
Behavior of Biochar-Modified Cementitious Composites Exposed to High Temperatures


Abstract
:1. Introduction
2. Materials and Methods
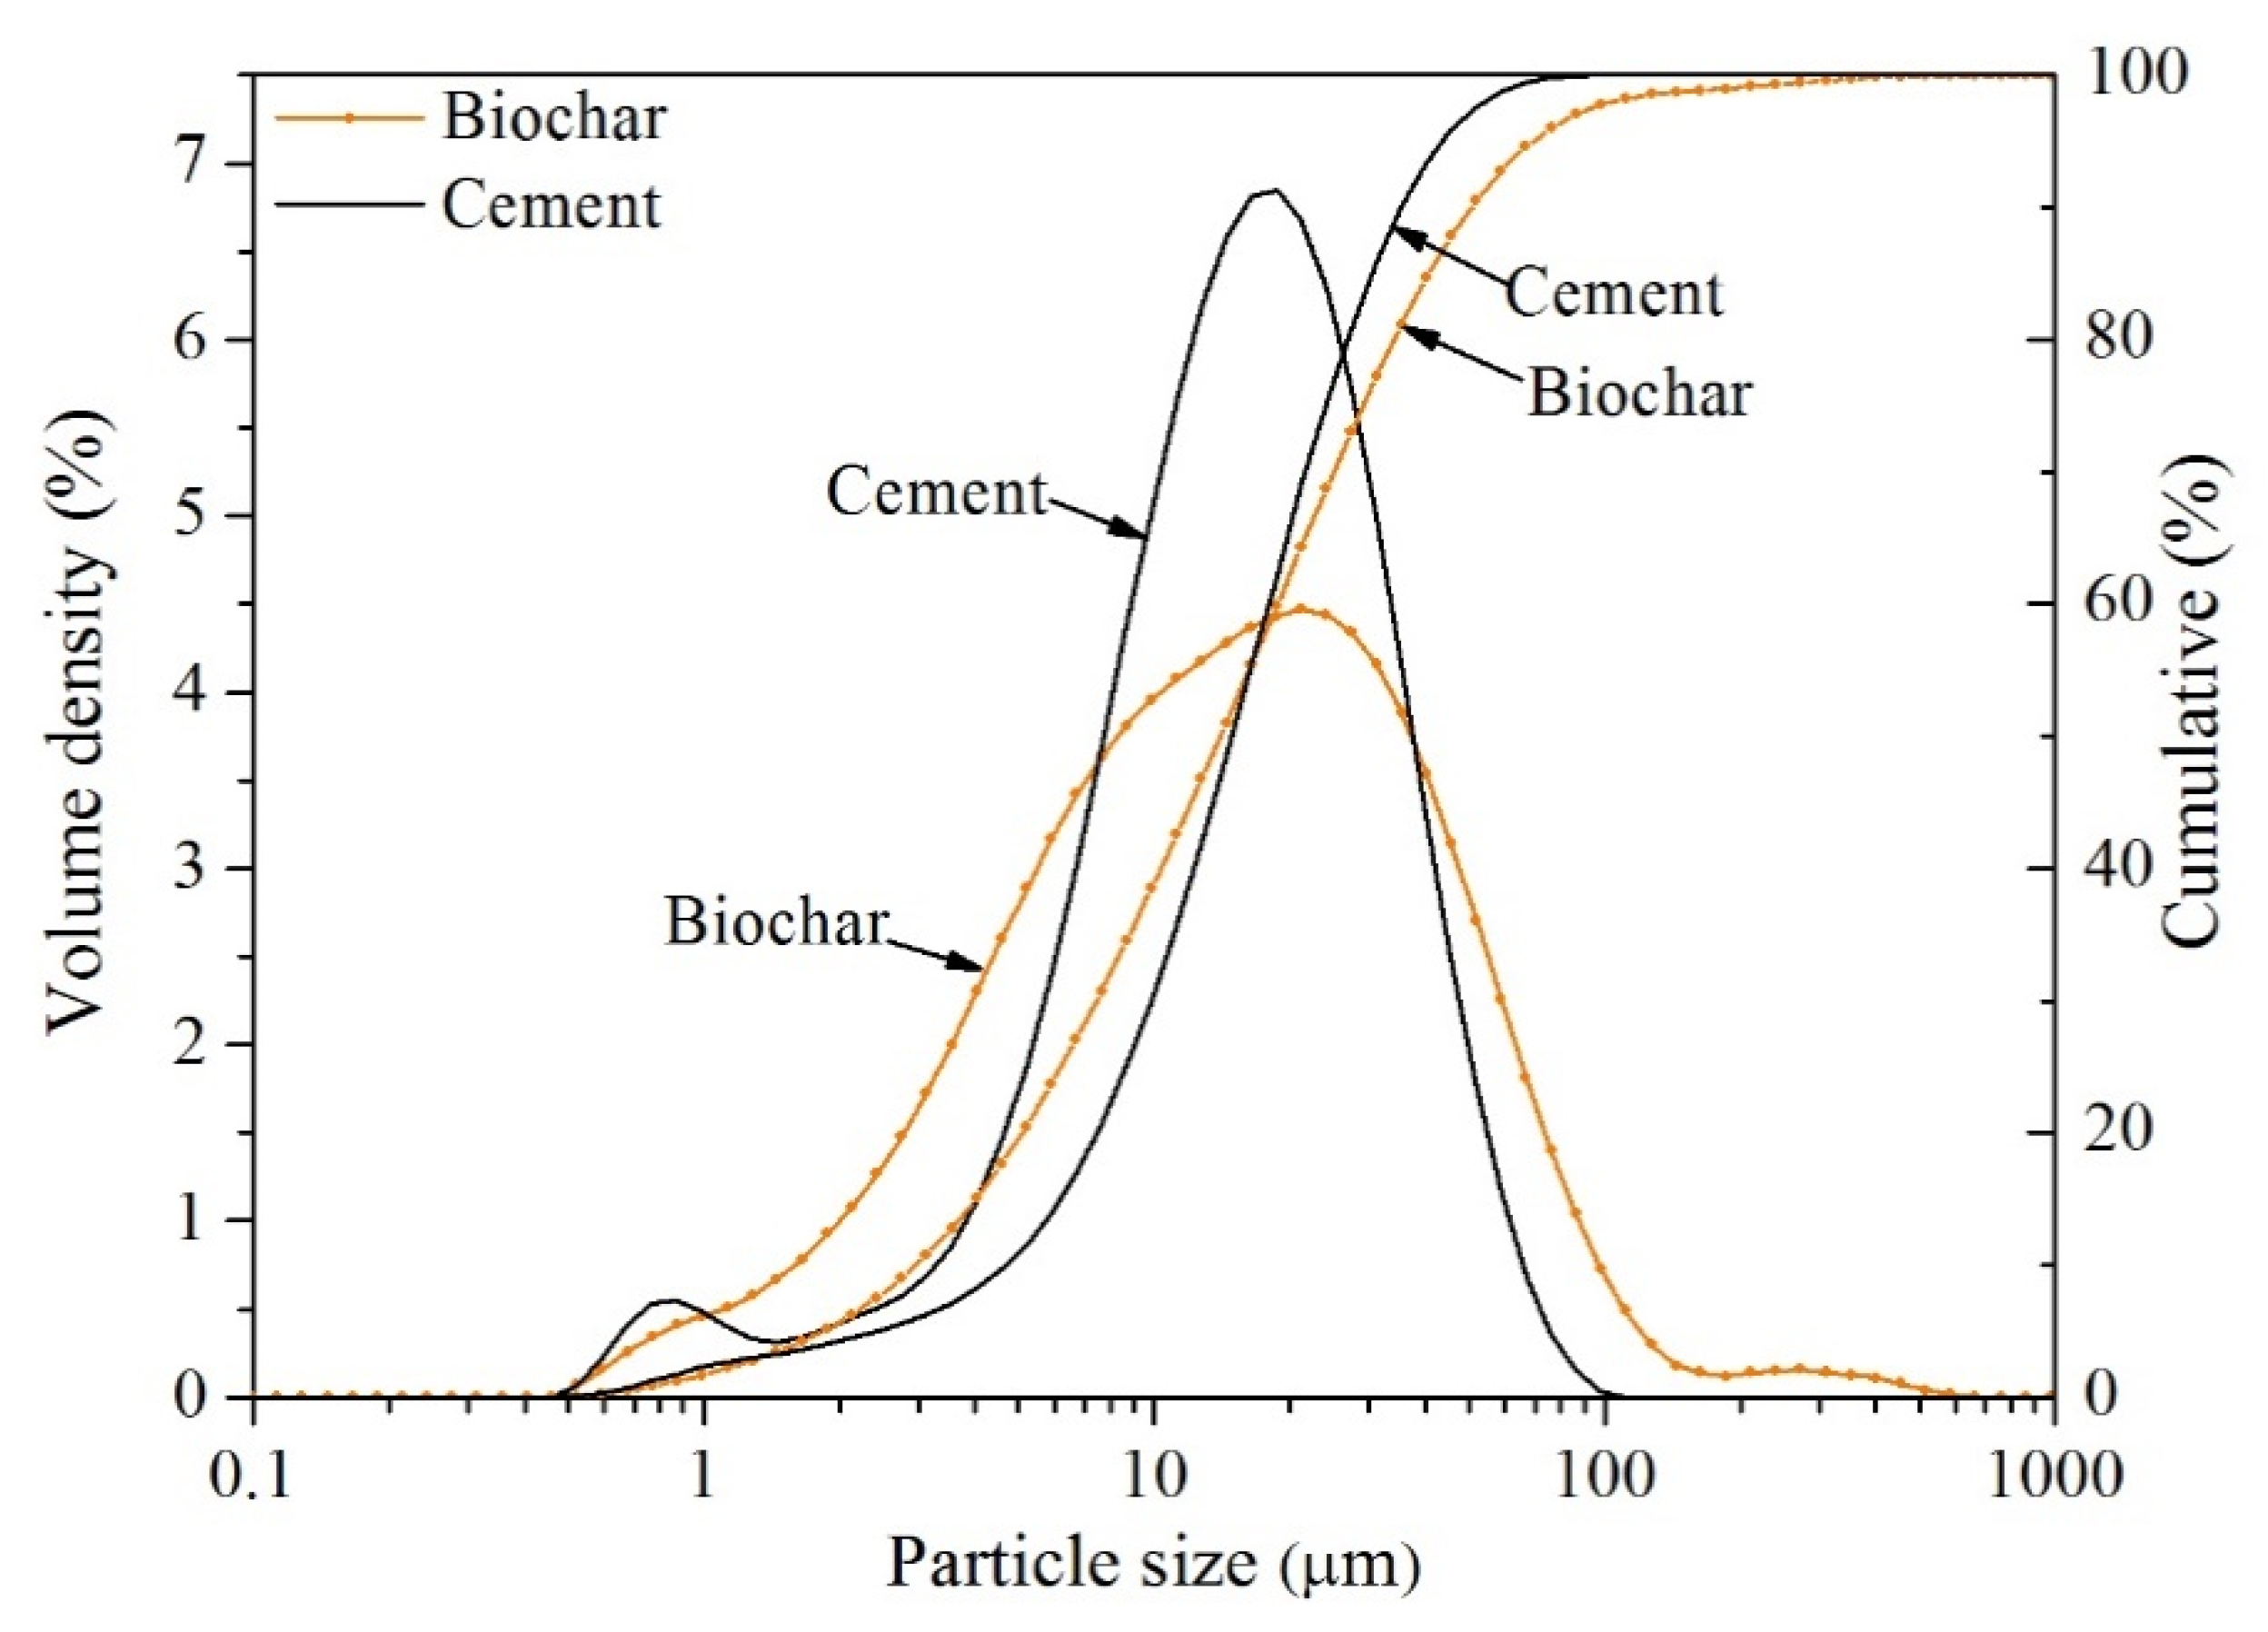
2.1. Materials and Mix Design
2.2. Methods
2.2.1. Macro Performance Characterization Methods
2.2.2. Micro Characterization Methods
3. Results and Discussion
3.1. Optical Microscopic Image
3.2. Macro Weight Loss
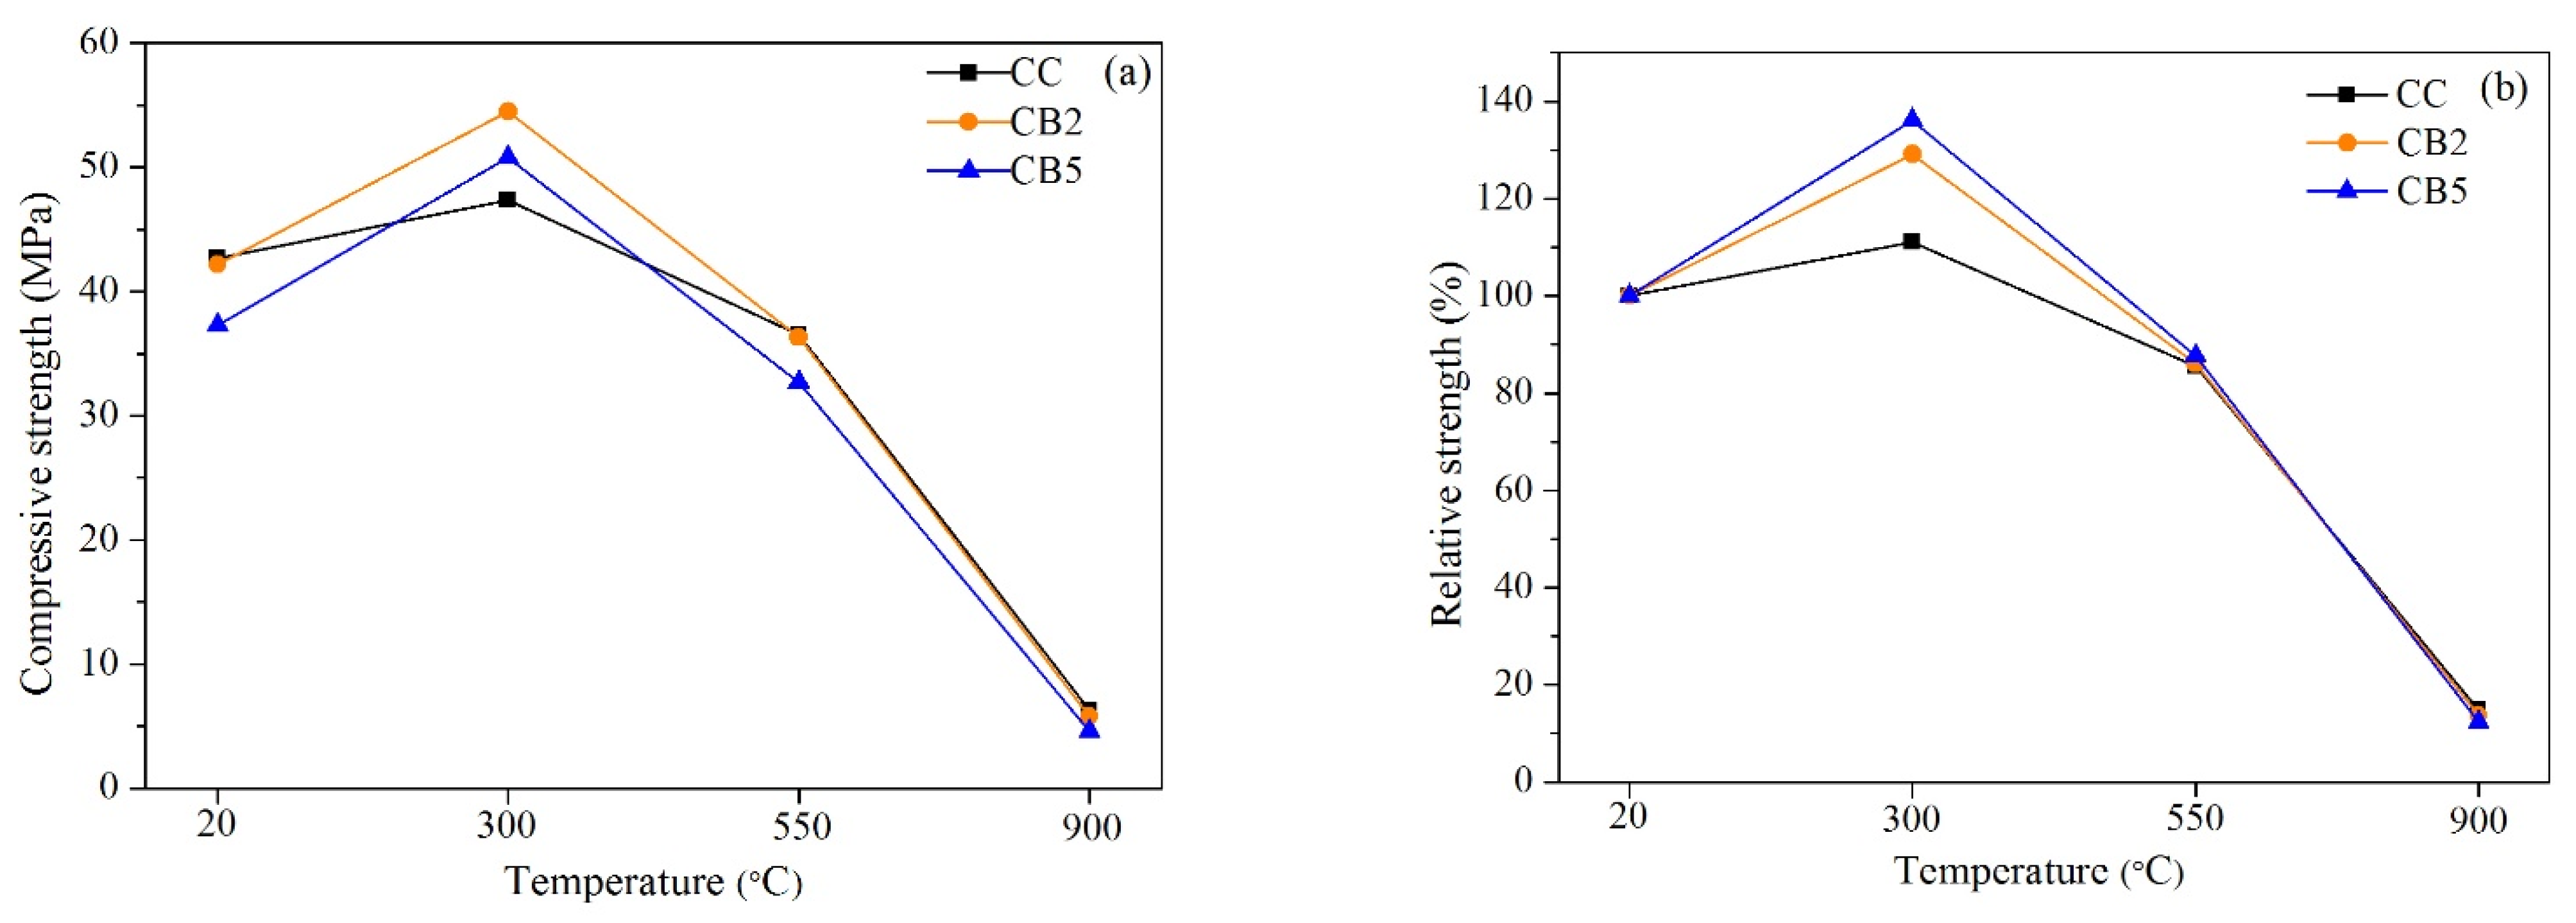
3.3. Residual Compressive Strength
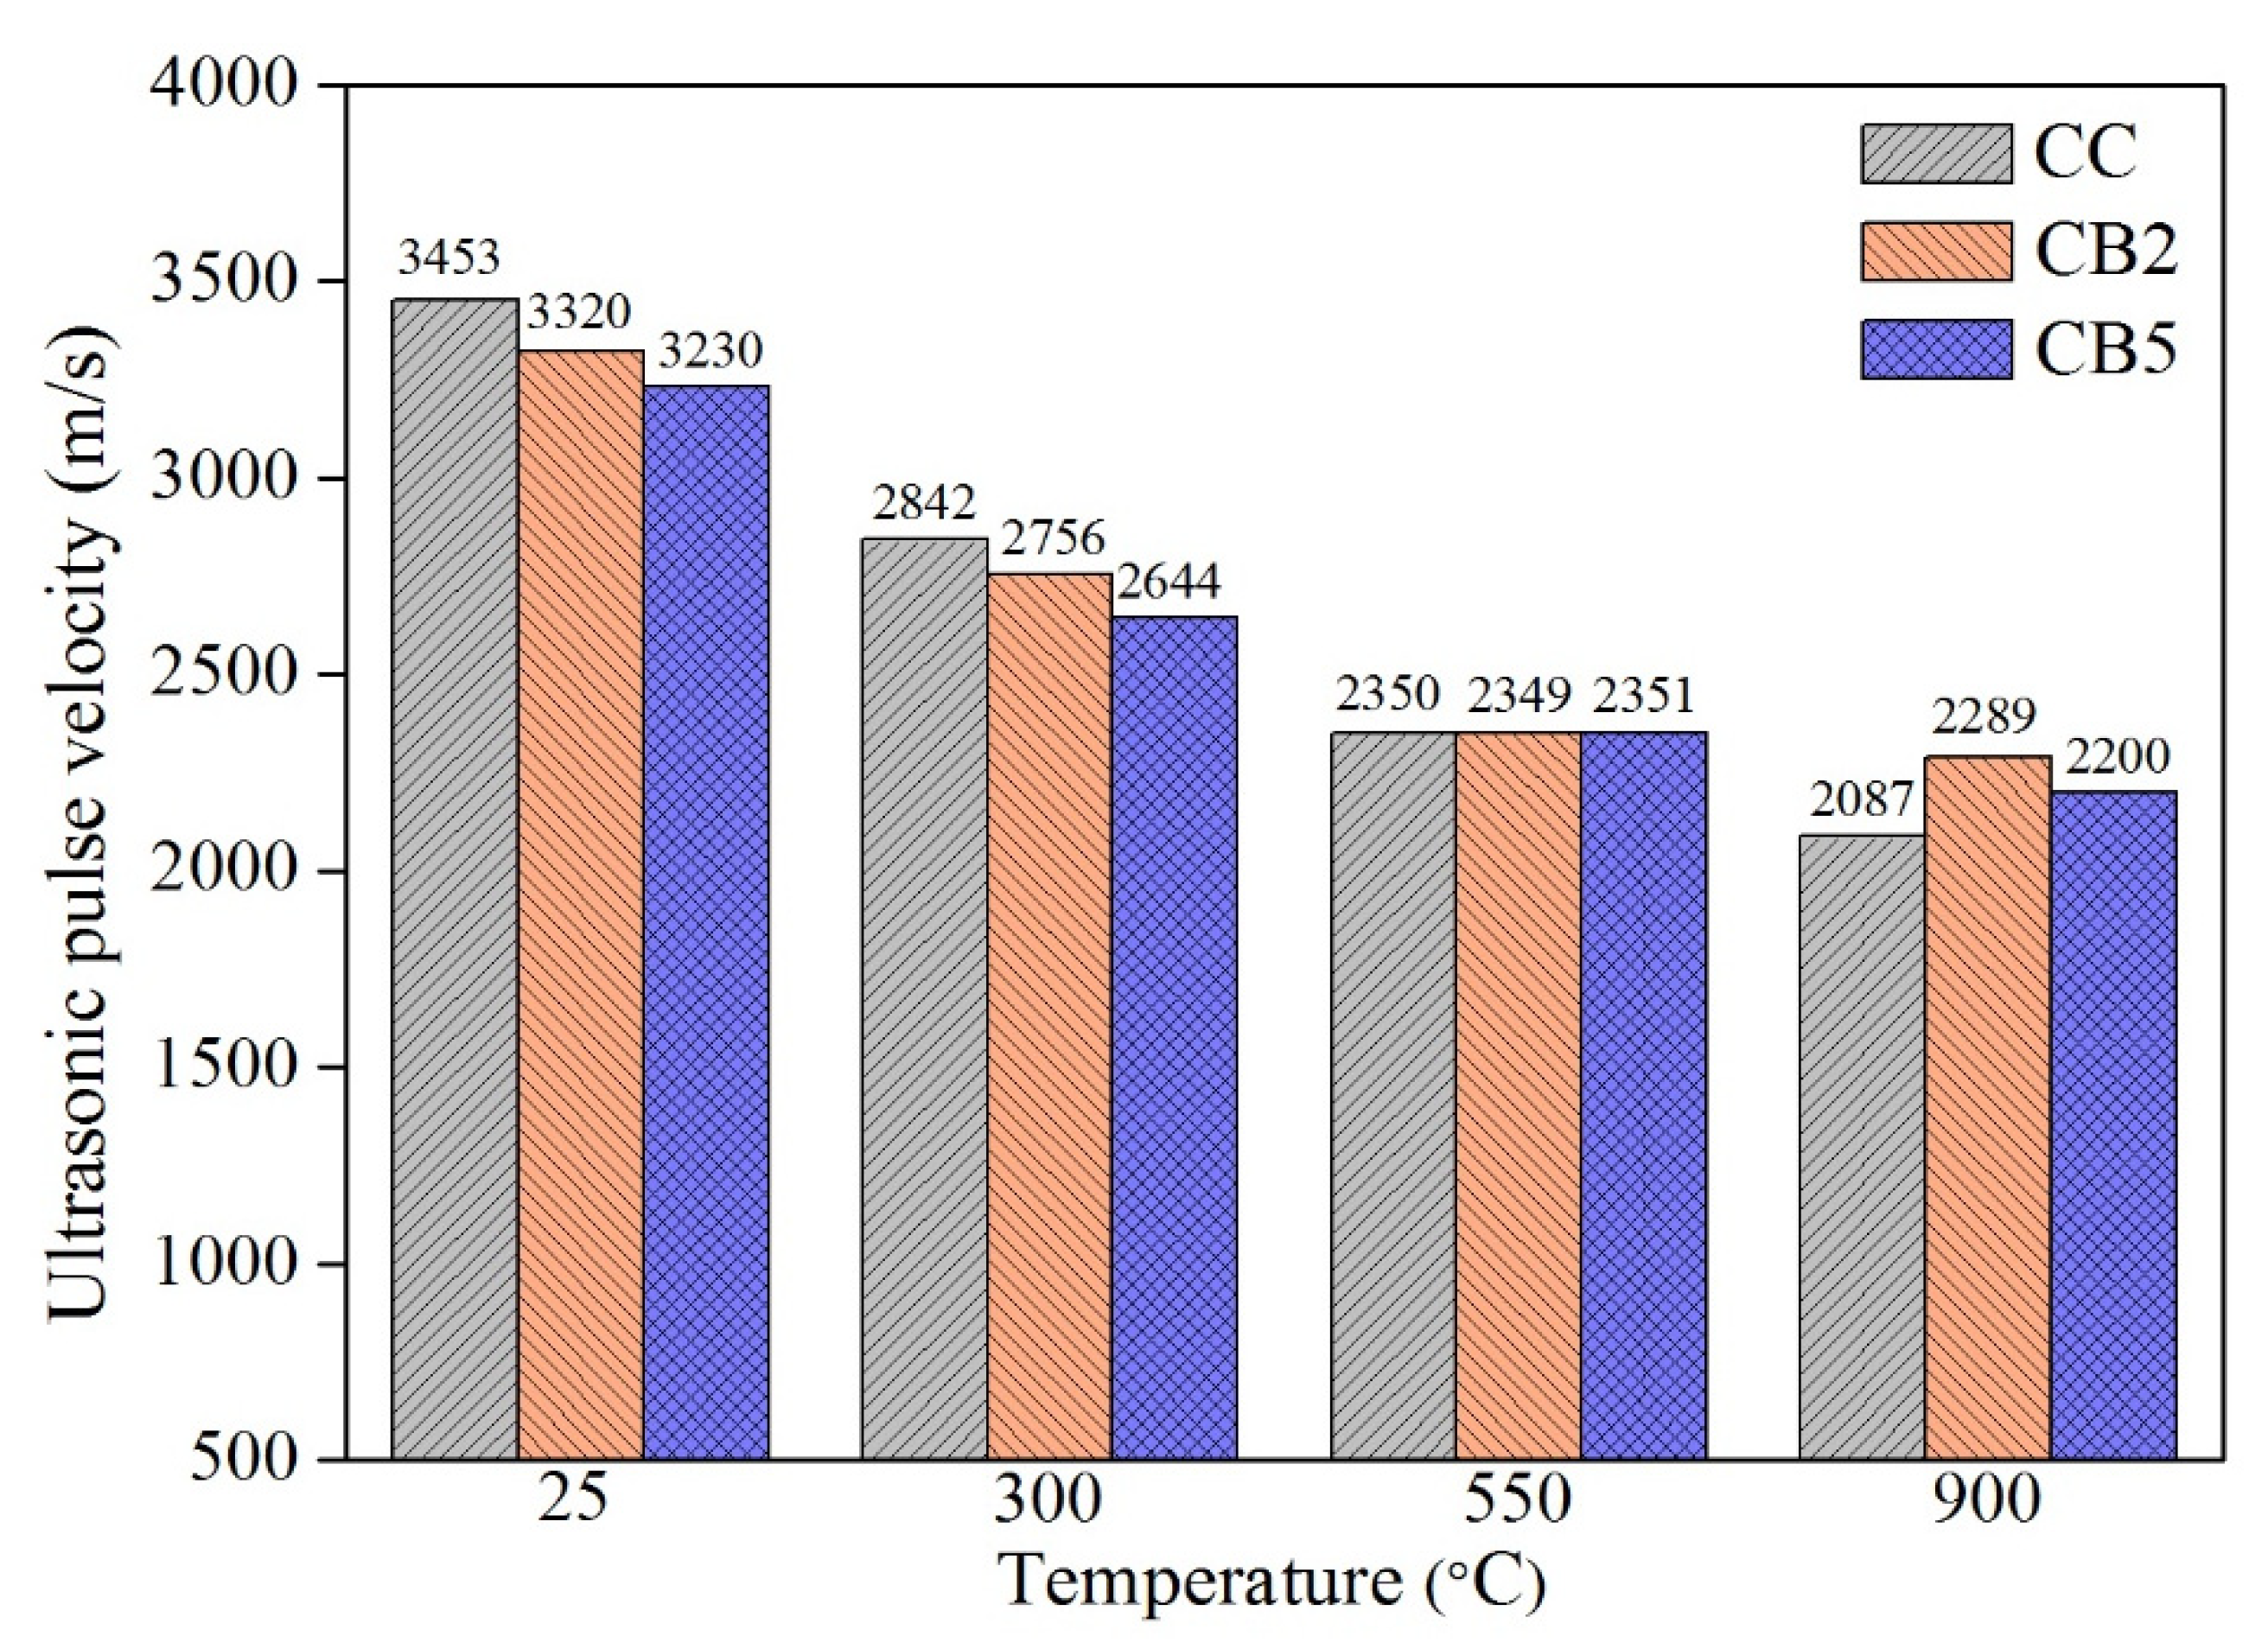
3.4. UPV
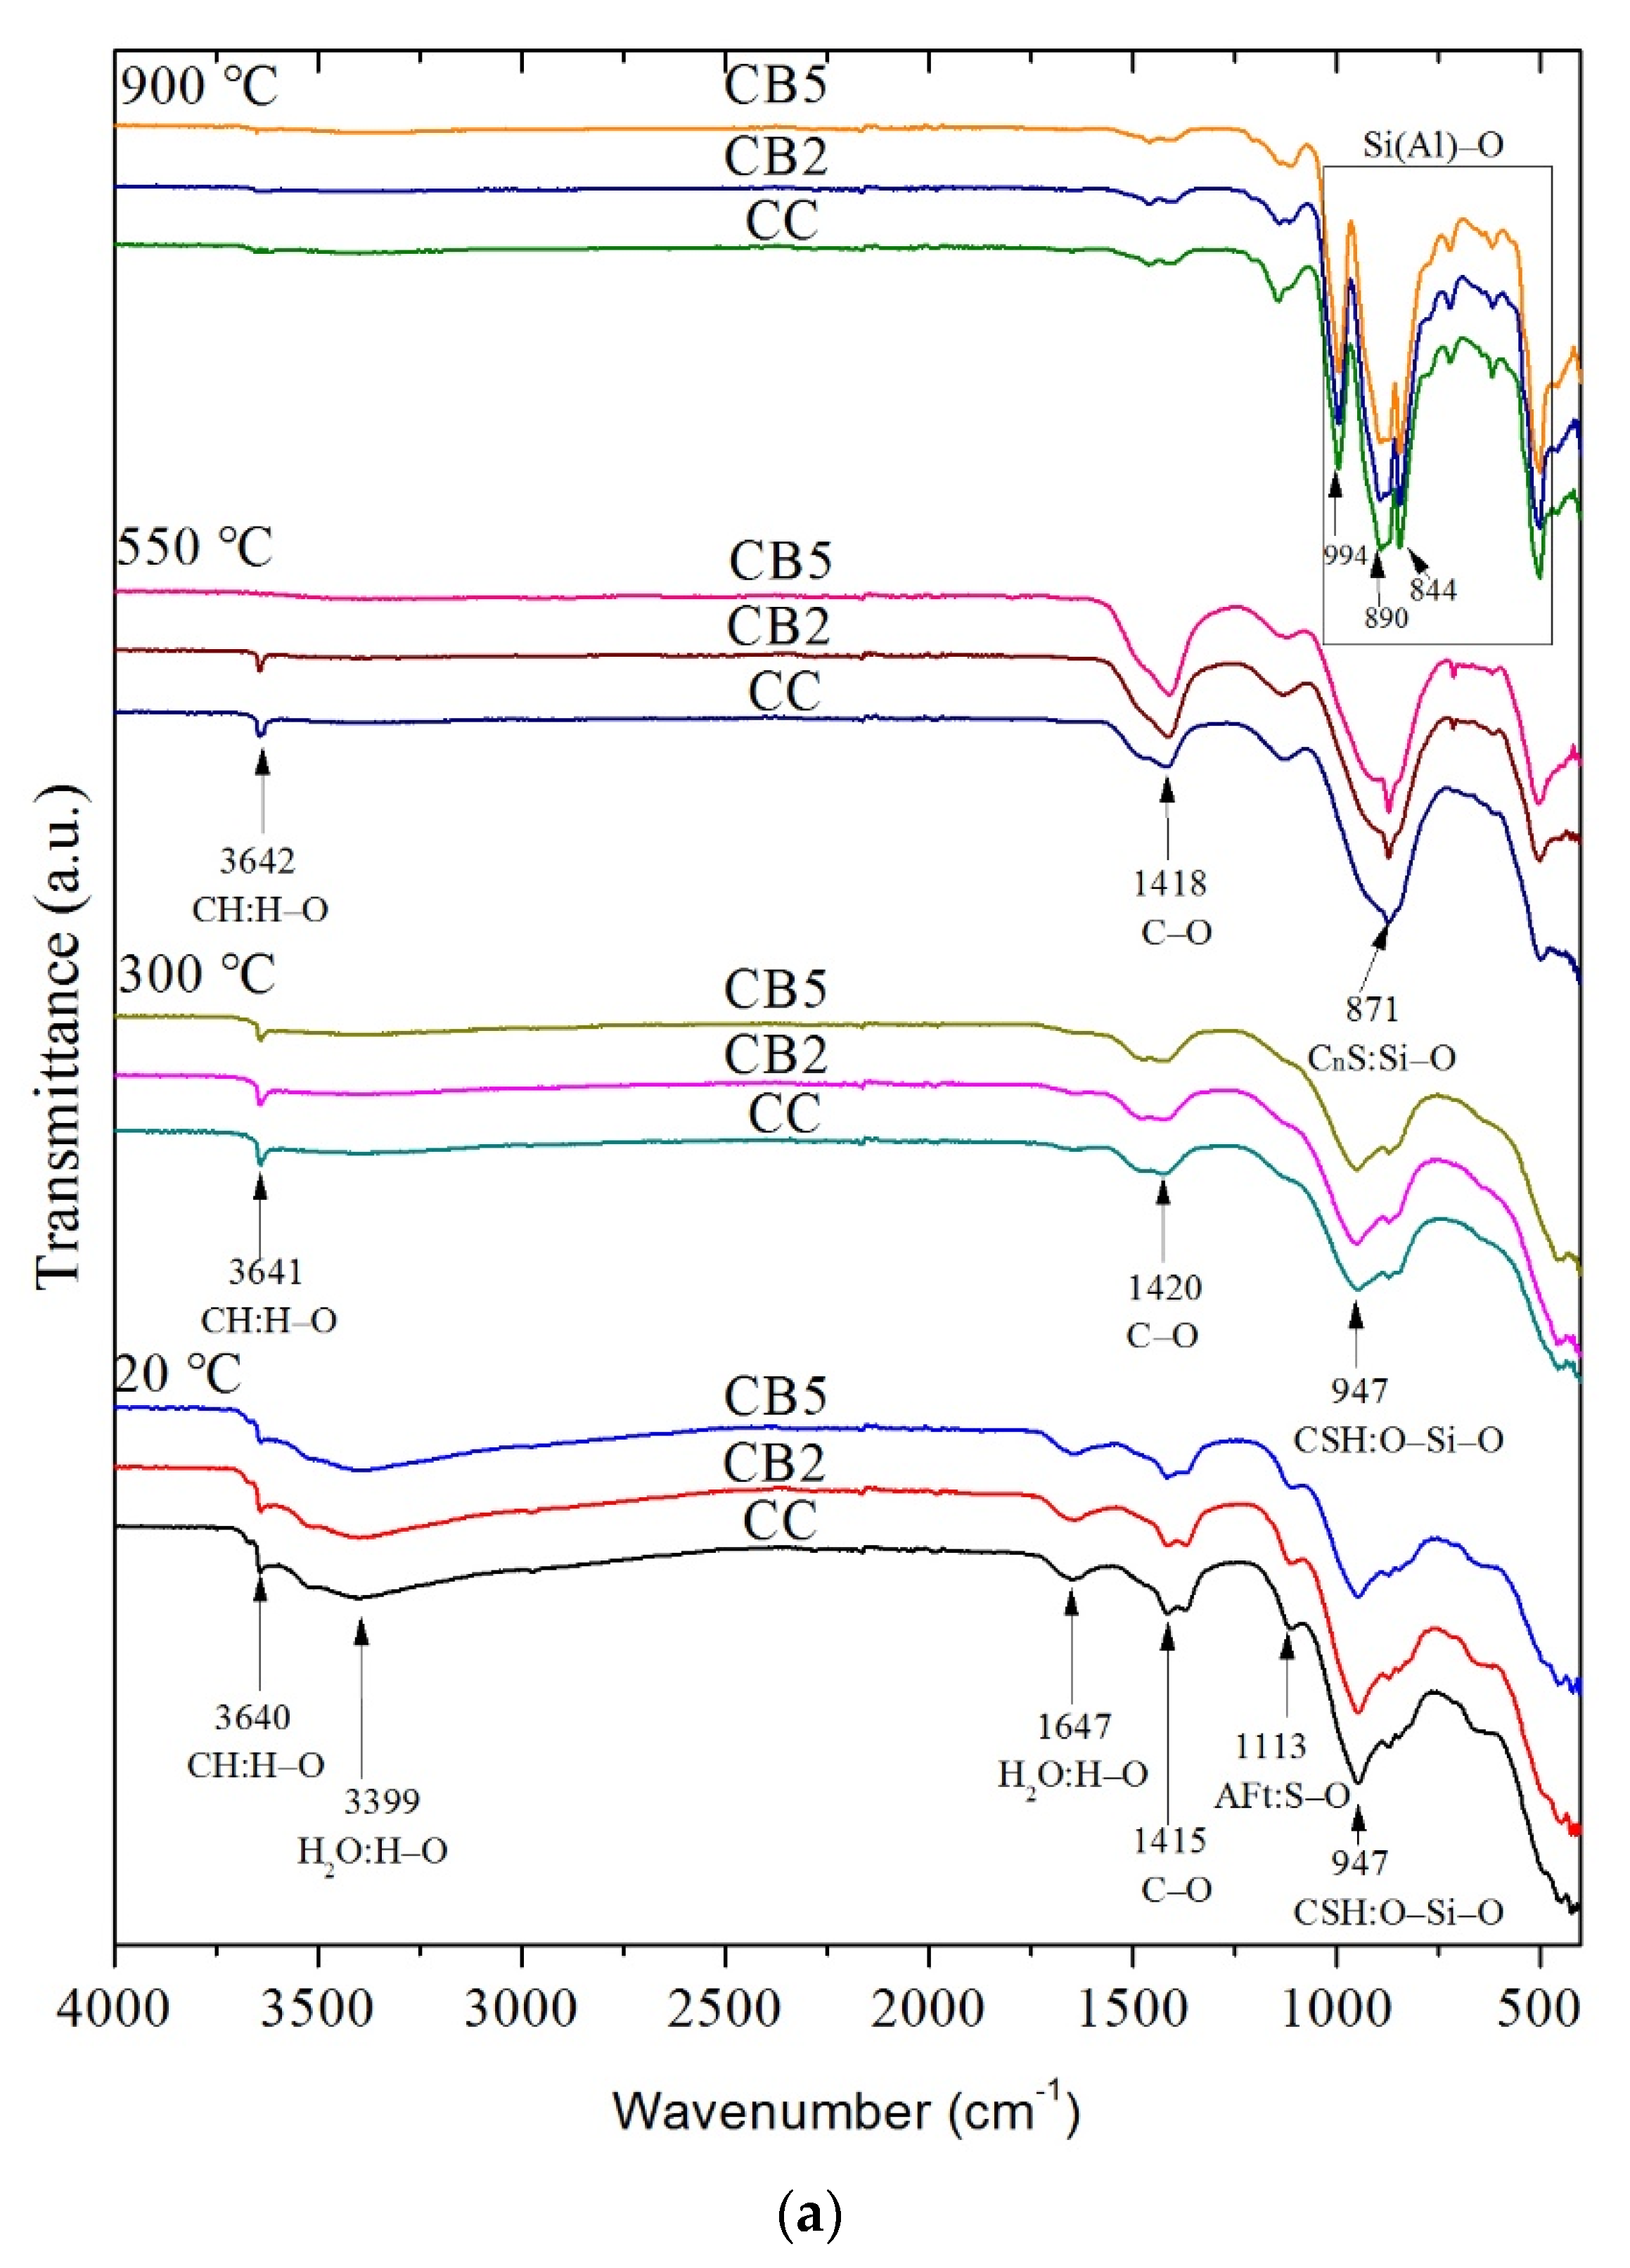
3.5. FTIR Analyses
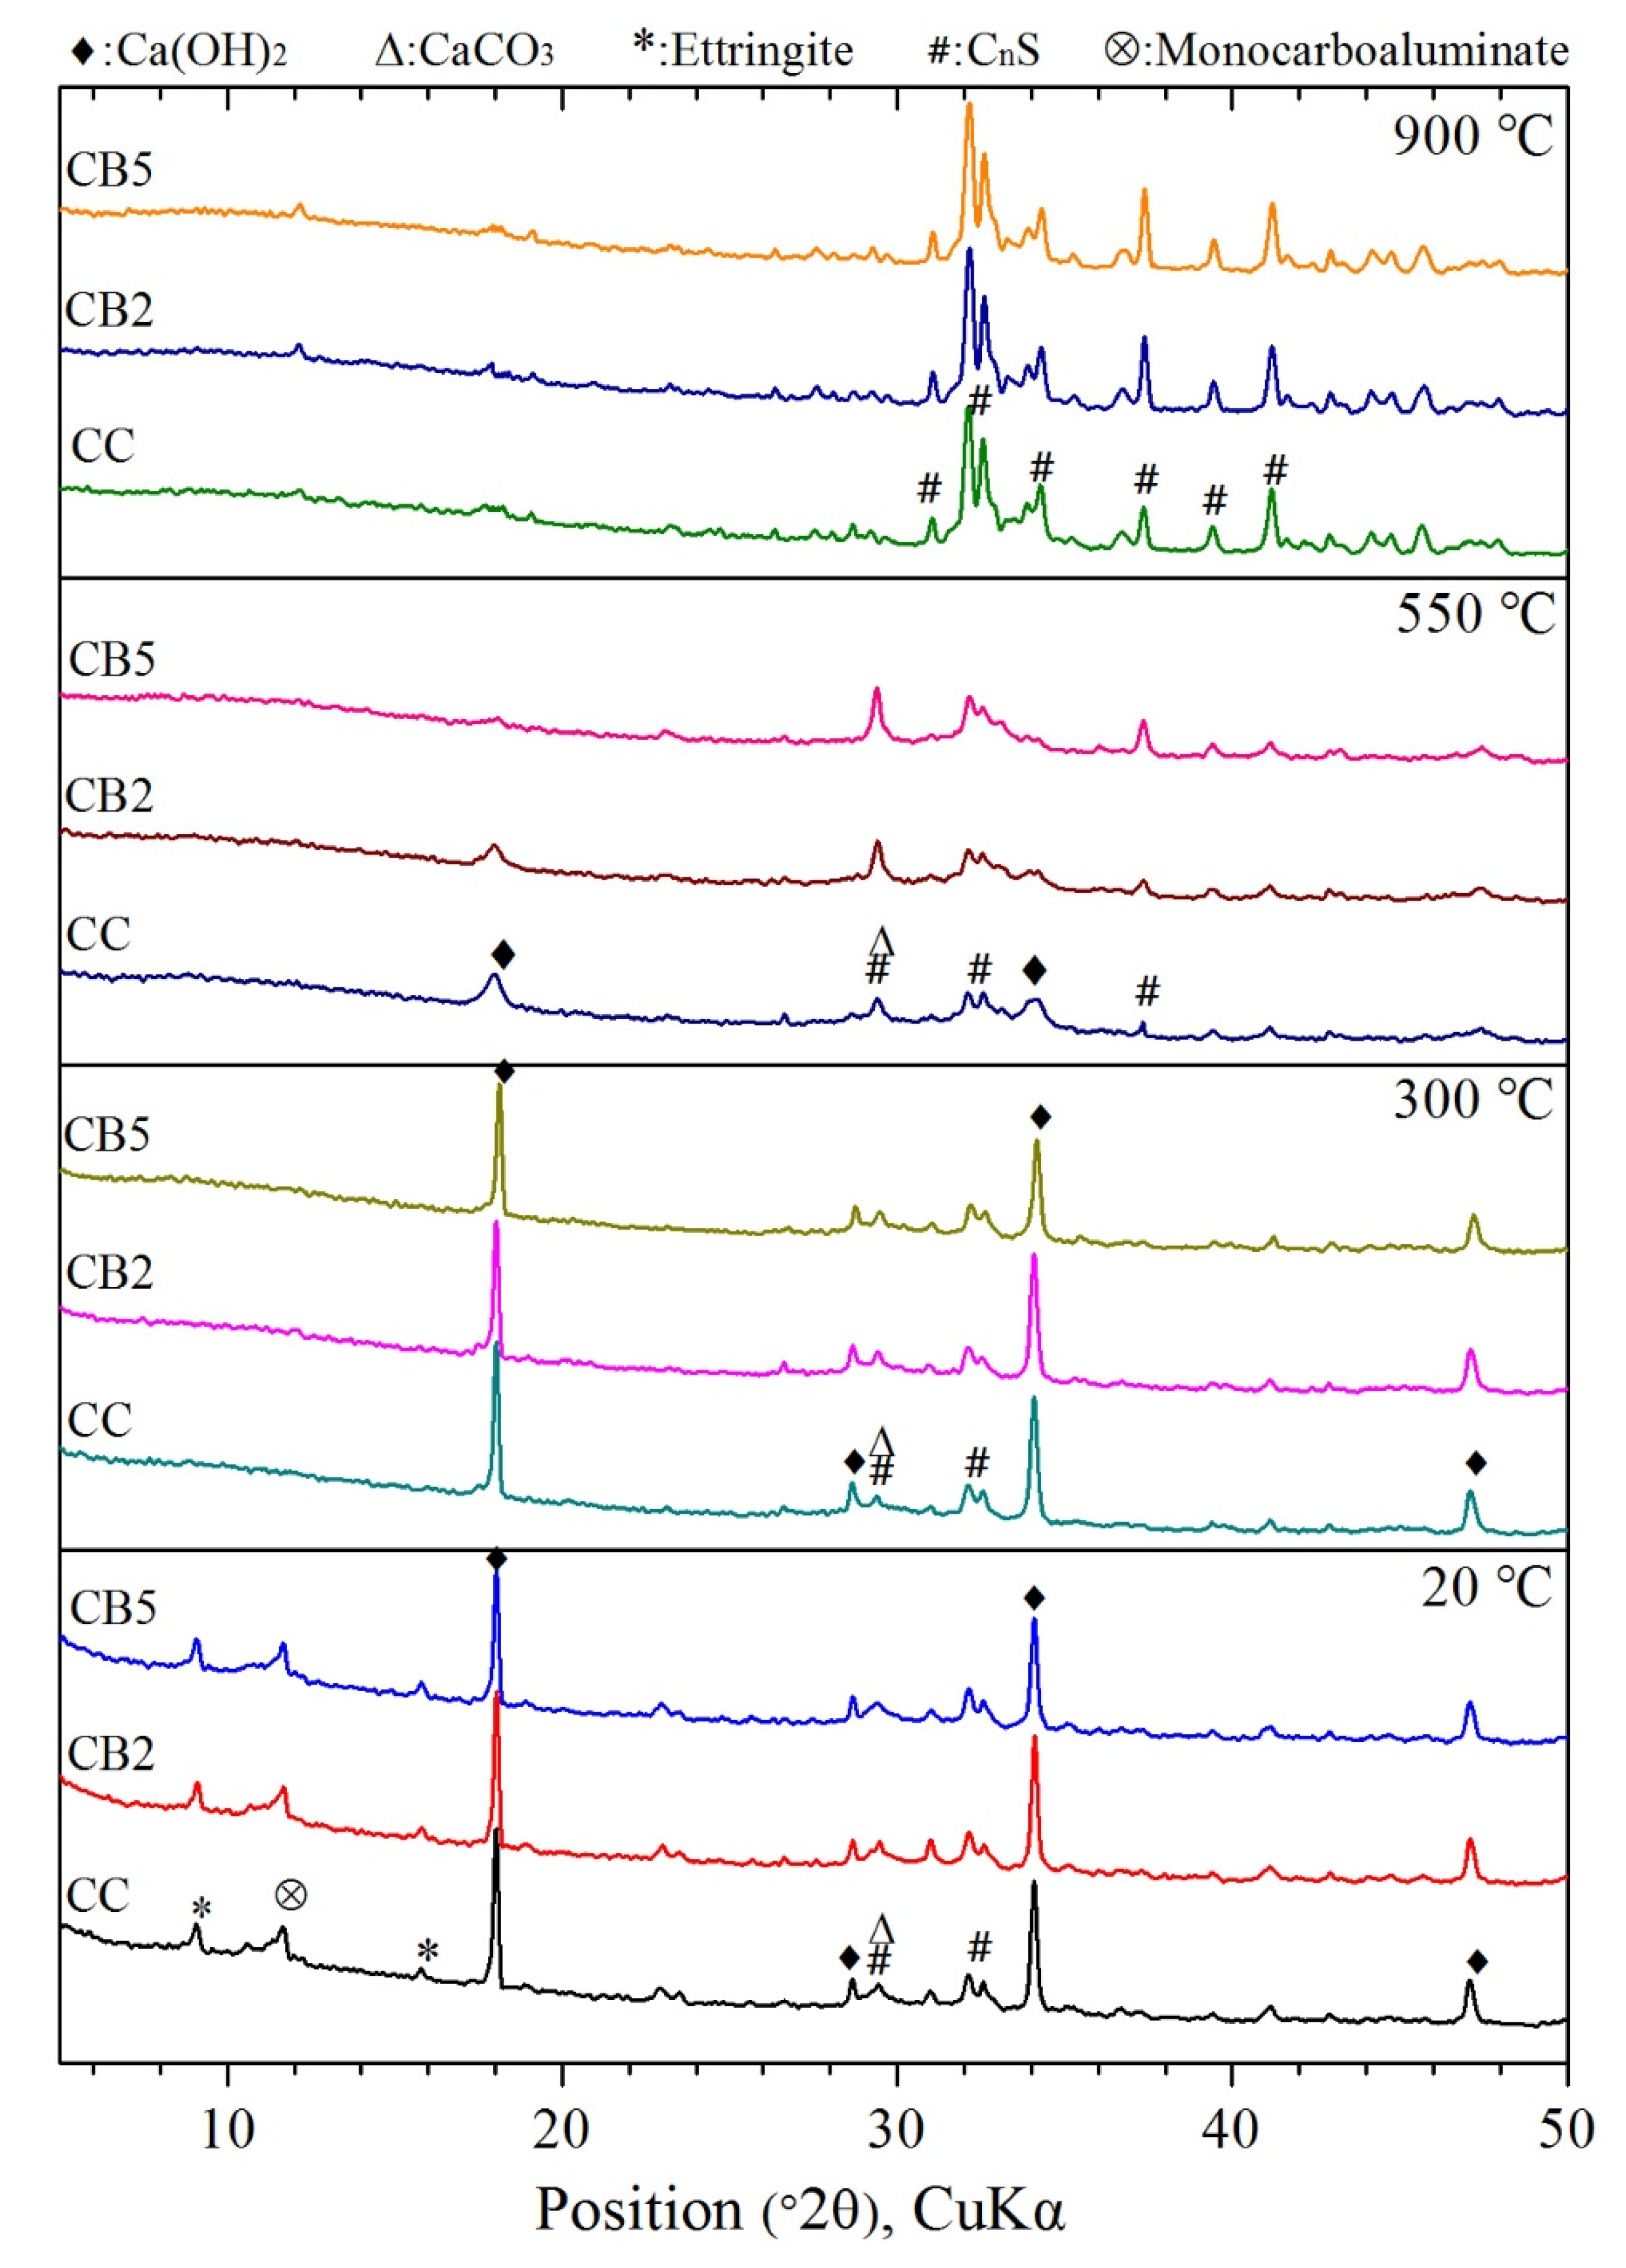
3.6. XRD Analyses
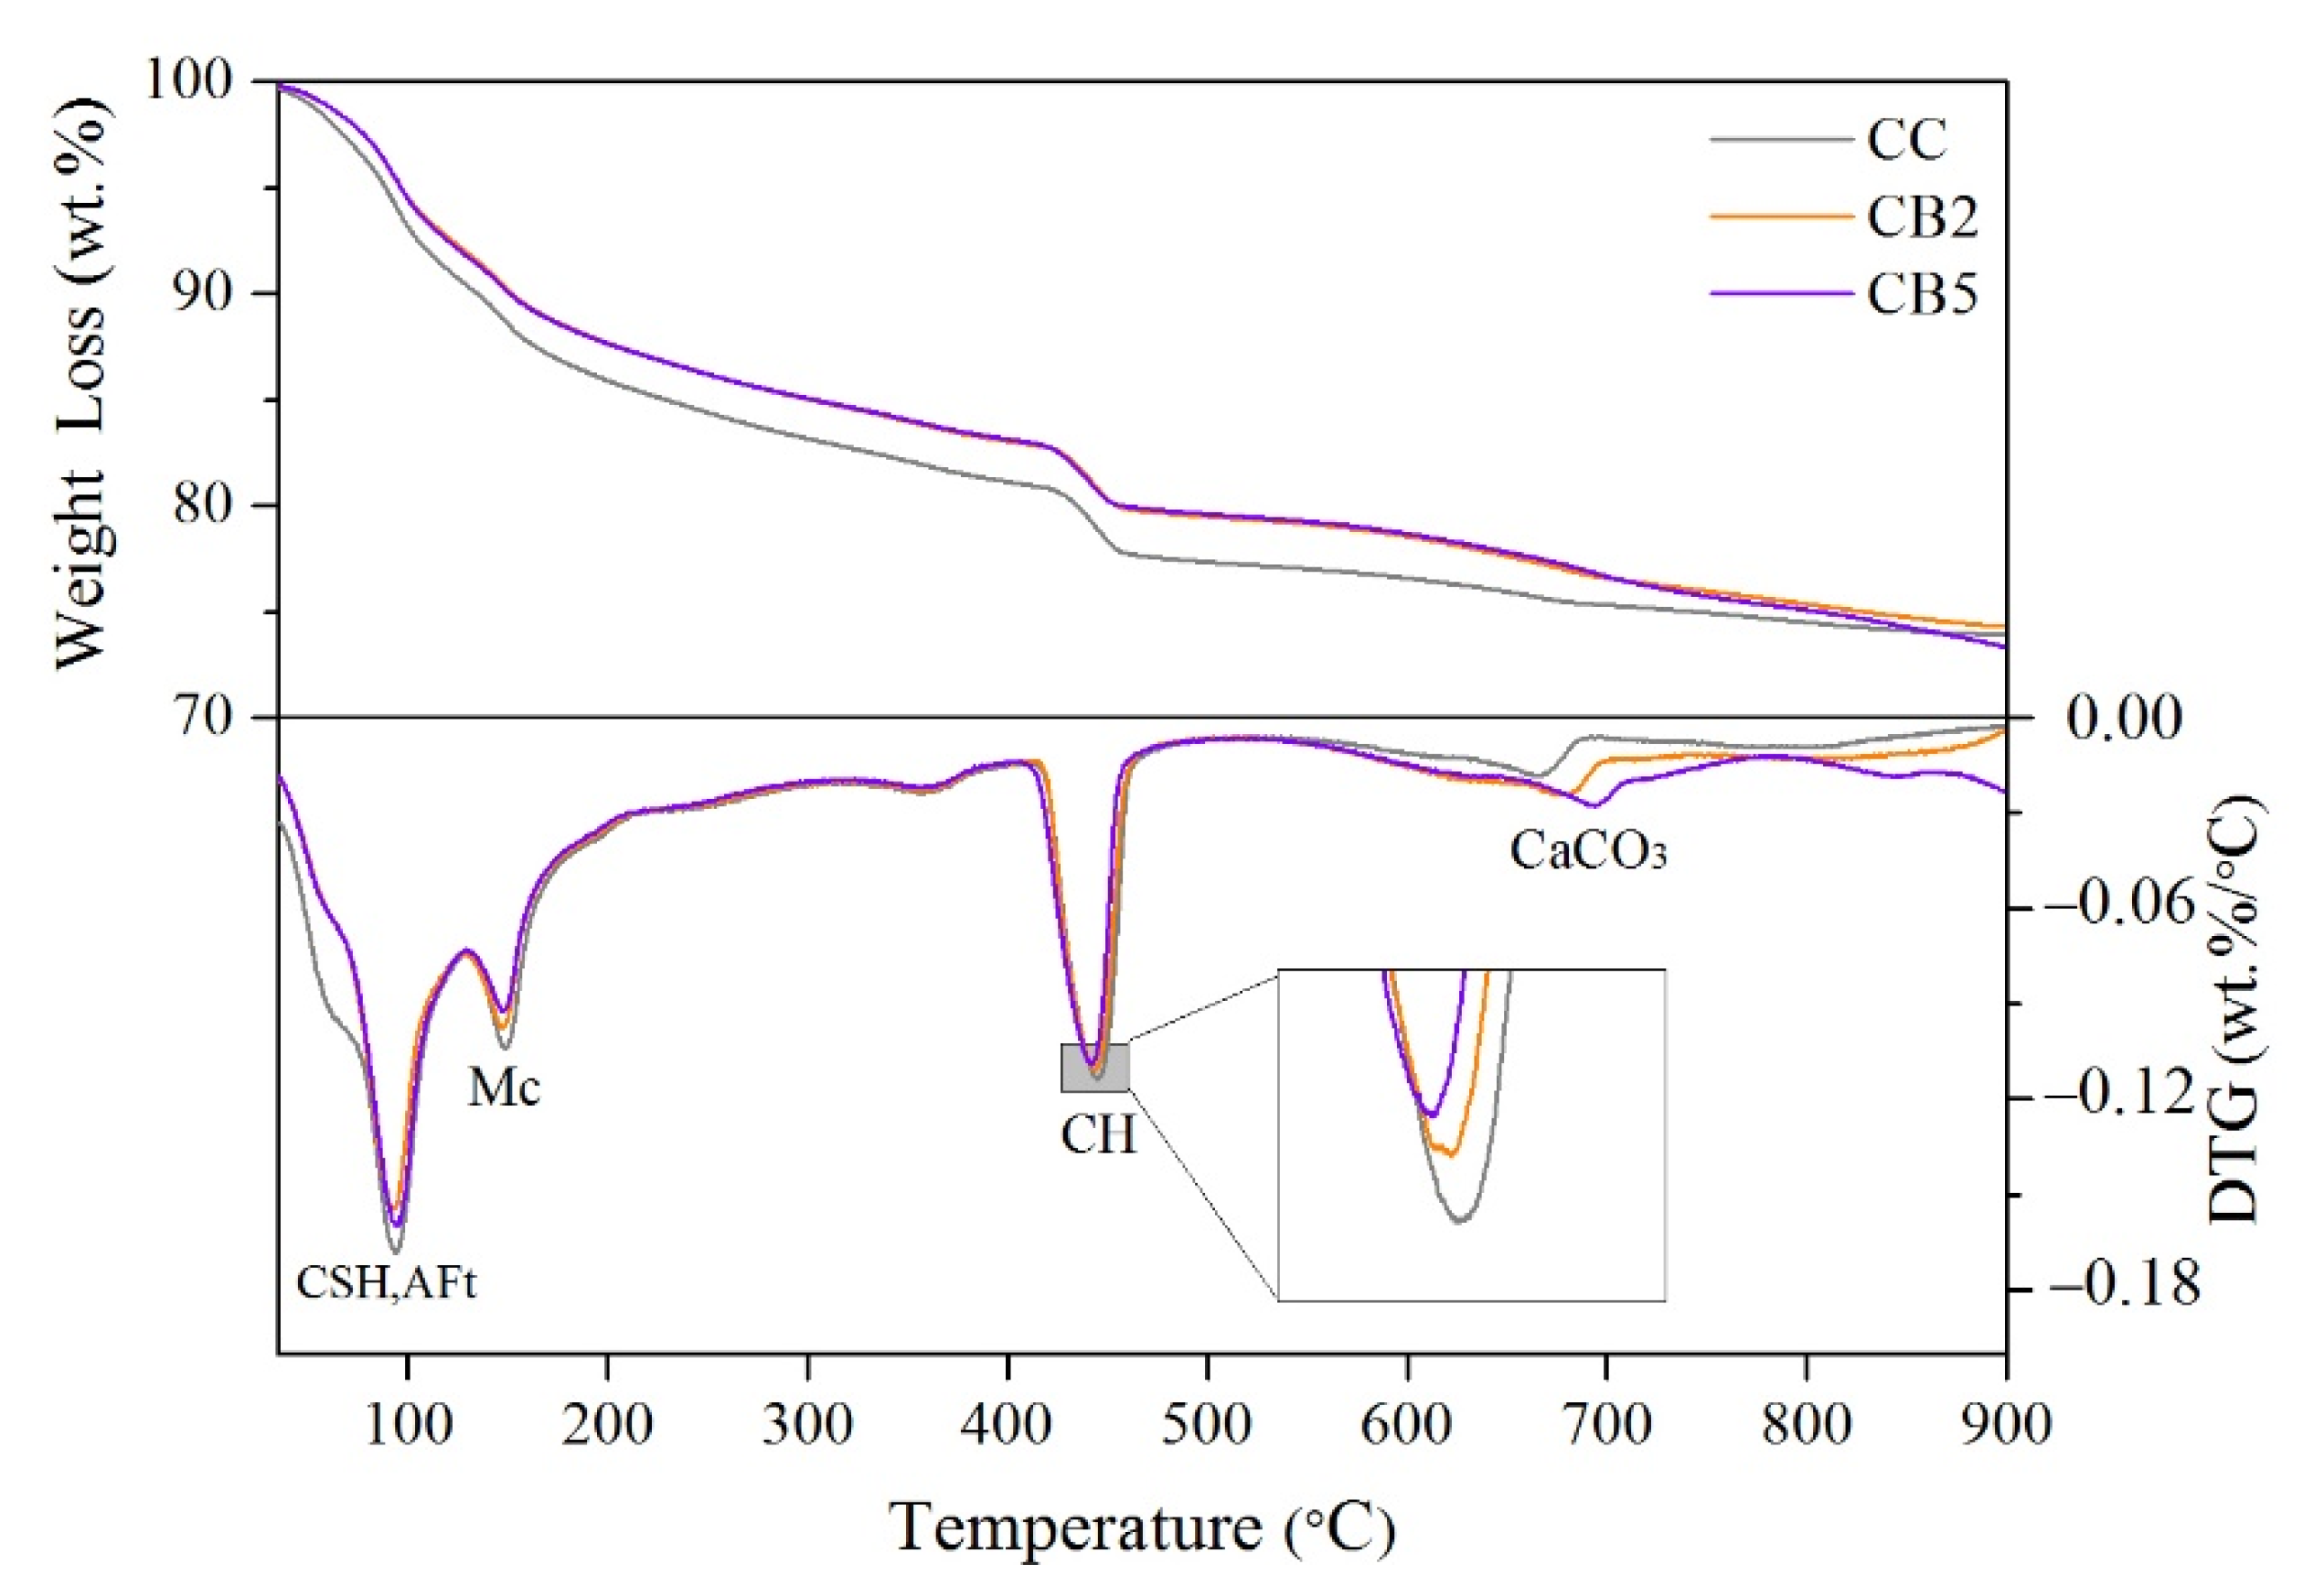
3.7. TG Analyses
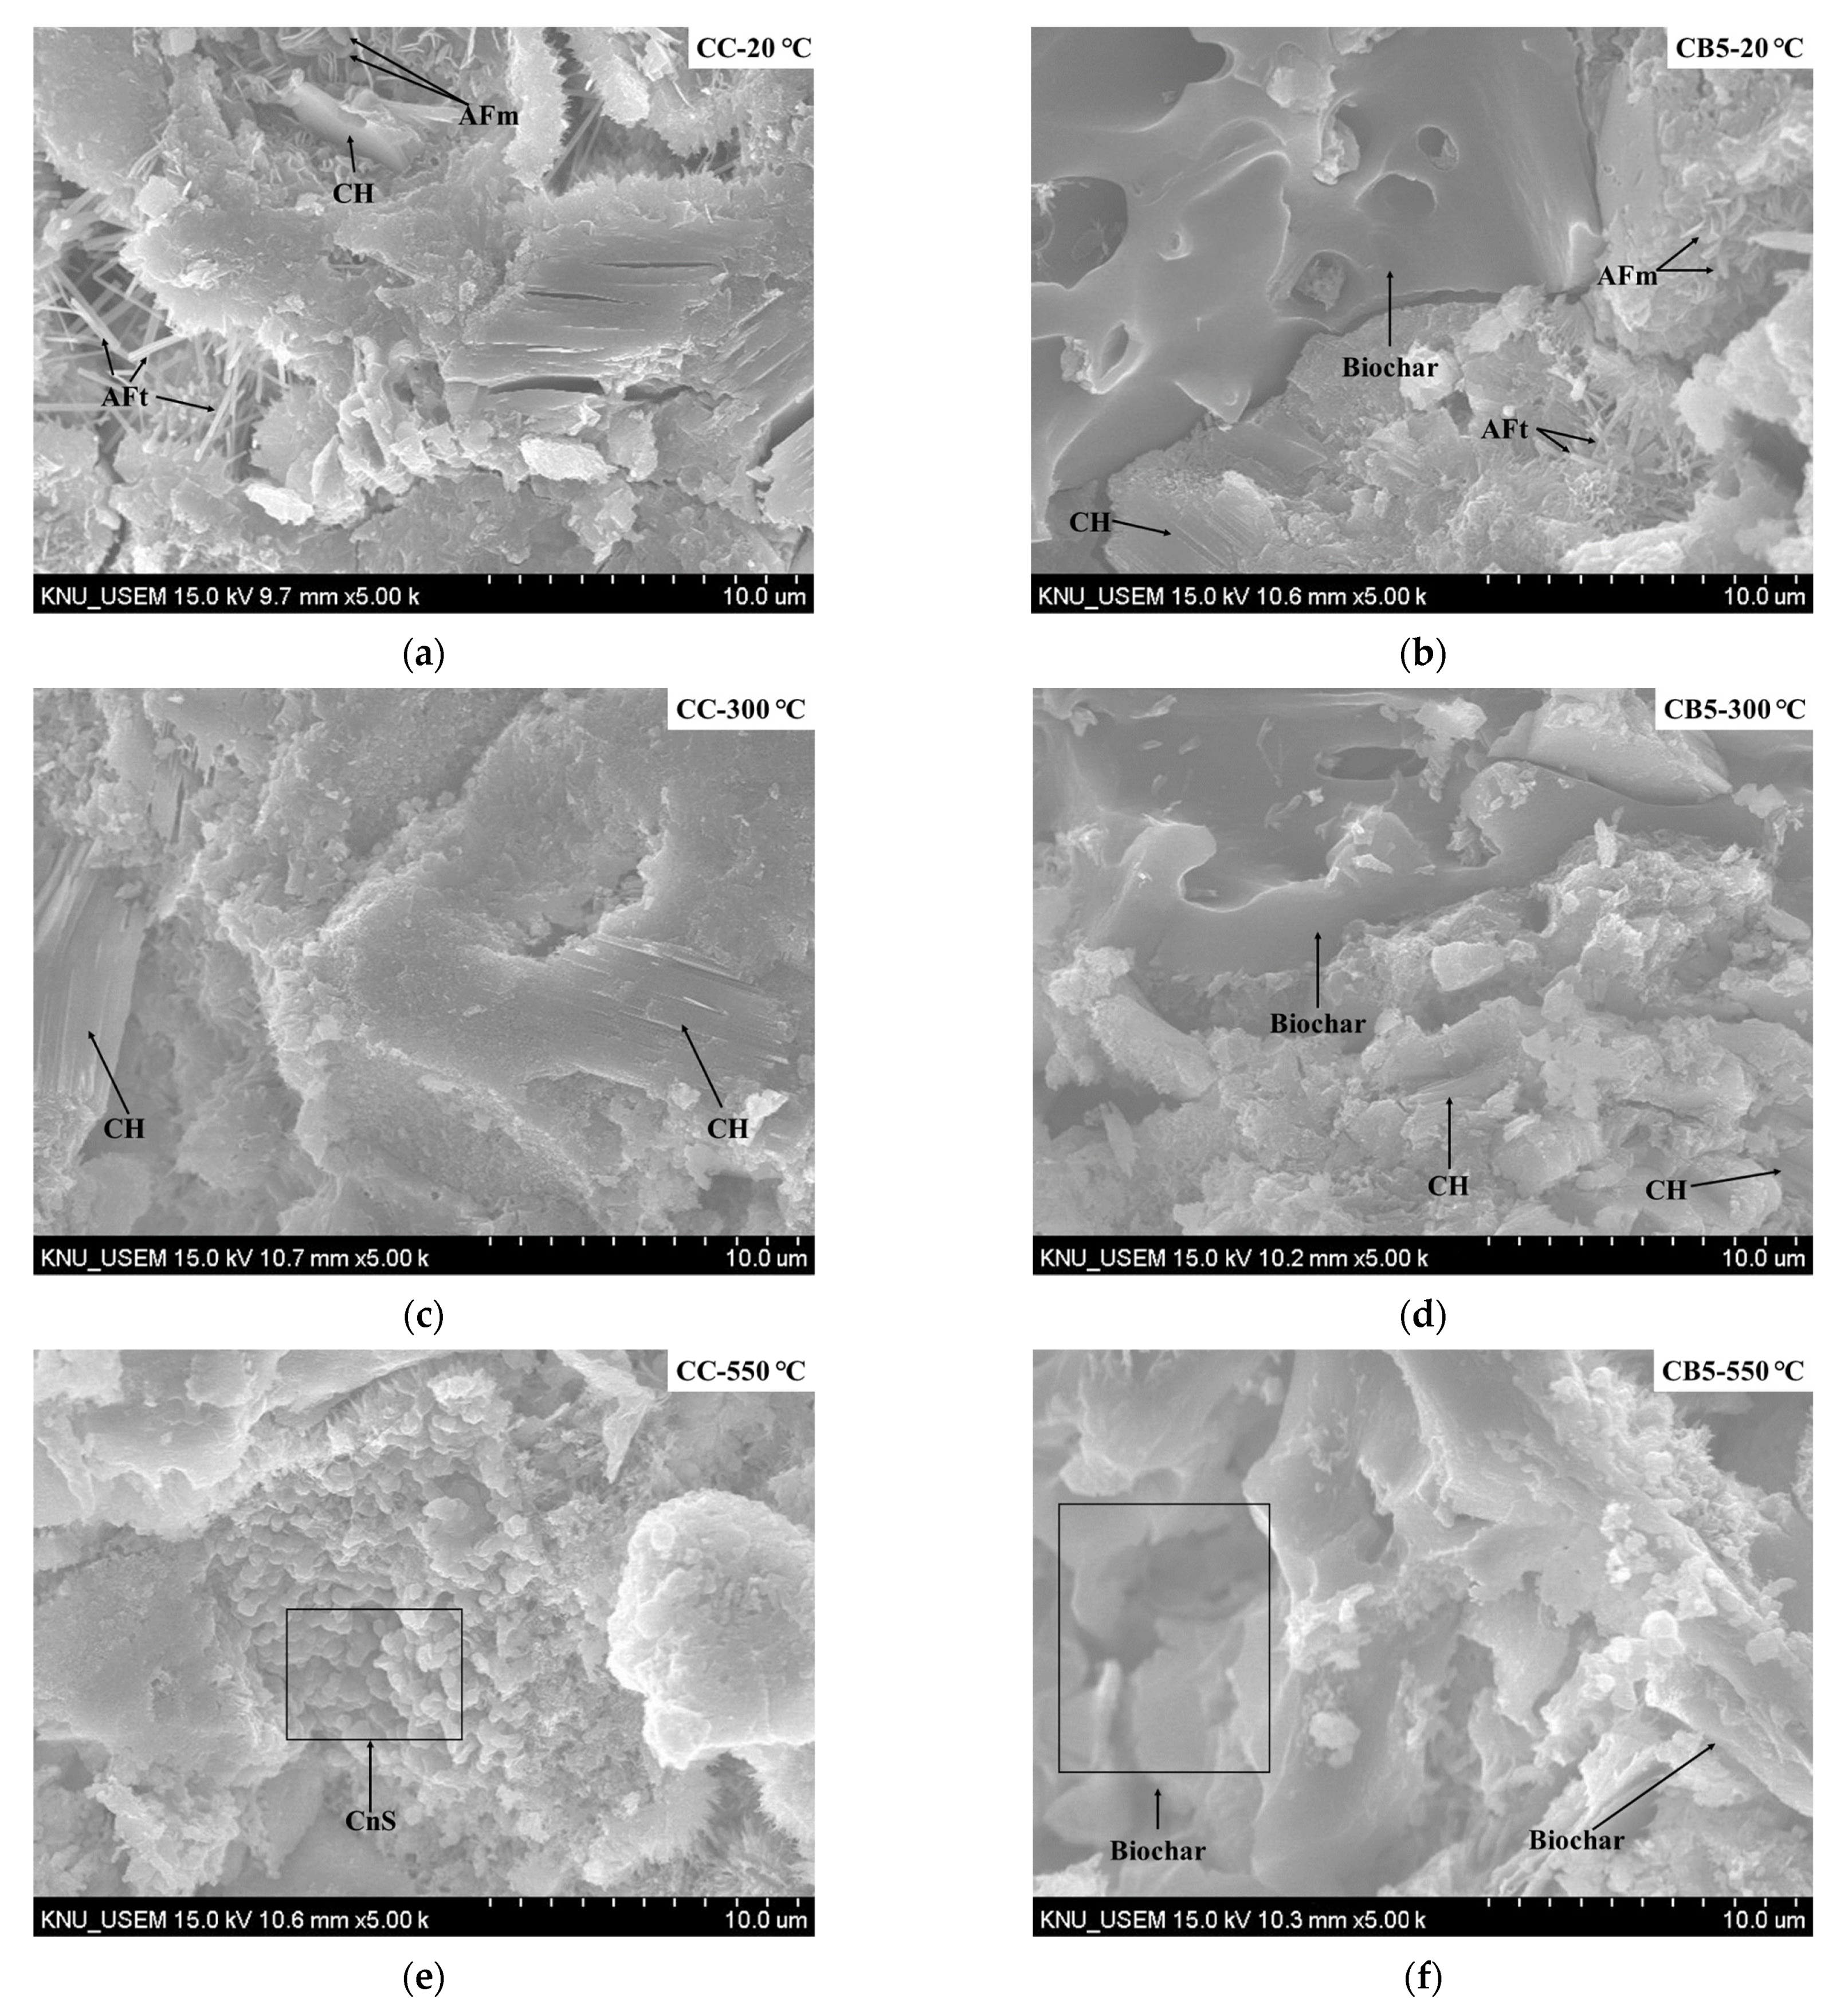
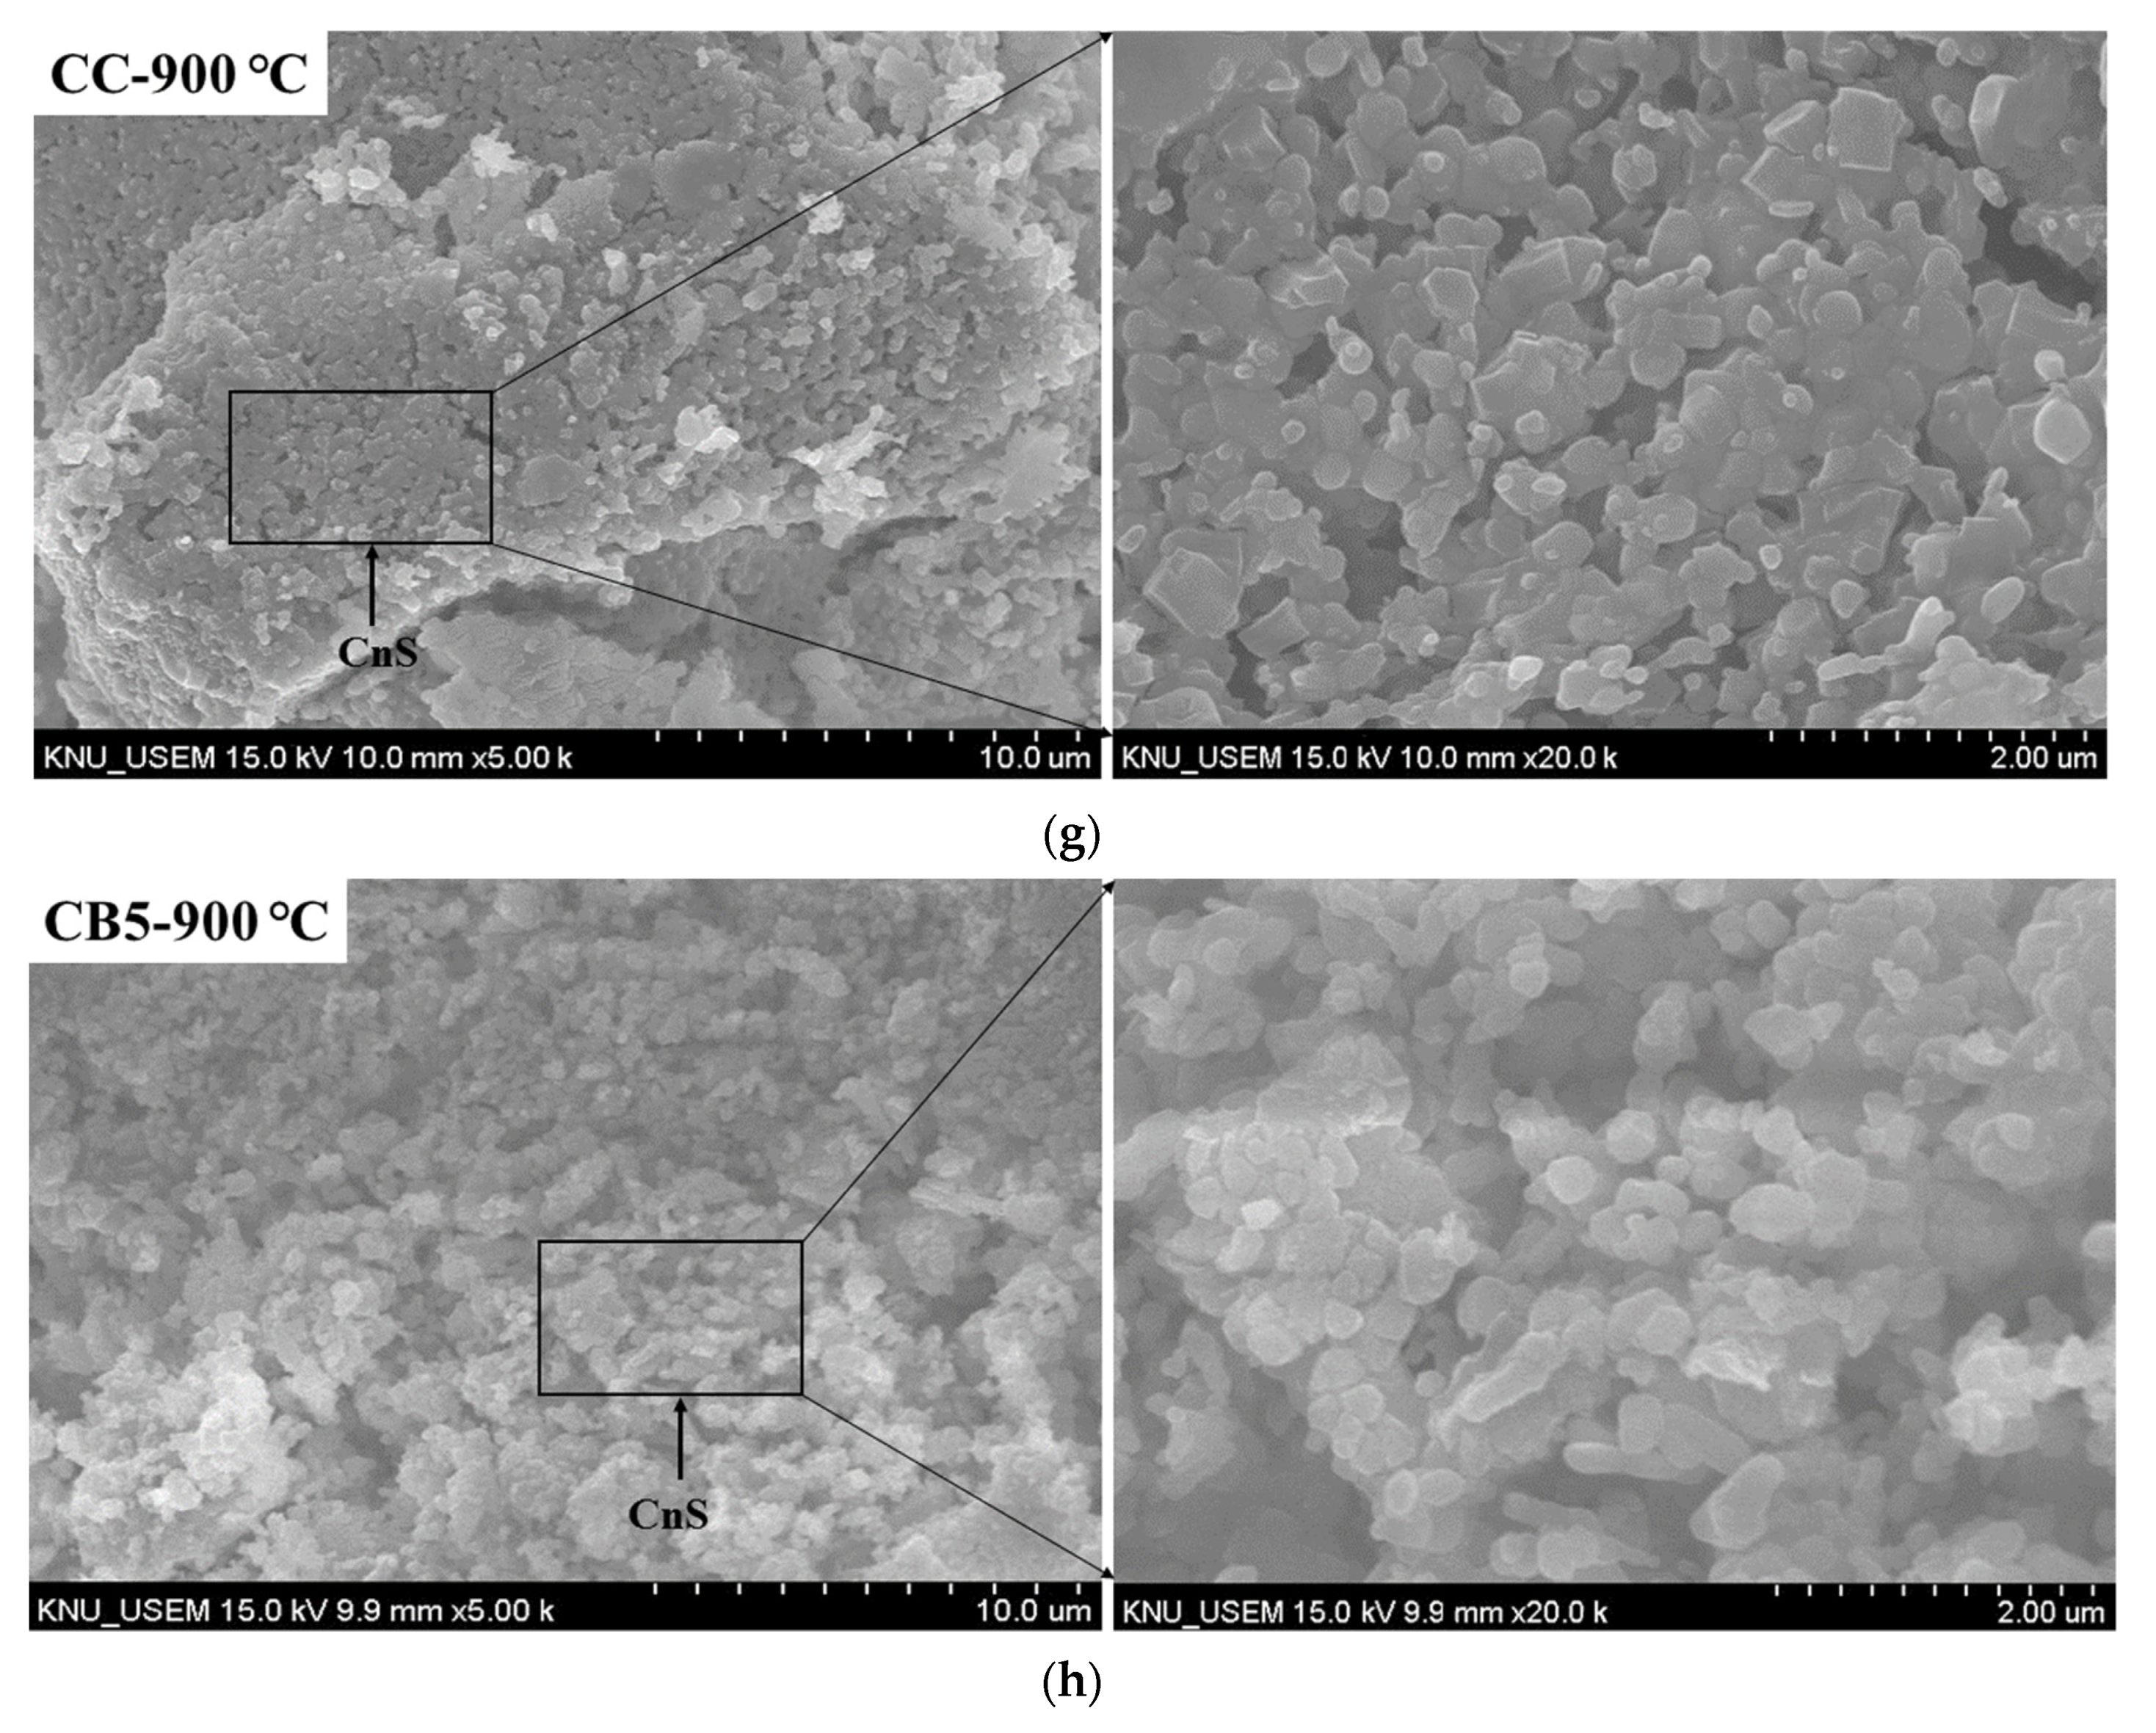
3.8. SEM Analyses
4. Discussion
4.1. Relationship between the Macro Weight Loss and the Micro Weight Loss
4.2. Relationship between Residual Strength and Cracks
4.3. Relationship between Compressive Strength and UPV
5. Conclusions
- The cracks’ widths and number of specimens exposed to any high temperature (300, 550 or 900 °C) decreased with increasing biochar content. The internal pores of biochar promoted the release of vapor pressure, which reduced the generation of cracks.
- The macro weight loss percentage of specimens exposed to 20–300 °C increased with the biochar content because biochar contributed to the release of free water and bound water. The macro weight loss percentage of the specimen exposed to 300–550 °C decreased with the increase in the biochar content, related to the decrease in CH. The macro weight loss percentage of the specimen exposed to 550–900 °C increased with the increase in the biochar content, potentially related to the ignition loss of biochar.
- From 20 to 300 °C, the strength of all specimens increased. Moreover, the strength increase of the biochar-blended specimen was greater than that of the control specimen. First, at 300 °C, the residual compressive strength of specimens increased by 7.1 and 3.4 MPa with 2% and 5% of biochar added compared to no biochar added. Second, at 550 °C, the residual compressive strengths of the control and specimens with 2% biochar were comparable. Third, at 900 °C, the residual compressive strength slightly decreased with the increase in biochar content. Summarily, due to the internal pores of biochar, the addition of an appropriate amount of biochar can improve the high temperature mechanical properties.
- From 20 to 300 °C, the UPV of all specimens decreased. For 300 °C, the UPV of the specimen decreased with the increase in biochar content. At 550 °C, the UPVs of the control and specimens with 2% and 5% biochar were comparable. For 900 °C, the UPV of the specimens with 2% and 5% biochar was greater than that of the control as a result of the reductions in meso cracks.
- FTIR and XRD results indicated that biochar does not change the types of functional groups and crystalline phases of the products of cementitious materials exposed to high temperatures. The free water, AFt, and AFm decomposed before 300 °C. Most of the CH peaks disappeared at 550 °C, and a small amount of recrystallized CH peaks were present. Only the CnS peaks were present at 900 °C.
- TG analysis showed that as the content of biochar increased, the weight loss at 20–300 and 300–550 °C decreased, indicating that the hydration products (CSH, AFt, Mc, and CH) were reduced.
- The SEM images showed that AFt and AFm disappeared at 300 °C. CH disappeared at 550 °C. Biochar particles were difficult to observe at 900 °C and a large amount of CnS was observed at 900 °C.
- The relationships of various properties indicated that it is more comprehensive and necessary to jointly characterize the high-temperature resistance of biochar cementitious materials using various methods. Such as the simultaneous consideration of the trends in the meso cracks, UPV, and residual compressive strength indicates that meso cracks and biochar pores play an important role in influencing the high-temperature-resistance performance of biochar–cement composites. In addition, the experimental FTIR findings at various high temperatures agree with the XRD, TG and SEM results.
Author Contributions
Funding
Institutional Review Board Statement
Informed Consent Statement
Data Availability Statement
Conflicts of Interest
References
- Sarker, P.K.; Kelly, S.; Yao, Z. Effect of fire exposure on cracking, spalling and residual strength of fly ash geopolymer concrete. Mater. Des. 2014, 63, 584–592. [Google Scholar] [CrossRef] [Green Version]
- Anwar Hossain, K.M. High strength blended cement concrete incorporating volcanic ash: Performance at high temperatures. Cem. Concr. Compos. 2006, 28, 535–545. [Google Scholar] [CrossRef]
- Saad, M.; Abo-El-Enein, S.A.; Hanna, G.B.; Kotkata, M.F. Effect of temperature on physical and mechanical properties of concrete containing silica fume. Cem. Concr. Res. 1996, 26, 669–675. [Google Scholar] [CrossRef]
- Irshidat, M.R.; Al-Saleh, M.H. Thermal performance and fire resistance of nanoclay modified cementitious materials. Constr. Build. Mater. 2018, 159, 213–219. [Google Scholar] [CrossRef]
- Kalifa, P.; Chéné, G.; Gallé, C. High-temperature behaviour of HPC with polypropylene fibres. Cem. Concr. Res. 2001, 31, 1487–1499. [Google Scholar] [CrossRef]
- Akhtar, A.; Sarmah, A.K. Novel biochar-concrete composites: Manufacturing, characterization and evaluation of the mechanical properties. Sci Total Environ. 2018, 616–617, 408–416. [Google Scholar] [CrossRef] [PubMed]
- Gupta, S.; Muthukrishnan, S.; Kua, H.W. Comparing influence of inert biochar and silica rich biochar on cement mortar—Hydration kinetics and durability under chloride and sulfate environment. Constr. Build. Mater. 2021, 268, 121142. [Google Scholar] [CrossRef]
- Gupta, S.; Kua, H.W.; Pang, S.D. Effect of biochar on mechanical and permeability properties of concrete exposed to elevated temperature. Constr. Build. Mater. 2020, 234, 117338. [Google Scholar] [CrossRef]
- Gupta, S.; Kua, H.W. Application of rice husk biochar as filler in cenosphere modified mortar: Preparation, characterization and performance under elevated temperature. Constr. Build. Mater. 2020, 253. [Google Scholar] [CrossRef]
- ASTM C109. Standard Test Method for Compressive Strength of Hydraulic Cement Mortars (Using 2-in. or [50-mm] Cube Specimens); ASTM International: West Conshohocken, PA, USA, 2016. [Google Scholar]
- ASTM C597. Standard Test Method for Pulse Velocity through Concrete; ASTM International: West Conshohocken, PA, USA, 2016. [Google Scholar]
- Shang, X.; Lu, Z. Impact of high temperature on the compressive strength of ECC. Adv. Mater. Sci. Eng. 2014, 2014, 919078. [Google Scholar] [CrossRef] [Green Version]
- Hager, I. Colour Change in Heated Concrete. Fire Technol. 2014, 50, 945–958. [Google Scholar] [CrossRef] [Green Version]
- Tai, Y.S.; Pan, H.H.; Kung, Y.N. Mechanical properties of steel fiber reinforced reactive powder concrete following exposure to high temperature reaching 800 °C. Nucl. Eng. Des. 2011, 241, 2416–2424. [Google Scholar] [CrossRef]
- Peng, G.F.; Huang, Z.S. Change in microstructure of hardened cement paste subjected to elevated temperatures. Constr. Build. Mater. 2008, 22, 593–599. [Google Scholar] [CrossRef]
- Tantawy, M.A. Effect of High Temperatures on the Microstructure of Cement Paste. J. Mater. Sci. Chem. Eng. 2017, 05, 33–48. [Google Scholar] [CrossRef] [Green Version]
- Mo, Z.; Gao, X.; Su, A. Mechanical performances and microstructures of metakaolin contained UHPC matrix under steam curing conditions. Constr. Build. Mater. 2021, 268, 121112. [Google Scholar] [CrossRef]
- Zhang, J.; Chen, T.; Gao, X. Incorporation of self-ignited coal gangue in steam cured precast concrete. J. Clean. Prod. 2021, 292, 126004. [Google Scholar] [CrossRef]
- Chen, X.; Li, J.; Xue, Q.; Huang, X.; Liu, L.; Poon, C.S. Sludge biochar as a green additive in cement-based composites: Mechanical properties and hydration kinetics. Constr. Build. Mater. 2020, 262, 120723. [Google Scholar] [CrossRef]
- Alonso, C.; Fernandez, L. Dehydration and rehydration processes of cement paste exposed to high temperature environments. J. Mater. Sci. 2004, 39, 3015–3024. [Google Scholar] [CrossRef]
- Lin, R.S.; Han, Y.; Wang, X.Y. Macro–meso–micro experimental studies of calcined clay limestone cement (LC3) paste subjected to elevated temperature. Cem. Concr. Compos. 2021, 116, 103871. [Google Scholar] [CrossRef]
- Praneeth, S.; Saavedra, L.; Zeng, M.; Dubey, B.K.; Sarmah, A.K. Biochar admixtured lightweight, porous and tougher cement mortars: Mechanical, durability and micro computed tomography analysis. Sci. Total Environ. 2021, 750, 142327. [Google Scholar] [CrossRef] [PubMed]
- Li, L.; Cao, M.; Ming, X.; Yin, H.; Sun, Y. nan. Microstructure of calcium carbonate whisker reinforced cement paste after elevated temperature exposure. Constr. Build. Mater. 2019, 227, 1–9. [Google Scholar] [CrossRef]
- Handoo, S.K.; Agarwal, S.; Agarwal, S.K. Physicochemical, mineralogical, and morphological characteristics of concrete exposed to elevated temperatures. Cem. Concr. Res. 2002, 32, 1009–1018. [Google Scholar] [CrossRef]
- Lin, R.-S.; Lee, H.-S.; Han, Y.; Wang, X.-Y. Experimental studies on hydration–strength–durability of limestone-cement-calcined Hwangtoh clay ternary composite. Constr. Build. Mater. 2021, 269, 121290. [Google Scholar] [CrossRef]
- Lin, R.S.; Park, K.B.; Wang, X.Y.; Zhang, G.Y. Increasing the early strength of high-volume Hwangtoh–cement systems using bassanite. J. Build. Eng. 2020, 30, 101317. [Google Scholar] [CrossRef]
- Lim, S.; Mondal, P. Micro- and nano-scale characterization to study the thermal degradation of cement-based materials. Mater. Charact. 2014, 92, 15–25. [Google Scholar] [CrossRef]
- Piasta, J.; Sawicz, Z.; Rudzinski, L. Changes in the structure of hardened cement paste due to high temperature. Matériaux Constr. 1984, 17, 291–296. [Google Scholar] [CrossRef]
- Lin, R.S.; Wang, X.Y.; Lee, H.S.; Cho, H.K. Hydration and microstructure of cement pastes with calcined Hwangtoh Clay. Materials 2019, 12, 458. [Google Scholar] [CrossRef] [Green Version]
- Ren, M.; Wen, X.; Gao, X.; Liu, Y. Thermal and mechanical properties of ultra-high performance concrete incorporated with microencapsulated phase change material. Constr. Build. Mater. 2021, 273, 121714. [Google Scholar] [CrossRef]
- Lee, H.S.; Wang, X.Y. Hydration Model and Evaluation of the Properties of Calcined Hwangtoh Binary Blends. Int. J. Concr. Struct. Mater. 2021, 15. [Google Scholar] [CrossRef]
- Lee, H.S.; Lim, S.M.; Wang, X.Y. Optimal Mixture Design of Low-CO2 High-Volume Slag Concrete Considering Climate Change and CO2 Uptake. Int. J. Concr. Struct. Mater. 2019, 13. [Google Scholar] [CrossRef]
- Benaicha, M.; Jalbaud, O.; Hafidi Alaoui, A.; Burtschell, Y. Correlation between the mechanical behavior and the ultrasonic velocity of fiber-reinforced concrete. Constr. Build. Mater. 2015, 101, 702–709. [Google Scholar] [CrossRef]


| Chemical Composition (%) | Cement | Biochar |
|---|---|---|
| CaO | 63.90 | 0.23 |
| SiO2 | 21.29 | 19.17 |
| Al2O3 | 5.33 | 0.04 |
| SO3 | 2.57 | 0.14 |
| MgO | 2.06 | 0.10 |
| P2O5 | 0.09 | 0.15 |
| Fe2O3 | 2.74 | 0.05 |
| K2O | 1.08 | 1.19 |
| TiO2 | 0.23 | - |
| ZnO | 0.11 | - |
| CO2 | - | 78.74 |
| MnO | - | 0.04 |
| Cl | - | 0.10 |
| Na2O | - | 0.05 |
| LOI | 0.59 | - |
| Sample | Cement | Biochar | Water | Water/Binder Ratio |
|---|---|---|---|---|
| CC (control) | 100 | 0 | 50 | 0.5 |
| CB2 (2%) | 98 | 2 | 50 | 0.5 |
| CB5 (5%) | 95 | 5 | 50 | 0.5 |
| No. | Experimental Items | Specimen Type | Temperature (°C) |
|---|---|---|---|
| 1 | Optical Microscopic image | All samples | 20, 300, 550 and 900 |
| 2 | Macro weight loss | All samples | 20–300, 300–550, 550–900 |
| 3 | Compressive strength | All samples | 20, 300, 550 and 900 |
| 4 | UPV | All samples | 20, 300, 550 and 900 |
| 5 | FTIR | All samples | 20, 300, 550 and 900 |
| 6 | XRD | All samples | 20, 300, 550 and 900 |
| 7 | TGA | All samples | 20–900 |
| 8 | SEM | CC, CB5 | 20, 300, 550 and 900 |
| Temperature | CC | CB2 | CB5 |
|---|---|---|---|
| 20 °C |  |  |  |
| 300 °C |  |  |  |
| 550 °C |  |  |  |
| 900 °C |  |  |  |
| Sample | Macro Weight Loss (%) | ||
|---|---|---|---|
| 20–300 °C | 300–550 °C | 550–900 °C | |
| CC | 24.6 | 6.0 | 2.8 |
| CB2 | 25.3 | 5.1 | 4.3 |
| CB5 | 25.8 | 4.0 | 6.5 |
| Sample | TG Weight Loss (%) | ||
|---|---|---|---|
| 20–300 °C | 300–550 °C | 550–900 °C | |
| CC | 16.8 | 6.2 | 3.1 |
| CB2 | 15.0 | 5.9 | 4.8 |
| CB5 | 14.9 | 5.8 | 5.9 |
Publisher’s Note: MDPI stays neutral with regard to jurisdictional claims in published maps and institutional affiliations. |
© 2021 by the authors. Licensee MDPI, Basel, Switzerland. This article is an open access article distributed under the terms and conditions of the Creative Commons Attribution (CC BY) license (https://creativecommons.org/licenses/by/4.0/).
Share and Cite
Yang, X.; Lin, R.-S.; Han, Y.; Wang, X.-Y. Behavior of Biochar-Modified Cementitious Composites Exposed to High Temperatures. Materials 2021, 14, 5414. https://doi.org/10.3390/ma14185414
Yang X, Lin R-S, Han Y, Wang X-Y. Behavior of Biochar-Modified Cementitious Composites Exposed to High Temperatures. Materials. 2021; 14(18):5414. https://doi.org/10.3390/ma14185414
Chicago/Turabian StyleYang, Xu, Run-Sheng Lin, Yi Han, and Xiao-Yong Wang. 2021. "Behavior of Biochar-Modified Cementitious Composites Exposed to High Temperatures" Materials 14, no. 18: 5414. https://doi.org/10.3390/ma14185414
APA StyleYang, X., Lin, R.-S., Han, Y., & Wang, X.-Y. (2021). Behavior of Biochar-Modified Cementitious Composites Exposed to High Temperatures. Materials, 14(18), 5414. https://doi.org/10.3390/ma14185414