1. Introduction
The blast furnace (BF) is a high-efficiency shaft furnace. The high heat utilization rate and production efficiency make the BF route the dominant ironmaking process globally [
1]. About 70% of the hot metal used in producing crude steel comes from the BF route [
2,
3,
4]. Coke is an indispensable burden in the blast furnace, and its performance shows a substantial impact on the ironmaking process [
5]. The coke plays the role of the skeleton, which ensures the gas and liquid penetration through the blast furnace. The Coke reactivity index (CRI) and the coke strength after reaction (CSR) are the most widely used indexes to indicate the coke degradation potential in a blast furnace. A coke with good quality shows a lower CRI and a higher CSR.
To cut CO
2 emissions during BF ironmaking process, many methods have been developed for substituting part of the coke, such as the application of ferro coke [
6,
7] and biomass coke [
8,
9], injection of pulverized coal or biomass, or natural gas, etc. [
10,
11,
12,
13,
14]. Oxygen-enriched blast technology is another well-used method to decrease the coke ratio by increasing the production rate of hot metal through enhancing the combustion intensity of coke and pulverized coal [
15,
16]. However, these methods result in higher requirements of coke quality, especially the coke strength. The coke quality should be adequate to ensure a continuous production of hot metal in the BF [
17].
Coke shows different deterioration degrees in different parts of the blast furnace. During the movement from the top to the lower part of the furnace, most lump cokes break into smaller particles consumed in the hearth. In this process, the structures of the coke change significantly [
18]. It is well known that the reactivity [
19,
20] and the strength of coke [
21,
22,
23,
24] are closely related to its structures. Therefore, it is essential to characterize the coke structures comprehensively. It should be noted that the properties of the parent coal and coking condition also influence the coke properties. Currently, there is no specific test for coals to guarantee high-quality coke products. Instead, multitudes of empirical laboratory tests have been developed to investigate aspects of the physical, chemical, and thermoplastic behavior of individual coals and blends [
25]. Some researchers summarized some models for predicting the metallurgical coke quality based on maceral composition and properties of coals. However, the models were not satisfactory when applied to coals or blends of different geological histories [
26]. Generally, in terms of coal properties, coke quality is primarily influenced by coal rank, coal type (reactive and inert macerals), and its inherent ability to soften, become plastic, and re-solidify into a coherent mass when heated [
25]. As a general comment on model replication, they cannot be used beyond the conditions under which they were derived [
27]. It is more acceptable to conclude the relations between coke structure and the properties.
At present, many studies discussed the relationship between coke structures and properties, but there is a lack of systematic discussion on characterization methods of coke structures. Considering the complexity of coke structures, this review divides the coke structures into chemical structure, physical structure, and optical texture. First, the relation between coke structures and coke properties is reviewed. Then, the appropriate characterization methods of the coke structures are introduced. Lastly, a general procedure of construction of a coke molecular model is proposed. We hope to bring about some inspiration for understanding and simulating the coke degradation at a molecular scale.
2. Relations between Coke Structures and Properties
The most important properties of coke are the reactivity and the strength. To measure the reaction characteristics of coke under high temperature conditions, the reactivity index (CRI), and coke strength after reaction (CSR) are proposed. CRI refers to the ability of the coke to react with carbon dioxide at 1100 °C. CSR refers to the strength of the coke after the reaction with carbon dioxide. CRI and CSR are two critical indicators of the thermal performance of coke. It is believed that a good quality metallurgical coke should have low CRI and high CSR. If the CRI is too high, the starting temperature of the reaction between the coke and CO2 will decrease. In other words, the reaction may start at the upper part of the blast furnace, resulting in the generated CO escaping from the top of the blast furnace. The cold/hot compressive strength of the coke is measured by two flat plates in room/high temperature conditions. One of the plates moves to compress the coke sample till the coke is destroyed. When the coke is used in a giant blast furnace, the compressive strength should be sufficient to support the iron-containing burdens. The following subsections introduce the relations between coke structures and the coke properties.
2.1. Coke Structure and Reactivity
The main factors influencing the reactivity of coke include the pore structures, the mineral types and contents, and the inherent properties of the carbon matrix. Guo et al. [
28] analyzed the porosities, pore wall thicknesses, and pore size distributions of 10 types of cokes to find the relations between these parameters and CRI. The reactivity of the coke was mainly affected by the content of pores with a size between 60 and 120 μm. These pores were important channels for the diffusion of the reaction gas into the coke. The coke with a larger pore wall thickness showed a lower CRI. Fott et al. [
29] found a similar phenomenon in that the effective diffusion rate of CO
2 in the ultra-micropores and macropores of the coke was relatively small. In these pores, the reaction only occurred in a small local area.
There are two primary sources of minerals that affect coke’s reactivity: the inherent minerals in the coke matrix and the extrinsic minerals that are enriched in the blast furnace. A large number of studies have pointed out that the minerals in the coke matrix showed different promotion effects on the reactivity of the coke [
30,
31,
32,
33,
34]. Generally, the cations of the minerals played a critical role in the promotion effects. The catalytic effect in descending order were K
+ > Na
+ > Ca
2+ > Mg
2+ > Fe
2+ > Al
3+ > Si
4+. To study the impact of the specific types of the minerals, a so-called coke analogue was developed for simulating the industrial coke. Reid et al. [
30] used the coke analogue to simulate the metallurgical coke with a particular type of mineral. It was found that K
+ showed the most potent catalytic effect. Due to the strong catalytic effect, alkali elements are regarded as detrimental for the blast furnace [
35,
36]. The influence of alkali elements in the blast furnace on coke reactivity has been a hot topic [
37]. The impact of Zn has also been extensively studied in recent years [
38,
39]. The extrinsic minerals enriched in the blast furnace are not within the scope of this review paper. In general, the appearance of these alkali and Zn elements could strongly accelerate the degradation of the coke.
Coke is a brittle material with a developed pore system composed of pore walls, pores, and cracks. The basic unit of the coke pore wall is the microcrystallite structure [
40]. Ignoring the influence of the pore structures and the mineral effect, the inherent property of the coke matrix is the decisive factor that determines the reactivity of the coke. The two crucial intrinsic properties of the coke matrix are microcrystallite and optical characteristics. The method of determining the microcrystallite parameters, such as the average stacking height (Lc) of crystalline, the average size (La) of crystalline layer, and the average spacing (d
002) of crystalline, are introduced in
Section 3.2.2. The method of determining optical characteristics, such as isotropic texture content (∑ISO) and anisotropic degree (OTI) is presented in
Section 3.3. Zhang et al. [
41] evaluated 30 different metallurgical cokes and found that d002, Lc, and La were in the ranges of 3.46–3.51 Å, 28.95–42.18 Å, and 41.40–53.05 Å, respectively. The interlayer spacing of cokes showed a neglectable difference. It was found that when the mineral effect was not strong, the CRI decreased with the increasing Lc and La. During the CO
2 gasification reaction, the isotropic texture in the coke reacted more quickly than the anisotropic texture [
42,
43,
44,
45]. The higher value of the ∑ISO of the coke is, the higher CRI of the coke will be. OTI is another index but describes the same optical phenomenon of the coke matrix. Generally, the coke with a higher value of OTI shows lower CRI.
2.2. Coke Structure and Strength
The direct forces that cause the degradation of the coke in the blast furnace are the friction and collision between the bulk burden materials, such as iron ore sinter, iron ore pellet, and cokes. The coke strength can be comprehensively indicated by cold compressive strength, CSR, and hot compressive strength. The pore structures play an essential role in determining the strength of the coke. Mihashi et al. [
46] found that the matrixes of different cokes showed similar strength. Young et al. [
22] used the 3-dimensional discrete element method to simulate the compressive cracks of coke. It was found that porosity is the main factor affecting the strength of the coke. A uniform pore distribution and less porosity contributed to the coke’s higher cold compressive strength. Saito et al. [
23] used the rigid bodies–spring model to analyze the relations between the pores and the cold compressive strength. He found that slight roundness and large distorted pores might cause stress concentration and significantly reduce the strength of coke. Gornostayev et al. [
24] found a similar result by directly observing the coke using a scanning electron microscope. The elliptical, elongated, and flattened pores, compared with circular pores, showed a lower ability to resist load pressure. The high cold compressive strength of coke could not guarantee its high CSR. The CSR presents a good negative correlation with the CRI [
21,
47,
48]. The factors that affect the CRI of the coke inevitably affect the CSR of coke. The aim of measuring hot compressive strength is to simulate the load borne by the coke in an actual blast furnace. Haapakangas et al. [
49,
50] used the Gleeble thermomechanical simulator to evaluate the coke hot compressive strength at 1000 °C, 1600 °C, and 1750 °C. It was found that the coke was brittle at 1000 °C but partially plastic at 1600 °C and 1750 °C. The high-temperature treatment above the temperature of the coking furnace may cause further graphitization. The non-graphitizing carbons became harder, and the graphitizing carbons became softer at temperatures between 1000 °C and 2000 °C. The low coke compressive strength at high temperature was considered to be due to the high graphitization degree of the coke. Fang et al. [
51] investigated the relations between temperature, carbon loss of the coke, and hot compressive strength. It was found that the hot compressive strength was significantly decreased with the increasing carbon loss of the coke and the temperature. However, the effects of individual factors affecting coke hot strength were not illustrated. Guo et al. [
52] studied the influence of the pore structure features on the hot compressive strength of coke. It showed that in the temperature between 1000 °C and 1300 °C, the temperature presented a limited influence on the strength. The coke with a higher hot compressive strength showed a smaller pore size with a more uniform distribution. The following chapter introduced the relevant characterization methods of the coke structures.
3. Characterization of Coke Structures
3.1. Chemical Structure
Coke is the solid residue of impure carbon obtained from coal after pyrolysis in a coking oven. The chemical structure of coke is discussed in two aspects: the element composition and the functional group. The chemical data obtained through experiments helps to obtain the formula of coke.
3.1.1. Ultimate Analysis
Coke mainly consists of C, H, O, N, and S elements. The average molecular formula of a coke can be simply represented by the ratio of these five elements. The contents of C and H are determined by the combustion method. The principle is to convert C and H into CO
2 and H
2O. The generated CO
2 and H
2O can be captured by an absorbent. The C and H contents in the coke samples are calculated from the weight gain of the absorbent. The determination of N content is to add the mixed catalyst and sulfuric acid to the coke sample. The N will convert into NH
4HSO
4 after being heated. Then adding NaOH into the mixed liquid, the NH
3 will be evaporated and absorbed into the H
3BO
3. The N content can be obtained by titration with the sulfuric acid standard solution. The determination of S content can be done by Eschka method, the bomb washing method, and the high-temperature combustion method. For O analysis, the methods are similar to those described for the determination of C but with pyrolysis in helium instead of oxygen. The easiest way to obtain O content is using 100% minus the total contents of C, H, N, and S. The contents of H, O, N, and S elements in the coke are typically low. White et al. [
53] discussed how to determine these elements. Therefore, detailed procedures are not given here. It should be noted that there is also the proximate analysis of coke determining the content of fixed carbon, moisture, volatile matter, and ash of the coke. The proximate analysis provides a fast determination of the composition of the coke and gives a preliminary judgment of the coke quality. The ultimate analysis is more comprehensive and is dependent on quantitative analysis of C, H, O, N, and S elements present in the coke. The C content from the ultimate analysis is generally higher than the fixed carbon content from the proximate analysis. Because the C content from ultimate analysis includes the carbon that escapes as volatile matter. For the calculation of coke molecular formula, the ultimate analysis should be used.
The molecular formula of a coke can be calculated according to the ratio of H/C, S/C, O/C, and N/C obtained from the ultimate analysis. Wang et al. [
54] and Tian et al. [
55] have successfully determined the average molecular formula of coke based on the elemental ratio and built the molecular model. The detailed molecular model is discussed in
Section 4.
3.1.2. Functional Group
Most of the functional groups on the benzene rings decompose during high-temperature carbonization. At present, the following four methods are usually used to characterize the functional groups of carbon materials: Fourier infrared spectroscopy (FTIR), Raman spectroscopy (Raman), X-ray photoelectron spectroscopy (XPS), and nuclear magnetic resonance imaging technology (13C NMR). The carbon skeleton structures (carbon category), such as aliphatic carbon, olefinic carbon, aromatic carbon, and polyaromatic hydrocarbon, can be analyzed by FTIR, Raman, and 13C NMR. FTIR and Raman provide a fast measurement and an essential identification of the carbon’s surrounding environment. It should be noticed that Raman is more sensitive to carbon skeleton structure, while the aliphatic side chains and functional groups are usually characterized by FTIR and 13C NMR. 13C NMR could provide more structure parameters about the carbon skeleton and functional groups, but it is expensive. XPS can be used to analyze the relative content of functional groups, especially for oxygen-containing functional groups. It is unnecessary to use all these four methods together to determine the functional groups. One of these methods is adequate to obtain general information of the functional groups. Details of these four methods are discussed below.
Fourier Infrared Spectroscopy (FTIR)
FTIR has the advantages of simple operation and high resolution. It has been widely used in characterizing the evolution of functional groups of the coal and biomass char during high-temperature pyrolysis [
56,
57]. Coke is the residue product of coal after pyrolysis without air. Coke matrix is connected by amorphous carbon and ordered carbon structural units through bridge bonds. The ordered carbon structure, generally called aromatic core, is formed by condensation of the benzene ring, alicyclic ring, hydrogenated aromatic ring, and heterocyclic ring. The amorphous carbon and irregular structures are the alkyl side chain and an oxygen-containing functional group connecting to the aromatic nucleus [
58].
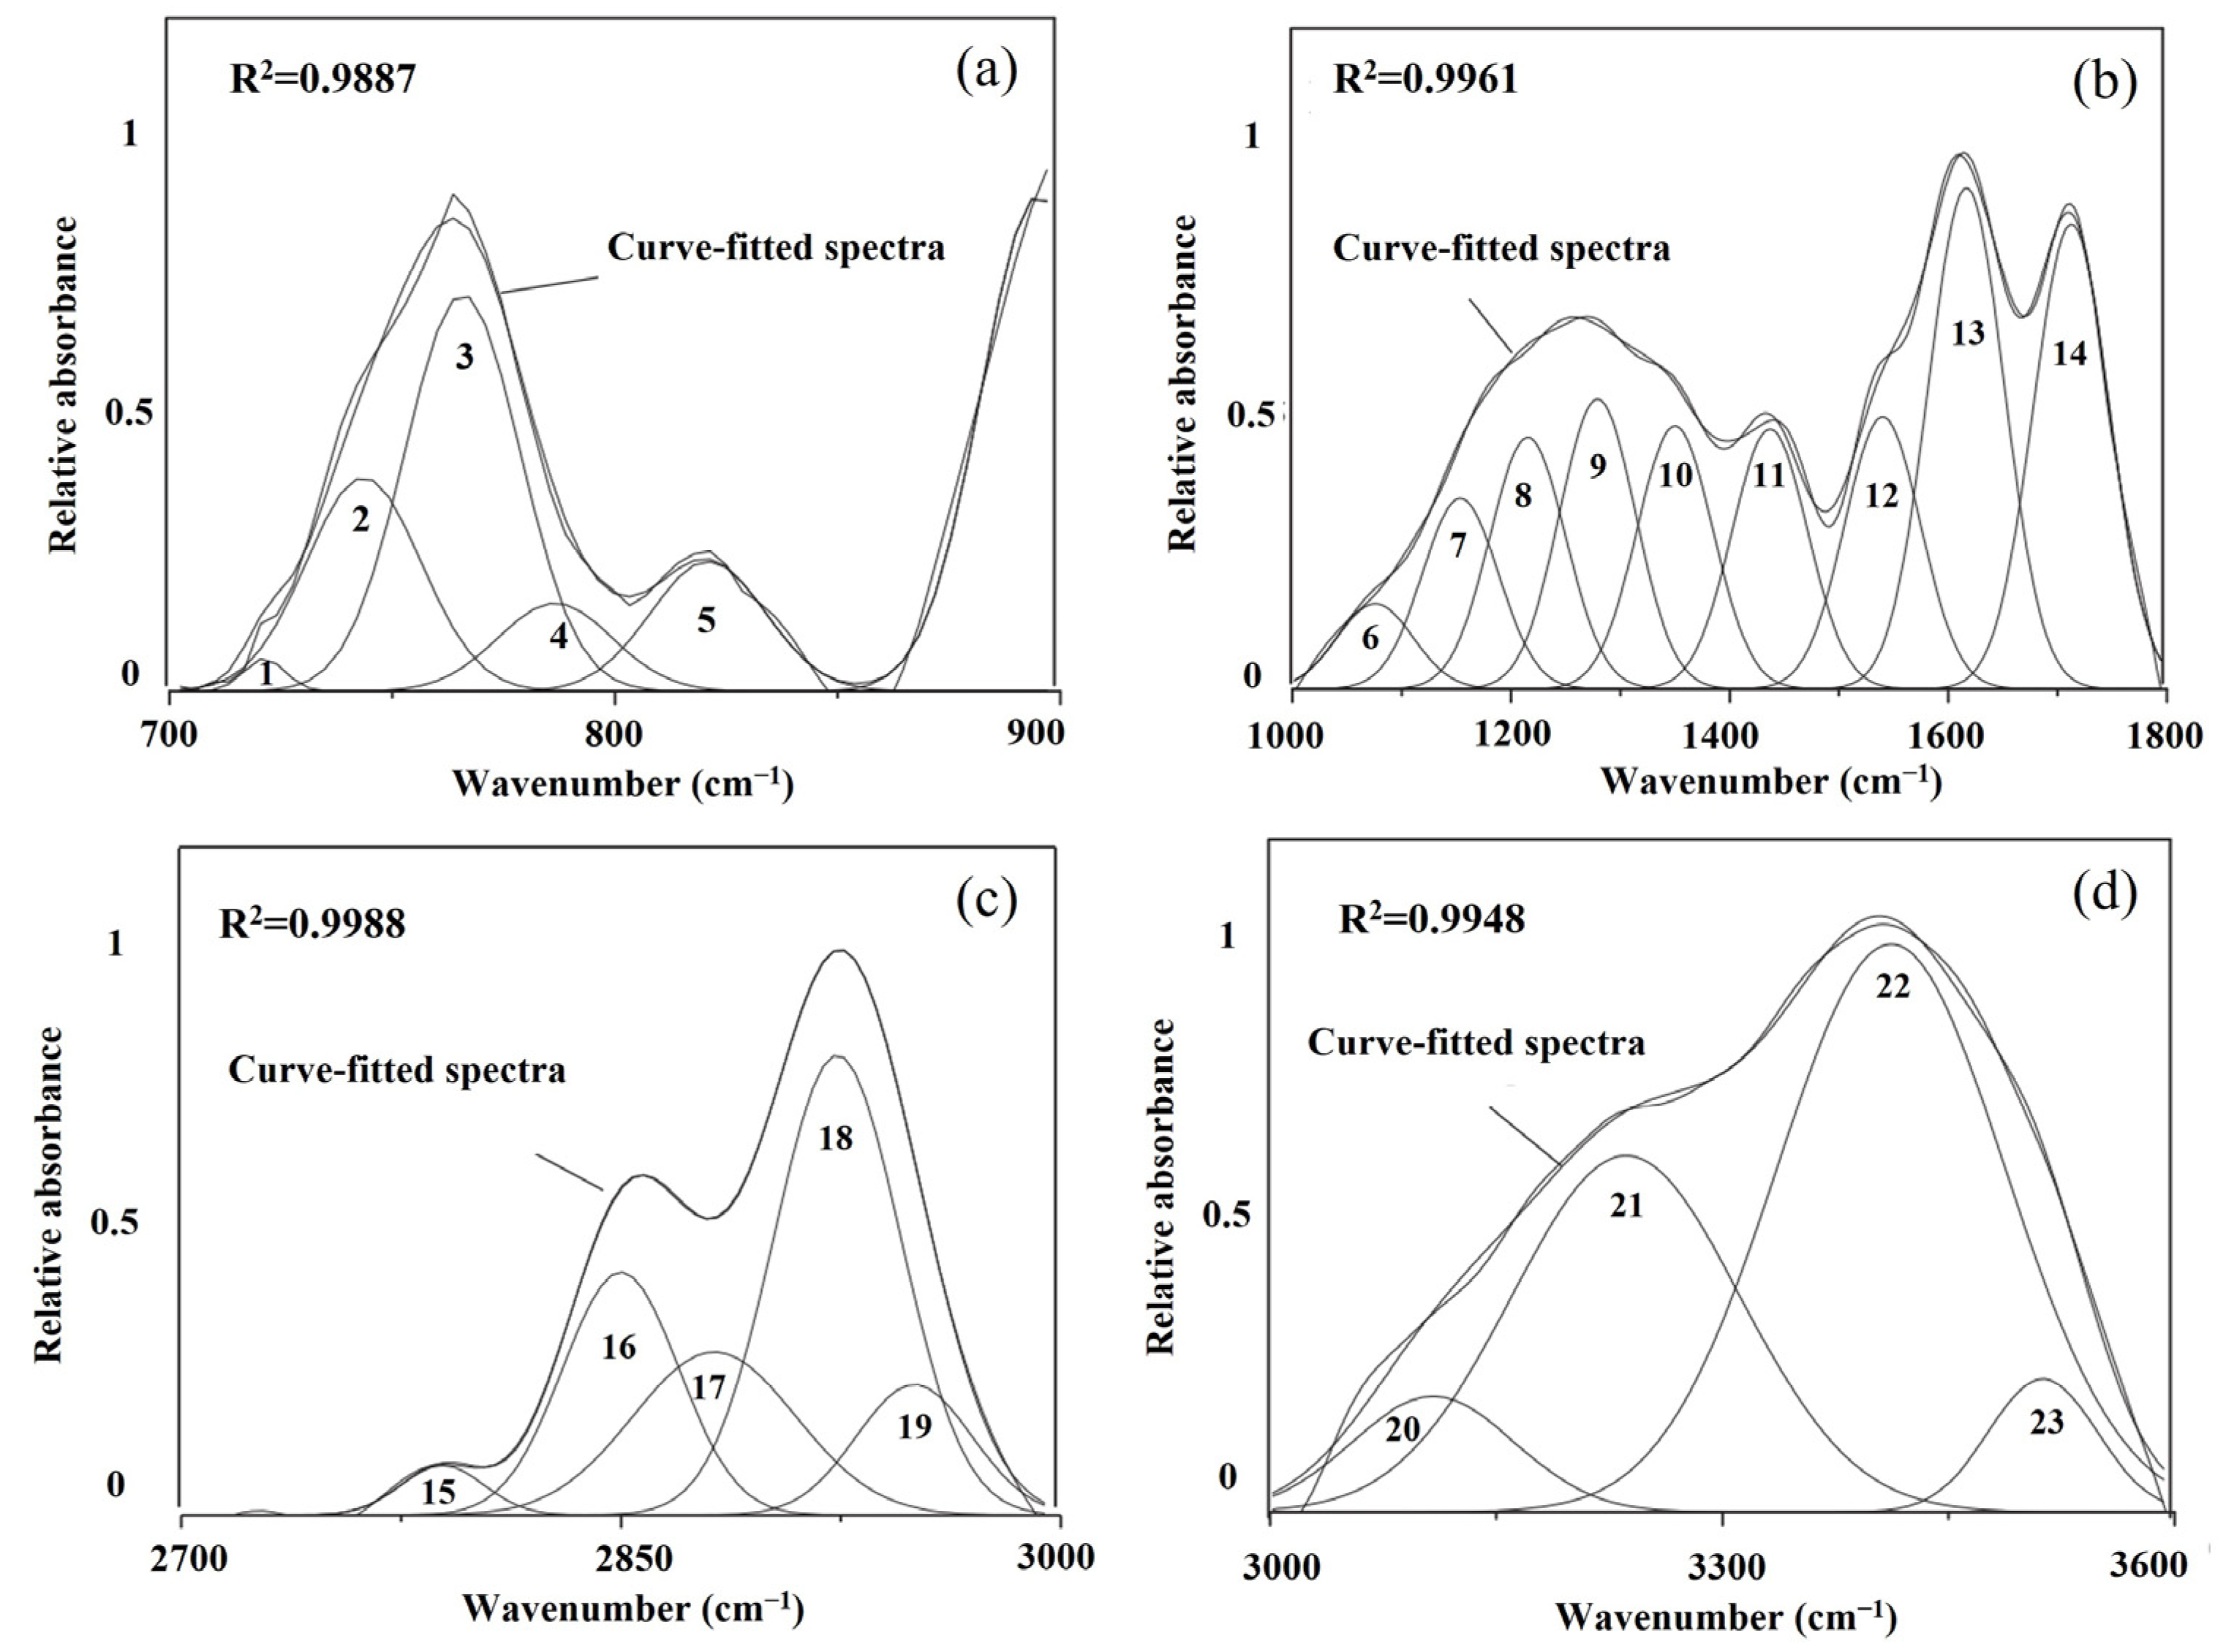
The key to the coke structure analysis by FTIR method lies in identifying absorption peak and its assignment. The different functional groups and relative contents in the coke structure can be determined by identifying the peak displacement. The typical FTIR spectrum can be divided into aromatic structure (700–900 cm
−1), oxygen-containing functional group (1000–1800 cm
−1), aliphatic functional group (2700–3000 cm
−1), and hydroxyl group (3000–3600 cm
−1) [
59,
60]. Feng et al. [
60] illustrated the FTIR spectrum of these four structures in lignite, as shown in
Figure 1. The peak-fitting information and parameters are listed in
Table 1. The relative content of each functional group can be calculated by the ratio of the peak areas. The following ratios can be used as structure parameters to describe the functional groups semi-quantitatively [
60]:
Har/H (hydrogen aromaticity) is the ratio of H atoms in the aromatic compounds to the total amount of H atoms. This value is calculated as (areas of peak 1–5)/(areas of peak 1–5 + areas of peak 15–19);
CH3/CH2 represents the aliphatic chain length and degree of branching of the aliphatic side group (side chains attached to macromolecular structure). A lower value implies comparatively longer and straight chains. This value is calculated as (areas of peak 15, 17, and 19)/(areas of peak 16 and 18);
far (aromatic–carbon ratio), representing the percentage of C atoms in sp2 hybrid relative to the total C. A higher value indicates higher aromaticity.
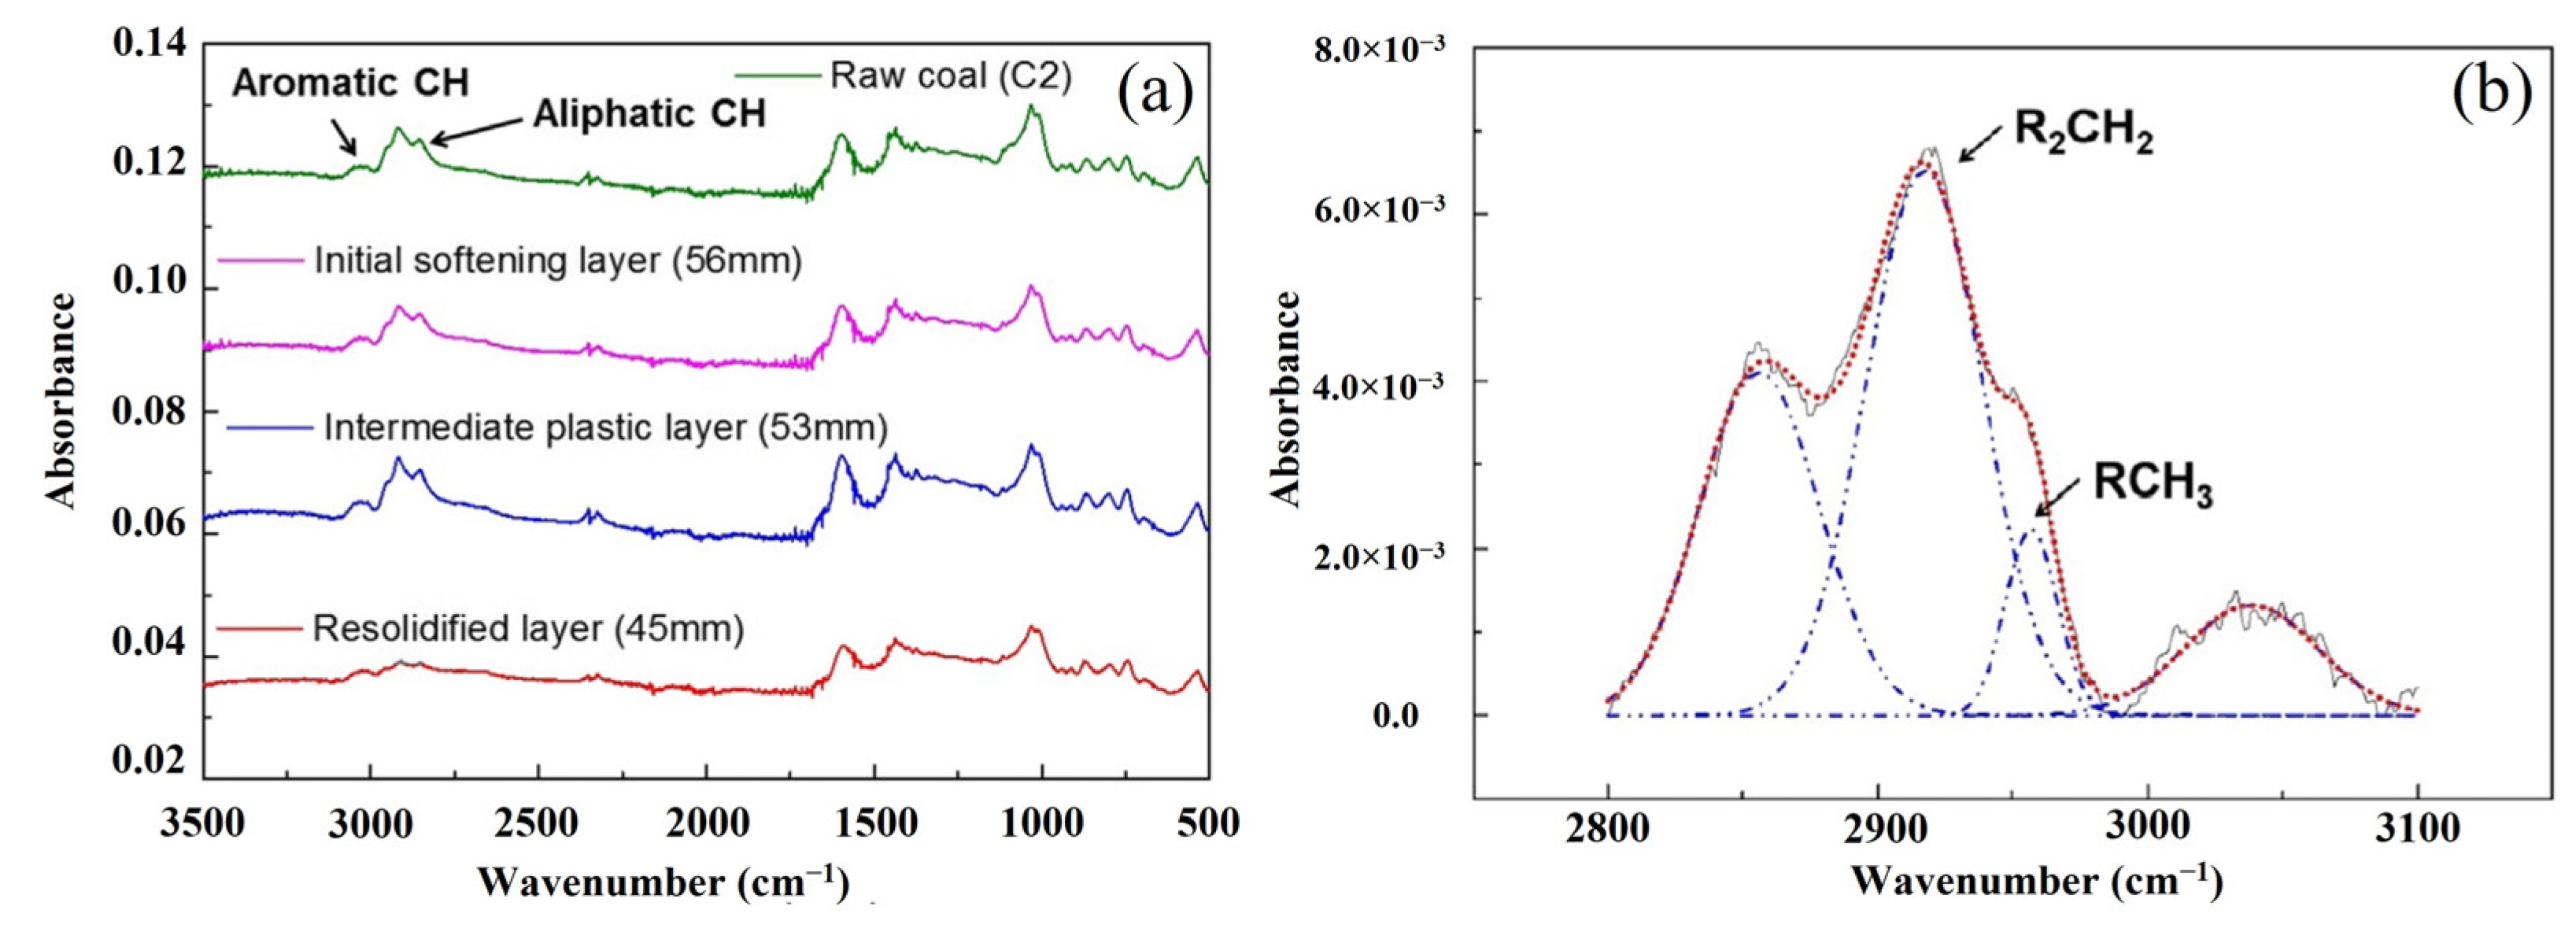
To investigate the changes in functional groups during coking, Lee et al. [
57] used an in-situ sampling probe to obtain the residue sample in the different positions of the coke oven. The different positions of the coke oven simulated the different periods of the coking procedure.
Figure 2a shows the FTIR spectrums of these samples, and
Figure 2b shows an example of deconvolution of the spectra. The identification of absorption peak and its assignment agree with
Table 1.
Raman Spectroscopy (Raman)
Raman is a kind of scattering spectrum. The scattering spectra with different frequencies of incident light can be analyzed to obtain the information of molecular vibration and rotation. The corresponding spectral data can be retrieved from the Raman spectrum database and applied to the study of molecular structure [
61]. The Raman effect is independent of the laser wavelength, indicating that the laser wavelength range would have little influence on the Raman spectra.
The Raman spectra for carbon material mainly consist of G (graphite) and D (defect) bands, whose peaks locate around 1580–1600 cm
−1 and 1350, respectively [
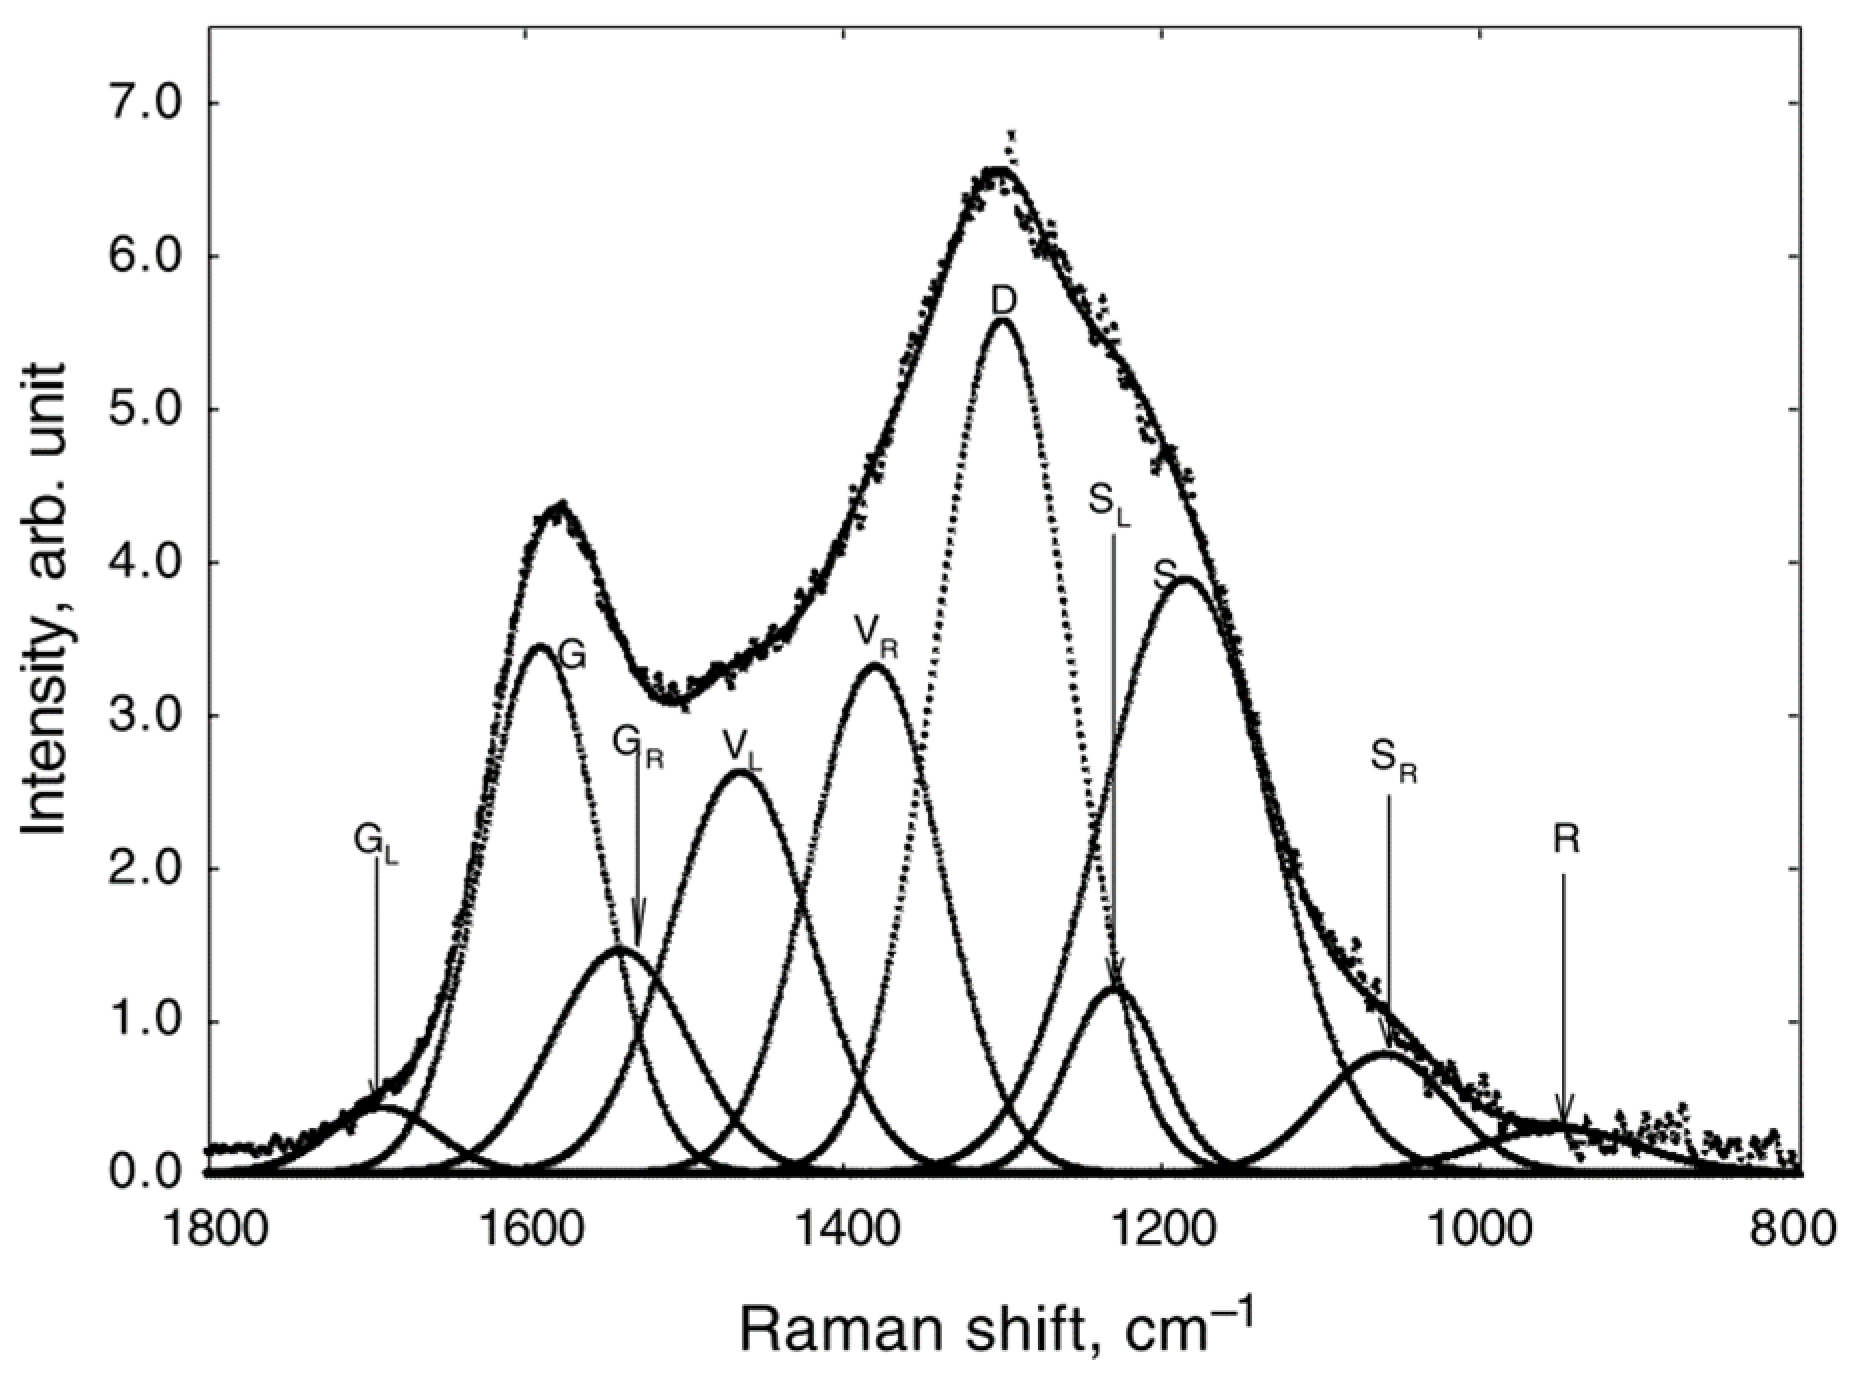
62]. As for highly disordered carbonaceous material, such as coal char and coke, some structural information may be hidden in the overlapped area between these two bands. Li et al. [
63] studied the structural evolution during the pyrolysis of brown coal by Raman spectroscopic method. To obtain detailed information about the skeletal carbon structures, the Raman spectra were curve-fitted in the range of 800 and 1800 cm
−1.
Figure 3 shows an example of a coal sample after carbonization at 700 °C. The ten typical bands are summarized in
Table 2.
It is unnecessary to fit the Raman spectra with all the ten sub-bands. It depends on the shape of the raw curve. Rantitsch et al. [
64] assessed the quality of the metallurgical cokes with varied CRI by Raman.
Figure 4a shows the fitted Raman spectra of the cokes. To quantitively estimate the ordered carbon structure, the peak area ratio D1/(G + D1 + D2), namely R2, was defined. A smaller R2 value indicated a better microstructural order. It was found that the coke with a high reactivity contained a more disordered carbon structure. Rantitsch et al. [
65] further analyzed the microstructural evolution of cokes from the deadman towards the raceway of a blast furnace.
Figure 4b,c shows the Raman spectra of the cokes from different parts of a blast furnace. The coke from the raceway where the temperature was higher showed a well-ordered carbon structure.
X-ray Photoelectron Spectroscopy (XPS)
XPS is sensitive to the bonding states of C and O elements, such as graphitized C, C-O bond, C=O bond, and COO-bond. The fundamental use X-ray to transform the electrons within the atoms to free electrons. By measuring the generated energy of the photon, the binding energy of the electrons in the solid sample can be obtained. The binding energies of the elements in different chemical environments have slight differences, which are called chemical shifts. The state of the element can be determined by the magnitude of the chemical shift [
66]. The summary of carbon functional groups and corresponding binding energy are listed in
Table 3.
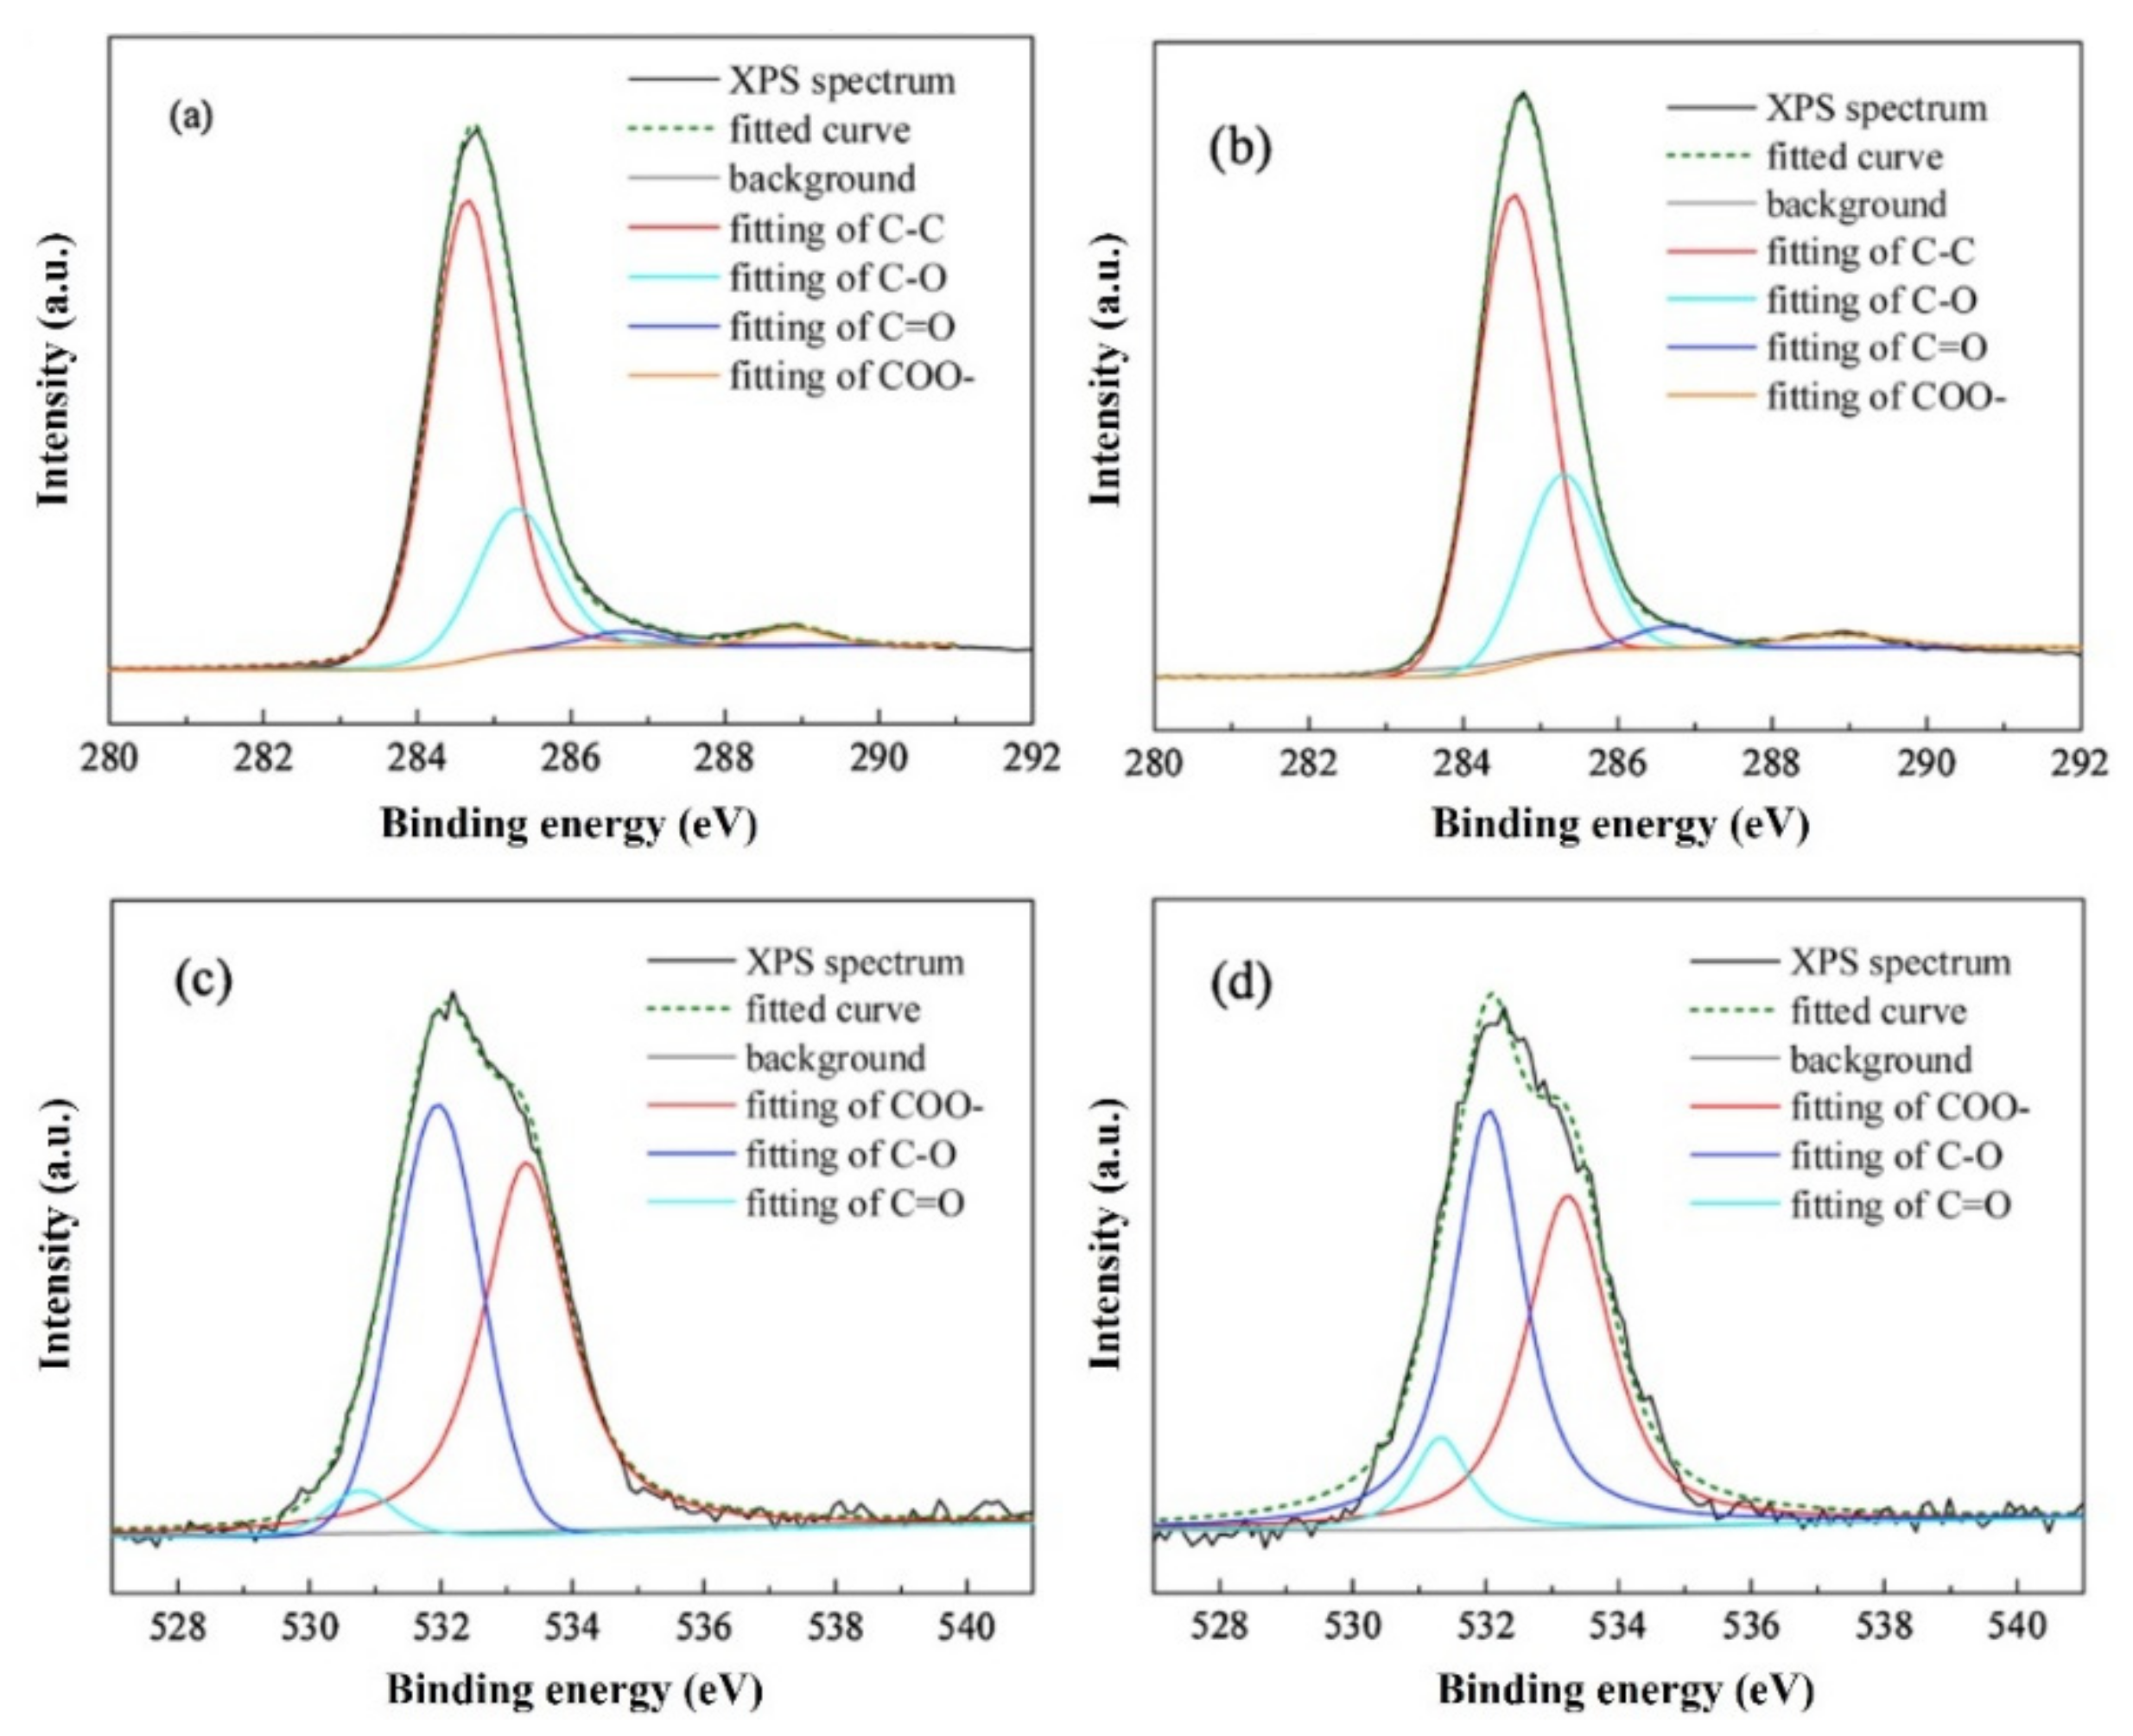
Liu et al. [
67] investigated the influence of blend ratios on the coke morphology and composition. The atomic ratios of C and O in different functional group states were calculated by XPS-PEAK software.
Figure 5 shows the typical XPS C1s and O1s spectra of the cokes. B0 and B3 are the cokes without and with 30% bio tar. The relative contents of different C and various classes of O in these two coke samples are presented in
Table 4. It shows that most carbons are in the C-C and C-H forms. The main form of O in coke is phenol hydroxyl.
Nuclear Magnetic Resonance Imaging Technology (13C NMR)
Few studies can be found discussing the
13C NMR spectra of coke. Most of the research focuses on the investigation of coal structure.
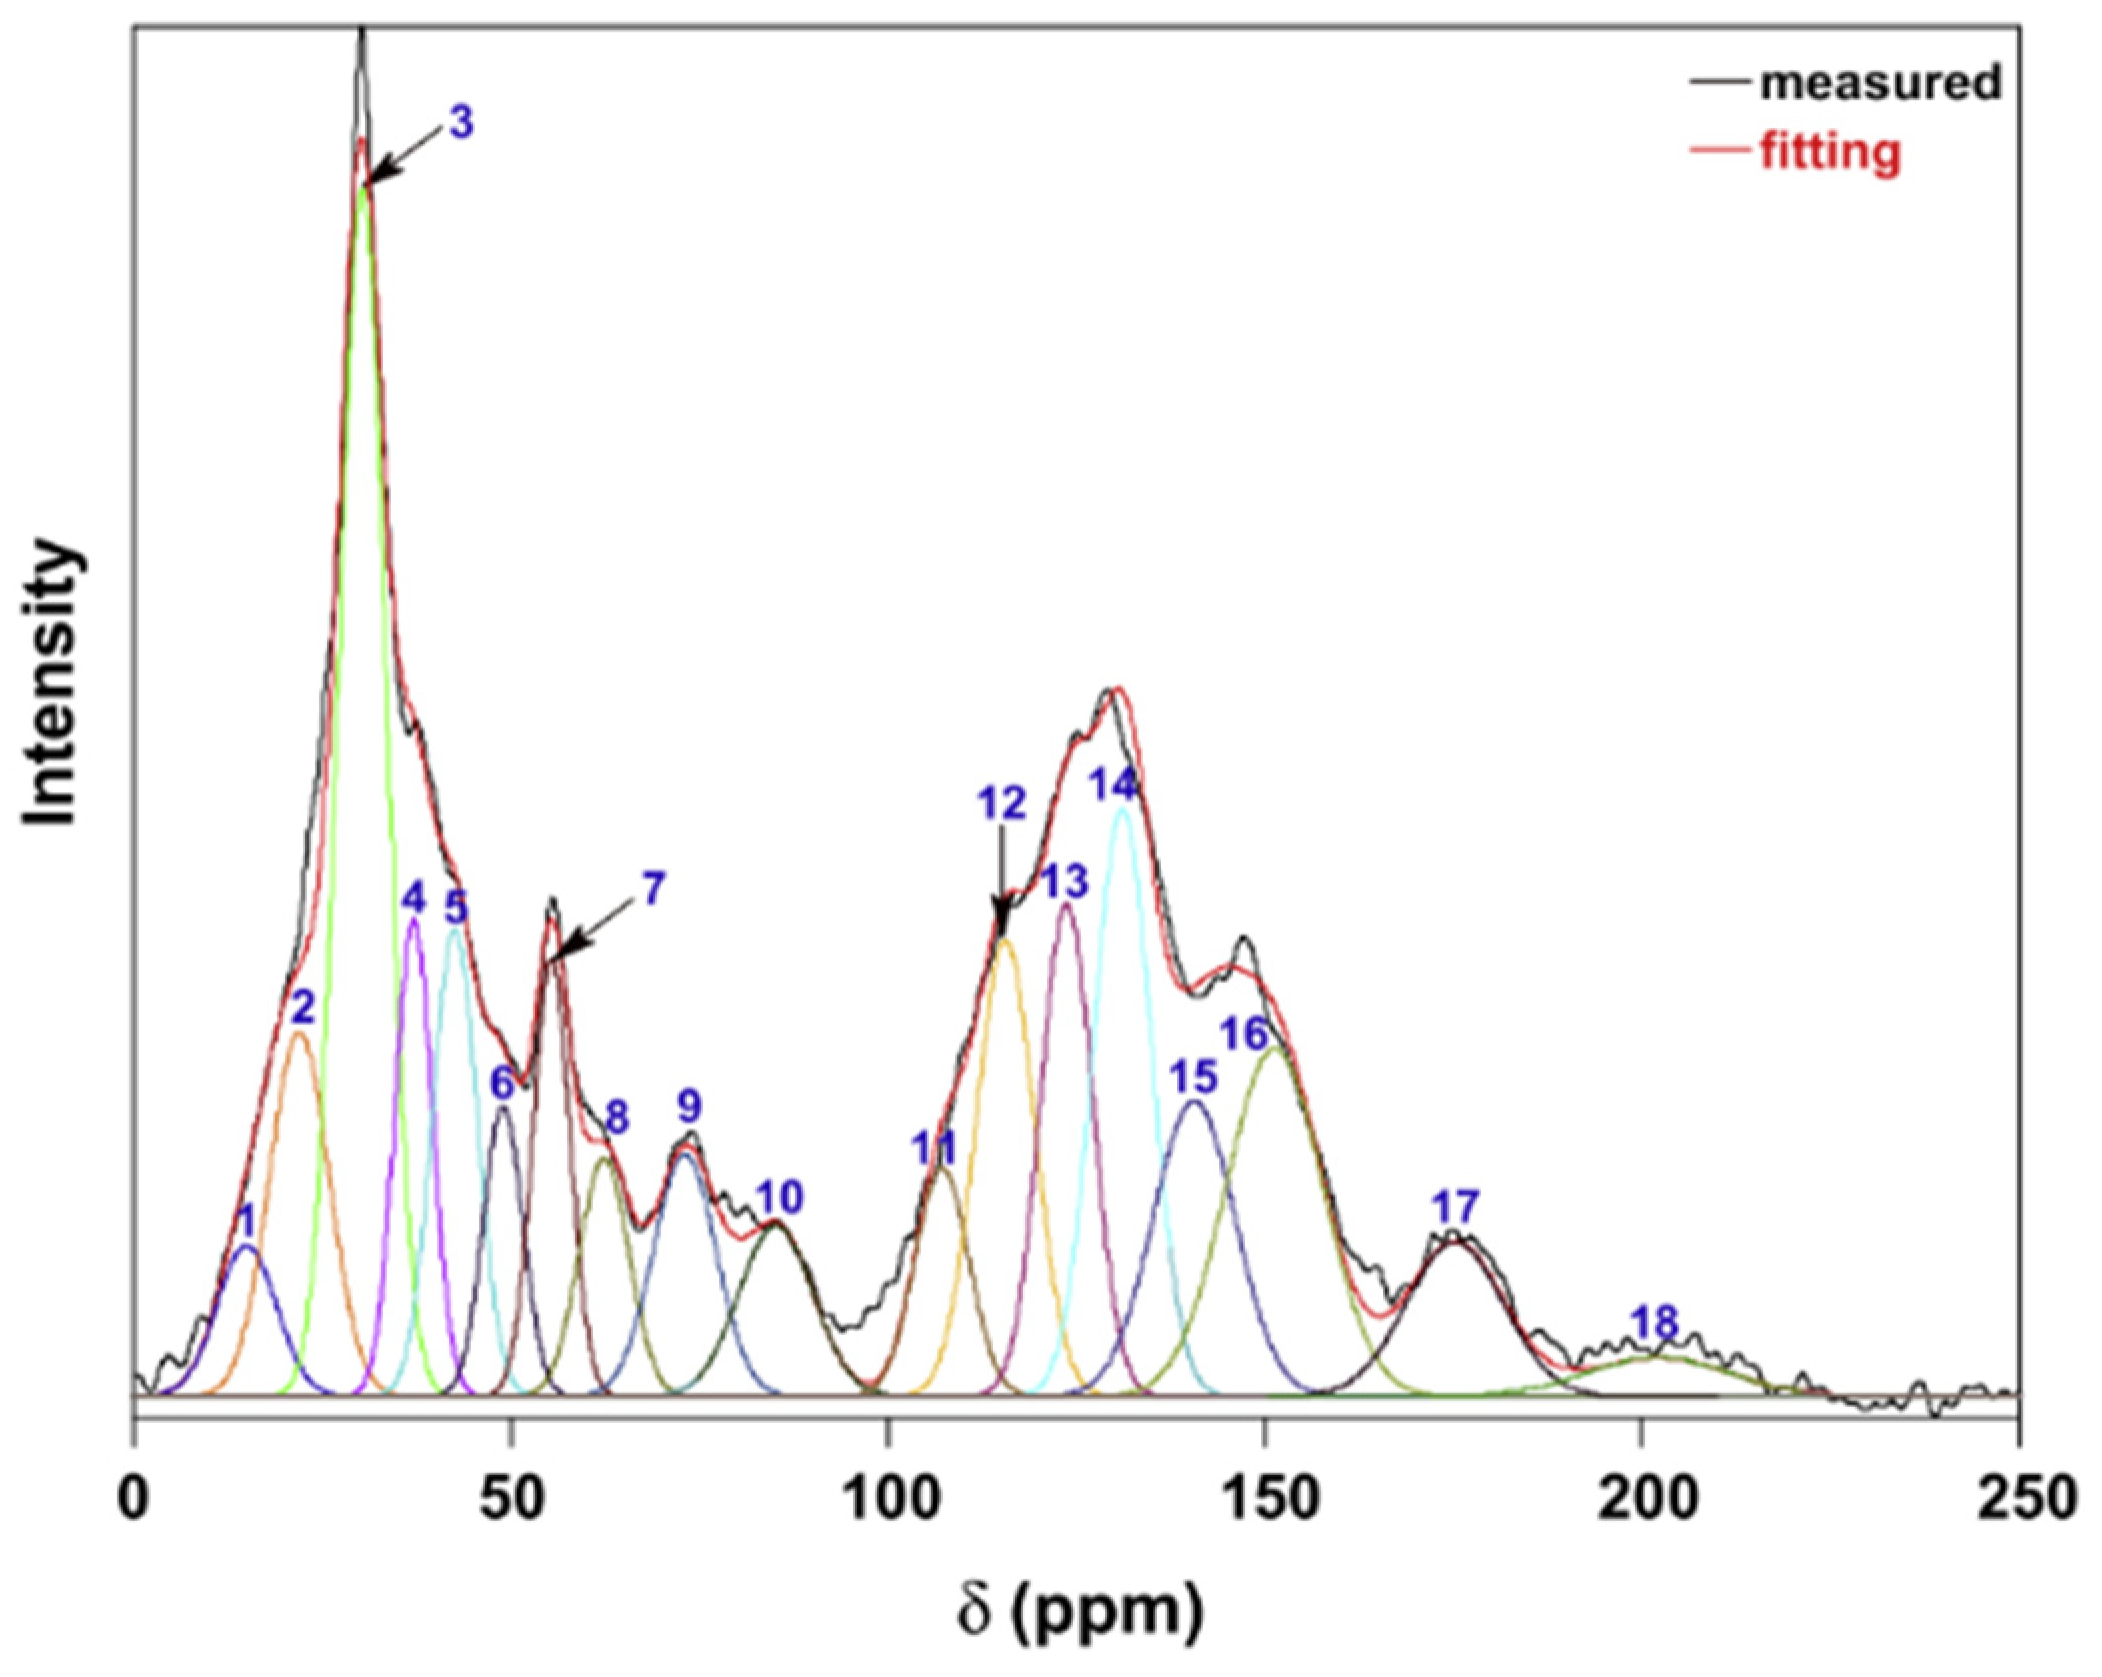
13C NMR is a direct and effective method to describe the carbon skeleton structure and functional groups of carbon material. The side chains and functional groups in the coke structure would decompose during the coking, where the assignments of different carbon types remain the same as coal structure. Li et al. [
68] studied the carbon skeleton of coal and divided the spectra into three chemical regions: aliphatic carbon (0–90 ppm), aromatic carbons (90–170 ppm), and carbonyl carbons (170–220 ppm). The proportion of structural units in the overall structure can be obtained by the peak fit.
Figure 6 shows a typical
13C NMR spectra of lignite coal. The chemical shift and molar content of different C types are summarized in
Table 5.
3.2. Physical Structure
Coke is a brittle material with a developed pore system composed of pore walls, pores, and cracks. During coking, the side chains on the aromatic core of coal continuously break off and decompose. Meanwhile, the aromatic core condenses and thickens to form a microcrystalline structure. Therefore, the basic unit of the coke pore wall is a microcrystallite structure [
40]. The pore structure is usually characterized by image, X-ray CT imaging, mercury intrusion, and N
2 gas adsorption methods. The microcrystallite structure is generally characterized by X-ray diffraction (XRD), high-resolution transmission electron microscopy (TEM/HRTEM), and Raman spectroscopy.
3.2.1. Pore Structure
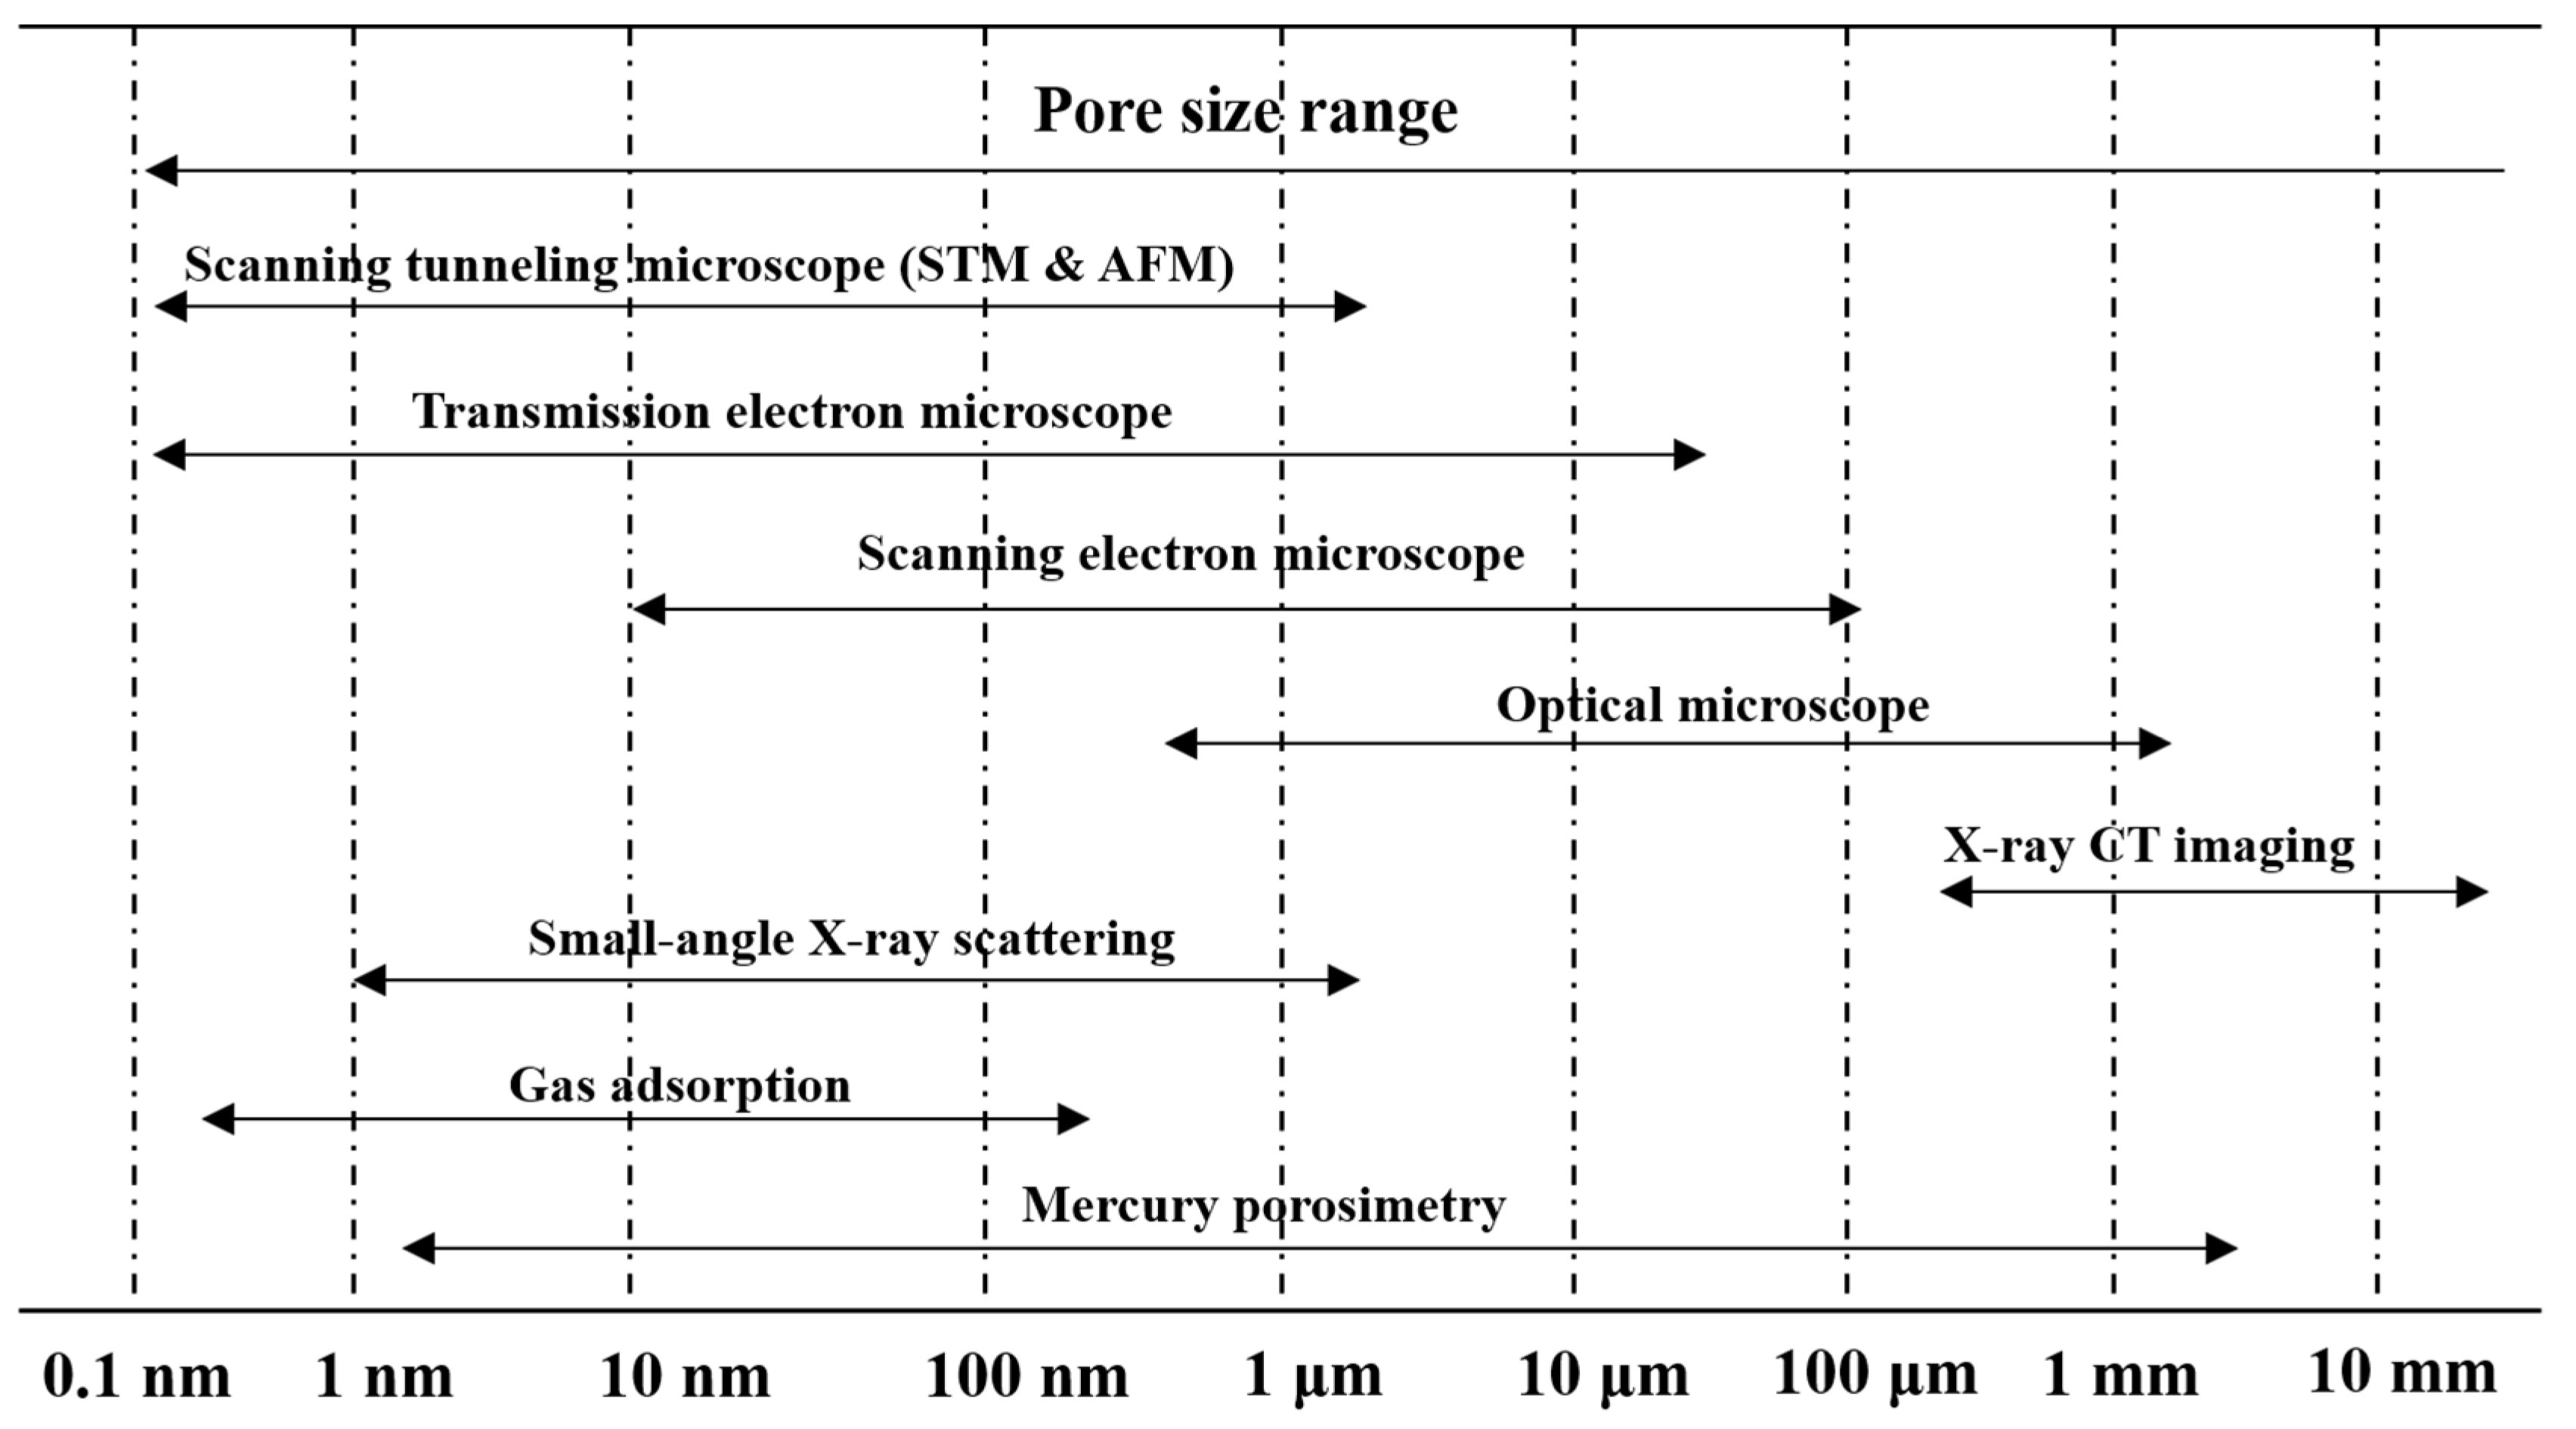
Pores in solid materials have been identified by different techniques, mainly depending on their sizes. The methods for the identification of pores are summarized in
Figure 7. The pores in the coke are generally in an extensive size range. Large pores on the surface of a coke can be observed using the microscope image method [
69,
70] and X-ray CT imaging technique [
71,
72,
73]. X-ray CT imaging is a non-destructive detection method. However, due to the relatively low resolution, the microscope image method is still required for further analysis of pore structure. For micropores and mesopores, nitrogen adsorption and mercury intrusion methods are used to analyze the specific area and pore size distribution. The pore structures of coke on multiscale can be characterized comprehensively through the above methods.
Microscope Image Method
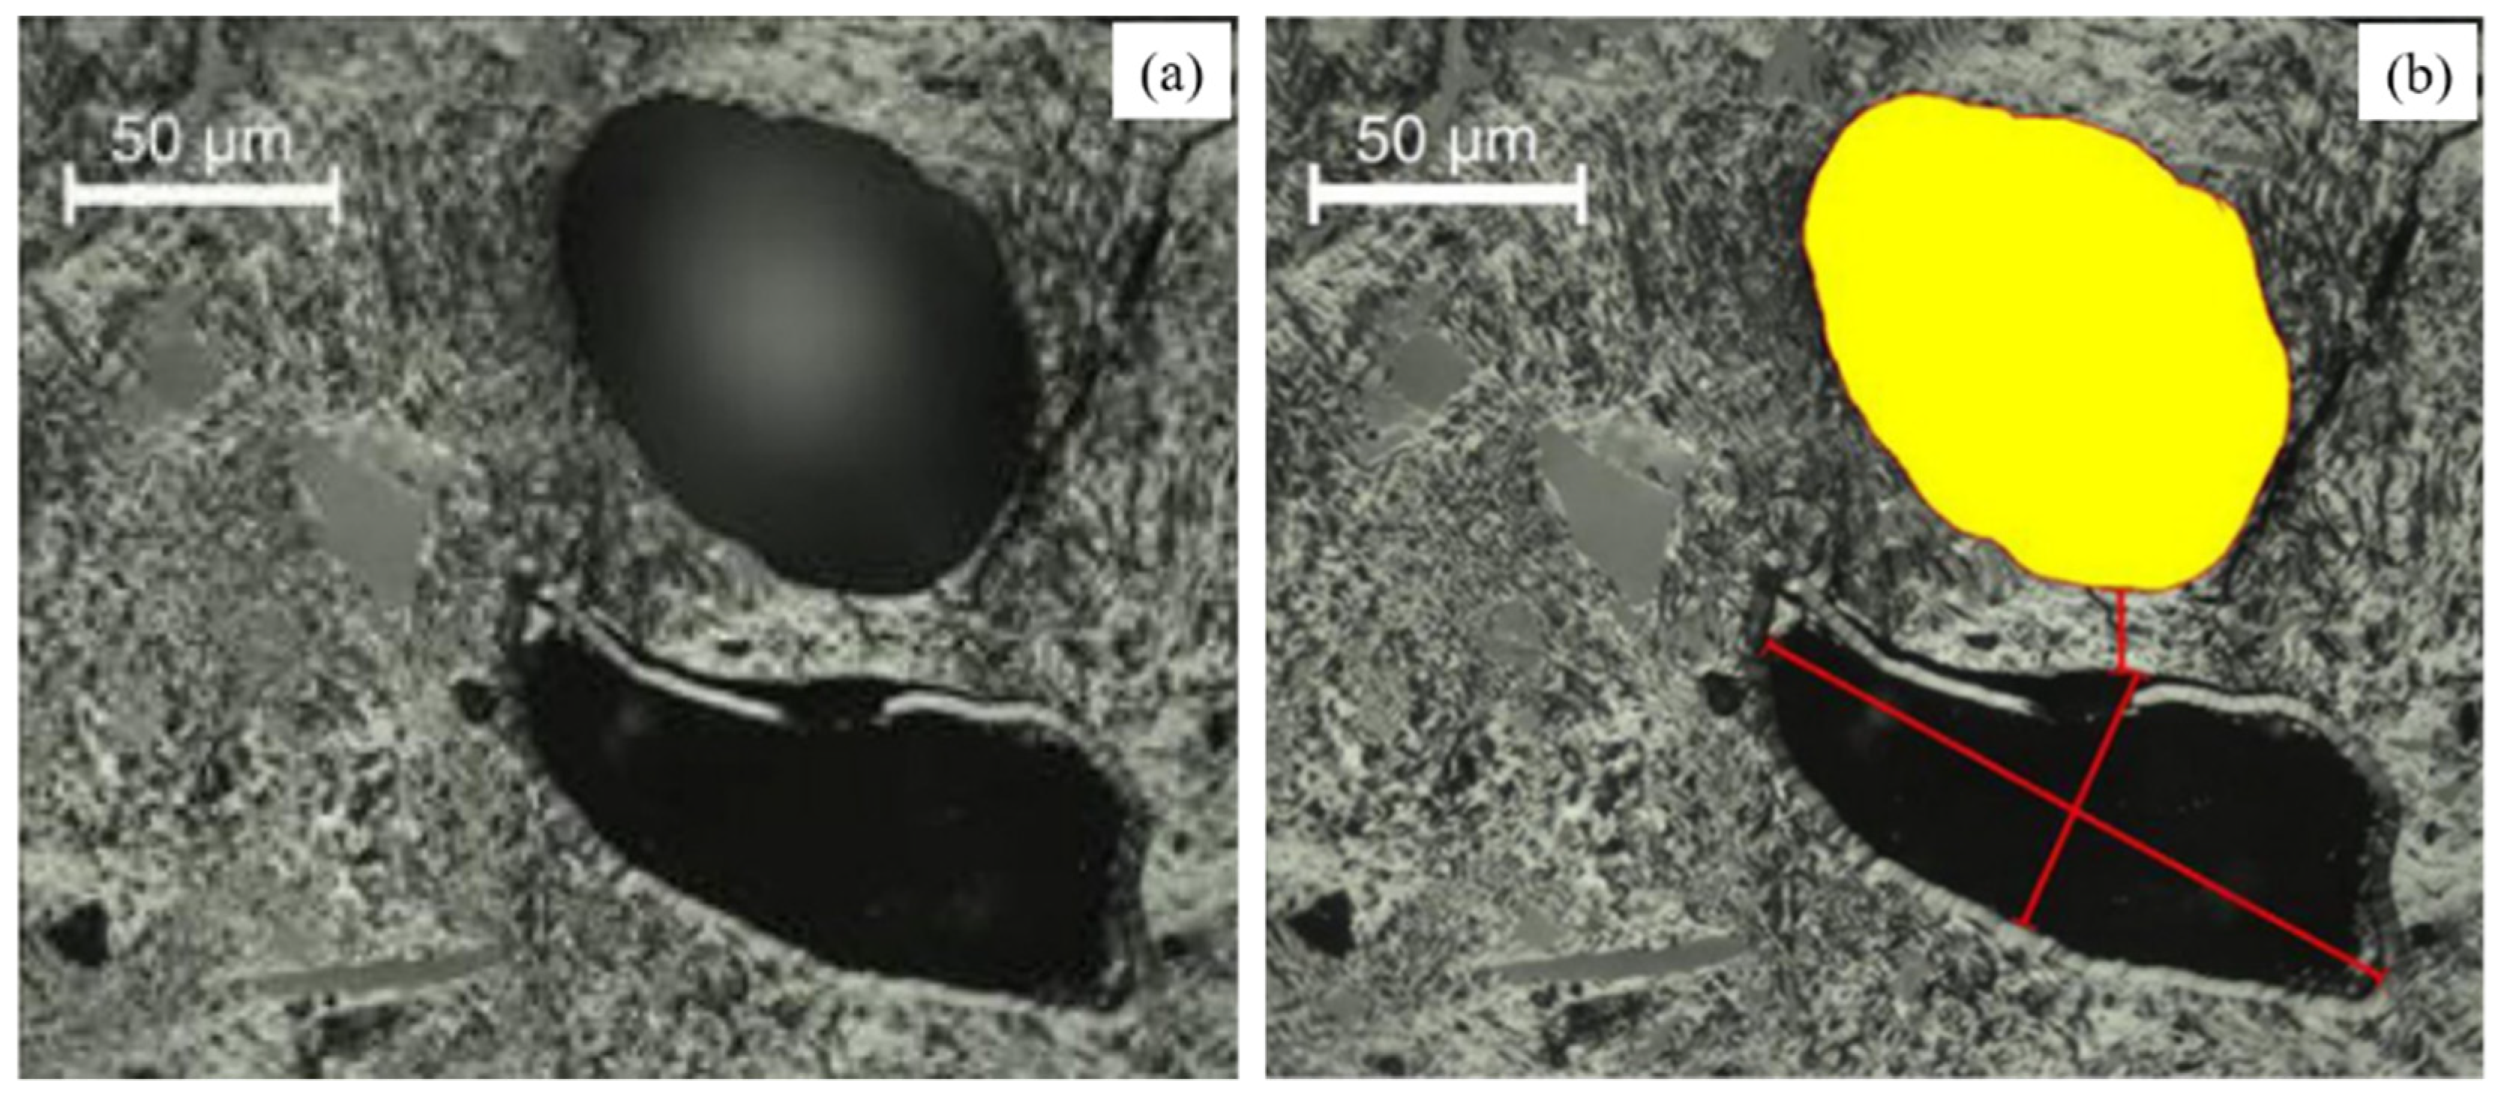
Nyathi et al. [
69] analyzed the pore structure in different sizes of coke by optical microscope. One hundred images were taken systematically for each sample. The image processing program can obtain the pore parameters, such as pore area, pore wall thickness, and pore diameter.
Figure 8 shows an example of how to determine these pore parameters. The pore parameters of coke with different sizes are shown in
Table 6. The pore wall thickness is the width of the carbon skeleton (<50 μm) between two pores. The particle size of the coke shows a minor influence on the determination of porosity via the microscope image method. Generally, the porosity and mean pore area increase with the coke size. At the same time, the mean thickness of the pore wall shows the opposite trend.
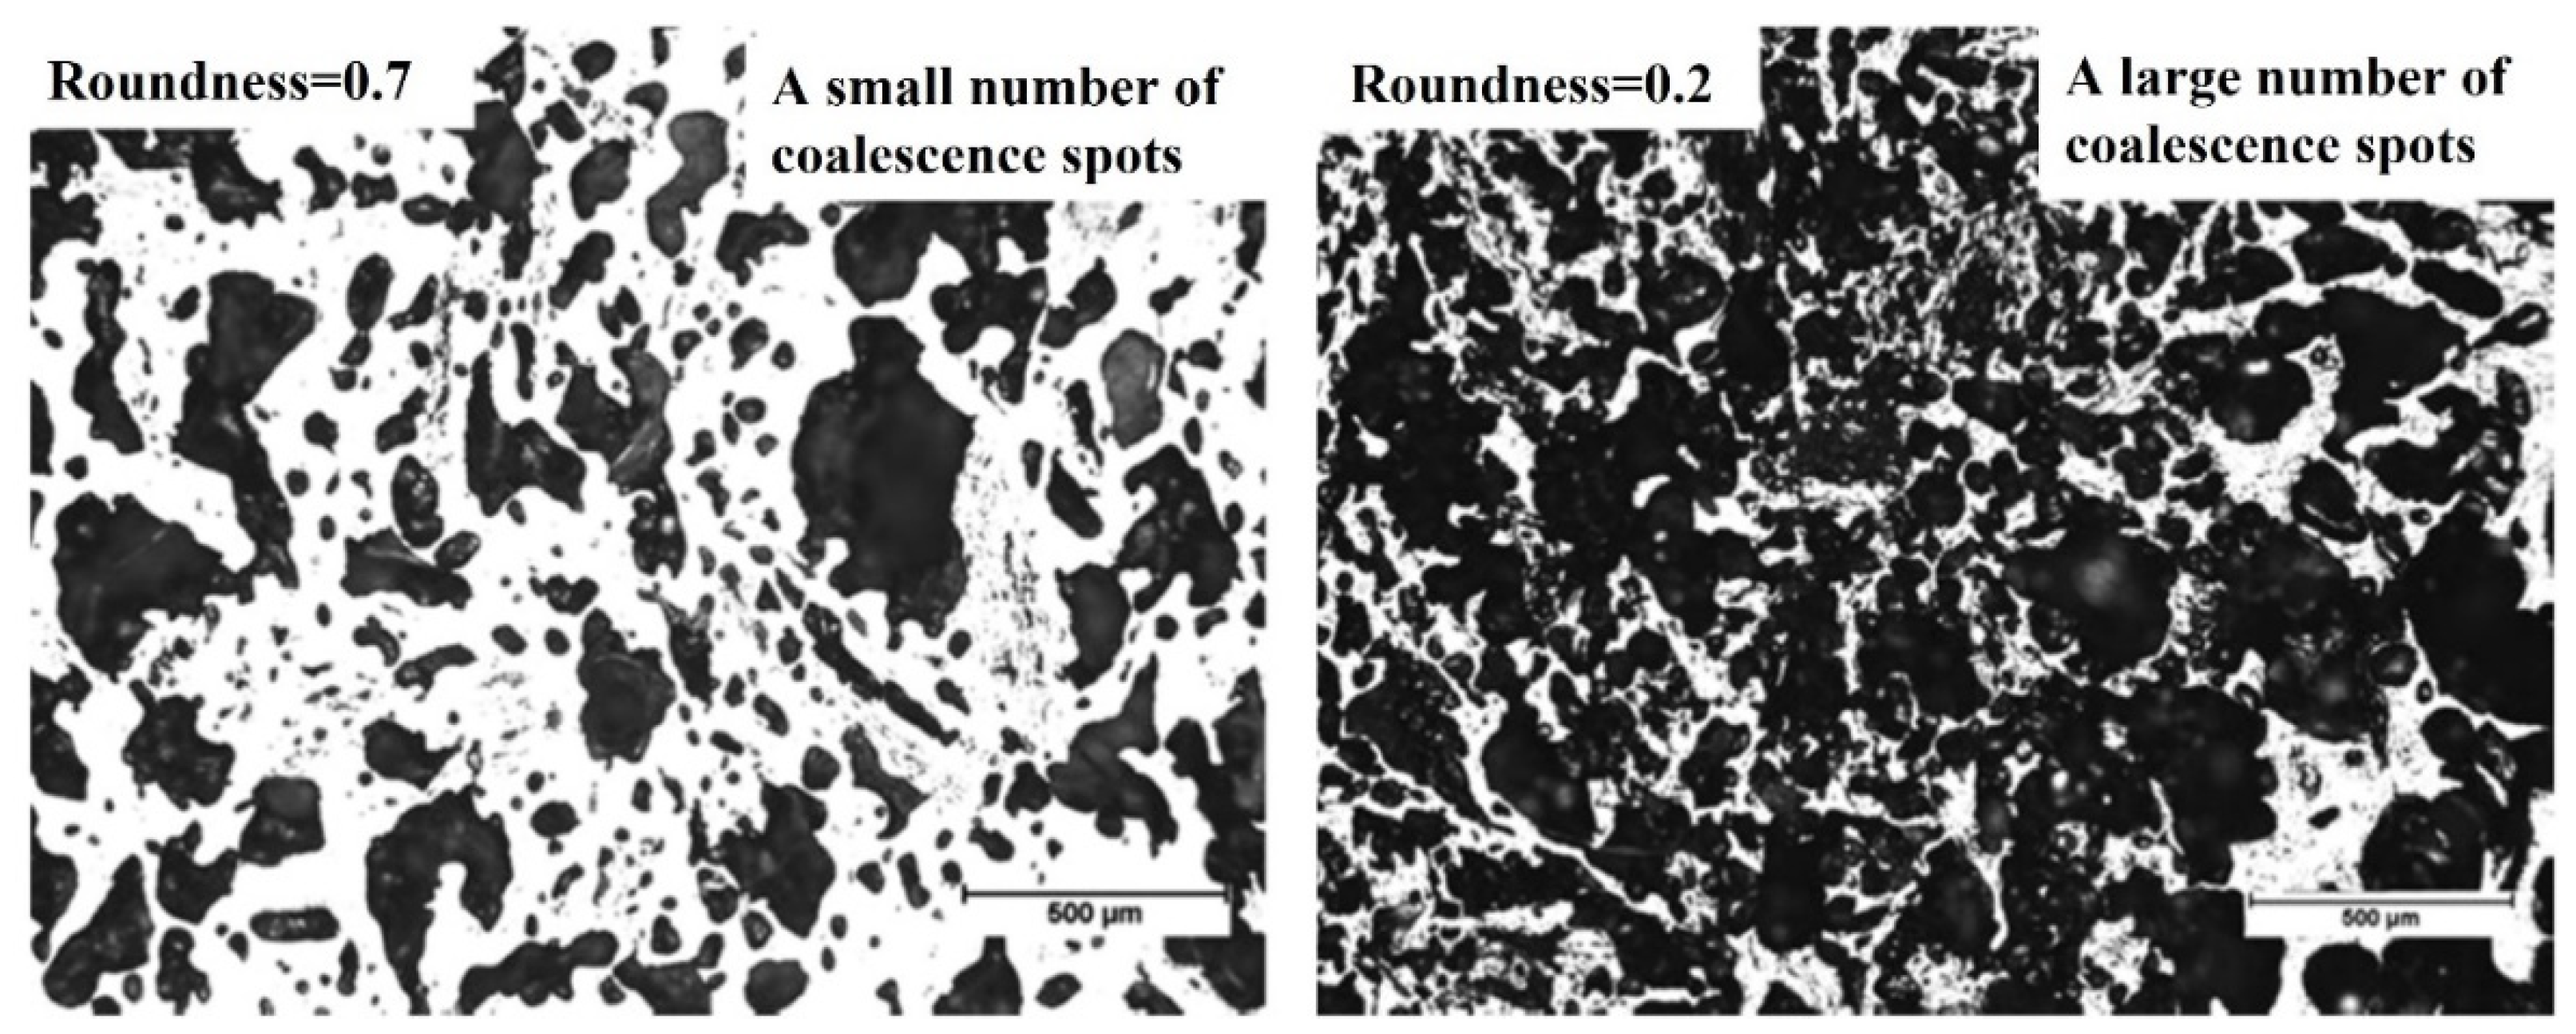
Kubota et al. [
74] and Xing et al. [
70] defined a shape factor of the pore by roundness (R), as shown in Equation (1). The smaller the R-value, the more complicated the shape of pores. When R equals 1, it represents the pore shape is a circle. The pores with regular shape and larger roundness can resist more vital external breaks. It can be seen from
Figure 9 that the pores with a roundness of 0.2 are more irregular in two-dimensional than those with a roundness of 0.7. The change of roundness is accompanied by the evolution of pore structures, such as the merge of pores and the collapse of the pore walls.
where S and L are the areas and the circumference of a pore. Generally, coke with higher pore roundness and larger pore wall thickness shows higher cold drum strength and hot strength (CSR) [
69,
74,
75].
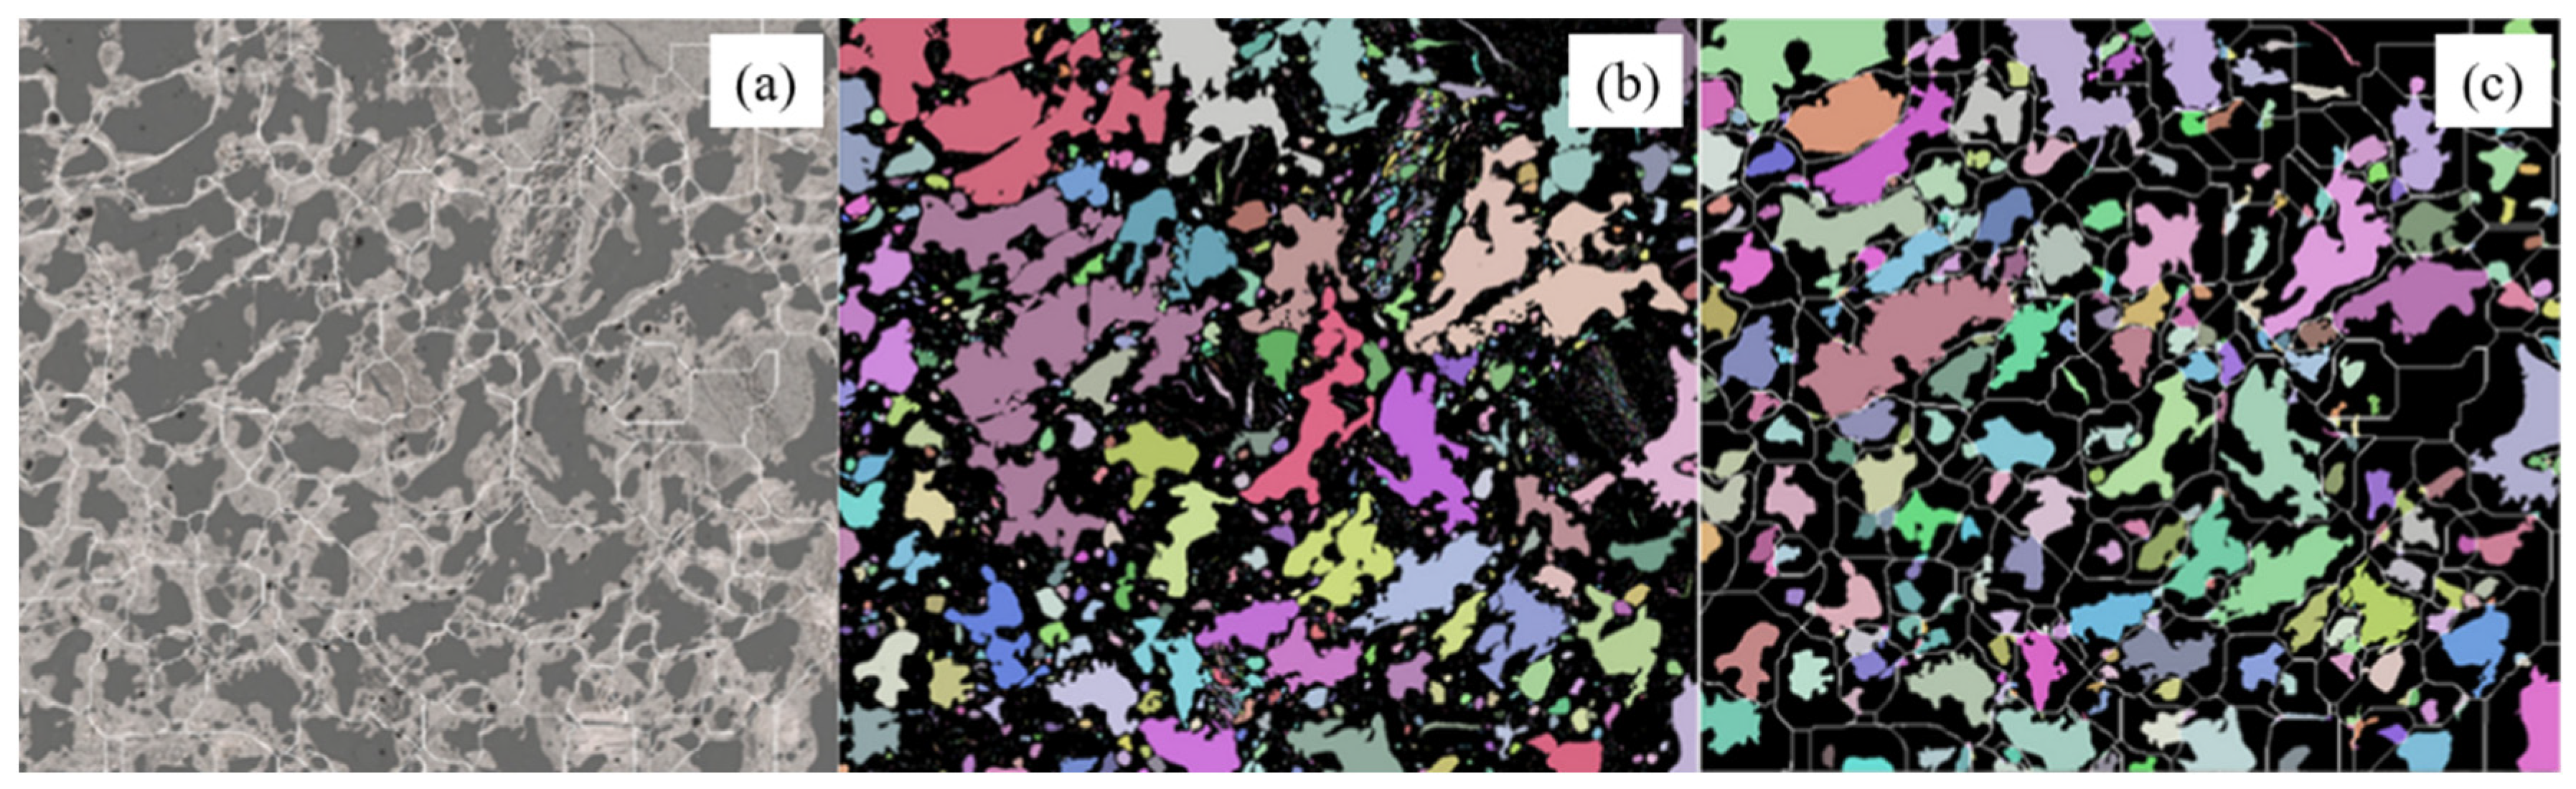
With the improvement of technology, the image method has been continuously enriched. To overcome the deviation of statistical results caused by manual intervention, many scholars [
76,
77] realized the automation image analysis of coke images.
Figure 10 shows the automatic segmentation process of coke pores [
78]. First, the separation lines were automatically generated based on pores. Then different pores were randomly colored, and some noise data were removed to form the color map. At last, it became easier to obtain the pore parameters of pores.
X-ray CT Imaging
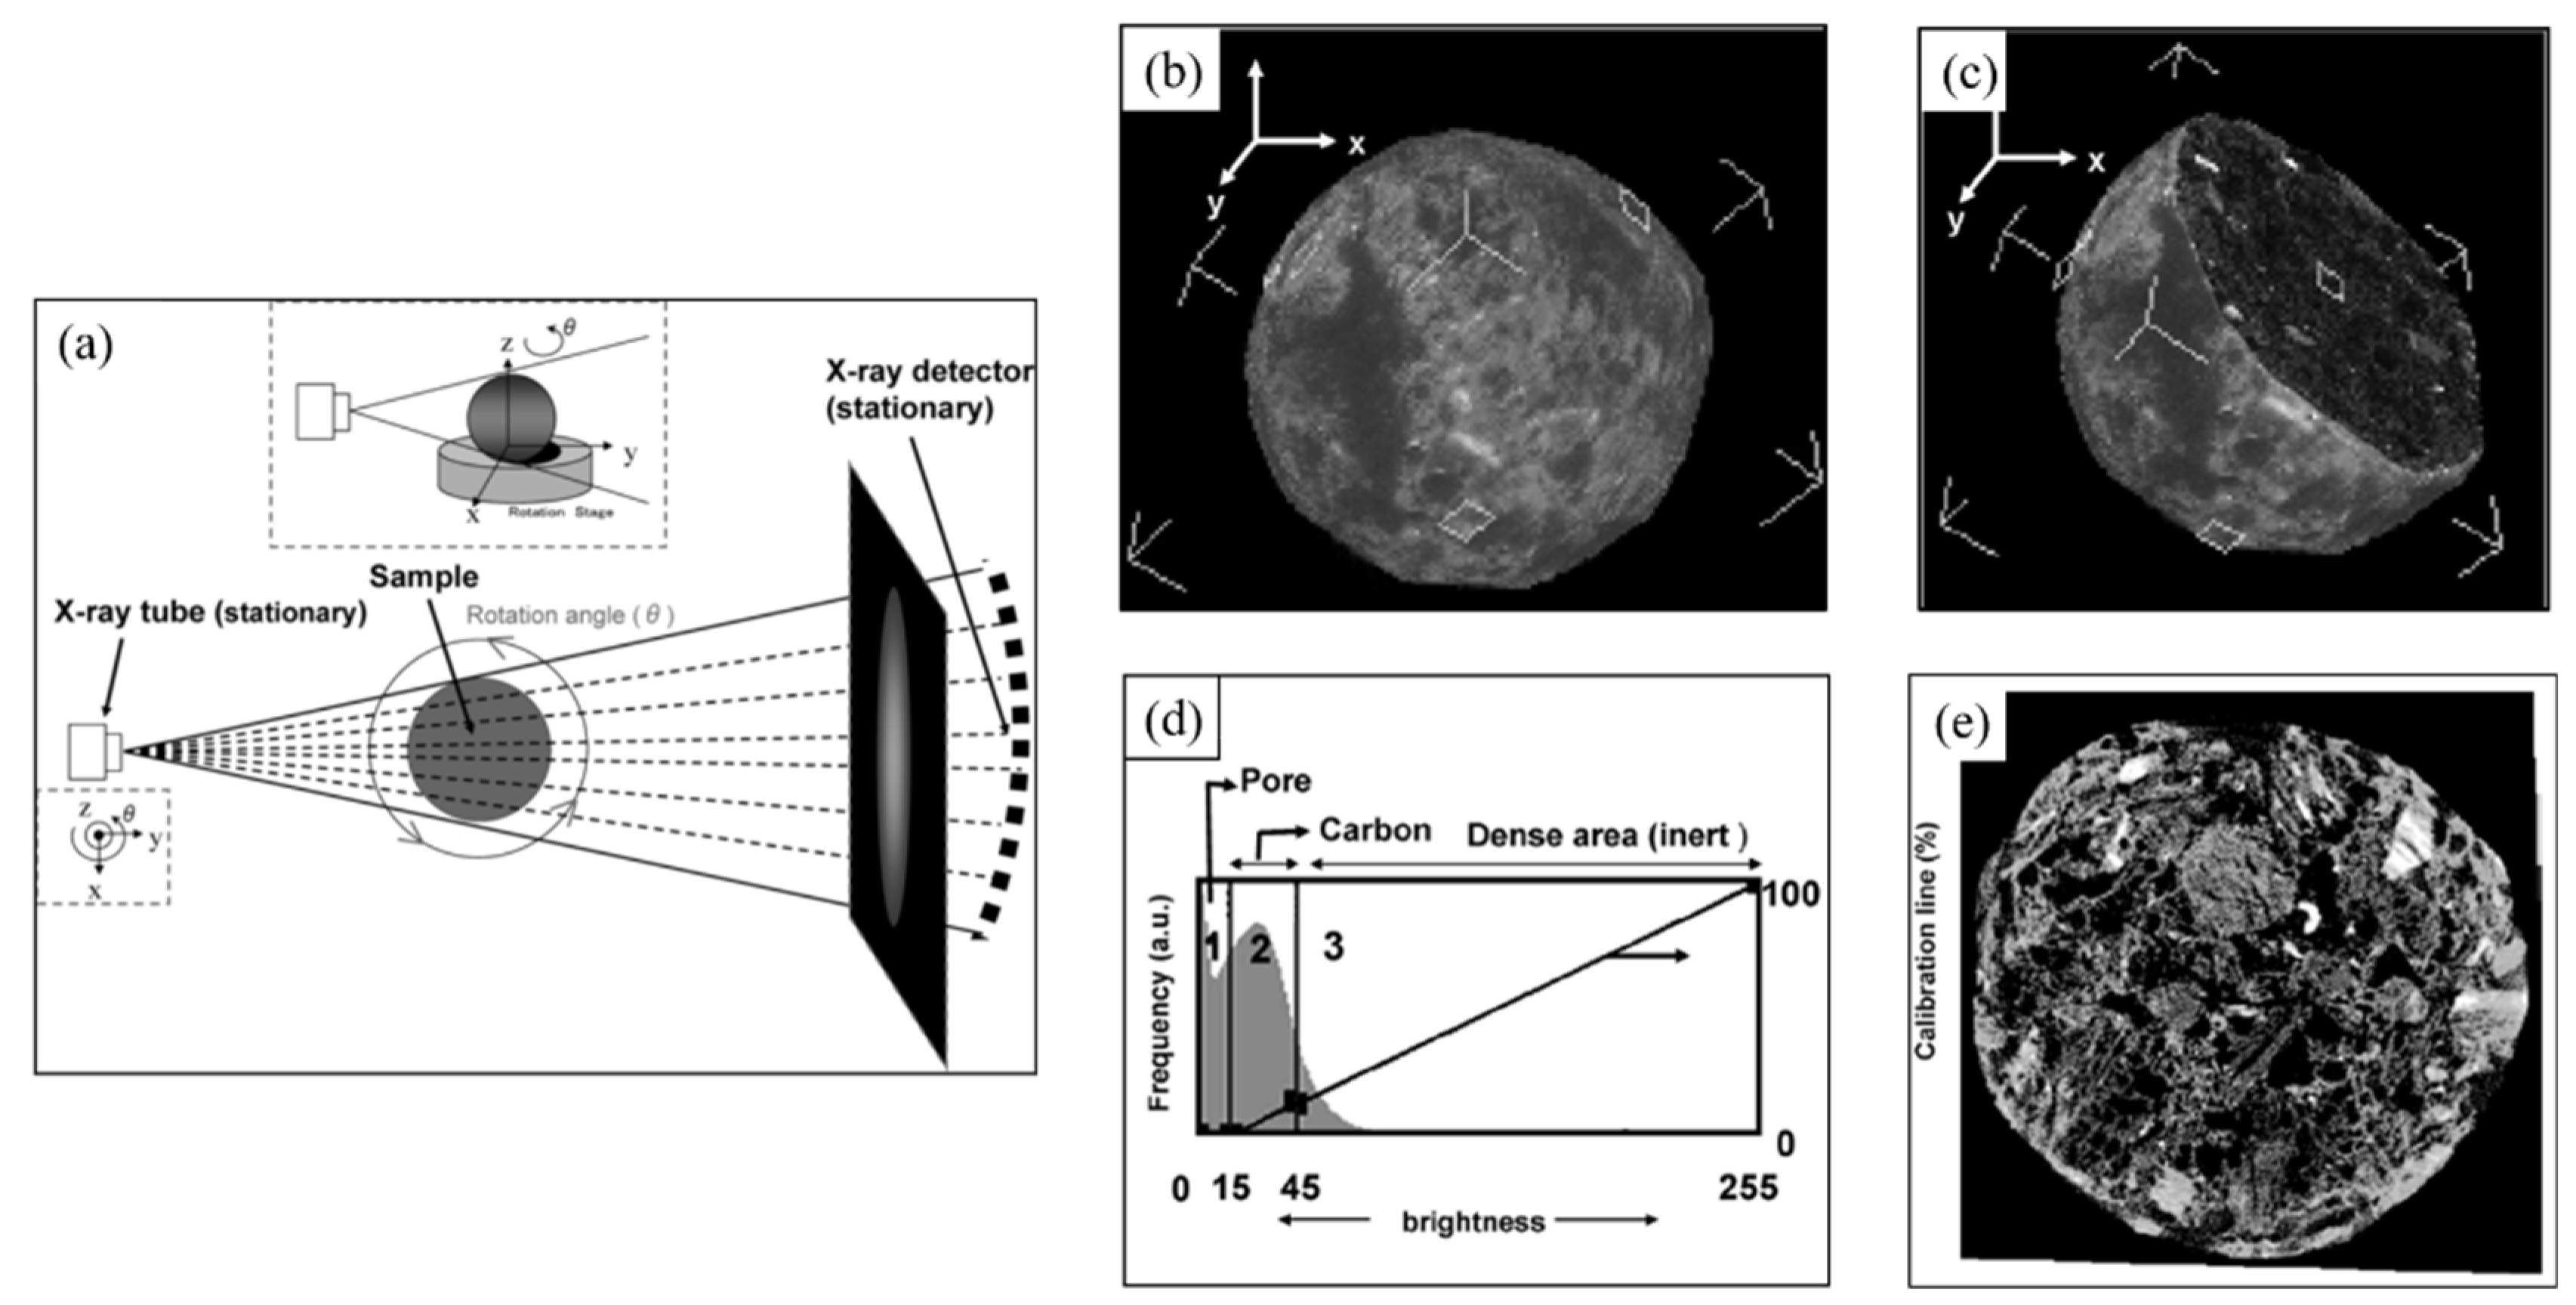
Most of the coke samples need to be crushed, grounded, and polished for the image analysis method. The sample preparation process inevitably causes damage to the coke pore structure. Yuichiro et al. [
79] used X-ray CT imaging technology, as shown in
Figure 11a, to carry out non-destructive observation statistics on the 3D structure and porosity of coke. According to the density difference between coke matrix and pores, the coke 3D scanning diagram, as shown in
Figure 11b–e, can be obtained, making it possible to observe the distribution and connection of coke pores in 3D space.
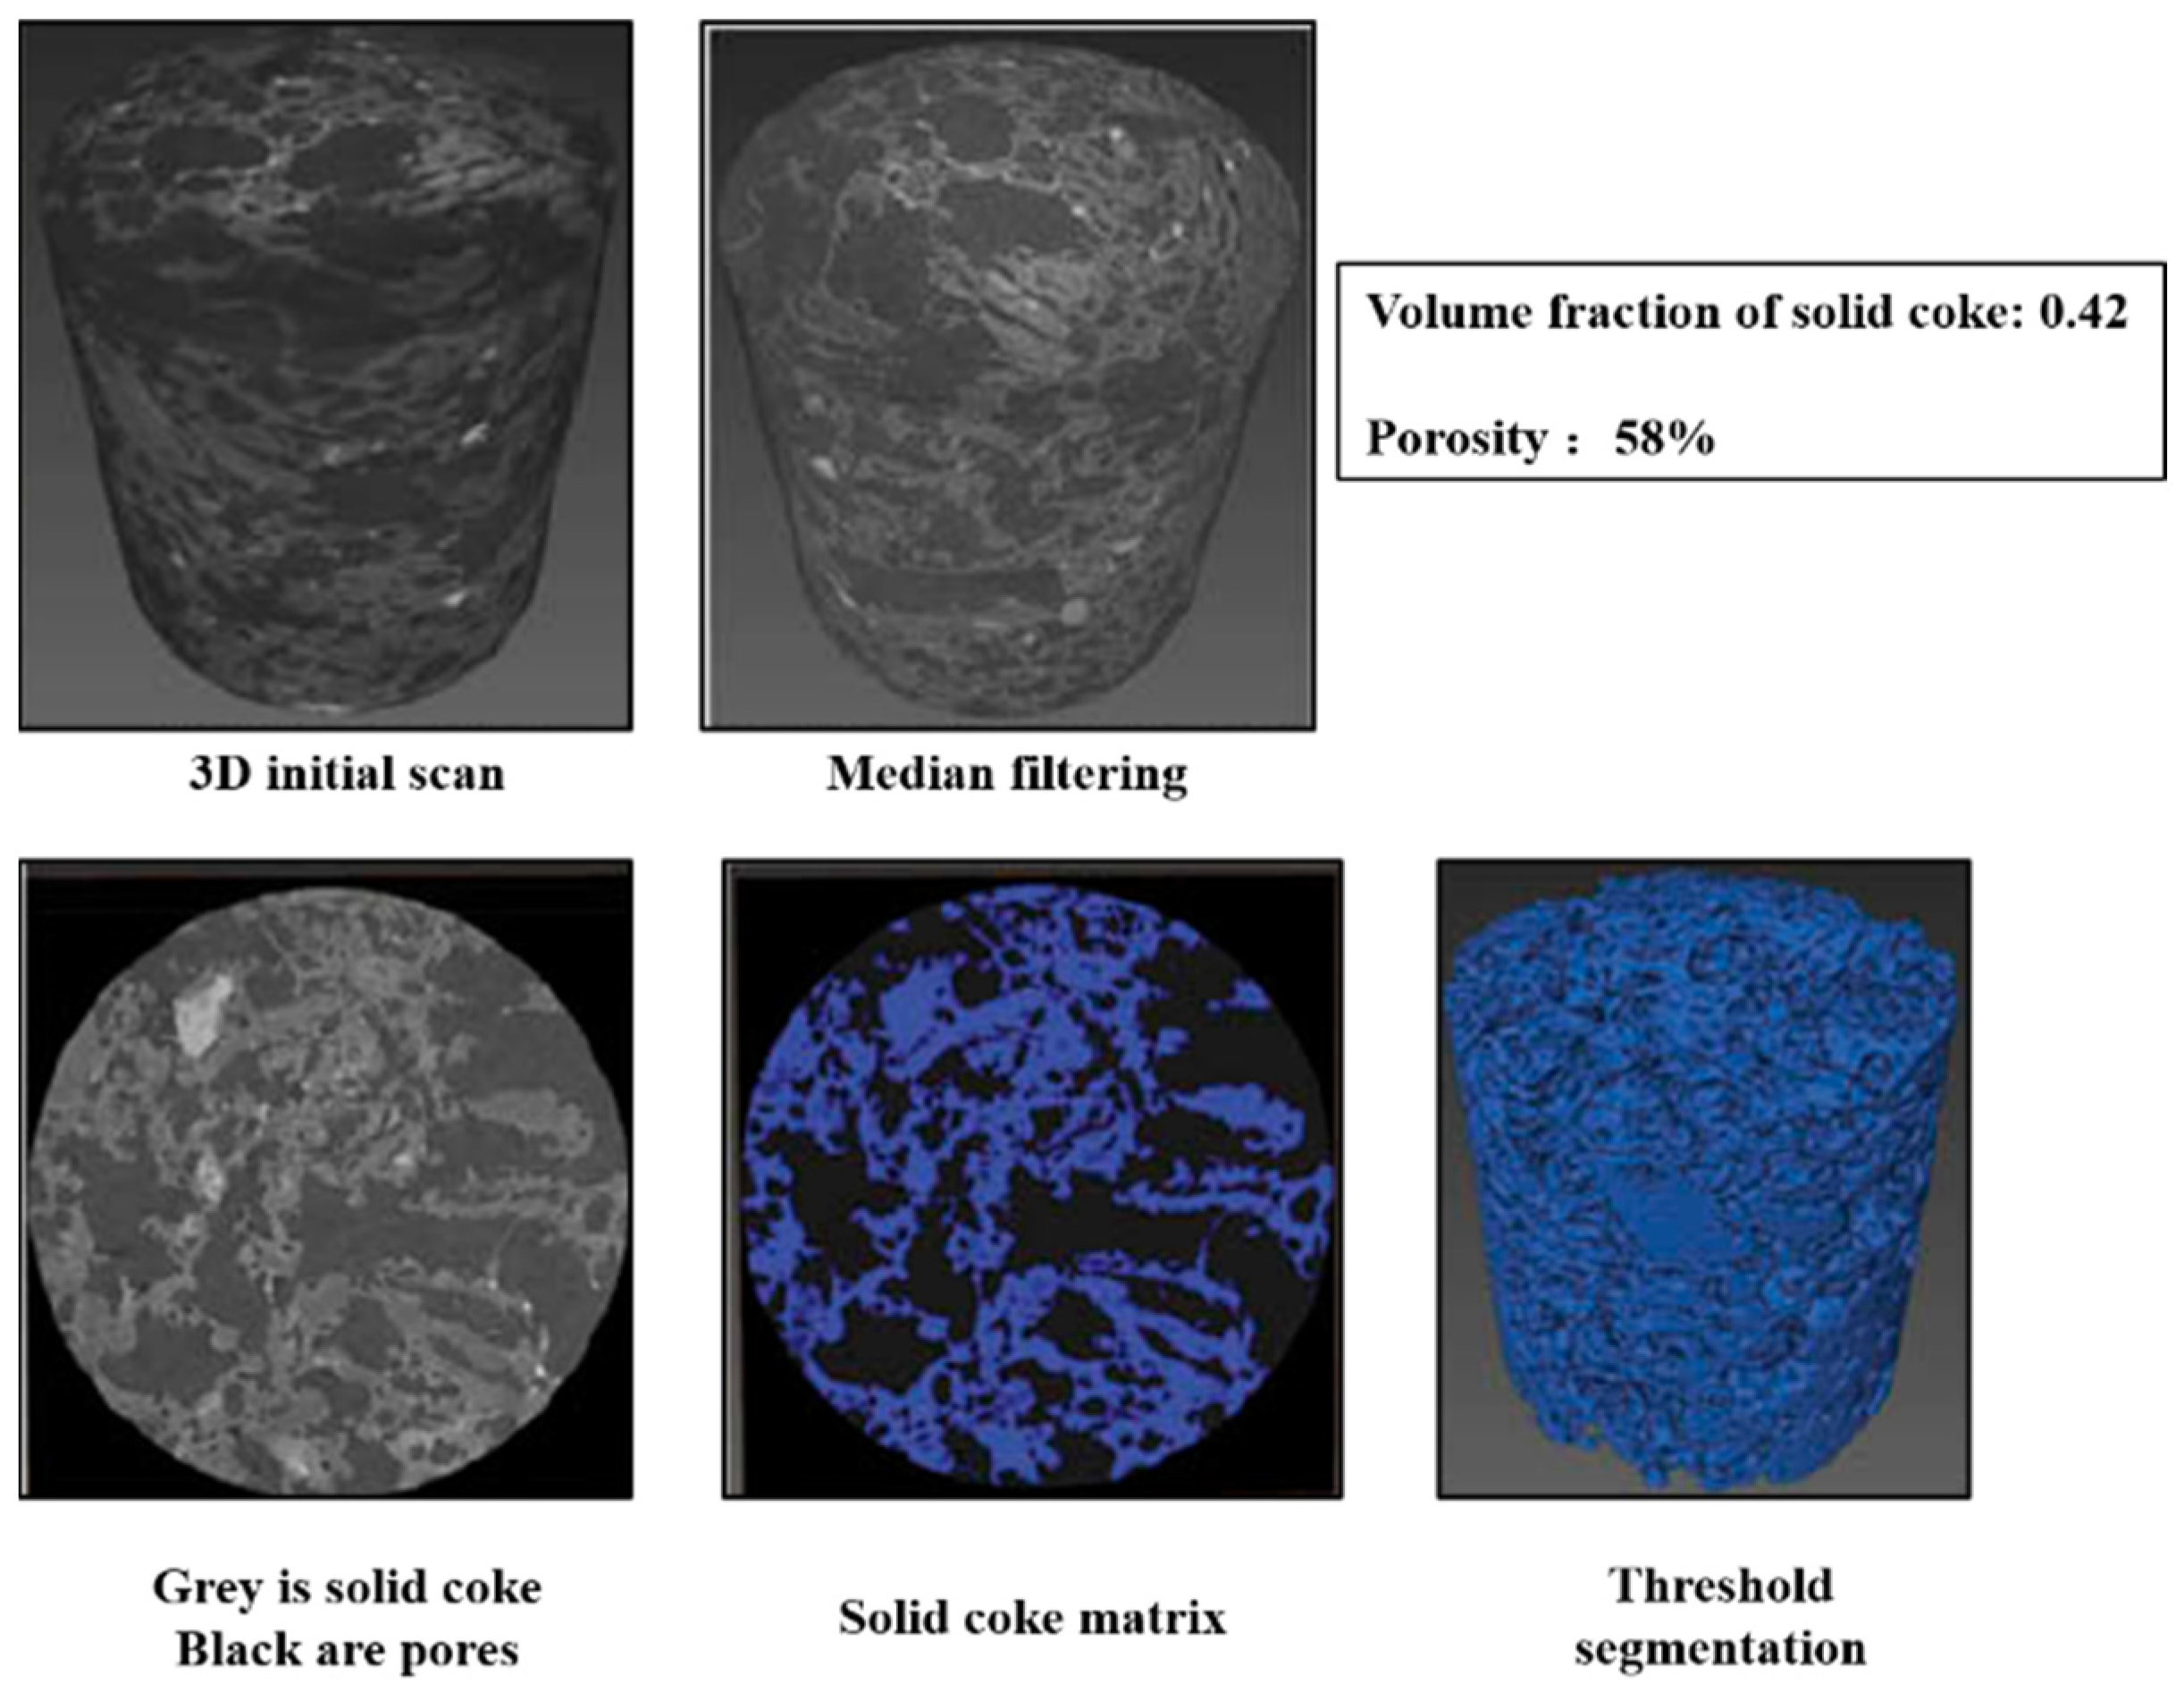
Ghosh et al. [
80] used X-ray CT imaging technology to visualize coke pore distribution in 3D space through threshold segmentation, as shown in
Figure 12. The size information of coke pore structures can be calculated by the corresponding relationship between image pixels and actual size. X-ray CT imaging technology is based on the different densities of different materials in the tested sample and then shows different gray levels in the image; therefore, it is an effective method for analyzing coke pore structure. It should be pointed out that the optical texture of coke cannot be distinguished by this method [
81].
Mercury Intrusion and Nitrogen Gas Adsorption Methods
PThe above two methods are limited to the analysis of macropores. For pores in nanoscale, mercury intrusion and nitrogen gas adsorption methods are good options. The mercury intrusion method has the advantage of measuring pores with a wide size range (5 nm–5 mm). However, due to the high toxicity of mercury, mercury intrusion is not widely used. The nitrogen gas adsorption method is used for determining the micropore distributions and specific surface area of coke. According to the nitrogen gas adsorption method, the sample is placed in liquid nitrogen after degassing treatment. The relation between pressures and the adsorption amount of nitrogen can be obtained. Through the nitrogen adsorption–desorption isotherms, the parameters of pores can be determined. Furthermore, the pore size distribution, the pore volume, and the surface area of the coke can be calculated.
3.2.2. Microcrystallite Structure
The microcrystallite structure of coke is typically characterized by X-ray diffraction (XRD). The average size of coke crystallite can be calculated based on the XRD pattern. In addition, high-resolution transmission electron microscopy (TEM/HRTEM) can directly observe the lattice fringe of the coke matrix and determine the ordering degree of coke. Raman spectroscopy can provide content of graphite crystalline (ordered carbon structure) in coke.
X-ray Diffraction (XRD)
XRD has been widely used to obtain the microcrystallite parameters of coke [
38,
82,
83]. SiO
2 and Al
2O
3 are the dominant inorganic minerals in the coke ash. If the contents of the inorganic minerals are not high, researchers usually ignore the relevant peaks in the XRD pattern. For a precise calculation of microcrystallite parameters, it is suggested to do demineralization treatment before a XRD test [
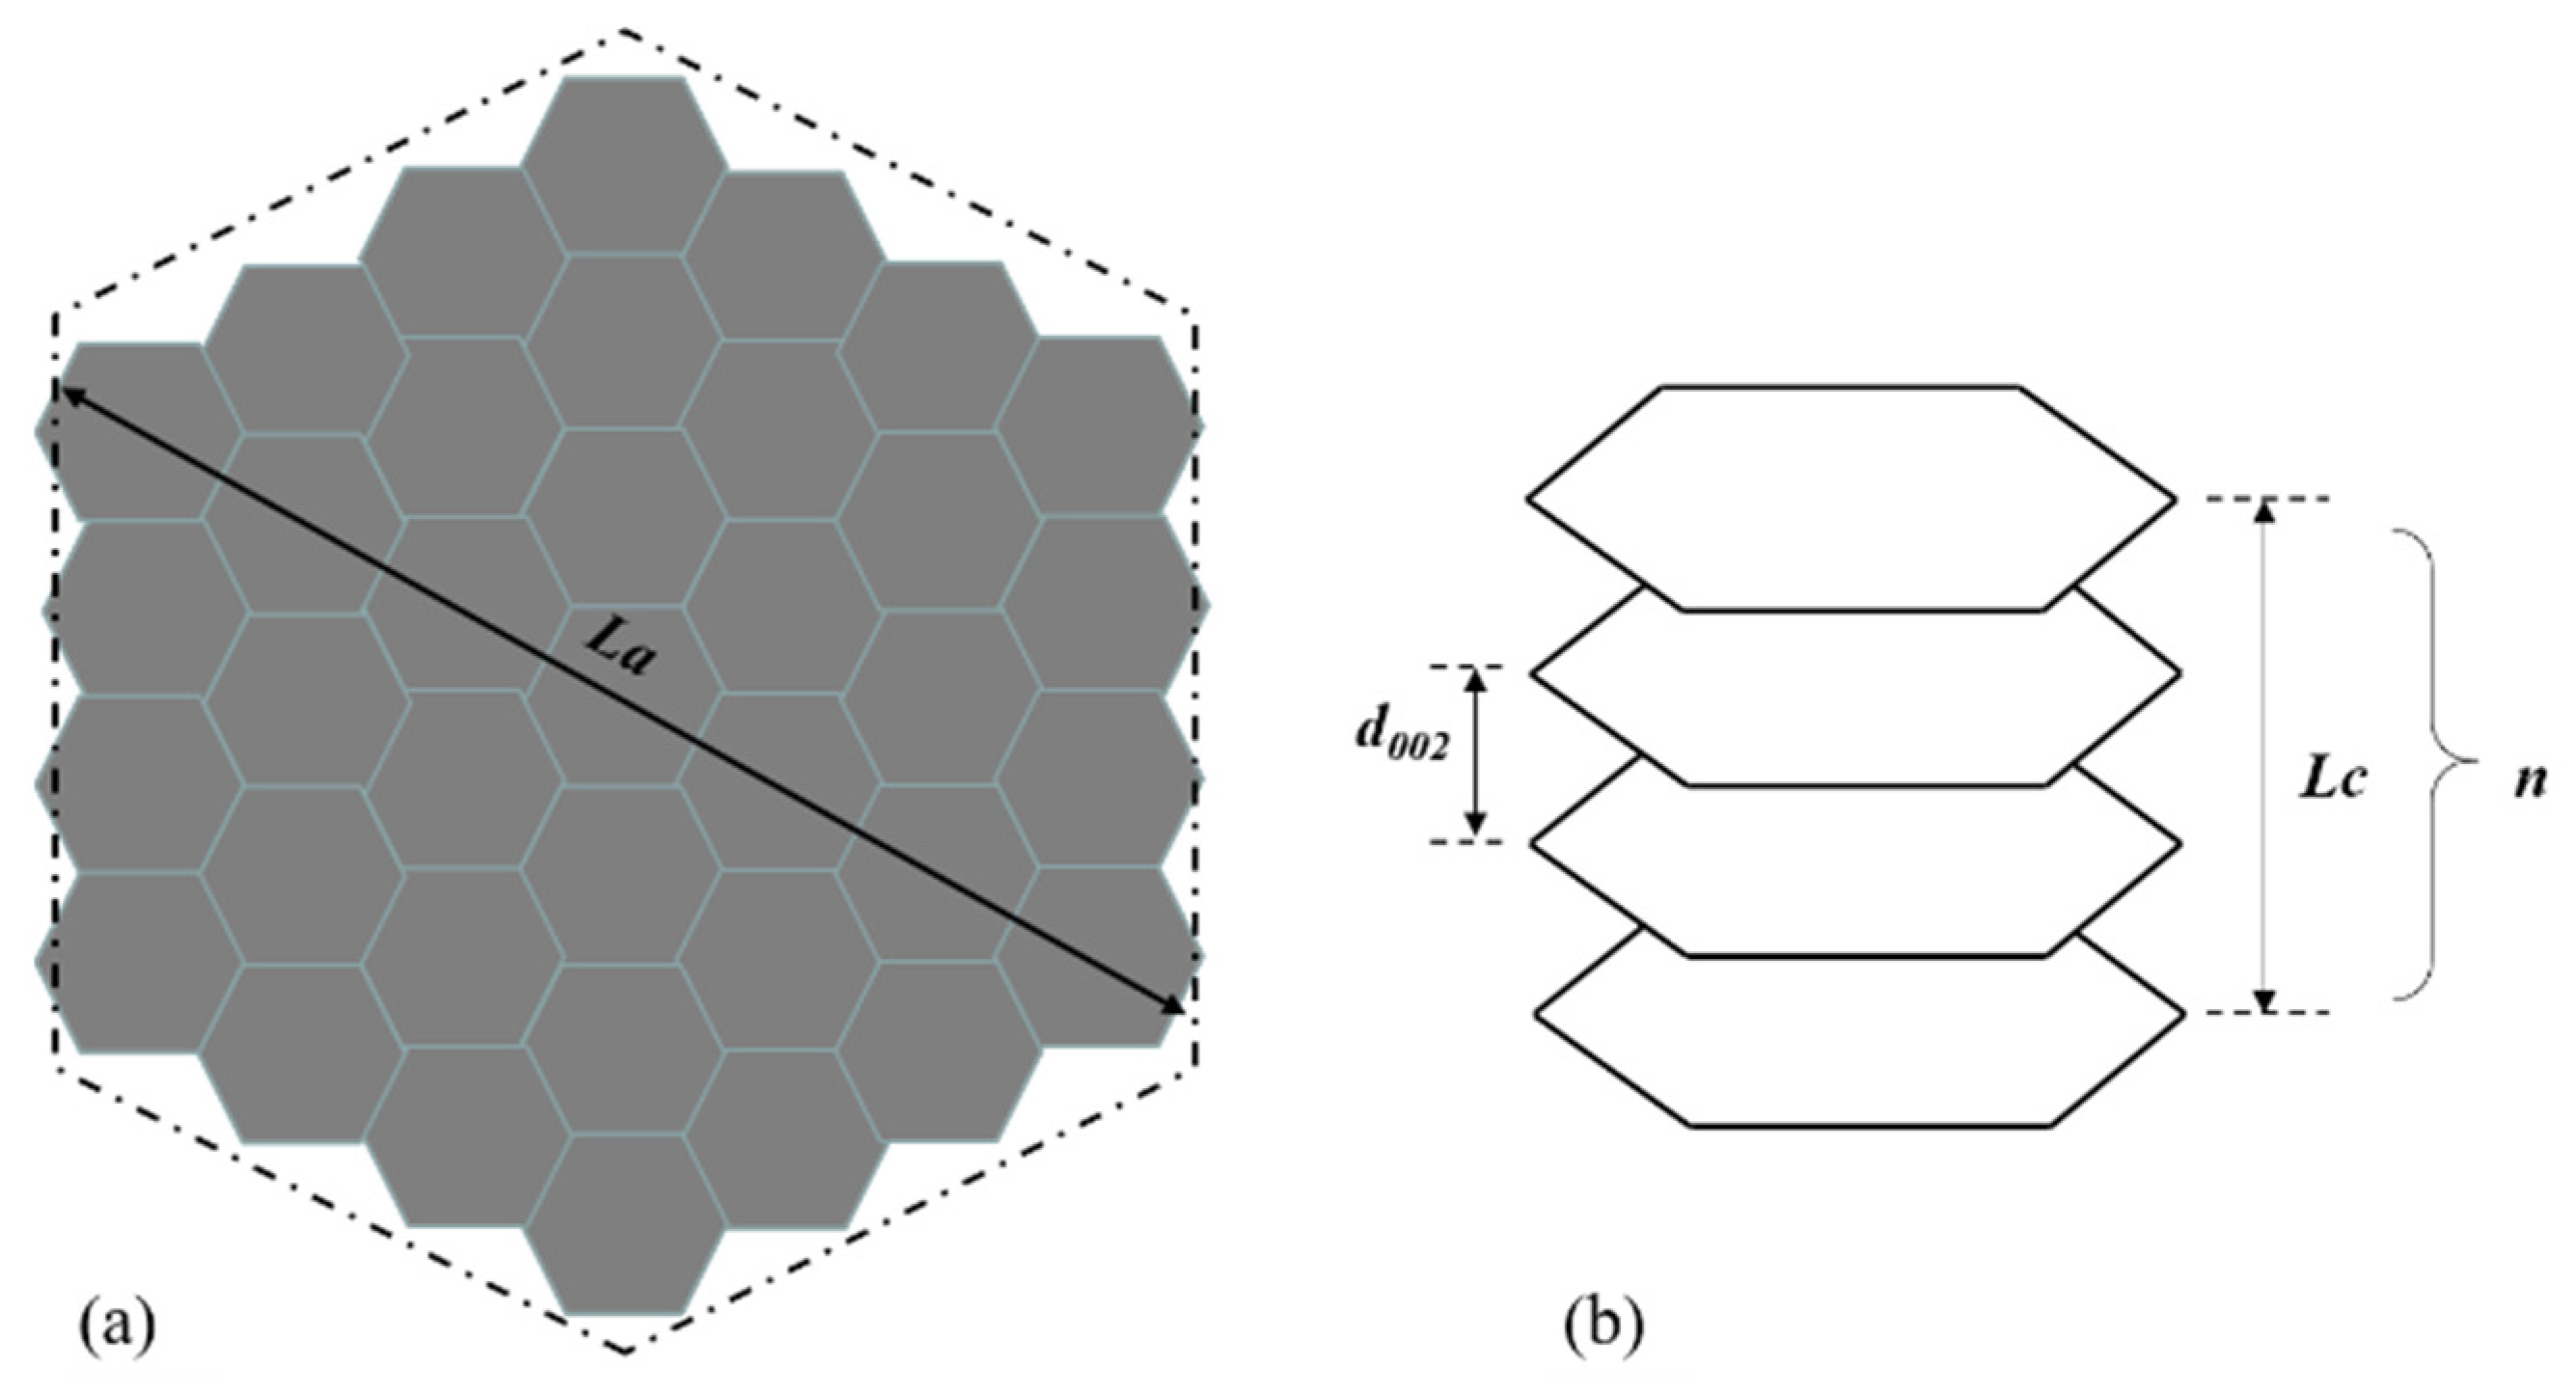
84]. Li et al. [
85] described the detailed procedure of the determination treatment by 6 vol% HCl and 40 wt% HF aqueous solution. As shown in
Figure 13, several parameters have been defined to quantitively interpret the microcrystallite structure: the average stacking height (Lc) of crystalline, the average size (La) of crystalline layer, and the average spacing (d
002) of crystalline [
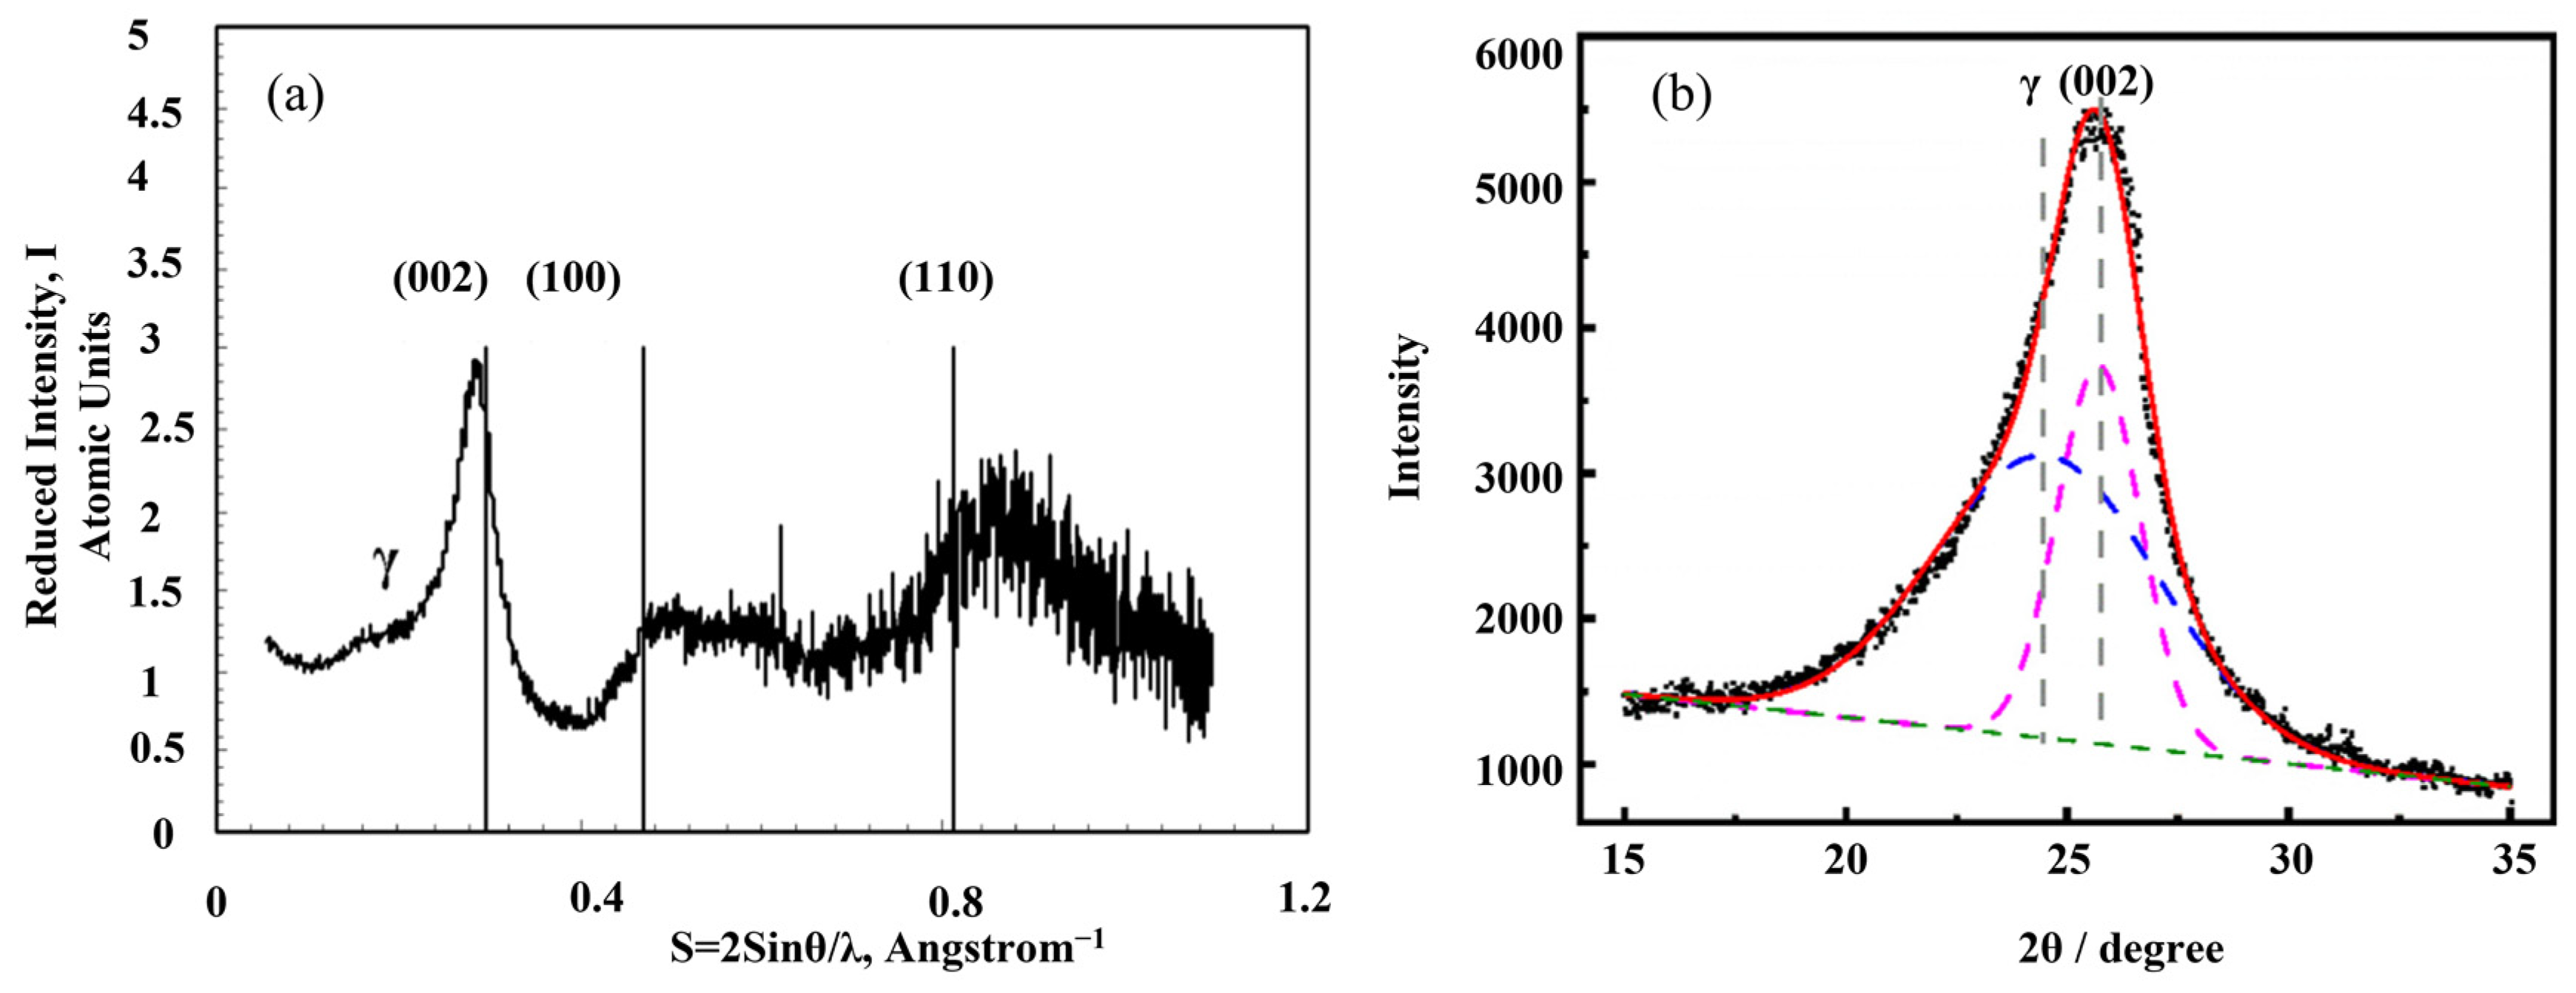
86]. The raw XRD pattern of carbon material, mainly coke, requires a data processing procedure to distinguish different interesting peaks. As shown in
Figure 14a, the typical XRD pattern of carbon material contains four bands, namely (002), (100), (110), and γ. It should be noted that the x coordinate in
Figure 14a is “2 sin θ/λ” instead of “2 θ”. Lu et al. [
87] also used 2 sin θ/λ as the x coordinate in the XRD patterns. There is no strict rule about the x coordinate, which largely depends on the habit of the researchers. From Equation (3), the “2 sin θ/λ” represents the reciprocal of the average interlayer spacing at the specific Bragg angle. The (002) band, at around 24°–26°, represents the ordering degree of the aromatic planes in the microcrystallite. It is generally accepted that (002) band implies the average stack height of the aromatic planes of carbon microcrystallite. This characteristic band of graphite locates at 26°. If the (002) band is very sharp and close to 26°, it means that the carbon microcrystallite is highly ordered and shows similar microcrystallite as graphite. The (100) band at around 44° and the (110) band at about 81° both represent hexagonal ring structures. The higher and narrower these two peaks, the larger the hexagonal ring structure. The γ band, at around 16°–23°, is associated with aliphatic side chains or condensed saturated rings. Theoretically, the areas under the γ and (002) bands are believed to be equal to the number of aliphatic carbon atoms and aromatic carbon atoms, respectively [
41].
Figure 14b shows a representative curve fitted with two Gaussian bands. All the data for the calculation of parameters can be obtained through the fitted curves.
According to the Scherrer equation [
64,
70], the average stacking height (
Lc), the average size (
La), the average interlayer spacing (
d002), and the number of layers (
n) of a crystalline can be calculated by Equations (2)–(5), as follows:
where
and
are the full width at half maximum (FWHM) of (002) and (110) bands, respectively;
and
are the scanning angle of X-ray at (002) and (100) bands, respectively; λ is the wavelength of X-ray, normally λ = 1.5418 Å;
is the correction coefficient,
= 1.84.
The graphitization degree,
r0, of a coke can be calculated according to the
d002, as shown in Equation (6) [
88,
89]. A higher value of r
0 represents a higher ordering degree.
where 3.44 Å is the spacing of ideal none-graphitized carbon crystalline;
is the average spacing of coke sample crystalline; 3.35400 Å is ideal graphitized carbon crystalline spacing.
Transmission Electron Microscopy (TEM)
TEM has a resolution of 0.1~0.2 nm and a magnification of 10
4–10
6 times, which can be used to observe the structure of the coke matrix microregion. Rouzaud et al. [
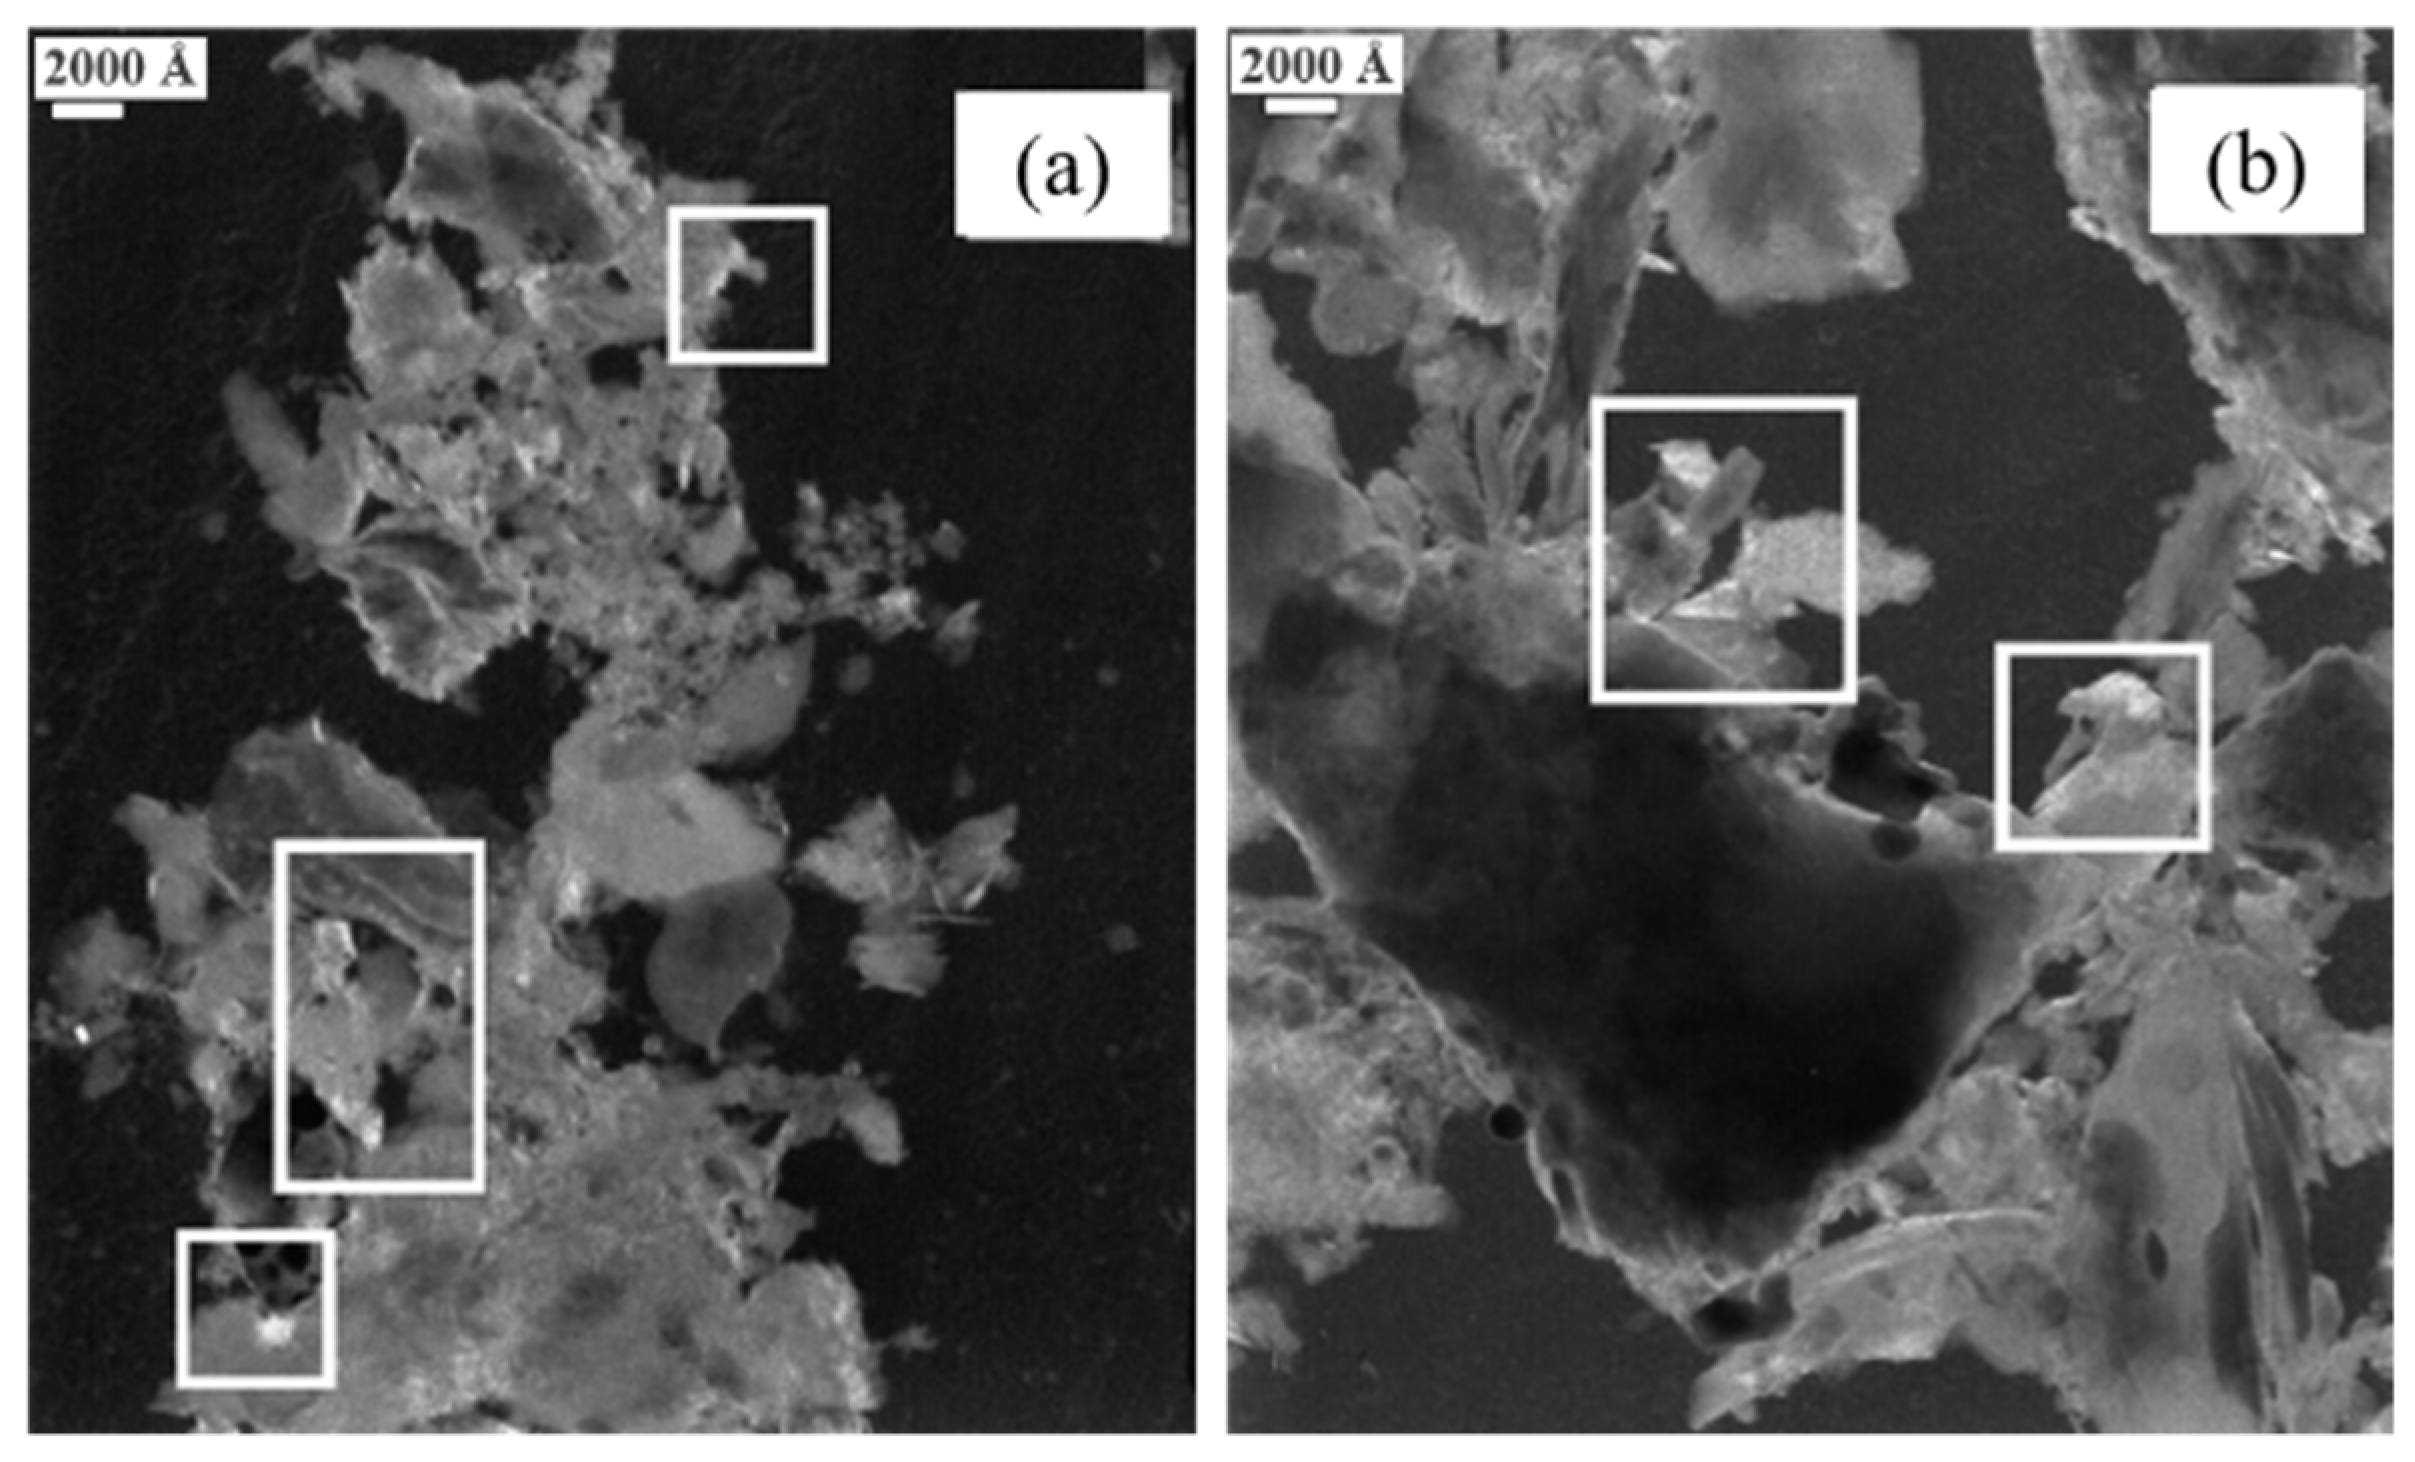
90] found that the molecular oriented domain (MOD) in the coke was one key factor to the reactivity, especially at the beginning of the gasification when the porosity was closed. The MODs are graphite-like structures that mainly develop along the pore wall. TEM method requires the sample to be thin enough, which limits its application in a certain field. To solve the sample preparation problem, Pusz et al. [
18] ground the coke sample in ethanol and then disperse the sample under ultrasonic bath treatment. The suspension liquid was placed on a copper grid covered by a carbon film. The sample can be used for TEM after the ethanol evaporates. As shown in
Figure 15, the microstructural images of the coke can be obtained. It was found that after reaction with CO
2, the molecular oriented domains (MODs) in the coke microregion became more extensive and more apparent, indicating that the microcrystallite is more orderly and tends to graphitization. The bright region in the white box is the MODs.
High-Resolution Transmission Electron Microscopy (HRTEM)
HRTEM has a higher resolution than TEM and can observe internal structures, such as the lattice fringe, of coke. The lattice fringe groups that represent graphite layers can be extracted from the lattice image by image processing technology. The interplanar spacing can be clearly seen by light and dark stripes. According to the characteristic parameters of the fringe groups, including length, curvature, and inclination angle, the microcrystallite parameters, such as the size of microcrystallite and the spacing of planes, can be directly calculated.
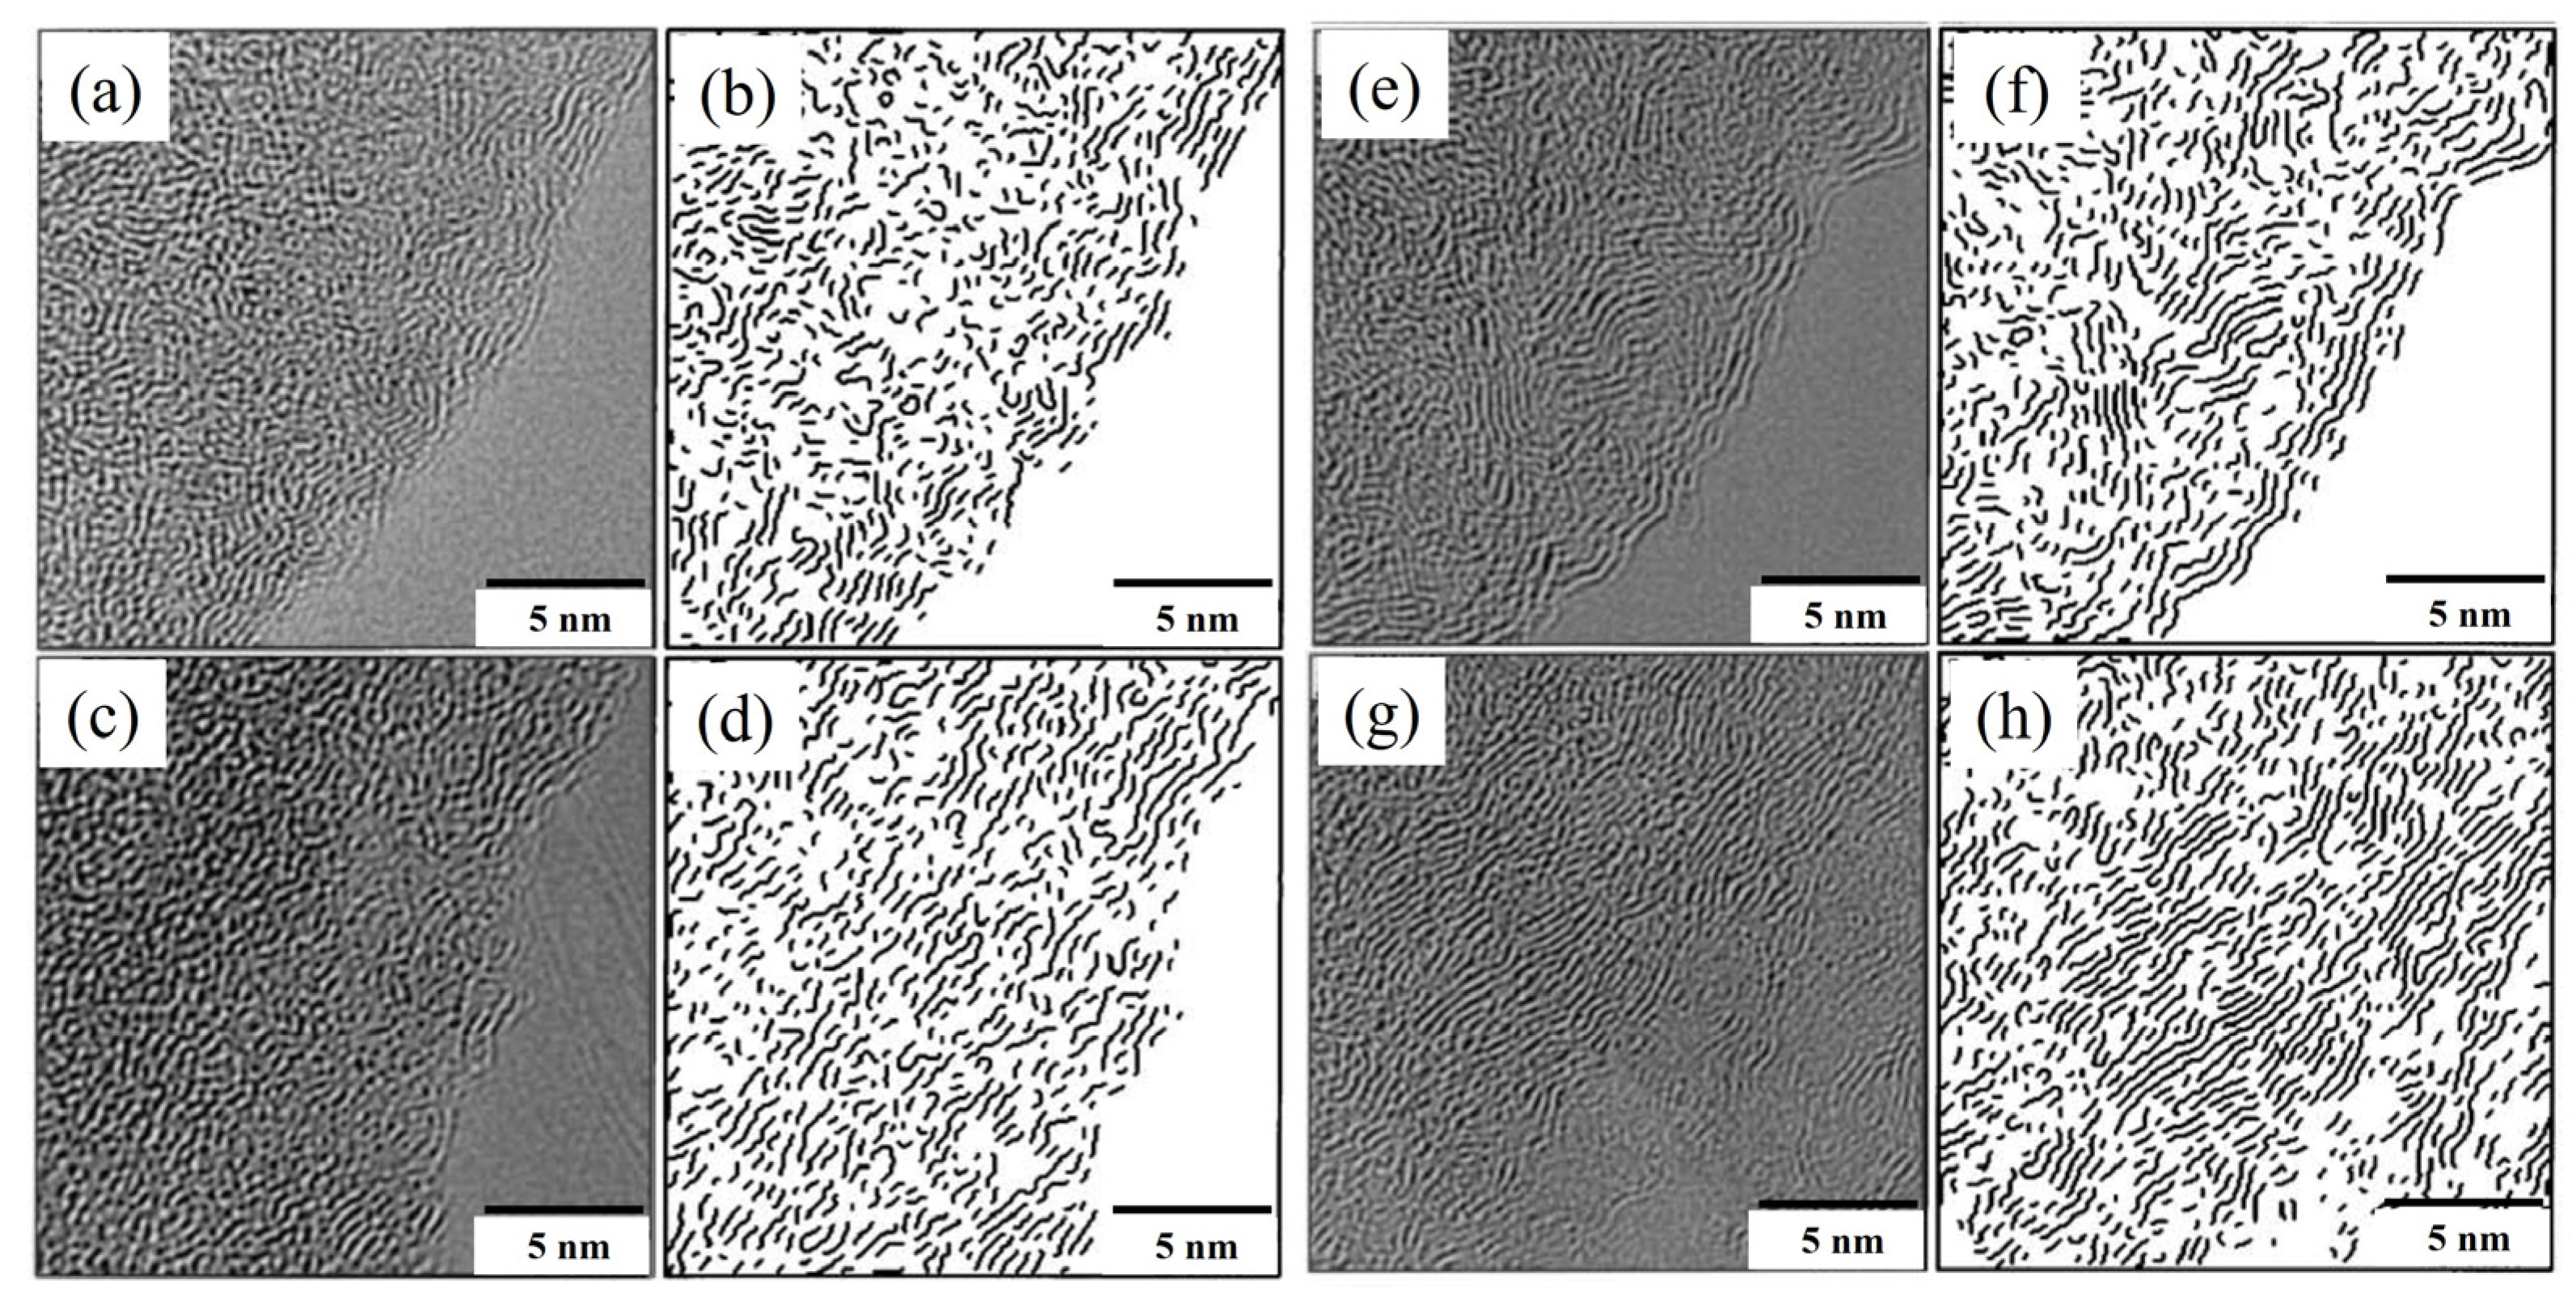
Wu et al. [
91,
92] put forward a quantitative analysis method for the calculation of microcrystallite parameters of coke based on HRTEM images. The stripes in the HRTEM image represent the layers of microcrystallite. Each stripe in the image was identified and numbered. The stripes that met a particular condition were classified as a group of stripes. Each group was regarded as an oriented microcrystallite. Sharma et al. [
93] tested the evolution of microcrystallite in phenol-formaldehyde resin char (PFC, a typical non-graphitized carbon) after pyrolysis at 1000 °C and 1400 °C. It was verified that the results from HRTEM were consistent with those obtained from XRD. The accuracy of HRTEM results was confirmed. Sharma et al. [
94] further analyzed the evolution of microcrystallite in pulverized coal during coking at different temperatures. As shown in
Figure 16, with the increase in pyrolysis temperature, the microcrystallite stripes tend to be distributed in parallel and arranged in an orderly manner.
3.3. Optical Texture
The active components (vitrinite and liptinite) in coal would soften and melt during coking and form a continuous pore wall. The inert components (inertinite, opaque matter, and semi vitrinite) would remain in the pore walls together with the active softening components [
95]. Under a polarized light microscope, the optical texture of coke is classified according to its microscopic characteristics (shape, size, and color). Coin et al. [
96] classified the typical visual textures of coke as isotropic, mosaic, flake, fibrous, ribbon, anisotropic, and pyrolytic carbon. To simplify the characterization of optical texture, the optical textures of coke are only divided into isotropic texture and anisotropic texture. In that sense, all the optical textures except isotropic and inert can be considered anisotropic. Zhang et al. [
45] evaluated the optical texture of six cokes from different plants according to Chinese standard YB/T 077-2017 (method for determination of coke visual structure). He found the coke with higher isotropic texture content exhibited higher reactivity. The optical texture contents and CRI of coke are listed in
Table 7.
The anisotropic degree (OTI) is another index to indicate the optical texture of coke, as expressed in Equation (7). In this case, further segmentation of the anisotropic texture type is needed.
where
is the content of each anisotropic texture type;
is the assignment value of each anisotropic texture type. The assignment value of each anisotropic type is listed in
Table 8. A higher assignment value indicates a higher ordering structure.
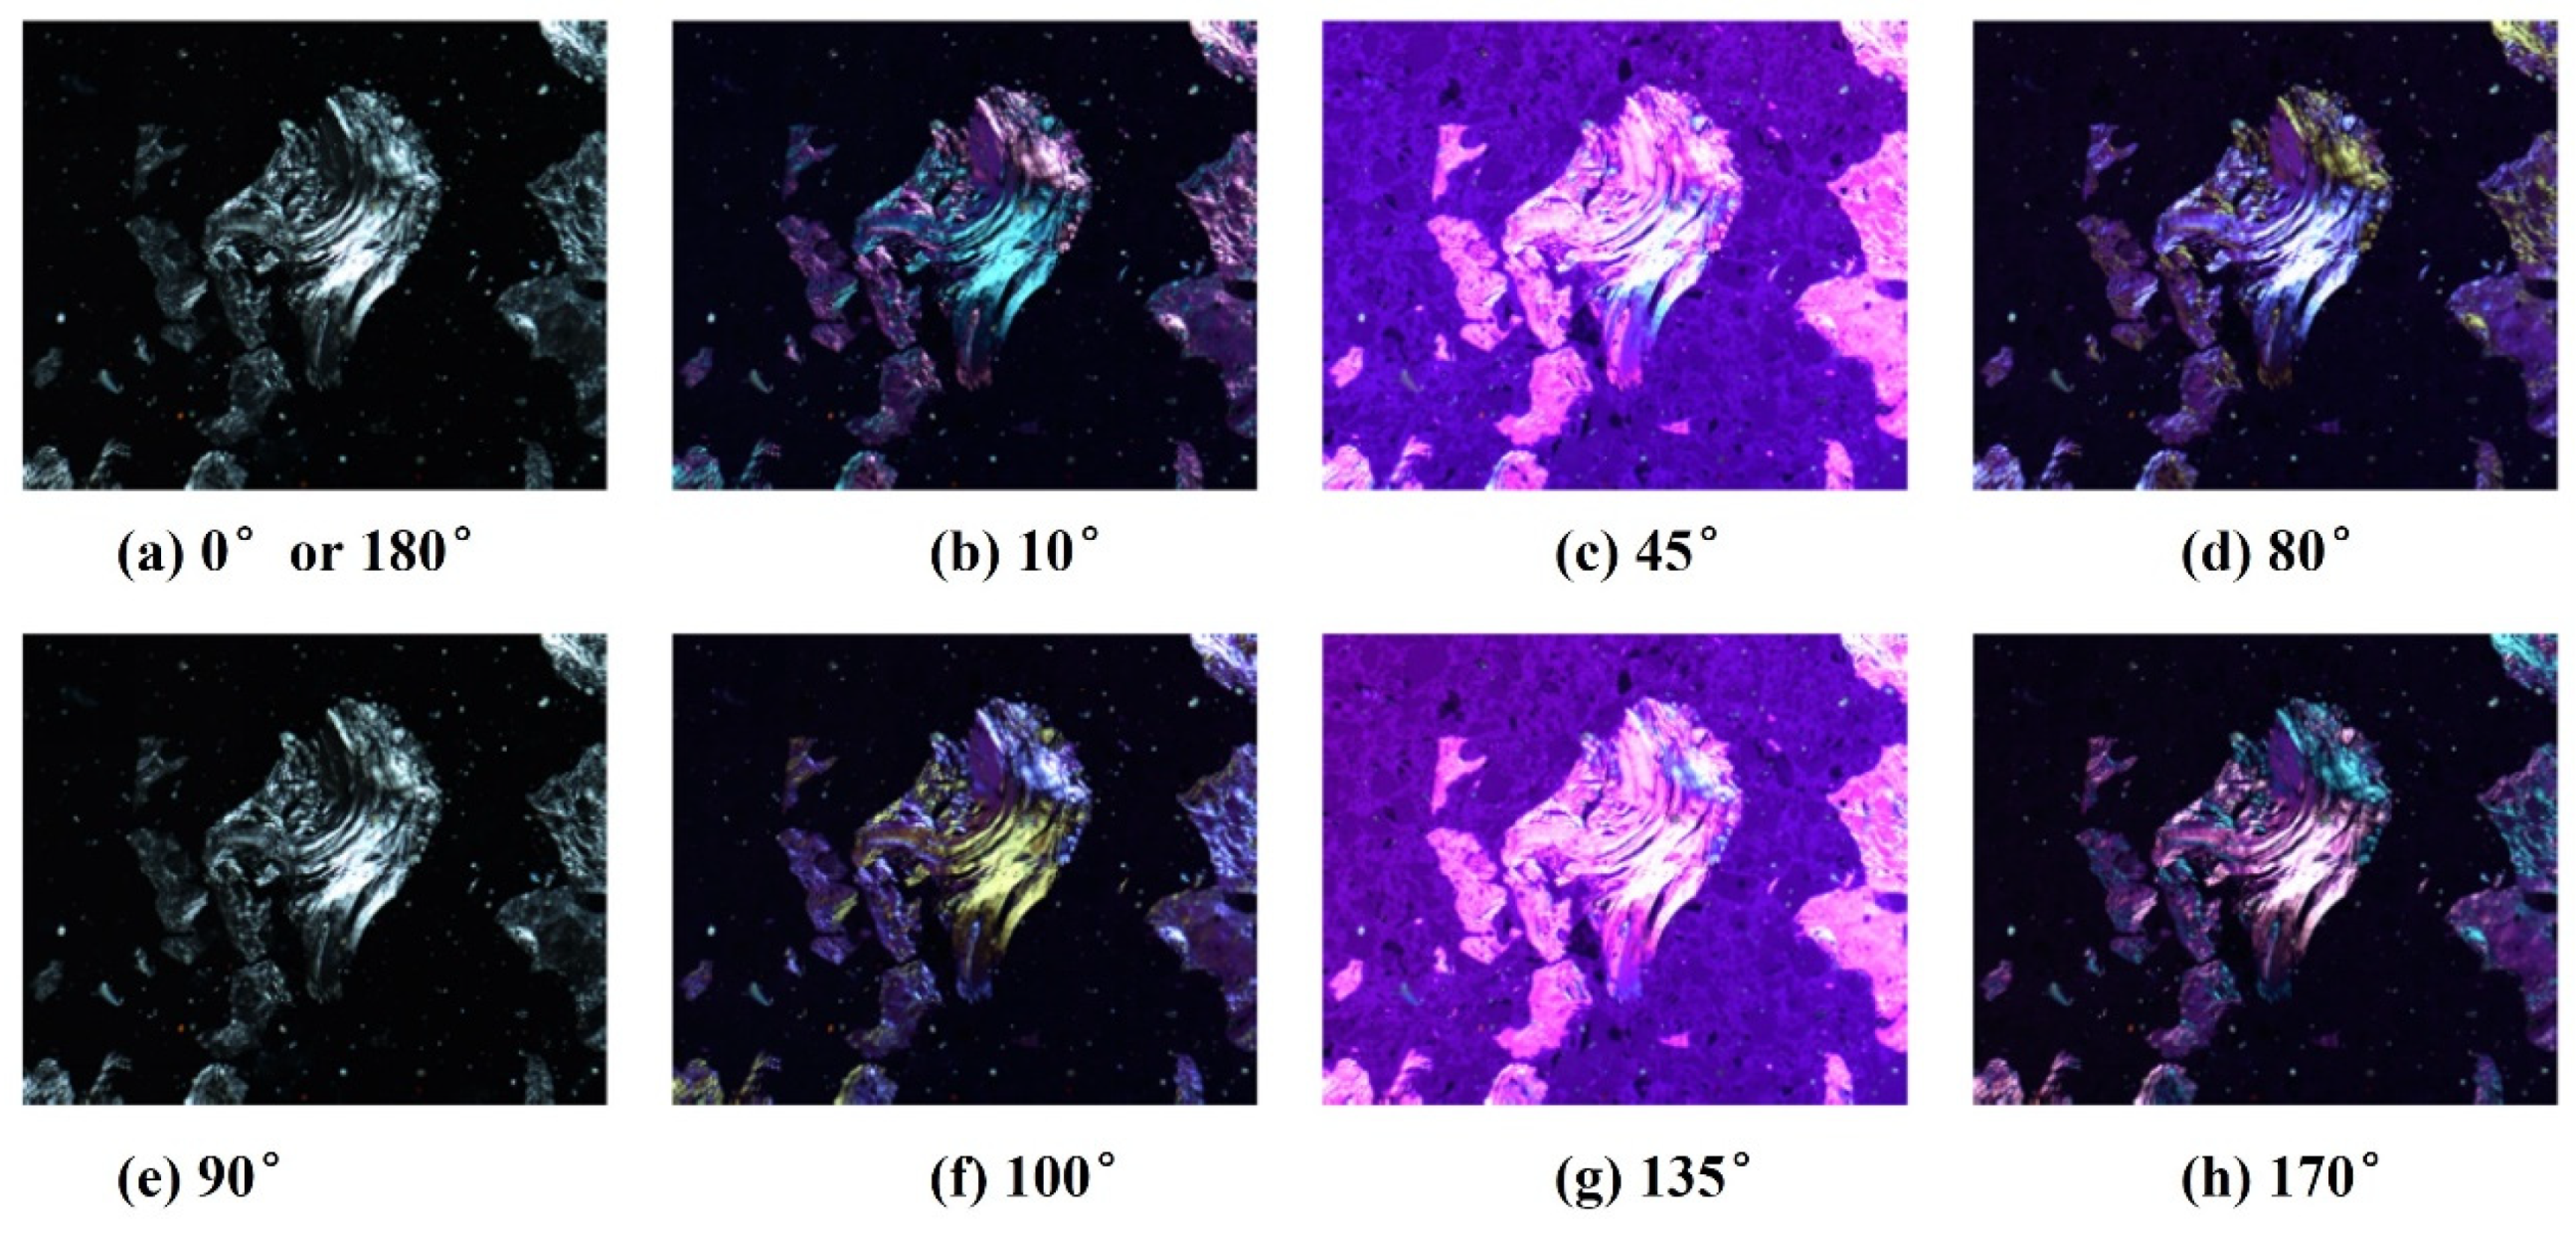
When the anisotropic texture is observed at different angles under the polarized light microscope, the interference colors will change; however, the interference color of the isotropic texture remains the same. This is the principle to distinguish these two kinds of optical textures. Sun et al. [
97] developed an automatic measurement method for the visual texture of coke under the polarizing microscope.
Figure 17 shows the optical images of the same field area of the coke from different analyzer angles. It should be noticed that
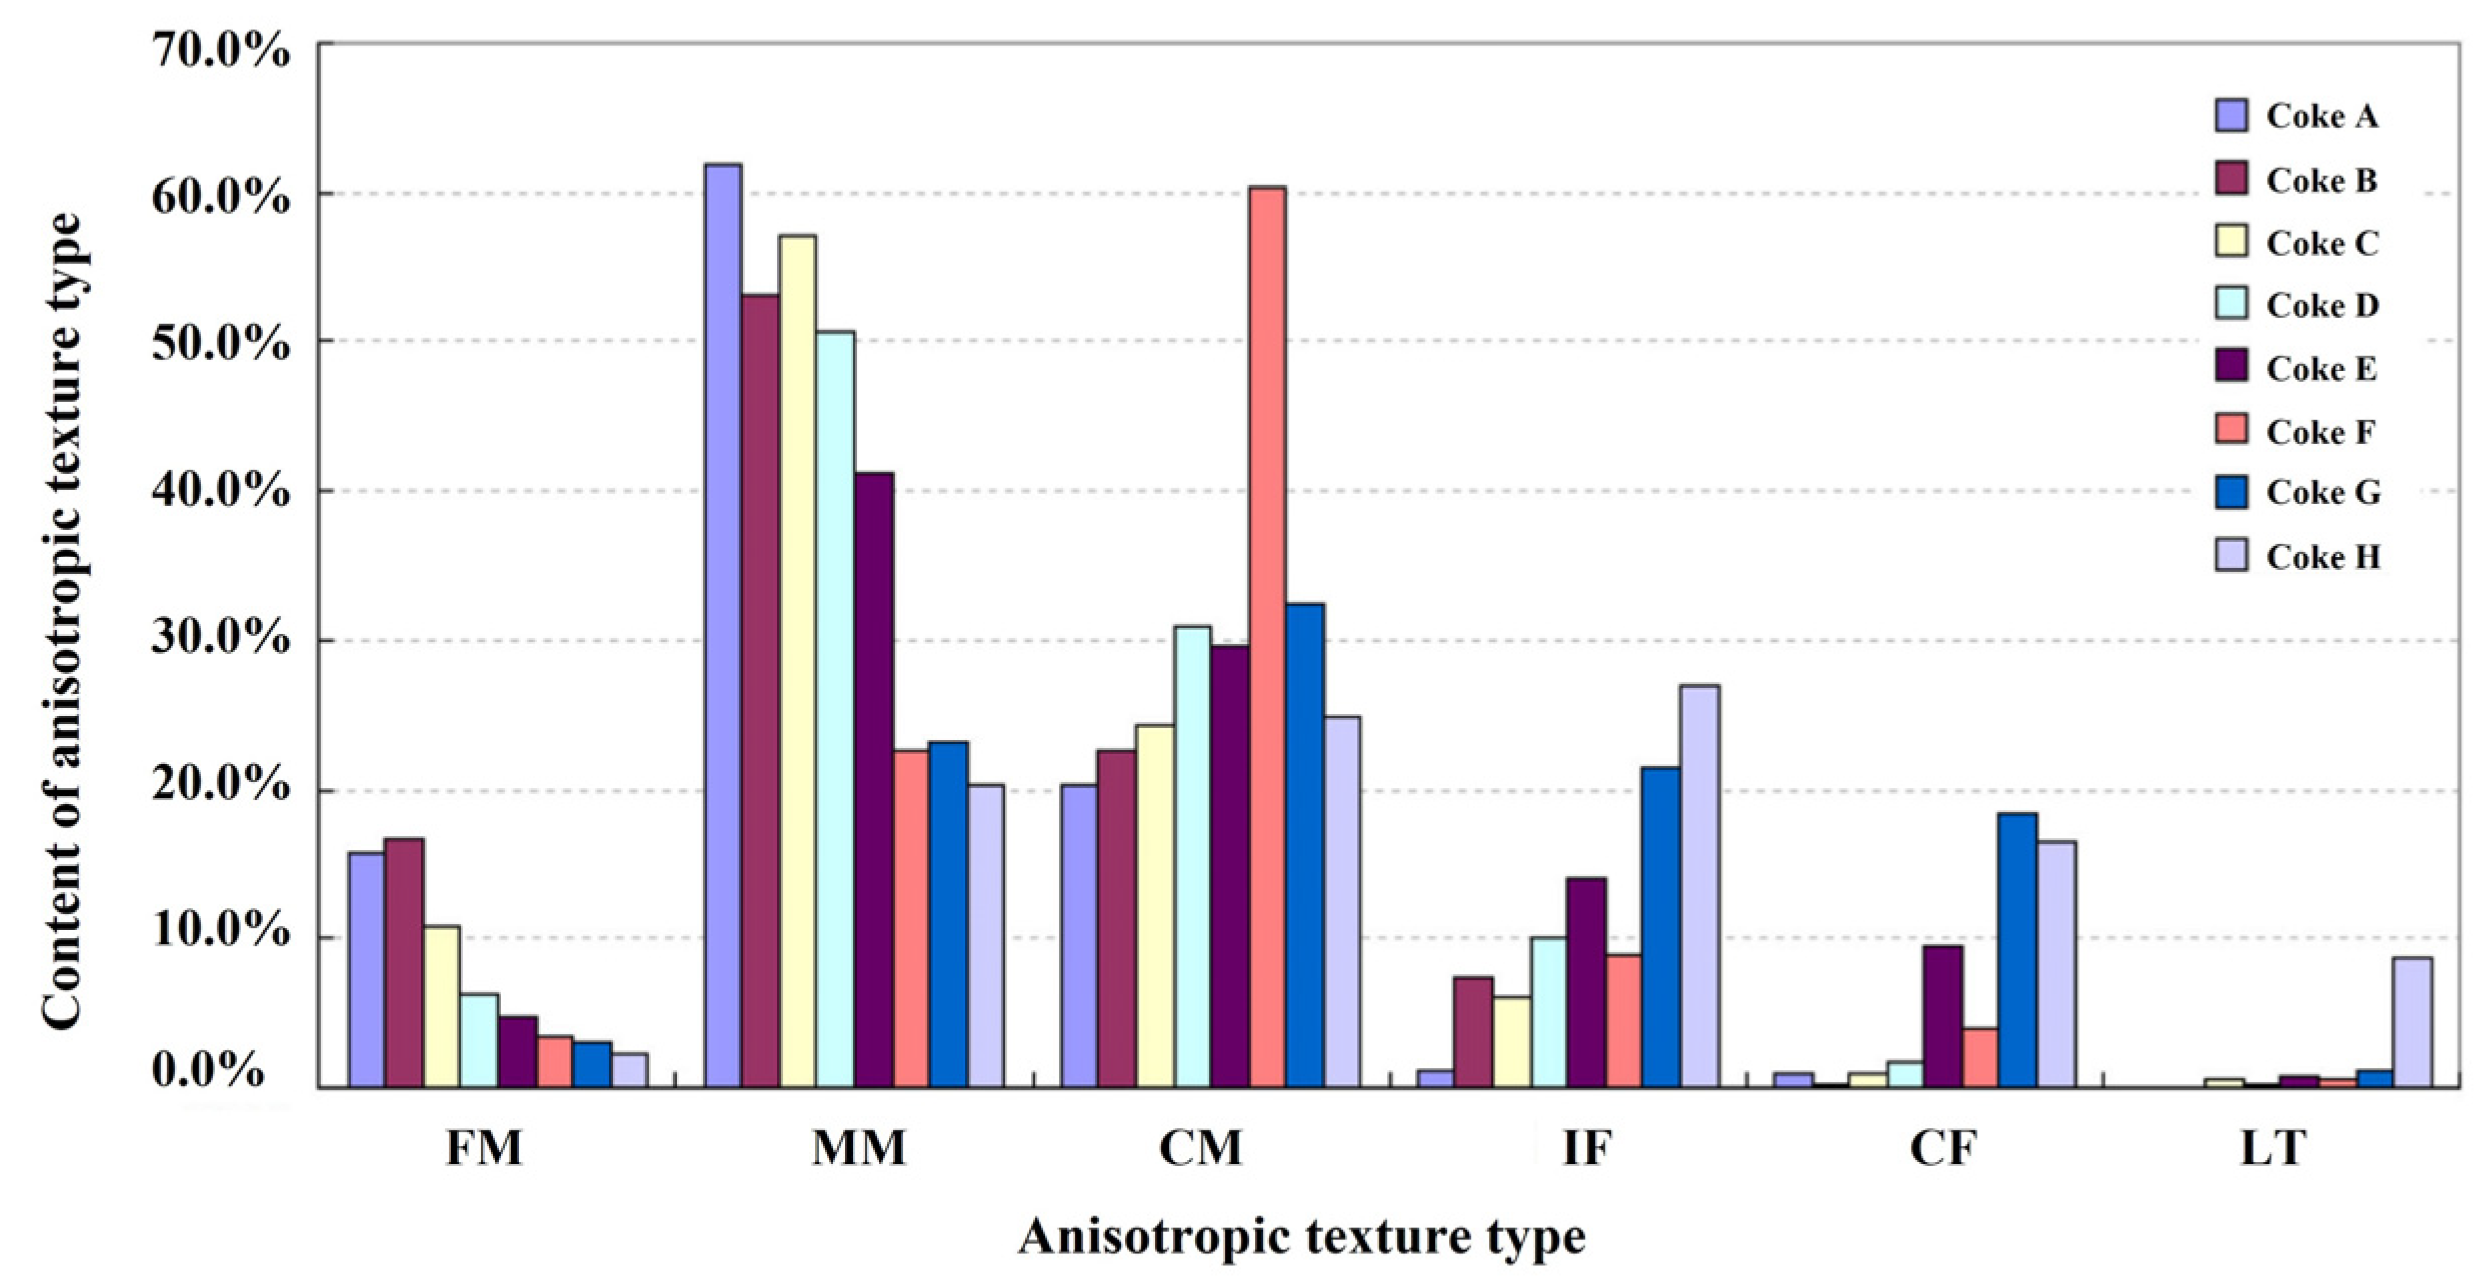
Figure 17a,e present the images under orthogonal polarization. All the isotropic textures exhibit black due to the extinction light. The anisotropic texture exhibit brightness because the reflected light partly passes through the analyzer. In practice, only two different analyzer angles (10° and 170°) images are needed for further analysis. The further quantitative analysis was fulfilled by a computer program, conducting the automatic extraction, recognition, and classification of color-changed regions.
Figure 18 shows the content of anisotropic texture type in cokes. Generally, the coke with a higher anisotropic degree offers lower CRI.
4. Construction of Molecular Structure Model
It is essential to build a molecular structure model of coke to understand its physicochemical properties and reactivity. Due to the complexity, variety, and heterogeneity of structural features, conducting a universal molecular structure model for all kinds of coke is impossible. The structure of each type of coke is unique and can be constructed by a combination of structural characterization and computer programming.
So far, there is plenty of literature about the molecular structure model of the coal [
60,
98,
99]. However, limited information about the construction of the coke molecular model is available [
55,
100]. Both coal and coke are carbon materials with different carbon skeleton and functional groups. The general principle of the construction of the molecular structure model is similar and can be summarized, as shown in
Figure 19. The key to the construction of the model is to obtain its basic structural units. After getting adequate structural parameters, the construction can be conducted by computer programs, such as Gaussian09 [
101], Fringe 3D [
102], and Packmol [
103], etc. Afterward, the validation of the model must be confirmed.
5. Conclusions
The relations between coke structures and properties are described in this review. The methods for a comprehensive characterization of the coke structures are summarized.
The metallurgical properties of coke strongly depend on its microstructures. Generally, the coke matrix with a more disordered carbon structure shows low reactivity. The coke with higher pore roundness and larger pore wall thickness shows higher cold strength and hot strength. The reactivity of the coke decreases with the increase in Lc and La. The coke with a higher amount of anisotropic texture shows lower reactivity because of the higher ordering degree.
The current review divides the coke structures into chemical structure, physical structure, and optical texture, according to its relevant characteristics. The chemical structures of the coke can be characterized by ultimate analysis and FTIR, Raman, XPS, and 13C NMR, respectively. The pore structure is usually detected by the image method, the X-ray CT imaging technique, the mercury intrusion method, and the N2 gas adsorption method. The microcrystallite structure can be characterized by XRD, TEM/HRTEM, and Raman spectroscopy. The optical texture of the coke is classified according to its microscopic characteristics (shape, size, and color) under the polarized light microscope. The advantages and features of each method are introduced.
6. Outlook
The above results show that coke has many characterization methods, involving the structure characterization scale from macro to micro, from chemistry to physics. In China, we have already mastered most research methods for the characterization of coke structure, such as XRD, FTIR, Raman, XPS, the optical texture technique, the mercury intrusion method, and N2 gas adsorption method. However, some advanced and in-depth characterization methods are yet to be commonly used, such as TEM/HRTEM, 13C NMR, and the X-ray CT imaging technique, etc. Therefore, these advanced technologies need to be developed with emphasis. For a comprehensive understanding of coke structures, we recommend conducting chemical, physical, and optical texture scales characterization.
A molecular model of the coke can be constructed by a combination of structural characterization and computer programming. The molecular structural model helps to understand the mechanism of the diversities of coke performance and provides a possible approach to simulate the evolution of coke structure in extreme conditions. The evolution of coke structures and its properties can be explained on a molecular scale. Moreover, the properties of a coke can be predicted and designed based on the molecular model. However, very limited information about the construction of the coke molecular model is available. Therefore, more attention should be paid to the construction of the molecular structure model. In the near future, with the continuous improvement of technology, the performance of coke at various conditions can be simulated and predicted by computer methods, based on the molecular structure model.
Author Contributions
Conceptualization, R.X. and H.Z.; investigation, O.D., C.L., and H.Z.; writing—original draft preparation, H.Z.; writing—review and editing, O.D., J.S., W.W., C.L. and J.Z.; supervision, R.X., J.Z. and W.W.; project administration, J.S. All authors have read and agreed to the published version of the manuscript.
Funding
This research was funded by K1-MET GmbH, metallurgical competence center. The research program of the K1-MET competence center is supported by COMET (Competence Center for Excellent Technologies), the Austrian program for competence centers. COMET is funded by the Federal Ministry for Climate Action, Environment, Energy, Mobility, Innovation, and Technology, the Federal Ministry for Digital and Economic Affairs, the provinces of Upper Austria, Tyrol, and Styria, and the Styrian Business Promotion Agency (SFG). In addition, the research work is partially financed by Montanuniversitaet Leoben. Zheng Heng greatly acknowledges the financial support from the program of China Scholarship Council (No.201908420284).
Institutional Review Board Statement
Not applicable.
Informed Consent Statement
Not applicable.
Data Availability Statement
Data sharing not applicable. No new data were created or analyzed in this study. Data sharing is not applicable to this article.
Conflicts of Interest
The authors declare no conflict of interest.
References
- Zhou, C.; Tang, G.; Wang, J.; Fu, D.; Okosun, T.; Silaen, A.; Wu, B. Comprehensive numerical modeling of the blast furnace ironmaking process. JOM 2016, 68, 1353–1362. [Google Scholar] [CrossRef]
- Liu, W.; Zuo, H.; Wang, J.; Xue, Q.; Ren, B.; Yang, F. The production and application of hydrogen in steel industry. Int. J. Hydrog. Energy 2021, 46, 10548–10569. [Google Scholar] [CrossRef]
- Chen, Y.; Zuo, H. Review of hydrogen-rich ironmaking technology in blast furnace. Ironmak. Steelmak. 2021, 48, 749–768. [Google Scholar] [CrossRef]
- Patisson, F.; Mirgaux, O. Hydrogen ironmaking: How it works. Metals 2020, 10, 922. [Google Scholar] [CrossRef]
- Lyalyuk, V.P.; Sheremet, V.A.; Kekuh, A.V.; Otorvin, P.I.; Tarakanov, A.K.; Kassim, D.A. Investigation of coke reactivity effect on parameters of blast furnace operation. Metall. Min. Ind. 2010, 2, 317–323. [Google Scholar]
- Wang, H.; Chu, M.; Bao, J.; Liu, Z.; Tang, J.; Long, H. Experimental study on impact of iron coke hot briquette as an alternative fuel on isothermal reduction of pellets under simulated blast furnace conditions. Fuel 2020, 268, 117339. [Google Scholar] [CrossRef]
- Yin, C.; Qiu, S.; Zhang, S.; Sher, F.; Zhang, H.; Xu, J.; Wen, L. Strength degradation mechanism of iron coke prepared by mixed coal and Fe2O3. J. Anal. Appl. Pyrolysis 2020, 150, 104897. [Google Scholar] [CrossRef]
- Castro-Diaz, M.; Vega, M.F.; Diaz-Faes, E.; Barriocanal, C.; Musa, U.; Snape, C. Evaluation of demineralized lignin and lignin-phenolic resin blends to produce biocoke suitable for blast furnace operation. Fuel 2019, 258, 116125. [Google Scholar] [CrossRef]
- Koveria, A.; Kieush, L.; Svietkina, O.; Perkov, Y. Metallurgical coke production with biomass additives. Part 1. A review of existing practices. Canadian Metall. Q. 2021, 59, 1–13. [Google Scholar] [CrossRef]
- De Assis, C.F.C.; Tenório, J.A.S.; Assis, P.S.; Nath, N.K. Experimental simulation and analysis of agricultural waste injection as an alternative fuel for blast furnace. Energy Fuels 2014, 28, 7268–7273. [Google Scholar] [CrossRef]
- Toloue Farrokh, N.; Suopajärvi, H.; Mattila, O.; Sulasalmi, P.; Fabritius, T. Characteristics of wood-based biochars for pulverized coal injection. Fuel 2020, 265, 117017. [Google Scholar] [CrossRef]
- Majeski, A.; Runstedtler, A.; D’alessio, J.; Macfadyen, N. Injection of pulverized coal and natural gas into blast furnaces for iron-making: Lance positioning and design. ISIJ Int. 2015, 55, 1377–1383. [Google Scholar] [CrossRef] [Green Version]
- Jampani, M.; Gibson, J.; Pistorius, P.C. Increased use of natural gas in blast furnace ironmaking: Mass and energy balance calculations. Met. Mater. Trans. B 2019, 50, 1290–1299. [Google Scholar] [CrossRef]
- Liu, Y.; Shen, Y. Modelling and optimisation of biomass injection in ironmaking blast furnaces. Prog. Energy Combust. Sci. 2021, 87, 100952. [Google Scholar] [CrossRef]
- Zhou, Z.; Wang, R.; Yi, Q.; Wang, G.; Ma, C. Combustion enhancement of pulverized coal with targeted oxygen-enrichment in an ironmaking blast furnace. Processes 2021, 9, 440. [Google Scholar] [CrossRef]
- Kou, M.; Zhou, H.; Hong, Z.; Yao, S.; Wu, S.; Xu, H.; Xu, J. Numerical analysis of effects of different blast parameters on the gas and burden distribution characteristics inside blast furnace. ISIJ Int. 2020, 60, 856–864. [Google Scholar] [CrossRef] [Green Version]
- Gangopadhyay, M.; Bayen, G.K.; Kumar, M.; Mukherjee, A.; Ranjan, R.; Kumar, S. Preheating upto tarrification point and compaction: A promising way for coke quality enhancement. Int. J. Coal Geol. 2021, 1–9. [Google Scholar] [CrossRef]
- Pusz, S.; Krzesinska, M.; Smedowski, L.; Majewska, J.; Pilawa, B.; Kwiecinska, B. Changes in a coke structure due to reaction with carbon dioxide. Int. J. Coal Geol. 2010, 81, 287–292. [Google Scholar] [CrossRef]
- Xu, R.; Dai, B.; Wang, W.; Schenk, J.; Bhattacharyya, A.; Xue, Z. Gasification reactivity and structure evolution of metallurgical coke under H2O/CO2 atmosphere. Energy Fuels 2018, 32, 1188–1195. [Google Scholar] [CrossRef]
- Guo, R.; Wang, Q. Relationship between coke properties and solution loss behavior and its influence on post-reaction strength of coke. Metall. Res. Technol. 2012, 109, 443–452. [Google Scholar] [CrossRef]
- Lech, K.; Jursova, S.; Kobel, P.; Pustejovska, P.; Bilik, J.; Figiel, A.; Romański, L. The relation between CRI, CSR indexes, chemical composition and physical parameters of commercial metallurgical cokes. Ironmak. Steelmak. 2019, 46, 124–132. [Google Scholar] [CrossRef]
- Sun-Young, K.; Sasaki, Y. Simulation of effect of pore structure on coke strength using 3-dimensional discrete element method. ISIJ Int. 2010, 50, 813–821. [Google Scholar] [CrossRef] [Green Version]
- Saito, Y.; Matsuo, S.; Kanai, T.; Toishi, A.; Uchida, A.; Yamazaki, Y.; Matsushita, Y.; Aoki, H.; Nomura, S.; Hayashizaki, H.; et al. Effect of random pore shape, arrangement and non-adhesion grain boundaries on coke strength. ISIJ Int. 2014, 54, 2519–2526. [Google Scholar] [CrossRef] [Green Version]
- Gornostayev, S.; Heino, J.; Fabritius, T. Effect of micro-pores on cracks formation in metallurgical coke. Can. Metall. Q. 2017, 56, 252–258. [Google Scholar] [CrossRef]
- Lu, L.; Devasahayam, S.; Sahajwalla, V. Evaluation of coal for metallurgical applications. Coal Handb. Towards Clean. Prod. 2013, 2013, 352–386. [Google Scholar] [CrossRef]
- Diez, M.A.; Alvarez, R.; Barriocanal, C. Coal for metallurgical coke production: Predictions of coke quality and future. Int. J. Coal Geol. 2002, 50, 389–412. [Google Scholar] [CrossRef]
- North, L.; Blackmore, K.; Nesbitt, K.; Mahoney, M.R. Methods of coke quality prediction: A review. Fuel 2018, 219, 426–445. [Google Scholar] [CrossRef]
- Guo, R.; Duan, C.; Sun, Z.; Wang, J.; Sun, X.; Liang, Y. Effect of pore structure and matrix reactivity on coke reactivity and post-reaction strength. Metall. Res. Technol. 2017, 114, 504. [Google Scholar] [CrossRef]
- Fott, P.; Straka, P. Effect of pore diffusion on reactivity of lump coke. Fuel 1987, 66, 1281–1288. [Google Scholar] [CrossRef]
- Reid, M.H.; Mahoney, M.R.; Monaghan, B.J. A Coke Analogue for the Study of the Effects of Minerals on Coke Reactivity. ISIJ Int. 2014, 54, 628–633. [Google Scholar] [CrossRef] [Green Version]
- Grigore, M.; Sakurovs, R.; French, D.; Sahajwalla, V. Coke gasification: The influence and behavior of inherent catalytic mineral matter. Energy Fuels 2009, 23, 2075–2085. [Google Scholar] [CrossRef]
- Gornostayev, S.S.; Heikkinen, E.-P.; Heino, J.J.; Huttunen, S.M.M.; Fabritius, T.M.J. Behavior of alkali-bearing minerals in coking and blast furnace processes. Steel Res. Int. 2016, 87, 1144–1153. [Google Scholar] [CrossRef]
- Dastidar, M.G.; Bhattacharyya, A.; Sarkar, B.K.; Dey, R.; Mitra, M.K.; Schenk, J. The effect of alkali on the reaction kinetics and strength of blast furnace coke. Fuel 2020, 268, 117388. [Google Scholar] [CrossRef]
- Wang, G.; Ren, S.; Zhang, J.; Ning, X.; Liang, W.; Zhang, N.; Wang, C. Influence mechanism of alkali metals on CO2 gasification properties of metallurgical coke. Chem. Eng. J. 2020, 387, 124093. [Google Scholar] [CrossRef]
- Bhattacharyya, A. Effect of alkaline elements on cokes structure under blast furnace process conditions. In Proceedings of the 25th Anniversary International Conference on Metallurgy and Materials. Metal, Brno, Czech Republic, 25–27 May 2016. [Google Scholar]
- Bhattacharyya, A. Effect of alkaline elements on the reactivity, strength and structural properties of blast furnace cokes. Metalurgija 2015, 54, 503–506. [Google Scholar]
- Li, K.; Zhang, J.; Barati, M.; Khanna, R.; Liu, Z.; Zhong, J.; Ning, X.; Ren, S.; Yang, T.; Sahajwalla, V. Influence of alkaline (Na, K) vapors on carbon and mineral behavior in blast furnace cokes. Fuel 2015, 145, 202–213. [Google Scholar] [CrossRef]
- Wang, W.; Wang, J.; Xu, R.; Yu, Y.; Jin, Y.; Xue, Z. Influence mechanism of zinc on the solution loss reaction of coke used in blast furnace. Fuel Process. Technol. 2017, 159, 118–127. [Google Scholar] [CrossRef]
- Wang, J.; Qie, L.; Hu, Y.; Liu, H.; Zheng, G. Influence of Zinc on nonisothermal gasification kinetics of coke in a blast furnace. ACS Omega 2021, 6, 28838–28847. [Google Scholar] [CrossRef]
- Hu, D.S. Crystall ite structure characteristics of coke. Iron Steel 2006, 41, 10–12. [Google Scholar]
- Zhang, H.; Bai, J.; Li, W.; Cheng, F. Comprehensive evaluation of inherent mineral composition and carbon structure parameters on CO2 reactivity of metallurgical coke. Fuel 2019, 235, 647–657. [Google Scholar] [CrossRef]
- Piechaczek, M.; Mianowski, A.; Sobolewski, A. Reprint of “The original concept of description of the coke optical texture”. Int. J. Coal Geol. 2015, 139, 184–190. [Google Scholar] [CrossRef]
- Flores, B.D.; Borrego, A.G.; Diez, M.A.; da Silva, G.L.; Zymla, V.; Vilela, A.C.; Osório, E. How coke optical texture became a relevant tool for understanding coal blending and coke quality. Fuel Process. Technol. 2017, 164, 13–23. [Google Scholar] [CrossRef]
- Li, K.; Khanna, R.; Zhang, J.; Liu, Z.; Sahajwalla, V.; Yang, T.; Kong, D. The evolution of structural order, microstructure and mineral matter of metallurgical coke in a blast furnace: A review. Fuel 2014, 133, 194–215. [Google Scholar] [CrossRef]
- Zhang, W.; Shi, T.; Zhang, Q.; Cao, Y.; Qian, H.; Wu, X.; Li, J.; Zhang, Q.; Yang, G.; Yang, J. Coke texture, reactivity and tumbler strength after reaction under simulated blast furnace conditions. Fuel 2019, 251, 218–223. [Google Scholar] [CrossRef]
- Mihashi, M.; Soejima, M.; Asakuma, Y.; Yamamoto, T.; Aoki, H.; Miura, T.; Katou, K.; Itagaki, S. Evaluation of matrix of coke strength by nano-indentation method. Tetsu-to-Hagane 2002, 88, 188–194. [Google Scholar] [CrossRef] [Green Version]
- Wang, Q.; Guo, R.; Zhao, X.; Sun, J.; Zhang, S.; Liu, W. A new testing and evaluating method of cokes with greatly varied CRI and CSR. Fuel 2016, 182, 879–885. [Google Scholar] [CrossRef]
- Lundgren, M.; Sundqvist Ökvist, L.; Björkman, B. Coke reactivity under blast furnace conditions and in the CSR/CRI test. Steel Res. Int. 2009, 80, 396–401. [Google Scholar] [CrossRef]
- Haapakangas, J.; Uusitalo, J.; Mattila, O.; Kokkonen, T.; Porter, D.; Fabritius, T. A method for evaluating coke hot strength. Steel Res. Int. 2013, 84, 65–71. [Google Scholar] [CrossRef]
- Haapakangas, J.A.; Uusitalo, J.A.; Mattila, O.J.; Gornostayev, S.S.; Porter, D.A.; Fabritius, T.M.J. The hot strength of industrial cokes—Evaluation of coke properties that affect its high-temperature strength. Steel Res. Int. 2014, 85, 1608–1619. [Google Scholar] [CrossRef]
- Fang, J.; Li, C.; Wang, X.; Ren, R. Raw material strength in a blast furnace at operating temperature. Steel Res. Int. 2008, 79, 5–10. [Google Scholar] [CrossRef]
- Guo, W.T.; Xue, Q.G.; Ling, C.; Zuo, H.B.; Wang, J.S.; Han, Y.H. Influence of pore structure features on the high temperature tensile strength of coke. Chin. J. Eng. 2016, 38, 930–936. [Google Scholar]
- White, A.; Whittingham, J. Ultimate analysis of coals and cokes using instrumental techniques. Fuel 1983, 62, 1058–1061. [Google Scholar] [CrossRef]
- Wang, X. Study on Structure and Composition of Coke on Spent Catalysts of Commercial Fixed-bed Residue Hydrotreating Unit. Master’s Thesis, China University of Petroleum (East China), Qingdao, China, 2014. [Google Scholar]
- Tian, Y.; Li, G.-Y.; Zhang, H.; Wang, J.; Ding, Z.-Z.; Guo, R.; Cheng, H.; Liang, Y. Molecular basis for coke strength: Stacking-fault structure of wrinkled carbon layers. Carbon 2020, 162, 56–65. [Google Scholar] [CrossRef]
- Chen, D.; Liu, D.; Zhang, H.; Chen, Y.; Li, Q. Bamboo pyrolysis using TG–FTIR and a lab-scale reactor: Analysis of pyrolysis behavior, product properties, and carbon and energy yields. Fuel 2015, 148, 79–86. [Google Scholar] [CrossRef]
- Lee, S.; Yu, J.; Mahoney, M.; Tremain, P.; Moghtaderi, B.; Tahmasebi, A. A study on the structural transition in the plastic layer during coking of Australian coking coals using Synchrotron micro-CT and ATR-FTIR. Fuel 2018, 233, 877–884. [Google Scholar] [CrossRef]
- Xie, K.-C. Structure and Reactivity of Coal; Springer: Berlin/Heidelberg, Germany, 2015; ISBN 978-3-662-47336-8. [Google Scholar]
- Geng, W.; Nakajima, T.; Takanashi, H.; Ohki, A. Analysis of carboxyl group in coal and coal aromaticity by Fourier transform infrared (FT-IR) spectrometry. Fuel 2009, 88, 139–144. [Google Scholar] [CrossRef]
- Feng, L.; Zhao, G.; Zhao, Y.; Zhao, M.; Tang, J. Construction of the molecular structure model of the Shengli lignite using TG-GC/MS and FTIR spectrometry data. Fuel 2017, 203, 924–931. [Google Scholar] [CrossRef]
- Dong, K.; Wang, D.; Duan, Y.; Zhou, X.; Zhao, J.; Si, M.; Liang, e.; Fang, Y.; Zhang, P. The database of raman spectrum and information search system. J. Light Scatt. 2008, 20, 359–362. [Google Scholar]
- Cuesta, A.; Dhamelincourt, P.; Laureyns, J.; Martínez-Alonso, A.; Tascón, J. Raman microprobe studies on carbon materials. Carbon 1994, 32, 1523–1532. [Google Scholar] [CrossRef]
- Li, X.J.; Hayashi, J.; LI, C. FT-Raman spectroscopic study of the evolution of char structure during the pyrolysis of a Victorian brown coal. Fuel 2006, 85, 1700–1707. [Google Scholar] [CrossRef]
- Rantitsch, G.; Bhattacharyya, A.; Schenk, J.; Lünsdorf, N.K. Assessing the quality of metallurgical coke by Raman spectroscopy. Int. J. Coal Geol. 2014, 130, 1–7. [Google Scholar] [CrossRef]
- Rantitsch, G.; Bhattacharyya, A.; Günbati, A.; Schulten, M.-A.; Schenk, J.; Letofsky-Papst, I.; Albering, J. Microstructural evolution of metallurgical coke: Evidence from Raman spectroscopy. Int. J. Coal Geol. 2020, 227, 103546. [Google Scholar] [CrossRef]
- Guo, Q.L. X ray photoelectron spectroscopy. Physics 2007, 36, 405–410. [Google Scholar]
- Liu, Y.; Yan, H.; Chen, X.; Feng, X.; Yang, C. Effect of blending ratio on coke morphology and composition in co-coking of vacuum residue and bio-tar. J. Anal. Appl. Pyrolysis 2019, 141, 104629. [Google Scholar] [CrossRef]
- Li, Z.-K.; Wei, X.-Y.; Yan, H.-L.; Zong, Z.-M. Insight into the structural features of Zhaotong lignite using multiple techniques. Fuel 2015, 153, 176–182. [Google Scholar] [CrossRef]
- Nyathi, M.S.; Mastalerz, M.; Kruse, R. Influence of coke particle size on pore structural determination by optical microscopy. Int. J. Coal Geol. 2013, 118, 8–14. [Google Scholar] [CrossRef]
- Xing, X.; Rogers, H.; Zhang, G.; Hockings, K.; Zulli, P.; Ostrovski, O. Changes in pore structure of metallurgical cokes under blast furnace conditions. Energy Fuels 2016, 30, 161–170. [Google Scholar] [CrossRef]
- Lomas, H.; Roest, R.; Gupta, S.; Pearson, R.A.; Fetscher, R.; Jenkins, D.R.; Pearce, R.; Kanniala, R.; Mahoney, M.R. Petrographic analysis and characterisation of a blast furnace coke and its wear mechanisms. Fuel 2017, 200, 89–99. [Google Scholar] [CrossRef]
- Lomas, H.; Jenkins, D.R.; Mahoney, M.R.; Pearce, R.; Roest, R.; Steel, K.; Mayo, S. Examining mechanisms of metallurgical coke fracture using micro-CT imaging and analysis. Fuel Process. Technol. 2017, 155, 183–190. [Google Scholar] [CrossRef]
- Steel, K.M.; Dawson, R.E.; Jenkins, D.R.; Pearce, R.; Mahoney, M.R. Use of rheometry and micro-CT analysis to understand pore structure development in coke. Fuel Process. Technol. 2017, 155, 106–113. [Google Scholar] [CrossRef]
- Kubota, Y.; Nomura, S.; Arima, T.; Kato, K. Quantitative evaluation of relationship between coke strength and pore structure. ISIJ Int. 2011, 51, 1800–1808. [Google Scholar] [CrossRef] [Green Version]
- Ghosh, B.; Sahoo, B.K.; Chakraborty, B.; Manjhi, K.K.; Das, S.K.; Sahu, J.N.; Varma, A.K. Influence of coke structure on coke quality using image analysis method. Int. J. Coal Sci. Technol. 2018, 5, 473–485. [Google Scholar] [CrossRef]
- Miu, J.L.; Wang, P.Z.; Sun, W.L.; Yu, J.Y. A novel contour extraction method for coke microscopic image. Comput. Technol. Dev. 2011, 21, 120–123. [Google Scholar]
- Xie, W.; Xia, J.; Qian, H.; Chen, Y.Q. Image shooting and automatic analysis technology of metallurgical coke. Microcomput. Appl. 2015, 31, 14–17. [Google Scholar]
- Donskoi, E.; Poliakov, A.; Mahoney, M.R.; Scholes, O. Novel optical image analysis coke characterisation and its application to study of the relationships between coke Structure, coke strength and parent coal composition. Fuel 2017, 208, 281–295. [Google Scholar] [CrossRef]
- Yamamoto, Y.; Kashiwaya, Y.; Nishimura, M.; Kubota, M. 3D Analysis of coke microstructure using mu-X-ray CT. Tetsu Hagane-J. Iron Steel Inst. Jpn. 2009, 95, 103–111. [Google Scholar] [CrossRef] [Green Version]
- Ghosh, B.; Sahoo, B.K.; Niyogi, O.S.; Chakraborty, B.; Manjhi, K.K.; Das, T.K.; Das, S.K. Coke structure evaluation for BF coke making. Int. J. Coal Prep. Util. 2017, 38, 321–326. [Google Scholar] [CrossRef]
- Gagarin, S.G. Study of coke structure by computerized X-ray tomography: A review. Coke Chem. 2012, 55, 56–61. [Google Scholar] [CrossRef]
- Wang, W.; Dai, B.; Xu, R.; Schenk, J.; Wang, J.; Xue, Z. The effect of H2O on the reactivity and microstructure of metallurgical coke. Steel Res. Int. 2017, 88, 1700063. [Google Scholar] [CrossRef]
- Kawakami, M.; Kanba, H.; Sato, K.; Takenaka, T.; Gupta, S.; Chandratilleke, R.; Sahajwalla, V. Characterization of thermal annealing effects on the evolution of coke carbon structure using Raman spectroscopy and X-ray diffraction. ISIJ Int. 2006, 46, 1165–1170. [Google Scholar] [CrossRef] [Green Version]
- Wu, D.; Zhang, H.; Hu, G.Q.; Zhang, W.Y. Fine characterization of the macromolecular structure of huainan coal using XRD, FTIR, 13C-CP/MAS NMR, SEM, and AFM techniques. Molecules 2020, 25, 2661. [Google Scholar] [CrossRef] [PubMed]
- Li, K.J.; Li, H.T.; Sun, M.M.; Zhang, J.L.; Zhang, H.; Ren, S.; Barati, M. Atomic-scale understanding about coke carbon Structural evolution by experimental. Energy Fuels 2019, 11, 10941–10952. [Google Scholar] [CrossRef]
- Philippe, O.; Aïmen, E.G.; Patrice, C.; Aïmen, E.G.; Patrice, C. A size-dependent thermodynamic model for the carbon/hydrogen/sulfur system in coke crystallites: Application to the production of pre-baked carbon anodes. In Light Metals 2015; Springer: Cham, Switzerland, 2015; pp. 1067–1072. [Google Scholar]
- Lu, L.; Sahajwalla, V.; Kong, C.; Harris, D. Quantitative X-ray diffraction analysis and its application to various coals. Carbon 2001, 39, 1821–1833. [Google Scholar] [CrossRef]
- Zou, D.Y.; Zhang, B.H.; Liao, B.H.G.; Chen, C.G. Study of determining the degree of graphitizing of cone with X-ray diffraction method. J. Chongqing Univ. 1988, 6, 88–98. [Google Scholar]
- Duan, K.H.; Cao, Q.Y.; Po, J.J.; Yang, Z.L. Correlation analysis on coke reaction indexing and coke strength after reaction towards degree of graphitization. K. Keji 2009, 32–36. [Google Scholar]
- Rouzaud, J.N.; Duval, B.; Leroy, J. Coke microtexture: One key for coke reactivity. In Fundamental Issues in Control of Carbon Gasification Reactivity; Lahaye, J., Ehrburger, P., Eds.; Springer: Dordrecht, The Netherlands, 1991; pp. 257–267. ISBN 978-94-010-5461-4. [Google Scholar]
- Wu, X.C.; Yang, J.H.; Hu, D.S.; Tang, G.H.; Zhang, Q.; Jiang, W.Z.; Shen, F.L. Processing method of High-Resolution Electron Microscope Image of Coke Crystallite. Chinese Patent Appl. 20051002632, 30 November 2005. [Google Scholar]
- Wu, X.C.; Yang, J.H.; Hu, D.S.; Zhang, Z.; Cao, Y.P.; Cheng, L.Y.; Zhang, Q. A Method to Quantitatively Analyze the Coke Mi-crocrystalline Unit from the High-Resolution Transmission Electron Microscope Image of the Coke. Chinese Patent Appl. 200510110982, 31 May 2005. [Google Scholar]
- Sharma, A.; Kyotani, T.; Tomita, A. Comparison of structural parameters of PF carbon from XRD and HRTEM techniques. Carbon 2000, 38, 1977–1984. [Google Scholar] [CrossRef]
- Sharma, A.; Kyotani, T.; Tomita, A. Quantitative evaluation of structural transformations in raw coals on heat-treatment using HRTEM technique. Fuel 2001, 80, 1467–1473. [Google Scholar] [CrossRef]
- Fortin, F.; Rouzaud, J.-N. Different mechanisms of coke microtexture formation during coking coal carbonization. Fuel 1994, 73, 795–809. [Google Scholar] [CrossRef]
- Coin, C. Coke microtextural description comparison of nomenclature, classification and methods. Fuel 1987, 66, 702–705. [Google Scholar] [CrossRef]
- Sun, W.; Zheng, M.; Cui, P.; Hu, D.; Kan, X. Novel method for coke optical texture measurement and application on coke derived from different ranks of coking coal. Asia-Pac. J. Chem. Eng. 2021, 2021, e2635. [Google Scholar] [CrossRef]
- Wang, J.; He, Y.; Li, H.; Yu, J.; Xie, W.; Wei, H. The molecular structure of Inner Mongolia lignite utilizing XRD, solid state 13C NMR, HRTEM and XPS techniques. Fuel 2017, 203, 764–773. [Google Scholar] [CrossRef]
- Wang, C.; Watson, J.K.; Louw, E.; Mathews, J.P. Construction strategy for atomistic models of coal chars capturing stacking diversity and pore size distribution. Energy Fuels 2015, 29, 4814–4826. [Google Scholar] [CrossRef]
- Zhong, Q.; Mao, Q.; Zhang, L.; Xiang, J.; Xiao, J.; Mathews, J.P. Structural features of Qingdao petroleum coke from HRTEM lattice fringes: Distributions of length, orientation, stacking, curvature, and a large-scale image-guided 3D atomistic representation. Carbon 2017, 129, 790–802. [Google Scholar] [CrossRef]
- G09. Gaussian.com. Available online: https://gaussian.com/glossary/g09/ (accessed on 24 June 2021).
- Justin, W.; Jonathan, M. Fringe 3D. Available online: https://sites.psu.edu/mmsg/research-topic-6/ (accessed on 24 June 2021).
- Packmol-Initial Configurations for Molecular Dynamics. Available online: http://leandro.iqm.unicamp.br/m3g/packmol/home.shtml (accessed on 24 June 2021).
| Publisher’s Note: MDPI stays neutral with regard to jurisdictional claims in published maps and institutional affiliations. |
© 2021 by the authors. Licensee MDPI, Basel, Switzerland. This article is an open access article distributed under the terms and conditions of the Creative Commons Attribution (CC BY) license (https://creativecommons.org/licenses/by/4.0/).


 ,
, 


