Abstract
The applications of polymeric sponges are varied, ranging from cleaning and filtration to medical applications. The specific properties of polymeric foams, such as pore size and connectivity, are dependent on their constituent materials and production methods. Nuclear magnetic resonance imaging (MRI) and X-ray micro-computed tomography (µCT) offer complementary information about the structure and properties of porous media. In this study, we employed MRI, in combination with µCT, to characterize the structure of polymeric open-cell foam, and to determine how it changes upon compression, µCT was used to identify the morphology of the pores within sponge plugs, extracted from polyurethane open-cell sponges. MRI T2 relaxation maps and bulk T2 relaxation times measurements were performed for 7° dH water contained within the same polyurethane foams used for µCT. Magnetic resonance and µCT measurements were conducted on both uncompressed and 60% compressed sponge plugs. Compression was achieved using a graduated sample holder with plunger. A relationship between the average T2 relaxation time and maximum opening was observed, where smaller maximum openings were found to have a shorter T2 relaxation times. It was also found that upon compression, the average maximum opening of pores decreased. Average pore size ranges of 375–632 ± 1 µm, for uncompressed plugs, and 301–473 ± 1 µm, for compressed plugs, were observed. By determining maximum opening values and T2 relaxation times, it was observed that the pore structure varies between sponges within the same production batch, as well as even with a single sponge.
Keywords:
pore size; polyurethane; open-cell foam; T2 relaxation; maximum opening; MRI; µCT; cleaning 1. Introduction
Open-cell foams are porous media with high permeability and high surface-to-volume ratios and can be produced from different polymers, such as polyurethane, polystyrene [1] and polyethylene [2]. Polyurethane (PU) foams are widely used in cleaning [3], filtration [4] and thermal insulation [5]. More recently, polyurethane foams have found applications in medical procedures, such as wound dressing [6], where they have been shown to reduce the risk of nosocomial infection and stimulate soft tissue regrowth [7]. This broad range of applications relies on the properties of these foams, such as high tensile strength [8], high liquid retention [9] and antimicrobial action [10]. Another important property of the PU foams is their compressibility, which is linked to their capacity to absorb fluids and energy, and their ability to recover from compression [11].
A limitation observed in applications of polyurethane foams is that they can exhibit inconsistent behaviour, even between samples from the same production batch, which is associated with variations in structural properties across the foam caused during the production process. Open-cell flexible polyurethane foams are produced by mixing polyol and diisocyanate [12]. Water is added to the mixture to cause the expansion of the foam by the formation of gaseous CO2, which results from the reaction between water and isocyanate [12,13]. Surfactants are often added to promote the nucleation of bubbles and pore cell stabilization, which are essential for the control of pore size and permeability within the foam [14]. During expansion, CO2 gas distributes unevenly within the growing bubbles, causing an anisotropic expansion of cells [15], especially along the axis of expansion. This exothermic reaction leads to variability in pore size, even between sponges produced from the same batch, which results in inconsistent behaviour in these types of foams. Thus, in order to test the performance of PU foams, for a range of applications, it is important to be able to characterise their pore network and relate this to their structure, behaviour and compressibility.
The structure and properties of porous media have been studied extensively using a wide range of techniques, including mercury intrusion porosimetry (MIP) [16], scanning electron microscopy (SEM) [17], X-ray micro computed tomography (µCT) [18,19], nuclear magnetic resonance and magnetic resonance imaging (MRI) [20]. While MIP and SEM are widely used for studying rocks and other solid scaffolds, they have drawbacks when studying flexible or polymeric porous media, such as sponges. In the case of MIP, which is based on the intrusion of mercury within the porous medium [21], the technique requires the application of external pressures up to 108 Pa. The application of such of high pressures can cause sample deformation and compression [22], which leads to inaccuracies in measurements. As a result, MIP is not suitable for flexible foams with porosities higher than 90% [21]. In the case of SEM, it has excellent spatial resolution (50 × 10−9 – 100 × 10−9 m) [23], and has been widely used to analyse the morphological properties of PU foams [24,25,26]. However, samples of PU foams need to be sectioned, which is invasive and can cause edge effects and errors in the measurements [21].
Magnetic resonance (MR) and X-ray µCT are both non-invasive techniques which offer complementary information about the structure and properties of porous media. X-ray µCT is capable of visualizing internal structures within porous objects [18], resulting in 3D images. Image contrast is based on differences in X-ray attenuation coefficient, which depends on both the chemical composition and density of constituent materials. In single-material objects, such as the foams investigated here, the 3D volume can be considered as a distribution of local density. Within certain boundaries, the spatial resolution is largely limited by the discretization of the 3D volume, hence it is restricted by the sample size. Selecting the appropriate resolution for imaging a porous object is a compromise between the pore size and representative element volume for the specific object of interest [27]. From 3D images, it is possible to extract quantitative parameters including density, porosity and pore size [28,29,30]. Recent developments in X-ray µCT have allowed the characterisation of internal and external dimensions in 3D printed parts [31] and the evaluation of flow processes in porous media filled with water and oil [32,33]. While offering valuable opportunities to visualize pore geometries non-invasively, there are several factors which can affect µCT images that are still poorly understood [34]. For instance, the selection of X-ray source is a critical factor, and inappropriate selection can cause the emission of secondary radiation, leading to reduced image contrast and ghost images. Furthermore, a major challenge for studying flow processes in porous media, such as polyurethane foams, is related to the small difference in contrast between fluid and the low-density porous substrate. Hence, there is a need for contrast agents to be added to the fluid [33].
MRI has typically lower spatial resolution than X-ray µCT, usually in the order of 10–5–10−2 m, and probes the 3D structure of a porous medium indirectly, through measurement of the signal of fluid contained within [35,36,37,38]. MRI is able to image the fluid within porous media without the need for additional contrast agents [39]. Moreover, the measurement of NMR relaxation times and diffusion coefficients for fluid within a porous medium is able to provide information on the structure of the pore network, including pore size distribution, porosity and permeability [36,37,38,39]. In particular, T2 NMR relaxation times are influenced by surface relaxation, especially in the presence of paramagnetic ions on the surface of the pore matrix, reduced mobility when molecules temporarily adsorb on to the pore surface [40], and internal magnetic field inhomogeneities (Bi) produced by magnetic susceptibility differences (Δχ) between the solid matrix and fluid [41]. In each of these situations, the T2 relaxation time of fluid within a pore is reduced, compared to bulk fluid, and is sensitive to the size of the pore. Hence, for a given porous medium, it is generally found that the smaller the pore, the shorter the T2 relaxation time. Thus, by knowing the relationship between T2 relaxation time and pore size, it is possible to determine the distribution of pore sizes within a porous medium [42]. In the case of rocks, it is found that the presence of a variety of paramagnetic ions and the large difference in magnetic susceptibility between matrix and fluids leads to a strong correlation between pore size and T2 relaxation time, and this has been extensively studied [43,44,45]. However, no MRI studies using T2 relaxation times have been undertaken to characterise polymeric porous systems. This is because, in contrast to rocks, polymeric porous systems, such as polyurethane foam, do not contain paramagnetic ions, and the difference in magnetic susceptibility between the porous matrix and the fluid within is low.
Flow MRI has been used to characterise the pore structure of PU foams [46] at three different compressions. In this study, the flow of water was used to evaluate the pore structure and hydrodynamics within the 3D pore network in the foam, and how these changed upon compression. However, flow MRI was not able to directly determine, or map, pore sizes, and a pore portioning algorithm was required to characterise the microstructure of the foam and connect this to pore hydrodynamics, while flow MRI has been used on polyurethane sponges,
While these previous studies of PU foams have demonstrated the capability of both MRI and µ-CT to non-invasively characterise pore networks within PU foams, the reported methods are not able to characterise PU foams at speed or in large quantities. Such capabilities are, however, important for understanding how PU foams perform in different applications and, in particular, enable a better understanding of observed inconsistencies in results, which may be linked to variabilities in foam structure. In order to achieve this, it is necessary to develop characterisation methods which do not rely on techniques involving instrumentation found in specialist laboratories or detailed sample-by-sample analysis. It is also important that they can be performed quickly, having the potential for high-throughput analysis, and can provide a direct measure of pore size. One method of this kind, that relies on the use of T2 NMR relaxation times, is well-logging [47], which has been employed in the petrochemical industry to characterise porous rocks in oil-field boreholes. However, in order to determine whether an analogous method can be applied to characterising PU foams, it is first essential to ascertain whether T2 NMR relaxation times are able to characterise these types of samples.
In this study, we investigate the capability of T2 NMR relaxation times to characterise PU foams. High-resolution X-ray µCT of dry foam samples and 1H T2 NMR relaxation time of water, within the same foam samples, were acquired to characterize the structure of open-cell polyurethane foams. These experiments were performed on both uncompressed and 60% compressed samples. Pore size distributions were evaluated, for uncompressed and compressed sponge samples, by X-ray µCT and compared with T2 NMR relaxation times of water, acquired from both MR images and bulk measurements. The relationship between maximum opening, for pores within each foam sample, and 1H T2 NMR relaxation times, for water within the pores, was investigated.
2. Materials and Methods
X-ray µCT and magnetic resonance experiments were conducted on plugs extracted from polyurethane sponges (Spontex, Colombes, France, Batch n° = 7124813). The cylindrical plugs, of diameter 15 mm and height 40 mm, were extracted from three sponges using a 15 mm corkborer (Fisher scientific UK Ltd., Loughborough, UK). Each plug was placed into a 10 mL Terumo® syringe (Terumo®, Binan, Philippines) to position the sponges in the MRI and CT instruments, as well as to control their compression. A plastic disk of 15 mm was also placed in the syringe, at the top of the sponge, as seen in Figure 1, to enable homogeneous compression. Each plug was reproducibly compressed by adjusting the plunger in the syringe to a fixed position, resulting in 60% compression. Care was taken to ensure there was no tilting of the plastic disk during compression, leading to non-uniform compression across the plug. For the magnetic resonance measurements, plugs were saturated with 7° dH water. Air bubbles were removed by submerging the plugs under water and placing them under vacuum for one hour. All data were from the PU foam (blue part of the sponge), and the scouring pad (white part of the sponge) was not included.
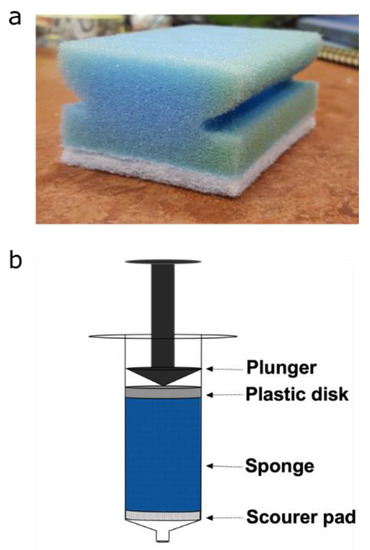
Figure 1.
(a) Photograph of polyurethane sponge. (b) Schematic diagram for the set-up used to hold and compress sponge plugs.
2.1. X-ray Computed Tomography
Data were acquired on the High-Energy CT System Optimized for Research (HECTOR) [48] at the Centre for X-ray Tomography (UGCT) at Ghent University, Belgium. This system consists of an XWT240 X-ray tube (X-ray WorkX, Garbsen, Germany) and a PerkinElmer flat-panel detector. For each scan, 2401 projections, of 1 s exposure time per projection, were acquired over the full 360° rotation. The tube was set at a voltage of 70 kV and a target power of 20 W, with 0.5 mm Al filter on the X-ray source to reduce beam hardening effects. Reconstruction of radiographs was conducted using Octopus reconstruction [49]. The reconstructed data had a voxel size of 40 × 40 × 40 µm3. Octopus analysis [30] was used to evaluate the morphology of each plug. The volume of the sponge plug was segmented by grey-value thresholding to obtain quantitative information. Maximum opening was used as an indirect measure of the size pores (Figure 2), where the maximum opening is defined as the diameter of the biggest sphere that can fit inside that pore. The distributions were normalized for the number of pores in each plug. The 3D rendering of the plugs was made using VGStudio MAX 3.2 (Volume Graphics GmbH, Heidelberg, Germany).
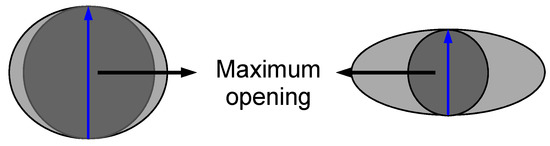
Figure 2.
Schematic diagram showing two different pores and the spheres (dark grey) used to evaluate the maximum opening (blue arrow).
2.2. Magnetic Resonance
Magnetic resonance data were collected on a Bruker Avance III HD spectrometer (Bruker (UK) Ltd, Coventry, UK), equipped with a 7 T vertical wide-bore superconducting magnet, operating at a proton resonance frequency of 300.13 MHz. All experiments were recorded using a micro2.5 imaging probe at 293 ± 0.3 K which was maintained by the temperature of water-cooled gradient coils. 1H MR images were collected using a 25 mm quadrature 1H radio frequency (RF) WB40 birdcage coil. Bulk T2 MR relaxation measurements were collected using a 25 mm 1H/19F radio frequency (RF) WB40 birdcage coil. Sagittal (vertical) two-dimensional (2D) T2 MR relaxation images of water within the plugs were acquired using the spin echo imaging sequence RARE (Rapid Acquisition with Relaxation Enhancement) [50]. Images were recorded using 1 mm slice thickness and a 64 × 128 pixel matrix, with a field of view of 25 mm × 50 mm. T2 MR relaxation maps were produced from eight echo images, with a RARE factor of 128, echo time of 8 ms and repetition time of 15 s. A Carr–Purcell–Meiboom–Gill (CPMG) pulse sequence was employed for bulk T2 measurements, collecting 64 spectra, varying the number of echoes from 0 to 2048, logarithmically spaced, with an echo time of 2 ms and repetition time of 15 s and a spectral width of 100,000 Hz.
All MR data were analysed using the software package Prospa (version 3.1, Magritek, Wellington, New Zealand) [51]. A correction was required for the MR T2 relaxation maps, to compensate for the effects of diffusion, which were found to be sensitive to both the RARE factor and T2 relaxation time of the liquid [52]. Details of the calibration used can be found in Appendix A. Averaged T2 relaxation times were determined from bulk CPMG data by fitting to a single exponential, or where a single exponential would not fit the data, a double exponential. The data were fitted to a minimum number of T2 time constants. T2 relaxation time distributions (G(T2) vs. log(T2)) were determined from the CPMG data using a 1D non-negative least square algorithm (NNLS 1D) [53], where G(T2) is the distribution function with respect to T2. A regulation parameter, α, was used to assess the smoothness of G(T2) [53]. The ideal value of α was estimated by calculating the fit error (χ2) as a function of α. The lowest value of α was chosen before a rapid increase in χ2, which resulted in the narrowest distributions, without introducing spurious peaks from fitting to the noise [54].
2.3. Statistical Analysis
Scatter plots of X-ray µCT maximum opening versus bulk T2 relaxation time, or MRI T2 relaxation time, were created. Linear regression analysis was performed on both sets of data to evaluate the correlation between MR T2 relaxation times and maximum opening. Points with a standard residual close to or lower than −2 were considered as outliers [55]. SPSS version 25 was used for statistical analysis [56], and the statistical significance (p) was set as p < 0.05.
3. Results
Figure 3 shows 3D-rendered X-ray µCT images for a single uncompressed and c, composed of polymeric struts (blue) and void (black). Figure 3b also shows that the compression of the sponge causes some pores to collapse, while others elongate. The change in pore shape can be more easily observed in Figure 3c,d, which show sections of maximum opening for the compressed and uncompressed plug, for a plane through the centre of the sponge. From analysis of the data of the full 3D maximum opening data, it was observed that when evaluating the maximum opening for compressed plugs, the volumes of the smaller pores reduced to almost zero, making it reasonable to claim that there simply is no pore anymore. This is supported by the data shown in Table 1, which reports the number of pores for the uncompressed and compressed plug. Here, the number of pores was found to be lower for the compressed plug.
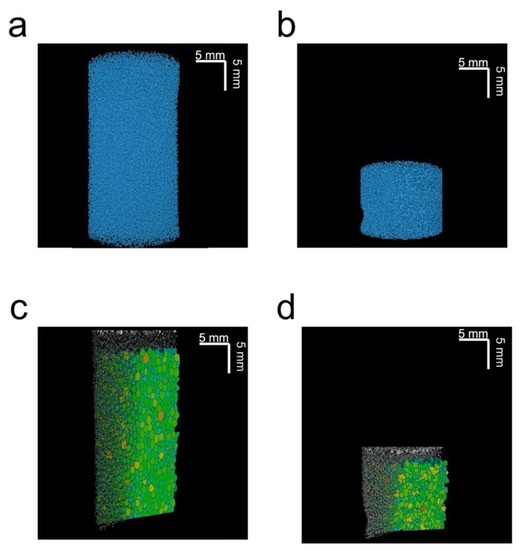
Figure 3.
Three-dimensional µCT renderings of an (a) uncompressed and (b) 60% compressed plug. Three-dimensional renderings of a vertical clipping plane, with the maximum opening distribution for (c) uncompressed and (d) 60% compressed plug. All images are for the same plug.

Table 1.
Total number of pores and average sphericity for an uncompressed and compressed plug from X-ray µCT.
Figure 4 shows T2 relaxation maps for water in the same plug as Figure 3. These images show a decrease in T2 relaxation time when the sponge is compressed (Figure 4a) compared to the uncompressed sponge (Figure 4b).
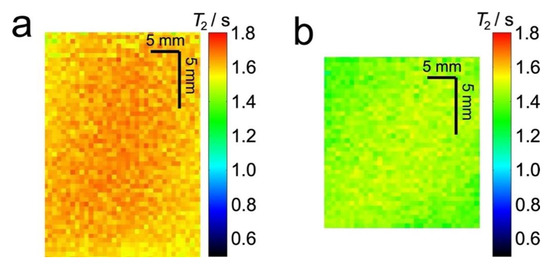
Figure 4.
Extracted sections from 2D 1H MR T2 relaxation maps of 7° dH water in an uncompressed (a) and 60% compressed (b) sponge plug. Both images are for the same plug.
Figure 5 compares the distributions of maximum opening (Figure 5a), determined by X-ray µCT, and T2 relaxation times (Figure 5b,c), determined from MRI and bulk NMR measurements, for the same uncompressed and 60% compressed plug. All three distributions indicate an average smaller maximum opening and shorter T2 relaxation time for compressed sponge plugs compared to uncompressed plugs. The average maximum opening and T2 relaxation times for these distributions are given in Table 2.
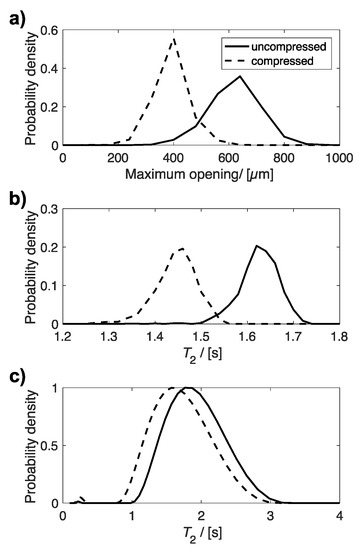
Figure 5.
Plots of the distribution of (a) maximum opening, (b) T2 relaxation time determined from T2 relaxation MR maps, and (c) bulk T2 relaxation time for the same uncompressed and compressed plug.
Table 2.
Average maximum opening from µCT, average MR T2 relaxation time from T2 relaxation MR map and average bulk T2 relaxation time determined from a mono-exponential fit to the CPMG data. The variability in average maximum opening and T2 relaxation time from MR maps, comes from the standard deviation of values across the sample.
Figure 6 compares the distributions of µCT maximum opening (Figure 6a) and T2 MR relaxation times (Figure 6b,c) for two different uncompressed plugs, which were extracted from different sponges within the same batch. The distributions for maximum opening and MRI T2 relaxation times indicate a difference between the two plugs. However, this is not observed in the bulk T2 relaxation time distributions, determined by non-linear least squares analysis. When these data were evaluated by fitting to a single exponential function, only a small difference is observed between the two plugs, with average values of 1.76 (plug 1) and 1.71 s (plug 2) determined. The relationship between average maximum opening with average T2 relaxation time, determined from MRI (Figure 7a) and bulk NMR measurements (Figure 7b), are plotted in Figure 7, for all uncompressed and compressed plugs.

Figure 6.
Plots of the distribution of (a) maximum opening, (b) T2 relaxation time, determined from MR T2 maps, and (c) bulk T2 relaxation times for two different uncompressed plugs.
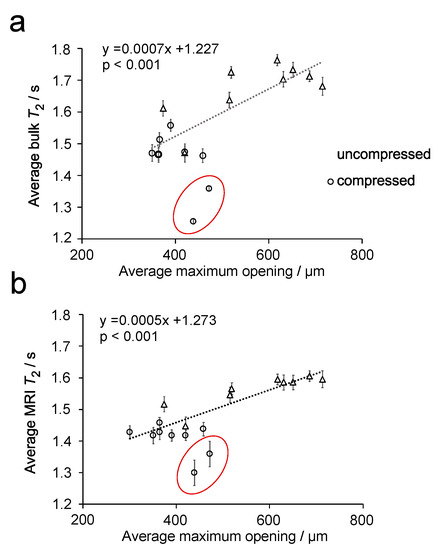
Figure 7.
Plot of the average maximum opening vs. bulk T2 MR relaxation time (a) and average T2 relaxation time determined from T2 relaxation MR maps (b) for 7° dH water in uncompressed and compressed sponge plugs. The dotted lines are a linear fit of the data. Two outlying samples are circled in each plot.
It can be seen that, for both plots in Figure 7, there appears to be a linear relationship between the maximum opening and the T2 relaxation time, where T2 relaxation time decreases with decreasing maximum opening. Statistical analysis of these data finds a p-value < 0.001 for both sets of data, which indicates a correlation between these parameters. In both plots, two outlying points can be observed. Linear regression analysis of these points in Figure 7, using standardized residuals, were found to be ≥−2 for the two outliers in Figure 7a,b. Hence, these points were confirmed as outliers and were not included in the fitting of the data. The outlier points were from two compressed sponge plugs and are believed to be related to a bending of the plug when compressed. This deformation can be observed in Figure 8.
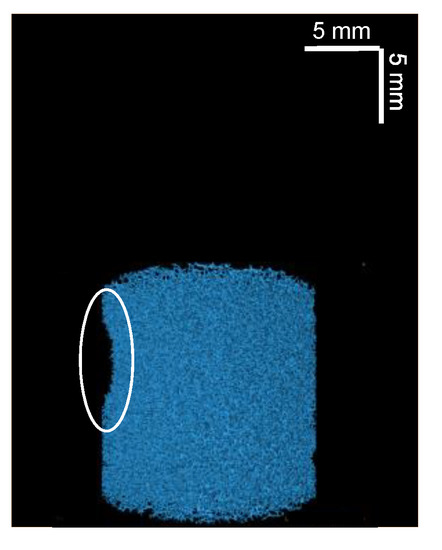
Figure 8.
Three-dimensional µCT reconstructed image of one of the two 60% compressed plugs related to the outlier points in Figure 7. An indentation, caused by a bending of the plug when compressed, is highlighted by a white circle.
4. Discussion
Our results across multiple sponges and compressions reveal a correlation between pore maximum opening and T2 relaxation time for fluid with pores. From close inspection of the X-ray µCT images in Figure 3, it can be observed that, when compressed, some pores collapse while others are elongated. This observation is confirmed by the decrease in the average maximum opening. However, it appears that the maximum opening tends to overestimate the actual real pore size of single pores in compressed plugs. Despite this, maximum opening can still be considered a reliable measure for sponge compression, because it represents a local, rather than a single-pore, characteristic. We found that maximum opening correlates with the T2 relaxation time for fluid within the pore network (Figure 7) and correlates better than pore size (equivalent diameter). This is possibly the case because MRI is not able to distinguish single pores, because of it has lower spatial resolution, compared to X-ray µCT. Thus, T2 relaxation times also represent a local property rather than a single-pore characteristic, which is comparable with maximum opening. While the characterisation of the pores is limited by the resolution, and image processing modalities (segmentation), the resolution at which scans were acquired was sufficient to visualise the pores of the sponge both at uncompressed and 60% compressed conditions.
Comparison of maximum opening values between different foam plugs also revealed a significant variability in pore dimensions between samples within the same production batch, and even within the same sponge. In our experiments, plugs were extracted from three different sponges within the same production batch. The variation in average maximum opening between uncompressed plugs was observed to be 422 ± 79 to 633 ± 97 µm (sponge 1), 375 ± 59 to 688 ± 96 µm (sponge 2) and 520 ± 87 to 716 ± 100 µm (sponge 3). This shows that there is variability in the average maximum opening between sponges. This demonstrated the heterogeneity in pore dimensions within the polyurethane block from which the sponges were cut.
Linear regression analysis of the data in Figure 7 demonstrates a positive linear correlation between bulk and MRI T2 relaxation time (coefficient of determination (R2) = 0.868, p < 0.001 and R2 = 0.915, p < 0.001, respectively), with the maximum opening of the pore. In particular, Figure 7 shows that as the pore decreases in size, there is a corresponding reduction in T2 relaxation time. While this effect has been observed in rock samples, it has not been previously observed in polymeric foams. Moreover, this relationship is found to be much more subtle in PU foams than in rocks, which is to be expected given the lack of paramagnetic species and small difference in magnetic susceptibility.
5. Conclusions
In this paper, we have shown that despite the similar magnetic susceptibilities between water and polyurethane, 1H magnetic resonance measurements of T2 relaxation time are sensitive to pore sizes within PU open-cell foams. Plots of maximum opening, determined by X-ray µCT, vs. T2 MR relaxation time are found to have a linear correlation. We have observed, using both X-ray µCT and MR relaxation times, that when a sponge is compressed, there is a decrease in pore dimensions. This study shows that it is possible to quantify the average pore size distribution directly from NMR T2 relaxation times, which can be mapped using MRI. Moreover, it is also possible to quantify the distribution using NMR bulk measurements, which paves the way for rapid in-line and in operando characterization of foams. These X-ray µCT and MR measurements have also demonstrated that it is possible to characterise the pore dimensions across different sponges, showing the variability resulting from the manufacturing process. We believe that such measurements will be of benefit to those studying the performance and behaviour of polyurethane open-cell foams in a variety of applications, where there is a link between pore size distribution and performance of the sponge or products within the sponge.
Author Contributions
Conceptualization, M.M.B., M.N.B. and V.C.; Methodology, G.M.C., A.S., M.M.B., M.N.B. and V.C.; Validation, G.M.C., A.S., M.M.B., M.N.B. and V.C.; Formal analysis, G.M.C. and A.S.; Investigation, G.M.C. and A.S.; Resources, M.M.B., M.N.B., V.C., E.S.J.R. and A.D.M.B.; Data curation, G.M.C. and A.S.; writing—original draft preparation, G.M.C. and M.M.B.; writing—review and editing, all authors; Visualization, G.M.C., A.S. and M.N.B.; Supervision, M.M.B., M.N.B., V.C., K.B., E.S.J.R. and A.D.M.B.; Project administration, M.M.B., M.N.B., V.C.; K.B., E.S.J.R. and A.D.M.B.; Funding acquisition, E.S.J.R., A.D.M.B., M.M.B., M.N.B., V.C. and K.B. All authors have read and agreed to the published version of the manuscript.
Funding
This research was funded by European Union’s Horizon 2020 research and innovation programme for funding under grant No. 722871 in the scope of the Marie Sklodowska-Curie action ITN BioClean. The Ghent University Special Research Fund (BOF-UGent) is acknowledged for the financial support to the Centre of Expertise UGCT (BOF.EXP.2017.007). The authors also thank the University of Birmingham and the UK Engineering and Physical Science Research Council (EPSRC grant EP/K039245/1) for financial support.
Institutional Review Board Statement
Not applicable.
Informed Consent Statement
Not applicable.
Data Availability Statement
The data generated in this study are available at https://doi.org/10.25500/edata.bham.00000648 (accessed on 21 April 2021).
Acknowledgments
The authors thanks Ivan Josipic, member of UGCT for his assistants in the CT scans.
Conflicts of Interest
The authors declare no conflict of interest.
Appendix A
The T2 of a sample recorded using RARE imaging sequence is generally affected by signal attenuation due to water self-diffusion, which is caused by the application in the read direction of a gradient (gR). Thus, the T2 observed contains a diffusion weighted component that needs to be correct. In order to evaluate the correction factor for each sample, four CuSO4 solutions at known concentrations (0, 1, 2, and 5 M) were been prepared. For the preparation, 7° dH water was used. Each solution was transferred in a 5 mm NMR tube. The NMR relaxation time data and magnetic resonance imaging acquisition parameter used were the same as those used for the study of water in sponge, and can be found in Section 2.3. For each sample, a ratio (R) between the T2 relaxation time obtained from CPMG and RARE was evaluated and plotted against T2. The plot is shown in Figure A1, which highlights that the ratio is not constant but is dependent on the T2 relaxation time.

Figure A1.
Plot of the ratio (R), between the T2 relaxation time obtained from CPMG and RARE experiments, vs. T2 obtained from RARE sequence. The black line represents a linear fit of the data.
Figure A1.
Plot of the ratio (R), between the T2 relaxation time obtained from CPMG and RARE experiments, vs. T2 obtained from RARE sequence. The black line represents a linear fit of the data.

References
- Aubert, J.; Clough, R. Low-density, microcellular polystyrene foams. Polymer 1985, 26, 2047–2054. [Google Scholar] [CrossRef]
- Fossey, D.; Smith, C. Fabrication of Open-Cell Polyethylene Foam. J. Cell. Plast. 1973, 9, 268–273. [Google Scholar] [CrossRef]
- Starry, G.L. Sponge Cleaning Device. U.S. Patent 3,345,669, 10 October 1967. [Google Scholar]
- Ma, Q.; Cheng, H.; Fane, A.G.; Wang, R.; Zhang, H. Recent development of advanced materials with special wettability for selective oil/water separation. Small 2016, 12, 2186–2202. [Google Scholar] [CrossRef]
- Kumaran, M.; Bomberg, M. Thermal performance of sprayed polyurethane foam insulation with alternative blowing agents. J. Therm. Insul. 1990, 14, 43–57. [Google Scholar] [CrossRef]
- Jones, V.; Grey, J.E.; Harding, K.G. Wound dressings. BMJ 2006, 332, 777–780. [Google Scholar] [CrossRef] [PubMed]
- Pollak, A.N. Use of negative pressure wound therapy with reticulated open cell foam for lower extremity trauma. J. Orthop. Trauma 2008, 22, S142–S145. [Google Scholar] [CrossRef] [PubMed]
- Menges, G.; Knipschild, F. Estimation of mechanical properties for rigid polyurethane foams. Polym. Eng. Sci. 1975, 15, 623–627. [Google Scholar] [CrossRef]
- Yong, W.; Jie, L. Use of polyurethane foams complex material to preserve moisture and fertility. Polym. Plast. Technol. Eng. 2007, 46, 943–947. [Google Scholar] [CrossRef]
- Llabres, C.M.; Rose, B.E. Antibacterial properties of retail sponges. J. Food Prot. 1989, 52, 49–50. [Google Scholar] [CrossRef] [PubMed]
- Gong, L.; Kyriakides, S.; Jang, W.-Y. Compressive response of open-cell foams. Part I: Morphology and elastic properties. Int. J. Solids Struct. 2005, 42, 1355–1379. [Google Scholar] [CrossRef]
- Gama, N.V.; Ferreira, A.; Barros-Timmons, A. Polyurethane foams: Past, present, and future. Materials 2018, 11, 1841. [Google Scholar] [CrossRef]
- Ashida, K. Polyurethane and Related Foams: Chemistry and Technology; CRC Press: Boca Raton, FL, USA, 2006. [Google Scholar]
- Lee, S.-T.; Ramesh, N.S. Polymeric Foams: Mechanisms and Materials; CRC Press: Boca Raton, FL, USA, 2004. [Google Scholar]
- Blazejczyk, A. Morphometric Analysis of One-Component Polyurethane Foams Applicable in the Building Sector via X-ray Computed Microtomography. Materials 2018, 11, 1717. [Google Scholar] [CrossRef]
- Van Brakel, J.; Modrý, S.; Svata, M. Mercury porosimetry: State of the art. Powder Technol. 1981, 29, 1–12. [Google Scholar] [CrossRef]
- Ziel, R.; Haus, A.; Tulke, A. Quantification of the pore size distribution (porosity profiles) in microfiltration membranes by SEM, TEM and computer image analysis. J. Membr. Sci. 2008, 323, 241–246. [Google Scholar] [CrossRef]
- Cnudde, V.; Boone, M.N. High-resolution X-ray computed tomography in geosciences: A review of the current technology and applications. Earth Sci. Rev. 2013, 123, 1–17. [Google Scholar] [CrossRef]
- Withers, P.J.; Bouman, C.; Carmignato, S.; Cnudde, V.; Grimaldi, D.; Hagen, C.K.; Maire, E.; Manley, M.; Du Plessis, A.; Stock, S.R. X-ray computed tomography. Nat. Rev. Methods Primers 2021, 1, 18. [Google Scholar] [CrossRef]
- Marica, F.; Chen, Q.; Hamilton, A.; Hall, C.; Al, T.; Balcom, B. Spatially resolved measurement of rock core porosity. J. Magn. Reson. 2006, 178, 136–141. [Google Scholar] [CrossRef] [PubMed]
- Ho, S.T.; Hutmacher, D.W. A comparison of micro CT with other techniques used in the characterization of scaffolds. Biomaterials 2006, 27, 1362–1376. [Google Scholar] [CrossRef]
- Yao, Y.; Liu, D. Comparison of low-field NMR and mercury intrusion porosimetry in characterizing pore size distributions of coals. Fuel 2012, 95, 152–158. [Google Scholar] [CrossRef]
- Swapp, S. Scanning Electron Microscopy. Available online: https://serc.carleton.edu/research_education/geochemsheets/techniques/SEM.html (accessed on 10 July 2020).
- Bang, S.S.; Galinat, J.K.; Ramakrishnan, V. Calcite precipitation induced by polyurethane-immobilized Bacillus pasteurii. Enzyme Microb. Technol. 2001, 28, 404–409. [Google Scholar] [CrossRef]
- Wu, D.; Wu, W.; Yu, Z.; Zhang, C.; Zhu, H. Facile preparation and characterization of modified polyurethane sponge for oil absorption. Ind. Eng. Chem. Res. 2014, 53, 20139–20144. [Google Scholar] [CrossRef]
- Souza, D.A.d.; Araujo, D.M.d.; Carvalho, C.d.F.; Yoshida, M.I. Physico-chemical analysis of flexible polyurethane foams containing commercial calcium carbonate. Mater. Res. 2008, 11, 433–438. [Google Scholar]
- Peng, S.; Hu, Q.; Dultz, S.; Zhang, M. Using X-ray computed tomography in pore structure characterization for a Berea sandstone: Resolution effect. J. Hydrol. 2012, 472, 254–261. [Google Scholar] [CrossRef]
- Maire, E.; Withers, P.J. Quantitative X-ray tomography. Int. Mater. Rev. 2014, 59, 1–43. [Google Scholar] [CrossRef]
- Long, H.; Swennen, R.; Foubert, A.; Dierick, M.; Jacobs, P. 3D quantification of mineral components and porosity distribution in Westphalian C sandstone by microfocus X-ray computed tomography. Sediment. Geol. 2009, 220, 116–125. [Google Scholar] [CrossRef]
- Brabant, L.; Vlassenbroeck, J.; De Witte, Y.; Cnudde, V.; Boone, M.N.; Dewanckele, J.; Van Hoorebeke, L. Three-dimensional analysis of high-resolution X-ray computed tomography data with Morpho+. Microsc. Microanal. 2011, 17, 252–263. [Google Scholar] [CrossRef]
- Khosravani, M.R.; Reinicke, T. On the Use of X-ray Computed Tomography in Assessment of 3D-Printed Components. J. Nondestr. Eval. 2020, 39, 1–17. [Google Scholar] [CrossRef]
- Shastry, A.; Palacio-Mancheno, P.; Braeckman, K.; Vanheule, S.; Josipovic, I.; Van Assche, F.; Robles, E.; Cnudde, V.; Van Hoorebeke, L.; Boone, M. In-Situ High Resolution Dynamic X-ray Microtomographic Imaging of Olive Oil Removal in Kitchen Sponges by Squeezing and Rinsing. Materials 2018, 11, 1482. [Google Scholar] [CrossRef]
- Bultreys, T.; Boone, M.A.; Boone, M.N.; De Schryver, T.; Masschaele, B.; Van Hoorebeke, L.; Cnudde, V. Fast laboratory-based micro-computed tomography for pore-scale research: Illustrative experiments and perspectives on the future. Adv. Water Resour. 2016, 95, 341–351. [Google Scholar] [CrossRef]
- Flay, N.; Brown, S.; Sun, W.; Blumensath, T.; Su, R. Effects of off-focal radiation on dimensional measurements in industrial cone-beam micro-focus X-ray computed tomography systems. Precis. Eng. 2020, 66, 472–481. [Google Scholar] [CrossRef]
- Borgia, G.; Bortolotti, V.; Fantazzini, P. Changes of the local pore space structure quantified in heterogeneous porous media by 1 H magnetic resonance relaxation tomography. J. Appl. Phys. 2001, 90, 1155–1163. [Google Scholar] [CrossRef]
- Attard, J.; Carpenter, T.; Hall, L.; Davies, S.; Taylor, M.; Packer, K. Spatially resolved T1 relaxation measurements in reservoir cores. Magn. Reson. Imaging 1991, 9, 815–819. [Google Scholar] [CrossRef]
- Guillot, G.; Chardaire-Rivière, C.; Bobroff, S.; Le Roux, A.; Roussel, J.; Cuiec, L. Characterisation of wetting heterogeneities in sandstone rocks by MRI. Magn. Reson. Imaging 1994, 12, 365–368. [Google Scholar] [CrossRef]
- Merrill, M. Porosity measurements in natural porous rocks using magnetic resonance imaging. Appl. Magn. Reson. 1993, 5, 307–321. [Google Scholar] [CrossRef]
- Britton, M.M. Porous Media Studied by MRI. eMagRes 2011. [Google Scholar] [CrossRef]
- Watson, A.T.; Chang, C.P. Characterizing porous media with NMR methods. Prog. Nucl. Magn. Res. Sp. 1997, 31, 343–386. [Google Scholar] [CrossRef]
- Hürlimann, M.D. Effective gradients in porous media due to susceptibility differences. J. Magn. Reson. 1998, 131, 232–240. [Google Scholar] [CrossRef]
- Stingaciu, L.; Weihermüller, L.; Haber-Pohlmeier, S.; Stapf, S.; Vereecken, H.; Pohlmeier, A. Determination of pore size distribution and hydraulic properties using nuclear magnetic resonance relaxometry: A comparative study of laboratory methods. Water Resour. Res. 2010, 46. [Google Scholar] [CrossRef]
- Wang, R.; Pavlin, T.; Rosen, M.S.; Mair, R.W.; Cory, D.G.; Walsworth, R.L. Xenon NMR measurements of permeability and tortuosity in reservoir rocks. Magn. Reson. Imaging 2005, 23, 329–331. [Google Scholar] [CrossRef]
- Schoenfelder, W.; Gläser, H.-R.; Mitreiter, I.; Stallmach, F. Two-dimensional NMR relaxometry study of pore space characteristics of carbonate rocks from a Permian aquifer. J. Appl. Geophys. 2008, 65, 21–29. [Google Scholar] [CrossRef]
- Washburn, K.E.; Madelin, G. Imaging of multiphase fluid saturation within a porous material via sodium NMR. J. Magn. Reson. 2010, 202, 122–126. [Google Scholar] [CrossRef]
- Von Der Schulenburg, D.G.; Paterson-Beedle, M.; Macaskie, L.; Gladden, L.; Johns, M. Flow through an evolving porous media—Compressed foam. J. Mater. Sci. 2007, 42, 6541–6548. [Google Scholar] [CrossRef]
- Kleinberg, R.L. NMR well logging at Schlumberger. Concept. Magn. Reson. 2001, 13, 396–403. [Google Scholar] [CrossRef]
- Masschaele, B.; Dierick, M.; Van Loo, D.; Boone, M.N.; Brabant, L.; Pauwels, E.; Cnudde, V.; Van Hoorebeke, L. HECTOR: A 240kV micro-CT setup optimized for research. J. Phys. Conf. Ser. 2013, 463, 012012. [Google Scholar] [CrossRef]
- Vlassenbroeck, J.; Dierick, M.; Masschaele, B.; Cnudde, V.; Van Hoorebeke, L.; Jacobs, P. Software tools for quantification of X-ray microtomography at the UGCT. Nucl. Instrum. Methods Phys. Res. B 2007, 580, 442–445. [Google Scholar] [CrossRef]
- Hennig, J.; Nauerth, A.; Friedburg, H. RARE imaging: A fast imaging method for clinical MR. Magn. Reson. Med. 1986, 3, 823–833. [Google Scholar] [CrossRef] [PubMed]
- Prospa, Magritek, Wellington, New Zealand. Available online: https://magritek.com/resources/faq/ (accessed on 19 July 2020).
- Bray, J.M.; Davenport, A.J.; Ryder, K.S.; Britton, M.M. Quantitative, In Situ Visualization of Metal-Ion Dissolution and Transport Using 1H Magnetic Resonance Imaging. Angew. Chem. Int. Ed. 2016, 55, 9394–9397. [Google Scholar] [CrossRef]
- Provencher, S.W. A constrained regularization method for inverting data represented by linear algebraic or integral equations. Comput. Phys. Commun. 1982, 27, 213–227. [Google Scholar] [CrossRef]
- Law, S.J.; Britton, M.M. Sizing of reverse micelles in microemulsions using NMR measurements of diffusion. Langmuir 2012, 28, 11699–11706. [Google Scholar] [CrossRef]
- Serdahl, E. An Introduction to Graphical Analysis of Residual Scores and Outlier Detection in Bivariate Least Squares Regression Analysis. Eric 1996, ED395949, 29. [Google Scholar]
- IBM Corp. IBM SPSS Statistics for Macintosh, 25.0; IBM Corp: Armonk, NY, USA, 2017. [Google Scholar]


Publisher’s Note: MDPI stays neutral with regard to jurisdictional claims in published maps and institutional affiliations. |
© 2021 by the authors. Licensee MDPI, Basel, Switzerland. This article is an open access article distributed under the terms and conditions of the Creative Commons Attribution (CC BY) license (https://creativecommons.org/licenses/by/4.0/).