1. Introduction
Multi-scale computational models for nonlinear or time-dependent mechanics problems can usually be classified as concurrent or sequential. In concurrent approaches, solutions to boundary value problems at fine and coarse scales are obtained near-simultaneously, where transient feedback from the solution at the fine scale informs the solution at the coarse scale, and vice versa, as a simulation proceeds. In contrast, and simpler by construction, sequential approaches address the system’s response at different length and/or time scales consecutively, where most often, the fine-scale solution is used to provide properties or conditions invoked subsequently to establish or solve the coarse-scale problem. References encompassing both classes of approaches include [
1,
2,
3]. A sequential multi-scale approach is used herein for modeling fracture, whereby failure properties of grain boundaries (GBs) are obtained at the fine scale via molecular dynamics (MD) simulations. These properties, namely distributions of fracture surface energies for different boundary compositions and orientations, then enter a coarse-scale representation of fracture of polycrystalline aggregates in the context of a continuum phase field model [
4]. Prior works that have invoked atomistic simulations (e.g, MD or density functional theory (DFT)) to inform phase field models, via prescription of properties or functional forms of phase field energy potentials, include [
5,
6,
7,
8,
9].
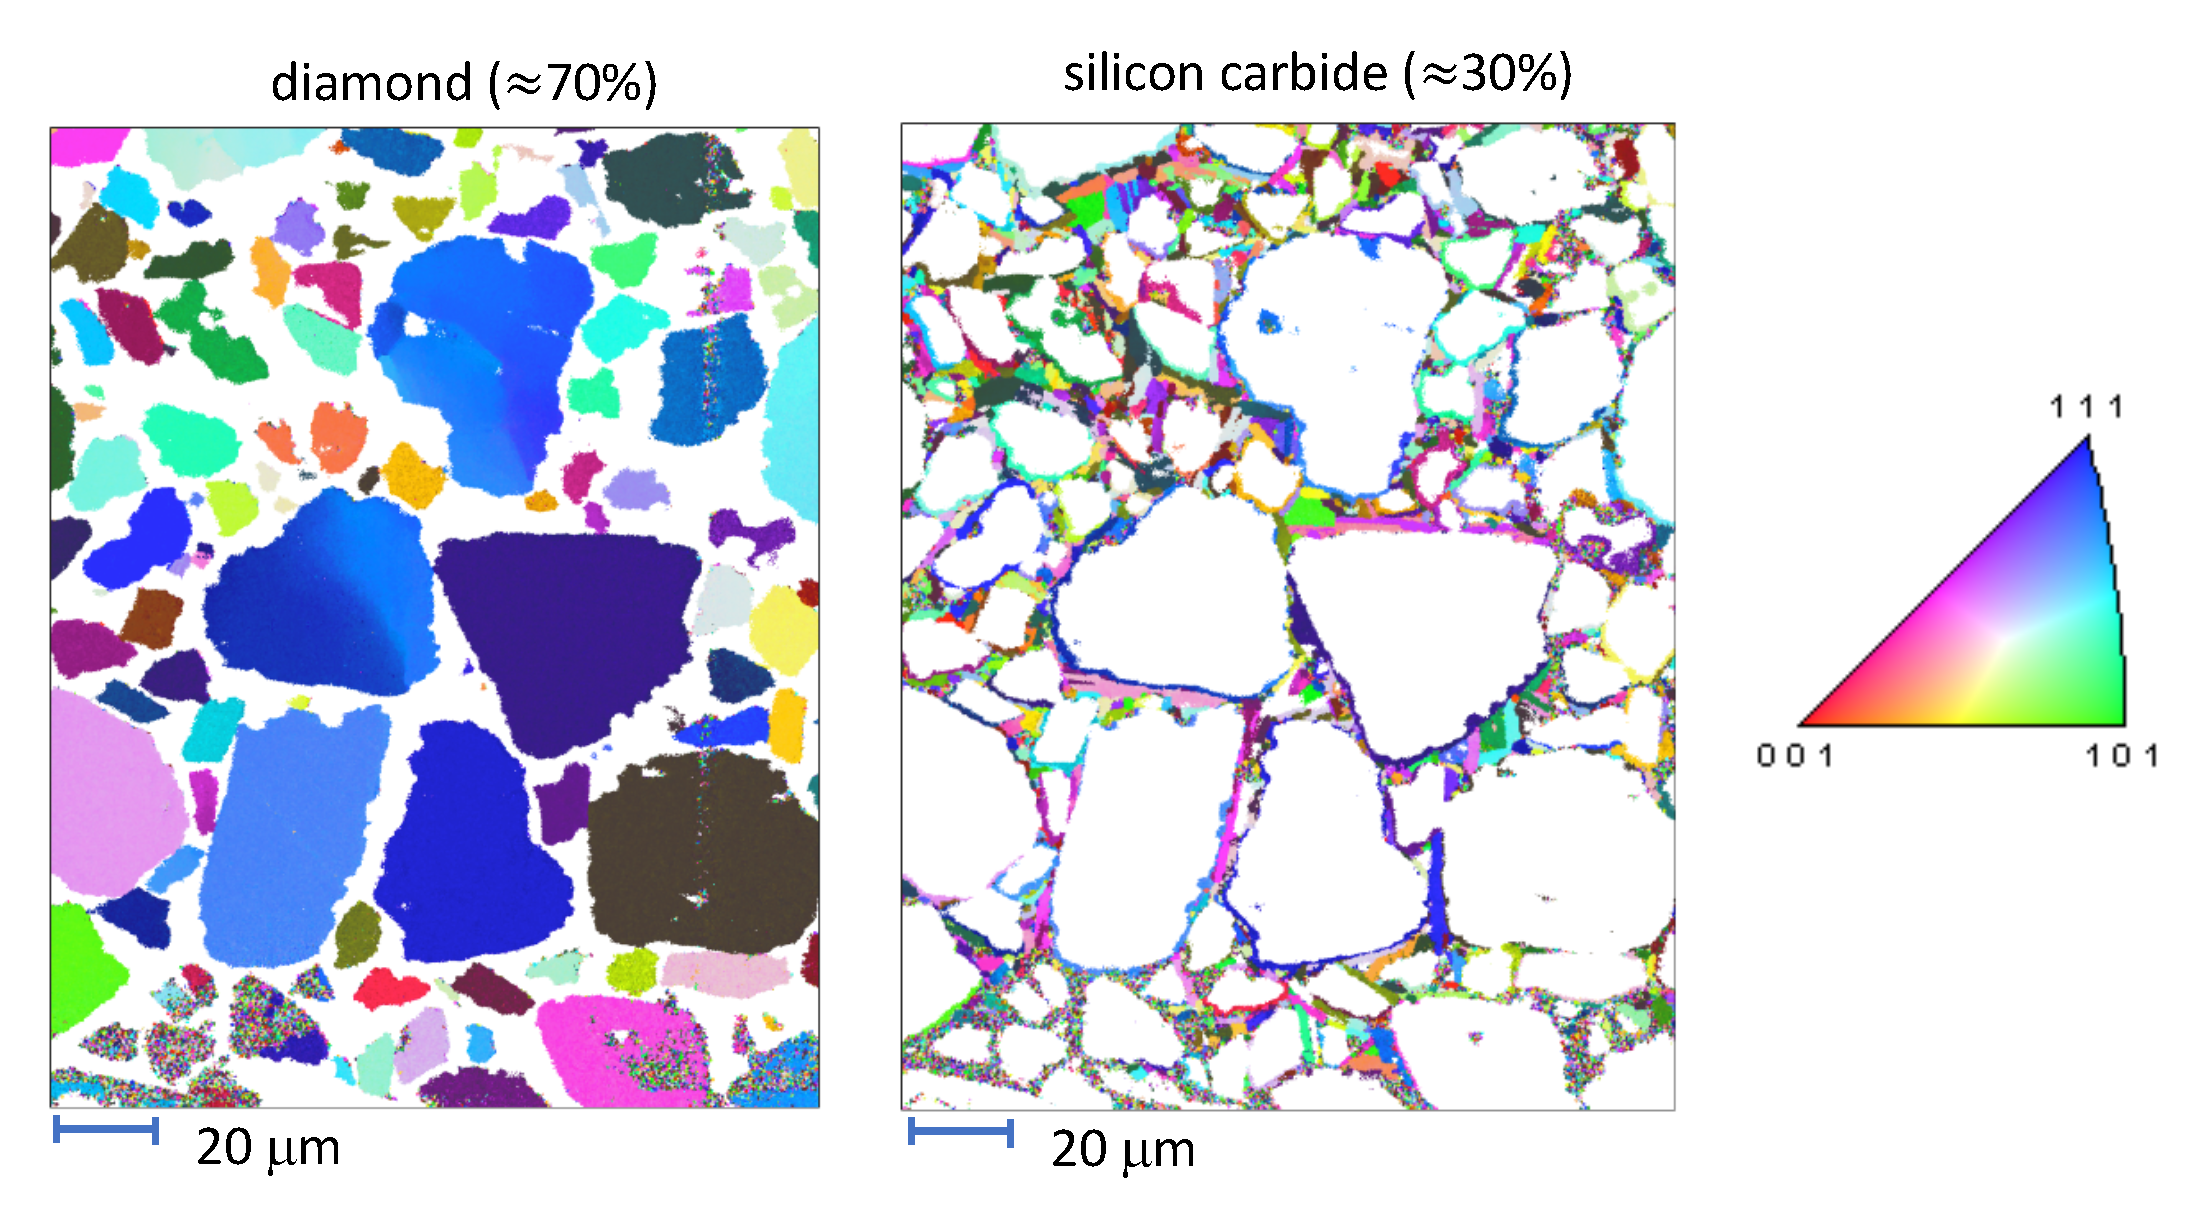
The aim of the present paper is an enhanced understanding of deformation and failure mechanisms in an ultra-hard dual-phase ceramic composite. The material consists of diamond and silicon carbide (SiC) crystals with complex spatial and size distributions of grains. Representative microstructures and processing routes for this material system can be found in [
10,
11,
12,
13,
14,
15]. In the material studied herein, disparities exist in typical grain sizes among the primary (diamond) and secondary (SiC) phases, with diamond grains tending to be at least an order of magnitude larger, with mean sizes in tens of microns. Furthermore, nanocrystalline SiC encases larger grains, and defects such as pores and graphitic inclusions may be present [
14,
15]. When graphitic layers at diamond-SiC interfaces are abundant, indentation hardness is compromised [
16]. Reduced stiffness, hardness, and/or fracture toughness due to graphite have also been reported for nanocrystalline diamond [
17,
18] and SiC [
19]. Somewhat contrary to other observations, fracture toughness measured by an indentation technique was thought to increase from graphitic GB layers due to plasticity, phase transformations, and/or GB sliding mechanisms [
19].
Both crystalline phases are cubic, where the most common polytype of diamond exists in concert with the
phase of SiC, which is prone to deformation twinning [
20]. Although diamond is the stiffest and hardest natural material, it is brittle and prone to cleavage failure [
21,
22]. The SiC phase is intended to increase toughness and ductility, through a variety of crack mitigation mechanisms that have been sought in diamond-based materials via microstructure alterations [
22]. During material production, the SiC phase can infiltrate GB regions, producing lower overall porosity, graphite content, and fewer debonded diamond-diamond particle contacts than would be present in polycrystalline diamond alone [
11,
14,
16].
The theoretical phase field component of this paper most closely follows recent work in [
23]. In that work, a methodology for approximating effects of graphitic inclusions and pores too small to resolve discretely in the phase field continuum was introduced, via assignment of special properties in affected regions. An idealized synthetic microstructure was studied, not directly culled from microscopy or diffraction data. Fracture energies were limited to cleavage on lowest-energy planes in each crystal phase, since sufficient information on GB energies was not available for the diamond-SiC material system. Even more limited in scope were initial studies of diamond-SiC blends in [
24,
25]. In all cases [
23,
24,
25], idealized 3D polycrystalline microstructures were represented from Voronoi polyhedra, and lattice misorientation effects on GB properties were ignored. A standard variational phase field theory was used in [
24], with theoretical origins in [
26,
27]. In [
25], a geometrically enriched theory was used, with origins in [
28,
29,
30]).
The current work prominently extends these prior studies. New features addressed herein, with all new simulation results, include the following:
Realistically rendered microstructures (i.e., meshes) constructed from diffraction data on real diamond-SiC samples;
Heterogeneous distributions of GB fracture properties obtained from molecular dynamics (MD) simulations, with probed orientation distributions based on electron backscatter diffraction (EBSD) characterization;
Superposition of GB fracture energy distributions obtained from MD with effects of defects, including subscale graphitic inclusions and initial porosity, from elastic homogenization;
Systematic variations of phase content and scale-dependent properties (e.g., bulk microcrystals versus nanocrystalline matrix).
Results then inform structure-property-performance metrics, with an emphasis on ultimate strength and ductility of polycrystalline aggregates. Knowledge can then suggest those failure-resistant microstructures to be targeted for synthesis in future processing routes.
The outline of the remainder of this paper is as follows. Phase field representations for bulk crystals (i.e., diamond and SiC) are described in
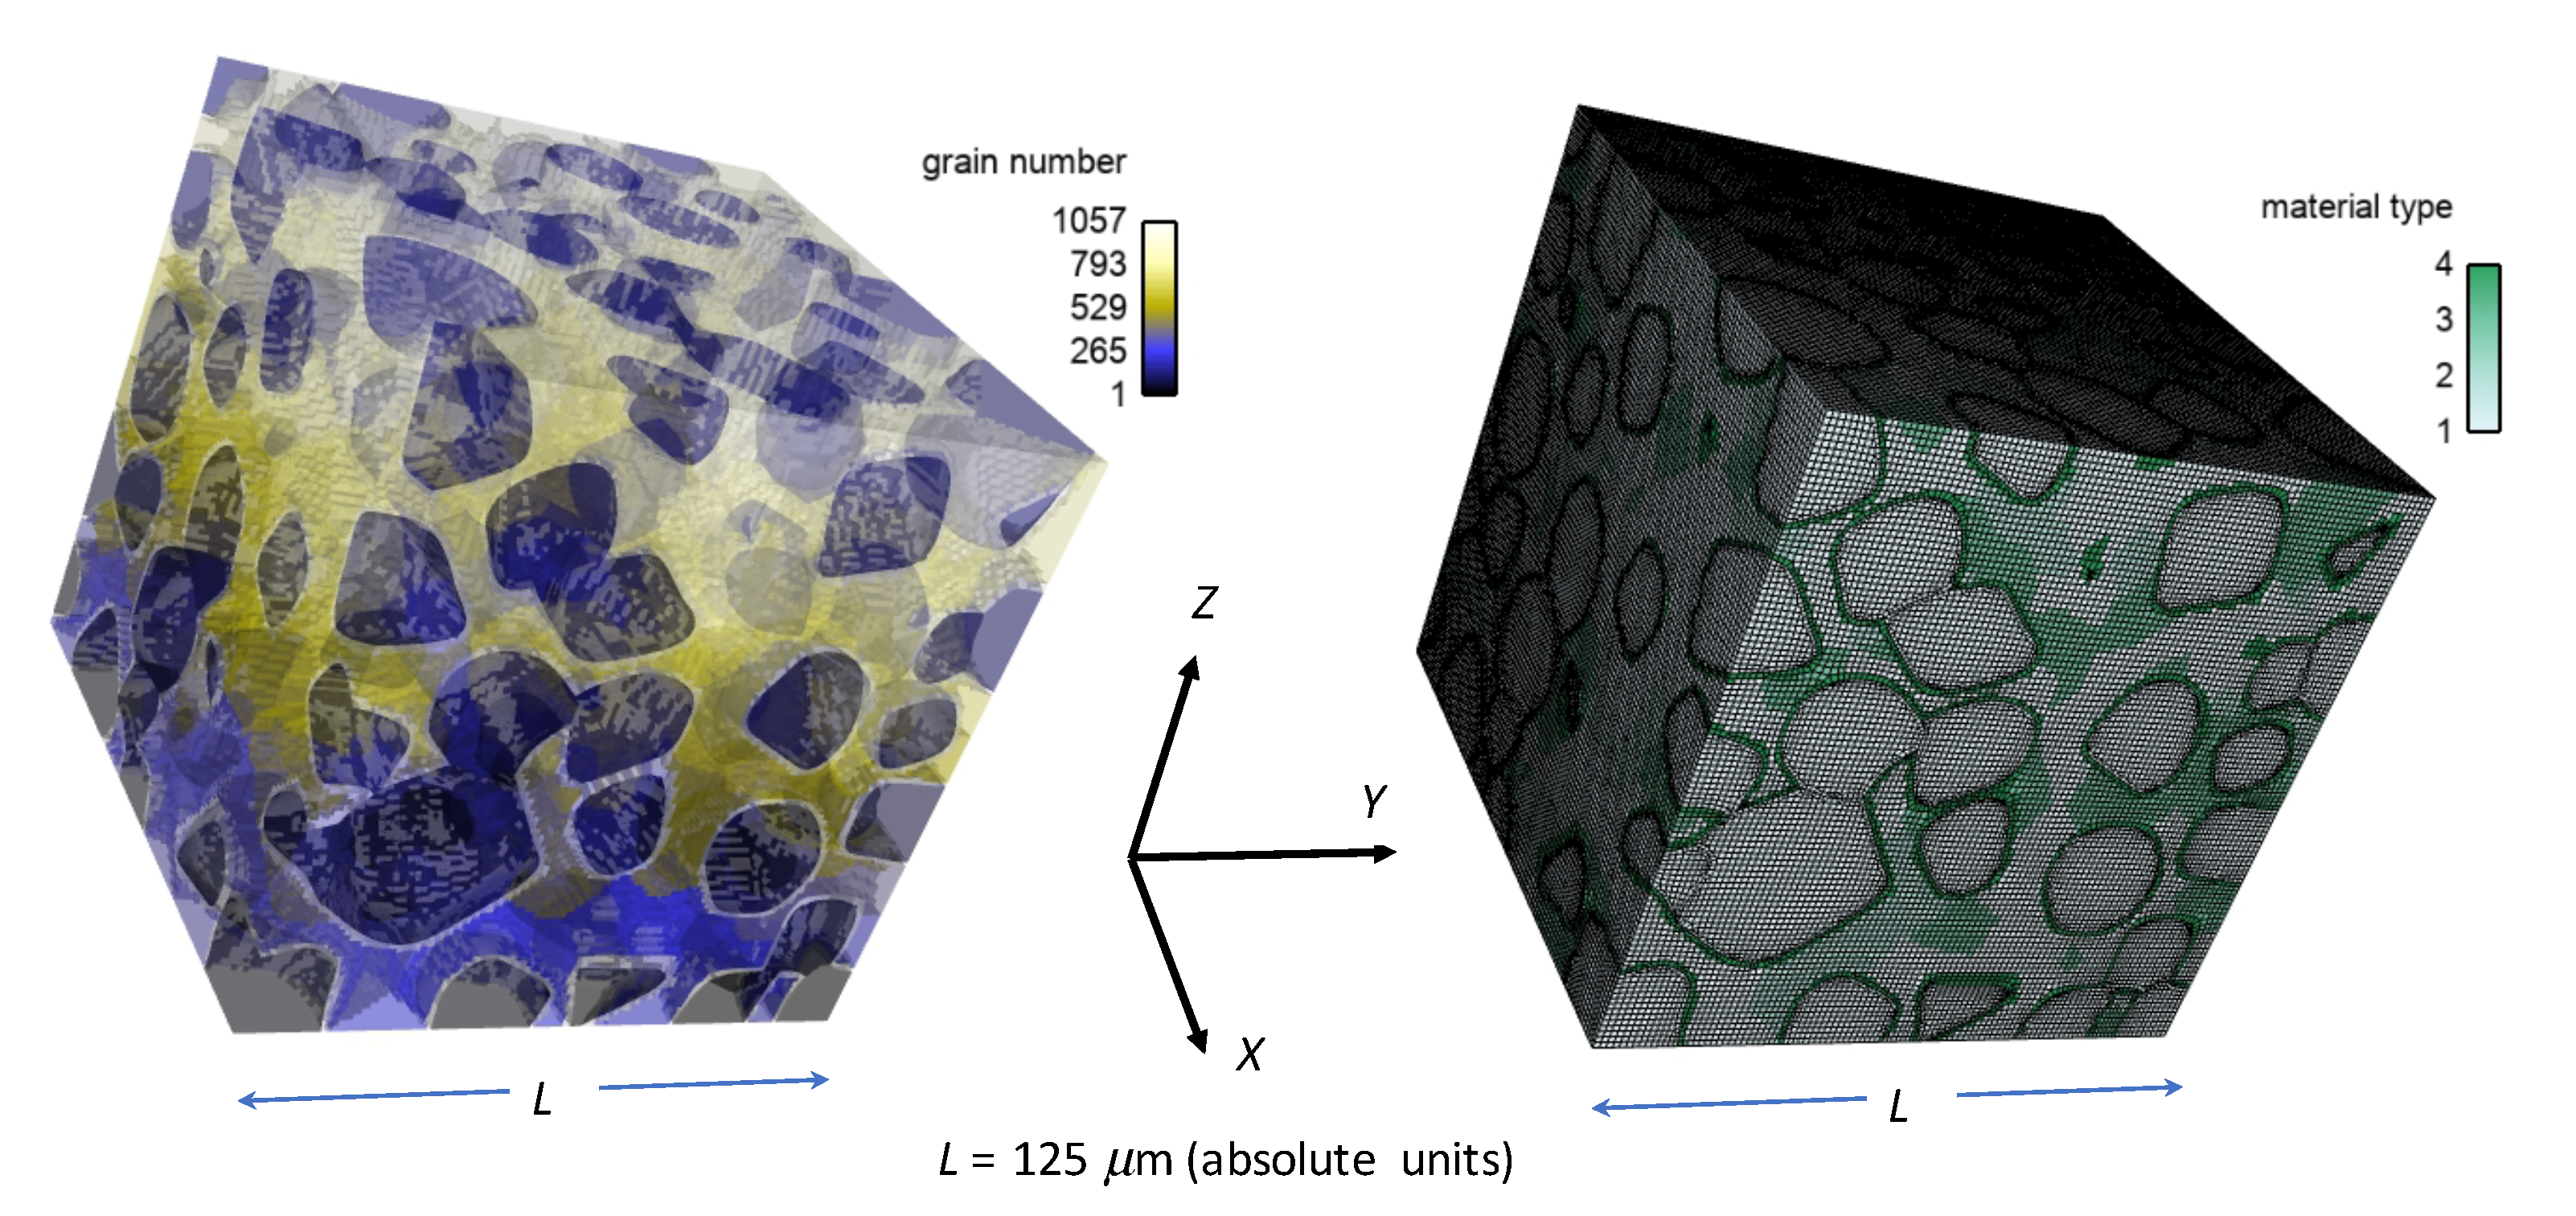
Section 2. Generation, from experimental data, of physically realistic microstructures is discussed in
Section 3, along with material properties. Each subsequent section builds on the former, whereby additional physics are incorporated sequentially, leading to a more comprehensive, albeit more complex, model at each stage. Results of phase field simulations describing effects of bulk phase volume fractions and lattice orientations, with uniform fracture energies among grains of a given type or GB composition, are given in
Section 4. Molecular dynamics simulations of GBs in
-SiC and diamond-SiC bicrystals that provide surface energy distributions entering the phase field fracture model are discussed in
Section 5. Results of phase field simulations describing effects of heterogeneous GB fracture energy distributions are presented in
Section 6. A homogenization approach to account for porosity and tertiary phases in matrix material is reviewed in
Section 7. Results on effects of subscale porosity and graphitic inclusions, superposed on heterogeneous GB energies, follow in
Section 8. Lastly, conclusions are given in
Section 9. Vectors and higher-order tensors are written in bold-italic font, scalars in italic. Summation is implied over repeated indices in a fixed Cartesian frame when index notation is used.
4. Phase Field Results: Bulk and Layer Composition Effects
Simulations listed in
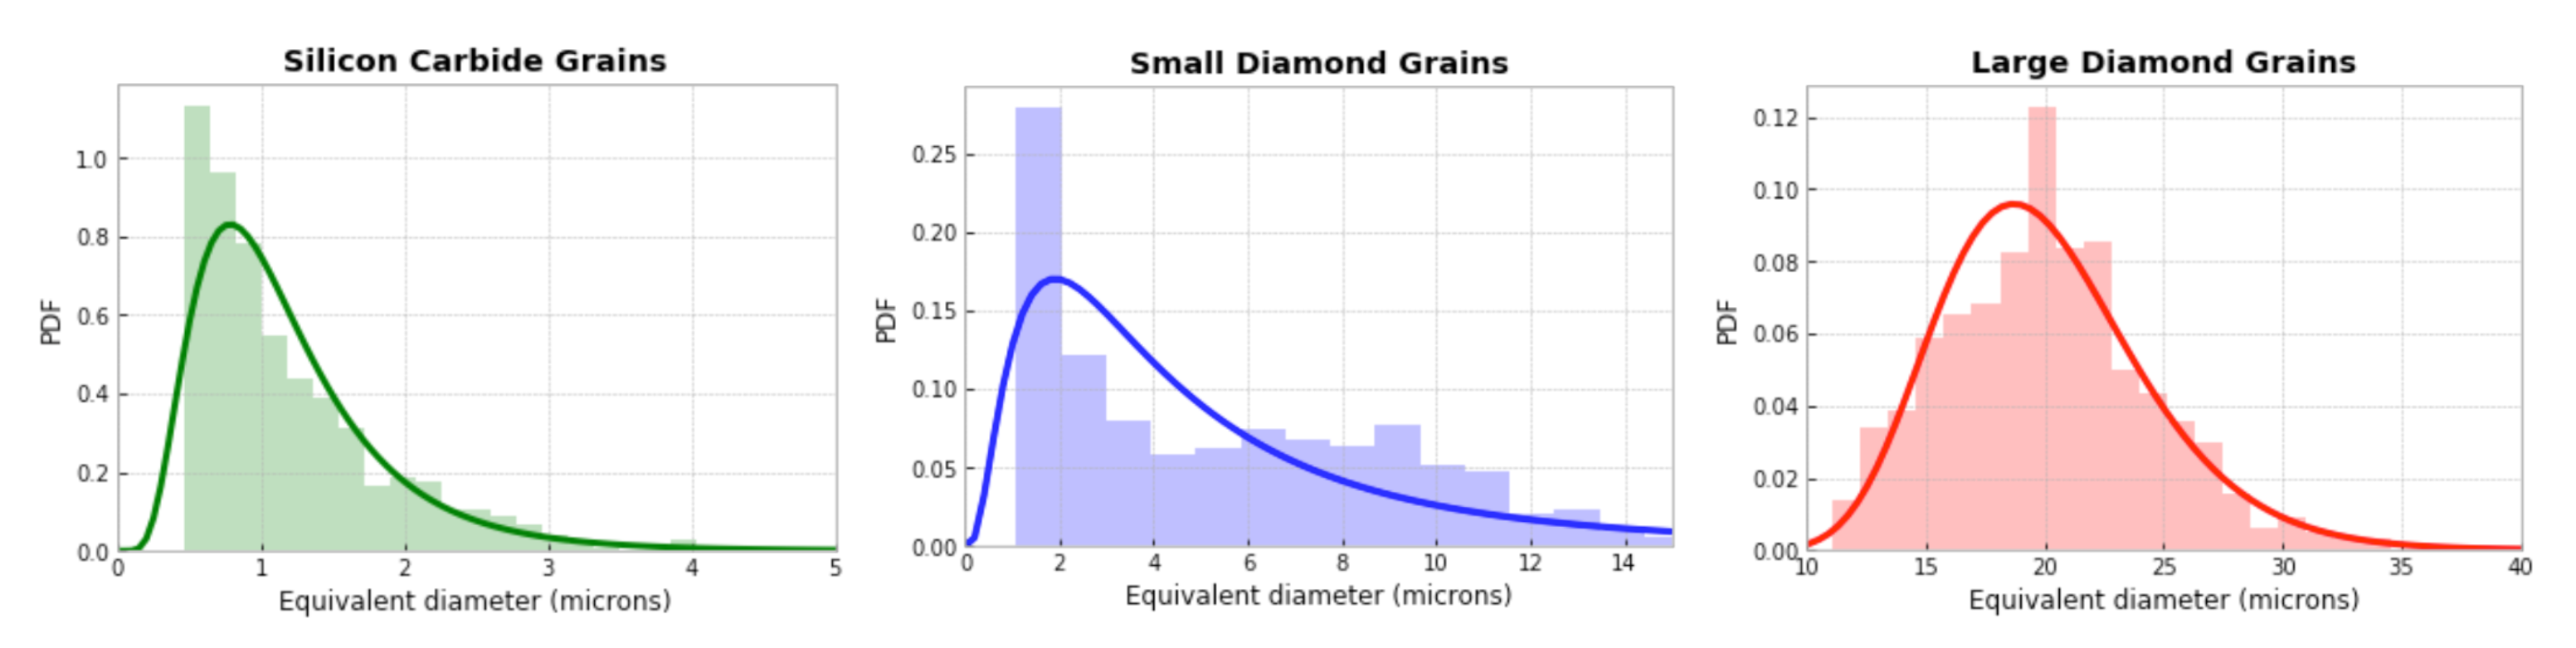
Table 2 consider different phase content among bulk grains, matrix regions, and GB layers encasing 170 diamond grains with average size of 20.5 µm, as explained in
Section 3.2. The 70% diamond fraction corresponds to the experimental sample, while the 39.4% diamond fraction is an excursion to investigate the response of a material with less diamond [
13]. Partitioning of SiC into 9.4% grains and 9.0% matrix is likewise consistent with the real sample, while other choices are excursions that are convenient based on mesh geometry. The 11.6% layer volume fraction is necessitated by mesh resolution, since a finer mesh would be required to resolve a much thinner layer. The default material for this layer is SiC, based on the real sample, but graphite and diamond layers are also studied to obtain further understanding, since these have been observed in other diamond-SiC materials [
12,
14,
16]. Effects of these different compositions on local and global mechanical behaviors are revealed in what follows next. Displacement boundary conditions are imposed in terms of normal strain
, defined in (
31), acting in the global
X,
Y, or
Z direction.
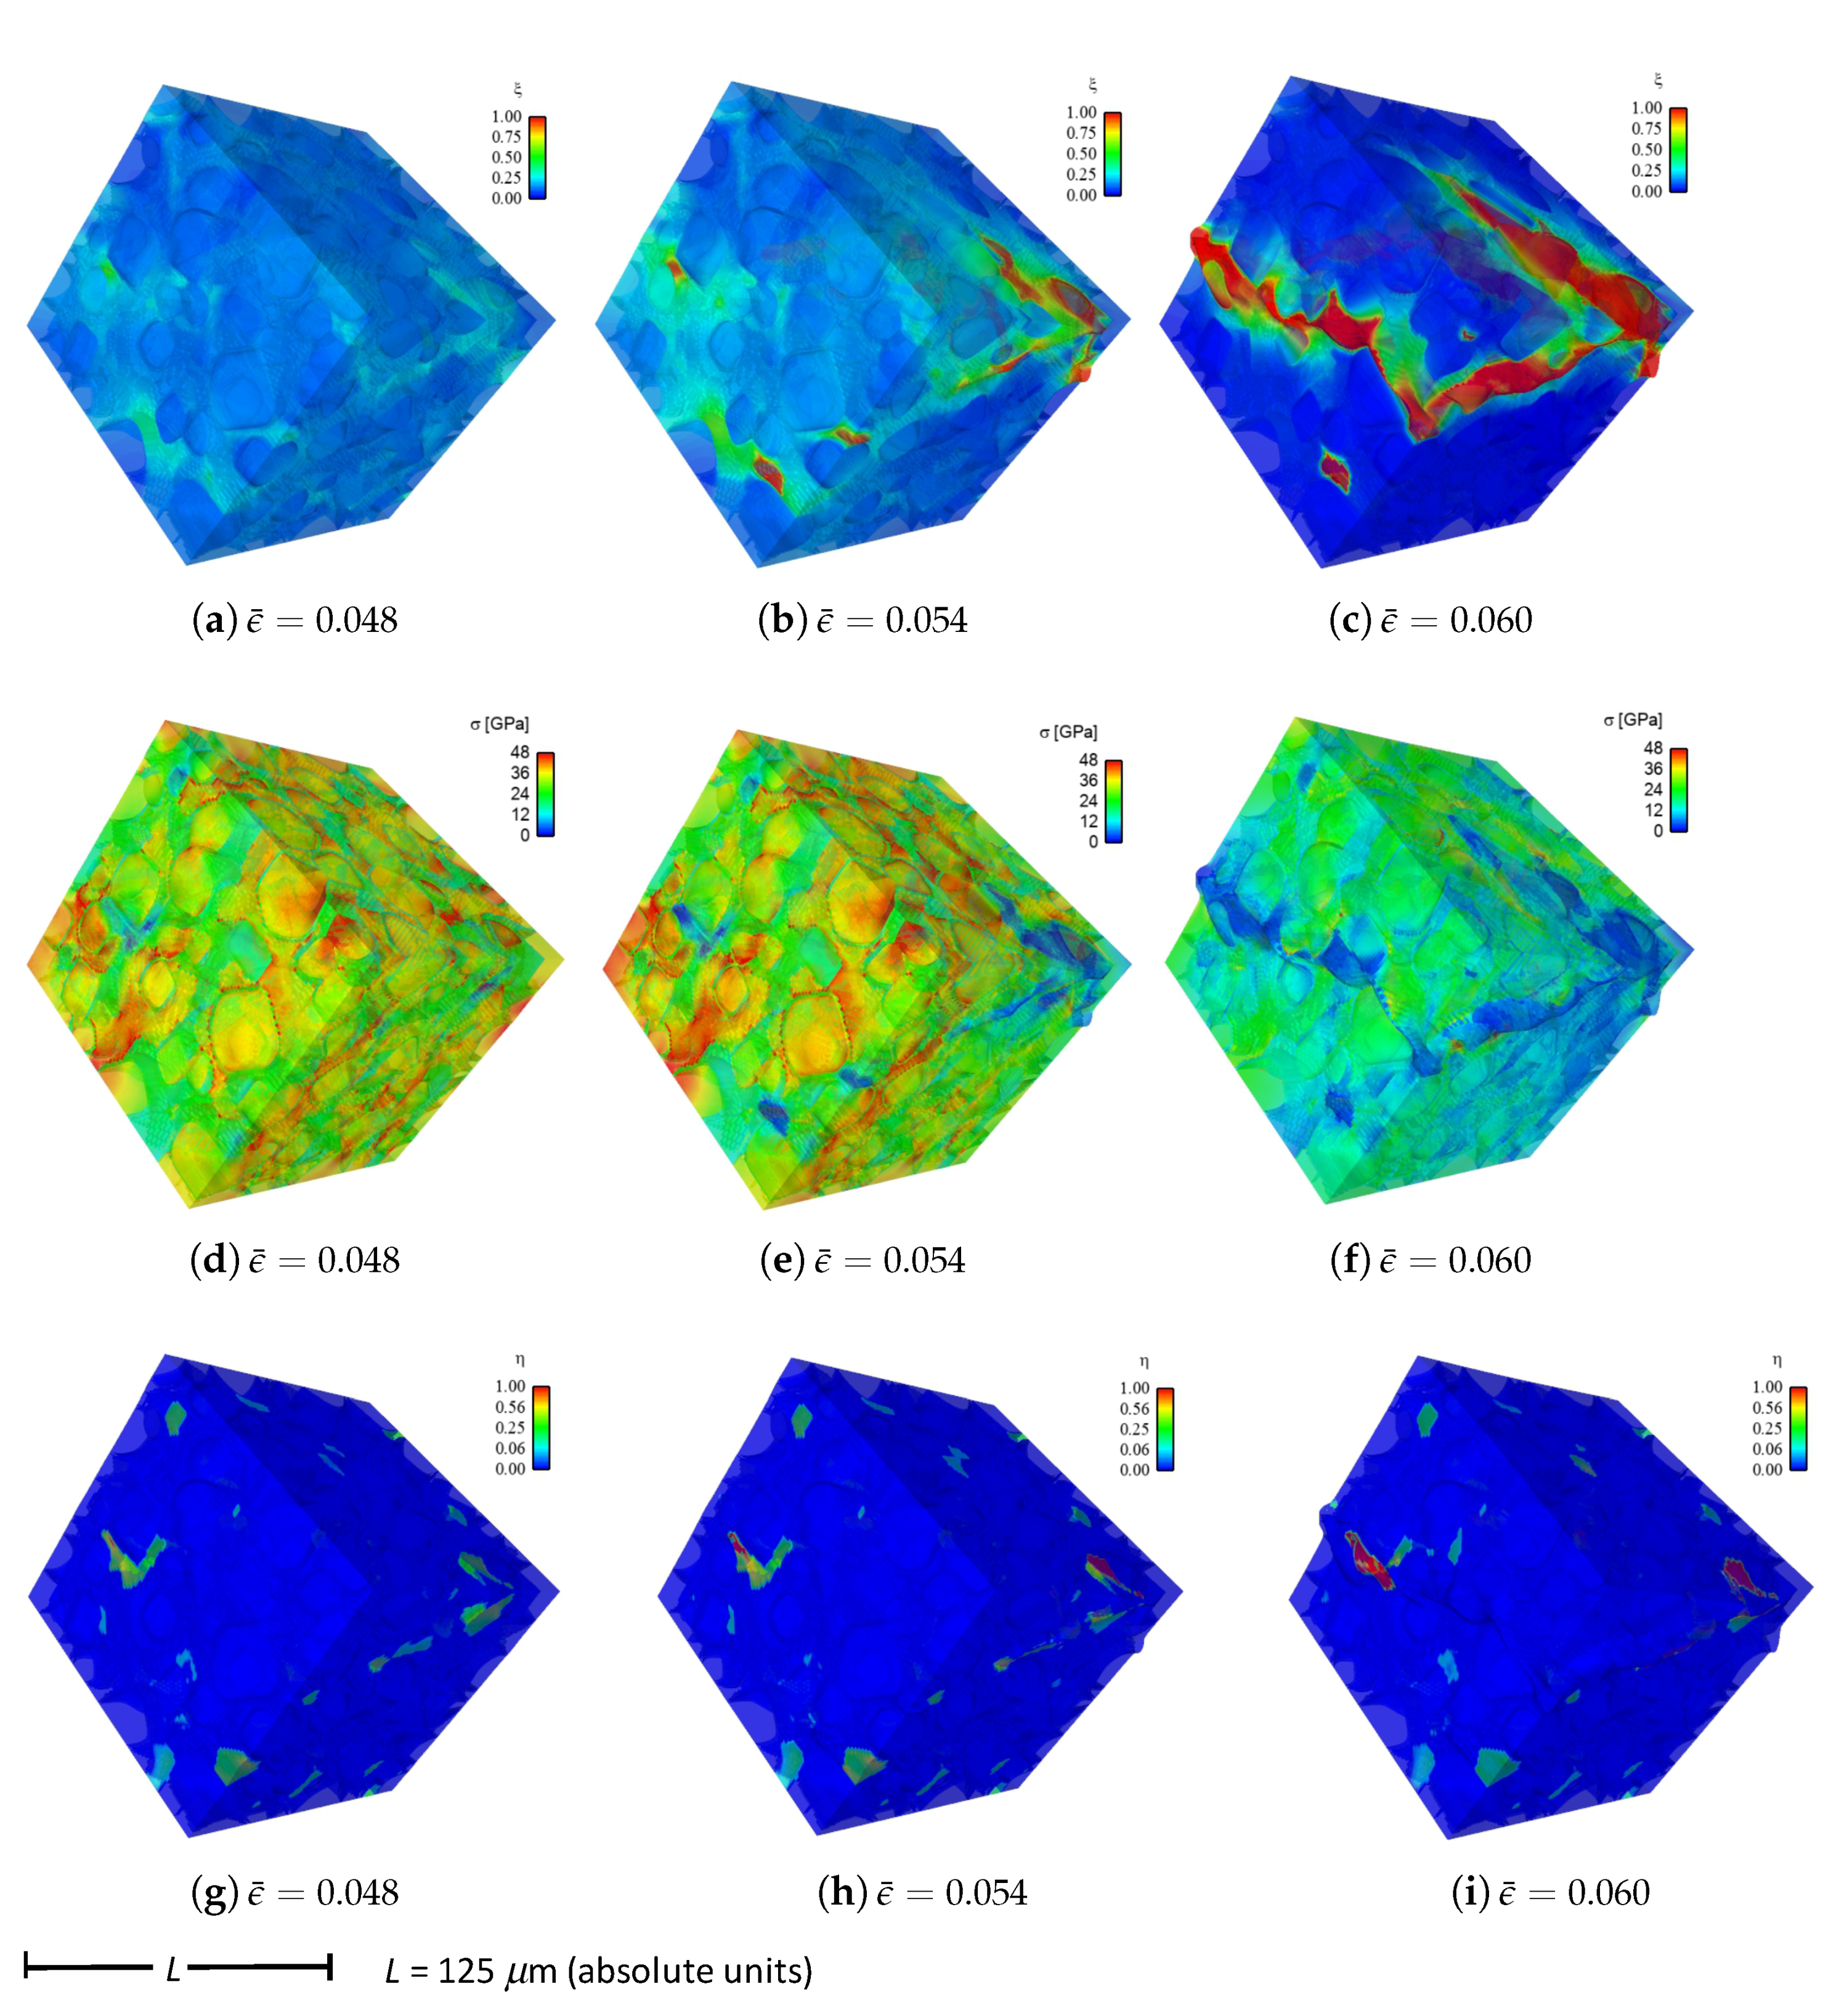
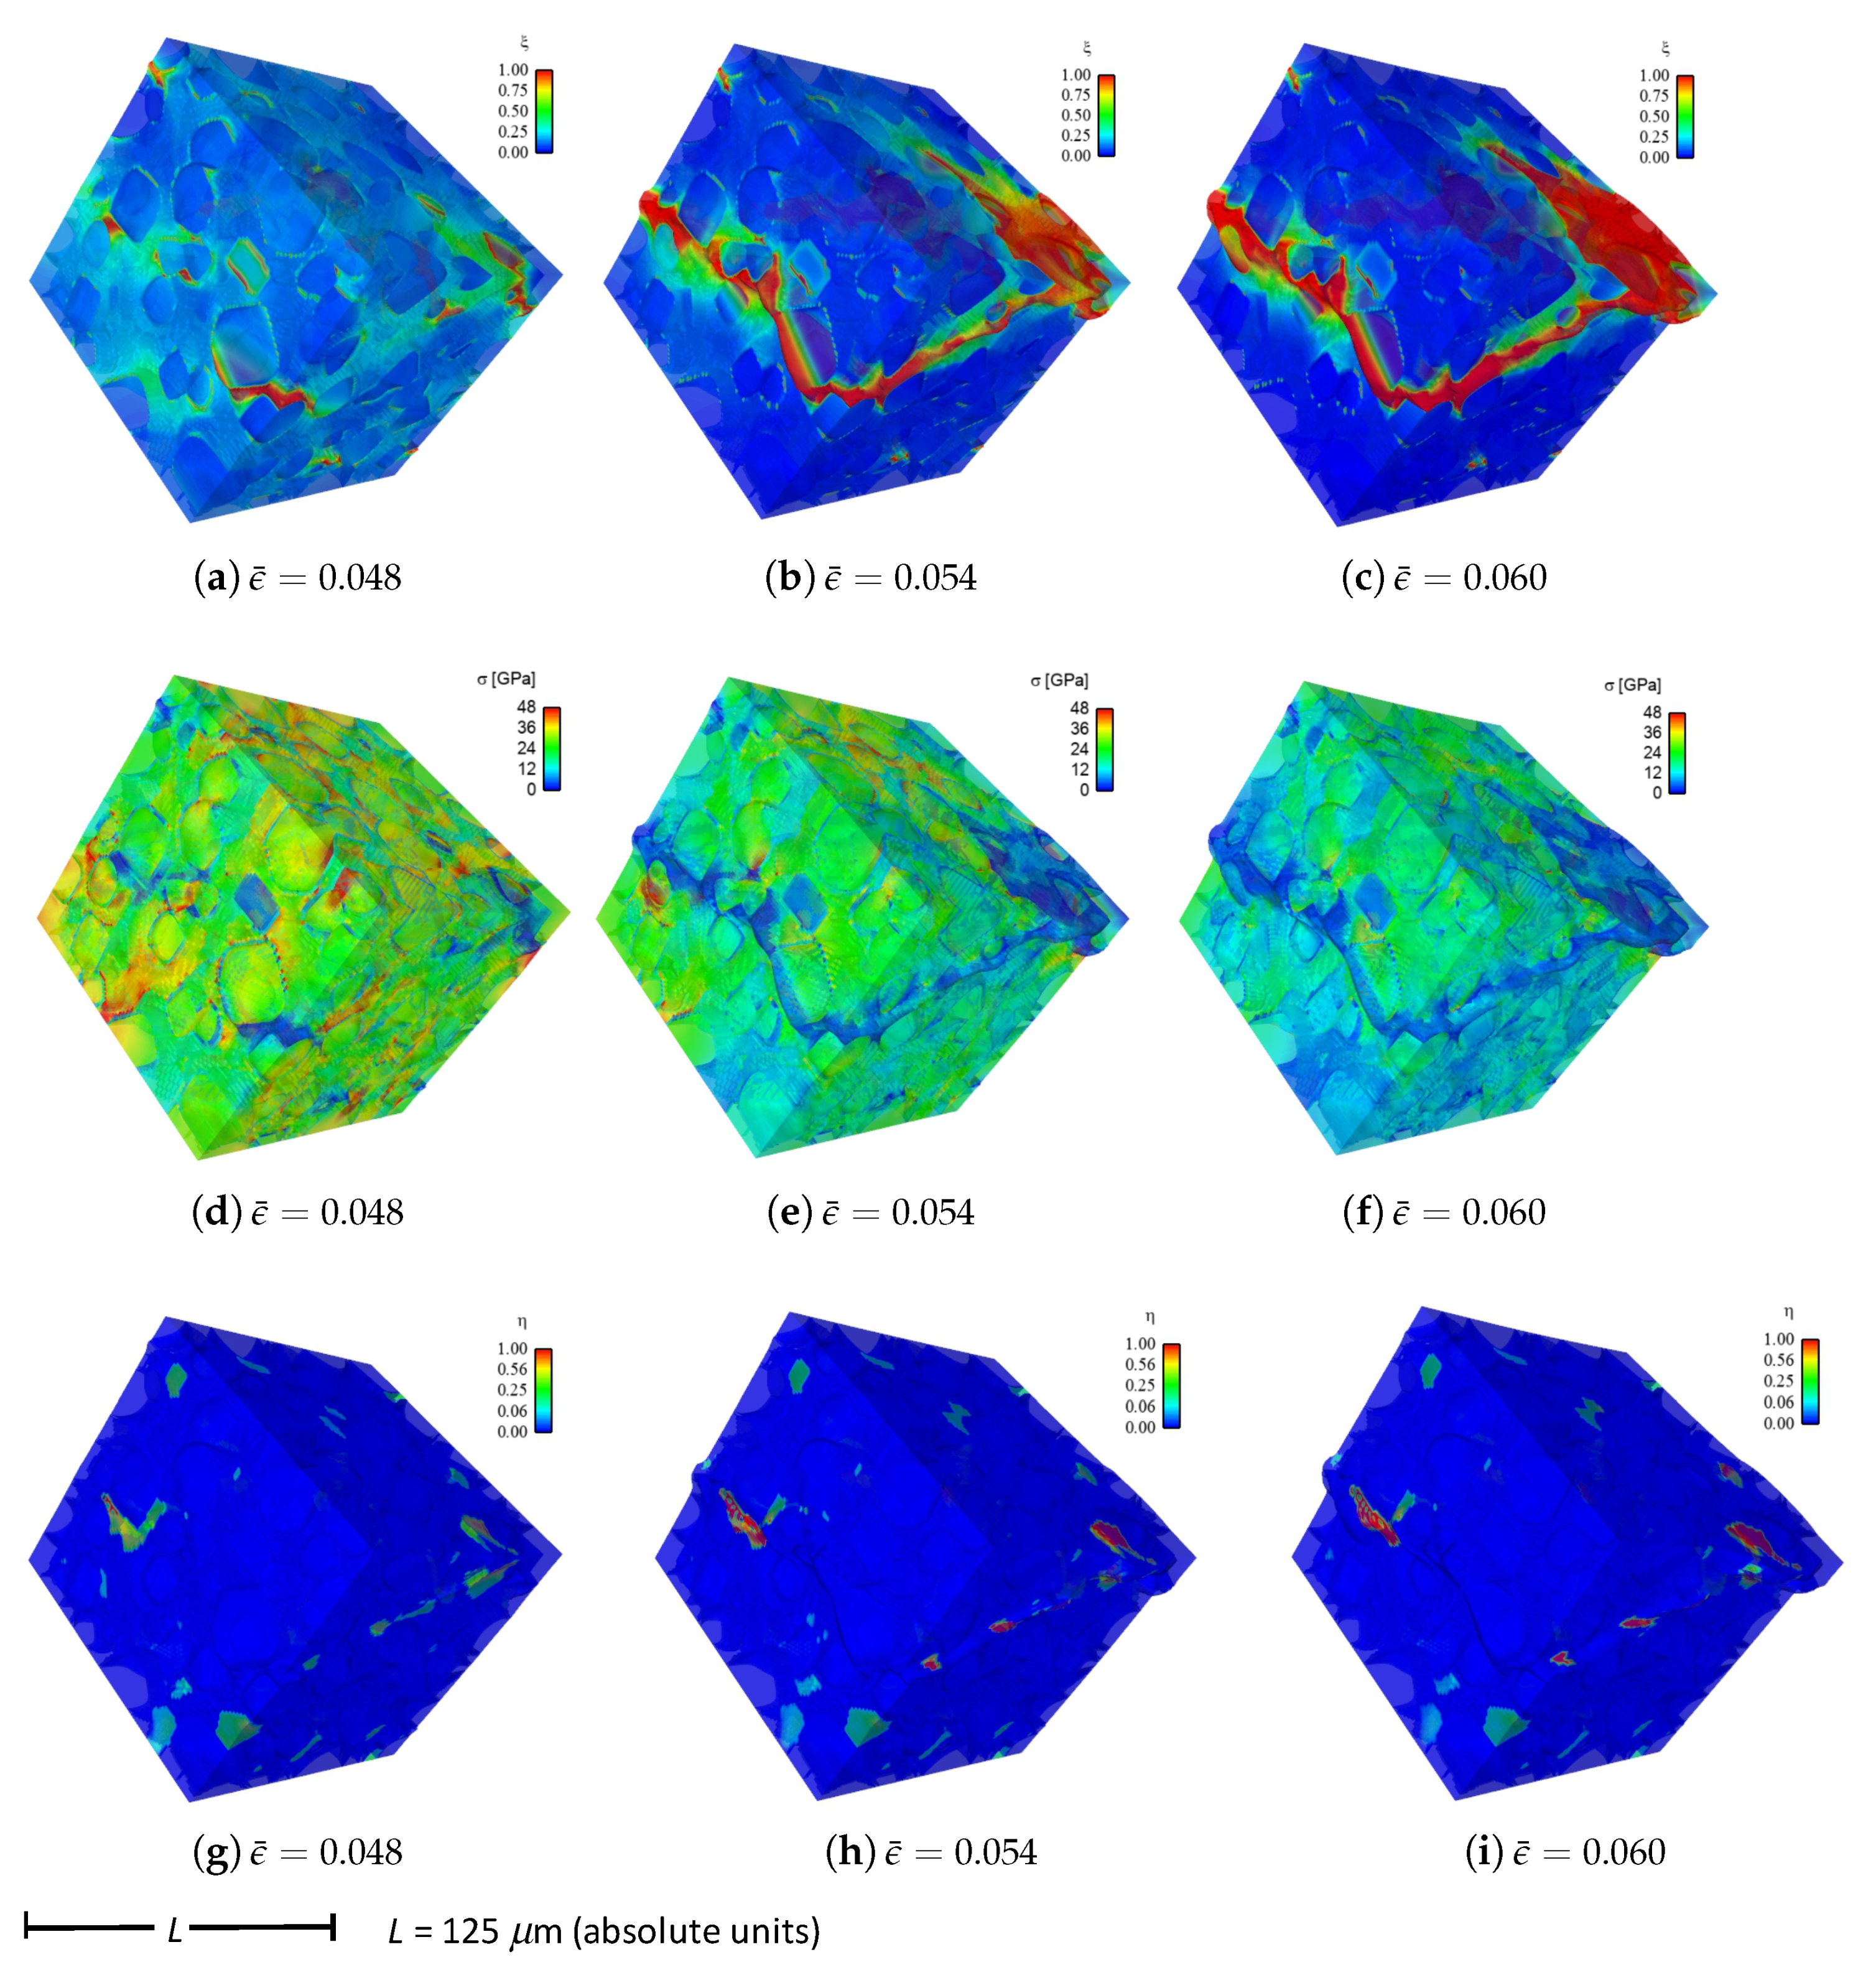
Shown in
Figure 4 are contours of field variables for simulation a.1.y, where compression is along the
Y-direction of
Figure 3. The microstructure, which is considered most physically representative of experimental characterization data discussed in
Section 3.2, contains 70% total fraction of diamond and 30% SiC. The SiC is partitioned among discrete grains (9.4%), isotropic matrix (9.0%), and isotropic GB layers (11.6%). Snapshots at increasing strain values are given from left to right, while each horizontal set of three subfigures shows the fracture order parameter, the local effective (von Mises) stress, and the twinning order parameter. Fractures initiate in the weaker SiC matrix and along grain and phase boundaries. Fractures propagate to include cleavage across diamond crystals, leading to percolation for
. Twinning is restricted to discrete granular SIC regions, which occupy only a small fraction of the diamond-heavy composite. It arises selectively only in crystals favorably oriented with respect to Schmid factor. Stresses tend to be larger in stiffer diamond regions, and stress concentrations are evident at phase boundaries. Stresses relax at larger strains as a result of stiffness degradation commensurate with fracture, as
within cracked regions.
Reported in
Figure 5 are contours of field variables for simulation a.2.y, again compressed along the
Y-direction of
Figure 3. The microstructure contains 70% total fraction of diamond, 18.4% SiC, and 11.6% graphite. The SiC is partitioned among discrete grains (9.4%) and isotropic matrix (9.0%). Graphite comprises the GB layers (11.6%) encasing the large diamond crystals. The same lattice orientation distribution is used here and in simulation a.7.y. The only difference between the current case and that shown in
Figure 4 is the presence of nanocrystalline graphite, rather than nanocrystalline SiC, at GB layers. Fractures often initiate in the graphite phase, which has notably low surface energy: 0.20 J/m
for graphite versus 2.33 J/m
for SiC in
Table 1. Fractures later propagate to matrix material and transgranular modes across diamond crystals, leading to percolation for
. Twinning behavior in
Figure 5 is slightly more prevalent than in
Figure 4, though differences among the two cases are small. Stresses are often larger in stiffer diamond regions, and are often low in graphitic regions due to softening commensurate with fracture in the much weaker graphite phase. Relative to the baseline simulation results of
Figure 4, those in
Figure 5 show earlier and more severe fractures (
) as well as lower overall effective stresses
at the same applied strain
.
Fluid-like behavior (
) is observed for the pulverized SiC-graphite material in the upper right of parts (c), (f), and (i) of
Figure 5. As discussed in [
23], accuracy of a linear elastic theory is thought acceptable for bulk grains where strains remain modest. Linear elasticity is presumably less accurate for highly distorted regions in damaged material at later load steps in the simulation history, e.g., the upper right corner of the domain in
Figure 5c. No known elastic potential, linear or nonlinear, is thought to be fully validated for such regions of very high crack density, wherein strain softening is severe.
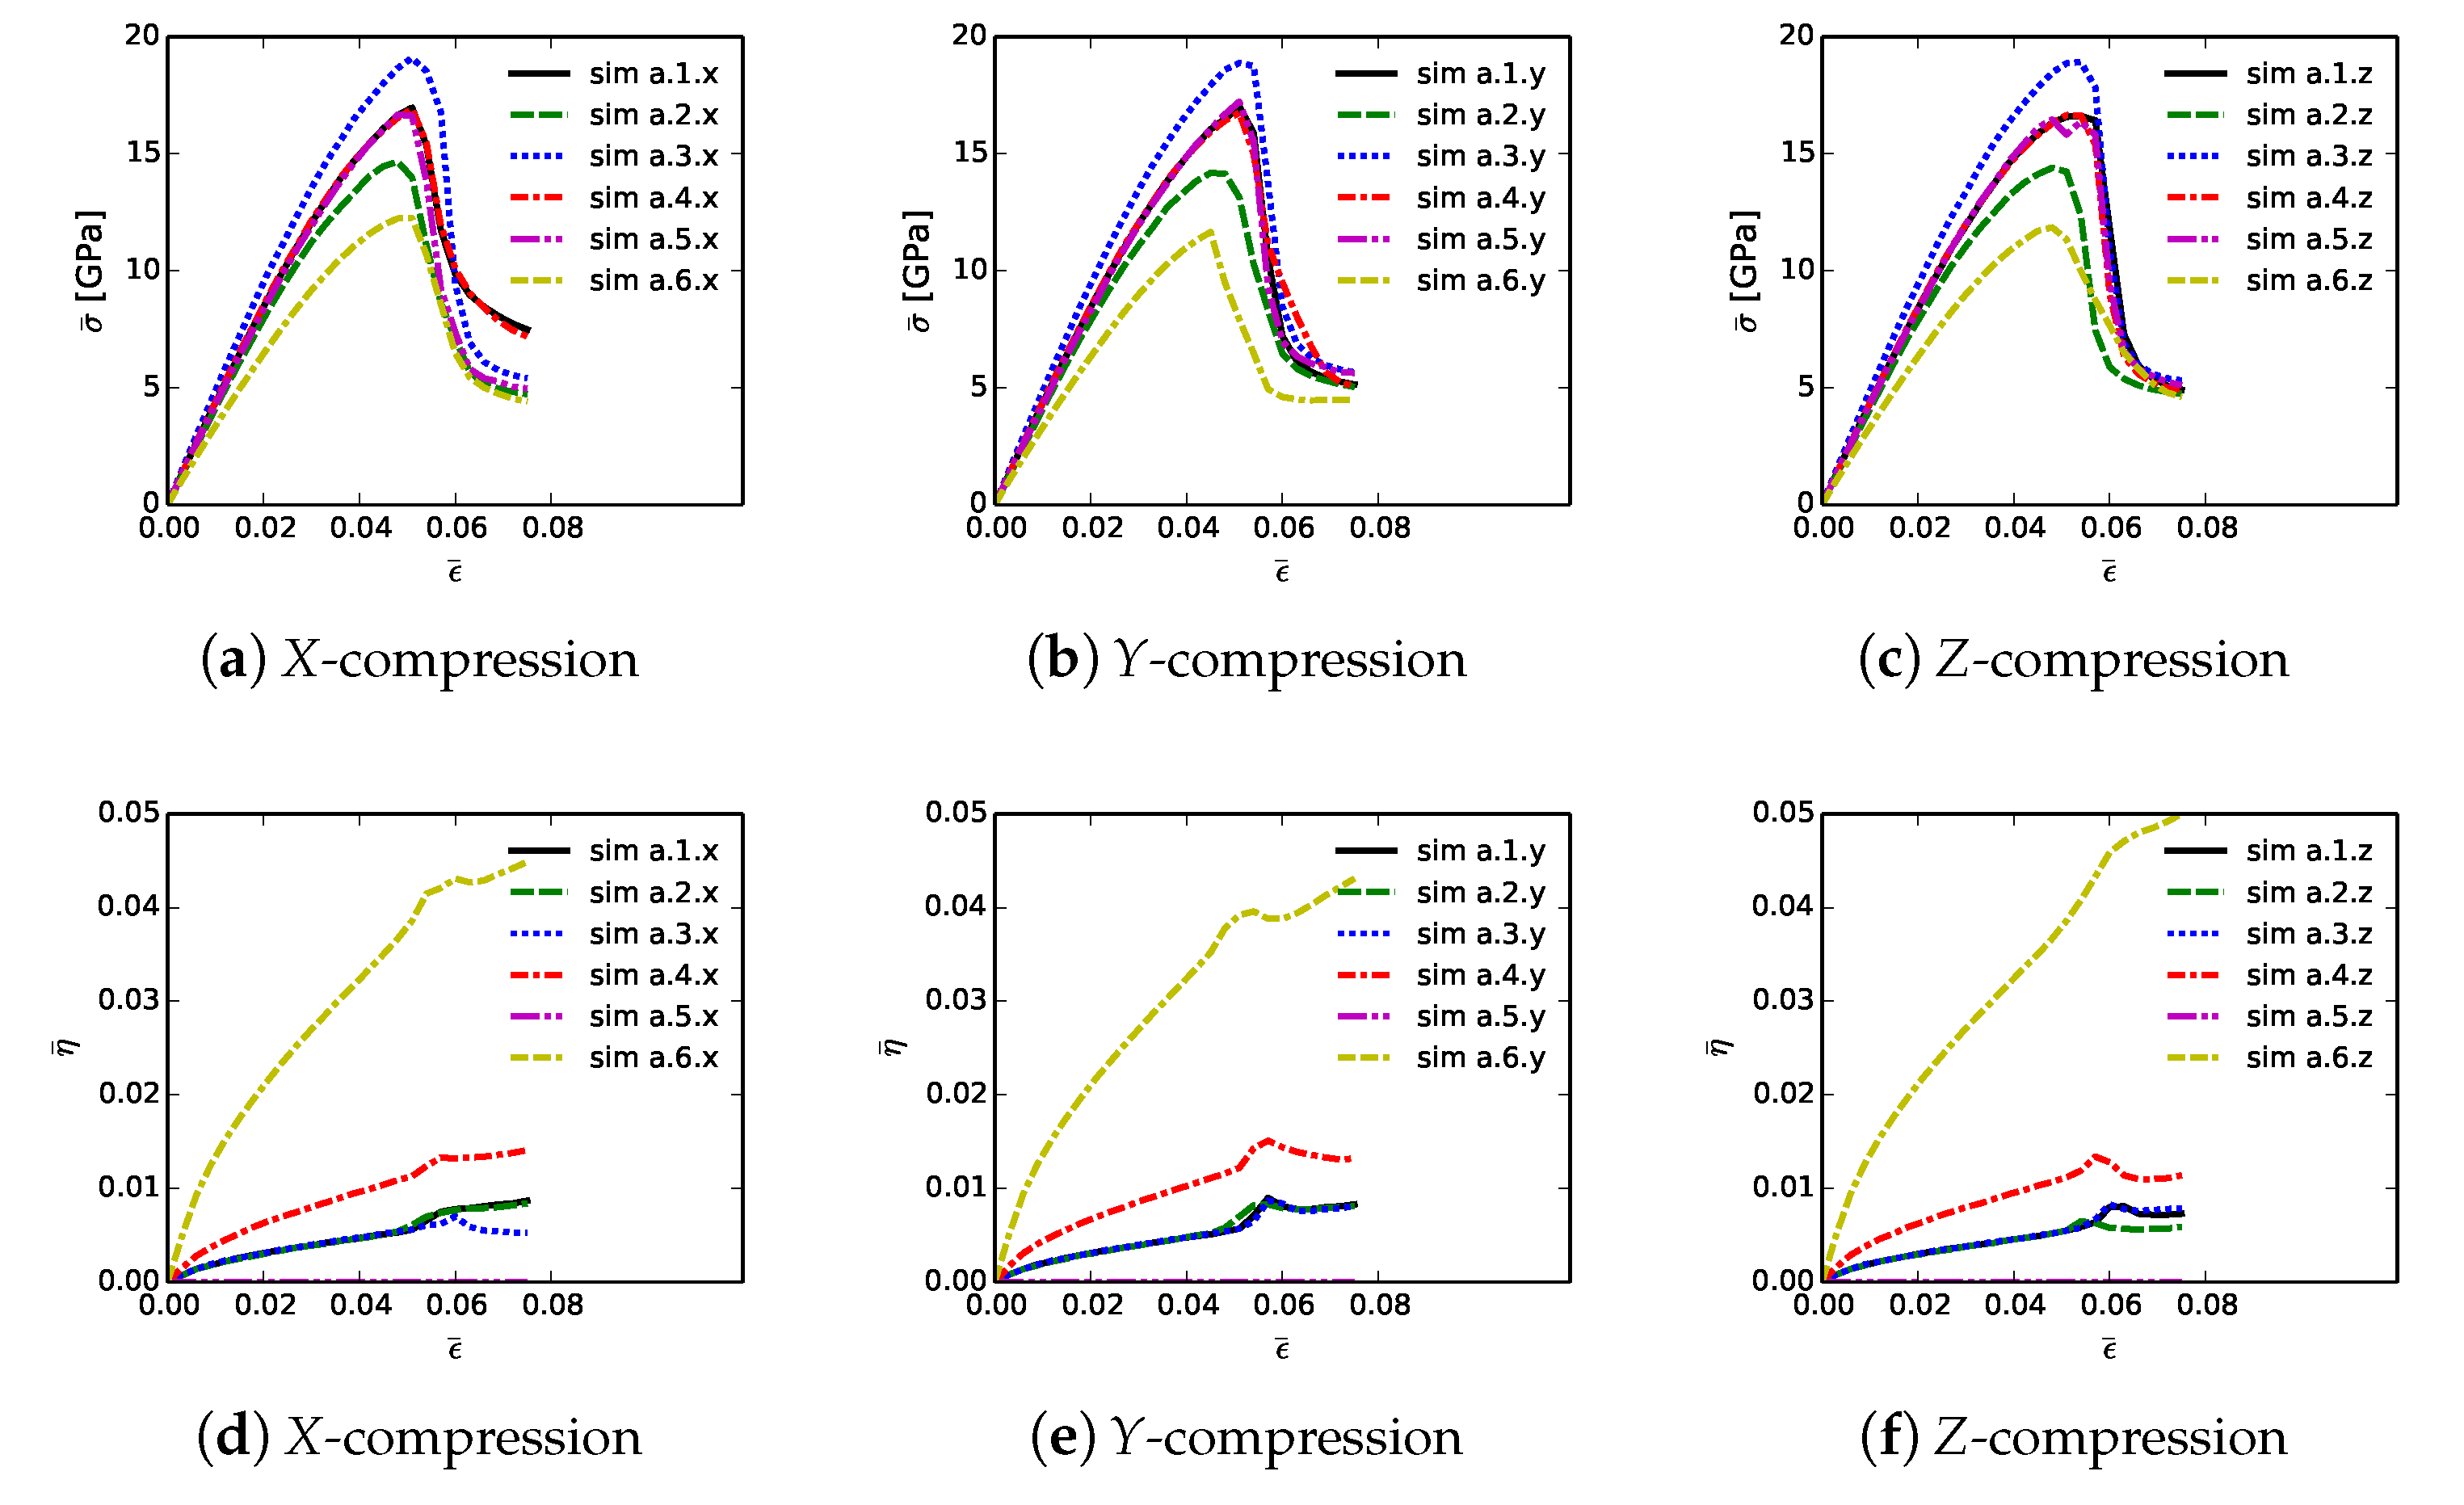
Shown in
Figure 6 are volume-averaged quantities calculated according to (
32) and (
33), for all 18 simulations listed in
Table 2. Results are plotted versus axial compressive strain
of (
31). Simulations are terminated at maximum applied strains of
due to restrictions on computer wall-clock time and slower numerical convergence in the strain softening regime. However, extending simulations to larger strains would provide no insight into peak strength and ductility, since the polycrystalline aggregates have already surpassed peak loading and undergone load release commensurate with massive fracture. Average stresses are reported in parts (a), (b), and (c), for respective loading directions
X,
Y, and
Z. For uniaxial stress compression loading, effective average stress
and the magnitude of average axial stress
of (
34) are essentially identical. Stress and stiffness are largest for simulations a.3.
; these contain more diamond than the others at 81.6% by volume. Correspondingly, stress and stiffness are lowest for simulations a.6.
, which contain less diamond than the others at 39.4%. The next-lowest strength is demonstrated by simulations a.2.
, which have graphitic layers as the GB phase surrounding large diamond crystals. Differences in average stress–strain behavior are small among the remaining three microstructures, which consider different proportions of SiC single crystals versus SiC matrix material. Furthermore, effects of loading direction and lattice orientation are generally small, since trends and magnitudes do not vary appreciably among parts (a), (b), and (c) of
Figure 6.
Shown in
Figure 6, parts (d), (e), and (f), is evolution of average twinning order parameter
, which correlates physically with the average volume fraction of twinned material in the microstructure. Recall from
Section 3 that diamond does not twin, but single crystals of
-SiC resolved in the simulated microstructure are enabled with twinning capability. Since cases a.4.
contain no resolved anisotropic SiC single crystals (
Table 2),
for these cases. Simulations a.6.
, followed by a.4.
, contain more SiC grains by volume than the other cases, so logically these demonstrate the most twinning activity. In cases a.6.
, the total volume fraction of SiC crystals is 49%, and the twinned volume fraction approaches 5% at
. Thus, around 10% of the SiC granular volume has twinned in these cases.
Table 3 lists mean simulation data at the point of maximum average compressive stress: peak stress
, axial compressive strain or ductility at this stress level
, and cumulative stress work
of (
34) at applied strain
. Data on each row of this table correspond to the arithmetic mean of values calculated for each of the three loading directions and lattice orientation distributions for each of the six microstructures. Furthermore, reported is the variation
, computed as the magnitude of the difference between min and max values among each set of three simulations x,y,z corresponding to a given row in the table.
Trends in
are identical to those discussed already for effective stress
in the context of
Figure 6. Baseline peak unconfined strengths are 16.91 GPa for simulations a.1.
, at applied strain of 5.2%, and with cumulative energy density of 0.517 GJ/m
. Graphite in cases a.2.
causes a reduction in
by 2.5 GPa, a decrease in average ductility by 0.5%, and a decrease in
by over 0.1 GJ/m
. Conversely, the added diamond in cases a.3.
gives an increase in peak strength by around 2 GPa, with the same ductility, and an increase in
of 0.06 GJ/m
. Peak load
, strain
, and energy
decrease only slightly from the baseline microstructure while proceeding to cases a.4.
and then a.5.
. Variability in peak load due to different microstructure orientations is modest, typically on the order of 0.5 GPa, or around 3% of
. Simulations with diamond material at GB layers have lowest variability, while those with high SiC matrix content have greatest variability. The weakest microstructures, in terms of
and energy absorption capability
, are those of cases a.6.
, which have much less diamond and more SiC. However, the most brittle in terms of critical strain
are those with graphite, even though they contain more diamond than cases a.6.
. Thus, the present results show that replacing diamond with more SiC grains compromises peak strength but not ductility. Replacing SiC GB layers with graphite substantially reduces both peak strength and ductility. Replacing SiC GB layers with isotropic nanocrystalline diamond matrix increases strength but not ductility.
6. Phase Field Simulations: Grain Boundary Energy Distribution Effects
Phase field simulations with results in
Section 4 assumed fractures were primarily transgranular, whereby fracture surface energy
was assigned uniformly among grains or regions belonging to a particular phase in the microstructure: diamond crystals (anisotropic fracture), SiC crystals (anisotropic), SiC matrix (isotropic), diamond matrix (isotropic), or graphite layers (isotropic). In these prior results,
was chosen appropriately based on the fracture energy of lowest-energy planes for each crystal type. In contrast, in the present simulations, fractures in material elements of matrix regions are assumed to be intergranular, i.e., along SiC-SiC grain boundaries [
19,
69] or diamond-SiC phase boundaries [
13]. Fracture energy
is assigned to the appropriate material phase based on distributions of GB energies calculated from MD in
Section 5. Those SiC matrix regions not bordering diamond crystals are nominally assumed to fracture by separation along SiC-SiC grain boundaries [
19,
69]. Matrix regions of SiC contiguous to diamond are assumed to fracture by separation along diamond-SiC phase boundaries [
13]. Fractions of SiC-SiC versus diamond-SiC boundaries vary among microstructures addressed in simulations.
Fracture along diamond-diamond GBs is not quantified in the phase field representation for two reasons. Firstly, in the present diamond-SiC material system, diamond-diamond GBs are very rare, since the microstructure consists of single crystals of diamond usually encased in a SiC matrix, diamond grains bordering larger SiC crystals, or diamond grains coated or in contact with graphitic layers or inclusions. Secondly, experiments [
22,
94,
95] and atomic simulations [
96] indicate that polycrystalline diamond tends to fail by transgranular fracture, most often on
planes, rather than by intergranular fracture along diamond-diamond GBs.
6.1. Simulation Protocols
Eighteen simulations are conducted, six loaded in each of the global
X,
Y, and
Z directions under uniaxial compressive stress conditions (
31). Details are listed in
Table 4. All simulated microstructures contain the identical assortment of diamond, comprising 70% of the total volume of the composite. The GB layer phase encasing the larger diamond crystals (11.6% by volume) is partitioned into 170 regions, with each discrete region encasing a single diamond crystal. In all 18 of these simulations, a different value of
is prescribed to each SiC matrix region, leading to a spatially heterogeneous distribution of fracture strength. Distributed values are assigned consistently with MD results of
Section 5.2 that consider a realistic variety of SiC-SiC GB types. Different realizations are enacted for each of the 18 simulations, i.e., a different spatial distribution of GB energy is invoked in each simulation, though all statistically correlate with probability distribution functions constructed from MD solution data of
Section 5.2. Simulations require 177 or 355 distinct values of
for SiC-SiC GB fracture depending on the number of simulated SiC matrix regions. Simulations b.1.
, b.2.
, b.5.
, and b.6.
are assigned discrete values of
to each of the 170 GB regions in an analogous way, but with diamond-SiC GB energies from
Section 5.3 used rather than SiC-SiC GB energies. Simulations b.3.
and b.4.
contain graphite rather than SiC in GB layers surrounding diamond crystals. Here, fracture energy
for the 170 layered regions is assigned as that of basal planes of graphite, since these are presumed much weaker than any other grain or phase boundary (
Table 1). Simulations b.2.
, b.4.
, and b.6.
assume failure in SiC matrix regions is dominated by phase boundaries between these regions and diamond grains in close proximity.
Simulations b.5.
and b.6.
have more regions of nanocrystalline SiC matrix (355 versus 177) in which failure may occur by GB decohesion, so effects of MD energy distributions are expected to be greater for these simulations relative to cases with
. Cases b.
.
have the same lattice orientations (
; Roman numerals I–IX in
Table 4) for bulk grains as cases b.
.
when
and
and
, or
and
, or
and
. For these matching paired cases, microstructure parameters differ only with regard to discrete instantiations of fracture energies (numbered 1–18) obtained from MD simulations. Such prescriptions enable effects of GB fracture energies to be distinguished from effects of orientation distributions of cleavage and twinning planes.
6.2. Results
Simulations listed in
Table 4 consider different GB fracture property distributions among numerous regions of matrix material and layers encasing larger grains. Effects on model predictions are discussed next. Displacement boundary conditions are the same as those of
Section 4: normal strain
, defined in (
31), compresses the aggregate in one of global
X,
Y, or
Z directions.
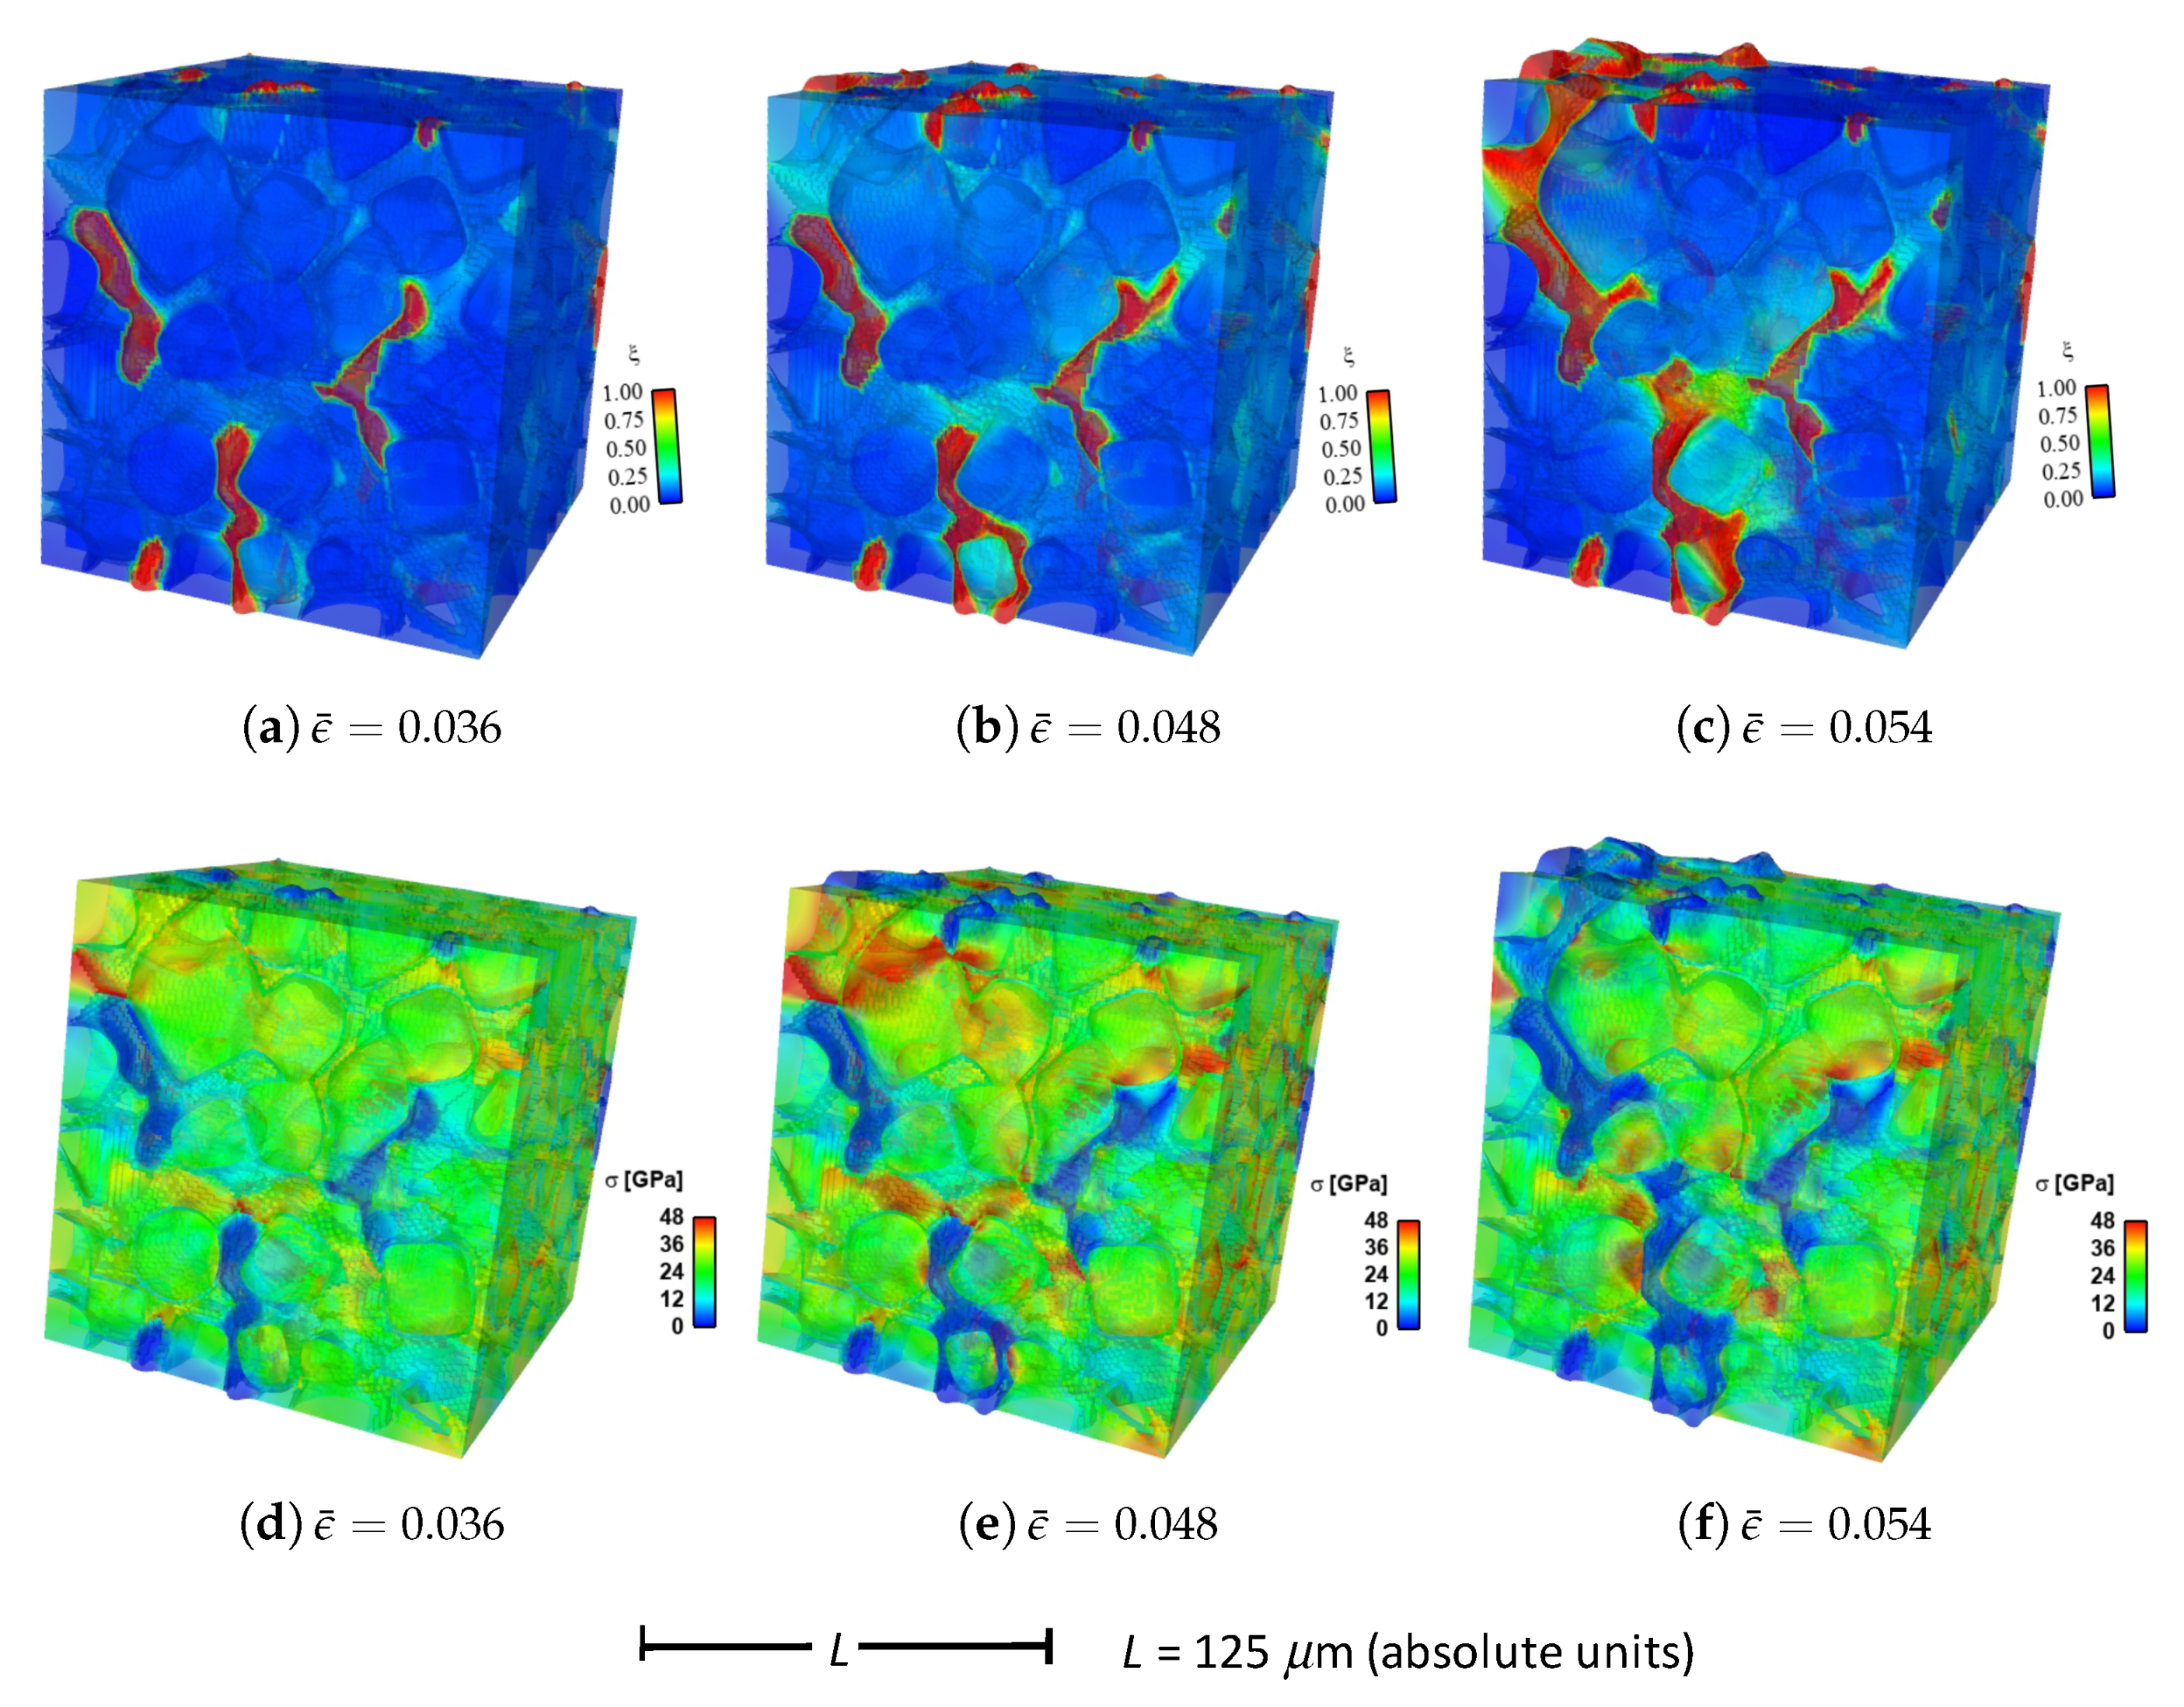
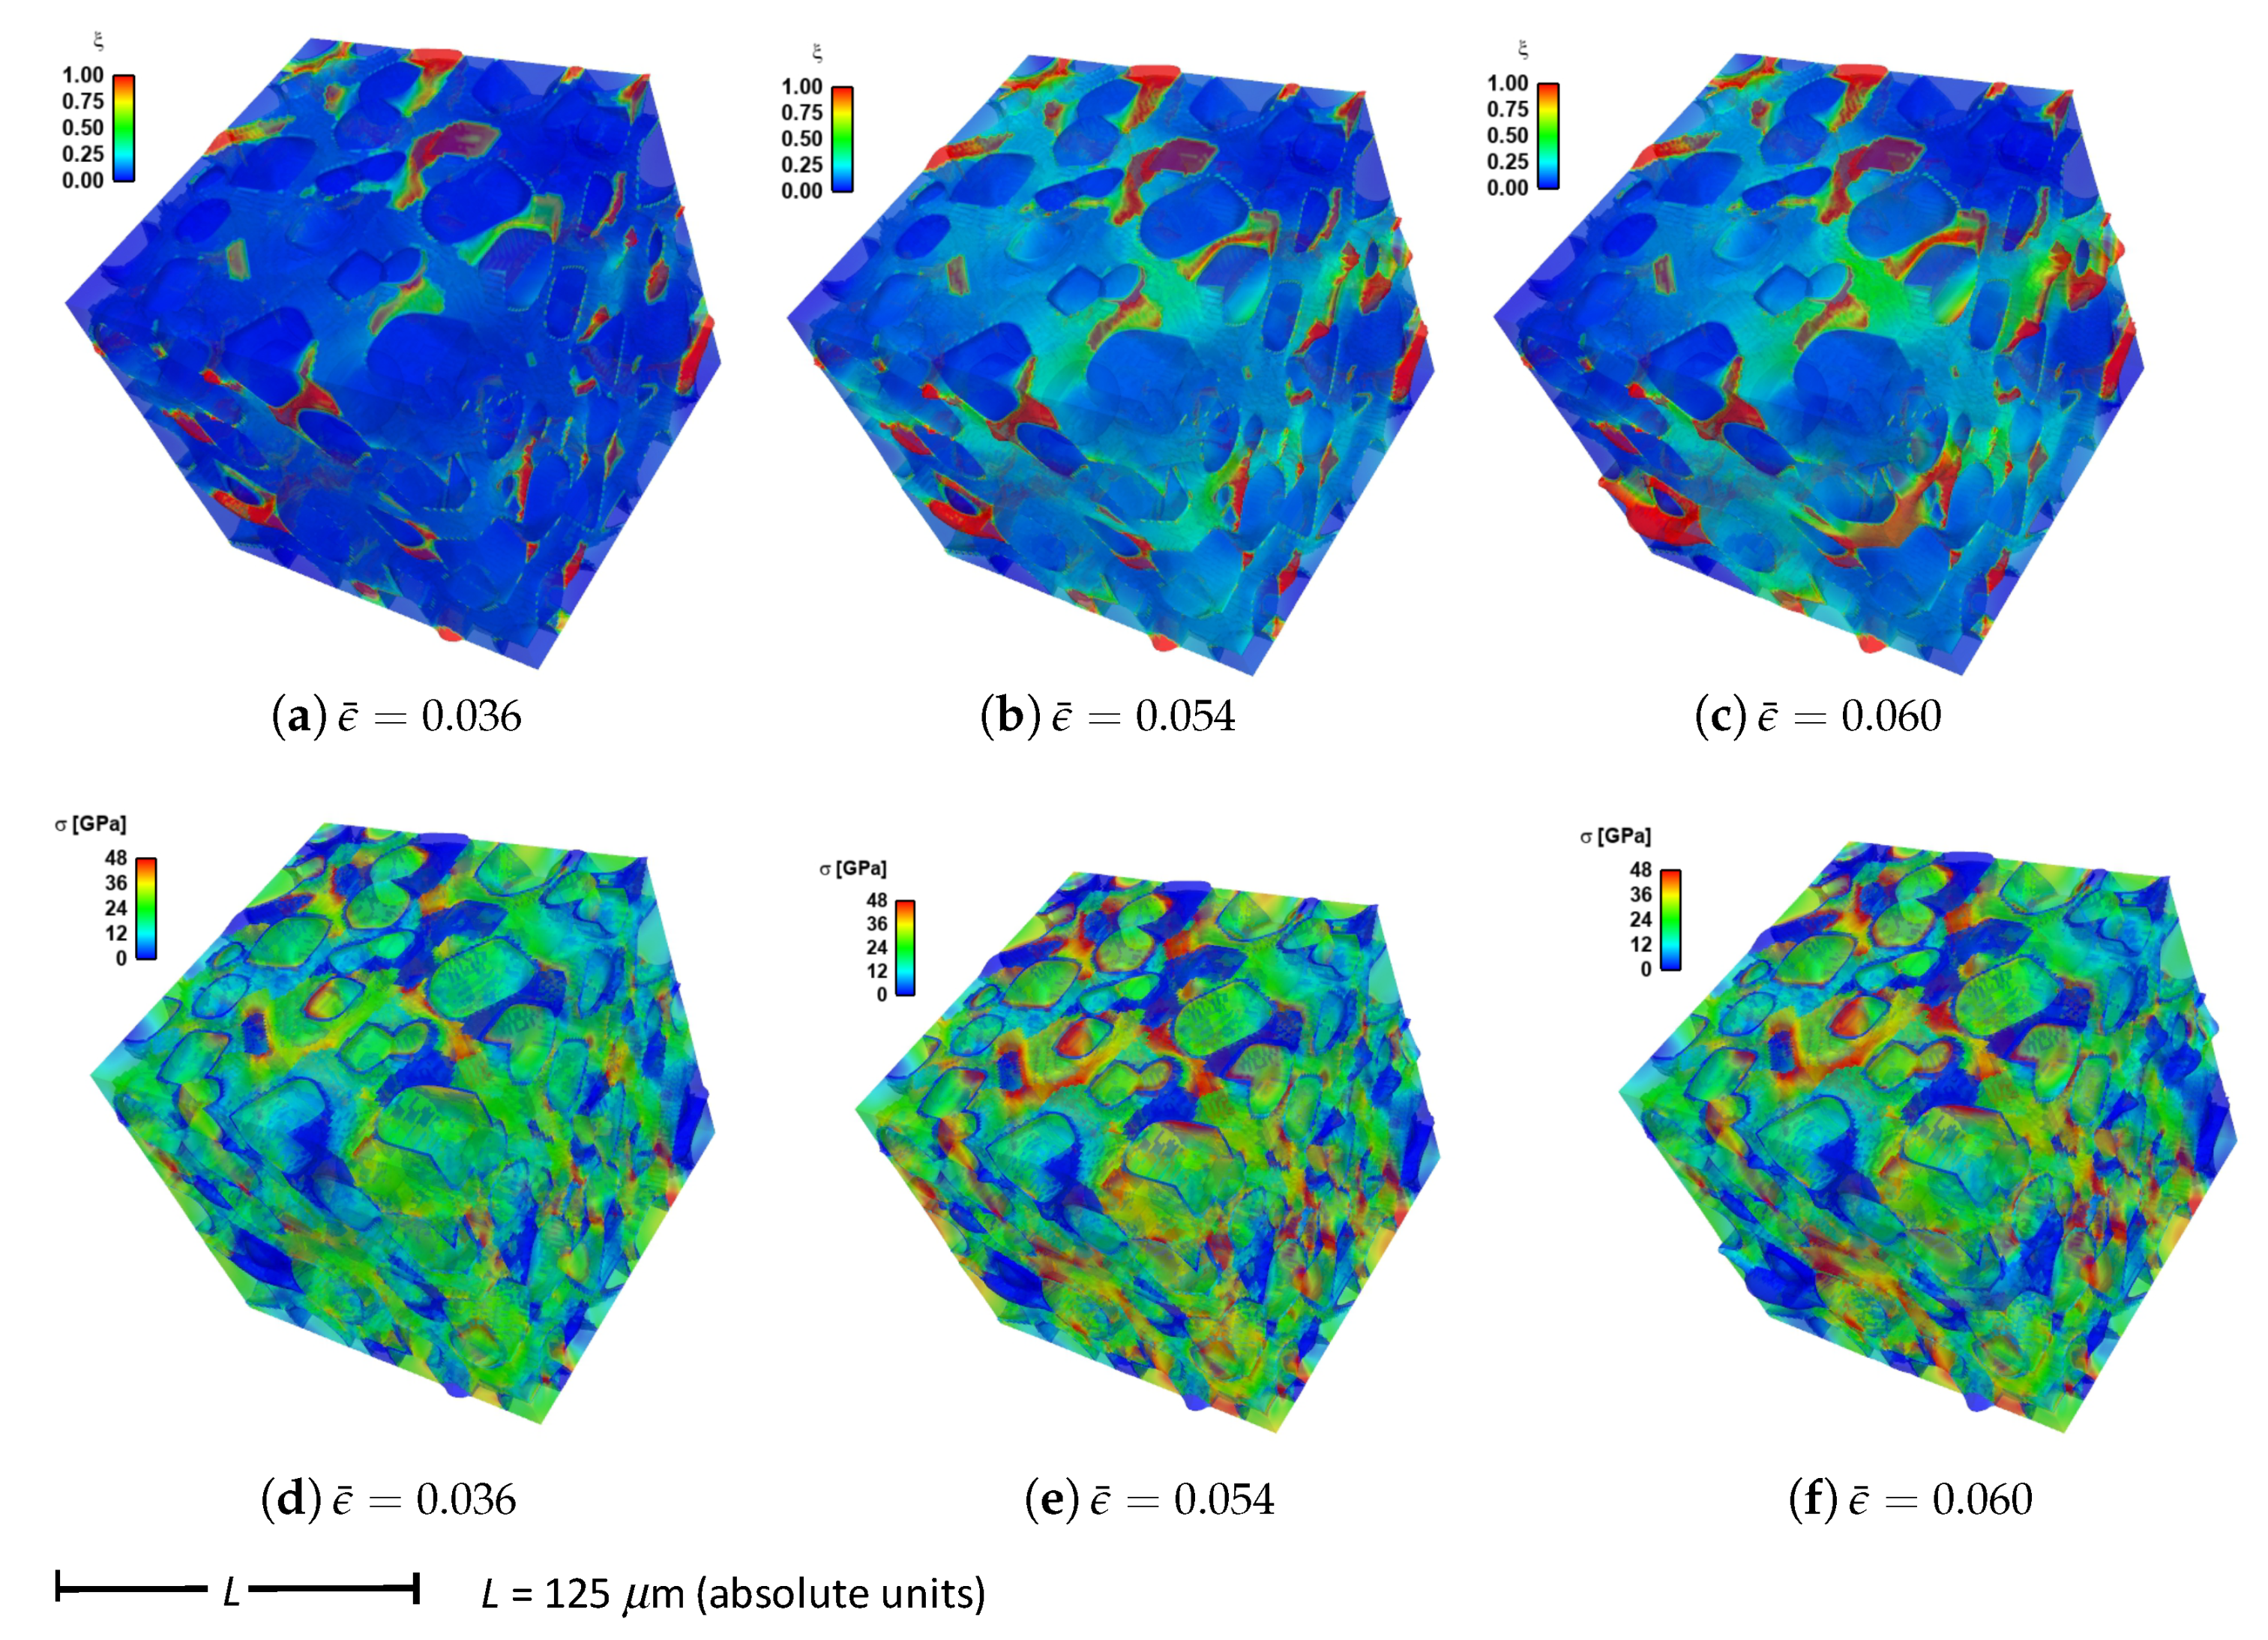
Given in
Figure 9 are contours of effective stress and order parameter fields for simulation b.6.z, compressed along the
Z-direction of
Figure 3. This microstructure contains 70% total fraction of diamond, 30%
-SiC. The SiC is divided into isotropic matrix (355 regions, 18.4%) and GB layers (170 regions, 11.6% by volume) encasing the large diamond crystals. Differences between the current case and that shown in
Figure 4 include the current use of distributions of fracture energies for distributions of energies for diamond-SiC interfaces (from MD results of
Section 5.3). In the former case of
Figure 4, uniform fracture energies for SiC cleavage on
planes were assigned instead. Fractures most commonly commence in the SiC matrix phase intermixed with smaller diamond crystals, in particular regions where assigned interfacial strengths are low. Dominant cracks, and cleavage fractures in diamond, are more scarce than those reported for simulations in
Section 4. Stresses appear most often largest in the stiffer diamond phase, and are highly relaxed where fractures occur.
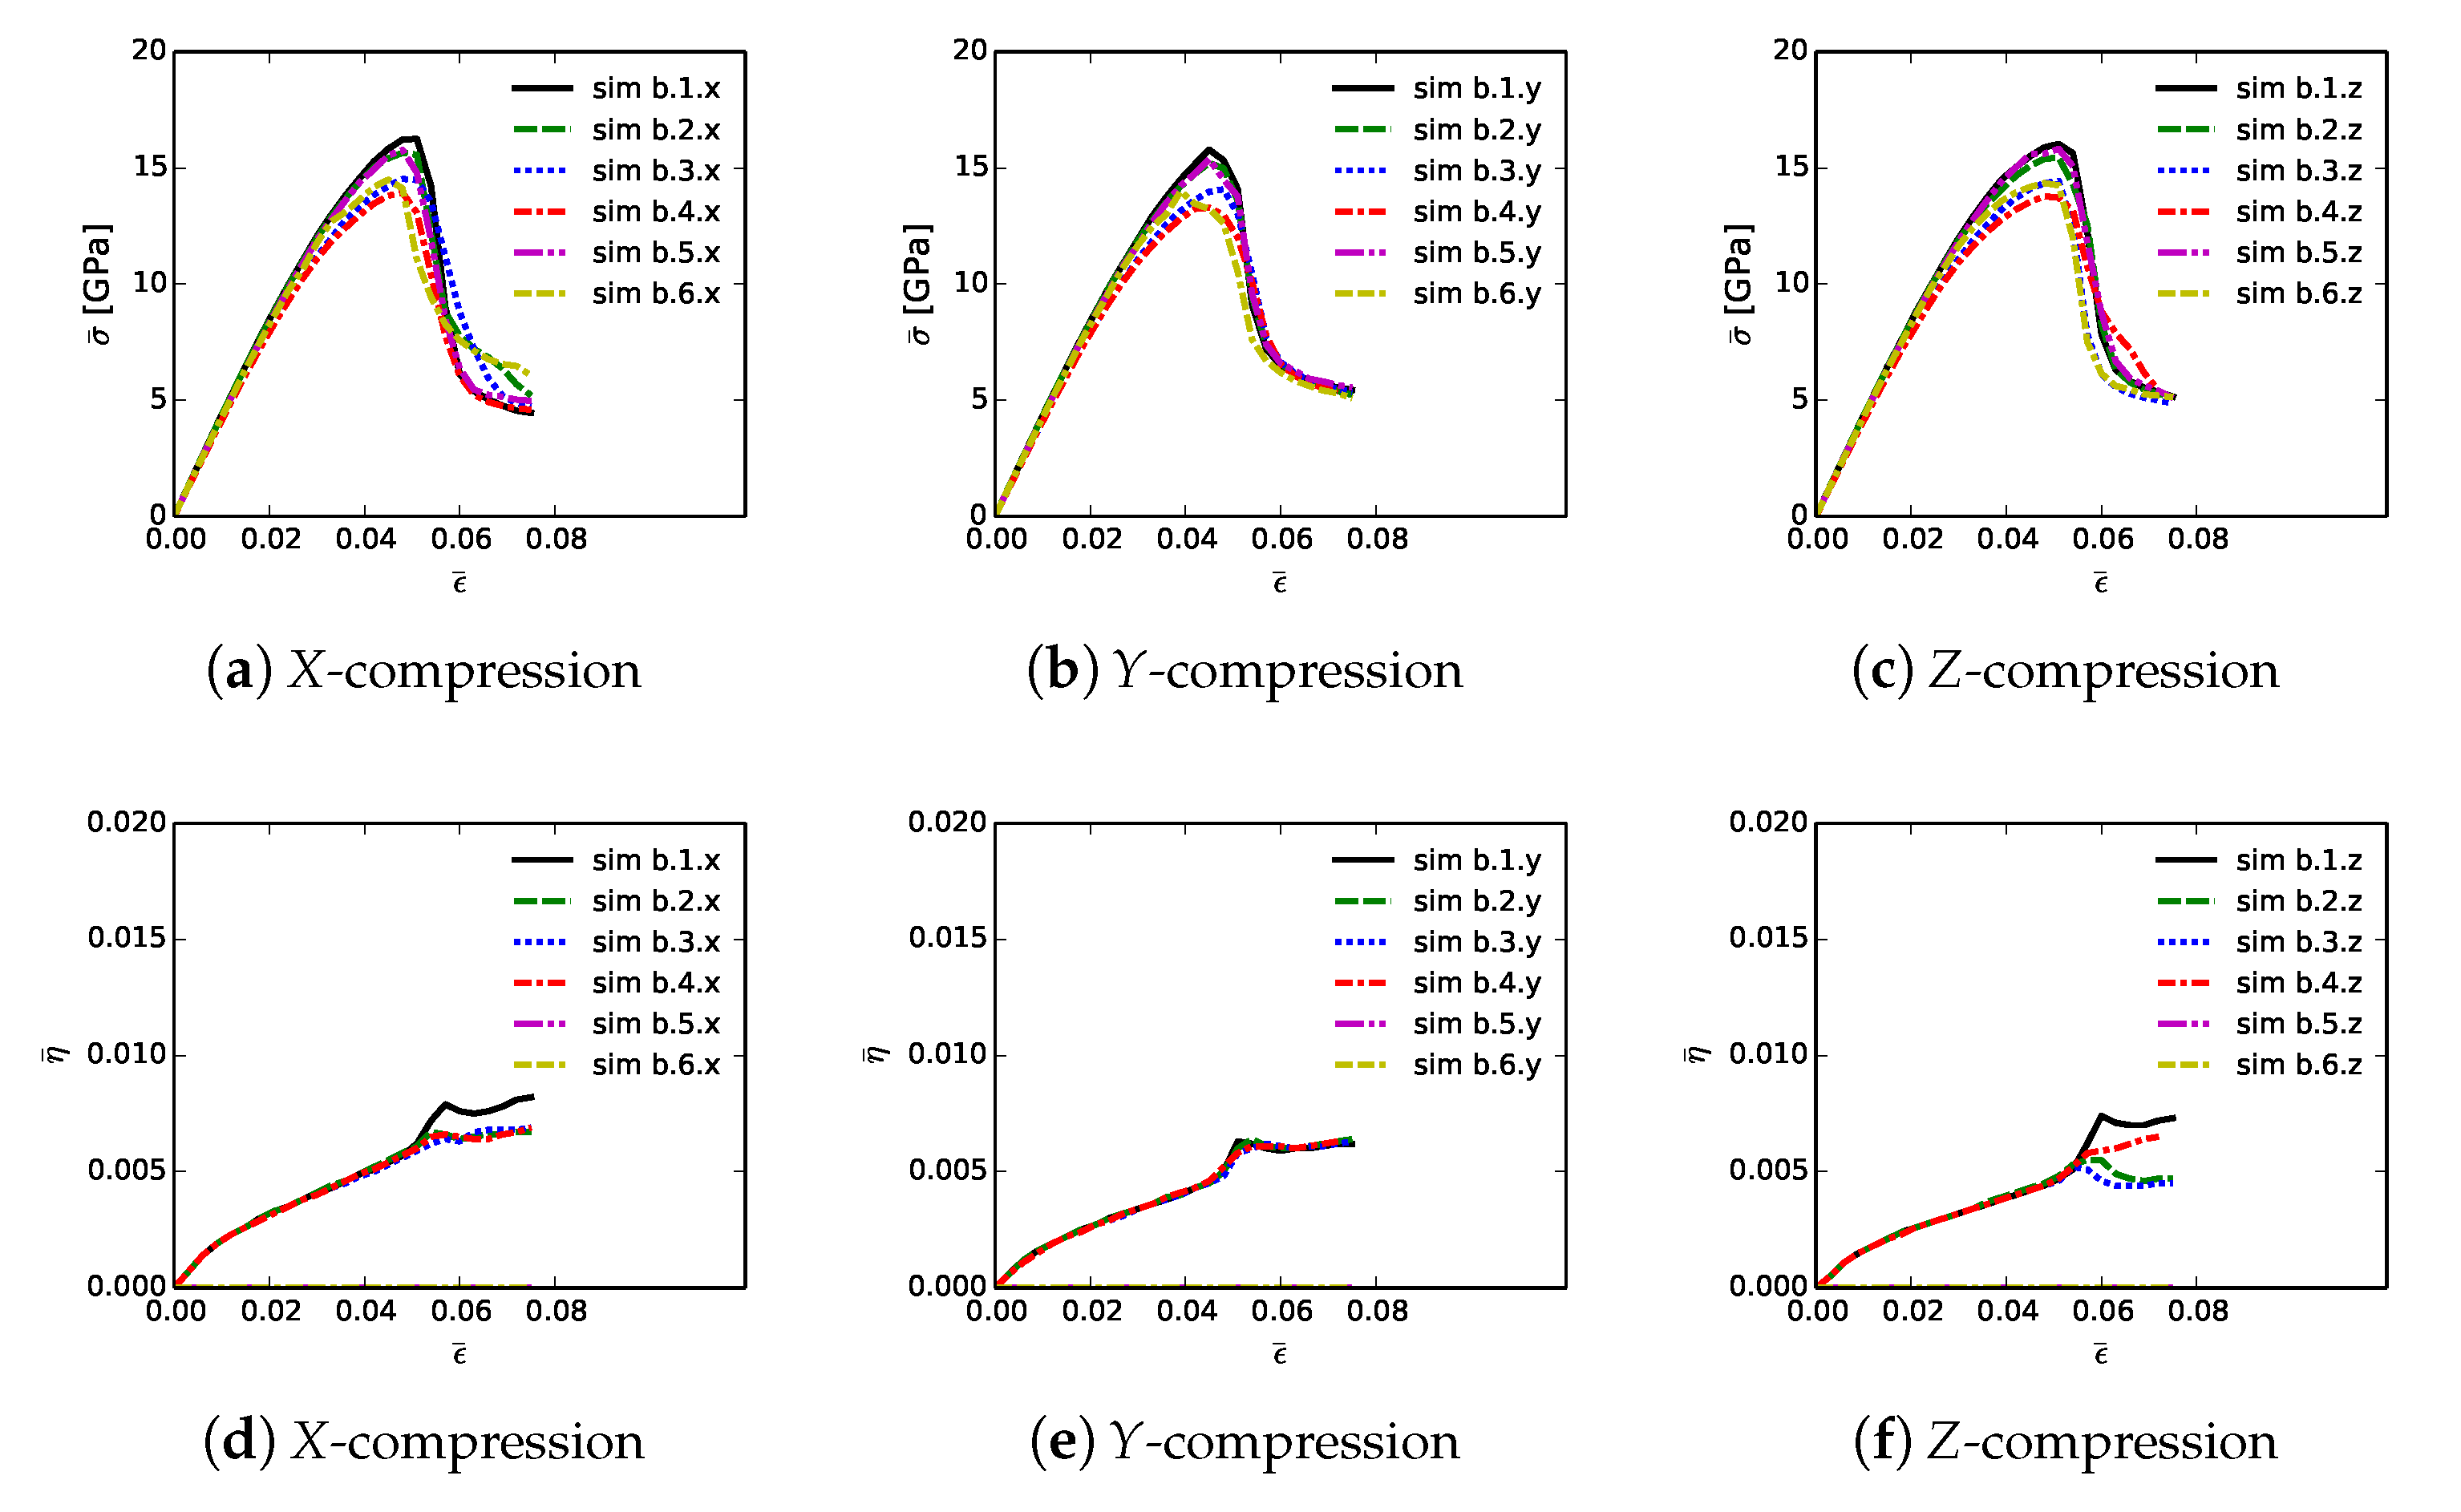
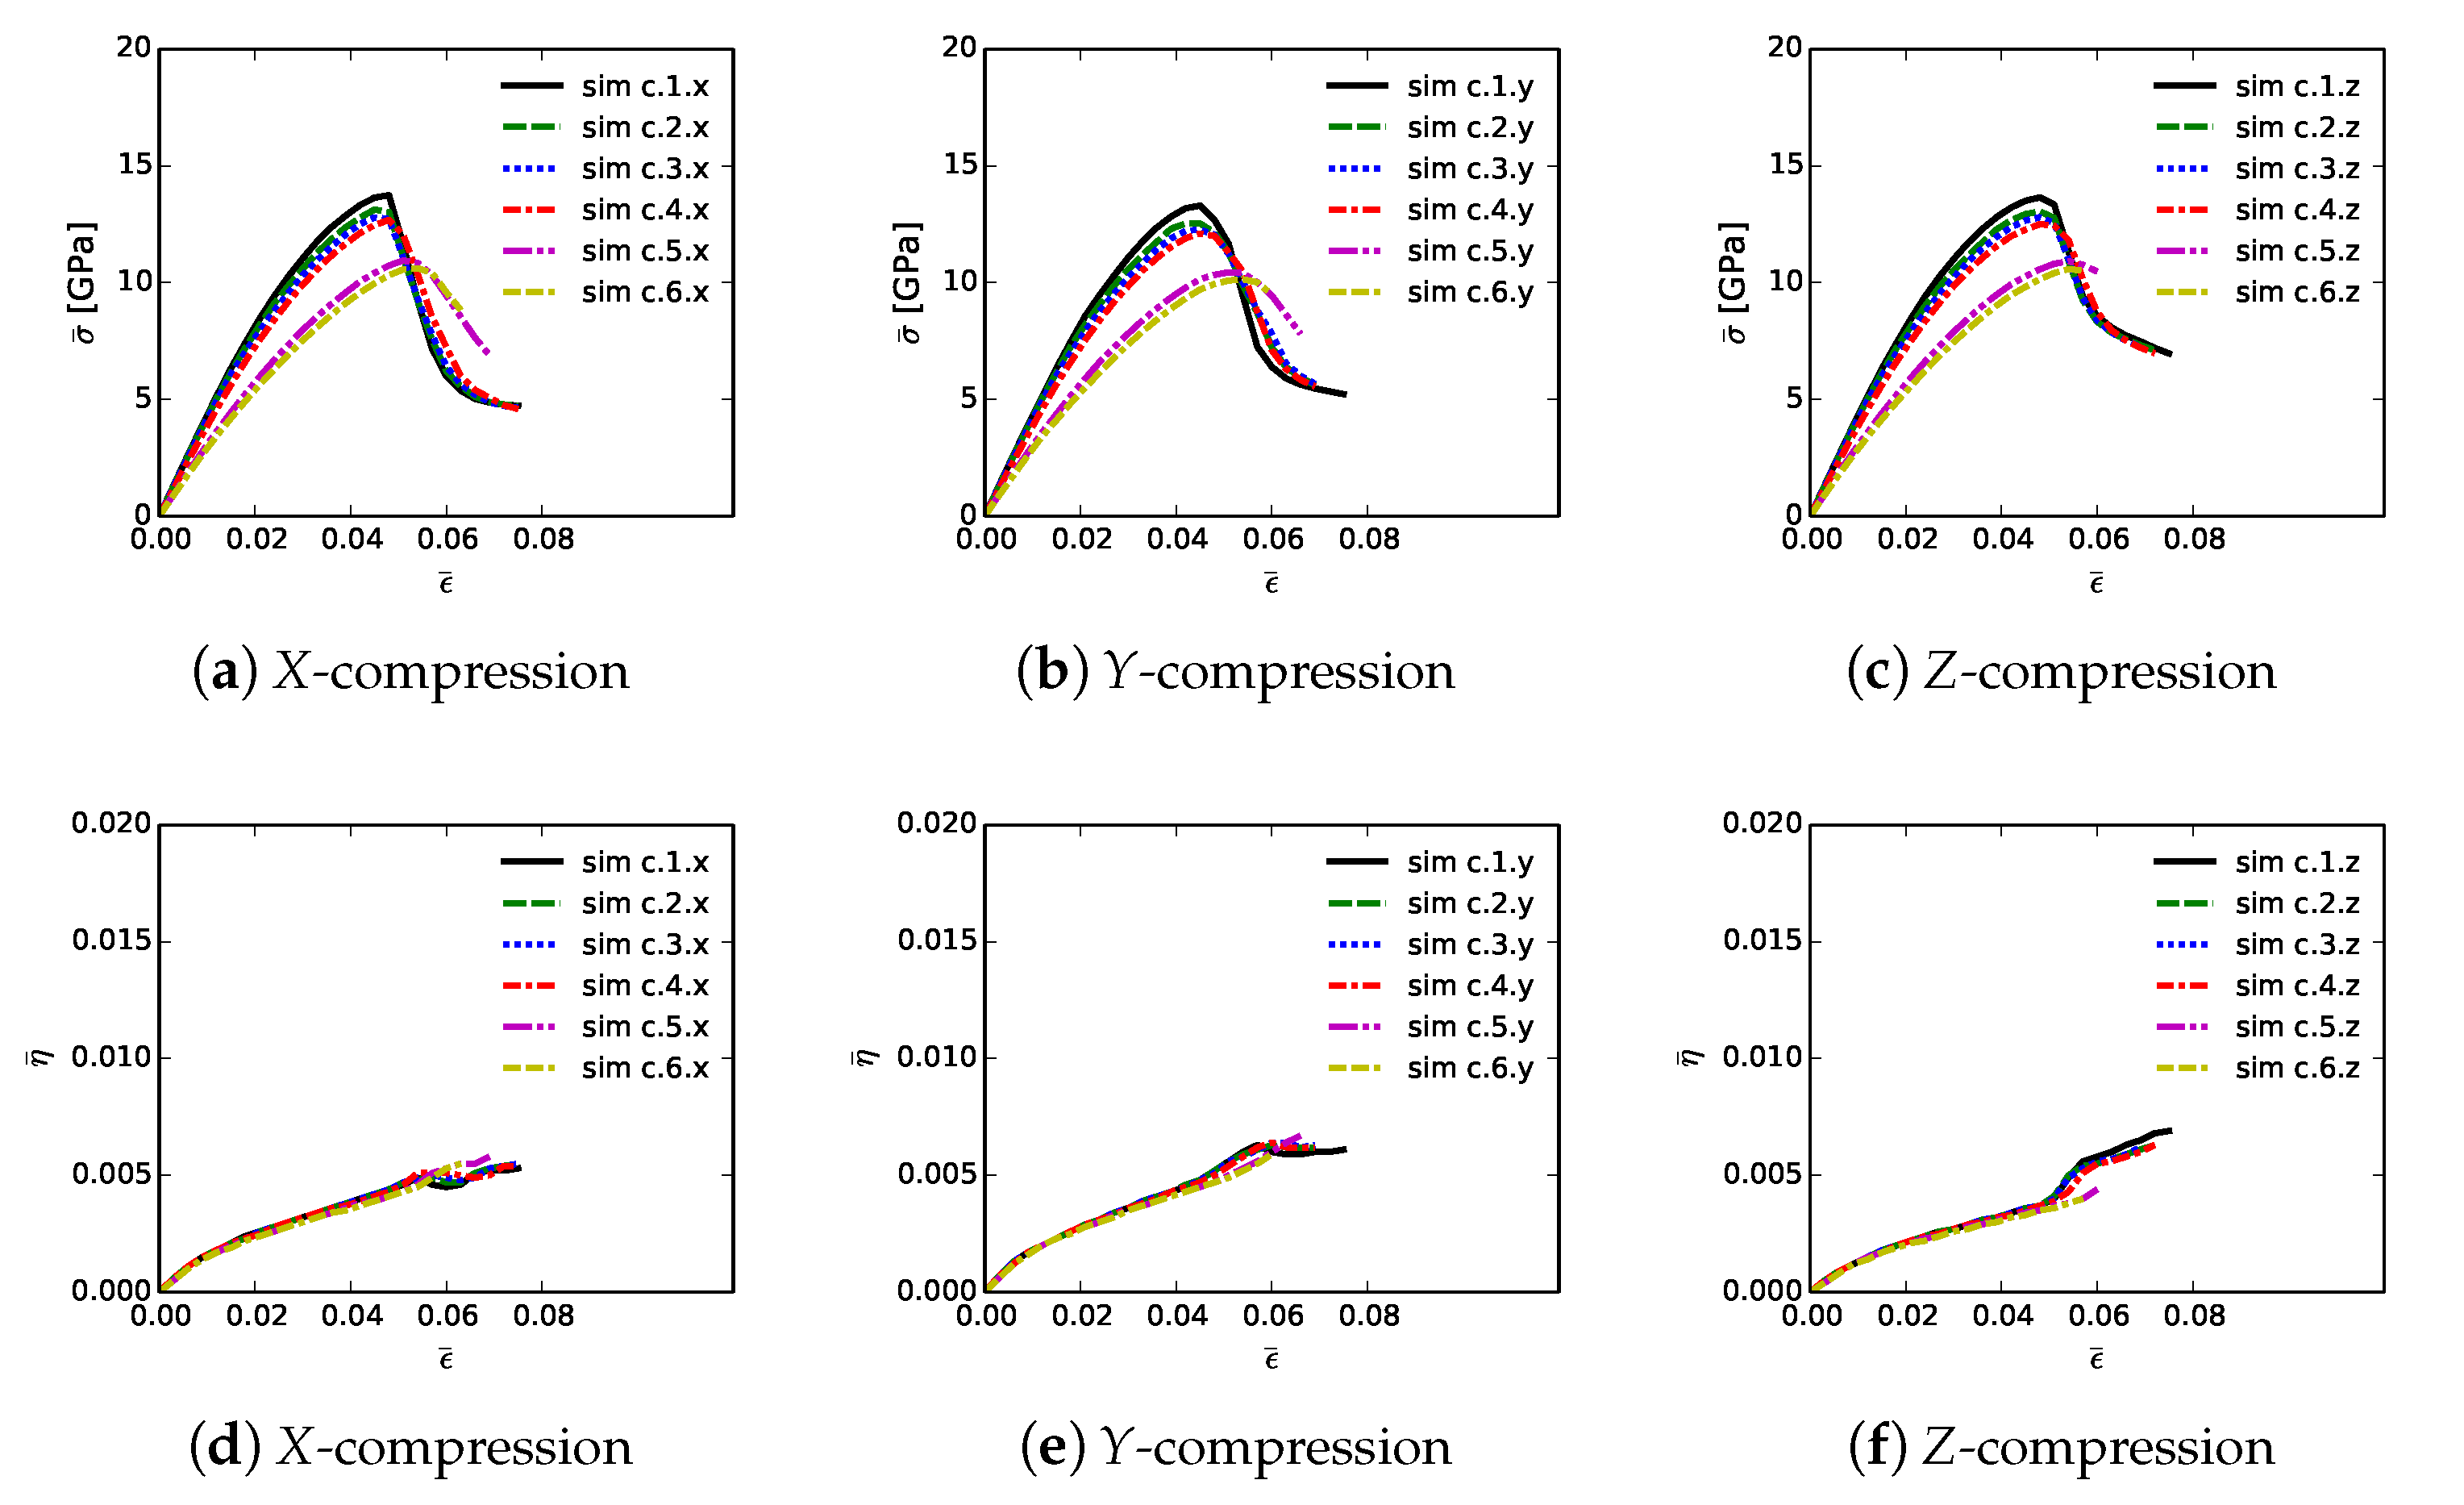
Volume averages of solution variables are shown in
Figure 10. These are computed according to (
32) and (
33), for all 18 simulations listed in
Table 4, and are plotted versus axial compressive strain
of (
31). Average effective stresses are given in parts (a), (b), and (c), for respective loading directions
X,
Y, and
Z. Average stress are usually largest for simulations b.1.
up until peak loading. These contain more discrete SiC crystals than b.5.
and b.6.
, so are less prone to fail by GB decohesion at grain/phase boundaries. Lowest strength and tangent stiffness are demonstrated by cases b.4.
, which contain graphite as the GB layer material and a high fraction of diamond-SiC boundaries controlling matrix failure. Fracture energy of graphite used in simulations (weak basal planes) is notably lower than the average fracture energy of SiC-SiC and diamond-SiC boundaries. Additionally, diamond-SiC boundaries are weaker than SiC-SiC boundaries (
Section 5), explaining lower compressive strengths of cases b.
.
relative to b.
.
, where
and
. Differences in average stress–strain behavior are very small among cases with the same lattice orientation distributions and area fractions of SiC-SiC versus SiC-diamond boundaries, but with different grain and phase boundary energy distributions. Effects of loading direction and lattice orientation are detectable, but still small, upon comparison of like simulations b.
.
in parts (a), (b), and (c) of
Figure 10.
Average twinning parameter
is shown in
Figure 10, parts (d), (e), and (f). This is physically related to the average volume fraction of twinned material in the composite, noting from
Section 3 that diamond does not twin, but single crystals of
-SiC may twin in simulations depending on orientation and stress state. Results shown here are similar to those for cases a.1.
and a.2.
in
Figure 6. Magnitudes are sensitive to initial lattice orientation, and thus loading direction, with cases b.
.y in
Figure 10e exhibiting generally lower average
than the other directions in
Figure 10d,f. Average twinned fraction does not vary with GB fracture energy distribution at strains up to peak load,
. Subsequently at larger strains, heterogeneous deformation and stress fields induced by fractures lead to different twinning behaviors among different cases in each of parts (d), (e), and (f) of
Figure 10.
Table 5 contains mean simulation data at the point of maximum average compressive stress: peak stress
, axial compressive strain, i.e., ductility, at this stress level denoted
, and cumulative stress work
defined generally in (
34) at applied strain
. Data on each row correspond to the arithmetic mean of values for each of the three loading directions and orientation distributions for each of the six microstructures. Variations of peak normal stress among each of the three directions are also listed in each row.
Trends in
match those of effective stress
reported in the context of
Figure 10. Cases b.1.
differ slightly due only to different GB fracture energy distributions, with average and variations of values of peak strength of 16.06 and 0.50 GPa, respectively. These are compared to baseline peak unconfined strength 16.91 GPa, with variation 0.39 GPa, for simulations a.1.
, which assumed uniform toughness of matrix phases corresponding to transgranular fractures. Use of distributed energies for intergranular fractures therefore leads to a decrease in peak average strength and an increase in variability
. Ductility
and cumulative work
are also reduced: 0.052 (a.1.
) versus 0.049 (b.1.
) and 0.517 GJ/m
(a.1.
) versus 0.464 GJ/m
(b.1.
). Graphite in simulations b.3.
and b.4.
reduces
by around 1.7 GPa and decreases
by around 0.05 GJ/m
. These reductions, though less severe, are consistent with those observed previously in
Table 3. Unconfined compressive strength
, strain
, and energy
are slightly reduced in cases b.5.
and b.6.
. Recall that these cases contain more SiC matrix regions, and hence more material susceptible to intergranular fracture than baseline simulations b.1.
and b.2.
. The current results again show that replacing SiC GB layers with graphite substantially reduces both peak strength and ductility, consistent with some experiments [
16,
17] that indicate deleterious effects of graphite. Furthermore, when matrix failure is affected by non-uniform distributions of GB fracture strengths, overall integrity of the composite is reduced relative to simulations in which local GB fracture energies are uniformly assigned.
7. Phase Field Theory: Defective Matrix and Gb Regions
The model of
Section 2,
Section 3 and
Section 5 is extended to account for processing defects, namely graphitic inclusions and pores. Graphite is assumed to present itself in the form of thin layers or lamellae between fine matrix grains, especially in the vicinity of SiC-diamond and SiC-SiC interfaces [
14,
15,
16]. Pores also tend to arise in the vicinity of grain and phase boundaries, rather than within individual crystals. Physical dimensions of these entities are typically on the order of 10 nm, though sizes may vary between several and several hundred nm. These defects are around two orders of magnitude smaller than the bulk diamond grain size
[
12,
13,
14,
15]. Residual silicon (Si) can also appear in small inclusions depending on processing, but is omitted in the present study.
In the current context, resolution of discrete defects (graphitic nano-layers, inclusions, and voids) is intractable using phase field theory when the entire domain contains numerous larger single crystals. Exceedingly refined FE meshes with an immense number of elements would be required. Instead, properties are homogenized for representative isotropic materials that address defect content in an average sense within thicker resolved layers surrounding bulk grains as well as the nanocrystalline matrix. These representative materials, in fully dense form, are assigned effective elastic constants based on properties and volume fractions of their solid constituents tabulated in
Section 3. Effective surface energies for fracture at SiC-SiC or SiC-diamond interfaces within representative mixtures are obtained from
Section 5. Finally, homogenized properties for elasticity and fracture strength are degraded according to the initial void volume fraction, if nonzero. Specifically, the effective isotropic bulk and shear moduli are reduced with porosity using the self-consistent theory of [
97], which is further discussed in [
98,
99]. The fracture surface energy is reduced proportionally to the effective elastic modulus, following the empirical model and observations from [
100,
101,
102].
This homogenized material (crystalline SiC matrix + fine-scale GB interfaces + graphite + pores) is herein referred to simply as the “effective material”. The present approach parallels that introduced previously for defective GB regions in [
23]. A comprehensive account of the model features outlined in
Section 7.1,
Section 7.2 and
Section 7.3 can be found in that reference [
23], including a physical description of microstructure features and length scales, derivations of averaging methods, and justifications and limitations of the model. Notably, this homogenization scheme for effective properties produces effective moduli and fracture energy that depend explicitly only on the known properties and volume fractions of the constituents, without recourse to ad hoc parameters.
Different microstructures of diamond-SiC composites can be achieved depending on choices and proportions of starting materials and processing routes [
10,
11,
12,
13,
14,
15,
16,
103]. Theoretically dense materials can be produced via infiltration of inter-crystalline regions by the matrix phase [
11,
16]. In materials with finite porosity [
13,
103], voids are usually found at local grain and phase boundaries in the matrix, rather than within bulk single crystals. Graphite may present itself in layered or agglomerated forms [
14,
16,
69,
104]. Ranges of porosity and graphite fractions investigated computationally (i.e., up to 8% of total volume) are motivated by percentages reported elsewhere for various diamond-SiC composites [
13,
14,
16,
103]. Although higher porosities may arise in other ceramics [
102], the maximum porosity realistically modeled here is capped by limits of elastic homogenization in
Section 7.2, e.g., with theoretical error on degraded shear modulus on the order of the square of porosity [
97].
7.1. SIC-Graphite Solid Mixture
The local volume fraction of solid material in the effective material occupied by graphite is denoted by
, such that
is the solid fraction of cubic nanocrystalline SiC. Denote by (
) the isotropic bulk moduli
of (SiC, graphite) phases. Denote by (
) the isotropic shear moduli
of (SiC, graphite). Effective isotropic elastic constants for this mixture are the arithmetic average of upper and lower Hashin-Shtrikman (H-S) type bounds for two-phase composites [
105]:
Numerical values of
and
from
Table 1 are inserted into (
37) to yield
for the solid mixture that depend uniquely on
. Elastic constants are assumed unaffected by grain boundaries. As shown in [
23], the average of the H-S bounds for this material system is nearly identical to the Hill average, so the latter (whose derivation does not imply isotropy of each individual phase) could be used instead without consequence.
Upper and lower bounds for
, the effective fracture surface energy for the solid mixture, are estimated as respective Voigt and Reuss averages:
Subscripts
and
correspond to properties of the SiC phase and graphite, respectively. Fracture surface energy of SiC can be calculated in one of three ways, depending on the location and composition of the material element in question. The first way, as used in [
23], invokes
from
Table 1, where weak links are assumed to be
cleavage planes. The second way invokes either the mean or distribution of
as calculated in
Section 5.2, assuming weak links are SiC-SiC grain boundaries. Since the mean GB energy is coincidentally equal to the
cleavage energy for 3C-SiC, both assumptions provide the same result when uniform properties are assigned. On the other hand, when distributions of SiC-SiC GB fracture energies are imposed as in
Section 6, the two assumptions yield different local properties for each element of effective material. The third way assumes SiC-diamond boundaries are weak links in the matrix phase in the absence of graphite, whereby the mean or distribution of
as calculated in
Section 5.3 is used, depending on whether uniform or heterogeneous GB strengths are applied. This third method would realistically apply for regions of effective material in close proximity to diamond grains, where behavior of phase boundaries dominates. Such is the case for the present material system, suggested by much weaker diamond-SiC boundaries than SiC-SiC boundaries and SiC cleavage planes according to MD results of
Section 5.
Importantly,
. The upper bound in (
38) was used to represent spherical graphitic inclusions in a recent phase field study [
23]. In that work, effects of graphite on predicted failure behavior were relatively small for volume fractions
. In the present work, the lower bound
is used, as it is thought to be more applicable to address effects of thin layers of graphite that more drastically degrade material integrity. For example, reductions in indentation hardness of 20 to 30 GPa were observed [
16] for a diamond-SiC composite containing ≈0.5–5 % graphite in layered form concentrated around diamond crystals.
In this paper, graphite is treated as an elastic material that may fracture on weak (0001) planes. Phase transformations, plasticity, and sliding mechanisms that could lead to toughening under high confinement, pressure-shear conditions [
19] (e.g., indentation) are not included since maximum pressures attained under the present uniaxial stress loading conditions are much lower. Prescription of a fracture energy increasing with defect fractions would provide increased integrity of the composite as shown in [
23], contradicting many, but not all, experimental results.
7.2. Porosity
Voids degrade elastic properties following a self-consistent scheme [
97,
98,
99]. Let
, within possible range
, represent the pore volume fraction, with
the mass density of the undeformed material with voids and
the mass density of the undeformed solid without voids. Denote by
,
, and
the bulk modulus, shear modulus, and Poisson’s ratio of the solid of density
, computed according to (
37). Let
,
, and
denote, respectively, the effective bulk modulus, shear modulus, and Poisson’s ratio of the material with voids, of density
. Then, following [
97,
99],
The constraints and , where , maintain a nonzero effective stiffness, e.g., if is large.
Based on theoretical derivations and experimental observations on various ceramics and brittle solids [
100,
101], effective fracture surface energy for the porous mixture,
, is assumed to be affected by pores analogously to the elastic modulus of the porous mixture,
. With Poisson’s ratio and Young’s modulus
and
, and complementary definitions for
and
,
The lower bound in the second of (
40) is used subsequently herein, consistent with remarks in
Section 7.1 As discussed in detail in [
23], the reduction in fracture energy due to voids in (
40) is based on empirical evidence for other ceramics [
100,
101,
102]. It has not been verified for a SiC-graphite composite with nano-voids pertinent to the present simulations, for which experimental toughness data versus defect volume fractions (porosity and graphite) do not exist. In certain cases, considered briefly in prior work [
23], pores have been observed to improve, rather than degrade, toughness [
102].
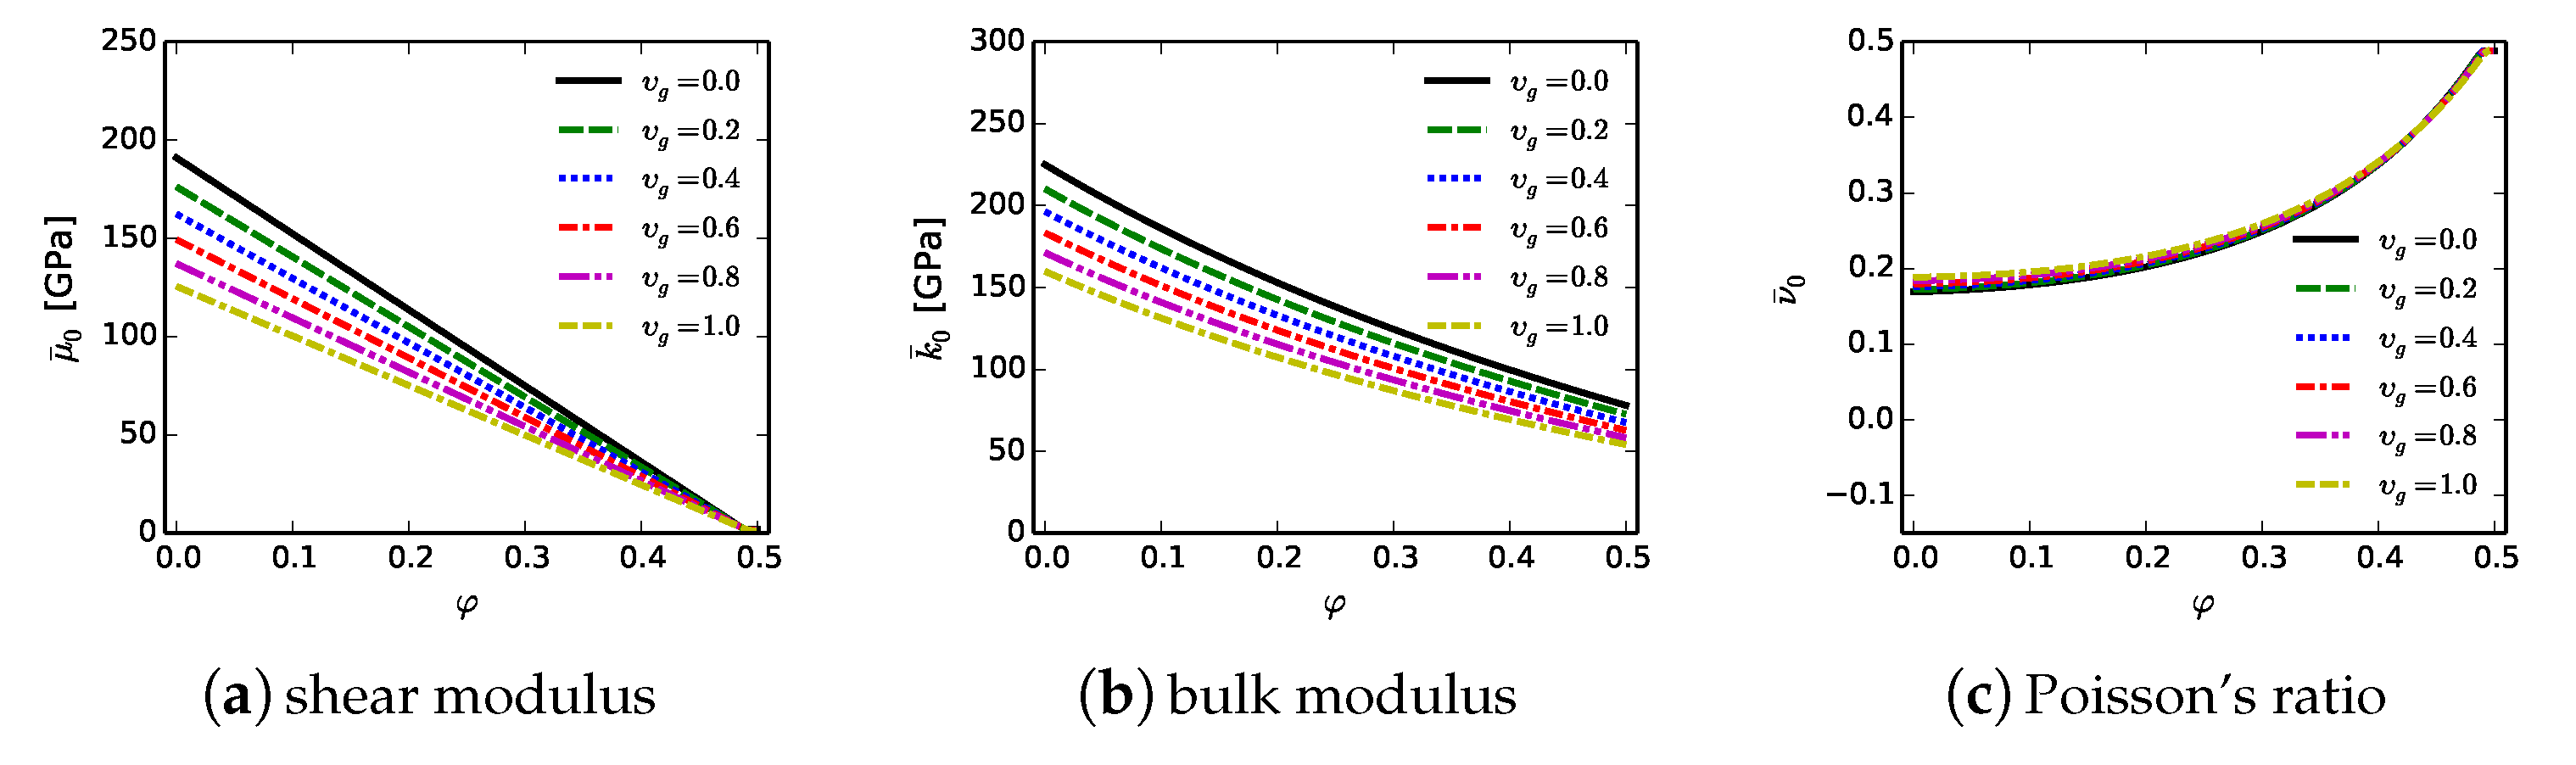
7.3. Effective Phase Field Properties
The phase field framework of
Section 2 for bulk crystals, informed by
Section 5 for GB fracture energies, is modified slightly to describe effective material regions with sub-scale defects. Elastic (
) and fracture (
) properties depend on the initial void volume fraction
and the solid fraction of graphite
according to
Section 7.1 and
Section 7.2. Ranges of elastic stiffnesses
,
, and Poisson’s ratio
from (
39) are shown in
Figure 11 [
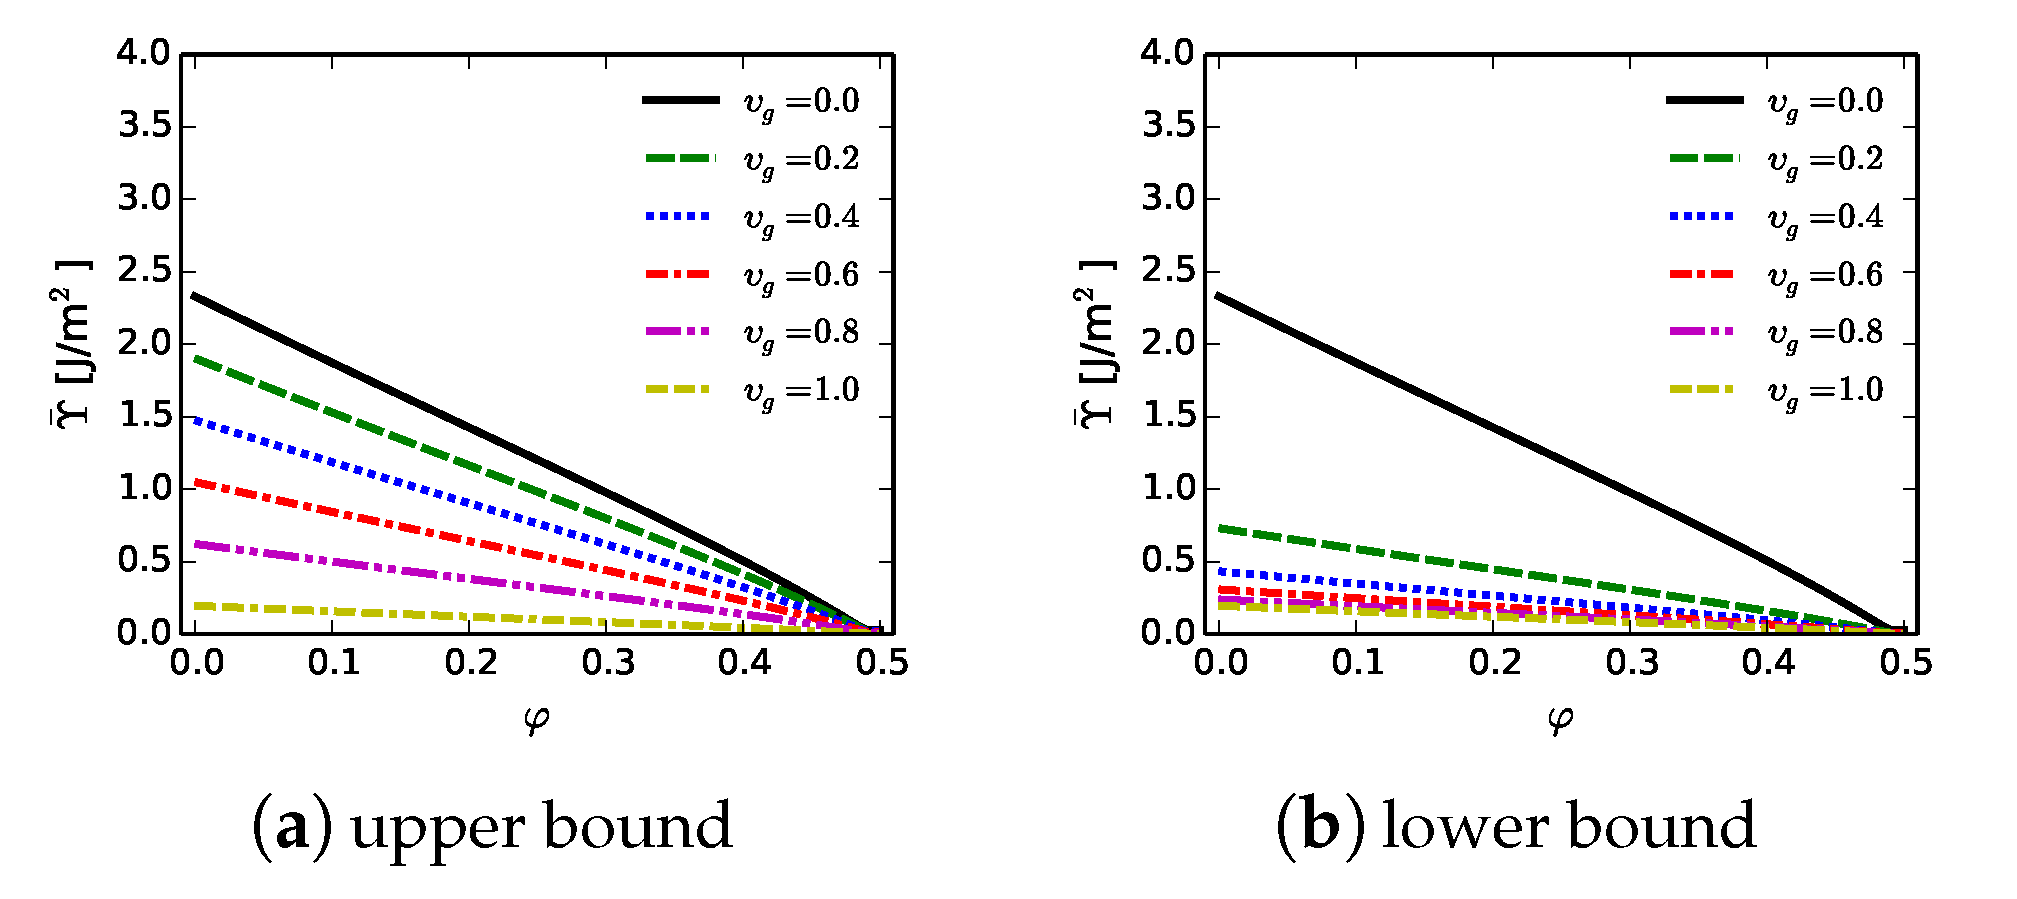
23]. Estimated upper and lower bounds on fracture energy
computed from (
40) are shown in
Figure 12. Here,
J/m
is used for the SiC phase, though in calculations, ranges are possible depending on which of the assumptions for
are invoked from
Section 7.1. Fracture energy
decreases with increasing graphite fraction. Decreases are more dramatic for the lower bound approximation in
Figure 12b, which is invoked subsequently in calculations of
Section 8. The rationale is that failure by separation of basal planes in graphite is assumed to dominate the overall fracture energy of the effective material when the graphite manifests in thin layers that percolate throughout grain and phase interfaces.
Since the effective material is idealized as isotropic,
. Values of
,
, and
l are identical to their counterparts in
Table 1, which do not vary with solid constituent. Twinning, by nature a highly anisotropic process, is omitted following reasons outlined in
Section 3 for the model of isotropic matrix phases. Cavitation or bulking associated with opening of newly formed fracture surfaces is omitted here in the effective material (i.e.,
) since existing pores provide free volume to accommodate localized expansion, and since graphitic layers provide lubrication to fractured areas whose asperities might otherwise induce expansion upon relative slippage of free surfaces.
9. Conclusions
A phase field theory has been informed by characterization experiments, MD simulations, and micromechanics-based homogenization. The framework has been implemented to study deformation and failure of ceramic composites. The material consists of diamond and SiC, with a range of grain sizes and initial defects in the form of graphitic layers, graphite inclusions, and voids. Distributions of fracture energies for SiC-SiC and diamond-SiC interfaces have been obtained from MD simulations, where grain boundary character has been deduced from EBSD measurements on a representative material sample. Similarly, statistical grain size data have been used to construct a realistic FE rendering for phase field simulations. Simulation data from MD and experimental data from EBSD are new features not considered in prior phase field studies [
23,
24,
25]. Baseline simulations have considered the most physically realistic microstructure, containing 70% diamond and 30% SiC, where the latter is distributed among discretely resolved grains, isotropic matrix, and grain boundary layers. Parametric studies have probed different microstructures containing different phase content, different fracture energy distributions, and different defect content (graphite and porosity). Notable findings are summarized below:
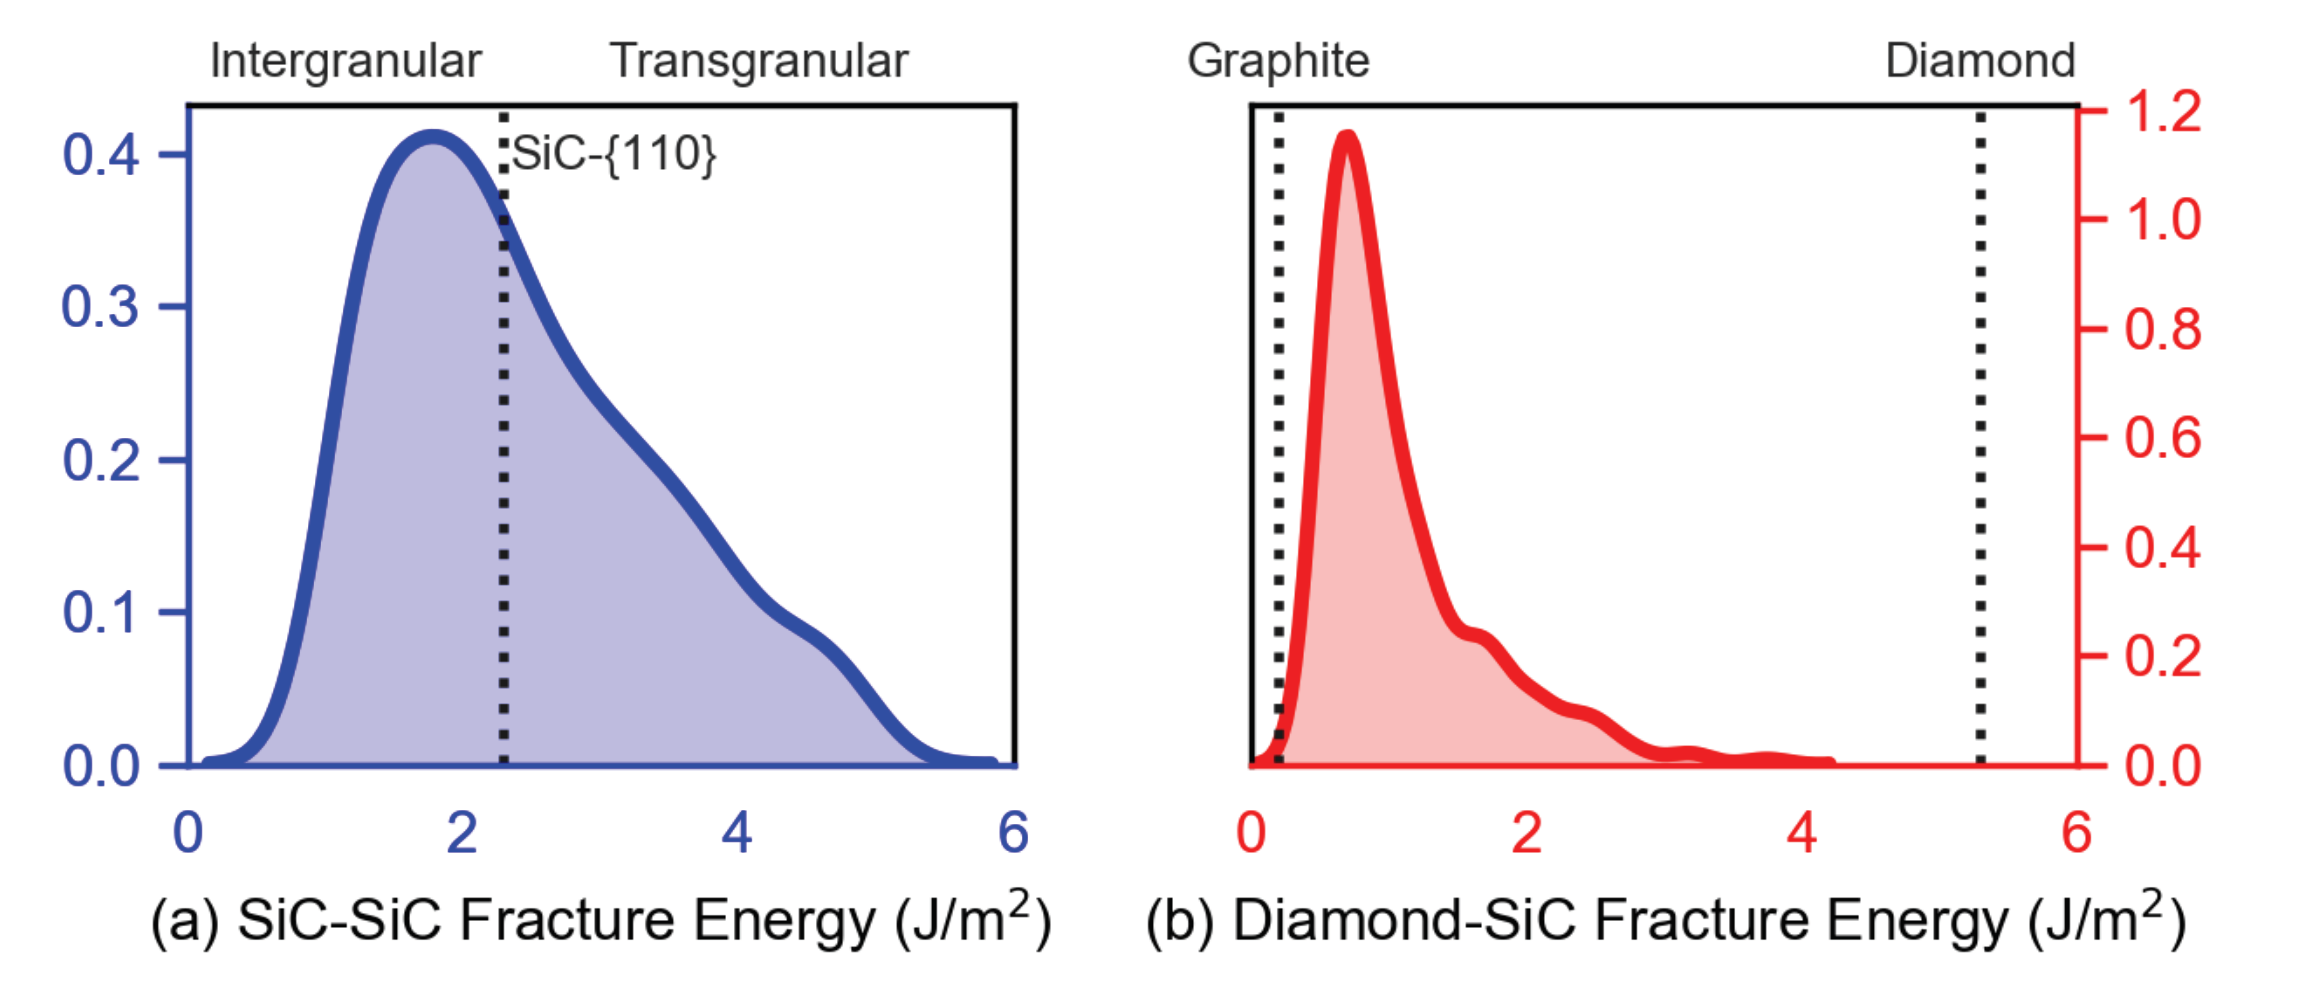
Mean fracture energies of diamond-SiC interfaces predicted from MD simulations are substantially lower than those of SiC-SiC interfaces;
Peak strength and tangent compressive stiffness of the composite increases with increasing diamond fraction when other physical properties are assumed fixed;
In the absence of porosity or graphite, diamond-SiC boundaries are the weak link in the microstructure; strength and ductility are reduced when the relative fraction of diamond-SiC to SiC-SiC potential fracture sites increases;
Peak strength and ductility of the composite are substantially reduced when graphitic layers encase large diamond crystals, and these properties are even more compromised when the same fraction of graphite is distributed throughout the whole microstructure;
Low concentrations of pores and graphite have moderately deleterious effects on strength, but neither significantly reduces the strain at peak load, i.e., these defects do not substantially reduce ductility;
High global concentrations of pores (8%) cause a much more drastic drop in strength and stiffness than the same global fraction of graphite;
Twinning occurs in favorably oriented SiC crystals and is sensitive to lattice orientation distribution, but it does not notably alter the overall stress–strain response for the microstructures considered herein.
The above conclusions imply that diamond volume fraction should be maximized when processing diamond-SiC composites for exceptional compressive strength and stiffness, so long as the presence of diamond-SiC boundaries, graphite, and voids can be minimized, or at least not increased, with increasing diamond fraction. Graphite is less harmful to peak compressive strength than voids of the same volume fraction. Low porosity may be tolerable, but void fractions in excess of a threshold on the order of 5% are predicted to much more severely degrade overall strength and stiffness.
The present results on compressive behavior of diamond-SiC composites await quantitative validation. However, flexure strength and fracture toughness of CVI (chemical vapor infiltration) diamond-SiC both show an increase with increasing diamond fraction [
13]. These findings are in qualitative agreement with the present simulation results that show increases in stiffness and compressive strength with increasing diamond fraction. Observed GB fractures in the SiC matrix and transgranular fractures in diamond [
13] are also consistent with the present simulations. Data relating unconfined compressive strength to graphite and porosity in diamond-SiC are likewise not available from experiments. Indentation experiments [
16] on fully dense diamond-SiC with graphitic layers show a hardness reduction as the graphite fraction increases from 0% to 0.4% to 5.3%. This decrease in hardness is qualitatively consistent with a decrease in compressive strength predicted by the present simulations. In three-point bending experiments [
12], a decreasing flexure strength due to increasing pore size was proposed. Unconfined compressive strengths of pure SiC polycrystals predicted by the phase field approach (≈7 GPa) [
23] are bounded by experimental data from macroscopic compression (5–6 GPa) [
69,
70] and micropillar compression (10 GPa) [
71], providing confidence in the modeling techniques.
New experimentation on diamond-SiC material samples of similar size and composition is therefore required for precise validation. Conventional methods (e.g., compression, flexure) may be used for average behaviors, but novel techniques are required to validate local stress magnitudes that are predicted to exceed 40 GPa concentrated in local regions of microstructure. The extreme hardness and stiffness of diamond pose challenges for mechanical experiments, especially machining of samples.
Methods developed in this work, as well as general trends in results, may be applied towards comparative studies of other dual-phase ceramic systems, especially those in which one phase is notably harder or stiffer than another. In the present case, diamond is the harder and stiffer phase, with SiC the more compliant material. Other dual-phase ceramics of this category include those with boron carbide (B
C) serving as the harder, and often less ductile phase, and either SiC [
106] or titanium diboride (TiB
) [
107,
108] the more ductile phase. Competing mechanisms of transgranular fracture in the harder phase, intergranular fracture, and fracture at phase boundaries, as well as possible partial dislocation slip [
63,
69,
109] or deformation twinning [
30,
110], are likewise observed in these material systems.
Results reported herein should be useful for design and optimization of ultra-hard ceramics for mechanical applications. Notably, diamond- and boron-based ceramics are found in industrial applications requiring very high hardness and wear resistance [
14,
16], including aerospace and machining operations [
15]. The diamond phase has the highest hardness and highest thermal conductivity of known natural materials [
15]. The second phase (SiC in this case) increases fracture toughness, providing dynamic impact resistance [
10]. Because of their unique thermal and mechanical properties, diamond-SiC composites are also of interest for high performance electronics, heat transport elements, tribological uses, and other structural systems where light weight and high stiffness are sought [
15].


