
Luminescent Carbon Dots Synthesized by the Laser Ablation of Graphite in Polyethylenimine and Ethylenediamine

 ,
,  ,
,  , and
, and 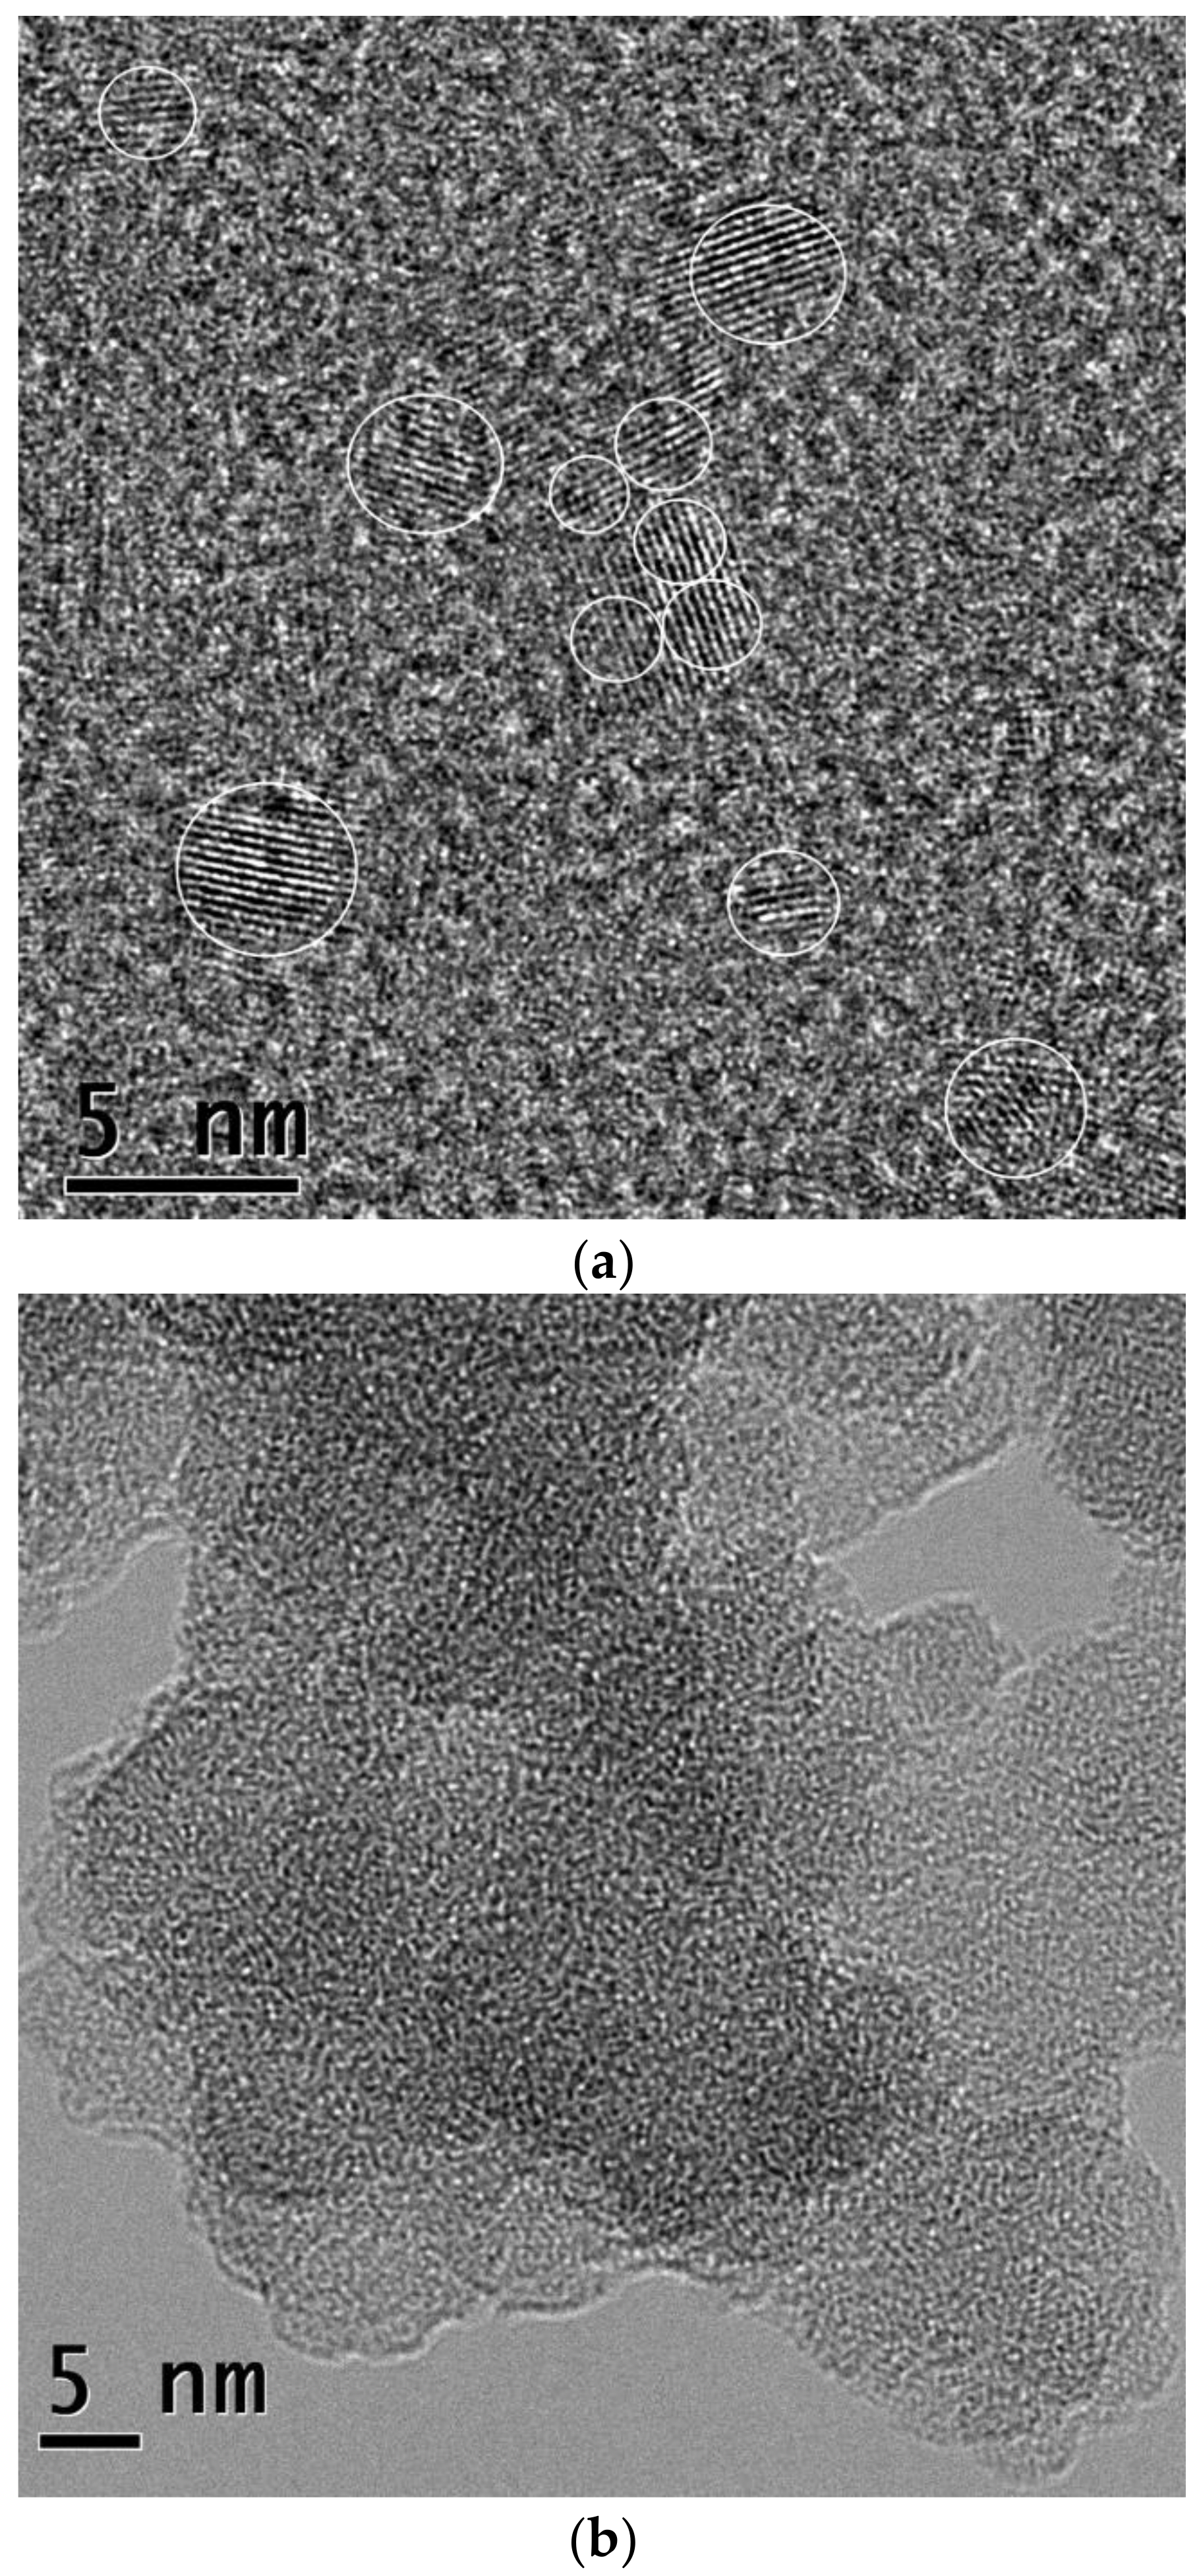
Abstract
1. Introduction
2. Materials and Method
2.1. Synthesis of CDots
2.2. Characterization
3. Results
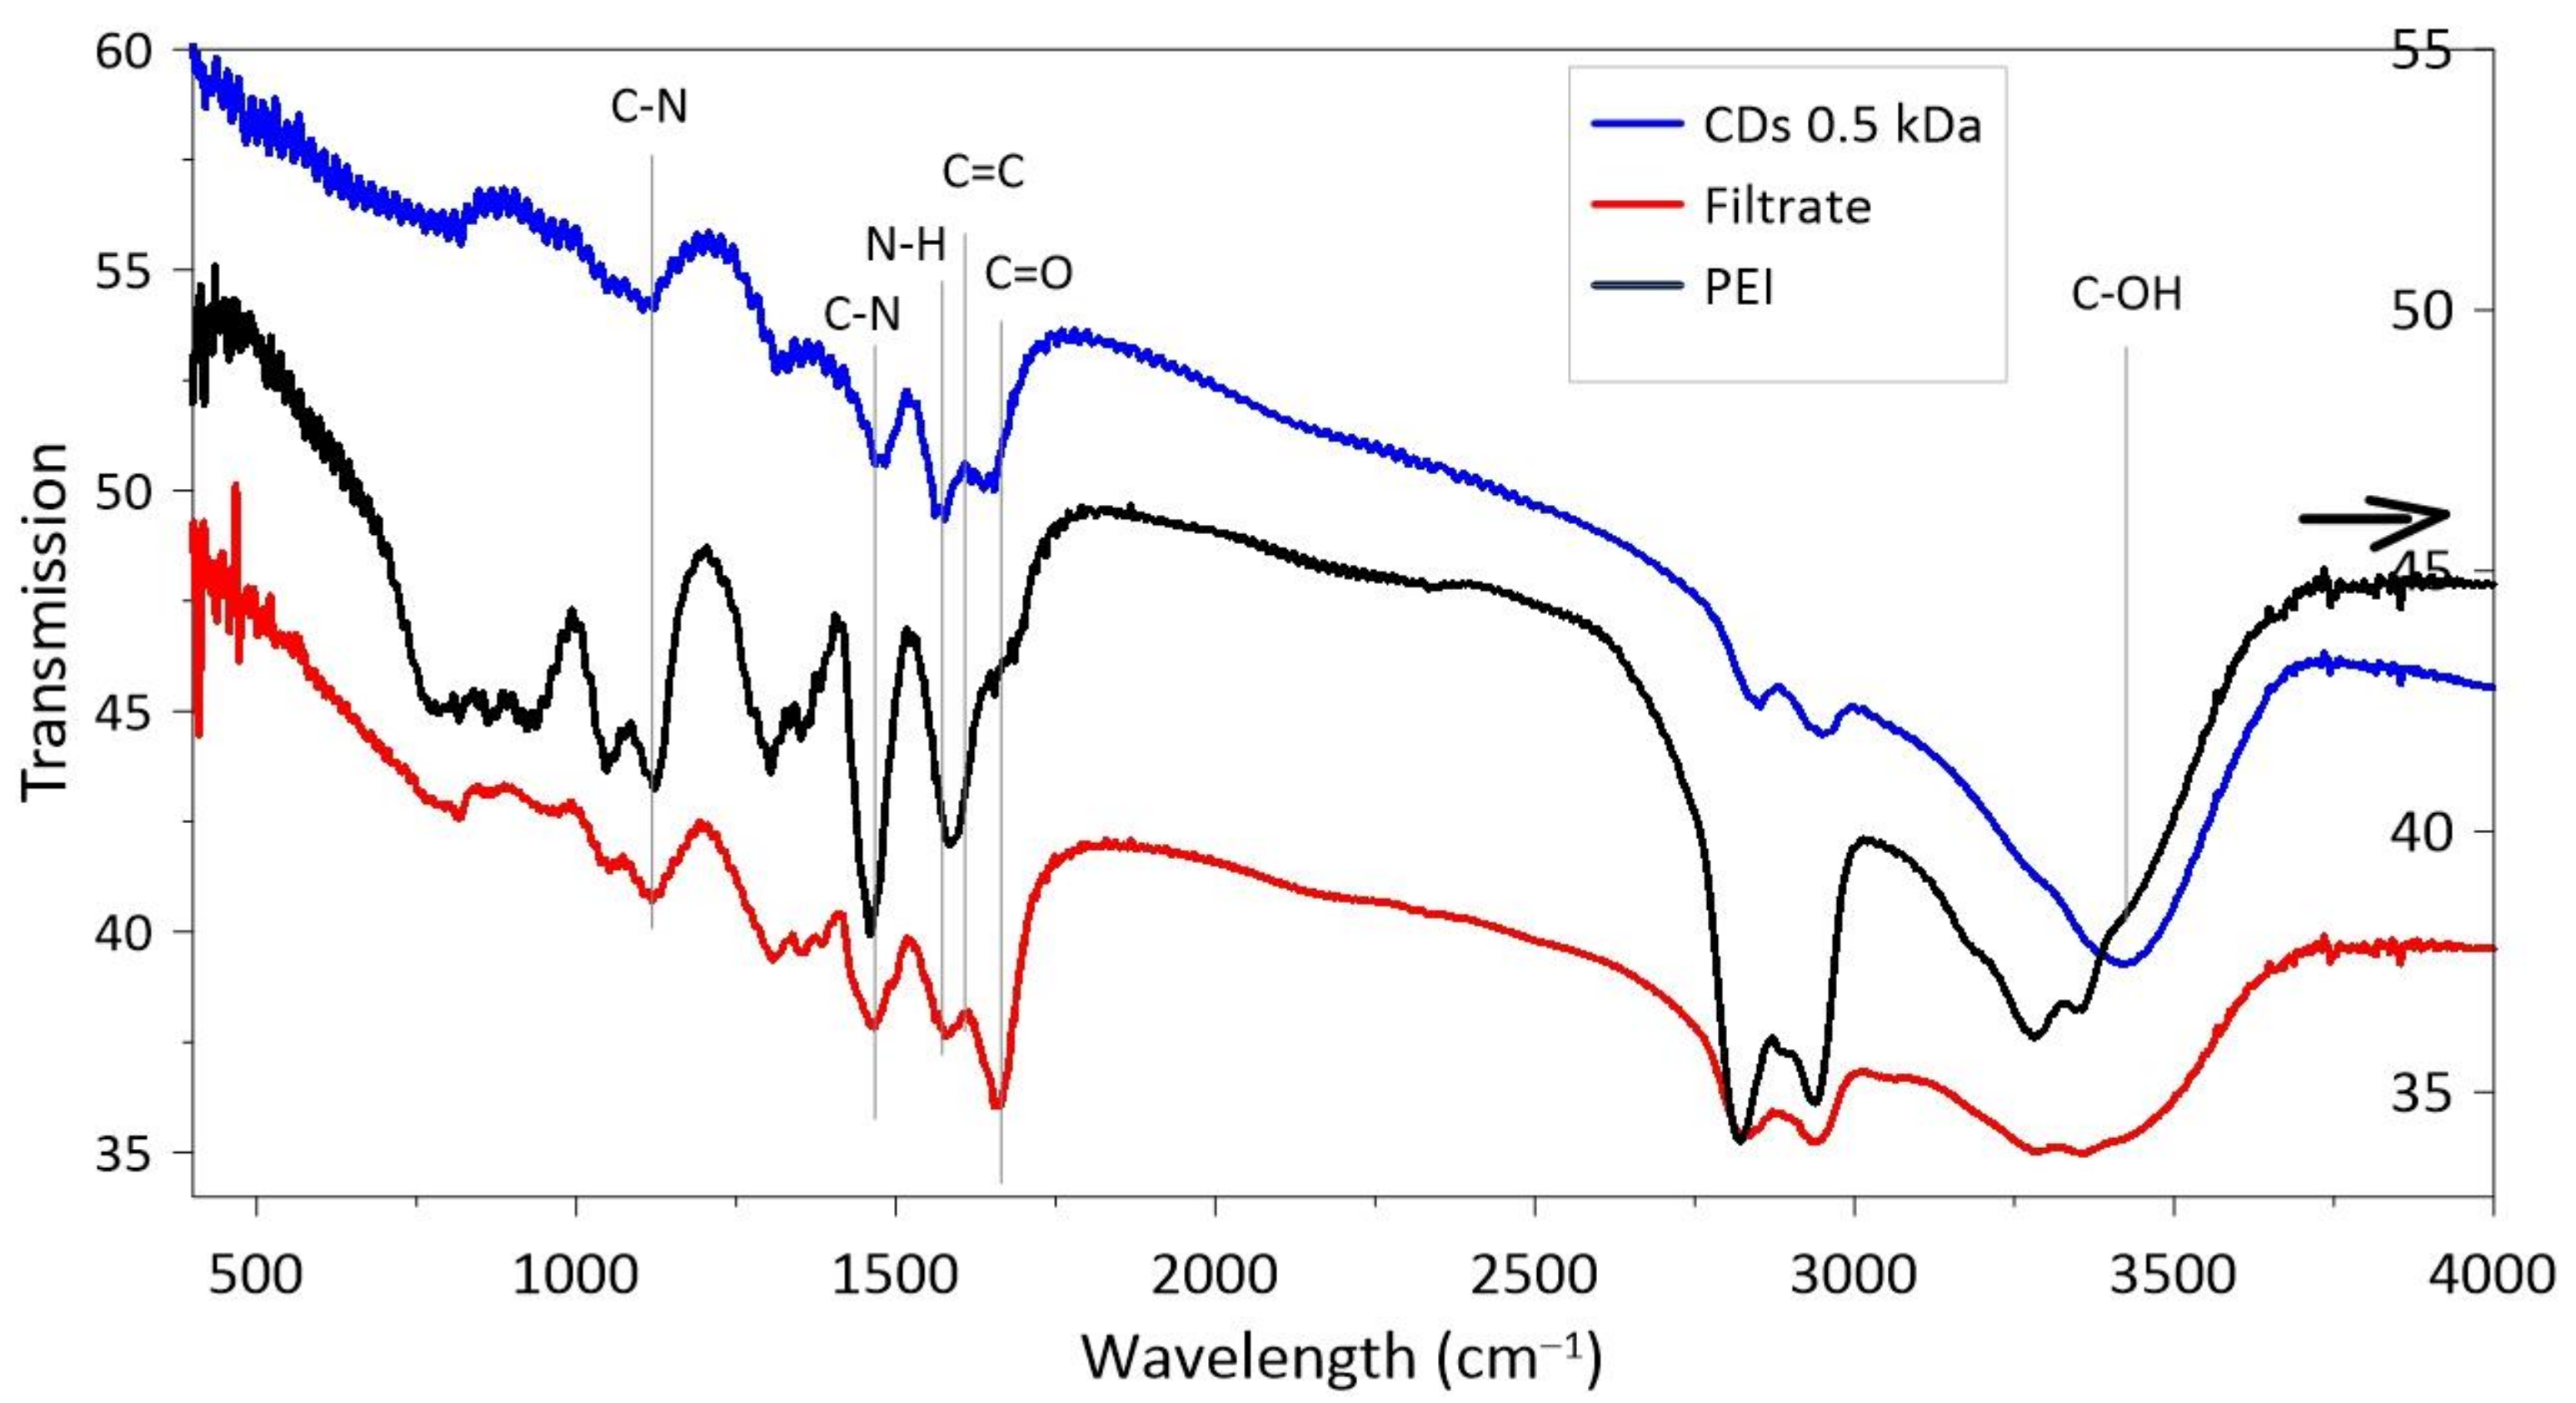
3.1. CDs Synthesized in PEI
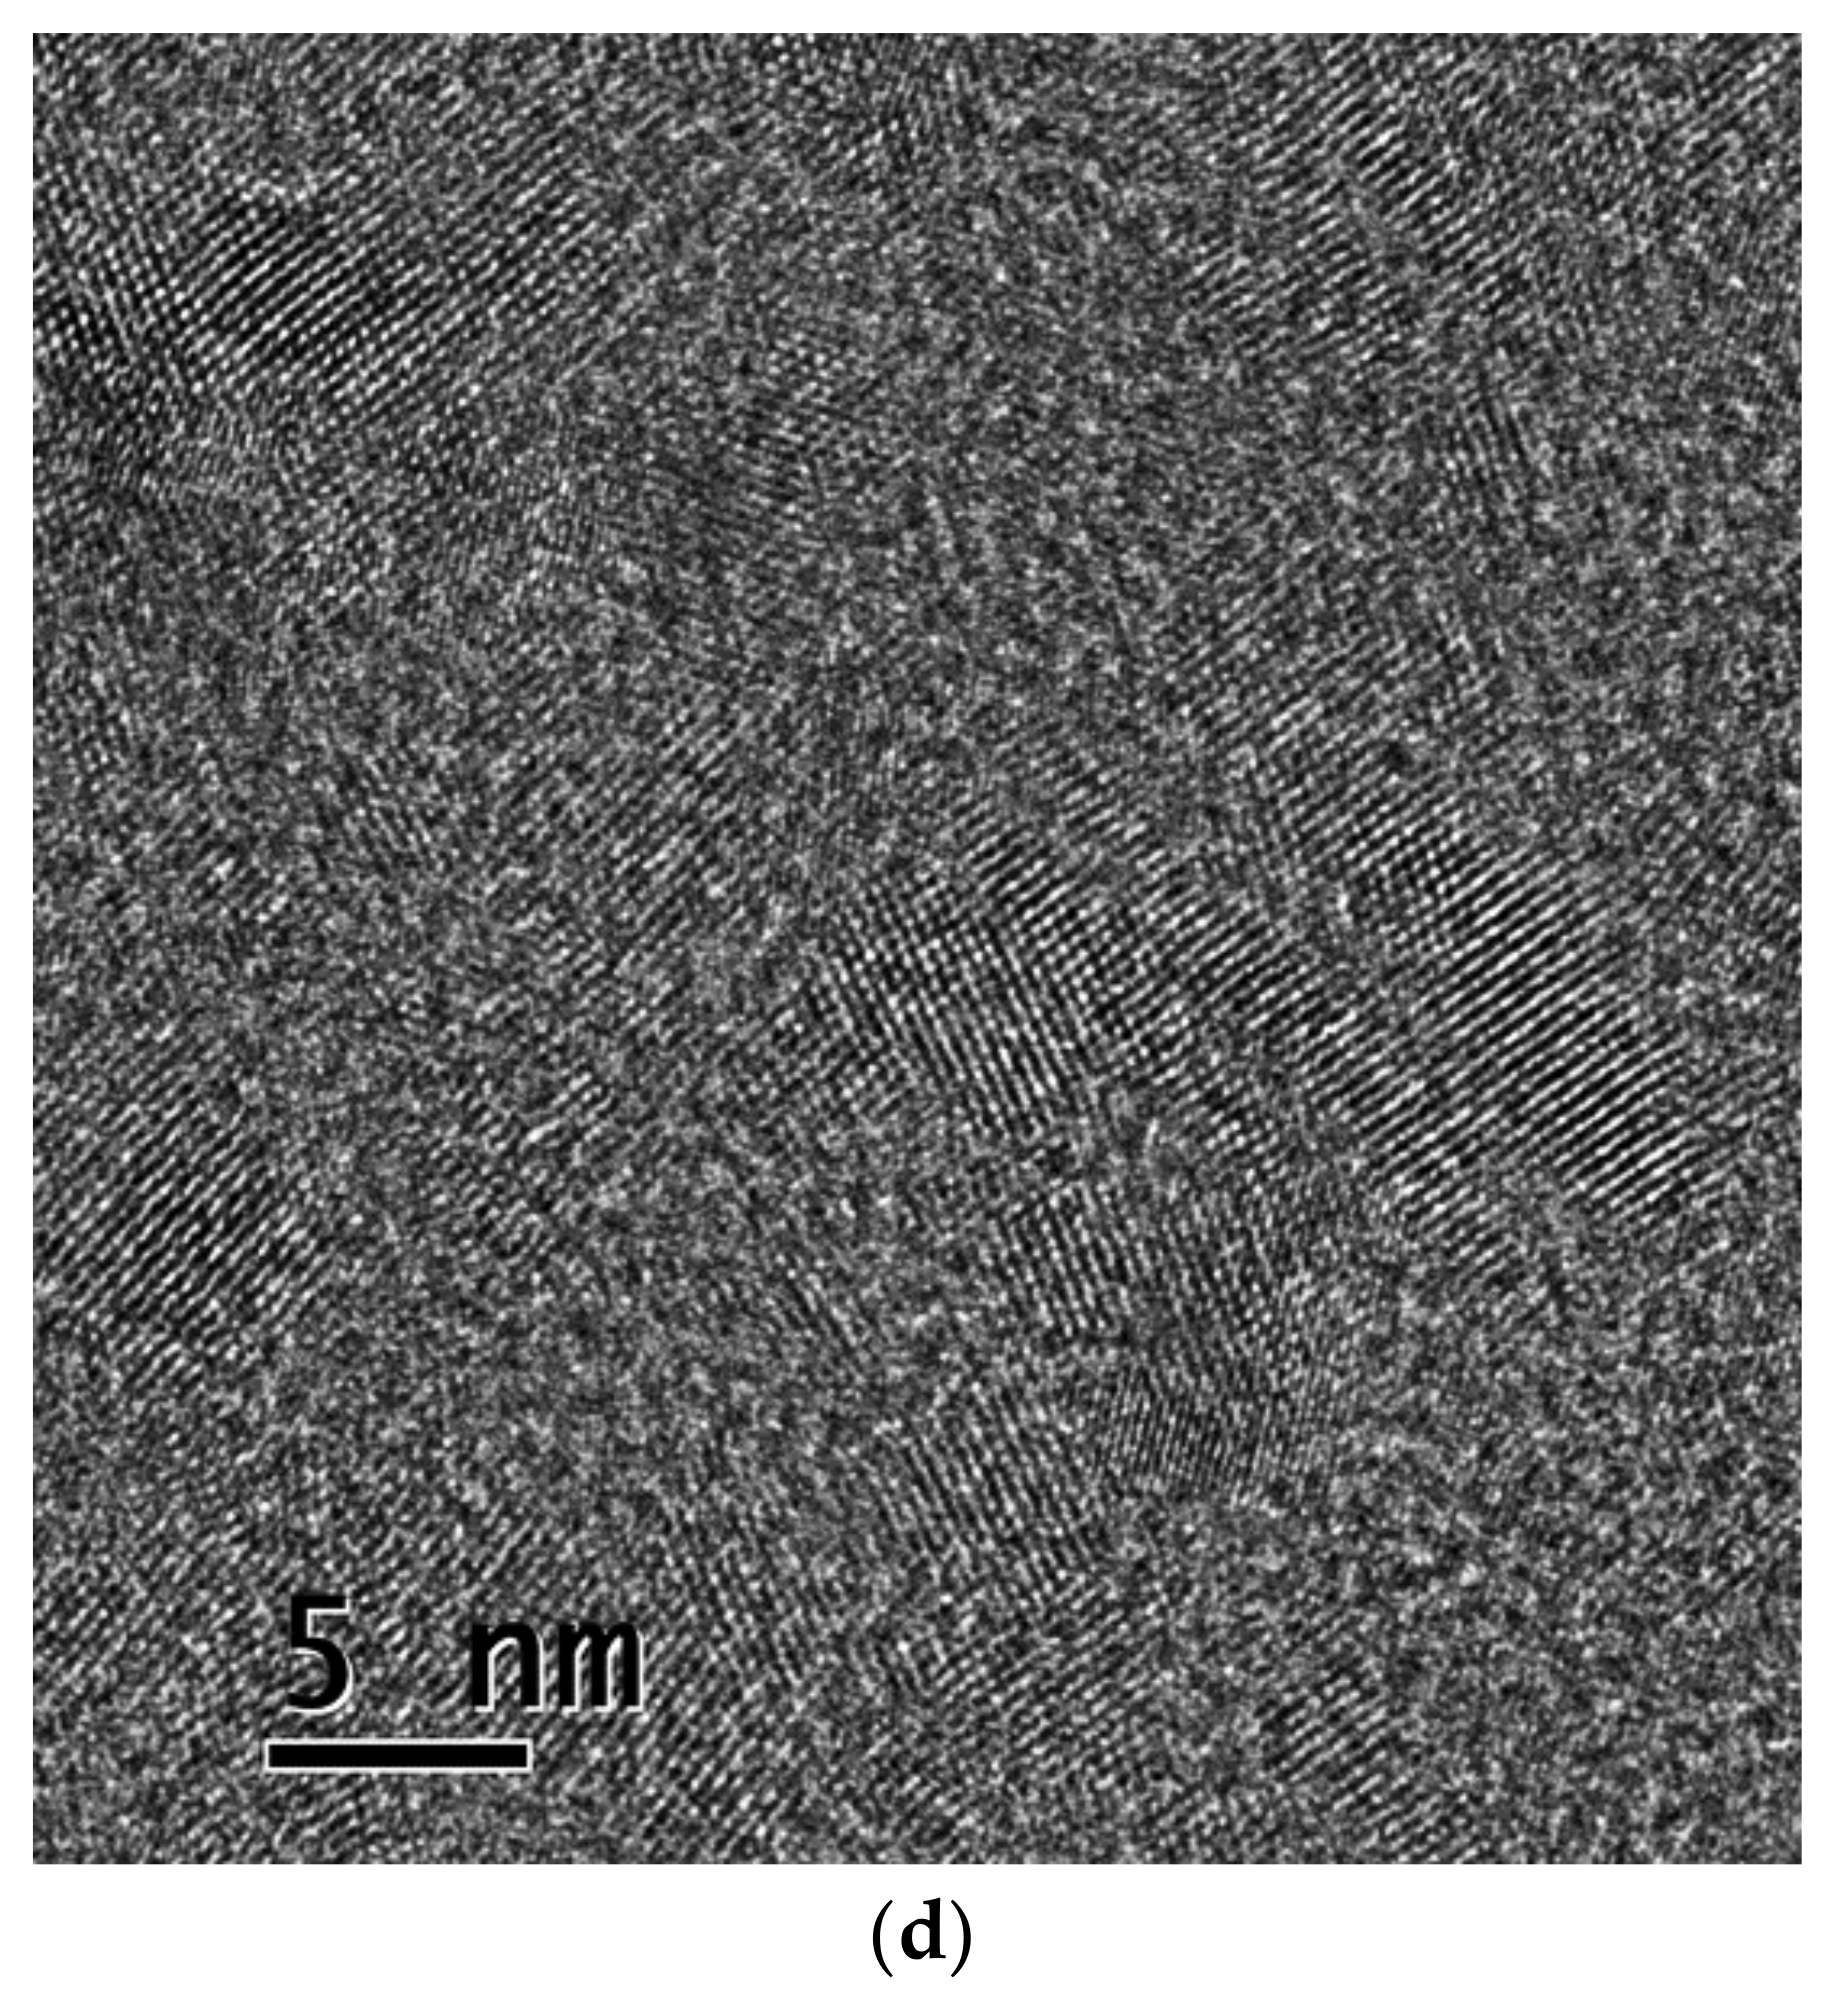
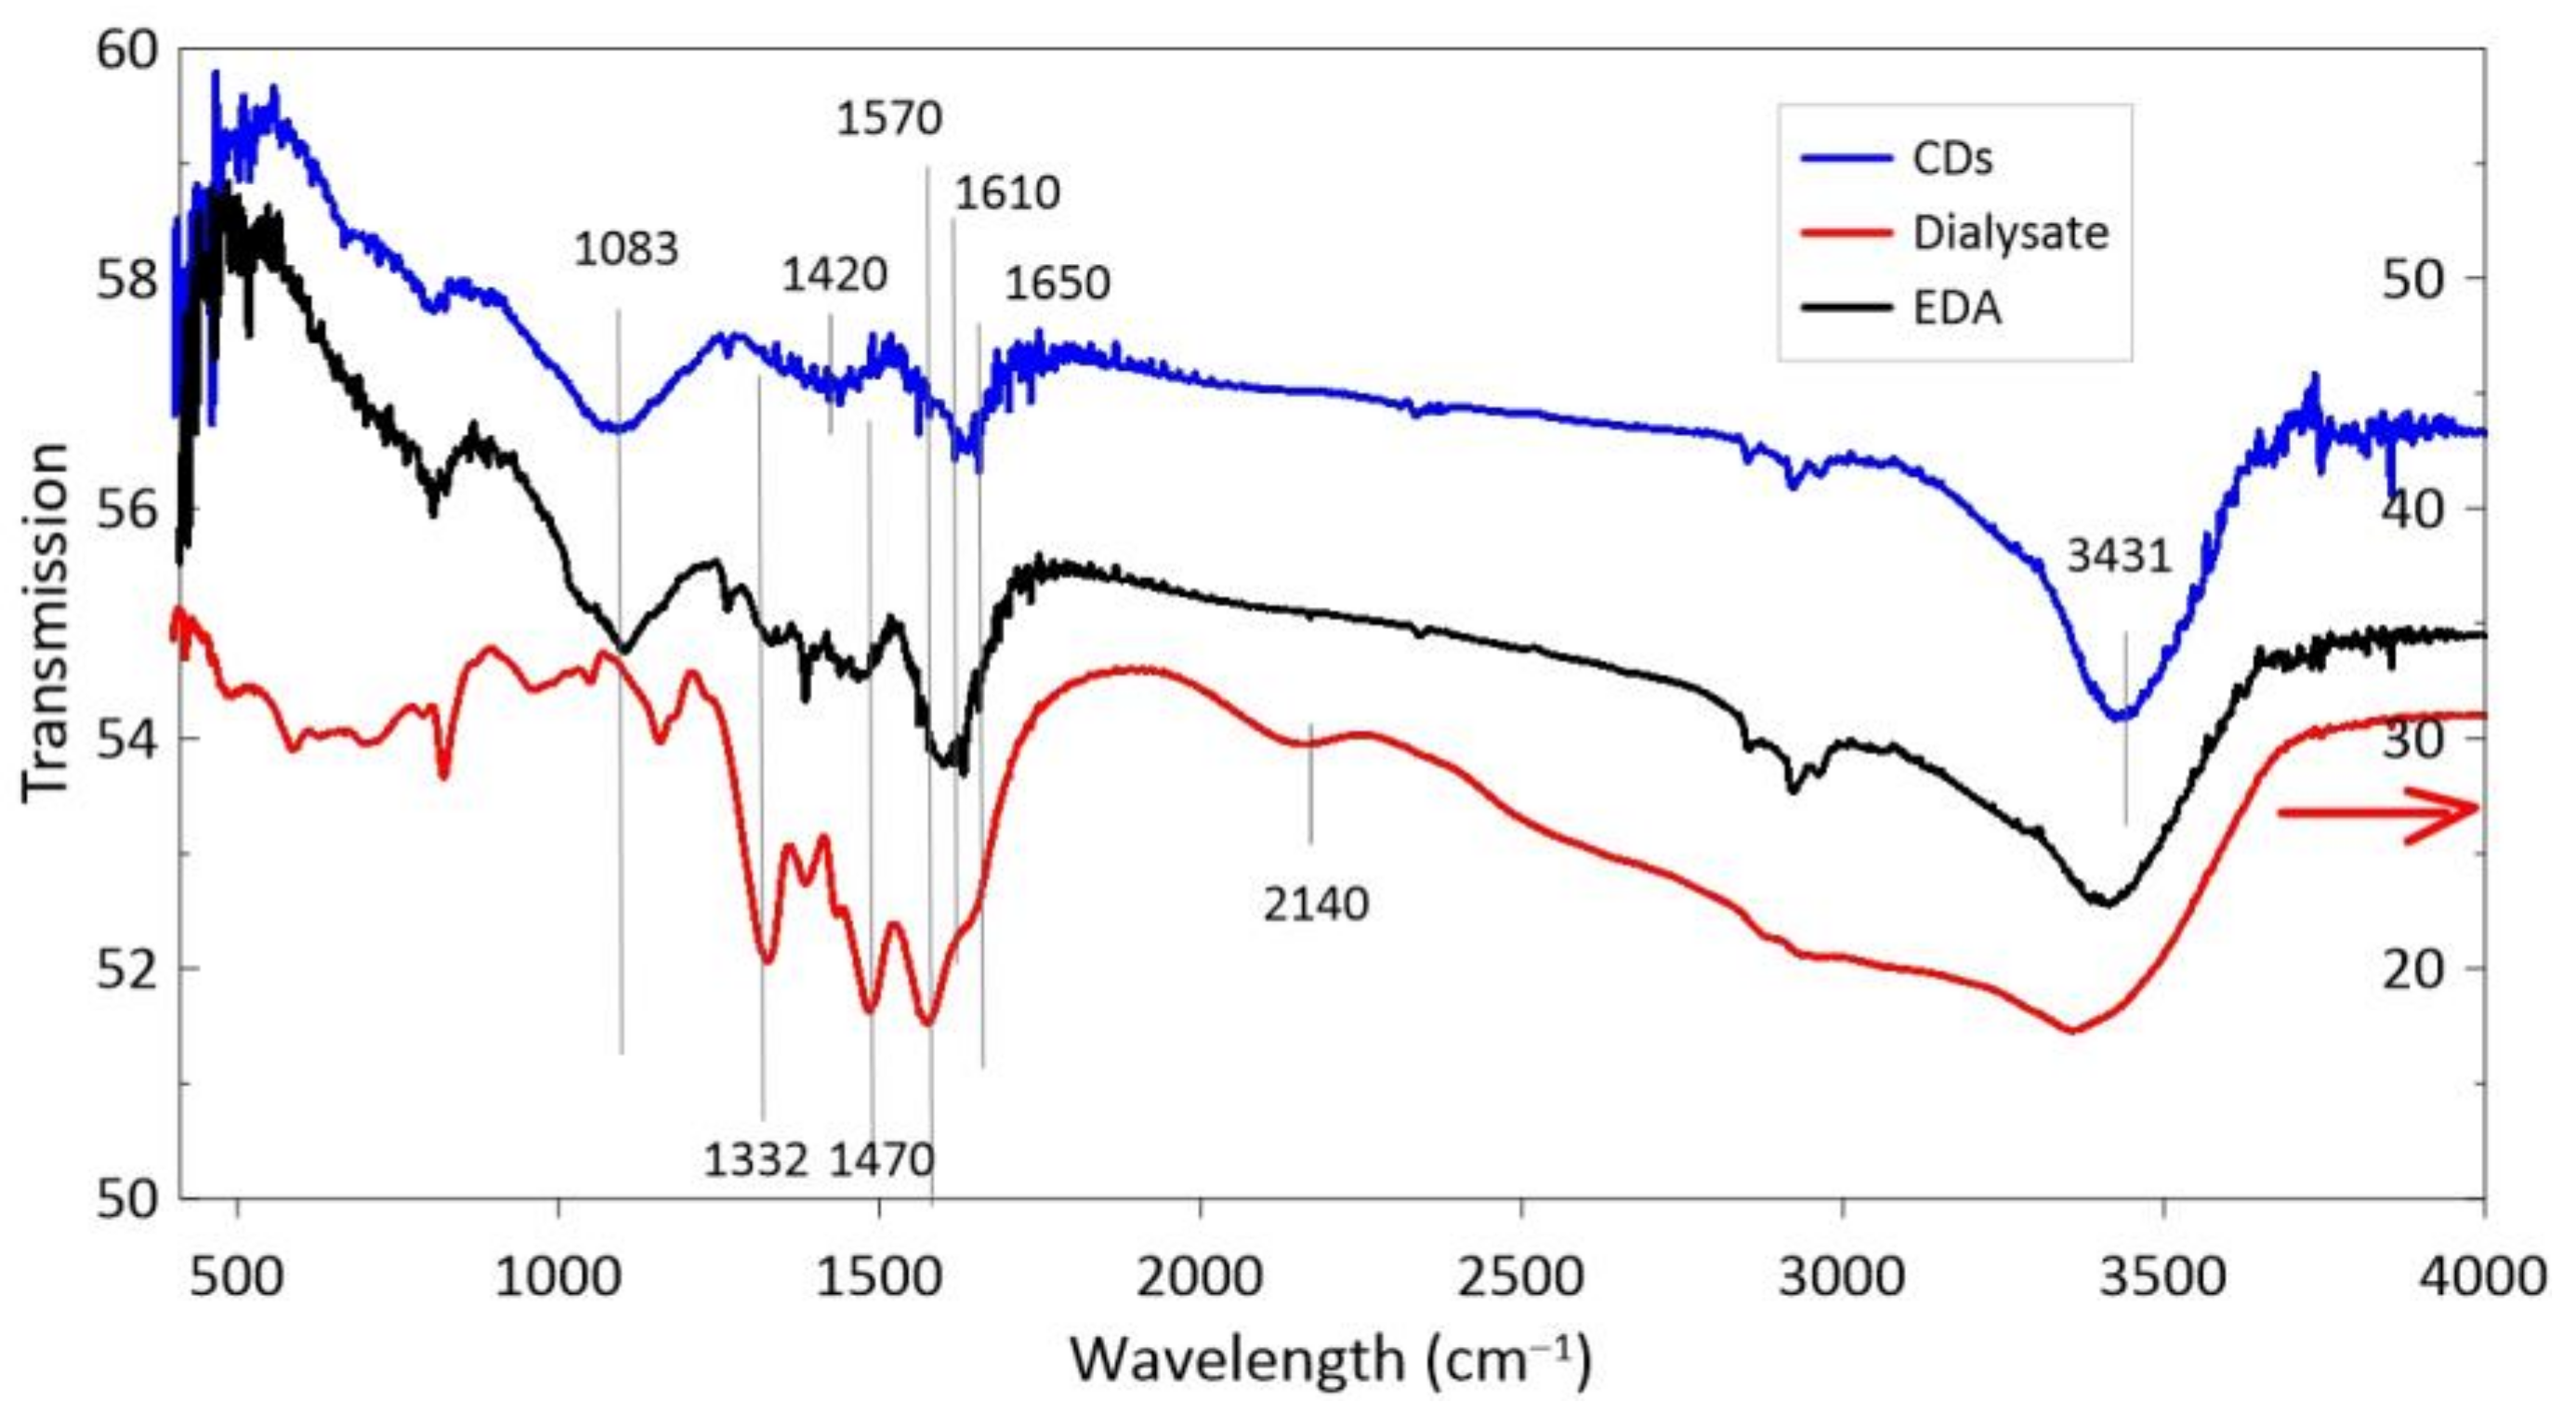
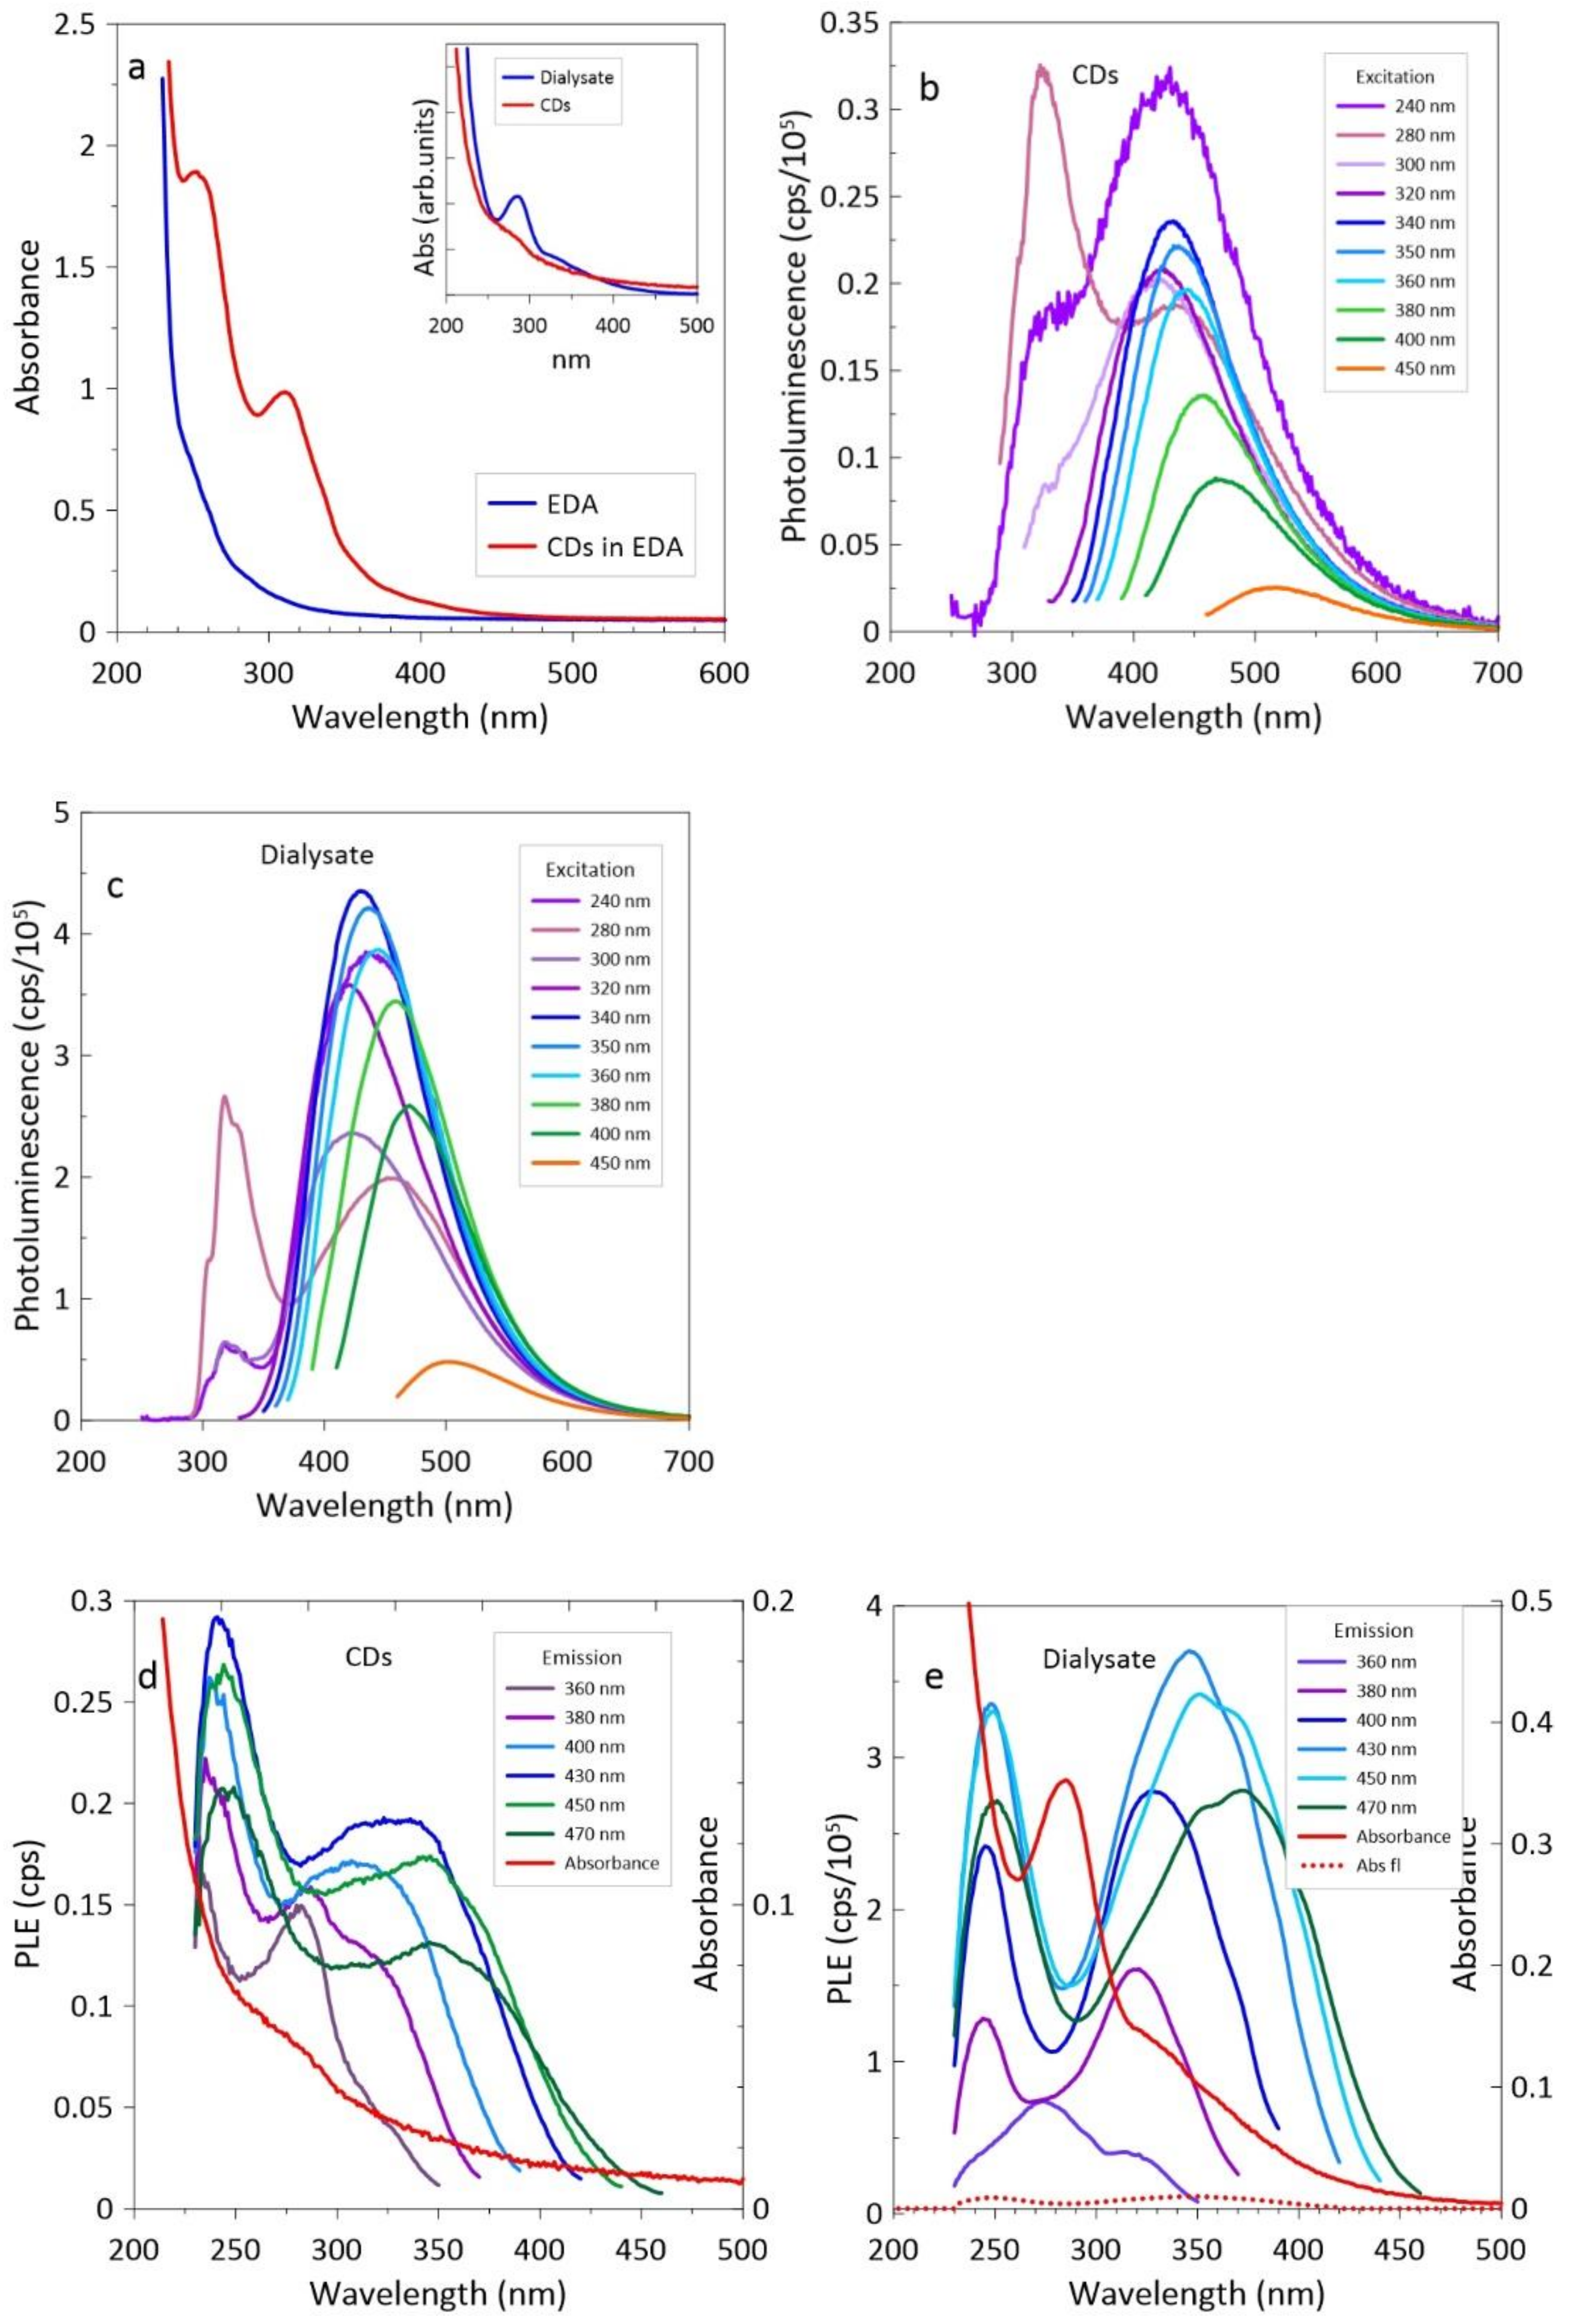
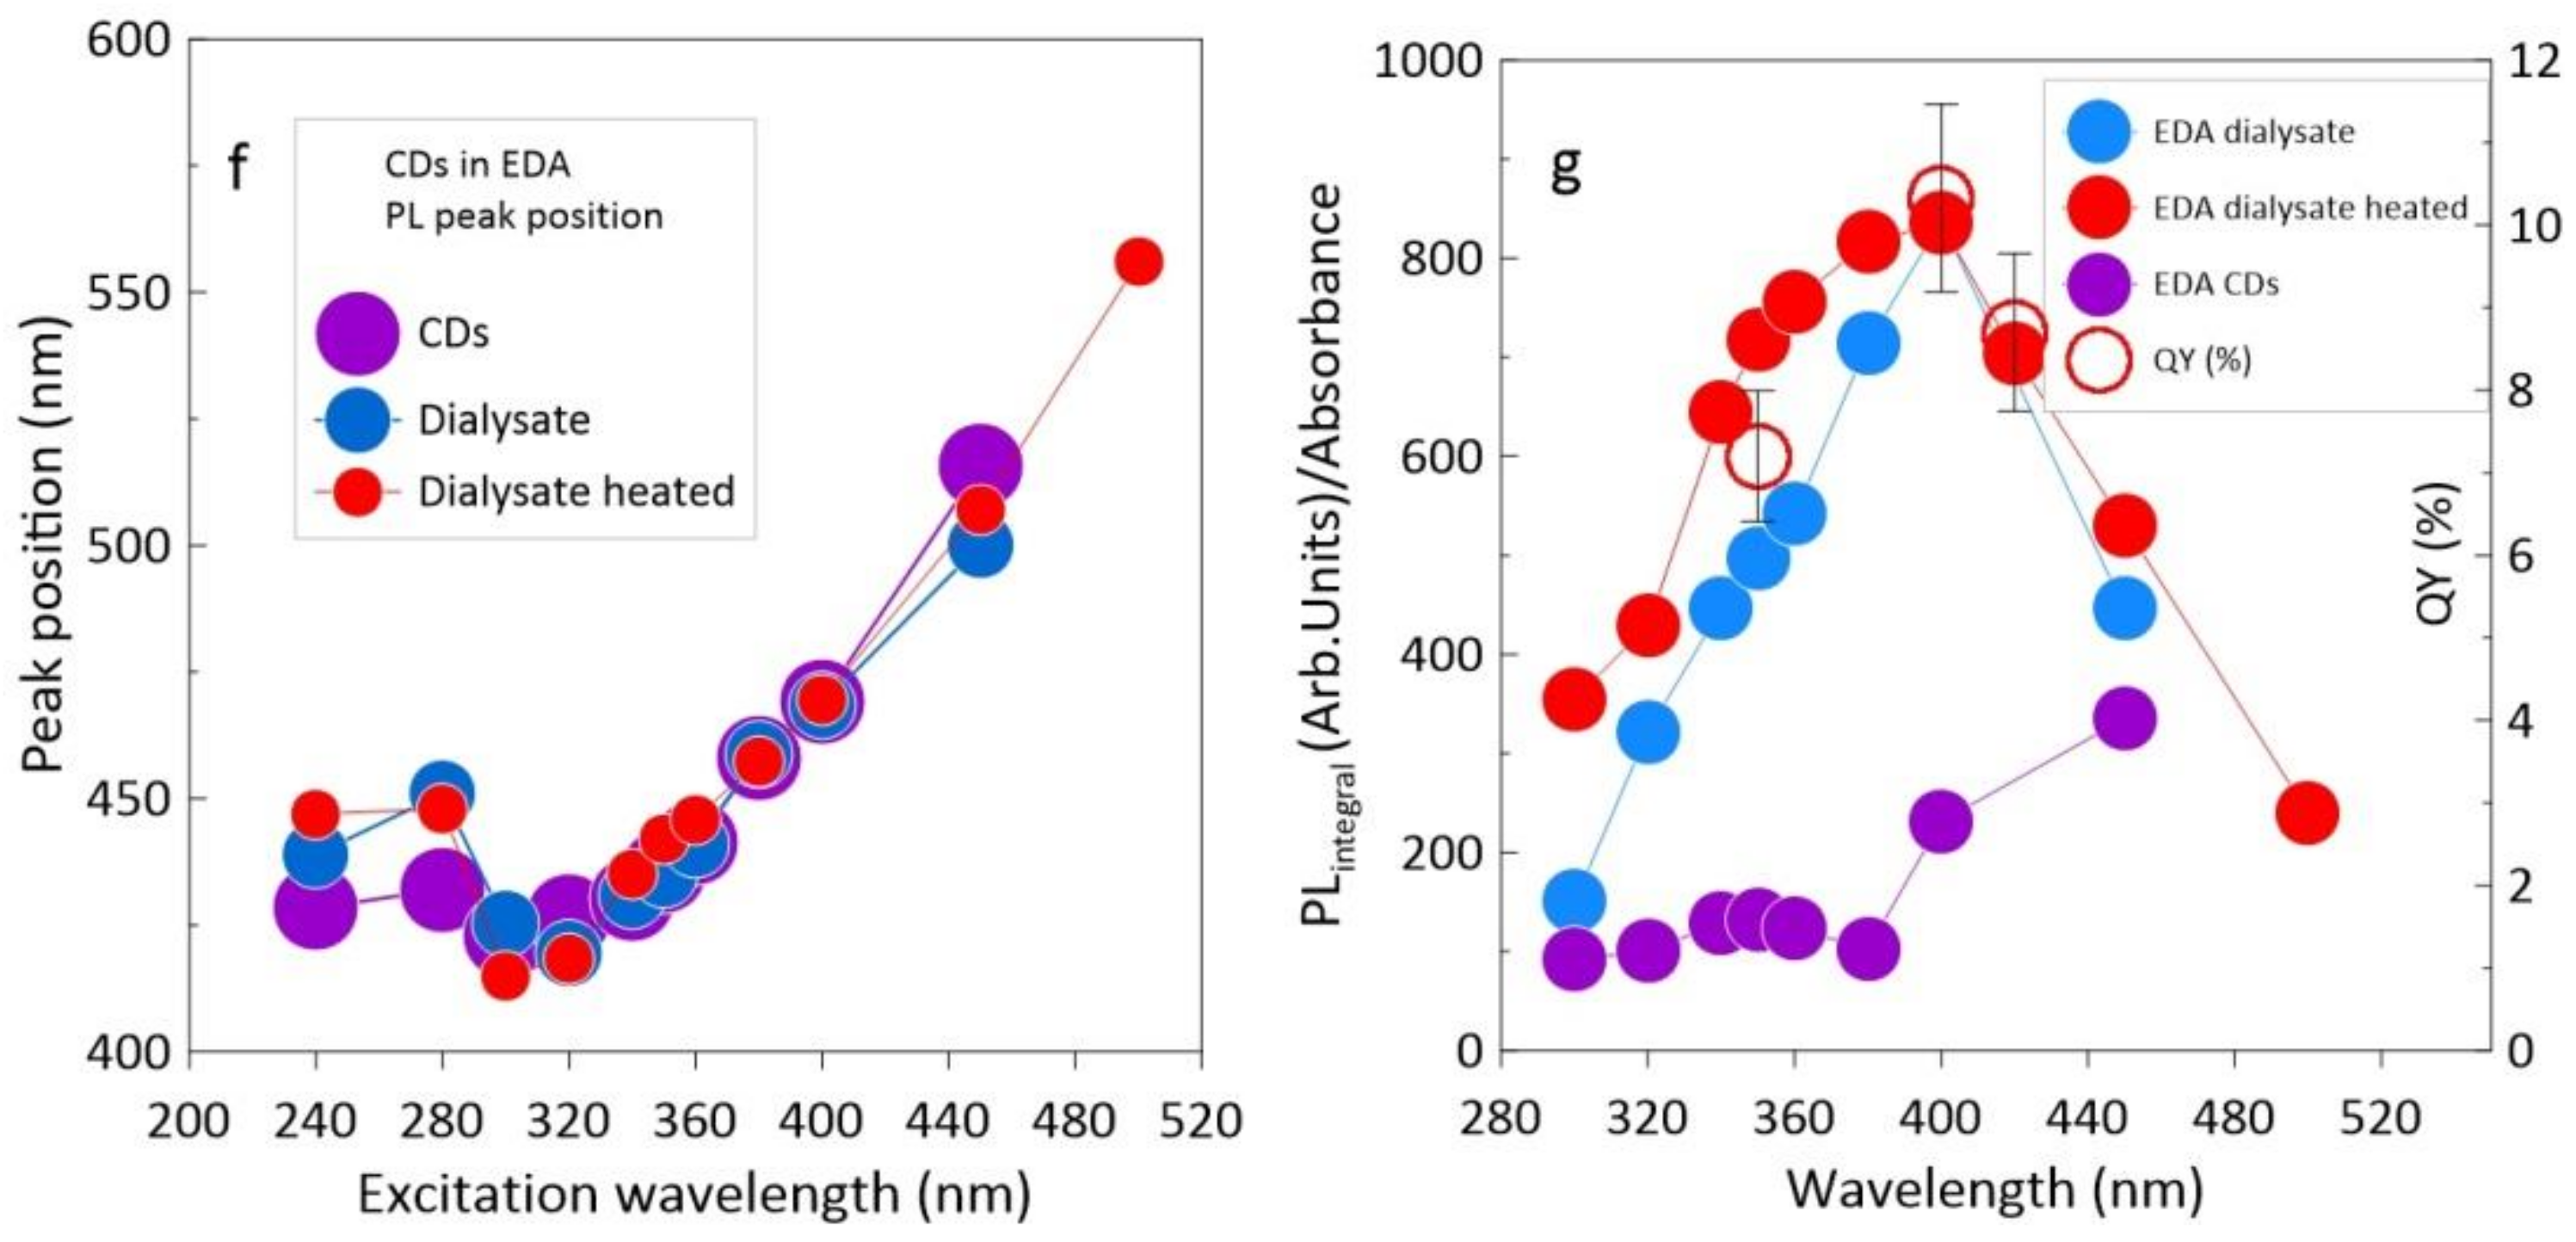
3.2. CDs in EDA
4. Discussion
5. Conclusions
Author Contributions
Funding
Institutional Review Board Statement
Informed Consent Statement
Data Availability Statement
Conflicts of Interest
References
- Wolfbeis, O.S. An overview of nanoparticles commonly used in fluorescent bioimaging. Chem. Soc. Rev. 2015, 44, 4743–4768. [Google Scholar] [CrossRef]
- Wang, Y.; Hu, A. Carbon quantum dots: Synthesis, properties and applications. J. Mater. Chem. C 2014, 2, 6921–6939. [Google Scholar] [CrossRef]
- Qu, D.; Zheng, M.; Zhang, L.; Zhao, H.; Xie, Z.; Jing, X.; Haddad, R.E.; Fan, H.; Sun, Z. Formation mechanism and optimization of highly luminescent N-doped graphene quantum dots. Sci. Rep. 2014, 4, 1–9. [Google Scholar] [CrossRef]
- Zhu, S.; Meng, Q.; Wang, L.; Zhang, J.; Song, Y.; Jin, H.; Zhang, K.; Sun, H.; Wang, H.; Yang, B. Highly photoluminescent carbon dots for multicolor patterning, sensors, and bioimaging. Angew. Chem. Int. Ed. 2013, 52, 3953–3957. [Google Scholar] [CrossRef]
- Zhai, X.; Zhang, P.; Liu, C.; Bai, T.; Li, W.; Dai, L.; Liu, W. Highly luminescent carbon nanodots by microwave-assisted pyrolysis. Chem. Commun. 2012, 48, 7955–7957. [Google Scholar] [CrossRef] [PubMed]
- Dong, Y.; Wang, R.; Li, H.; Shao, J.; Chi, Y.; Lin, X.; Chen, G. Polyamine-functionalized carbon quantum dots for chemical sensing. Carbon 2012, 50, 2810–2815. [Google Scholar] [CrossRef]
- Dong, Y.; Pang, H.; Yang, H.B.; Guo, C.; Shao, J.; Chi, Y.; Li, C.M.; Yu, T. Carbon-based dots co-doped with nitrogen and sulfur for high quantum yield and excitation-independent emission. Angew. Chem. Int. Ed. 2013, 52, 7800–7804. [Google Scholar] [CrossRef]
- Zhu, S.; Shao, J.; Song, Y.; Zhao, X.; Du, J.; Wang, L.; Wang, H.; Zhang, K.; Zhang, J.; Yang, B. Investigating the surface state of graphene quantum dots. Nanoscale 2015, 7, 7927–7933. [Google Scholar] [CrossRef]
- Wang, Y.; Kalytchuk, S.; Zhang, Y.; Shi, H.; Kershaw, S.V.; Rogach, A.L. Thickness-dependent full-color emission tunability in a flexible carbon dot ionogel. J. Phys. Chem. Lett. 2014, 5, 1412–1420. [Google Scholar] [CrossRef]
- Liu, X.; Li, H.B.; Shi, L.; Meng, X.; Wang, Y.; Chen, X.; Xu, H.; Zhang, W.; Fang, X.; Ding, T. Structure and photoluminescence evolution of nanodots during pyrolysis of citric acid: From molecular nanoclusters to carbogenic nanoparticles. J. Mater. Chem. C 2017, 5, 10302–10312. [Google Scholar] [CrossRef]
- Fang, Q.; Dong, Y.; Chen, Y.; Lu, C.H.; Chi, Y.; Yang, H.H.; Yu, T. Luminescence origin of carbon based dots obtained from citric acid and amino group-containing molecules. Carbon 2017, 118, 319–326. [Google Scholar] [CrossRef]
- Xiong, Y.; Schneider, J.; Ushakova, E.V.; Rogach, A.L. Influence of molecular fluorophores on the research field of chemically synthesized carbon dots. Nano Today 2018, 23, 124–139. [Google Scholar] [CrossRef]
- Song, Y.; Zhu, S.; Zhang, S.; Fu, Y.; Wang, L.; Zhao, X.; Yang, B. Investigation from chemical structure to photoluminescent mechanism: A type of carbon dots from the pyrolysis of citric acid and an amine. J. Mater. Chem. C 2015, 3, 5976–5984. [Google Scholar] [CrossRef]
- Kasprzyk, W.; Bednarz, S.; Bogdał, D. Luminescence phenomena of biodegradable photoluminescent poly(diol citrates). Chem. Commun. 2013, 49, 6445–6447. [Google Scholar] [CrossRef]
- Shi, L.; Yang, J.H.; Zeng, H.B.; Chen, Y.M.; Yang, S.C.; Wu, C.; Zeng, H.; Yoshihito, O.; Zhang, Q. Carbon dots with high fluorescence quantum yield: The fluorescence originates from organic fluorophores. Nanoscale 2016, 8, 14374–14378. [Google Scholar] [CrossRef] [PubMed]
- Dell’Aglio, M.; Gaudiuso, R.; De Pascale, O.; De Giacomo, A. Mechanisms and processes of pulsed laser ablation in liquids during nanoparticle production. Appl. Surf. Sci. 2015, 348, 4–9. [Google Scholar] [CrossRef]
- Zhang, D.; Gökce, B.; Barcikowski, S. Laser Synthesis and Processing of Colloids: Fundamentals and Applications. Chem. Rev. 2017, 117, 3990–4103. [Google Scholar] [CrossRef]
- Małolepszy, A.; Błonski, S.; Chrzanowska-Giżyńska, J.; Wojasiński, M.; Płocinski, T.; Stobinski, L.; Szymanski, Z. Fluorescent carbon and graphene oxide nanoparticles synthesized by the laser ablation in liquid. Appl. Phys. A Mater. Sci. Process. 2018, 124, 282. [Google Scholar] [CrossRef]
- Bhattacharyya, S.; Ehrat, F.; Urban, P.; Teves, R.; Wyrwich, R.; Döblinger, M.; Feldmann, J.; Urban, A.S.; Stolarczyk, J.K. Effect of nitrogen atom positioning on the trade-off between emissive and photocatalytic properties of carbon dots. Nat. Commun. 2017, 8, 1–9. [Google Scholar] [CrossRef] [PubMed]
- Sudolská, M.; Dubecký, M.; Sarkar, S.; Reckmeier, C.J.; Zbořil, R.; Rogach, A.L.; Otyepka, M. Nature of absorption bands in oxygen-functionalized graphitic carbon dots. J. Phys. Chem. C 2015, 119, 13369–13373. [Google Scholar] [CrossRef]
- Habiba, K.; Makarov, V.I.; Avalos, J.; Guinel, M.J.F.; Weiner, B.R.; Morell, G. Luminescent graphene quantum dots fabricated by pulsed laser synthesis. Carbon 2013, 64, 341–350. [Google Scholar] [CrossRef] [PubMed]
- Righetto, M.; Privitera, A.; Fortunati, I.; Mosconi, D.; Zerbetto, M.; Curri, M.L.; Corricelli, M.; Moretto, A.; Agnoli, S.; Franco, L.; et al. Spectroscopic Insights into Carbon Dot Systems. J. Phys. Chem. Lett. 2017, 8, 2236–2242. [Google Scholar] [CrossRef] [PubMed]
- Christé, S.; da Silva, J.C.G.E.; da Silva, L.P. Evaluation of the environmental impact and efficiency of N-doping strategies in the synthesis of carbon dots. Materials 2020, 13, 504. [Google Scholar] [CrossRef] [PubMed]


Publisher’s Note: MDPI stays neutral with regard to jurisdictional claims in published maps and institutional affiliations. |
© 2021 by the authors. Licensee MDPI, Basel, Switzerland. This article is an open access article distributed under the terms and conditions of the Creative Commons Attribution (CC BY) license (http://creativecommons.org/licenses/by/4.0/).
Share and Cite
Kaczmarek, A.; Hoffman, J.; Morgiel, J.; Mościcki, T.; Stobiński, L.; Szymański, Z.; Małolepszy, A. Luminescent Carbon Dots Synthesized by the Laser Ablation of Graphite in Polyethylenimine and Ethylenediamine. Materials 2021, 14, 729. https://doi.org/10.3390/ma14040729
Kaczmarek A, Hoffman J, Morgiel J, Mościcki T, Stobiński L, Szymański Z, Małolepszy A. Luminescent Carbon Dots Synthesized by the Laser Ablation of Graphite in Polyethylenimine and Ethylenediamine. Materials. 2021; 14(4):729. https://doi.org/10.3390/ma14040729
Chicago/Turabian StyleKaczmarek, Agata, Jacek Hoffman, Jerzy Morgiel, Tomasz Mościcki, Leszek Stobiński, Zygmunt Szymański, and Artur Małolepszy. 2021. "Luminescent Carbon Dots Synthesized by the Laser Ablation of Graphite in Polyethylenimine and Ethylenediamine" Materials 14, no. 4: 729. https://doi.org/10.3390/ma14040729
APA StyleKaczmarek, A., Hoffman, J., Morgiel, J., Mościcki, T., Stobiński, L., Szymański, Z., & Małolepszy, A. (2021). Luminescent Carbon Dots Synthesized by the Laser Ablation of Graphite in Polyethylenimine and Ethylenediamine. Materials, 14(4), 729. https://doi.org/10.3390/ma14040729