Article

Influence of Cu Content on Structure, Thermal Stability and Magnetic Properties in Fe72−xNi8Nb4CuxSi2B14 Alloys

1
Lukasiewicz Research Network—Institute of Non-Ferrous Metals, 5 Sowinskiegostr., 44-100 Gliwice, Poland
2
Institute of Metallurgy and Materials Science, Polish Academy of Sciences, 25 Reymonta str., 30-059 Krakow, Poland
*
Authors to whom correspondence should be addressed.
Materials 2021, 14(4), 726; https://doi.org/10.3390/ma14040726
Submission received: 29 December 2020 / Revised: 28 January 2021 / Accepted: 29 January 2021 / Published: 4 February 2021
(This article belongs to the Special Issue Nanocomposite Magnetic Materials for Energy Conversion)

Abstract

:
The effect of substitution of Fe by Cu on the crystal structure and magnetic properties of Fe72−xNi8Nb4CuxSi2B14 alloys (x = 0.6, 1.1, 1.6 at.%) in the form of ribbons was investigated. The chemical composition of the materials was established on the basis of the calculated minima of thermodynamic parameters: Gibbs free energy of amorphous phase formation ΔGamorph (minimum at 0.6 at.% of Cu) and Gibbs free energy of mixing ΔGmix (minimum at 1.6 at.% of Cu). The characteristic crystallization temperatures Tx1onset and Tx1 of the alpha-iron phase together with the activation energy Ea for the as-spun samples were determined by differential scanning calorimetry (DSC) with a heating rate of 10–100 °C/min. In order to determine the optimal soft magnetic properties, the wound cores were subjected to a controlled isothermal annealing process in the temperature range of 340–640 °C for 20 min. Coercivity Hc, saturation induction Bs and core power losses at B = 1 T and frequency f = 50 Hz P10/50 were determined for all samples. Moreover, for the samples with the lowest Hc and P10/50, the magnetic losses were determined in a wider frequency range 50 Hz–400 kHz. The real and imaginary parts of the magnetic permeability µ′, µ″ along with the cut-off frequency were determined for the samples annealed at 360, 460, and 560 °C. The best soft magnetic properties (i.e., the lowest value of Hc and P10/50) were observed for samples annealed at 460 °C, with Hc = 4.88–5.69 A/m, Bs = 1.18–1.24 T, P10/50 = 0.072–0.084 W/kg, µ′ = 8350–10,630 and cutoff frequency at 8–9.3 × 10⁴ Hz. The structural study of as-spun and annealed ribbons was carried out using X-ray diffraction (XRD) and a transmission electron microscope (TEM).

1. Introduction

In 2019, the soft magnetic market was valued at USD 51.4 billion, with an assumed compound annual growth rate of 9.1% in the 2019–2024 period [1]. Nowadays, an increasing group of these soft magnetic materials are amorphous and nanocrystalline metal alloys, mainly based on iron, which are widely used as distribution and industrial transformers [2,3], high-efficiency photovoltaic inverters [4,5], stator cores [6] or elements of wind turbines [7,8]. For this kind of applications, materials should be characterized by magnetic properties such as low coercivity and core losses over a wide frequency range, high magnetization and permeability, but also low weight, wide operation temperature range, simple technological process and low manufacturing cost [9]. These requirements were met by FINEMET-like alloys, which have been widely used for over 20 years [10]. However, the growing demand and diversity of specialized electrical devices presents scientists and engineers with new challenges—improving or creating new materials that can improve existing technologies. This can be achieved by modifying the chemical composition and controlled heat treatment resulting from the crystallization kinetics.
One of the main disadvantages of iron-based metallic glasses is the relatively low glass forming ability (GFA; compared to Mg, Zr or Pd-based glasses) [11], which makes it difficult to obtain an amorphous structure by melt-spinning. In order to improve the GFA of the alloy, metals, and metalloids, with a negative enthalpy of the solution and a large difference in atomic size between them and the main component, Fe are introduced. However, reducing the amount of Fe in the alloy causes a significant deterioration of the magnetic properties [12]. For this reason, a compromise has to be found between GFA and the magnetic properties. In order to facilitate the planning of the chemical composition of alloys, thermodynamic calculations are used to determine the values of parameters such as Gibbs free energy of mixing (ΔGmix) or Gibbs free energy of amorphous phase formation (ΔGamorph), which are crucial for GFA [13].
The most commonly used alloys additives promoting GFA in Fe-based alloys are B and Si. It is worth noting that the influence of B on GFA is 5 times greater than that of Si [14]. However, a side-effect of using B addition is reducing the safe distance between the primary α-Fe crystallization and the secondary Fe-B crystallization and at higher concentrations it causes overlapping of these processes [15]. In order to prevent this process, Nb is used, which not only helps in the separation of crystallization peaks, but also allows grain size control [16]. It is also worth noting Ni, which is also often used to improve GFA, as well as the magnetic properties at high temperatures and Curie temperature, but reduces Bs and Hc values [17,18]. The last alloying additive worth mentioning and the effects of which will be discussed in this paper is Cu. In iron-based alloys, Cu forms nano clusters in an amorphous matrix, which during the annealing process act as a nucleation site for the crystallization of the α-Fe phase. Due to this, it is possible to obtain a fine-grained, uniform crystal structure, which results in the improvement of soft magnetic properties [19,20,21,22]. In the work of Lintao Dou et al. the effect of Cu substitution on the structure and magnetic properties in the Fe72−xCuxB20Si4Nb4 bulk metallic glasses was described. It was determined that Hc decreased from 2.5 A/m to 1.4 A/m and the effective permeability increased from 16,200 to 24,700 for Cu = 0 at.% and Cu = 0.6 at.%, respectively. Further increase in Cu content resulted in deterioration of magnetic properties [23]. The Fe-Cu system has a positive heat of mixing equal to +13 kJ/mol [24], which should reduce the ability to form amorphous phase. However, it has been reported that the minor addition of copper can improve GFA [25,26]. A. Radoń et al. showed that the initial increase in copper content caused a reduction in Gibbs free energy of mixing ΔGmix (minimum at 0.5 and 0.75 at.% Cu content) in the Fe-Co-Mo-B-Si alloy. The ΔGmix has a minimum for 0.5 and 0.75 at.% Cu content. A further increase in copper content caused an increase in this energy [27]. We obtained similar results in our previous work on the effect of copper addition in the binary alloy Fe76−xB14, where the thermodynamic parameters were correlated with the crystallization kinetics, crystal structure, and magnetic properties. It was found that a small addition of copper reduces the Gibbs free energy of amorphous phase formation (ΔGamorph), which has a minimum for 0.55 at.% Cu content. Moreover, with such a copper content, the minimum value of the real and imaginary magnetic permeability was recorded and it is a “breakpoint” in the magnetic properties of the material [28]. It is worth noting, that the optimal Cu content depends on the chemical composition and the Cu effect on the properties of multicomponent amorphous and nanocrystalline iron-based alloys is not fully understood.
Fe-Ni-Nb-Si-B and Fe-Ni-Nb-Cu-Si-B systems were reported recently. Previously, Aronhime at al. presented results for (Fe100−xNix)80Nb4Si2B14 (30 < x <70) alloys, which show promising properties for applications in motors and transformers. These as-spun alloys have following magnetic properties: coercivity Hc = 7.0 A/m, magnetic saturation Bs = 1.3 T, power core loses measured at 1 T and 400 Hz P10/400 = 0.9 W/kg and at 1 kHz P10/1000 = 2.3 W/kg and a relatively high permeability which increases from 4000 to 16,000 after strain-annealing [29,30]. J. Gutierrez et al. studied the effect of heat treatment at 350–550 °C on magnetic and piezoelectric properties on the Fe64Ni10Nb3Cu1Si13B9 alloy. A significant improvement in Hc was observed from 50 A/m for as-spun to 5 A/m for annealed at 520 °C samples. Annealing at a temperature higher than 520 °C causes a slight increase in the Hc value. The Bs value ranged from 1.1 to 1.18 T [31]. The alloy Fe67.2Ni10Nb2.9Cu0.8Si11.2B8 annealed under a magnetic field called VITROPERM 250 is used industrially and reaches Bs = 1.24 T, 2800–4000 permeability and Hc < 3 A/m [32].
The present study describes the effect of Cu substitution in Fe72−xNi8Nb4CuxSi2B14 alloys on thermodynamic parameters, crystallization kinetics, crystal structure, and magnetic properties. Our initial chemical composition is based on the multi-component alloy Fe72Ni8Nb4Si2B14, which was described in the previous work [33]. The heat treatment of this material has been optimized in order to obtain the lowest possible core power losses. The best soft magnetic properties were obtained after the 20 min isothermal heat treatment at 370 °C and were characterized by Hc = 3.95 A/m, P10/50 = 0.092 W/kg, Bs = 1.09 T, µ′ = 3100 and the cut-off frequency at 5 × 10⁵ Hz. Moreover, by performing aging process at 310–370 °C for up to 6200 min, it was possible to improve µ′ value up to 5000. In the present work, the Cu substitution in the alloy was optimized by thermodynamic calculations to fit the minimum Gibbs free energy of amorphous phase formation ΔGamorph (minimum at 1.6 at.% Cu) and the Gibbs free energy of mixing ΔGmix (minimum at 0.6 at.% Cu). Annealing processes were carried out to optimize the soft magnetic properties.

2. Materials and Methods

The master alloys of Fe72−xNi8Nb4CuxSi2B14 (x = 0.6, 1.1, 1.6) were prepared in an induction furnace under an argon atmosphere (heating at 1400–1450 °C for 15 min, casting at 1200–1260 °C) using chemical elements Fe (3N), Cu (4N), Ni (2N), and binary compound FeB18 (2.5N), FeNb23 (2.5N). The amorphous alloys in the form of a 6–7 mm width ribbons were obtained by melt spinning technique (at 30 m/s Cu wheel speed, casting at 1250–1260 °C).
In order to analyze the influence of the annealing temperature on the soft magnetic parameters the wound toroidal cores were isothermally annealed in a vacuum furnace (5·10−3 mbar) for 20 min at various temperatures from 340 to 640 °C at about 10 °C/min heating rate. The crystalline structure of the samples was verified by X-ray diffraction (XRD) at room temperature using a Rigaku MiniFlex 600 diffractometer (Rigaku, Tokyo, Japan) equipped with a CuKα copper tube (λ = 1.5406 Å). On the basis of differential scanning calorimetry (DSC) measurements carried out with the Netzsch DSC 214 Polyma (NETZSCH-Gerätebau GmbH, Selb, Germany) with a heating rate of 10–100 °C/min, the crystallization kinetics of amorphous materials was investigated. To determine the coercivity (Hc) and the magnetic saturation (Bs), hysteresis loops were obtain up to saturation at 50 Hz with the Remacomp C-1200 magnetic measurement system (MAGNET-PHYSIK Dr. Steingroever GmbH, Köln, Germany). The values of power losses (Ps) for all annealed samples were measured with a magnetic induction B = 1 T and f = 50 Hz (P10/50). Additionally for samples annealed at 460 °C the Ps parameters were measured in the frequency range f = 50 Hz–400 kHz and the magnetic induction B = 0.01–1 T. For samples annealed at characteristic temperatures (360, 460 and 560 °C) the complex magnetic permeability at room temperature and in the frequency range f = 104–108 Hz was determined with the Agilent 4294A impedance analyzer (Agilent, Santa Clara, CA, USA). Moreover, bright field (BF) and dark field (DF) images together with selected area electron diffraction patterns (SAEDPs) were recorded by using a transmission electron microscope (TEM)—Tecnai G2 F20 (200 kV) electron microscope (Thermo Fisher Scientific, Waltham, MA, USA).

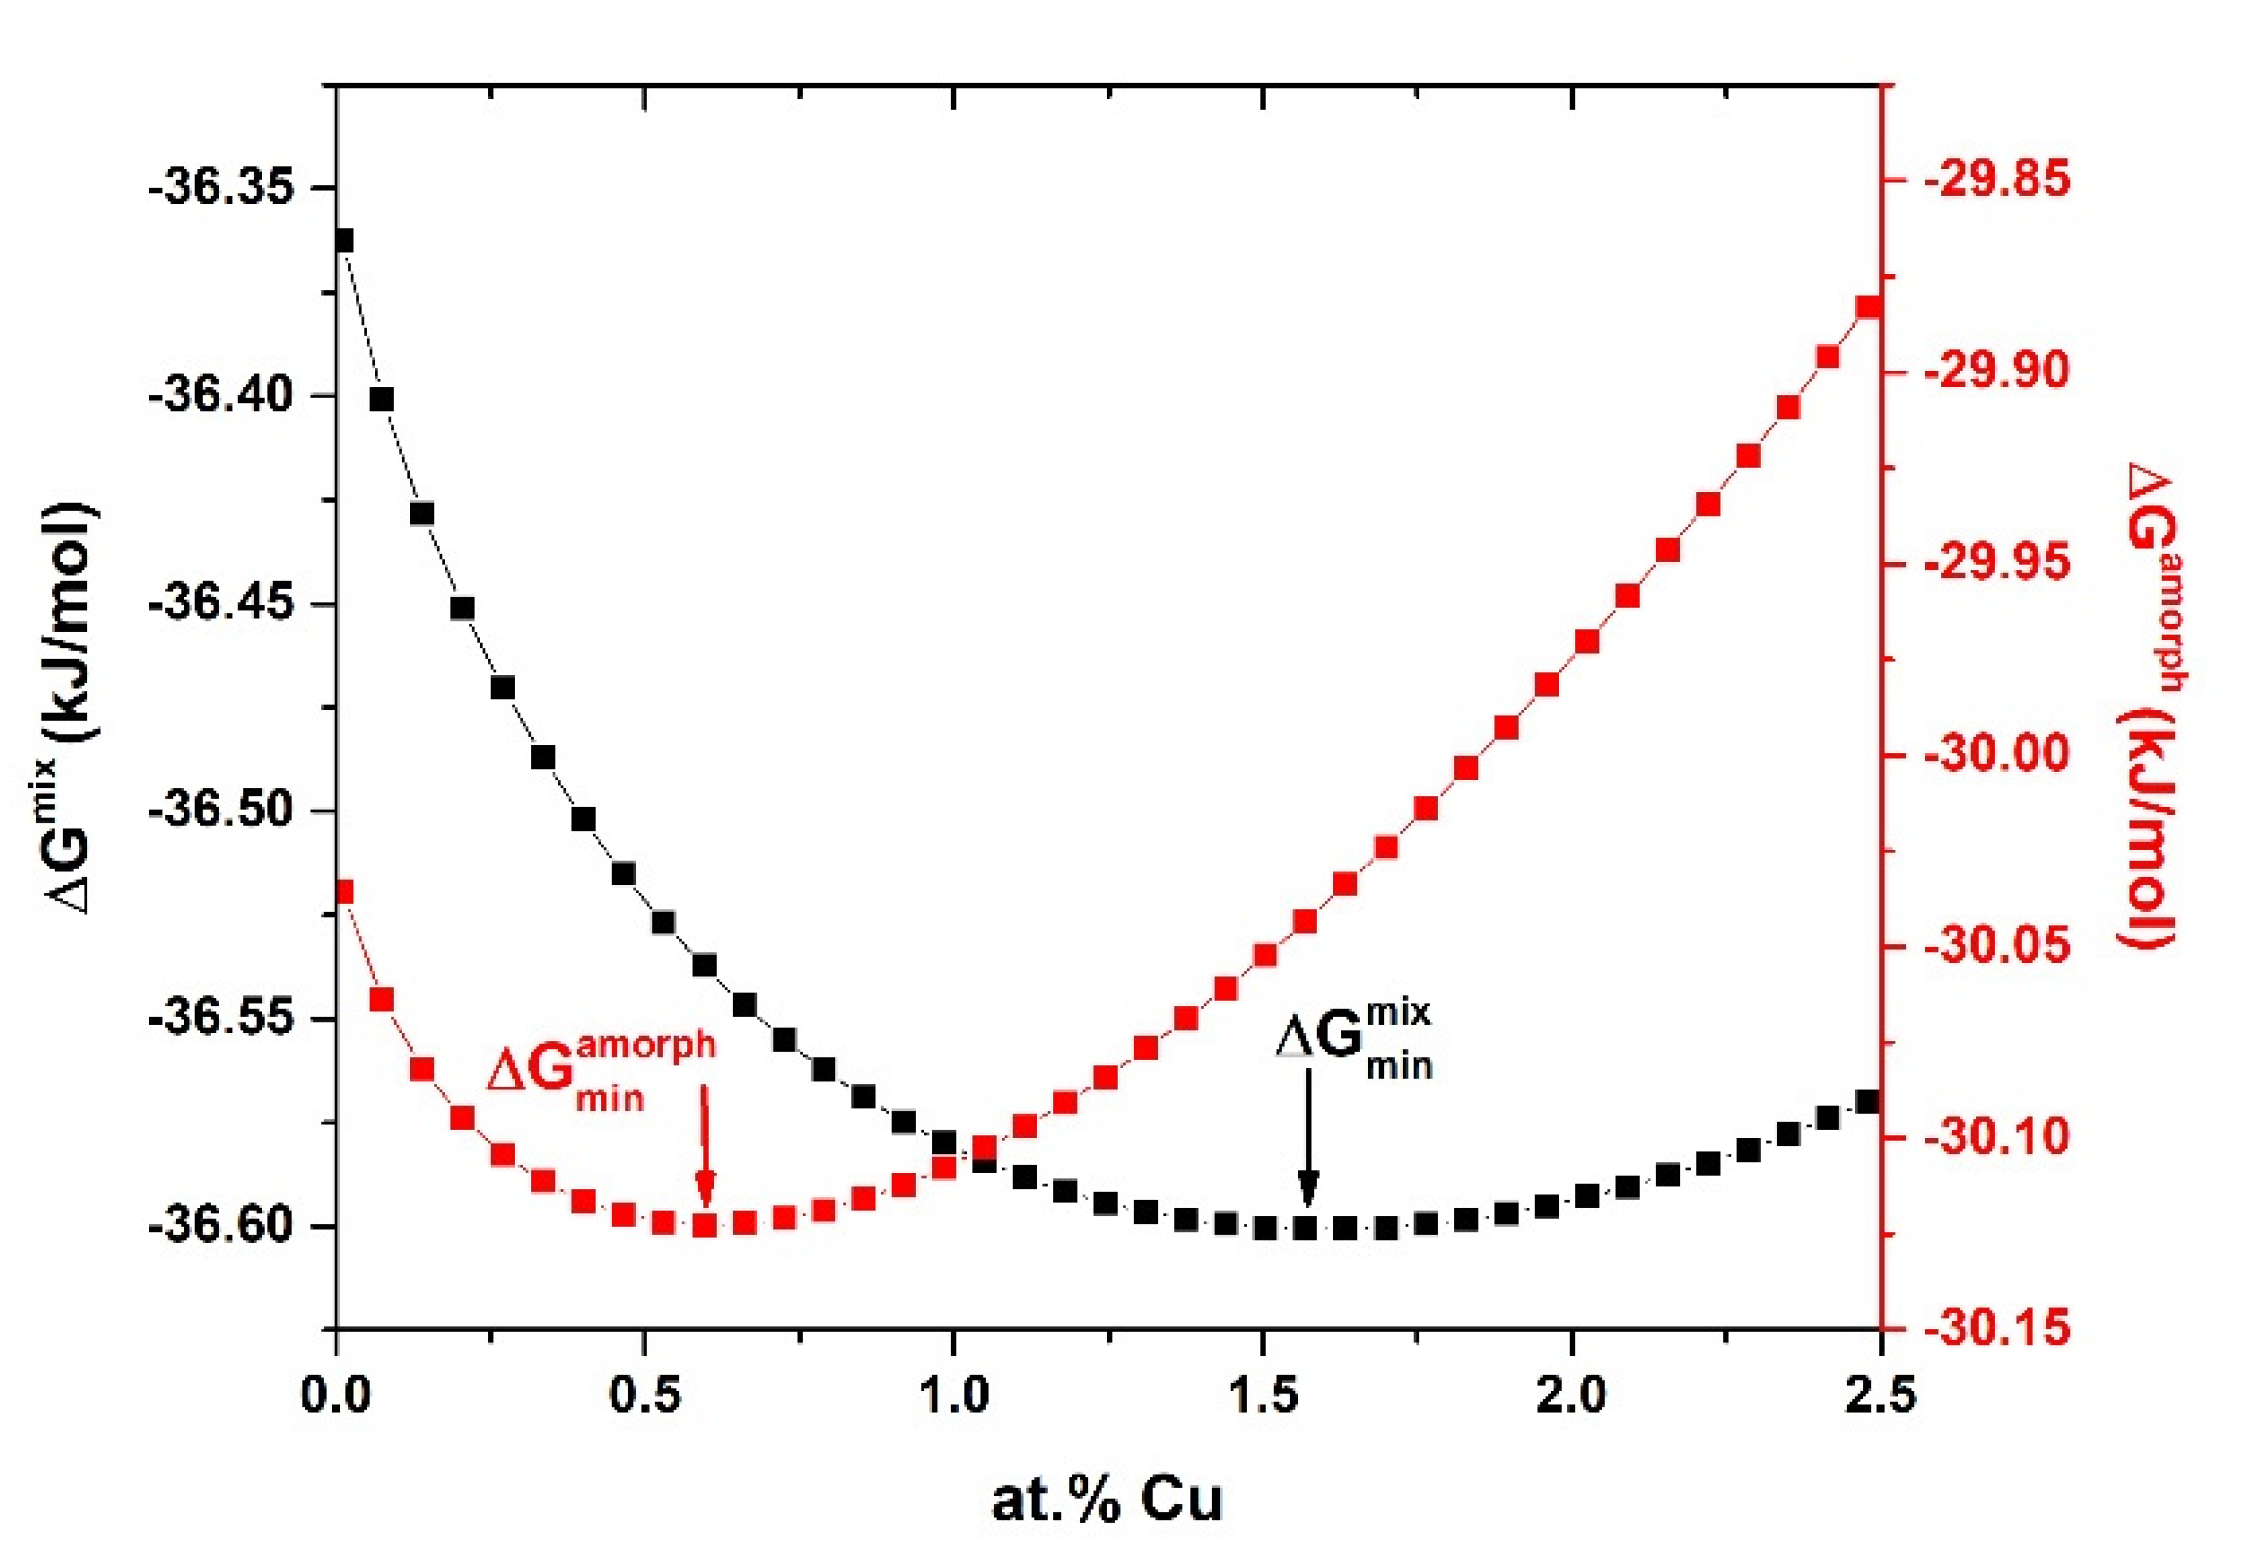
3. Thermodynamic Calculation

To determine the optimal concentration of copper content in Fe72−xNi8Nb4CuxSi2B14 alloys, thermodynamic calculations were performed. Two parameters, Gibbs free energy of mixing (ΔGmix) and formation of amorphous phase (ΔGamorph), were calculated and optimal chemical compositions were chosen. First of all, the configurational entropy (Sconf) was calculated according to Equation (1).
Δ S c o n f i g = R i = 1 n c i l n c i
where R is the gas constant and ci concentration of i-th chemical element.
Afterwards, enthalpies were calculated according to the simple equation using the values determined on the basis of calculations performed using Miedema’s model implemented in Miedema Calculator [34,35,36,37]. Generally, the enthalpy for the alloys can be calculated as:
Δ H k x = 4 Δ H i j x c i c j
Δ H x = k = 1 N Δ H k x
where ΔHx is the enthalpy of mixing (ΔHmix) or formation of amorphous phase (ΔHamorph), Δ H i j x is the enthalpy between i-th and j-th chemical elements for equiatomic composition in a binary system (determined using a Miedema Calculator), ci and cj are the concentrations of i-th and j-th elements, k is the atomic pair number, N is the number of different atomic pairs ij (N = 15 for n = 6), n is the number of chemical elements in the alloy (in this study n = 6).
Taking into account this fact, that both entropy and enthalpy have a high impact on the thermodynamics of the liquid phase, and then on the crystallization process under cooling, the Gibbs free energies were calculated according to the formula:
Δ G x = Δ H x T Δ S c o n f
where: ΔGx is the Gibbs free energy of mixing (ΔGmix) or formation of amorphous phase (ΔGamorph), and T is the average melting temperature.
The analysis results are presented in Figure 1. The first minimum was related to the lowest value of Gibbs free energy of formation of amorphous phase, whereas the second one to the lowest value of Gibbs free energy of mixing. The value of the ΔGamorph firstly rapidly decreases with increasing copper content, which is related to the positive contribution of configurational entropy. After reaching the minimum at 0.6 at.%. the negative impact of Cu can be observed and this is related to the contribution from ΔHamorph. A similar relationship can be observed for ΔGmix, however, the minimum was observed for much higher Cu content equal to 1.6 at.%. According to that, the Fe71.4Ni8Nb4Cu0.6Si2B14 and Fe70.4Ni8Nb4Cu1.6Si2B14 alloys were chosen from the optimization process to the analysis of structure and magnetic properties in these studies. Additionally, to broaden the analysis a third Fe70.9Ni8Nb4Cu1.1Si2B14 alloy was selected, with ΔGamorph higher than calculated minimum and ΔGmix lower than calculated minimum.

4. Results

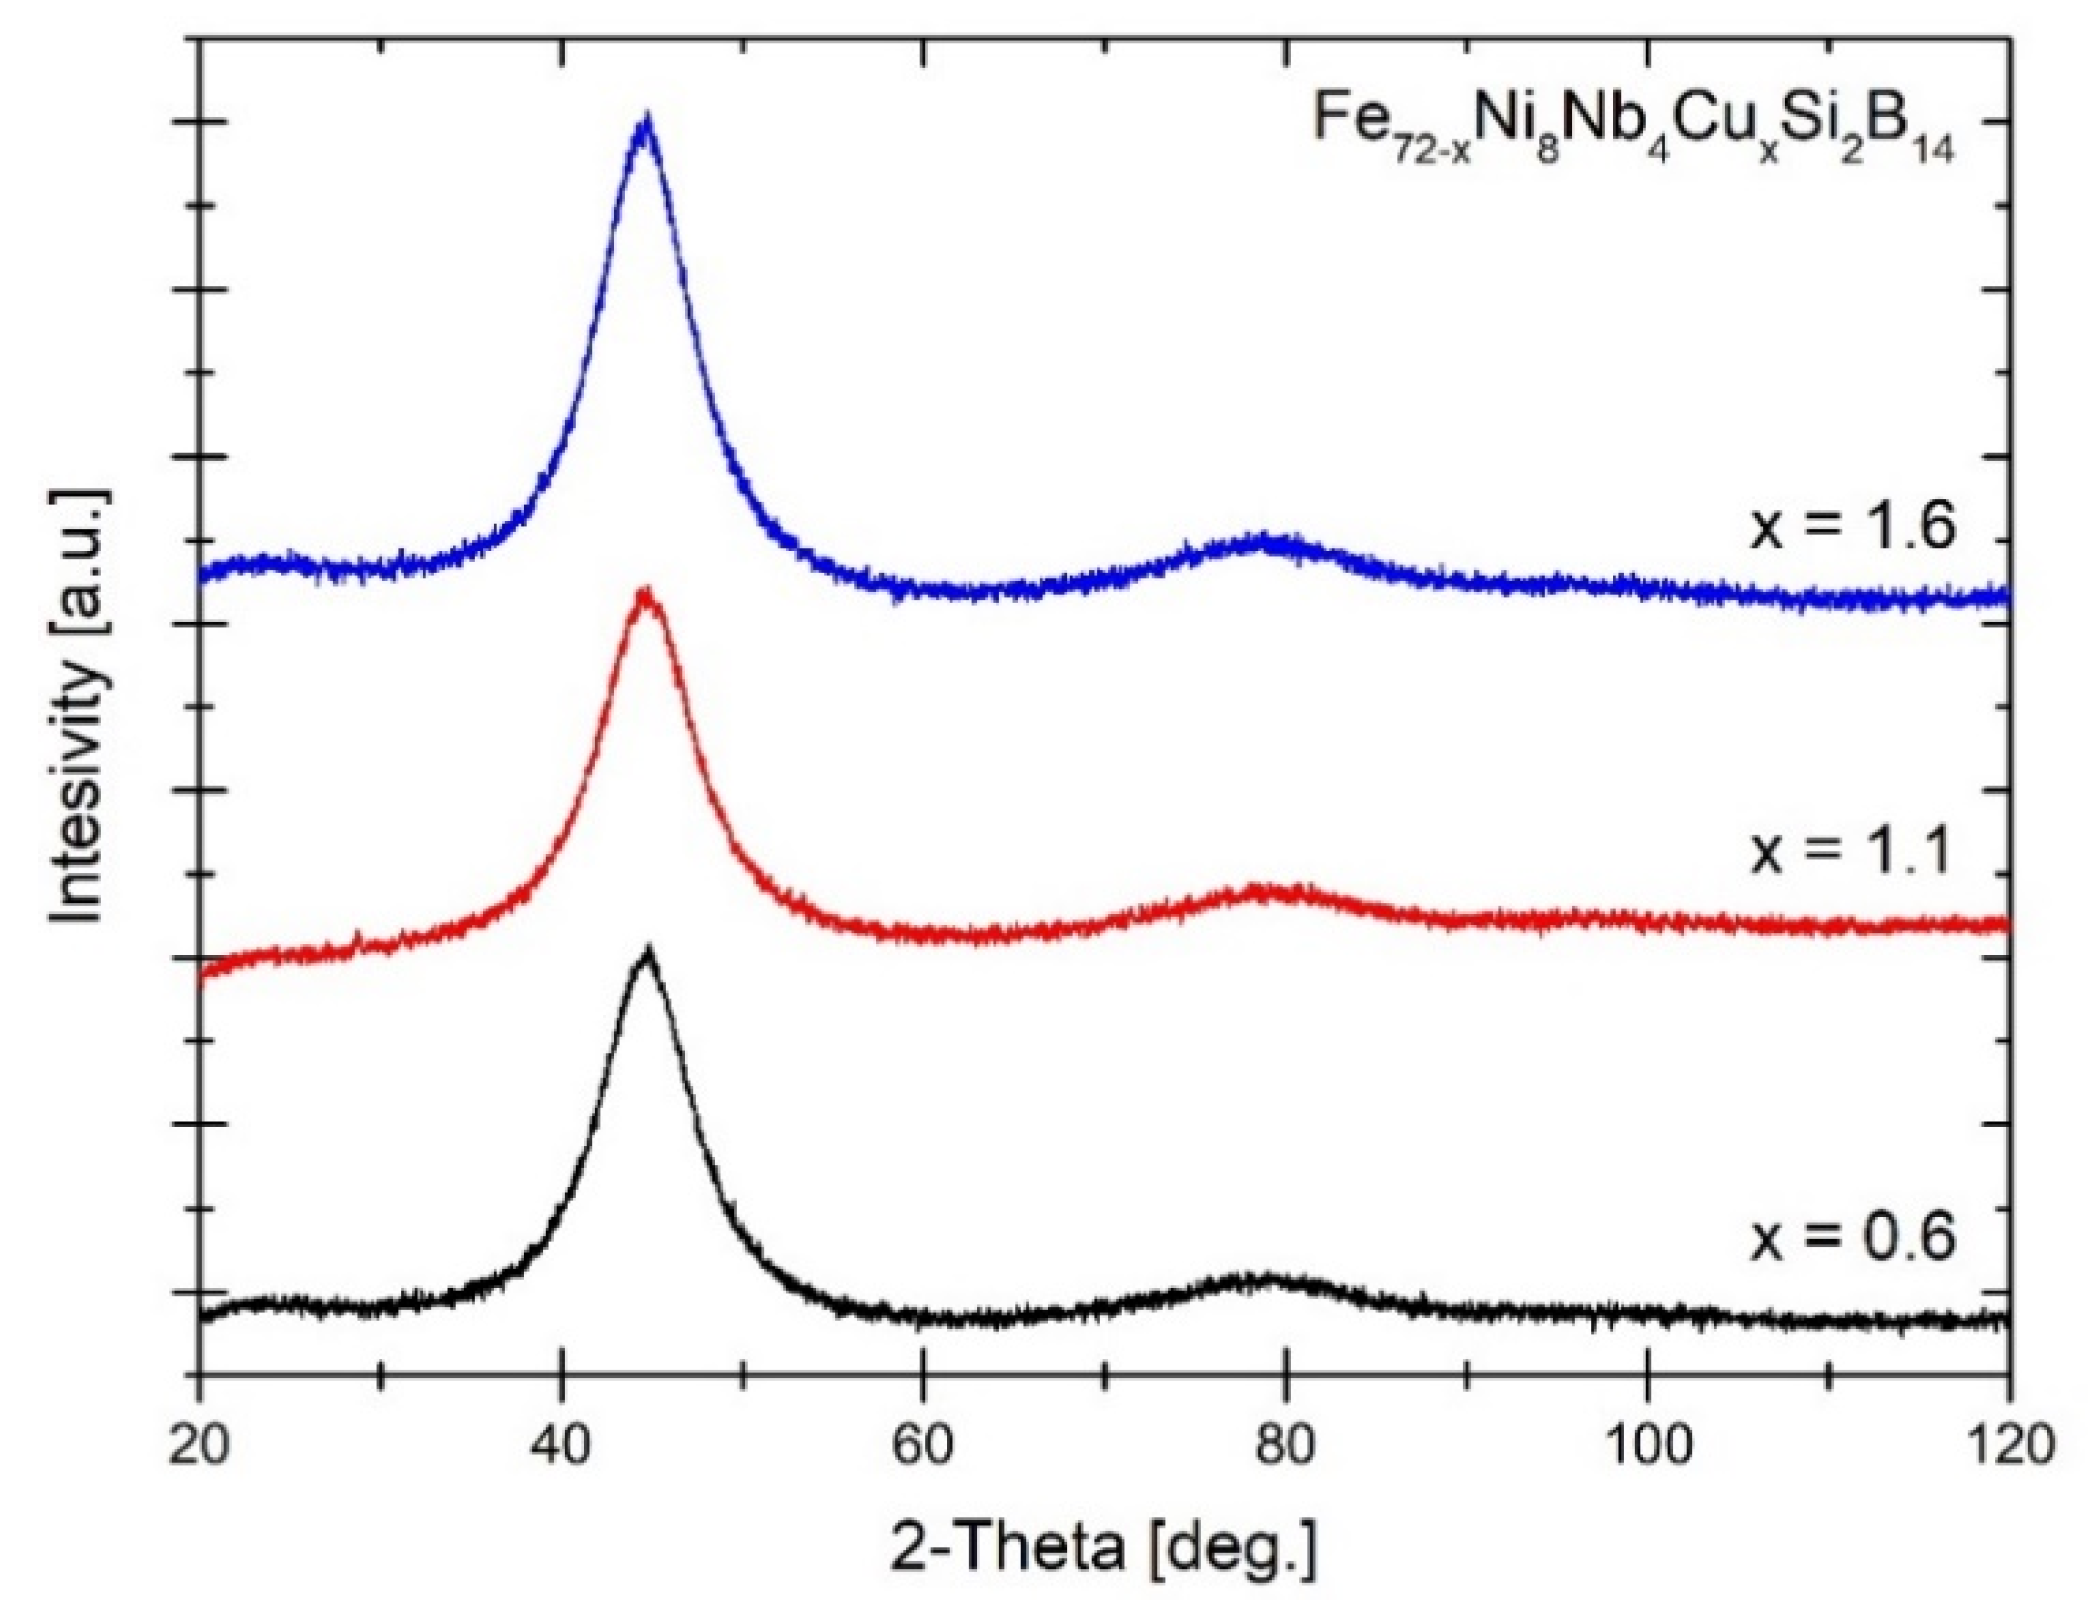
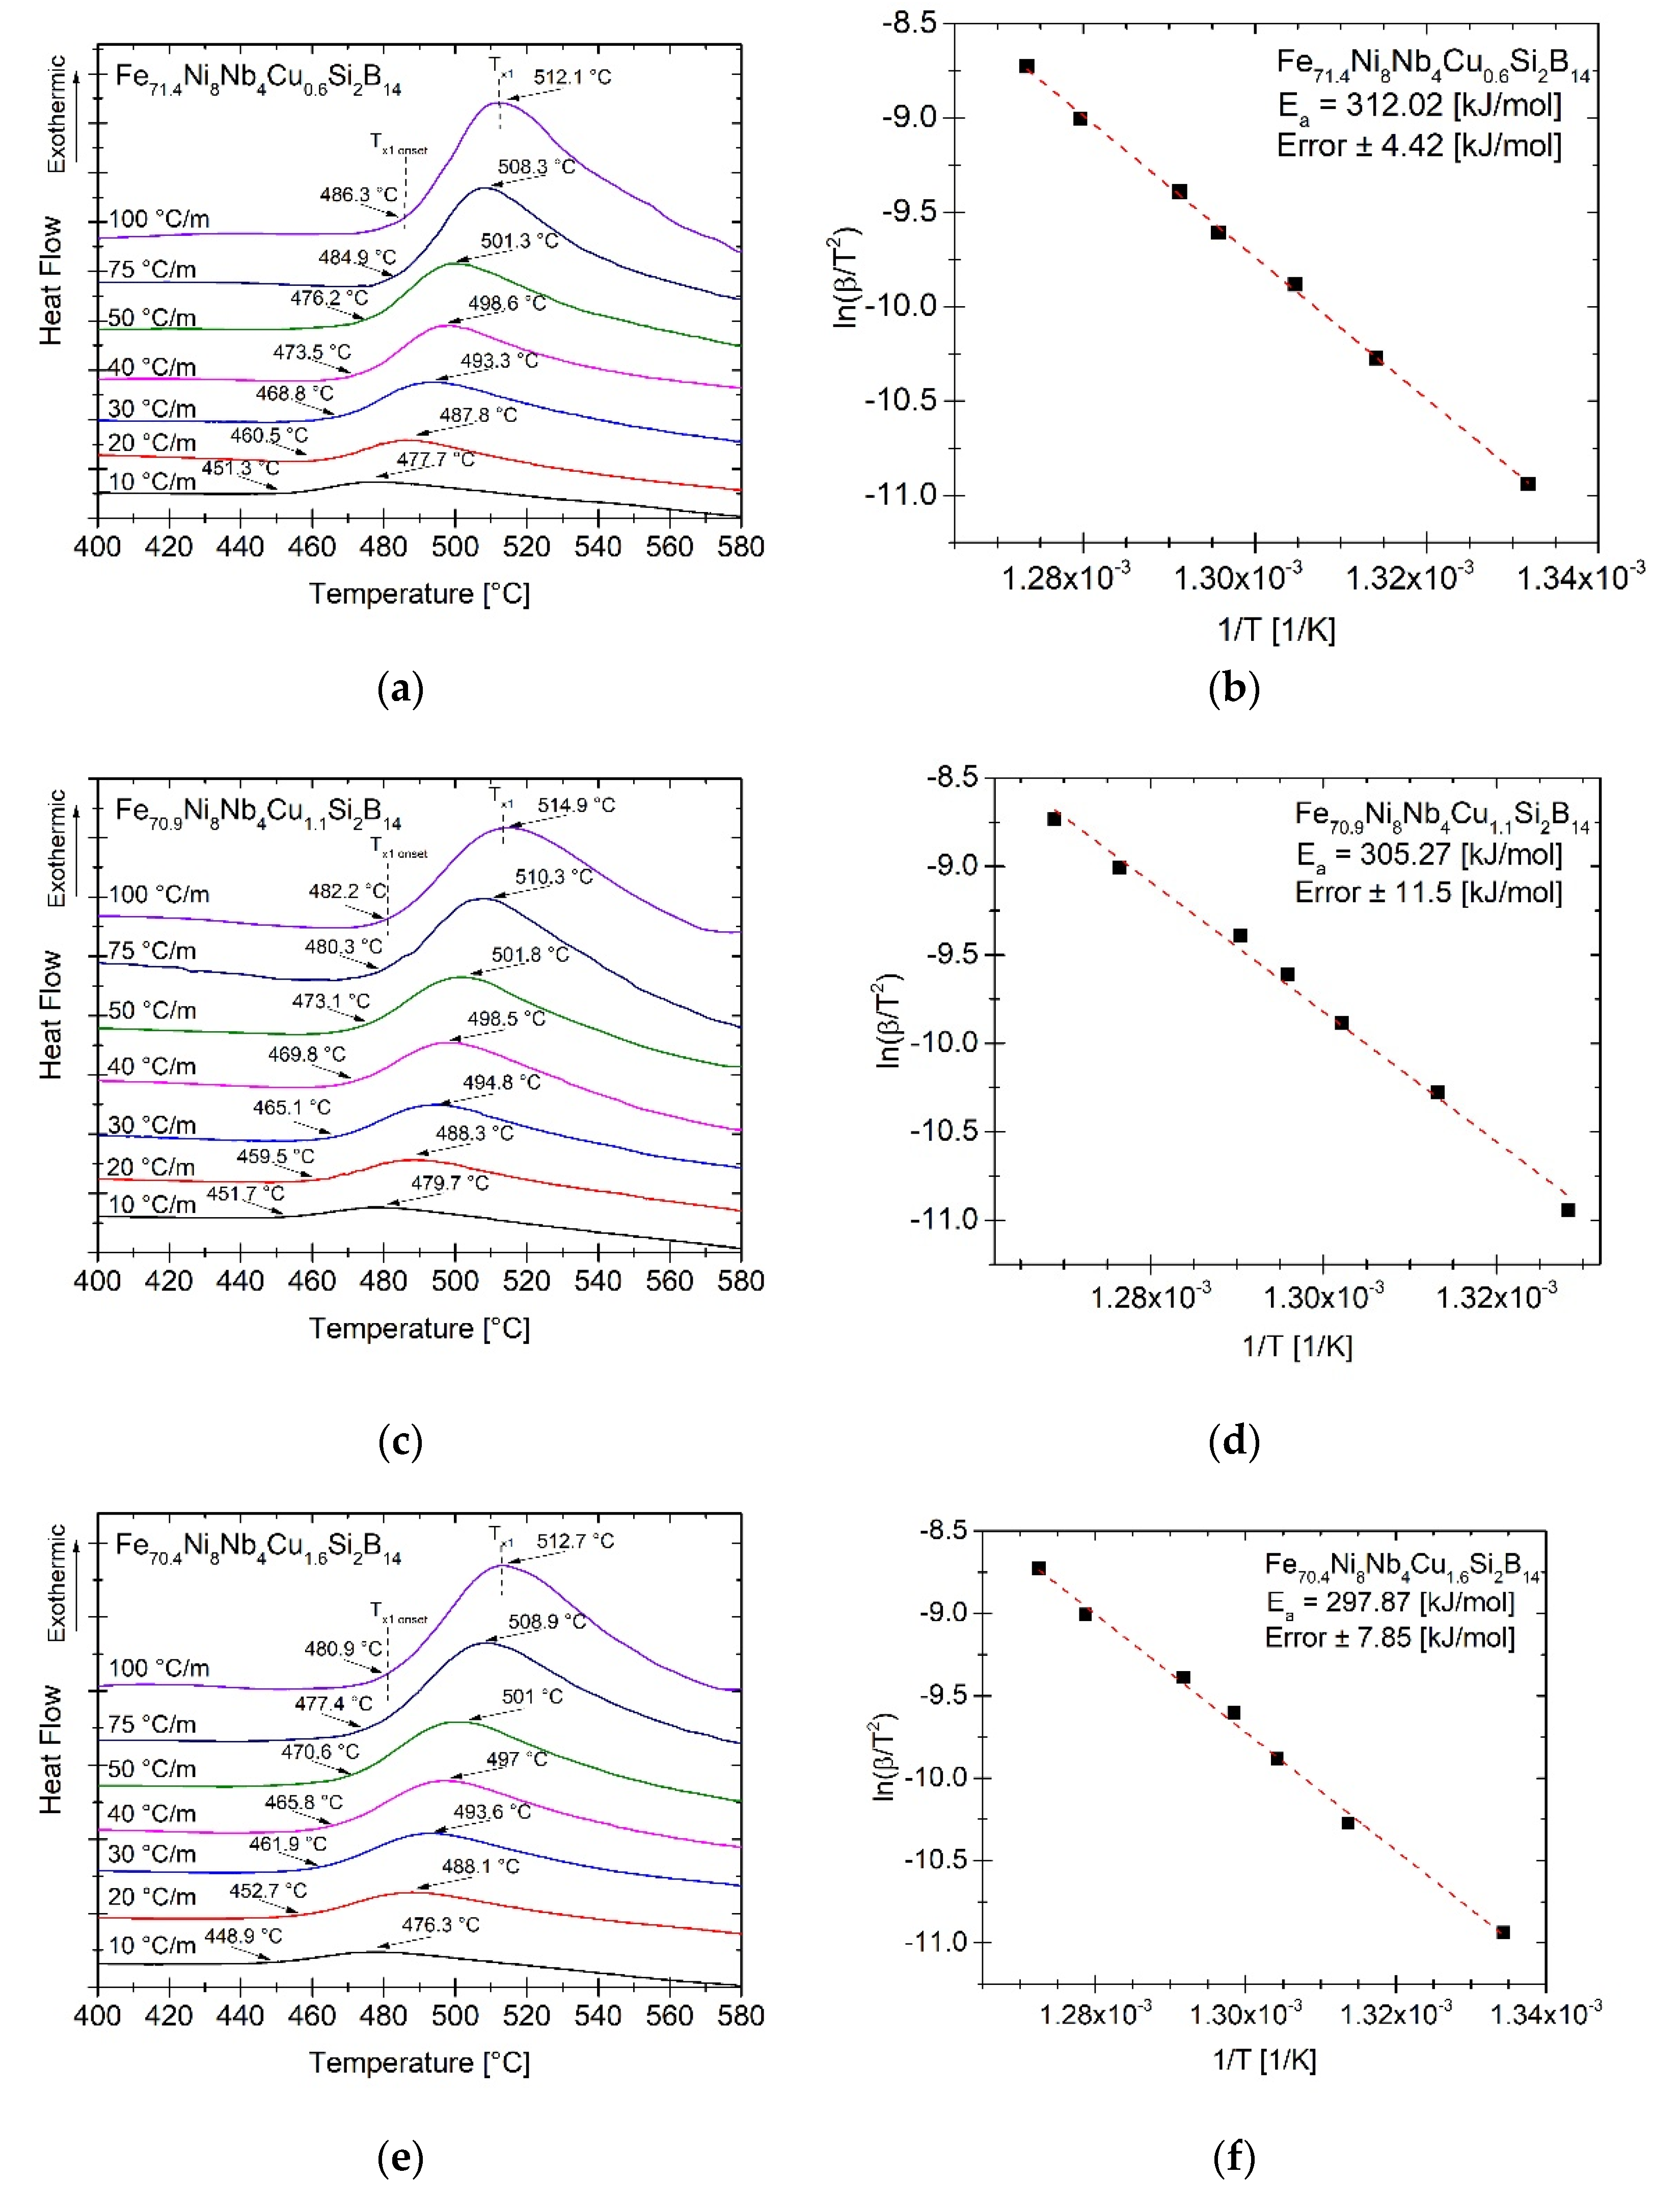
4.1. Kinetic and Structure Studies of As-Spun Alloys

In order to confirm the structure of the as-spun materials, an X-ray diffraction study was carried out. The XRD patterns were presented in Figure 2. The 1st and 2nd order of the amorphous halo are clearly visible confirming amorphousness of the materials.
α-Fe crystallization processes were recorded by differential scanning calorimetry (DSC). Samples were heated up to 580 °C with heating rates in the range from 10 to 100 °C/min. The DSC signals with marked temperatures of onset (Tx1onset) and crystallization peak (Tx1) of α-Fe are presented in Figure 3a–c. At lower heating rates the Tx1onset temperatures are very similar for all samples. However, as the heating rate increased the differences in characteristic temperatures are more visible—the higher the Cu content, the lower the Tx1onset temperature. The influence of Cu addition on crystallization temperature (Tx1) is not clearly noticeable, therefore the average activation energy was calculated. For this purpose the Kissinger model for not-isothermal crystallization was used [38]:
l n ( β T 2   ) = E a R T + C 1
where: β is the heating rate, E a is the activation energy, R is the gas constant, T is the temperature of maximum of crystallization peak and C 1   is the constant. The slope of linearly fitted l n ( β / T 2   ) vs. 1 / T curves is used to obtain E a .
The Kissinger plots l n ( β / T 2   ) vs. 1 / T with the determined activation energies E a are presented in Figure 3d–f. For the sample with 0.6 at.% of Cu the average E a is equal to 312.02 kJ/mol. For samples with a higher content of Cu = 1.1 at.% and 1.6 at.% the average E a decreases and is equal to 305.27 and 297.97 kJ/mol, respectively. There is a correlation between the decrease in E a and the onset of Tx1 crystallization temperatures with the increase in the Cu content. The Cu atoms agglomerate and act as a nucleation site for the α-Fe phase at the Cu nanocluster and amorphous phase boundary, which facilitates the precipitation of the α-Fe phase.

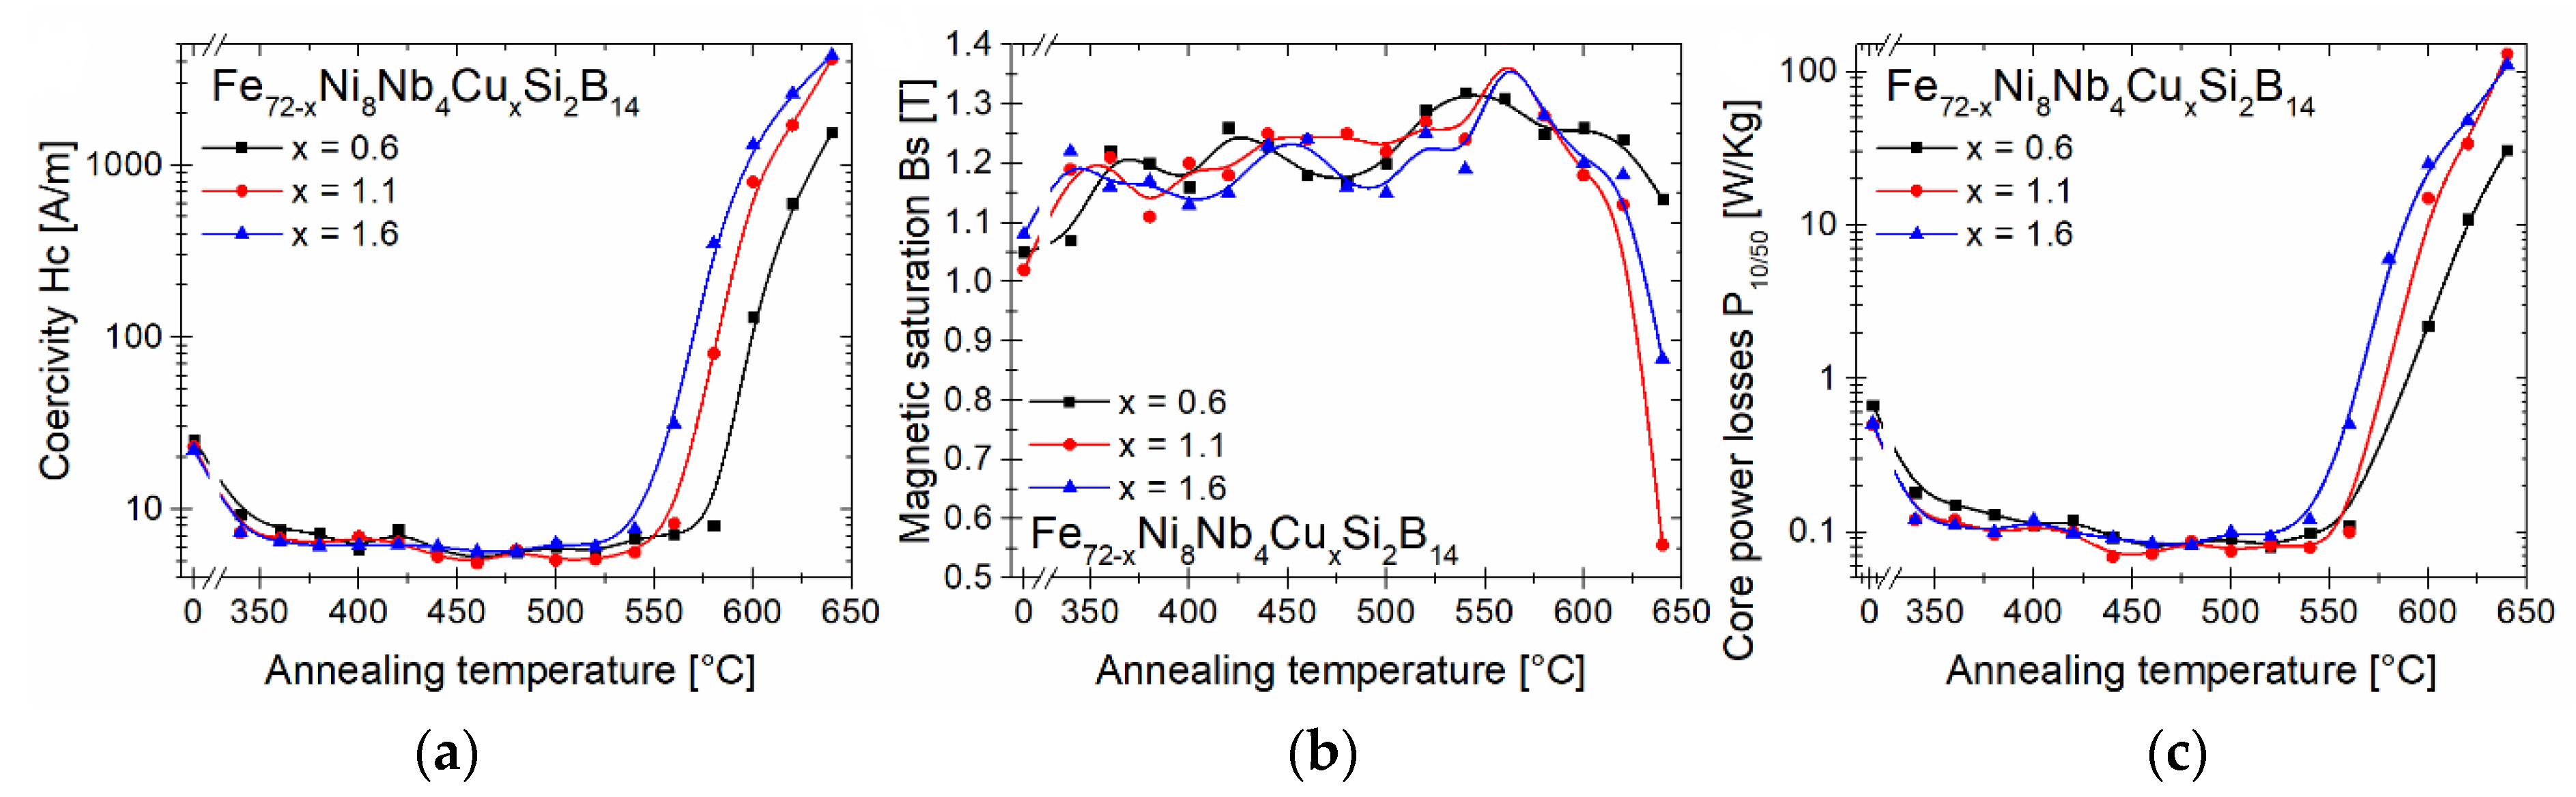
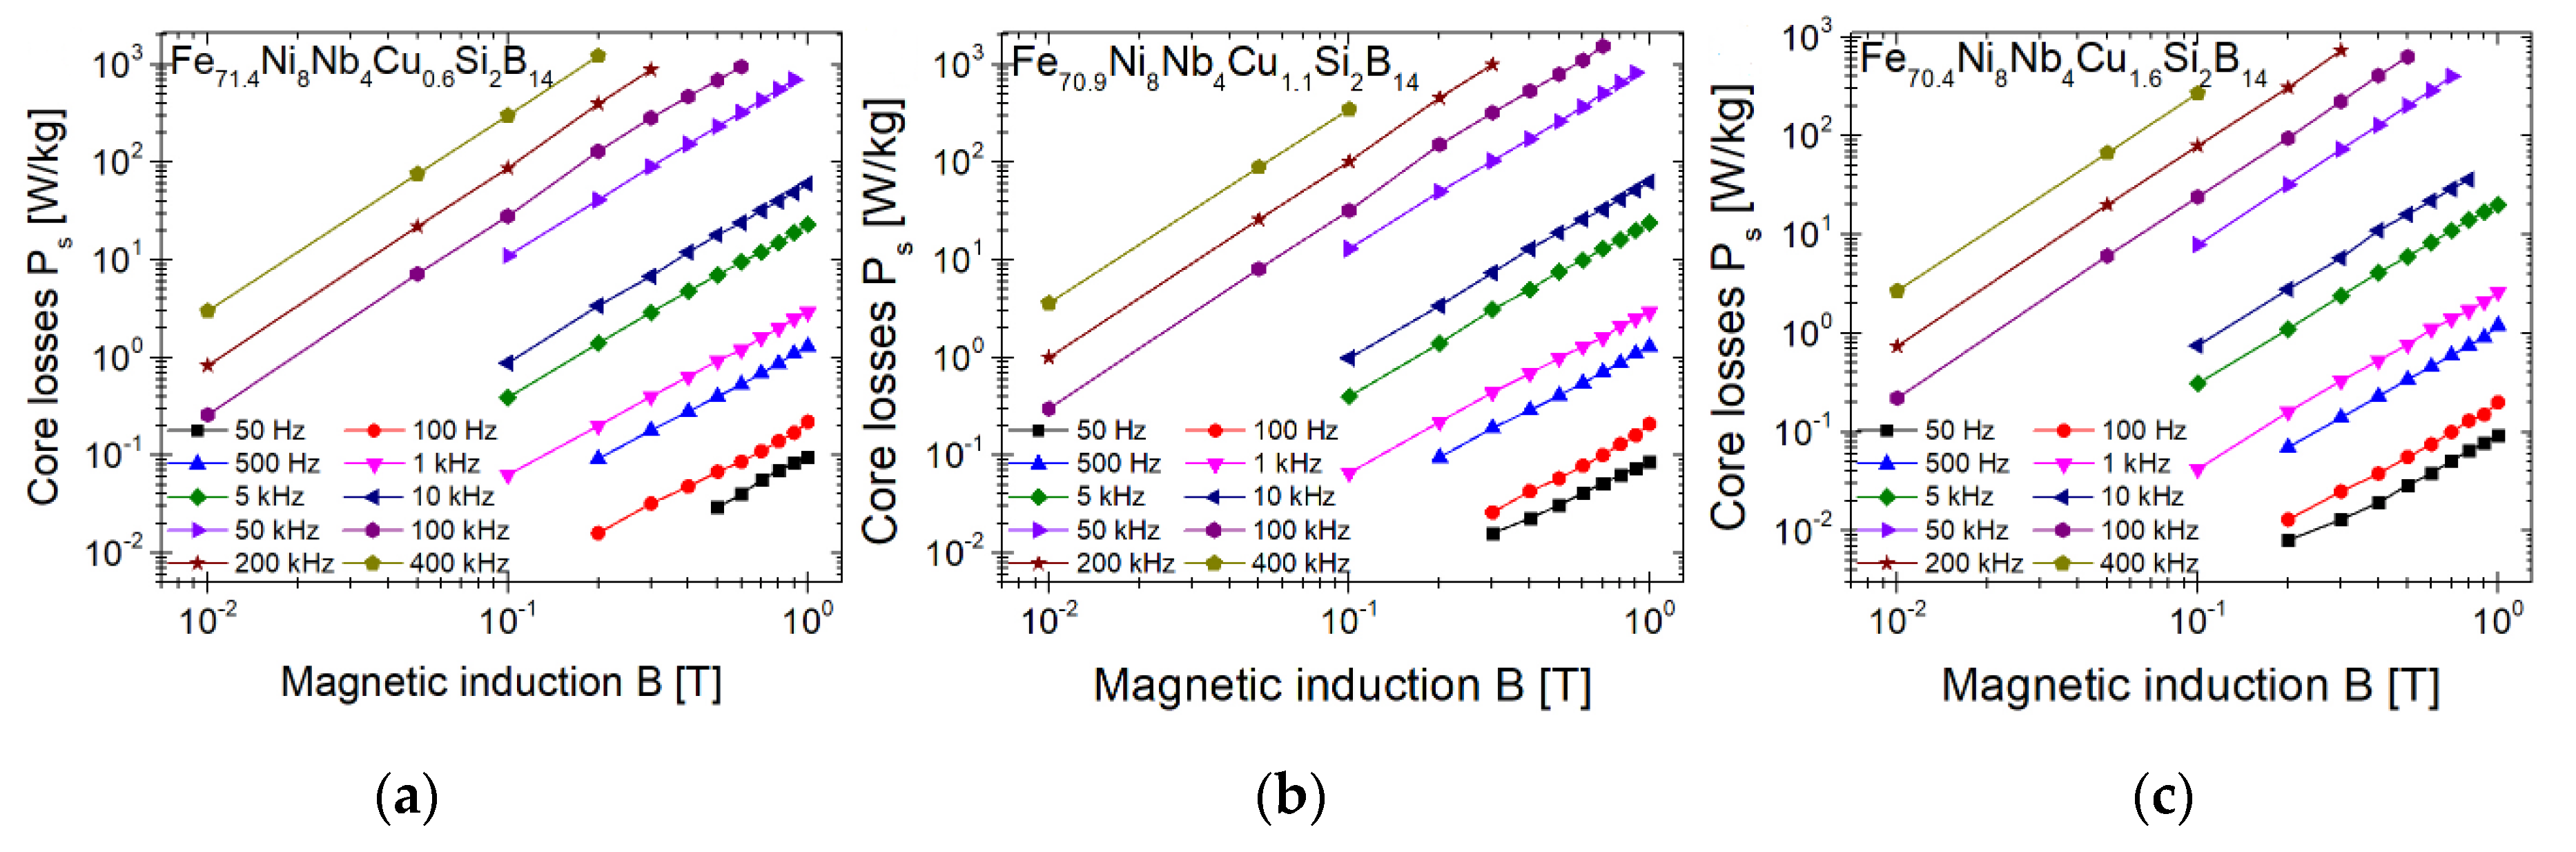
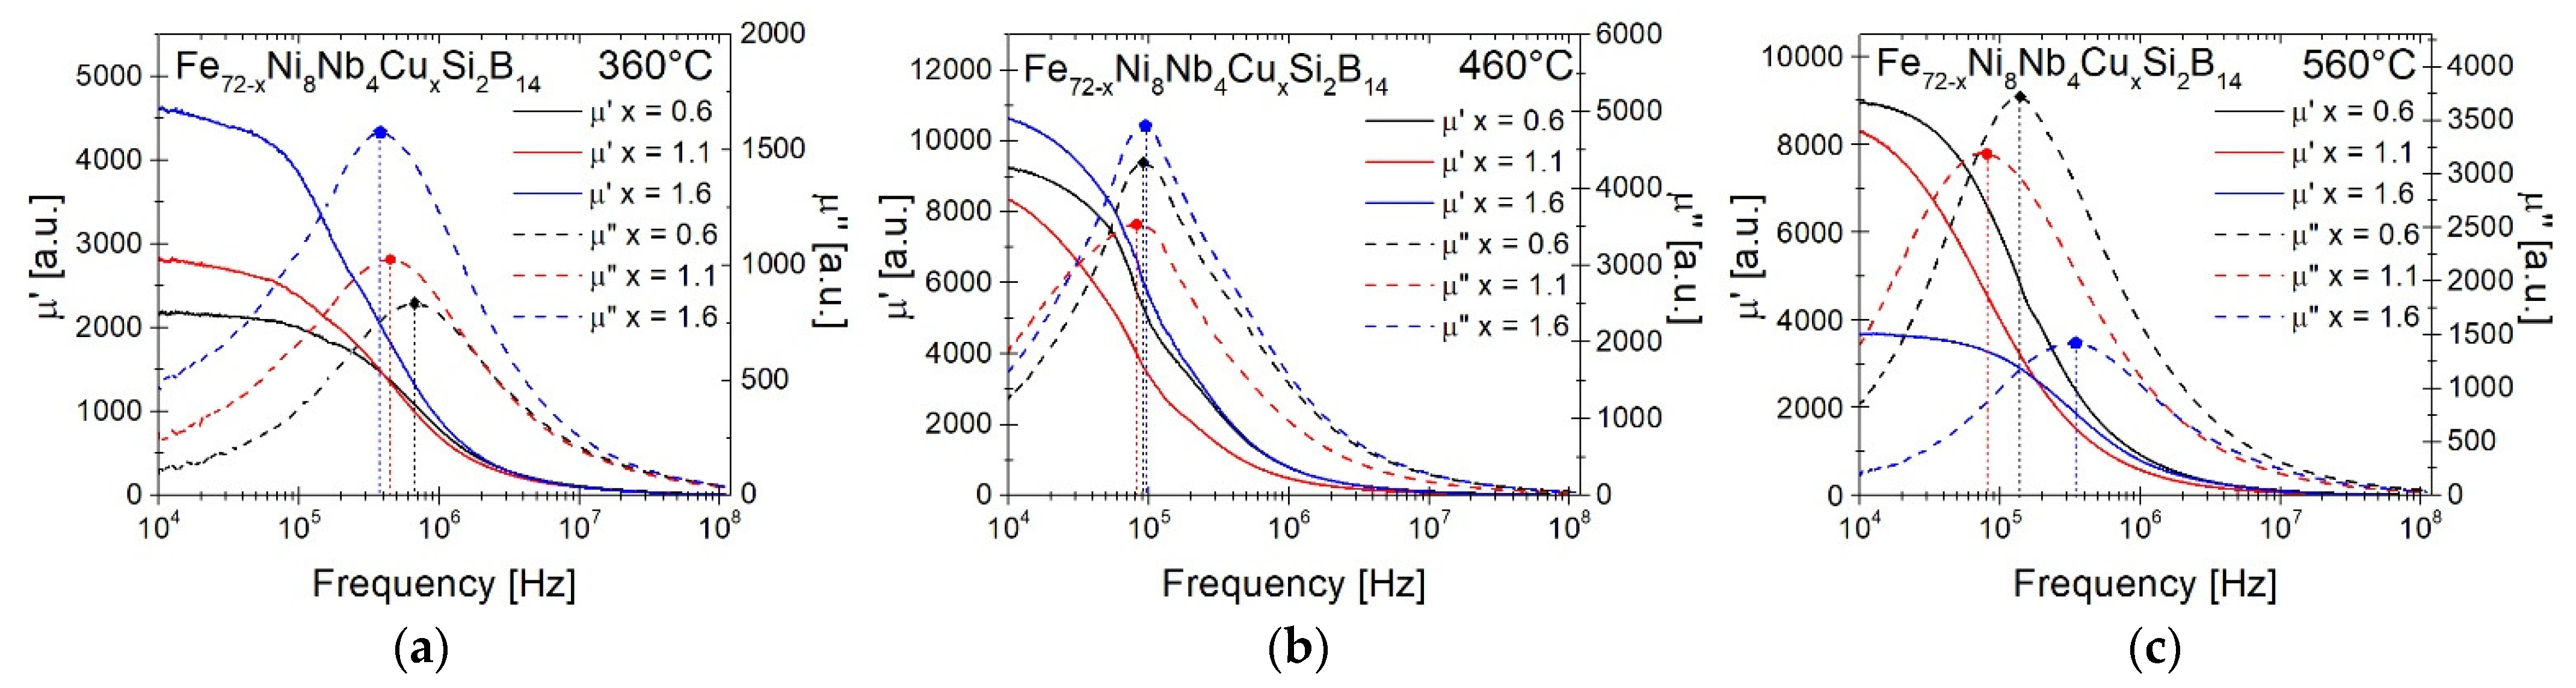
4.2. Magnetic Properties Studies

The dependence of the coercivity Hc, the magnetic saturation Bs and the core power losses at 1 T and 50 Hz P10/50 on the annealing temperatures for the as-spun and annealed alloys was presented in Figure 4. A significant improvement in the soft magnetic properties was noticed after the heat treatment at 340 °C. Similar values of Hc, Bs, and P10/50 have been maintained up to 540 °C for the material with Cu content equal to 1.6 at.% and up to 580 °C for the materials with 0.6 at.% and 1.1 at.% of Cu. Heat treatment at higher temperatures was associated with the deterioration of the soft magnetic properties, which was related to the separation of the boride phase. It is worth noting that the temperature of the boride phase formation decreases with increasing copper content in the materials. Table 1 shows magnetic properties of ribbon cores before and after 20 min isothermal annealing at characteristic temperatures: 360, 460, and 560 °C. Additionally, the results for Fe72Ni8Nb4Si2B14 annealed at 370 °C are provided for comparison. The alloys annealed at 360 °C differ significantly from the as-spun alloys. There was a 3.36–3.42-fold decrease in Hc, a 4.16–4.63-fold decrease in P10/50, and an increase in Bs by 7.4–18.6% compared to the non-annealed samples. The improvement of soft magnetic properties is related to the relaxation of stresses that arose during the rapid cooling of materials in the melt-spinning process. The temperature of 460 °C corresponds to the optimal annealing temperature for which the Hc value is the lowest for all ribbons. It is worth mentioning, that the material with 1.1 at.% Cu content had the lowest Hc and P10/50 values. The last characteristic temperature, i.e., 560 °C, corresponds to the annealing temperature, at which the boride phase begins to form. At this annealing temperature, the materials have the highest value of Bs equal to 1.31 T for 0.6 at.% Cu and 1.41 T for both 1.1 and 1.6 at.% Cu.
One of the most important parameters in terms of applicability are the core power losses Ps. Figure 5 shows the Ps parameter of metallic ribbons annealed at 460 °C depending on the magnetic induction for different frequencies. The Ps characteristics are summarized in Table 2. Additionally, the results of the previous work were added to the table for comparison (Fe72Ni8Nb4Si2B14 annealed at 370 °C). Initially, the value of the Ps parameter at lower frequencies is similar for all samples. However, as the frequency increases, the difference becomes apparent (Ps values for Cu content 1.6 < 0.6 < 1.1). The sample with Cu = 1.1 at.% has the highest values of Ps. For the sample with Cu = 1.6 at.% (minimum ΔGmix), with increasing frequency, the Ps value is lower by 5–25% than for samples with Cu = 1.1 at.%. For the sample with Cu = 0.6 at.% (minimum ΔGamorph), initially the losses are higher by 4% (P10/100), and then they decrease up to 15% (P0.5/400,000). It is worth mentioning that at low frequencies the values of the Ps parameter have a different relationship than at high frequencies (P10/50 values for Cu content 1.1 < 0.6 < 1.6).
The magnetic permeability µ′ and magnetic permeability loss µ″ in the function of frequency for samples annealed at 360, 460, and 560 °C were presented in Figure 6 and comparison of characteristic parameters is summarized in Table 3. Additionally, the results for Fe72Ni8Nb4Si2B14 annealed at 370 °C are provided. Among the samples annealed at 360 °C, the highest magnetic permeability µ′value has the sample with the Cu = 1.6 at.% (µ′ = 4623) and the lowest with Cu = 0.6 at.% (µ′ = 2152). After increasing the annealing temperature to 460 °C, the values of the real part of magnetic permeability increased drastically more than 2.2–4.5 times and the cut-off frequency is shifted towards lower frequencies. The highest value of µ′ among all measured samples, equal to 10,630, has a sample with a Cu content of 1.6 at.%, while the next one with a copper content of 0.6% at. has the value 9252. It is worth noting that both materials have a minimum Gibbs free energy value both the mixing (minimum ΔGmix) and the amorphous phase formation (minimum ΔGamorph). At the annealing temperature of 560 °C, materials with copper content Cu = 0.6 at.% and 1.1 at.% retained similar properties to their counterparts annealed at a lower temperature. However, for the sample Cu = 1.6 at.%, the permeability decreased significantly to 3679 and the cut-off frequency increased to 3.35 × 10⁵ Hz, which may be related to the different state of the crystal structure.

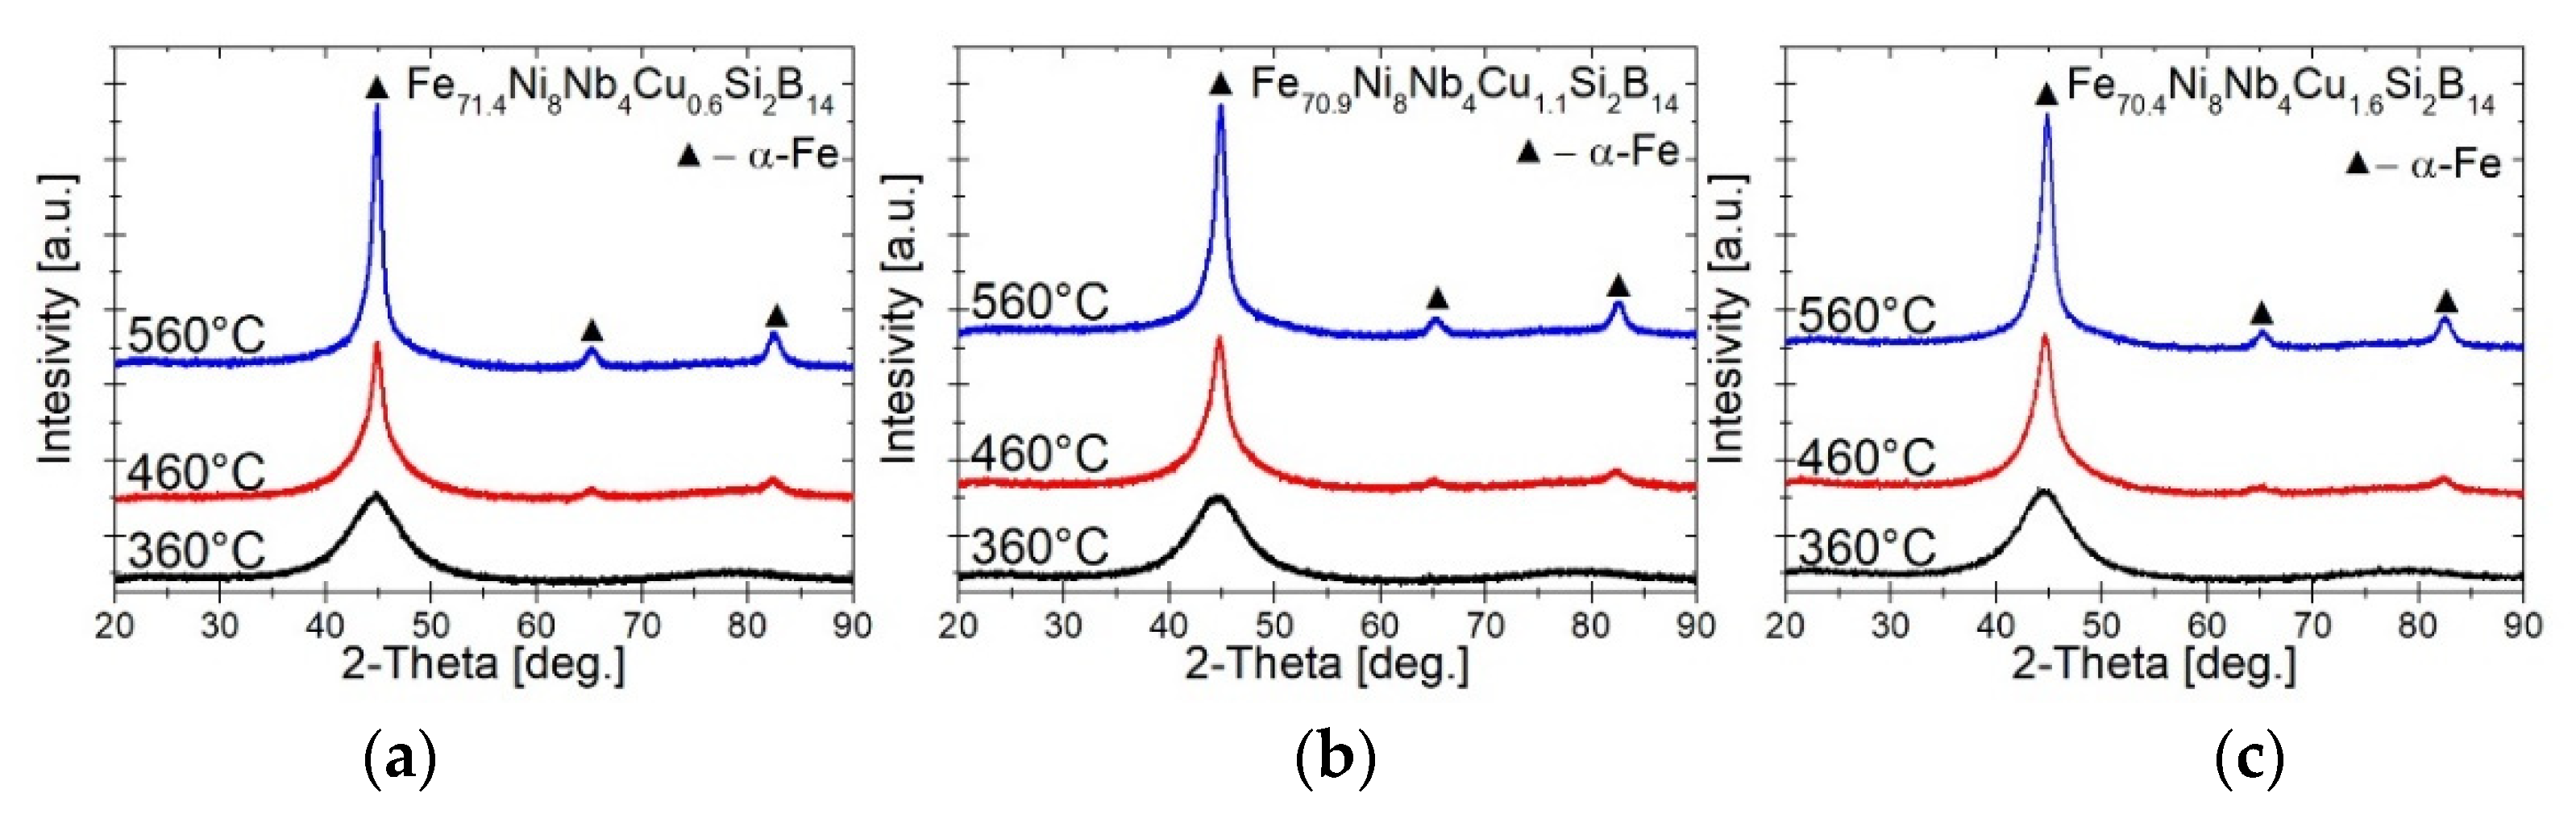
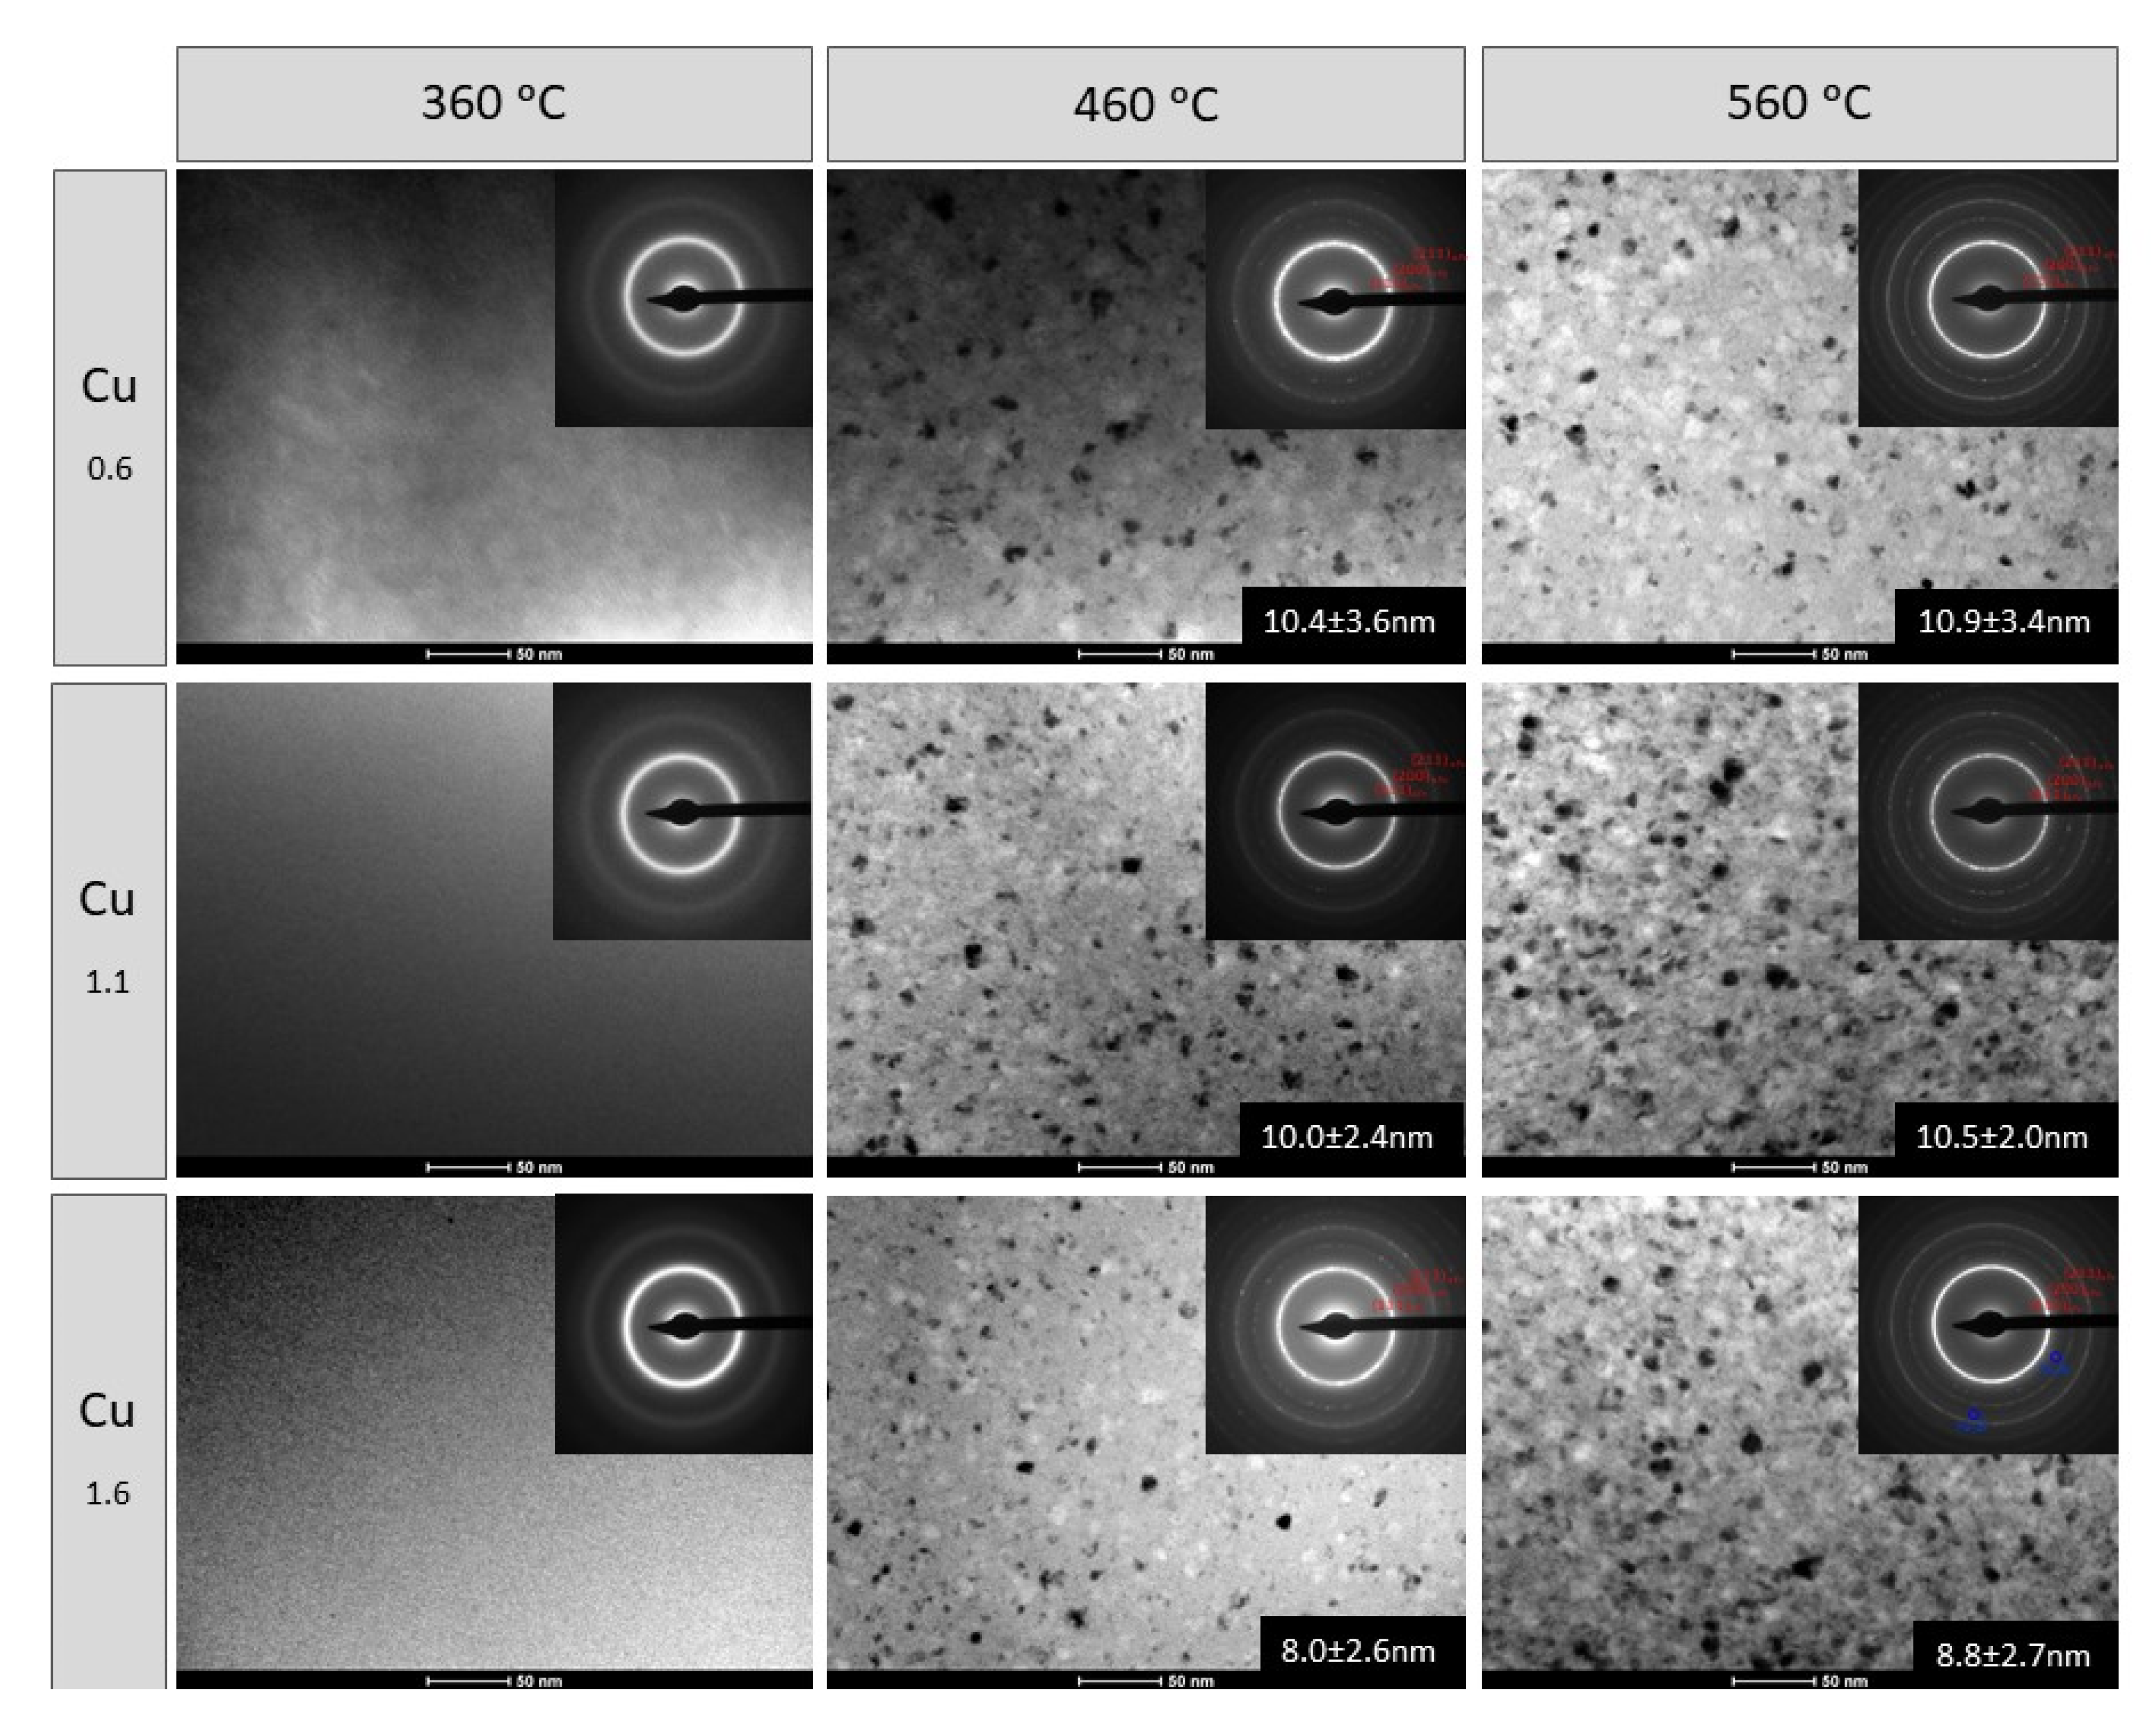
4.3. Crystal Structure of Annealed Alloys

To determine the influence of the structure on the magnetic properties, XRD and TEM studies were performed for samples annealed at characteristic temperatures. Figure 7 shows the XRD patterns of samples annealed at 360, 460, and 560 °C. The alloys after annealing at 360 °C are still in an amorphous state as a relaxed glass. It was noticed that with increasing temperature, reflections corresponding to the α-Fe phase begin to appear and at 560 °C the α-Fe peaks have higher intensities and become narrower.
Figure 8 presents a set of bright field (BF) images along with selected area electron diffraction patterns (SAEDPs) of Fe72−xNi8Nb4CuxSi2B14 ribbons containing 0.6 at.%, 1.1 at.% and 1.6 at.% Cu, annealed at 360, 460, and 560 °C. Regardless of the Cu content, ribbons annealed at 360 °C show a fully amorphous structure with the characteristic halo observed in SAEDPs. Ribbons heat treated at 460 °C were two-phase composed of α-Fe crystals embedded in an amorphous matrix while the samples after annealing at 560 °C were fully crystalized. SAEDPs were identified as α-Fe phase. However, in SAEDPs of ribbons containing 1.6 at.% of Cu annealed at 560 °C additional reflections corresponding to the Fe2B phase were found. Based on dark field (DF) images (an example of the set of BF, SAEDPs and DF images obtained from the marked reflections of α-Fe phase of Fe72−xNi8Nb4CuxSi2B14 ribbon heat treated at 460 °C), the average α-Fe crystallite sizes were calculated with standard deviations for each sample. The values are presented in Figure 8. With an increase in Cu content the size of the crystallites decreases slightly while with increasing temperature it increases. The smallest α-Fe crystallites, 8.0 ± 2.6 nm in size, were found in the Fe70.4Ni8Nb4Cu1.6Si2B14 ribbon, annealed at 460 °C.
The Figure 9 presents high-resolution transmission electron microscopy (HRTEM), fast Fourier transform (FFT) and inverse fast Fourier transform (IFFT) images of Fe70.4Ni8Nb4Cu1.6Si2B14 annealed at 560 °C. In the FFT, reflections corresponding to the α-Fe crystals and the additional phase were found. The extra phase reflections were indexed according to the Fe2B phase with a crystallite size below 2 nm.

5. Conclusions

The influence of copper addition on thermodynamic parameters, crystallization kinetics, crystal structure, and magnetic properties of Fe72−xNi8Nb4CuxSi2B14 alloys was investigated. Thermodynamic studies shows two minima of Gibbs free energy, i.e., ΔGamorph for Cu = 0.6 at.% and ΔGmix for Cu = 1.6 at.%. The study on the crystallization kinetics shows that with the increase in Cu content, the crystallization onset temperature Tx1onset and activation energy Ea of the α-Fe crystallization process decrease. However, the difference in Tx1 crystallization temperature between the materials is small. The annealing process has been optimized to determine the temperature corresponding to the lowest values of Hc and P10/50. A significant improvement in the soft magnetic properties was noted after annealing at 360 °C. Increasing the annealing temperature to 560 °C did not cause significant changes in the Hc and P10/50 values. The samples annealed at 460 °C had minimal Hc and P10/50 values. The best soft magnetic properties: Hc = 4.88 A/m, Bs = 1.24 T, P10/50 = 0.072 W/kg, have been found for a sample with Cu = 1.1 at.%. More in-depth studies of the core power losses show a linear increase in Ps values as a function of frequency. Magnetic permeability studies have proven that the measurement materials, after annealing at 460 °C, can reach µ′ values in the range of 8350–10,630, with a cut-off frequency of nearly 105 Hz. It is interesting to note that the highest values of µ′ correspond to materials with 1.6 at.% and 0.6 at.% Cu content (minimum of Gibbs free energy). It is also worth paying attention to the positive effect of the Cu addition on the magnetic properties in comparison with Cu-free counterpart (Fe72Ni8Nb4Si2B14 alloy) studied in our previous work [33]. The materials obtained in this work have higher Bs values and lower Ps values in the entire tested frequency and magnetic induction range. These improved magnetic parameters (higher Bs and lower Ps in the broad frequency range) are crucial especially in electric motor application. Structure studies confirmed the amorphous state of the as-spun materials and relaxed glass for samples annealed at 360 °C. These studies also allowed to determine the microstructure evolution caused by the annealing process. It was observed that the addition of Cu had a significant effect on the fine-grained structure, reducing the size of the crystallites of the alloys annealed at 460 °C (from 10.4 nm for Cu = 0.6 at.% to 8.0 nm for Cu = 1.6 at.%). Moreover, increasing the Cu content reduces the amount of crystallites present in the amorphous matrix after the annealing process. However, it has negative effect on thermal stability and lowers the crystallization temperature of the Fe2B phase. In summary, the high value of magnetic permeability µ′, low core power losses Ps and coercivity Hc, satisfactory Bs and good thermal stability of the discussed alloys make it possible to find the application as replacements of existing materials used in the electrical devices and power industry.

Author Contributions

Conceptualization, T.W., L.H. and A.K.-B.; investigation, T.W., P.W., M.P., P.Z., A.R., A.W., W.M. and L.H.; writing—original draft preparation, T.W.; writing—review and editing, T.W., L.H. and P.W.; supervision, L.H. All authors have read and agreed to the published version of the manuscript.

Funding

This work was funded by the National Centre for Research and Development Grant TECHMATSTRATEG No. 1/347200/11/NCBR/2017.

Institutional Review Board Statement

Not applicable.

Informed Consent Statement

Not applicable.

Data Availability Statement

The data presented in this study are available on request from the corresponding authors.

Conflicts of Interest

The authors declare no conflict of interest. The funders had no role in the design of the study; in the collection, analyses, or interpretation of data; in the writing of the manuscript, or in the decision to publish the results.

References

  1. Eckard, R. Soft Magnetic Materials: Applications and Markets; BCC Publishing: Wellesley, MA, USA, 2020; MFG072A. [Google Scholar]
  2. Wang, J.; Sheng, W.; Wang, L.; Yang, H. Study on technical and economical efficiency of amorphous alloy transformer and on-load capacity regulating transformer in distribution network application. In Proceedings of the International Conference on Electricity Distribution (CICED), Shenzhen, China, 23–26 September 2014; pp. 30–34. [Google Scholar]
  3. Yurekten, S.; Kara, A.; Mardikyan, K. Energy efficient green transformer manufacturing with amorphous cores. In Proceedings of the 2013 International Conference on Renewable Energy Research and Applications (ICRERA), Madrid, Spain, 20–23 October 2013; pp. 534–536. [Google Scholar]
  4. Wang, L.J.; Pei, Y.; Wang, L.Y. Inverter cores using FeMoCuSib nanocrystalline soft magnetic alloys. Mater. Sci. Eng. A 2001, 304–306, 1075–1077. [Google Scholar] [CrossRef]
  5. Rabiul Islam, M.; Guo, Y.; Wei Lin, Z.; Zhu, J. An amorphous alloy core medium frequency magnetic-link for medium voltage photovoltaic inverters. J. Appl. Phys. 2014, 115, 17E710. [Google Scholar] [CrossRef] [Green Version]
  6. Okamoto, S.; Denis, N.; Kato, Y.; Ieki, M.; Fujisaki, K. Core Loss Reduction of an Interior Permanent-Magnet Synchronous Motor Using Amorphous Stator Core. IEEE Trans. Ind. Appl. 2016, 52, 2261–2268. [Google Scholar] [CrossRef]
  7. Matizamhuka, W. The impact of magnetic materials in renewable energy-related technologies in the 21st century industrial revolution: The case of South Africa. Adv. Mater. Sci. Eng. 2018, 2018, 3149412. [Google Scholar] [CrossRef] [Green Version]
  8. Islam, M.R.; Guo, Y.; Zhu, J. A medium frequency transformer with multiple secondary windings for medium voltage converter based wind turbine power generating systems. J. Appl. Phys. 2013, 113, 17A324. [Google Scholar] [CrossRef]
  9. Krings, A.; Boglietti, A.; Cavagnino, A.; Sprague, S. Soft Magnetic Material Status and Trends in Electric Machines. IEEE Trans. Ind. Electron. 2017, 64, 2405–2414. [Google Scholar] [CrossRef]
  10. Ferch, M. Application overview of nanocrystalline inductive components in today’s power electronic systems. Magn. GmbH 2013. Available online: https://www.semanticscholar.org/paper/Application-overview-of-nanocrystalline-inductive-%E2%80%99-Ferch/74ad44215c5bc16a68c8976f752caa5e7ce282f2 (accessed on 3 February 2021).
  11. Zhang, P.; Wei, H.; Wei, X.; Long, Z.; Su, X. Evaluation of glass-forming ability for bulk metallic glasses based on characteristic temperatures. J. Non-Cryst. Solids 2009, 355, 2183–2189. [Google Scholar] [CrossRef]
  12. Shi, L.; Yao, K. Composition design for Fe-based soft magnetic amorphous and nanocrystalline alloys with high Fe content. Mater. Des. 2020, 189, 108511. [Google Scholar] [CrossRef]
  13. Tang, C.; Zhou, H. Thermodynamics and the Glass Forming Ability of Alloys. In Thermodynamics: Physical Chemistry of Aqueous Systemsed; IntechOpen: London, UK, 2011. [Google Scholar]
  14. Lashgari, H.R.; Chu, D.; Xie, S.; Sun, H.; Ferry, M.; Li, S. Composition dependence of the microstructure and soft magnetic properties of Fe-based amorphous/nanocrystalline alloys: A review study. J. Non Cryst. Solids 2014, 391, 61–82. [Google Scholar] [CrossRef]
  15. Yao, B.; Si, L.; Tan, H.; Zhang, Y.; Li, Y. Effects of high boron content on crystallization, forming ability and magnetic properties of amorphous Fe91-xZr5B xNb4 alloy. J. Non Cryst. Solids 2003, 331, 43–52. [Google Scholar] [CrossRef]
  16. Jung, H.Y.; Yi, S. Enhanced glass forming ability and soft magnetic properties through an optimum Nb addition to a Fe-C-Si-B-P bulk metallic glass. Intermetallics 2010, 18, 1936–1940. [Google Scholar] [CrossRef]
  17. Zhu, M.; Chen, S.; Yao, L.; Li, Y.; Wang, Y.; Jian, Z.; Chang, F. The influence of Ni or Co substitution for Fe on glass forming ability and magnetic properties in the quaternary Fe-Nb-B-Ni and (Fe, Ni, Co)-Nb-B alloy systems. J. Mater. Res. 2015, 30, 811–817. [Google Scholar] [CrossRef]
  18. Efthimiadis, K.G.; Chrissafis, K.; Polychroniadis, E.K. Combined study of crystallization of amorphous Fe75-xNixSi9B16 alloy. Mater. Sci. Eng. A 2004, 366, 211–220. [Google Scholar] [CrossRef]
  19. Rahman, A.; Luo, Q.; Lu, Y.; Shen, J. Recurring effects of Cu addition on magnetic properties in Fe-based bulk metallic glasses. J. Non-Cryst. Solids 2015, 442, 1–5. [Google Scholar] [CrossRef]
  20. Fan, X.; Ma, A.; Men, H.; Xie, G.; Shen, B.; Makino, A.; Inoue, A. Fe-based nanocrystalline FeBCCu soft magnetic alloys with high magnetic flux density. J. Appl. Phys. 2011, 109, 07A314. [Google Scholar] [CrossRef]
  21. Jiao, Z.B.; Li, H.X.; Gao, J.E.; Wu, Y.; Lu, Z.P. Effects of alloying elements on glass formation, mechanical and soft-magnetic properties of Fe-based metallic glasses. Intermetallics 2011, 19, 1502–1508. [Google Scholar] [CrossRef]
  22. Jia, Y.; Zeng, S.; Shan, S.; Zhang, L.; Fan, C.; Zhang, B.; Zhan, Z.; Liu, R.; Wang, W. Effect of copper addition on the glass forming ability of a Fe-Co based alloy. J. Alloys Compd. 2007, 440, 113–116. [Google Scholar] [CrossRef]
  23. Dou, L.; Liu, H.; Hou, L.; Xue, L.; Yang, W.; Zhao, Y.; Chang, C.; Shen, B. Effects of Cu substitution for Fe on the glass-forming ability and soft magnetic properties for Fe-based bulk metallic glasses. J. Magn. Magn. Mater. 2014, 358–359, 23–26. [Google Scholar] [CrossRef]
  24. Takeuchi, A.; Inoue, A. Classification of bulk metallic glasses by atomic size difference, heat of mixing and period of constituent elements and its application to characterization of the main alloying element. Mater. Trans. 2005, 46, 2817–2829. [Google Scholar] [CrossRef] [Green Version]
  25. Li, H.X.; Gao, J.E.; Wu, Y.; Jiao, Z.B.; Ma, D.; Stoica, A.D.; Wang, X.L.; Ren, Y.; Miller, M.K.; Lu, Z.P. Enhancing glass-forming ability via frustration of nano-clustering in alloys with a high solvent content. Sci. Rep. 2013, 3, 1983. [Google Scholar] [CrossRef]
  26. Lesz, S.; Babilas, R.; Dośpial, M.; Nowosielski, R. Effect of Cu addition on the GFA, structure and properties of Fe-Co-based alloy. Arch. Mater. Sci. Eng. 2012, 55, 70–77. [Google Scholar]
  27. Radoń, A.; Babilas, R.; Włodarczyk, P.; Zackiewicz, P.; Łukowiec, D.; Polak, M.; Kądziołka-Gaweł, M.; Kolano-Burian, A.; Hawełek, Ł. Influence of copper addition and heat treatment parameters on nanocrystallization process of Fe-Co-Mo-B-Si amorphous ribbons with high saturation magnetization about 1.6 T. J. Magn. Magn. Mater. 2020, 496, 165951. [Google Scholar] [CrossRef]
  28. Warski, T.; Wlodarczyk, P.; Polak, M.; Zackiewicz, P.; Radon, A.; Wojcik, A.; Szlezynger, M.; Kolano-Burian, A.; Hawelek, L. Influence of Cu content on structure and magnetic properties in Fe86-xCuxB14 alloys. Materials 2020, 13, 1451. [Google Scholar] [CrossRef] [PubMed] [Green Version]
  29. Aronhime, N.; Zoghlin, E.; Keylin, V.; Jin, X.; Ohodnicki, P.; McHenry, M.E. Magnetic properties and crystallization kinetics of (Fe100−xNix)80Nb4Si2B14 metal amorphous nanocomposites. Scr. Mater. 2018, 142, 133–137. [Google Scholar] [CrossRef]
  30. Aronhime, N.; DeGeorge, V.; Keylin, V.; Ohodnicki, P.; McHenry, M.E. The Effects of Strain-Annealing on Tuning Permeability and Lowering Losses in Fe-Ni-Based Metal Amorphous Nanocomposites. JOM 2017, 69, 2164–2170. [Google Scholar] [CrossRef]
  31. Gutiérrez, J.; Barandiarán, J.M.; Mínguez, P.; Kaczkowski, Z.; Ruuskanen, P.; Vlasák, G.; Svec, P.; Duhaj, P. Influence of heat treatment on the magnetic and piezomagnetic properties of amorphous and nanocrystalline Fe64Ni10Nb 3Cu1Si13B9 alloy strips. Sens. Actuators A Phys. 2003, 106, 69–72. [Google Scholar] [CrossRef]
  32. Vacuumschmelze. VITROPERM 250 Product Information. 2010. Available online: https://www.vacuumschmelze.com/Nanocrystalline-Material (accessed on 3 February 2021).
  33. Hawelek, L.; Warski, T.; Wlodarczyk, P.; Polak, M.; Zackiewicz, P.; Maziarz, W.; Wojcik, A.; Steczkowska-Kempka, M.; Kolano-Burian, A. The Structure and Magnetic Properties of Rapidly Quenched Fe72Ni8Nb4Si2B14 Alloy. Materials 2021, 14, 5. [Google Scholar] [CrossRef] [PubMed]
  34. De Boer, F.R.; Boom, R.; Mattens, W.C.M.; Miedema, A.R.; Niessen, A.K. Cohesion in Metals: Transition Metal Alloys; Cohesion and Structure vol.1; North Holland: Amsterdam, The Netherlands, 1989; ISBN 0444870989. [Google Scholar]
  35. Zhang, R.F.; Sheng, S.H.; Liu, B.X. Predicting the formation enthalpies of binary intermetallic compounds. Chem. Phys. Lett. 2007, 442, 511–514. [Google Scholar] [CrossRef]
  36. Bakker, H. Material Science Foundations: Enthalpies in Alloys—Miedema’s Semi-Empirical Model; Enfield Publishing & Distribution Company: Zurich, Switzerland, 1998; ISBN 0878497838. [Google Scholar]
  37. Zhang, R.F.; Rajan, K. Statistically based assessment of formation enthalpy for intermetallic compounds. Chem. Phys. Lett. 2014, 612, 177–181. [Google Scholar] [CrossRef]
  38. Kong, L.H.; Gao, Y.L.; Song, T.T.; Wang, G.; Zhai, Q.J. Non-isothermal crystallization kinetics of FeZrB amorphous alloy. Thermochim. Acta 2011, 552, 166–172. [Google Scholar] [CrossRef]
Figure 1. The influence of the copper content on the Gibbs free energy of mixing (ΔGmix) and formation of amorphous phase (ΔGamorph).
Materials 14 00726 g001
Figure 2. The XRD patterns of as-spun alloys.
Materials 14 00726 g002
Figure 3. The DSC thermograms for heating rates (a,c,e) ranged from 10 to 100 °C/min and Kissinger plots determined for crystallization peak temperatures Tx1 (b,d,f) of as-spun amorphous alloys.
Materials 14 00726 g003
Figure 4. Coercivity Hc (a), magnetic saturation Bs (b) and core power losses P10/50 (c) of measured cores.
Materials 14 00726 g004
Figure 5. Core power losses Ps of annealed at 460 °C metallic ribbons: Fe71.4Ni8Nb4Cu0.6Si2B14 (a), Fe70.9Ni8Nb4Cu1.1Si2B14 (b) and Fe70.4Ni8Nb4Cu1.6Si2B14 (c) measured at 50 Hz–400 kHz in function of magnetic induction.
Materials 14 00726 g005
Figure 6. Magnetic permeability µ′ and magnetic loss permeability µ″ dependence as a function of frequency for samples annealed at 360 °C (a), 460 °C (b), and 560 °C (c).
Materials 14 00726 g006
Figure 7. XRD patterns of Fe71.4Ni8Nb4Cu0.6Si2B14 (a), Fe70.9Ni8Nb4Cu1.1Si2B14 (b) and Fe70.4Ni8Nb4Cu1.6Si2B14 (c) annealed at 360 °C, 460 °C, and 560 °C.
Materials 14 00726 g007
Figure 8. Microstructural evolution of Fe72−xNi8Nb4CuxSi2B14.
Materials 14 00726 g008
Figure 9. HRTEM, FFT, and IFFT images of Fe70.4Ni8Nb4Cu1.6Si2B14 annealed at 560 °C.
Materials 14 00726 g009
Table 1. Coercivity Hc, magnetic saturation Bs and core power losses P10/50 of amorphous ribbon cores as-spun and annealed at characteristic temperatures.
AlloyAnnealing Temperatures [°C]Hc [A/m]Bs [T]P10/50 [W/kg]
Fe71.4Ni8Nb4Cu0.6Si2B14As-spun25.71.050.67
3607.641.220.15
4605.171.180.079
5607.191.310.11
Fe70.9Ni8Nb4Cu1.1Si2B14As-spun23.31.020.5
3606.81.210.12
4604.881.240.072
5608.281.410.1
Fe70.4Ni8Nb4Cu1.6Si2B14As-spun22.21.080.51
3606.481.160.11
4605.691.240.084
56031.41.410.5
Fe72Ni8Nb4Si2B14 [33]3703.951.090.092
Table 2. Different core power losses values of Fe72−xNi8Nb4CuxSi2B14 alloys (x = 0, 0.6, 1.1, 1.6).
Ps [W/kg]x = 0.6x = 1.1x = 1.6x = 0 [33]
P10/1000.220.210.20.28
P10/5001.31.31.21.8
P10/10002.92.92.64.2
P10/500023242035
P5/10,00018191629
P5/50,000232261202321
P1/100,00028322439
P1/200,0008710279110
P0.5/400,00076896788
Table 3. Magnetic permeability µ′ at 104 Hz and cut-off frequency for annealed toroidal cores at characteristic temperatures.
AlloyAnnealing Temperature [°C]Magnetic Permeability µ′ at 104 HzCut-Off Frequency [Hz]
Fe71.4Ni8Nb4Cu0.6Si2B1436021526.7 × 105
46092528.9 × 104
56089461.39 × 105
Fe70.9Ni8Nb4Cu1.1Si2B1436028254.17 × 105
46083508 × 104
56083096.8 × 104
Fe70.4Ni8Nb4Cu1.6Si2B1436046233.8 × 105
46010,6309.3 × 104
56036793.35 × 105
Fe72Ni8Nb4Si2B14 [33]37031005.07 × 105
Publisher’s Note: MDPI stays neutral with regard to jurisdictional claims in published maps and institutional affiliations.

