
Characterization of Phosphate Coatings: Influence of the Acid Pickling Conditions


Abstract
:1. Introduction
2. Materials and Methods
3. Results and Discussion
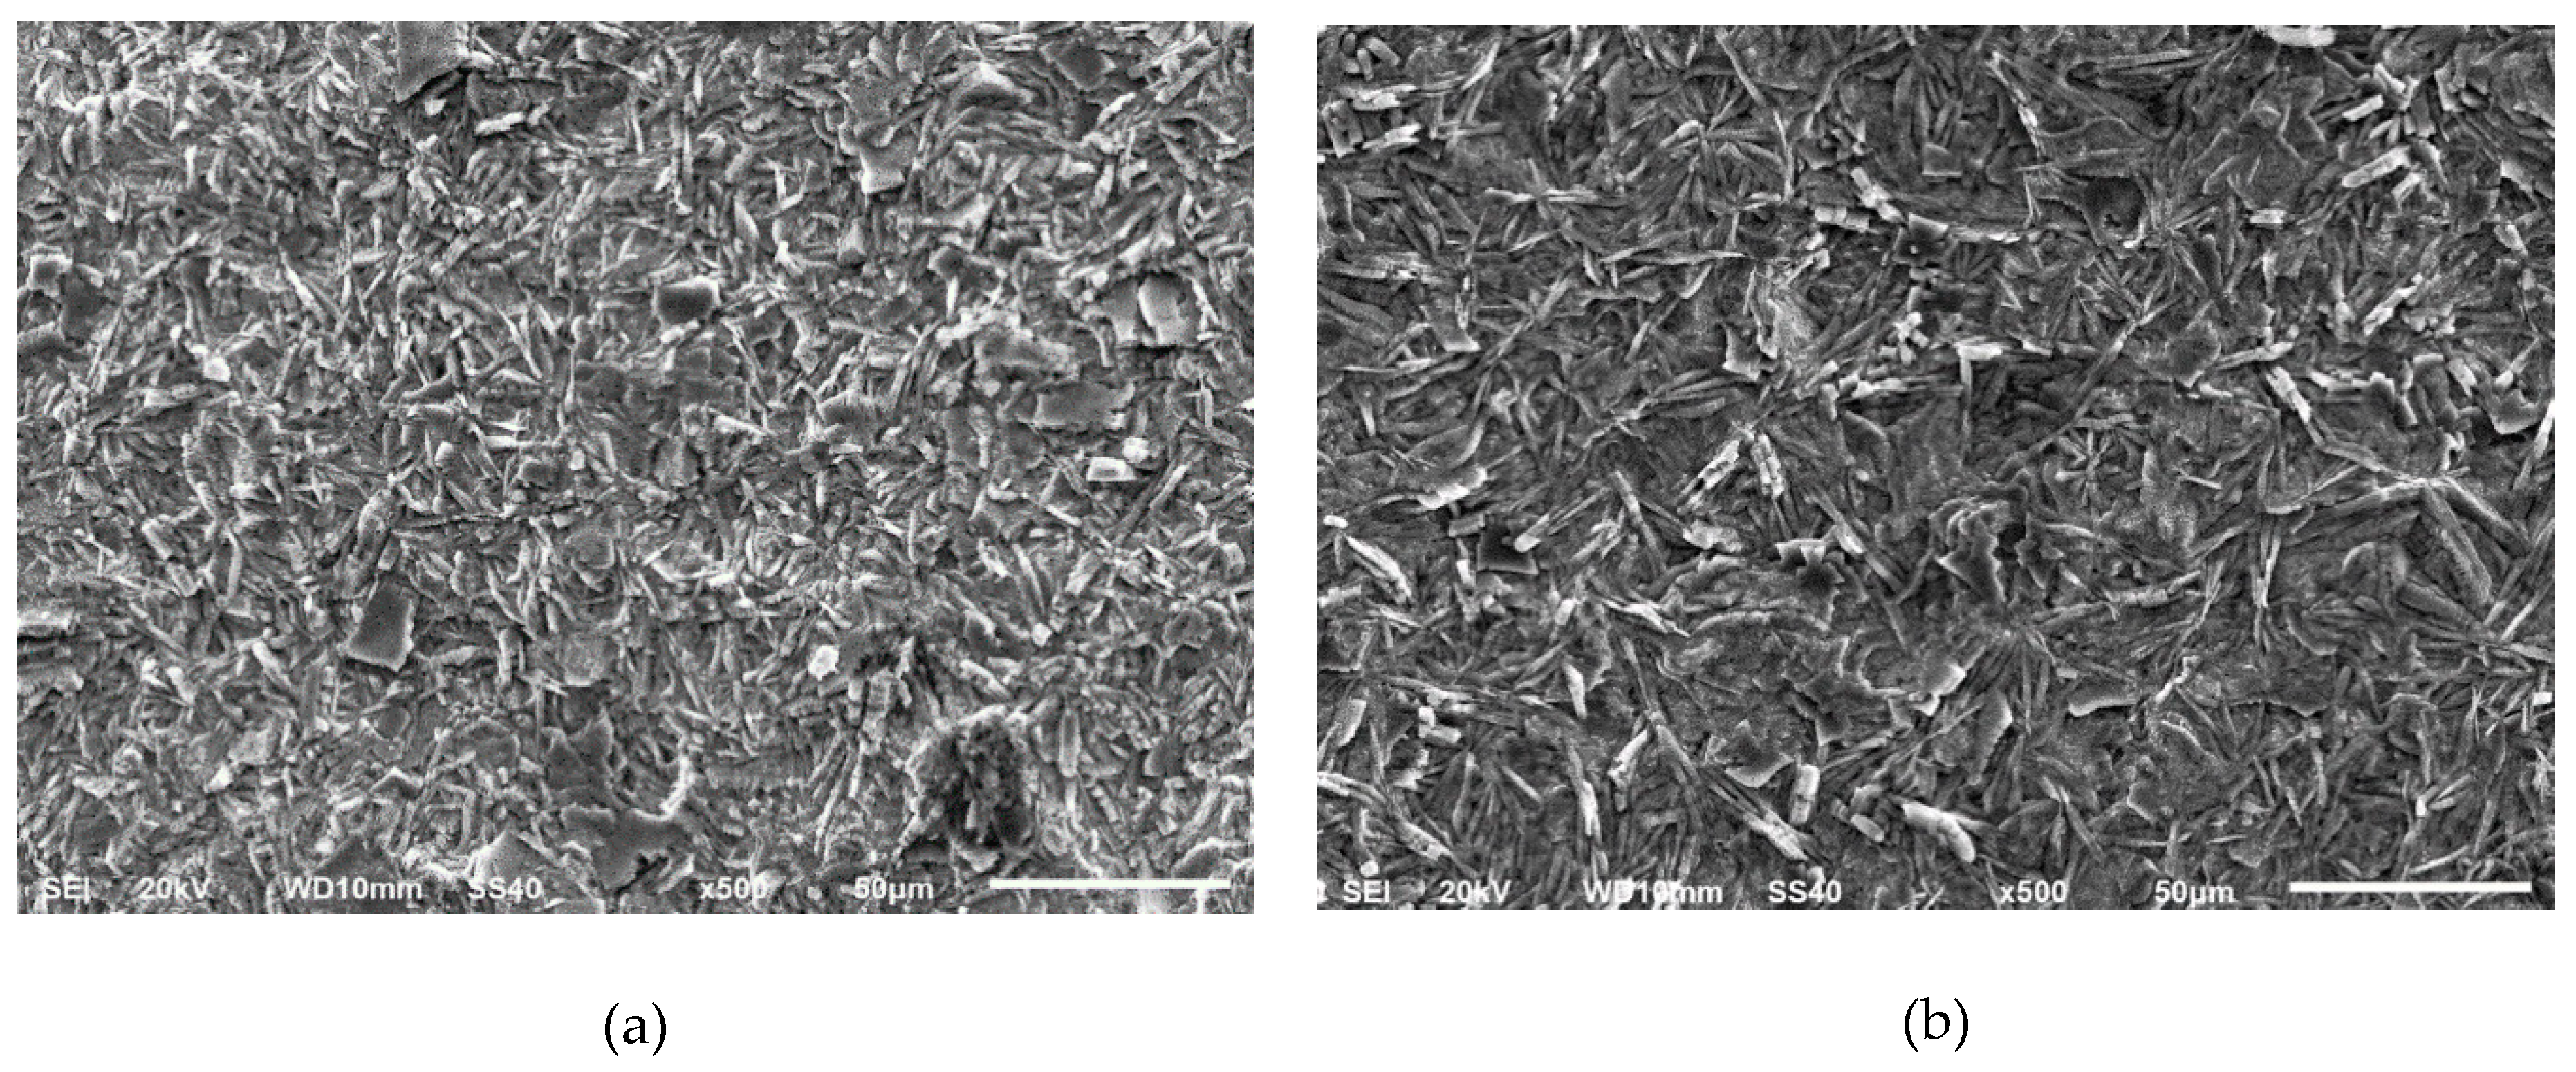
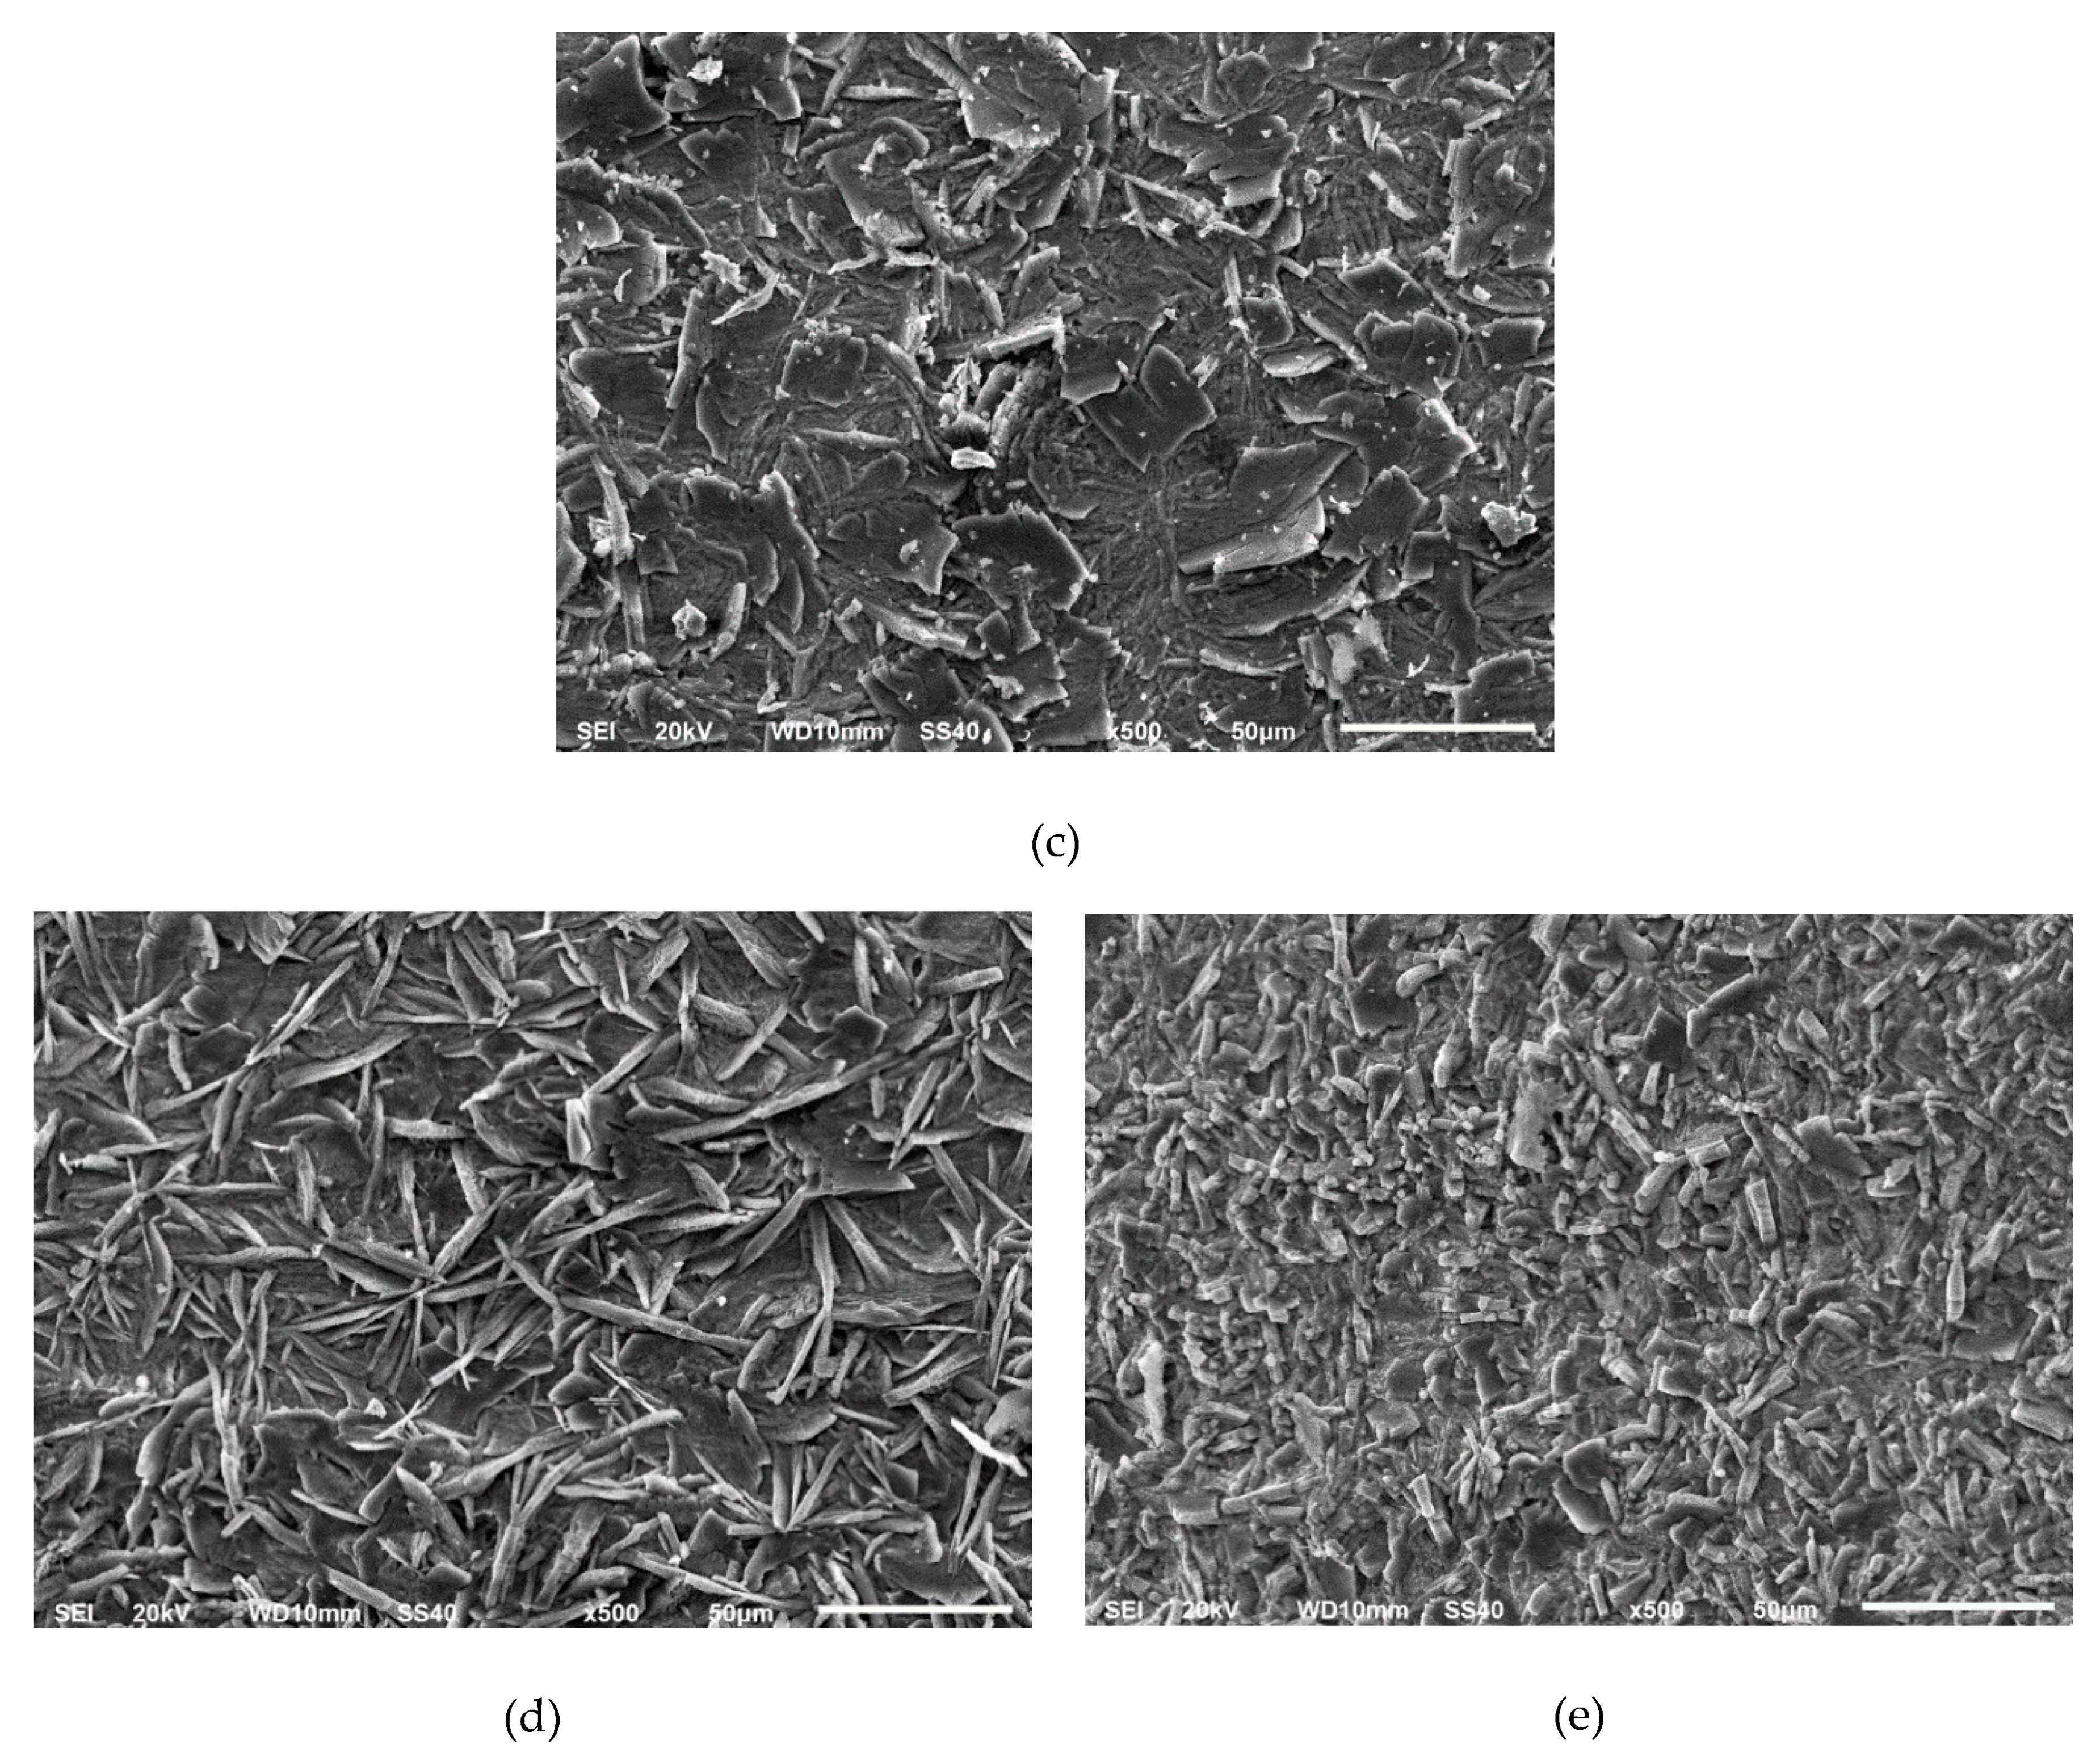
3.1. Phosphate Coatings after Pickling with the Conventional Acids
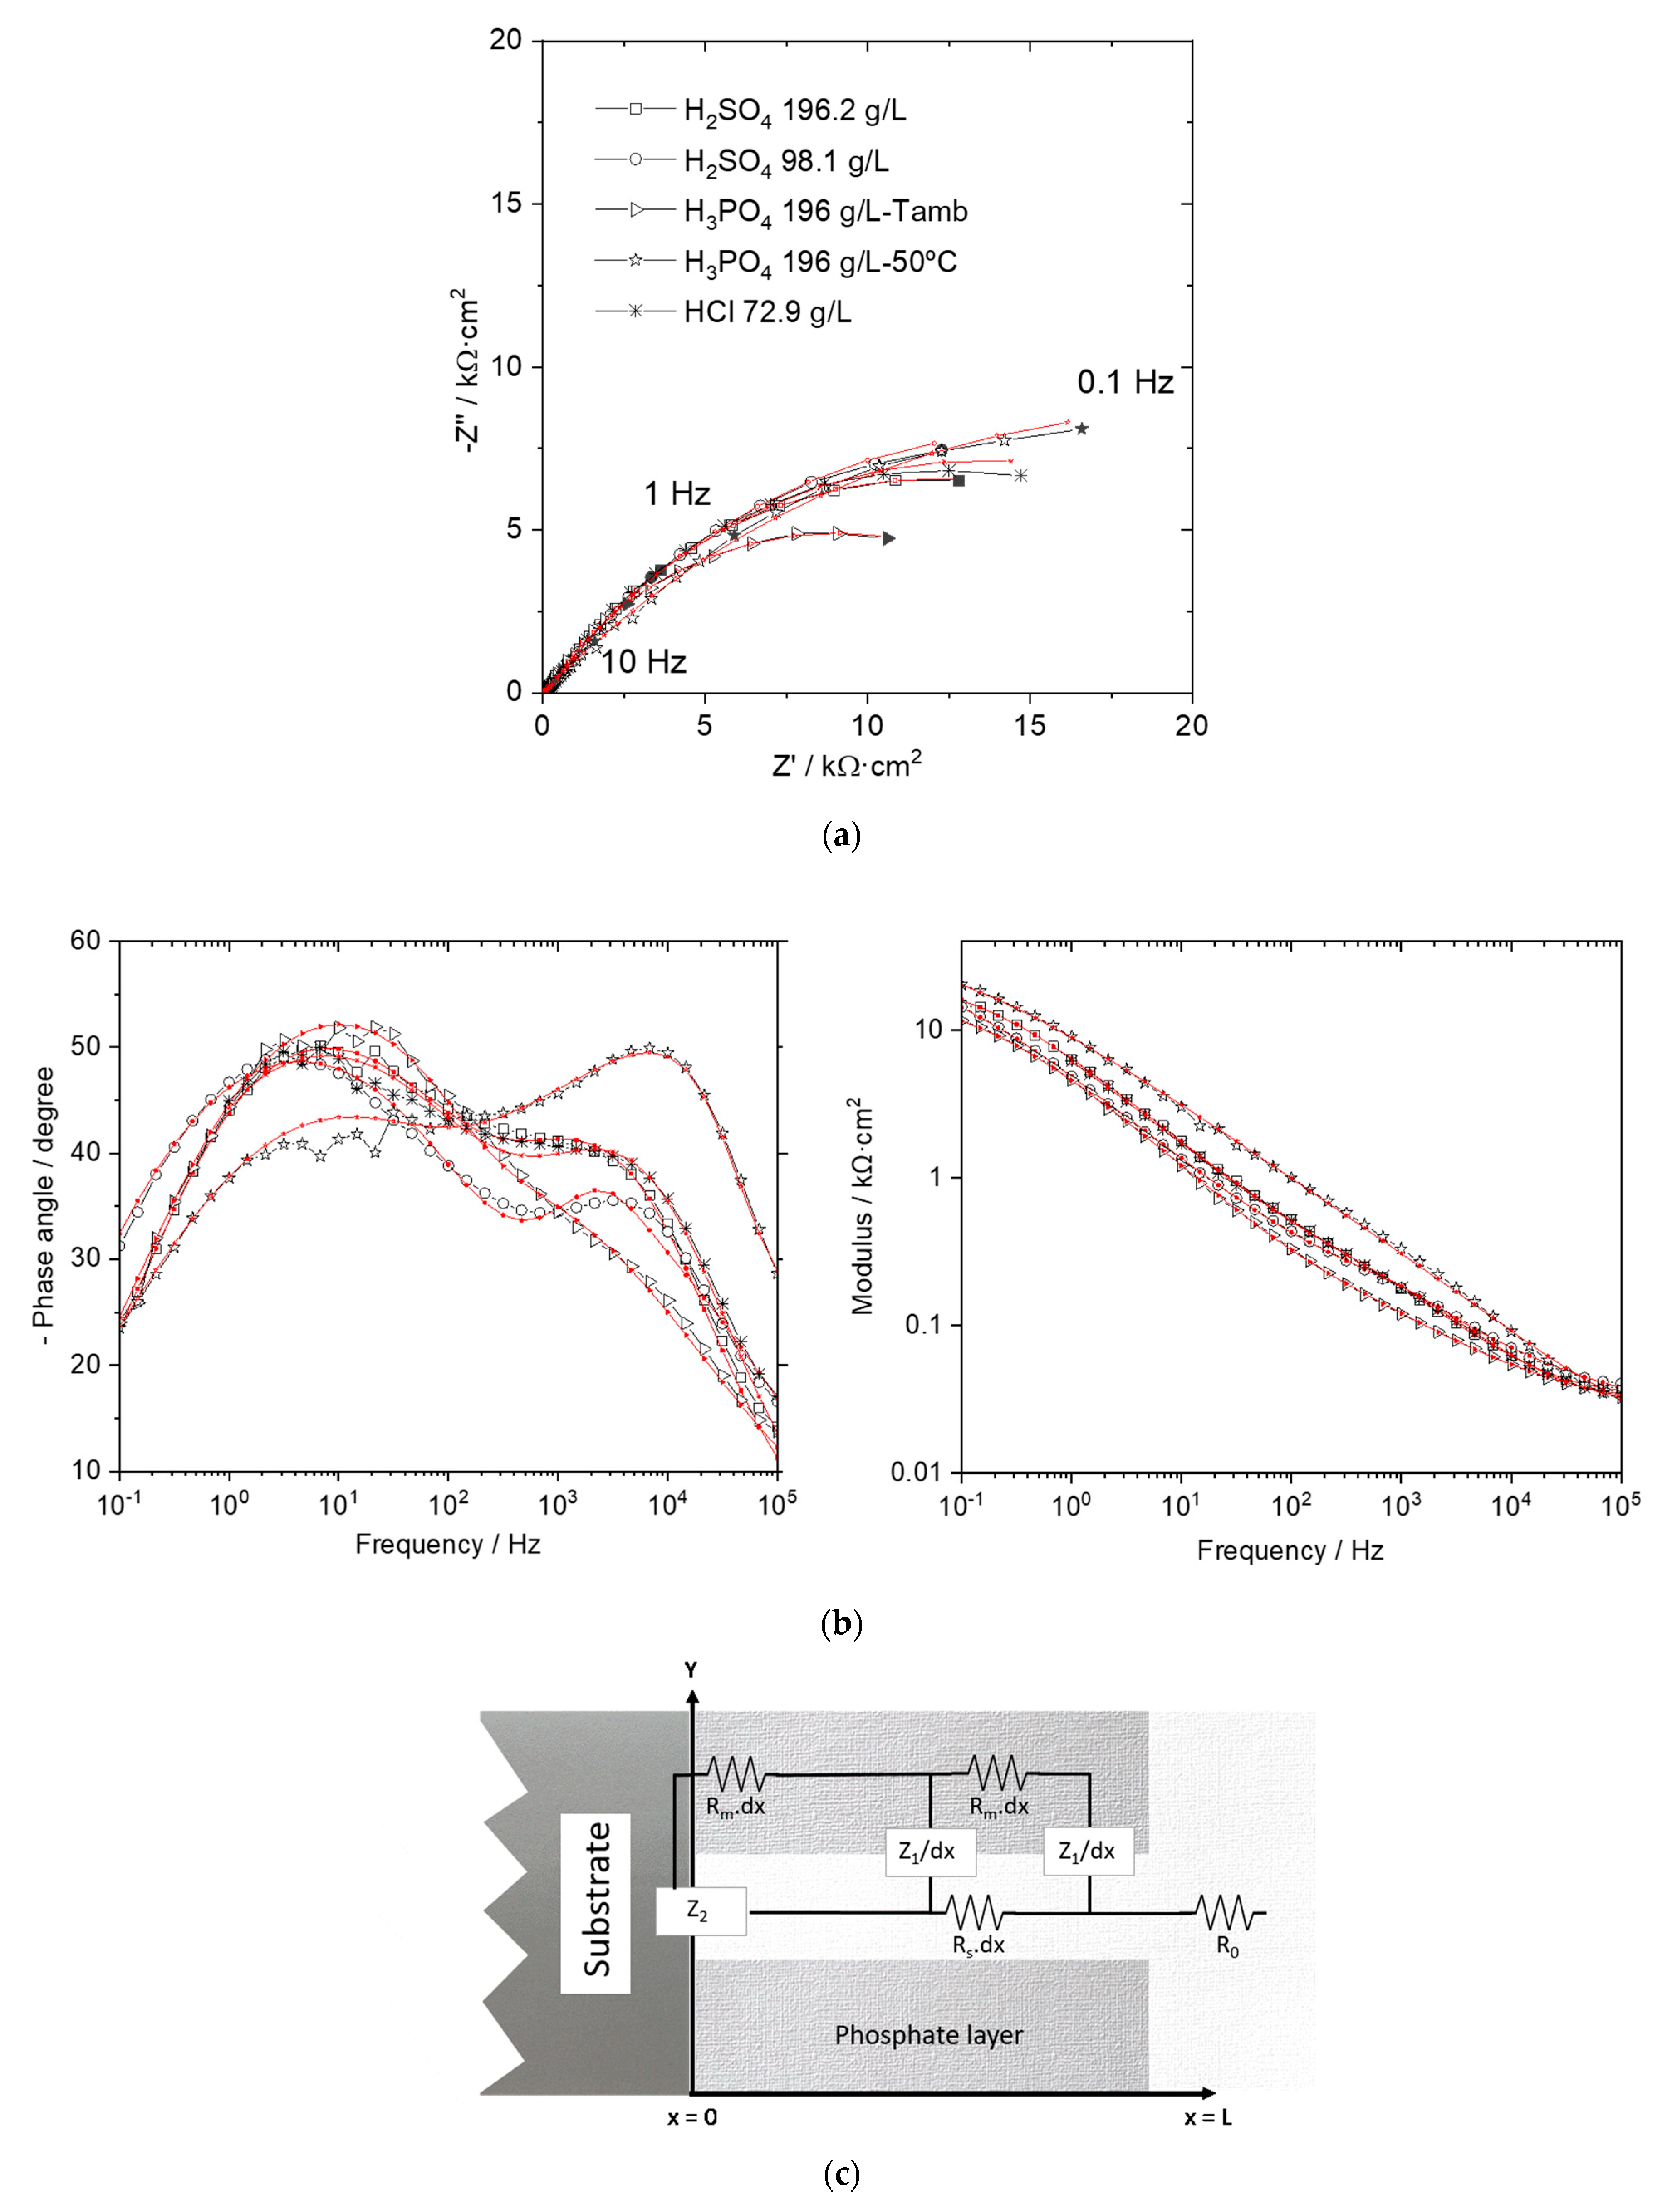
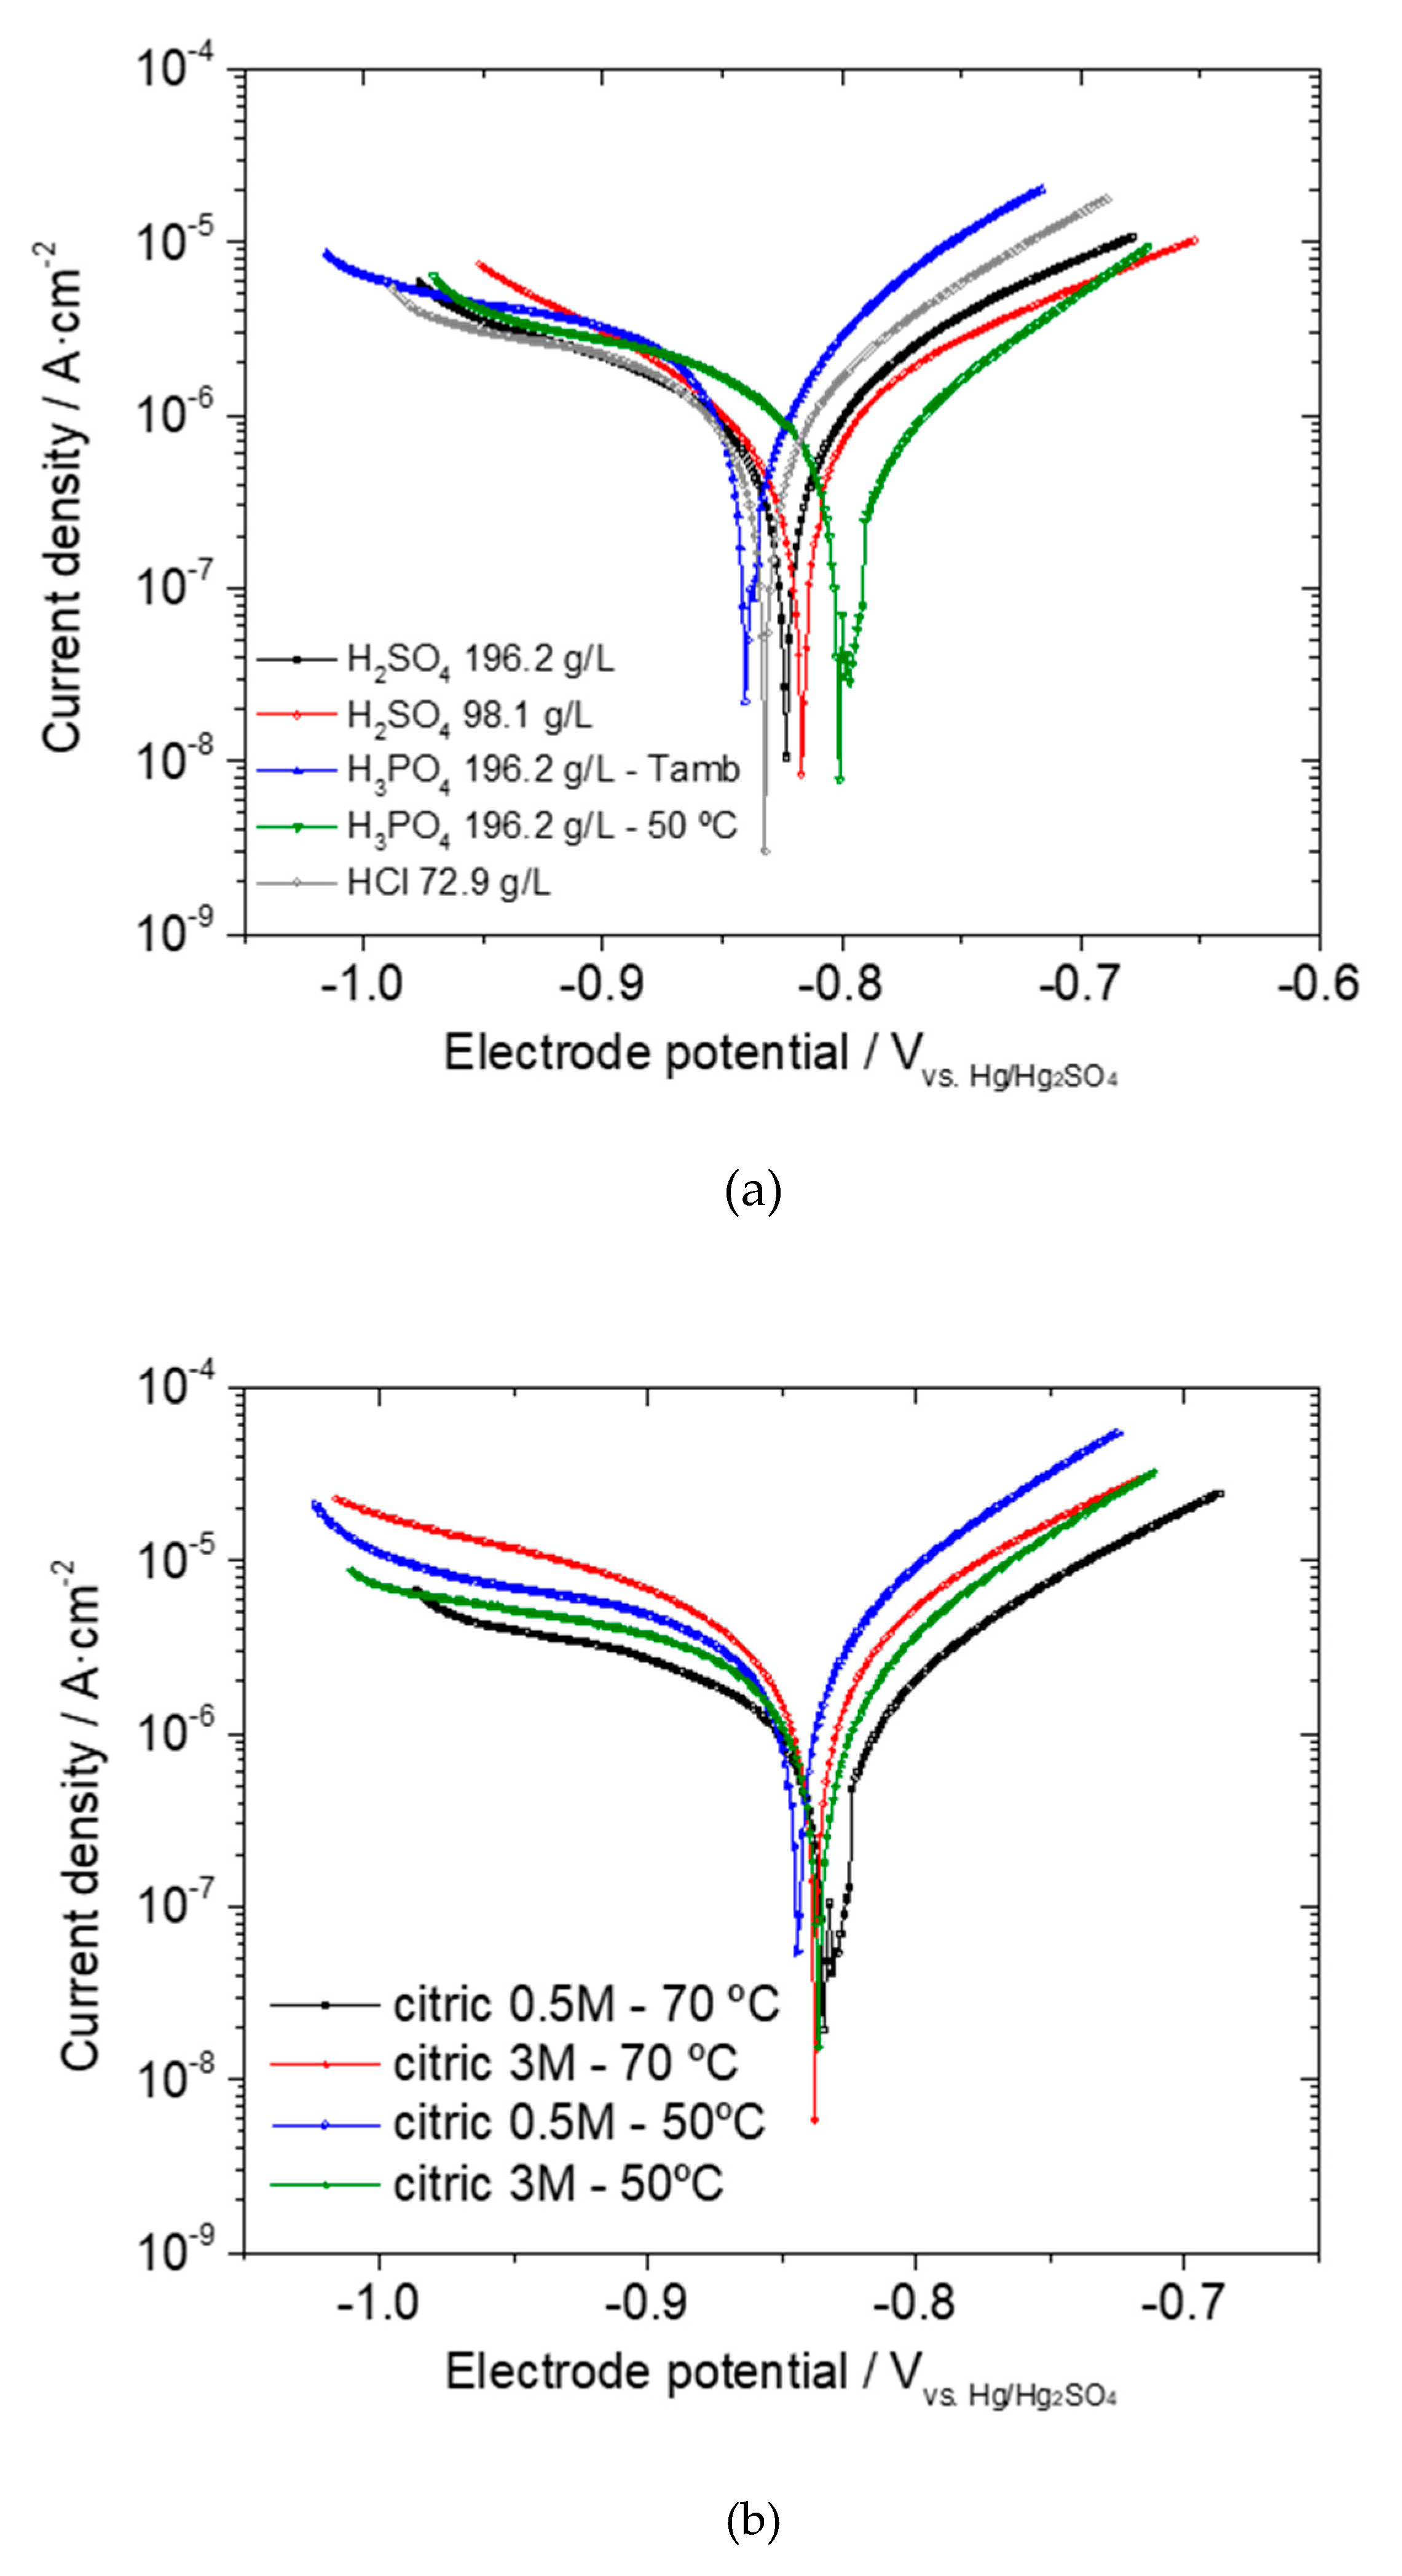
Electrochemical Response of the Phosphated Specimens
3.2. Phosphate Coating after Pickling with Citric Acid: Temperature and Concentration Assessment
Electrochemical Response of the Phosphated Specimens
4. Conclusions
Author Contributions
Funding
Data Availability Statement
Acknowledgments
Conflicts of Interest
References
- Rausch, W. The Phosphating of Metals; Finishing Publications Ltd.: Stevenage, UK, 1990; ISBN 0-904477-11-8. [Google Scholar]
- Panossian, Z. Phosphating of steel for cold forming processes. In Encyclopedia of Tribollogy; Wang, Q.J., Chung, Y.W., Eds.; Springer: Boston, MA, USA, 2013. [Google Scholar]
- Díaz, B.; Freire, L.; Mojío, M.; Nóvoa, X.R. Optimization of conversion coatings based on zinc phosphate on high strength steels, with enhanced barrier properties. J. Electroanal. Chem. 2015, 737, 174–183. [Google Scholar] [CrossRef]
- Narayanan, T.S.N.S. Surface pretreatment by phosphate conversion coatings—A review. Rev. Adv. Mater. Sci. 2005, 9, 130–177. [Google Scholar]
- Maanonen, M. Steel Pickling in Challenging Conditions. Master’s Thesis, Helsinki Metropolia University of Applied Sciences, Helsinki, Finland, 2014. [Google Scholar]
- Kelly, R. Principles of Fastener Pretreatment. Met. Finish. 1988, 86, 15–19. [Google Scholar]
- Hivart, P.; Bricout, J.P. Influence of cleaning pretreatments on tribological properties of zinc phosphated steels. Ind. Lubr. Tribol. 2003, 55, 90–96. [Google Scholar] [CrossRef]
- Rouzmeh, S.S.; Naderi, R.; Mahdavian, M. Steel surface treatment with three different acid solutions and its effect on the protective properties of the subsequent silane coating. Prog. Org. Coatings 2017, 112, 133–140. [Google Scholar] [CrossRef]
- Patil, S.J.; Pujari, R.B.; Hou, T.; Park, J.; Lee, D.W. Supercapacitive performance of vanadium sulfide deposited on stainless steel mesh: Effect of etching. Micro Nano Syst. Lett. 2020, 8, 1–7. [Google Scholar] [CrossRef]
- Bandi, P.; K, V.M.; Kausley, S.; Rai, B. Development of superhydrophobic and corrosion resistant coatings on mild steel—A greener approach. Mater. Today Commun. 2020, 25, 101625. [Google Scholar] [CrossRef]
- Taskin, N.U.; Ordu, F. Effect of etching duration on roughness and wettability of different carbon steel substrates. Mater. Chem. Phys. 2021, 257, 123746. [Google Scholar] [CrossRef]
- Pajonk, G.; Bubert, H. Influence of pickling high alloyed CrNi-steels and nickel base alloys with citric acid on the composition of their tarnish oxides. Mikrochim. Acta 2000, 133, 289–293. [Google Scholar] [CrossRef]
- Nelson, G.C. Laser scale pretreatment solutions. Ind. Paint Powder 2006, 82, 27–33. [Google Scholar]
- Losch, A.; Schultze, J.W. A new electrochemical method for the determination of the free surface of phosphate layers. Appl. Surf. Sci. 1991, 52, 29–38. [Google Scholar] [CrossRef]
- Losch, A.; Schultze, J.W. Impedance spectroscopy and other electrochemical in-situ investigations of the phosphating process. J. Electroanal. Chem. 1993, 359, 39–61. [Google Scholar] [CrossRef]
- Losch, A.; Klusmann, E.; Schultze, J.W. Electrochemical investigations of phosphate layers by metal deposition and cataphoretic painting. Electrochim. Acta 1994, 39, 1183–1187. [Google Scholar] [CrossRef]
- Ahn, S.H.; Choi, Y.S.; Kim, J.G.; Han, J.G. A study on corrosion resistance characteristics of PVD Cr-N coated steels by electrochemical method. Surf. Coatings Technol. 2002, 150, 319–326. [Google Scholar] [CrossRef]
- Simescu, F.; Idrissi, H. Effect of zinc phosphate chemical conversion coating on corrosion behaviour of mild steel in alkaline medium: Protection of rebars in reinforced concrete. Sci. Technol. Adv. Mater. 2008, 9. [Google Scholar] [CrossRef] [PubMed]
- Park, J.R.; Macdonald, D.D. Impedance studies of the growth of porous magnetite films on carbon steel in high temperature aqueous systems. Corros. Sci. 1983, 23, 295–315. [Google Scholar] [CrossRef]
- Guitián, B.; Lascaud, S.; Nóvoa, X.R.; Ribeaucourt, L.; Vidal, E. On the growth of nanostructured iron hydroxy-fluorides for Li-ion batteries. J. Power Sources 2013, 241, 567–571. [Google Scholar] [CrossRef]
- Zhu, C.; Weichert, K.; Maier, J. Electronic conductivity and defect chemistry of heterosite FePO4. Adv. Funct. Mater. 2011, 21, 1917–1921. [Google Scholar] [CrossRef]
- Shin, W.; Lee, J.; Kim, Y.; Steinfink, H.; Heller, A. Ionic conduction in Zn3(PO4)2· 4H2O enables efficient discharge of the zinc anode in serum. J. Am. Chem. Soc. 2005, 127, 14590–14591. [Google Scholar] [CrossRef] [PubMed]


| C (%) | Mn (%) | Si (%) | S (%) | P (%) | Cr (%) | Ni (%) | Mo (%) | Cu (%) | V (%) | N (%) |
|---|---|---|---|---|---|---|---|---|---|---|
| 0.815 | 0.783 | 0.160 | 0.003 | 0.007 | 0.150 | 0.070 | 0.013 | 0.116 | 0.004 | 0.007 |
| H3PO4 (85 wt.%) | ZnO | NaNO3 | NaNO2 |
|---|---|---|---|
| 8.6 mL | 1.3 g | 3 g | 0.1 g |
| H2SO4 196.2 g/L | H2SO4 98.1 g/L | HCl 72.9 g/L | H3PO4 196 g/L-Troom | H3PO4 196 g/L-50 °C | |
|---|---|---|---|---|---|
| Weight loss (%, after pickling) | 2.28 | 2.83 | 0.01 | 0.06 | 1.17 |
| Coating weight (g/m2, after phosphating) | 7.80 | 5.69 | 3.13 | 3.32 | 5.30 |
| H2SO4 196.2 g/L | H2SO4 98.1 g/L | HCl 72.9 g/L | H3PO4 196 g/L-Tamb | H3PO4 196 g/L-50 °C | |
|---|---|---|---|---|---|
| Zn | 26.1 | 25.2 | 23.8 | 28.7 | 24.7 |
| P | 24.7 | 24.7 | 20.2 | 24.1 | 27.5 |
| Fe | 49.1 | 50.1 | 56.0 | 47.2 | 47.8 |
| H2SO4 196.2 g/L | H2SO4 98.1 g/L | HCl 72.9 g/L | H3PO4 196 g/L-Tamb | H3PO4 196 g/L-50 °C | |
|---|---|---|---|---|---|
| icorr-phosphated (µA/cm2) | 1.00 | 1.29 | 1.15 | 1.77 | 0.88 |
| Porosity (%) | 5.01 | 6.40 | 5.73 | 8.8 | 4.39 |
| Rm (kΩ·cm) | Rs (kΩ·cm) | R1 (Ω·cm3) | C1 (mF·cm−3) | α1 | R2 (kΩ·cm2) | C2 (µF·cm−2) | α2 | |
|---|---|---|---|---|---|---|---|---|
| H2SO4-196.2 g/L | 2612.4 | 128.1 | 19.9 | 556.0 | 0.6 | 45.6 | 0.8 | 0.8 |
| H2SO4-98.1 g/L | 4111.9 | 122.1 | 23.1 | 505.9 | 0.6 | 31.2 | 2.1 | 0.8 |
| HCl-72.9 g/L | 9656.4 | 79.8 | 8 | 659.1 | 0.6 | 37.9 | 3.6 | 0.7 |
| H3PO4-196 g/L-Troom | 11.3 | 1331.2 | 15.1 | 23.4 | 1 | 22.0 | 68.3 | 0.6 |
| H3PO4-196 g/L-50 °C | 933.1 | 14.9 | 22.6 | 0.2 | 1 | 68.6 | 100.1 | 0.5 |
| 96.1 g/L | 576.4 g/L | |||
|---|---|---|---|---|
| 50 °C | 70 °C | 50 °C | 70 °C | |
| Weight loss (%, after pickling) | 0.12 | 0.87 | 0.09 | 0.46 |
| Coating weight (g/m2, after phosphating) | 3.71 | 5.23 | 3.53 | 6.64 |
| 96.1 g/L | 576.4 g/L | |||
|---|---|---|---|---|
| 50 °C | 70 °C | 50 °C | 70 °C | |
| Zn | 19.4 | 39.6 | 27.3 | 39.9 |
| P | 18.1 | 32.3 | 28.9 | 34.7 |
| Fe | 62.4 | 28.1 | 43.9 | 25.4 |
| 96.1 g/L | 576.4 g/L | |||
|---|---|---|---|---|
| 50 °C | 70 °C | 50 °C | 70 °C | |
| icorr-phosphated (µA/cm2) | 3.25 | 1.62 | 1.69 | 3.68 |
| Porosity (%) | 16.2 | 8.1 | 8.4 | 18.3 |
| Rm (kΩ·cm) | Rs (kΩ·cm) | R1 (Ω·cm3) | C1 (mF·cm−3) | α1 | R2 (kΩ·cm2) | C2 (µF·cm−2) | α2 | |
|---|---|---|---|---|---|---|---|---|
| 50 °C—96.1 g/L | 64.1 | 1234.2 | 0.5 | 25.4 | 0.9 | 13.2 | 36.9 | 0.6 |
| 70 °C—96.1 g/L | 39.7 | 846.1 | 22.2 | 4.6 | 1 | 29.7 | 104.1 | 0.6 |
| 50 °C—576.4 g/L | 217.8 | 1557.5 | 1.1 | 6.2 | 0.9 | 37.5 | 27.7 | 0.6 |
| 70 °C—576.4 g/L | 15.8 | 756.1 | 137.1 | 14.9 | 1 | 10.5 | 128.3 | 0.5 |
Publisher’s Note: MDPI stays neutral with regard to jurisdictional claims in published maps and institutional affiliations. |
© 2021 by the authors. Licensee MDPI, Basel, Switzerland. This article is an open access article distributed under the terms and conditions of the Creative Commons Attribution (CC BY) license (http://creativecommons.org/licenses/by/4.0/).
Share and Cite
Díaz, B.; Nóvoa, X.R.; Pérez, C.; Silva-Fernández, S. Characterization of Phosphate Coatings: Influence of the Acid Pickling Conditions. Materials 2021, 14, 1048. https://doi.org/10.3390/ma14041048
Díaz B, Nóvoa XR, Pérez C, Silva-Fernández S. Characterization of Phosphate Coatings: Influence of the Acid Pickling Conditions. Materials. 2021; 14(4):1048. https://doi.org/10.3390/ma14041048
Chicago/Turabian StyleDíaz, Belén, X. Ramón Nóvoa, Carmen Pérez, and Sheila Silva-Fernández. 2021. "Characterization of Phosphate Coatings: Influence of the Acid Pickling Conditions" Materials 14, no. 4: 1048. https://doi.org/10.3390/ma14041048
APA StyleDíaz, B., Nóvoa, X. R., Pérez, C., & Silva-Fernández, S. (2021). Characterization of Phosphate Coatings: Influence of the Acid Pickling Conditions. Materials, 14(4), 1048. https://doi.org/10.3390/ma14041048