Featured Application
Mathematical tool for tuning Selective Laser Melting process parameters for achieving highly dense components.
Abstract
In this work, dimensional analysis is used to develop a general mathematical model to predict bulk density of SLMed components taking volumetric energy density, scanning speed, powder’s thermal conductivity, specific heat capacity, and average grain diameter as independent variables. Strong relation between dependent and independent dimensionless products is observed. Inconel 718 samples were additively manufactured and a particular expression, in the form of a power-law polynomial, for its bulk density, in the working domain of the independent dimensionless product, was obtained. It is found that with longer laser exposure time, and lower scanning speed, better densification is attained. Likewise, volumetric energy density has a positive influence on bulk density. The negative effect of laser power in bulk density is attributed to improper process conditions leading to powder particle sublimation and ejection. A maximum error percentage between experimental and predicted bulk density of 3.7119% is achieved, which corroborates the accuracy of our proposed model. A general expression for determining the scanning speed, with respect to laser power, needed to achieve highly dense components, was derived. The model’s applicability was further validated considering SLMed samples produced by AlSi10Mg and Ti6Al4V alloys. This article elucidates how to tune relevant manufacturing parameters to produce highly dense SLM parts using mathematical expressions derived from Buckingham’s π- theorem.
1. Introduction
Selective Laser Melting
Additive manufacturing (AM) has gained interest in industrial spheres due to its benefits, reduction of waste materials, shortening of manufacturing times, high flexibility, production of complex geometry products, shortening of product development cycle, among others [1]. Wohlers Associates’ “Annual Worldwide Report on 3D Printing and Additive Manufacturing” states that the global revenue generated by AM production and associated services will reach $21 billion by 2020 [2].
Selective laser melting (SLM) is an AM powder bed fusion technology which involves heating, melting, and solidification of a metallic powder by a moving heat source, in the form of a laser, in a layer-by-layer manner [3]. Each scanning process produces a thin cross-sectional layer of the final product. The final component is, therefore, completed in an iterative process of depositing feedstock, laser scanning, melting the feedstock, and undergoing a solidification lapse [4]. Once the repetitive process is completed, loose powders are removed from the building chamber and the produced piece is separated from the substrate plate either manually or by electrical discharge machining, as required [5].
Through SLM, it is possible to produce metallic parts with intricate geometries with high three-dimensional accuracy [6]. The sectors where SLM has found its most significant contributions are in high value-added industries, such as aerospace, automotive, and medicine [5]. For instance, nickel-based super alloy abrasive turbine blade tips, which reduced gas leakage, and thus improved turbine efficiency, were produced [7]. Aluminum-based metal matrix composites that exploit the lightweight, high specific strength, and thermal conductivity of aluminum for aerospace and automotive applications were investigated by Dadbakhsh et al. [8]. A proposal for a potential porous implant or drug delivery system using NiTi (known for its high strength, high corrosion resistance, biocompatibility, and shape memory effect) with hydroxyapatite additions was given by Shishkovskii et al. [9].
Inconel 718 is chosen as the material of study for this research since it is of high relevance in the aerospace and biomedical industries. It is used to produce critical components in aircraft, gas turbines, turbocharger roots, nuclear reactors, liquid fueled rockets, and several corrosive and structural applications involving high operation temperatures [10]. Ni-Cr-based superalloy is chosen for its strength, creep resistance, good weldability, and fatigue life at temperatures up to 700 °C [11]. Aircraft engine components such as critical rotating parts, aerofoils, supporting structures, and pressure vessels (which represent approximately 30% of the aircraft’s total weight) have been produced with Inconel 718 [12]. In718 is a hard-cutting alloy with hardness (Brinell) HB values ranging from 240 to 410 kg/mm2, and thus, the SLM of this material represents a potentially relevant application for complex geometries working in highly abrasive conditions. Kapłonek et al. [13] performed studies on the grinding process of In718 rings with high-efficiency MoS2 treated grinding wheels with promising positive results.
SLM process parameters must be adjusted such that a single melt line can fuse completely with the neighboring melt trajectories and the preceding layer [5]. Spears et al. discuss additional details in [14]. There, the authors divide the process parameters in four categories: (1) laser and scanning parameters, (2) powder material properties, (3) powder bed properties and recoat parameters, and (4) build environment parameters. Of the fifty parameters listed, only twelve can be directly adjusted for the process [14]. Among these, it may be listed: laser power, spot size, scan velocity, spacing and strategy, deposition system, layer thickness, powder bed temperature, oxygen level, chamber pressure, temperature, and gas flow velocity.
Most publications on SLM focus on studying the influence that process parameters have on a vast variety of physical and structural properties of AM metallic samples. An overview of such studies is provided in Table 1. Post-processing is also relevant in SLM. Waqar et al. [15] found that microstructure and mechanical properties of SLMed SS316L components are influenced by different post-annealing conditions at which the cooling down takes place. Likewise, Gupta et al. [16] found that higher angle layer rotation leads to a reduction in grain size, residual stress, and surface roughness. Moreover, micro-hardness, tensile strength, elongation, and relative density were significantly enhanced. Khanna et al. [17] performed a study on Invar-36, a Ni-Fe-based alloy used in the aerospace industry and known for its low thermal expansion, of the effect of laser power, scan speed, layer thickness, and hatch spacing on the SLSed (Selective Laser Sintering) densification and surface roughness.

Table 1.
Experimental investigations on the effect of relevant process parameters in SLM.
In the SLM process, volumetric energy density is defined by the quotient of laser power supply and the product of scanning speed with hatch spacing, layer thickness, laser spot size, or average powder diameter. The effect of volumetric energy density (VED) on melt pool dimensions and geometry, densification, surface roughness, dimensional accuracy, microstructure, hardness, fatigue life and mechanical properties have been studied on a wide variety of materials. A brief overview of these performed studies is presented in Table 2. Even though VED has been thoroughly investigated, authors like Scipioni et al. [28] and Mishurova et al. [29] have suggested that VED is not able to fully describe the SLM physical process and therefore, one should use VED with caution as a design parameter.
Table 2.
Studies on the effect of volumetric energy density in SLM.
Besides the experimental design methodologies, computational algorithms are also used to study the SLM process [41]. Finite element method (FEM) models, in SLM, have been developed to study the deposition process, part distortion, and thermal gradients [42], heat distribution and residual stress [43], temperature profile and melting process [44], melt pool size [45], just to mention a few. Adaptive meshing has been used to determine thermal gradients near laser incidence points [46]. Moser et al. [47] presented a part scale continuum model predicting thermal stresses which incorporate thermal, laser, and mechanical properties for SS316L. Ahmadi et al. [48] developed a computational model which studied the response of the mechanical properties of SLMed SS316L to a series of process parameters. The multi-track, multi-layer, and multi-material SLM process was modeled by the discrete element method [49]. Numerical tools were developed for obtaining reliable processing windows [50] and studying the thermal behavior, and melt pool morphology in the multi-track multi-layer SLM of SS316L [51].
The application of dimensional analysis to selective laser melting has not been studied thoroughly in the research community. Van Elsen et al. presented a possible complete set of dimensionless parameters to describe the process, aiming at facilitating comparison between different research groups works [52]. Cardaropoli et al. used dimensional analysis intending to find out an appropriate definition of a set of non-dimensional groups in order to represent the output parameters for the process [53], proposing a set of 16 independent physical quantities and twelve π-products evaluated in Ti6Al4V. Most recently, Khan et al. [54] used dimensional analysis to model heat source in SLM as a function of laser parameters and properties of alloy powder in SS316L.
In this work, dimensional analysis is used to develop a general mathematical model to predict the bulk density of SLMed components, taking into account relevant process parameters and properties such as volumetric energy density, scanning speed, powder’s thermal conductivity, specific heat capacity, and average diameter. In comparison with previous studies, the reduced number of elements of this independent set allows the full evaluation of the physical model through experimentation. Moreover, high precision for the prediction of bulk density is attained, proving that in fact, dimensional analysis has succeeded at describing the behavior of the densification of SLMed components, and that the chosen set is adequate. Moreover, this proposed model is able to identify a mathematical expression for determining the scanning speed value needed to achieve high part densification, with respect to the laser power supply, and vice versa. This expression is of high practical relevance since it allows the user to tune manufacturing parameters to obtain highly dense SLMed metallic components, leading to a potential significant reduction on material waste and costs associated to experimentation.
Validation of the developed model is primarily addressed by using information from produced Inconel 718 SLMed samples in which bulk density was predicted using, for instance, the laser scanning speed. The validity of the mathematical formulation through different materials is confirmed with adapted experimental data collected from AlSi10Mg and Ti6Al4V.
The purpose of this work is to obtain a general mathematical expression which is able to predict the bulk density of a metallic component manufactured through selective laser melting, as well as to develop a mathematical tool for properly defining the needed scanning speed, with respect to laser power, to attain highly dense pieces.
2. Materials and methods
2.1. Modelling AM by Dimensional Analysis
2.1.1. Introduction to Dimensional Analysis
Before we start with the derivation of a mathematical model based on Buckingham’s π-theorem to find the relation between process parameters and physical phenomena, we briefly review some definitions and basic foundations of dimensional analysis.
The basis of dimensional analysis is that a physical phenomenon can be described by the following relationship [55]:
where represents a property in the general thermodynamic sense or a physical quantity. Assuming an interest in some dependent particular physical quantity Q0, we have that [55]:
As a whole, is a complete set of independent physical quantities. Defining these factors is the first and most important step in dimensional analysis. Then, a complete, dimensionally independent, subset is chosen from the complete independent set . The dimensions of the dependent and remaining independent physical quantities are expressed as a power law of the dimensions of the dimensionally independent subset. Dimensionless products are constructed from these equidimensional products.
Buckingham-π theorem of dimensional analysis transforms Equation (1) into [55]:
where each is a dimensionless product [56]. Buckingham’s π-theorem (Theorem 1) states that the physical phenomena will be now described by number of dimensionless products.
Theorem 1.
Buckingham’s π-theorem states that:
When a complete relationship between dimensional physical quantities is expressed in dimensionless form, the number of independent quantities that appear in it is reduced from the original n to n − k, where k is the maximum number of the original n that are dimensionally independent.
In the dimensionless causal form of dimensional analysis [57]:
The dependent dimensionless product π0 will be a function of the set of independent dimensionless products . The particular form of the function in dimensionless causal relationship is not provided by Buckingham’s π-theorem and should be determined experimentally [58]. The independent dimensionless product is divided in proper domains and a power law form is adopted to fit the results, as the following [57]:
where C is a proportionality constant, and are real numbers. Both are defined for the working domain of independent dimensionless products.
2.1.2. Selective Laser Melting Dimensional Analysis
The independent variables that have the most influence on the final density of parts produced via SLM, and thus are chosen as independent physical quantities for the dimensional analysis developed in this work, are volumetric energy density (), average particle diameter (), scanning speed (), specific heat capacity (), and heat conductivity (). VED represents the energy input for ensuring proper melt of the powder. If scanning speed is improperly high, adequate densification will not be achieved as proper melt may not occur. Furthermore, if scanning speed is too low, powder particles will be ejected from the powder bed. Heat conductivity is of the upmost importance as heat conduction is one of the governing phenomenon in selective laser melting. Specific heat capacity is highly relevant since it is related to the required energy to raise the material’s temperature.
In this work, VED (γ) is defined as:
where P is the laser power (W), v is the scanning speed (m/s), h is the hatch spacing (m), and t is the layer thickness (m). Definition of fundamental dimensions along with symbol, units, and dimensions of factors are summarized in Table 3 and Table 4, respectively.
Table 3.
Symbol and unit of the fundamental dimensions involved in the dimensional analysis.
Table 4.
Units, symbol, and dimensions of the physical quantities involved in the dimensional analysis of selective laser melting.
Volumetric energy density, scanning speed, average particle diameter, and specific heat capacity are chosen as the dimensionally independent subset. The equidimensional products of heat conductivity and density are defined in Equations (7) and (8): is introduced:
Afterwards, the dependent and independent dimensionless products, presented in Equations (9) and (10), respectively, are set using the quotient of the remaining dependent and independent variables with their respective equidimensional product:
Using Buckingham’s π-theorem, the following expression for determining the bulk density of metallic pieces produced by selective laser melting is obtained:
where α and C are found by fitting experimental data. We shall discuss this process in the next section.
2.2. Experiments
Truform In718 powder was acquired from Praxair (Truform 718 metal powder, Monterrey, Mexico). The overall chemical composition provided by the supplier is summarized in Table 5. The alloy is estimated to possess a hardness (Brinell, HB) value ranging from 240–410 kg/mm2. Figure 1 shows scanning electron microscopy (SEM) images of the powder as received. The average powder diameter is determined to be of 26.56 µm. Figure 1b illustrates the powder size distribution. Notice from Figure 1a that the powder morphology is of spherical-like shape. However, it is not uniform among the powder particles. Next, the Inconel 718 density, taken from Aerospace Specification of Metals, was fixed to the value of 8190 kg/m3. Specific heat capacity and thermal conductivity were estimated to have the values of 435 W/M·°K and 11.4 J/kg·°K, respectively.
Table 5.
Truform Inconel 718 metal powder chemical composition.
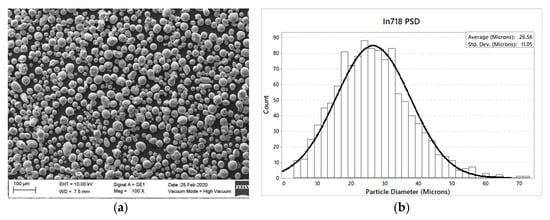
Figure 1.
Praxair’s TruForm In718 powder’s (a) scanning electron microscopy image and (b) particle size distribution.
In718 cubes (10 mm × 10 mm × 10 mm) were manufactured using Renishaw AM400 system (Wharton, UK) equipped with a 400 W, pulsed wave, Nd:YAG fiber laser (wavelength of 1080 nm and laser focus diameter of 70 µm). Figure 2 depicts the experimental set-up, along with its main elements, where the selective laser melting of the probes was carried out. It is first ensured that the building chamber is in an inert atmosphere, achieving so, by flooding it with argon gas. A homogeneous layer of metallic powder (Inconel 718) is first spread, by the recoater (Reduced Build Volume equipment, Renishaw, Wharton, UK), on the build plate. The excess powder is dragged by the recoater to the overflow, where it is stored for further potential reuse. A laser beam, as heat source, selectively scans the build plate, melting a cross section of the final product. After solidification, the build plate lowers, the recoater returns to its initial position, and the powder feed container rises. The process is repeated until the final piece is constructed.
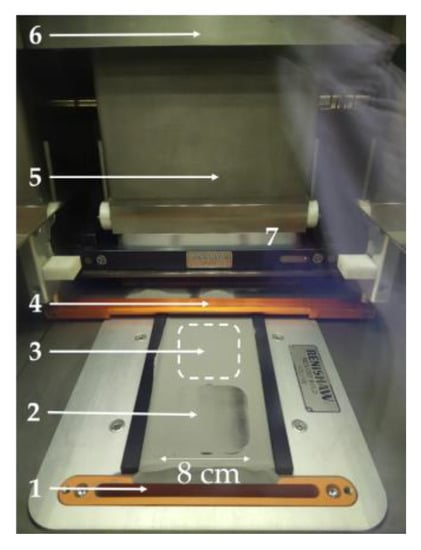
Figure 2.
Experimental set-up for the selective laser melting of In718 cubes. The main elements of the experimental set-up are marked: (1) overflow, (2) build plate, (3) powder feed container, (4) recoater, (5) inert atmosphere; argon, (6) laser and optics system; Nd: YAG fiber laser, and (7) building chamber.
Layer thickness (t), hatch spacing (h), and point distance (pd) were set to 60, 70, and 70 µm, respectively. Laser power (P) and exposure time (ton) were varied from 360 to 400 W and 35 to 40 µs, respectively. Scanning speed (v) was approximated, referring to the work of Tiwari et al. [14], as the quotient between point distance and exposure time for compatibility with a continuous wave laser. A summary of the parameters used, along with VED (γ), are listed in Table 6. In total, 27 probes were manufactured: 3 probes per experimental condition. The results presented are the mean average values recorded from 3 specimens of the same batch. After fabrication, bulk density of the built specimens was measured with Mettler Toledo XPR Analytical Balance (Zurich, Switzerland) equipped with its density measuring kit through buoyancy method.
Table 6.
Fabrication parameter values.
3. Results and Discussion
Manufactured samples, in the building chamber and in the build plate of a different set of experimental probes, are shown in Figure 3a,b, respectively. After fabrication, the samples were manually removed from the build plate.
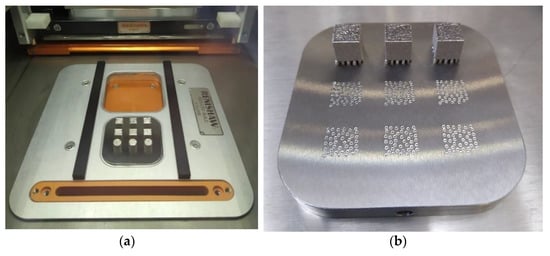
Figure 3.
SLMed Inconel 718 cubes in (a) the build chamber after construction and (b) build plate on the fabrication of another set of experimental probes. Good surface finish is observed.
Bulk density experimental measurements of the fabricated specimens are listed in Table 7 along with the relative density values measured. The maximum relative density value of 96.082% in specimen ID 33 was obtained under the following machine process parameters: laser power of 400 W, 40 µs of exposure time (scanning speed of 1.75 m/s), and a volumetric energy density of 54.42 × 10⁹ J/m3. The specimen with lowest relative density (94.274%) was produced considering the following process parameter values: laser power of 400 W, 35 µs of exposure time (a scanning speed of 2 m/s), with a volumetric energy density of 47.62 × 10⁹ J/m3. In average, a densification of 95.218% was experimentally measured.
Table 7.
Bulk and relative density of the fabricated specimens.
Figure 4 shows a graph of the resulting bulk density (ρ) with respect to exposure time (ton) and volumetric energy density (γ). It is observed, in overall, that with higher exposure time values, better densification is achieved. If the laser remains in contact with the metallic material for longer periods, it is easier for the heat addition to be sufficient to properly melt the powder. In general, higher bulk density values in SLM are obtained at higher conditions of volumetric energy density. The VED concept provides information of the energetic input needed to ensure full melt of the metallic powder, while avoiding the sublimation and ejection of powder particles.
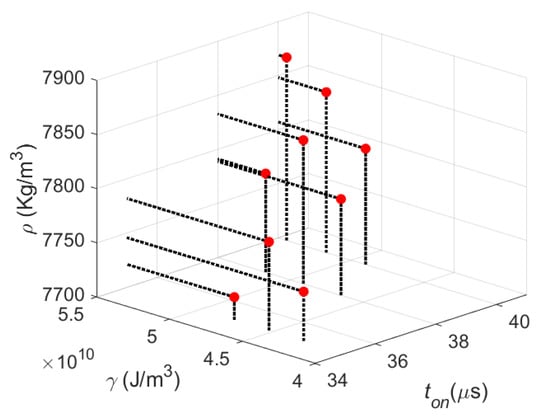
Figure 4.
Graph of the resulting bulk density (ρ) with respect to exposure time (ton) and volumetric energy density (γ). In general, it is observed that higher bulk density values are attained at higher exposure time and volumetric energy density conditions. Please notice that the volumetric energy density (γ) values, in J/m3, are in the ×1010 range.
As previously stated, scanning speed (v) is defined as the quotient between point distance (pd) and exposure time (ton). The following, Equation (12):
is obtained when substituting this definition into Equation (11). Equation (12) is useful for visualizing the effect of exposure time and point distance in the bulk density of components produced by selective laser melting. Equation (12) differs from Equation (11) in that, the latter one is more adequate for SLM where a continuous wave laser is used. On the other hand, Equation (12) is compatible with a pulsed wave laser SLM machine. From Equation (12), it may be concluded that exposure time, as well as volumetric energy density, will have a positive influence on bulk density, as observed simultaneously in Figure 4. This conclusion is equivalent to arguing that working at lower scanning speed conditions will produce components of higher density. The only difference is that scanning speed is used for a continuous wave laser, and the conjunction of point distance and exposure time is used for pulsed wave lasers.
Substituting the values of γ, ρ, and v listed in Table 6 and Table 7 and the material thermal conductivity value of κ = 11.4 J/kg·°K, and its specific heat capacity Cp = 435 W/m·°K, alongside with the measured average particle diameter ϕ = 26.56 μm into Equations (9) and (10), yields the experimental points shown in Figure 5. Then, the experimental data were fitted following the classical nonlinear least square method from which the values C = 4910.4 and α = 1.34 were found for the working independent dimensionless range of π1 between 3.17 × 10⁻⁸ to 4.6 × 10⁻⁸. Thus, the SLMed In718 samples’ bulk density can be predicted using the following equation:
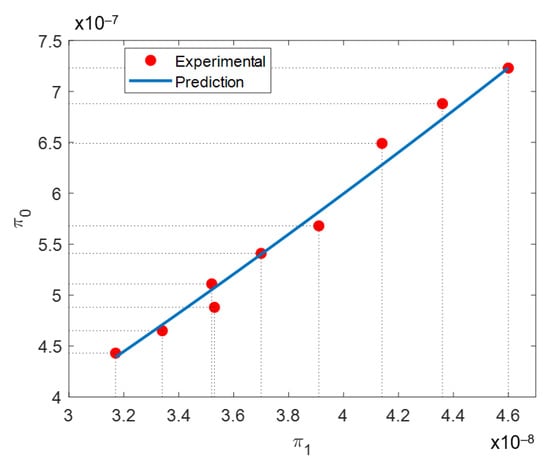
Figure 5.
Experimental plot of π0 (dependent) vs. π1 (independent) dimensionless numbers. The correlation between π0 and π1 is an indication that dimensional analysis has succeeded in describing the physics of the SLM process [57].
Equations (9) and (10) can be reduced to the simple dimensionless relationship:
From Equation (13), it is observed that dimensional analysis has provided an insight on the attained bulk density for the SLM process. In this case, the bulk density is positively affected by VED and inversely by scanning velocity. The independent dimensionless product π1 is found to influence bulk density with a power of 1.34. Based on these results, it is now evident from Equation (13) how the bulk density varies as a function of the velocity, heat conductivity, VED, specific heat capacity, and powder particle diameter. It is important to highlight that dimensional analysis states that it must be considered that the dimensionless form of bulk density, in Equation (9), is affected by π1 as a whole and not by its individual elements alone [57].
Following Buckingham’s π-theorem, the process initially described by six factors is now described by two i.e., a dependent (π0) and an independent (π1) dimensionless product. Dimensionless density product π0 incorporates density, scanning speed, and VED. The two latter are closely related to the energy input received by the powder bed. Independent dimensionless product π1 includes energetic input factors such as scanning speed and VED, powder thermal properties such as thermal conductivity and specific heat capacity, and metallic powder particle average diameter value.
A curve of the dependent π0 and independent π1 dimensionless products along with the prediction provided by Equation (14) is illustrated in Figure 5. From Figure 5, a strong correlation between π0 and π1 is observed. This is a proof that dimensional analysis has succeeded in describing the physic of the SLM process with dimensionless products. Equation (9) depicts the expression for the dependent dimensionless product, π0. The value it attains will be a function of resulting bulk density, the laser scanning speed, and the volumetric energy density conditions. Greater values of bulk density and laser scanning speed will produce a larger π0 value. Volumetric energy density has the opposite effect. For π1, presented in Equation (10), thermal conductivity (κ), specific heat capacity (Cp), and average grain diameter (ϕ), remain unchanged in all experimental points. Then, the only parameters affecting π1 are laser scanning speed and volumetric energy density. Again, greater laser scanning speed will produce greater π1 values, while the opposite will happen with greater volumetric energy density. Laser scanning speed will affect both dependent and independent dimensionless products. However, it will have a greater influence on π0 than in π1.
Figure 6 presents a SEM image of the top surface of the In718 manufactured probe with ID 33, for which experimental conditions are described in Table 6. Evaluating Equation (13) with the manufacturing process parameters and physical properties, the developed mathematical model yields that the resulting bulk density will be of ρ = 7811.9724 kg/m3. Nevertheless, as shown in Table 7, the real value of bulk density is 7869.09 kg/m3. An error percentage between experimentally measured bulk density and the prediction provided by the developed mathematical model is of 0.7259%.
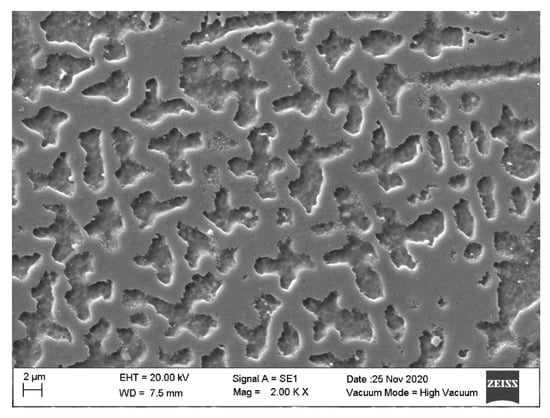
Figure 6.
SEM image of the top surface of the In718 manufactured probe with ID 33.
Experimental bulk density and dependent dimensionless product, along with theoretical prediction obtained from Equation (13), and the corresponding error percentages are listed in Table 8. Here, an average percentage error of 1.6503% is attained. The biggest errors of 3.7119% and 3.0542% were observed in specimens 13 and 31. However, high precision was achieved with a maximum error values of 0.1611% and 0.1617% in specimens 22 and 11, respectively. Therefore, it is concluded that the expressions derived from dimensional analysis fit experimental data well.
Table 8.
Comparison between experimental and predicted values for ρ and π0. Notice that the maximum error attained does not exceed 3.71%, which is an indication of the accuracy of the proposed dimensionless model.
A surface plot of bulk density with respect to laser power and scanning velocity is shown in Figure 7, where it is evident that bulk density increases with lower scanning speed and tends to decrease with increasing laser power. Higher scanning speed implies less exposure time of the laser to the powder bed which is related to energy input and sample densification. High laser power values may be related to powder particle sublimation and ejection affecting densification [52]. It is important to point out that the specific values of C and α are only valid in the range interval values of π1 from 3.17 × 10⁻⁸ to 4.6 × 10⁻⁸, determined according to the manufacturing parameter values used during the fabrication of the metallic samples.
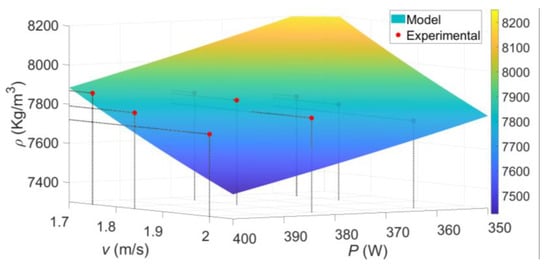
Figure 7.
Experimental and predicted samples’ density graph as a function of laser power and scan velocity. It is observed that the best densification conditions are obtained at lower scanning speeds and small laser power. Low scanning speed implies larger exposure time of the laser in the powder bed which increases sample densification. When the laser power supply is improperly set, it creates undesirable effects such as particle sublimation or ejection, which leads to metallic samples with higher porosity.
An equation to estimate scanning speed with respect to laser power supply to obtain the desire sample densification is obtained by substituting Equation (6) into Equation (13), and using theoretical density value (ρTH) instead of bulk density:
Equation (15) is valid for any independent dimensionless product range value of π1 because of the dimensional analysis. Thus, solving Equation (15) for P, yields:
In this case, Equation (16) can be used to predict the laser power supply as a function of the scanning speed needed to achieve high densification on the AM metallic sample, as shown in Figure 7 for Inconel 718. Specific recommendations for the definition of laser scanning velocity, with respect to laser power, to SLM In718 pieces may be drawn from Figure 8. For example, with the specific conditions described in the experimental set up of this work, if a laser power of P = 390 W is defined, a laser scanning velocity of v = 1.55 m/s is needed to achieve highly dense components. Likewise, if a laser scanning velocity of v = 1.7 m/s is defined, an approximate laser power value of P ≈ 357 W will do so too.
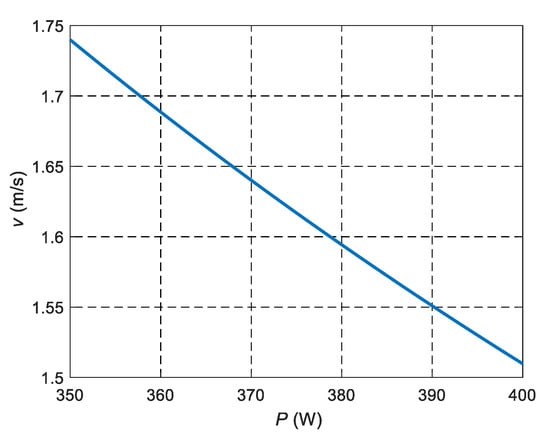
Figure 8.
Scanning speed with respect to laser power supply needed to achieve high densification of SLMed Inconel 718 samples. This plot is useful for tuning scanning velocity with respect to laser power supply for the SLM of Inconel 718 in an independent dimensionless product range π1 from 3.17 × 10⁻⁸ to 4.6 × 10⁻⁸.
To further validate our proposed model, let us consider experimental data collected by Kempen et al. [59] during the AM of metallic samples made from AlSi10Mg alloy, of chemical composition provided in Table 9. For this material, the following parameter values were assumed: κ = 110 W/m·°K, Cp = 910 J/kg·°K, ρTH = 2680 kg/m3, with particle average diameter value of 16.3 μm. Manufacturing parameters used in the calculation of the dimensionless products are listed in Table 10. Therefore, Equation (16) can be used to determine the laser power supply needed to manufacture highly dense AlSi10Mg metallic samples as a function of the scanning speed.
Table 9.
Chemical composition of AlSi10Mg powder used in [59].
Table 10.
Parameter values used to AM AlSi10Mg alloy samples. Experimental data taken from [59].
The values of C = 278.4 and α = 1.416 with an RMSE of 3.7023 × 10⁻⁹ were calculated by fitting experimental data using a nonlinear least square method. Figure 9 shows the curve obtained using the dependent and independent dimensionless products. Notice that the proposed dimensionless mathematical model captures well the SLM process of AlSi10Mg alloy samples, too.
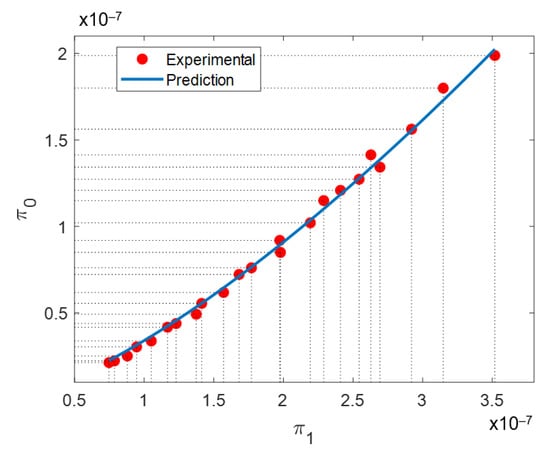
Figure 9.
Plot of π0 vs. π1 using experimental data collected by Kempen et al. in [59] during the fabrication of metallic samples made from AlSi10Mg alloy.
Similar conclusions can be drawn for Ti6Al4V samples produced with the SLM process, as shown in Figure 10. In this case, the material parameter values are: κ = 6.4 W/m °K, Cp = 546 J/kg °K, ρTH = 4220 kg/m3, with ϕ = 30 μm [60]. The chemical composition of Ti6Al4V powder, reported by the provider in [61], used by Dilip et al. is presented in Table 11. It is easy to show that the values of C and α are, using the parameter values listed in Table 12, 4612 and 1.335, respectively, with a RMSE value of 2.0842 × 10⁻⁹.
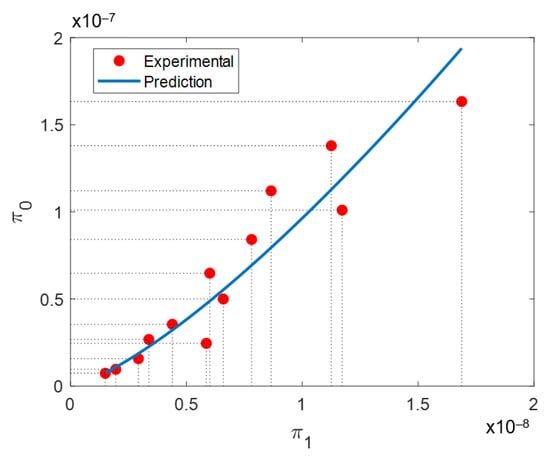
Figure 10.
Plot of π0 (dependent) vs. π1 (independent) dimensionless numbers calculated using experimental data collected during the fabrication of Ti6Al4V metallic via SLM [60].
Table 11.
Chemical composition, reported by the supplier [61], of Ti6Al4V powder used in [60].
Table 12.
Parameter values used to AM Ti6Al4V alloy samples. Experimental data taken from [60].
4. Conclusions
In this article, a general expression for determining the scanning speed needed to achieve the part’s high densification as a function laser power supply was derived using Buckingham’s π-theorem dimensional analysis. The derived expression allows to identify how powder material properties and SLM process parameters are connected via the interaction between the dimensionless groups π0 and π1.
The accuracy of the derived expression that relates π0 and π1 is assessed considering additive manufactured In718 samples. Collected experimental data were used to plot π0 vs. π1 finding a correlation between them, which is an indication of the validity of Equation (13). In fact, the error percentage value attained between experimental data and predicted bulk density values does not exceed 3.71%.
The effect of relevant manufacturing parameters in SLM was assessed. It was found that greater exposure time, of the laser beam on the powder bed (or lower laser scanning speed), leads to better densification. It was also shown that volumetric energy density has an overall positive influence on bulk density. The negative effect of laser power in bulk density is attributed to improperly high energetic conditions which cause the sublimation and ejection of powder particles for the specific experimental manufacturing parameters framework.
Moreover, using the expression that defines the volumetric energy density and the expressions that define π0 and π1, we were able to find a relationship between the scanning speed and the laser power supply. This expression sheds a new light on how AM process parameters and powder material properties are connected, since the applicability of the derived expression through dimensionless analysis could help the user in tuning machine process parameters in such a way that the end part could attain the desirable bulk density.
Finally, the developed mathematical model based on Buckingham-π theorem is able to properly predict collected data obtained during the additive manufacturing via SLM of In718, AlSi10Mg, and Ti6Al4V metallic samples. Therefore, this paper provides evidence of the applicability of the proposed dimensionless model for AM metallic parts produced by SLM in industrial sectors such as aerospace, medical devices, industrial design, and automotive, to name a few.
In comparison with previous attempts of applying dimensional analysis to describe the physical process of selective laser melting, this work has developed expressions of high applicability and practical relevance. The chosen set of independent physical quantities is significantly smaller than the previously proposed ones. This has allowed the full evaluation of the physical model with an experimental stage. Highly precise predictions on the bulk density of SLMed components, with respect to relevant process parameters and powder properties, have been able to be drawn from the developed mathematical expressions. Moreover, it is now possible to identify the scanning speed value needed to achieve high part densification, with respect to the laser power supply, leading to a potential significant reduction on material waste and costs associated to experimentation.
Author Contributions
Conceptualization, J.A.E.-D., A.E.-Z., and O.M.-R.; methodology, J.A.E.-D., A.E.-Z., and J.R.-S.; software, J.A.E.-D., A.E.-Z., O.M.-R., and D.O.-T.; validation, J.A.E.-D., A.E.-Z., O.M.-R., J.R.-S., and D.O.-T.; formal analysis, J.A.E.-D., A.E.-Z., and J.R.-S.; investigation, J.A.E.-D., A.E.-Z., O.M.-R., J.R.-S., and D.O.-T.; resources, A.E.-Z. and O.M.-R.; writing—original draft preparation, J.A.E.-D., A.E.-Z., O.M.-R., J.R.-S., and D.O.-T.; writing—review and editing, J.A.E.-D. and A.E.-Z.; visualization, J.A.E.-D., A.E.-Z., O.M.-R., and D.O.-T.; supervision, J.A.E.-D., A.E.-Z., and O.M.-R.; project administration, A.E.-Z., and O.M.-R.; funding acquisition, A.E.-Z., and O.M.-R. All authors have read and agreed to the published version of the manuscript.
Funding
This research was funded by Consejo Nacional de Ciencia y Tecnología de México (CONACYT), through project numbers 242269, 255837, 296176, National Lab in Additive Manufacturing, 3D Digitizing and Computed Tomography (MADiT) LN299129 and FORDECYT-296176.
Institutional Review Board Statement
Not applicable.
Informed Consent Statement
Not applicable.
Data Availability Statement
Data available on request due to restrictions eg privacy. The data presented in this study are available on request from the corresponding author.
Acknowledgments
The authors would like to thank financial support from Tecnológico de Monterrey-Campus Monterrey, through the Research Group in Nanotechnology and Devices Design.
Conflicts of Interest
The authors declare no conflict of interest.
Nomenclature
| Acronyms/Variables | Definition |
| SLM | Selective Laser Melting |
| SLS | Selective Laser Sintering |
| AM | Additive Manufacture |
| 3D | Three-dimensional |
| SEM | Scanning Electron Microscopy |
| FEM | Finite Element Method |
| RMSE | Root Mean Square Error |
| PSD | Particle Size Distribution |
| γ/VED | Volumetric energy density, J/m3 |
| v | Scanning speed, m/s |
| P | Laser power, W |
| κ | Heat conductivity, J/m·°K |
| Cp | Specific heat capacity, J/kg·°K |
| ϕ | Average powder diameter, m |
| ρ | Bulk density, kg/m3 |
| ρTH | Theoretical density, kg/m3 |
| ton | Exposure time, s |
| h | Hatch spacing, m |
| t | Layer thickness, m |
| pd | Point distance, m |
| π0 | Dependent dimensionless product |
| π1 | Independent dimensionless product |
| C | Proportionality constant |
| α | Fitting exponent |
References
- Yakout, M.; Elbestawi, M.A.; Veldhuis, S. A review of metal additive manufacturing technologies. Solid State Phenom. 2018, 278, 1–14. [Google Scholar] [CrossRef]
- Wohlers, T. Additive Manufacturing and 3D Printing, State of the Industry; Annual Worldwide Progress Report; Wohlers Associations: Fort Collins, CO, USA, 2012. [Google Scholar]
- Mukherjee, T.; Zhang, W.; Debroy, T. An improved prediction of residual stresses and distortion in additive manufacturing. Comput. Mater. Sci. 2017, 126, 360–372. [Google Scholar] [CrossRef]
- Ebrahimi, A.; Mohammadi, M. Numerical tools to investigate mechanical and fatigue properties of additively manufactured MS1-H13 hybrid steels. Addit. Manuf. 2018, 23, 381–393. [Google Scholar] [CrossRef]
- Yap, C.Y.; Chua, C.K.; Dong, Z.; Liu, Z.H.; Zhang, D.Q.; Loh, L.E.; Sing, S.L. Review of selective laser melting: Materials and applications. Appl. Phys. Rev. 2015, 2, 041101. [Google Scholar] [CrossRef]
- Mohammed, M.T. Mechanical Properties of SLM-Titanium Materials for Biomedical Applications: A Review. In Proceedings of the Materials Today: Proceedings; Elsevier BV: Amsterdam, The Netherlands, 2018; Volume 5, pp. 17906–17913. [Google Scholar]
- Das, S.; Fuesting, T.P.; Danyo, G.; Brown, L.E.; Beaman, J.J.; Bourell, D.L. Direct laser fabrication of superalloy cermet abrasive turbine blade tips. Mater. Des. 2000, 21, 63–73. [Google Scholar] [CrossRef]
- Dadbakhsh, S.; Hao, L.; Jerrard, P.; Zhang, D. Experimental investigation on selective laser melting behaviour and processing windows of in situ reacted Al/Fe2O3 powder mixture. Powder Technol. 2012, 231, 112–121. [Google Scholar] [CrossRef]
- Shishkovskii, I.V.; Yadroitsev, I.A.; Yu, S.I. Theory and technology of sintering, thermal, and chemicathermal treatment. Powder Metall. Met. Ceram. 2011, 50, 275–283. [Google Scholar] [CrossRef]
- Hosseini, E.; Popovich, V. A review of mechanical properties of additively manufactured Inconel 718. Addit. Manuf. 2019, 30, 100877. [Google Scholar] [CrossRef]
- Qi, H.; Azer, M.; Ritter, A. Studies of standard heat treatment effects on microstructure and mechanical properties of laser net shape manufactured Inconel 718. Met. Mater. Trans. A 2009, 40, 2410–2422. [Google Scholar] [CrossRef]
- Parimi, L.L.; Atallah, M.M.; Gebelin, J.C.; Reed, R.C. Direct laser fabrication of Inconel-718: Effects on distortion and microstructure. In Proceedings of the Superalloys 2012: 12 International Symposium on Superalloys; Huron, E.S., Reed, R.C., Hardy, M.C., Mills, M.J., Montero, R.E., Portella, P.D., Telesman, J., Eds.; The Journal of The Minerals, Metals & Materials Society (TMS): Pittsburgh, PA, USA, 2012; pp. 1–10. [Google Scholar]
- Kapłonek, W.; Nadolny, K.; Sutowska, M.; Mia, M.; Pimenov, D.Y.; Gupta, M.K. Experimental studies on MoS2-treated grinding wheel active surface condition after high-efficiency internal cylindrical grinding process of Inconel® alloy 718. Micromachines 2019, 10, 255. [Google Scholar] [CrossRef]
- Spears, T.G.; Gold, S.A. In-process sensing in selective laser melting (SLM) additive manufacturing. Integrating Mater. Manuf. Innov. 2016, 5, 16–40. [Google Scholar] [CrossRef]
- Waqar, S.; Liu, J.; Sun, Q.; Guo, K.; Sun, J. Effect of post-heat treatment cooling on microstructure and mechanical properties of selective laser melting manufactured austenitic 316L stainless steel. Rapid Prototyp. J. 2020, 26, 1739–1749. [Google Scholar] [CrossRef]
- Gupta, M.K.; Singla, A.K.; Ji, H.; Song, Q.; Liu, Z.; Cai, W.; Mia, M.; Khanna, N.; Krolczyk, G.M. Impact of layer rotation on micro-structure, grain size, surface integrity and mechanical behaviour of SLM Al–Si–10Mg alloy. J. Mater. Res. Technol. 2020, 9, 9506–9522. [Google Scholar] [CrossRef]
- Khanna, N.; Mistry, S.; Rashid, R.A.R.; Gupta, M.K. Investigations on density and surface roughness characteristics during selective laser sintering of Invar-36 alloy. Mater. Res. Express 2019, 6, 086541. [Google Scholar] [CrossRef]
- Tiwari, J.K.; Mandal, A.; Sathish, N.; Agrawal, A.; Srivastava, A. Investigation of porosity, microstructure and mechanical properties of additively manufactured graphene reinforced AlSi10Mg composite. Addit. Manuf. 2020, 33, 101095. [Google Scholar] [CrossRef]
- Darvish, K.; Chen, Z.W.; Phan, M.; Pasang, T. Selective laser melting of Co-29Cr-6Mo alloy with laser power 180–360 W: Cellular growth, intercellular spacing and the related thermal condition. Mater. Charact. 2018, 135, 183–191. [Google Scholar] [CrossRef]
- Read, N.; Wang, W.; Essa, K.; Attallah, M.M. Selective laser melting of AlSi10Mg alloy: Process optimisation and mechanical properties development. Mater. Des. 2015, 65, 417–424. [Google Scholar] [CrossRef]
- AlFaify, A.; Hughes, J.; Ridgway, K. Critical evaluation of the pulsed selective laser melting process when fabricating Ti64 parts using a range of particle size distributions. Addit. Manuf. 2018, 19, 197–204. [Google Scholar] [CrossRef]
- Morgan, R.; Sutcliffe, C.J.; O’Neill, W. Density analysis of direct metal laser re-melted 316L stainless steel cubic primitives. J. Mater. Sci. 2004, 39, 1195–1205. [Google Scholar] [CrossRef]
- Suzuki, A.; Nishida, R.; Takata, N.; Kobashi, M.; Kato, M. Design of laser parameters for selectively laser melted maraging steel based on deposited energy density. Addit. Manuf. 2019, 28, 160–168. [Google Scholar] [CrossRef]
- Pleass, C.; Jothi, S. Influence of powder characteristics and additive manufacturing process parameters on the microstructure and mechanical behaviour of Inconel 625 fabricated by selective laser melting. Addit. Manuf. 2018, 24, 419–431. [Google Scholar] [CrossRef]
- Wang, Y.; Shi, J. Influence of laser scan speed on micro-segregation in selective laser melting of an iron-carbon alloy: A multi-scale simulation study. Procedia Manuf. 2018, 26, 941–951. [Google Scholar] [CrossRef]
- Almangour, B.; Grzesiak, D.; Yang, J.-M. Selective laser melting of TiB2/316L stainless steel composites: The roles of powder preparation and hot isostatic pressing post-treatment. Powder Technol. 2017, 309, 37–48. [Google Scholar] [CrossRef]
- Ucar, Y.; Ekren, O. Effect of layered manufacturing techniques, alloy powders, and layer thickness on mechanical properties of Co–Cr dental alloys. J. Prosthet. Dent. 2018, 120, 762–770. [Google Scholar] [CrossRef] [PubMed]
- Bertoli, U.S.; Wolfer, A.J.; Matthews, M.J.; Delplanque, J.-P.R.; Schoenung, J.M. On the limitations of volumetric energy density as a design parameter for selective laser melting. Mater. Des. 2017, 113, 331–340. [Google Scholar] [CrossRef]
- Mishurova, T.; Artzt, K.; Haubrich, J.; Requena, G.; Bruno, G. New aspects about the search for the most relevant parameters optimizing SLM materials. Addit. Manuf. 2019, 25, 325–334. [Google Scholar] [CrossRef]
- Mishra, A.K.; Kumar, A. Numerical and experimental analysis of the effect of volumetric energy absorption in powder layer on thermal-fluidic transport in selective laser melting of Ti6Al4V. Opt. Laser Technol. 2019, 111, 227–239. [Google Scholar] [CrossRef]
- Enneti, R.K.; Morgan, R.; Atre, S.V. Effect of process parameters on the selective laser melting (SLM) of tungsten. Int. J. Refract. Met. Hard Mater. 2018, 71, 315–319. [Google Scholar] [CrossRef]
- Maamoun, A.H.; Xue, Y.F.; Elbestawi, M.A.; Veldhuis, S. Effect of selective laser melting process parameters on the quality of al alloy parts: Powder characterization, density, surface roughness, and dimensional accuracy. Materials 2018, 11, 2343. [Google Scholar] [CrossRef]
- Moussaoui, K.; Rubio, W.; Mousseigne, M.; Sultan, T.; Rezai, F. Effects of selective laser melting additive manufacturing parameters of Inconel 718 on porosity, microstructure and mechanical properties. Mater. Sci. Eng. A 2018, 735, 182–190. [Google Scholar] [CrossRef]
- Koutiri, I.; Pessard, E.; Peyre, P.; Amlou, O.; De Terris, T. Influence of SLM process parameters on the surface finish, porosity rate and fatigue behavior of as-built Inconel 625 parts. J. Mater. Process. Technol. 2018, 255, 536–546. [Google Scholar] [CrossRef]
- Tucho, W.M.; Lysne, V.H.; Austbø, H.; Sjolyst-Kverneland, A.; Hansen, V. Investigation of effects of process parameters on microstructure and hardness of SLM manufactured SS316L. J. Alloy. Compd. 2018, 740, 910–925. [Google Scholar] [CrossRef]
- Jadhav, S.D.; Dadbakhsh, S.; Goossens, L.; Kruth, J.-P.; Van Humbeeck, J.; Vanmeensel, K. Influence of selective laser melting process parameters on texture evolution in pure copper. J. Mater. Process. Technol. 2019, 270, 47–58. [Google Scholar] [CrossRef]
- Jing, G.; Huang, W.; Yang, H.; Wang, Z. Microstructural evolution and mechanical properties of 300M steel produced by low and high power selective laser melting. J. Mater. Sci. Technol. 2020, 48, 44–56. [Google Scholar] [CrossRef]
- Pal, S.; Gubeljak, N.; Hudak, R.; Lojen, G.; Rajtukova, V.; Predan, J.; Kokol, V.; Drstvensek, I. Tensile properties of selective laser melting products affected by building orientation and energy density. Mater. Sci. Eng. A 2019, 743, 637–647. [Google Scholar] [CrossRef]
- Liu, S.; Li, H.; Qin, C.; Zong, R.; Fang, X.-Y. The effect of energy density on texture and mechanical anisotropy in selective laser melted Inconel 718. Mater. Des. 2020, 191, 108642. [Google Scholar] [CrossRef]
- Ghayoor, M.; Lee, K.; He, Y.; Chang, C.-H.; Paul, B.K.; Pasebani, S. Selective laser melting of 304L stainless steel: Role of volumetric energy density on the microstructure, texture and mechanical properties. Addit. Manuf. 2020, 32, 101011. [Google Scholar] [CrossRef]
- Van Elsen, M. Complexity of Selective Laser Melting: A New Optimisation Approach. Ph.D. Thesis, Katholieke Universiteit Leuven, Belgium, Brussel, January 2007. [Google Scholar]
- Tawfik, S.M.; Nasr, M.N.A.; El Gamal, H.A. Finite element modelling for part distortion calculation in selective laser melting. Alex. Eng. J. 2019, 58, 67–74. [Google Scholar] [CrossRef]
- Conti, P.; Cianetti, F.; Pilerci, P. Parametric finite elements model of SLM additive manufacturing process. Procedia Struct. Integr. 2018, 8, 410–421. [Google Scholar] [CrossRef]
- Sun, S.; Zheng, L.; Liu, Y.; Liu, J.; Zhang, H. Selective laser melting of Al–Fe–V–Si heat-resistant aluminum alloy powder: Modeling and experiments. Int. J. Adv. Manuf. Technol. 2015, 80, 1787–1797. [Google Scholar] [CrossRef]
- Tran, H.-C.; Lo, Y.-L. Heat transfer simulations of selective laser melting process based on volumetric heat source with powder size consideration. J. Mater. Process. Technol. 2018, 255, 411–425. [Google Scholar] [CrossRef]
- Zeng, K.; Pal, D.; Gong, H.J.; Patil, N.; Stucker, B. Comparison of 3DSIM thermal modelling of selective laser melting using new dynamic meshing method to ANSYS. Mater. Sci. Technol. 2015, 31, 945–956. [Google Scholar] [CrossRef]
- Moser, D.; Cullinan, M.; Murthy, J. Multi-scale computational modeling of residual stress in selective laser melting with uncertainty quantification. Addit. Manuf. 2019, 29, 100770. [Google Scholar] [CrossRef]
- Ahmadi, A.; Mirzaeifar, R.; Moghaddam, N.S.; Turabi, A.S.; Karaca, H.; Elahinia, M. Effect of manufacturing parameters on mechanical properties of 316L stainless steel parts fabricated by selective laser melting: A computational framework. Mater. Des. 2016, 112, 328–338. [Google Scholar] [CrossRef]
- Gu, H.; Wei, C.; Li, L.; Han, Q.; Setchi, R.; Ryan, M.; Li, Q. Multi-physics modelling of molten pool development and track formation in multi-track, multi-layer and multi-material selective laser melting. Int. J. Heat Mass Transf. 2020, 151, 119458. [Google Scholar] [CrossRef]
- Ridolfi, M.R.; Folgarait, P.; Battaglia, V.; Vela, T.; Corapi, D.; Di Schino, A. Development and calibration of a CFD-based model of the bed fusion SLM additive manufacturing process aimed at optimising laser parameters. Procedia Struct. Integr. 2019, 24, 370–380. [Google Scholar] [CrossRef]
- Waqar, S.; Sun, Q.; Liu, J.; Guo, K.; Sun, J. Numerical investigation of thermal behavior and melt pool morphology in multi-track multi-layer selective laser melting of the 316L steel. Int. J. Adv. Manuf. Technol. 2021, 112, 879–895. [Google Scholar] [CrossRef]
- Van Elsen, M.; Al-Bender, F.; Kruth, J. Application of dimensional analysis to selective laser melting. Rapid Prototyp. J. 2008, 14, 15–22. [Google Scholar] [CrossRef]
- Cardaropoli, F.; Alfieri, V.; Caiazzo, F.; Sergi, V. Dimensional analysis for the definition of the influence of process parameters in selective laser melting of Ti–6Al–4V alloy. Proc. Inst. Mech. Eng. Part B J. Eng. Manuf. 2012, 226, 1136–1142. [Google Scholar] [CrossRef]
- Khan, K.; Mohr, G.; Hilgenberg, K.; De, A. Probing a novel heat source model and adaptive remeshing technique to simulate laser powder bed fusion with experimental validation. Comput. Mater. Sci. 2020, 181, 109752. [Google Scholar] [CrossRef]
- Sonin, A.A. The Physical Basis of Dimensional Analysis, 2nd ed.; Massachusets Institute of Technology: Cambridge, MA, USA, 2001. [Google Scholar]
- Gibbings, J.C. Dimensional Analysis; Springer: London, UK, 2011. [Google Scholar]
- Tan, Q.M. Dimensional Analysis: With Case Studies in Mechanics; Springer: Berlin/Heidelberg, Germany, 2011. [Google Scholar]
- Simon, V.; Weigand, B.; Gomaa, H. Dimensional Analysis for Engineers; Springer: Berlin, Germany, 2017; ISBN 9783319520261. [Google Scholar]
- Kempen, K.; Thijs, L.; Van Humbeeck, J.; Kruth, J.-P. Mechanical properties of AlSi10Mg produced by selective laser melting. Phys. Procedia 2012, 39, 439–446. [Google Scholar] [CrossRef]
- Dilip, J.J.S.; Zhang, S.; Teng, C.; Zeng, K.; Robinson, C.; Pal, D.; Stucker, B. Influence of processing parameters on the evolution of melt pool, porosity, and microstructures in Ti-6Al-4V alloy parts fabricated by selective laser melting. Prog. Addit. Manuf. 2017, 2, 157–167. [Google Scholar] [CrossRef]
- Carpenter Additive PowderRange Ti64 Datasheet. Available online: https://f.hubspotusercontent10.net/hubfs/6205315/Resources/DataSheets/20201112-CT-PowderRange-TI64-AM-DataSheet_Revs.pdf (accessed on 15 January 2021).
Publisher’s Note: MDPI stays neutral with regard to jurisdictional claims in published maps and institutional affiliations. |
© 2021 by the authors. Licensee MDPI, Basel, Switzerland. This article is an open access article distributed under the terms and conditions of the Creative Commons Attribution (CC BY) license (http://creativecommons.org/licenses/by/4.0/).