
Evaluation of Eco-Efficient Concretes Produced with Fly Ash and Uncarbonated Recycled Aggregates


Abstract
:1. Introduction
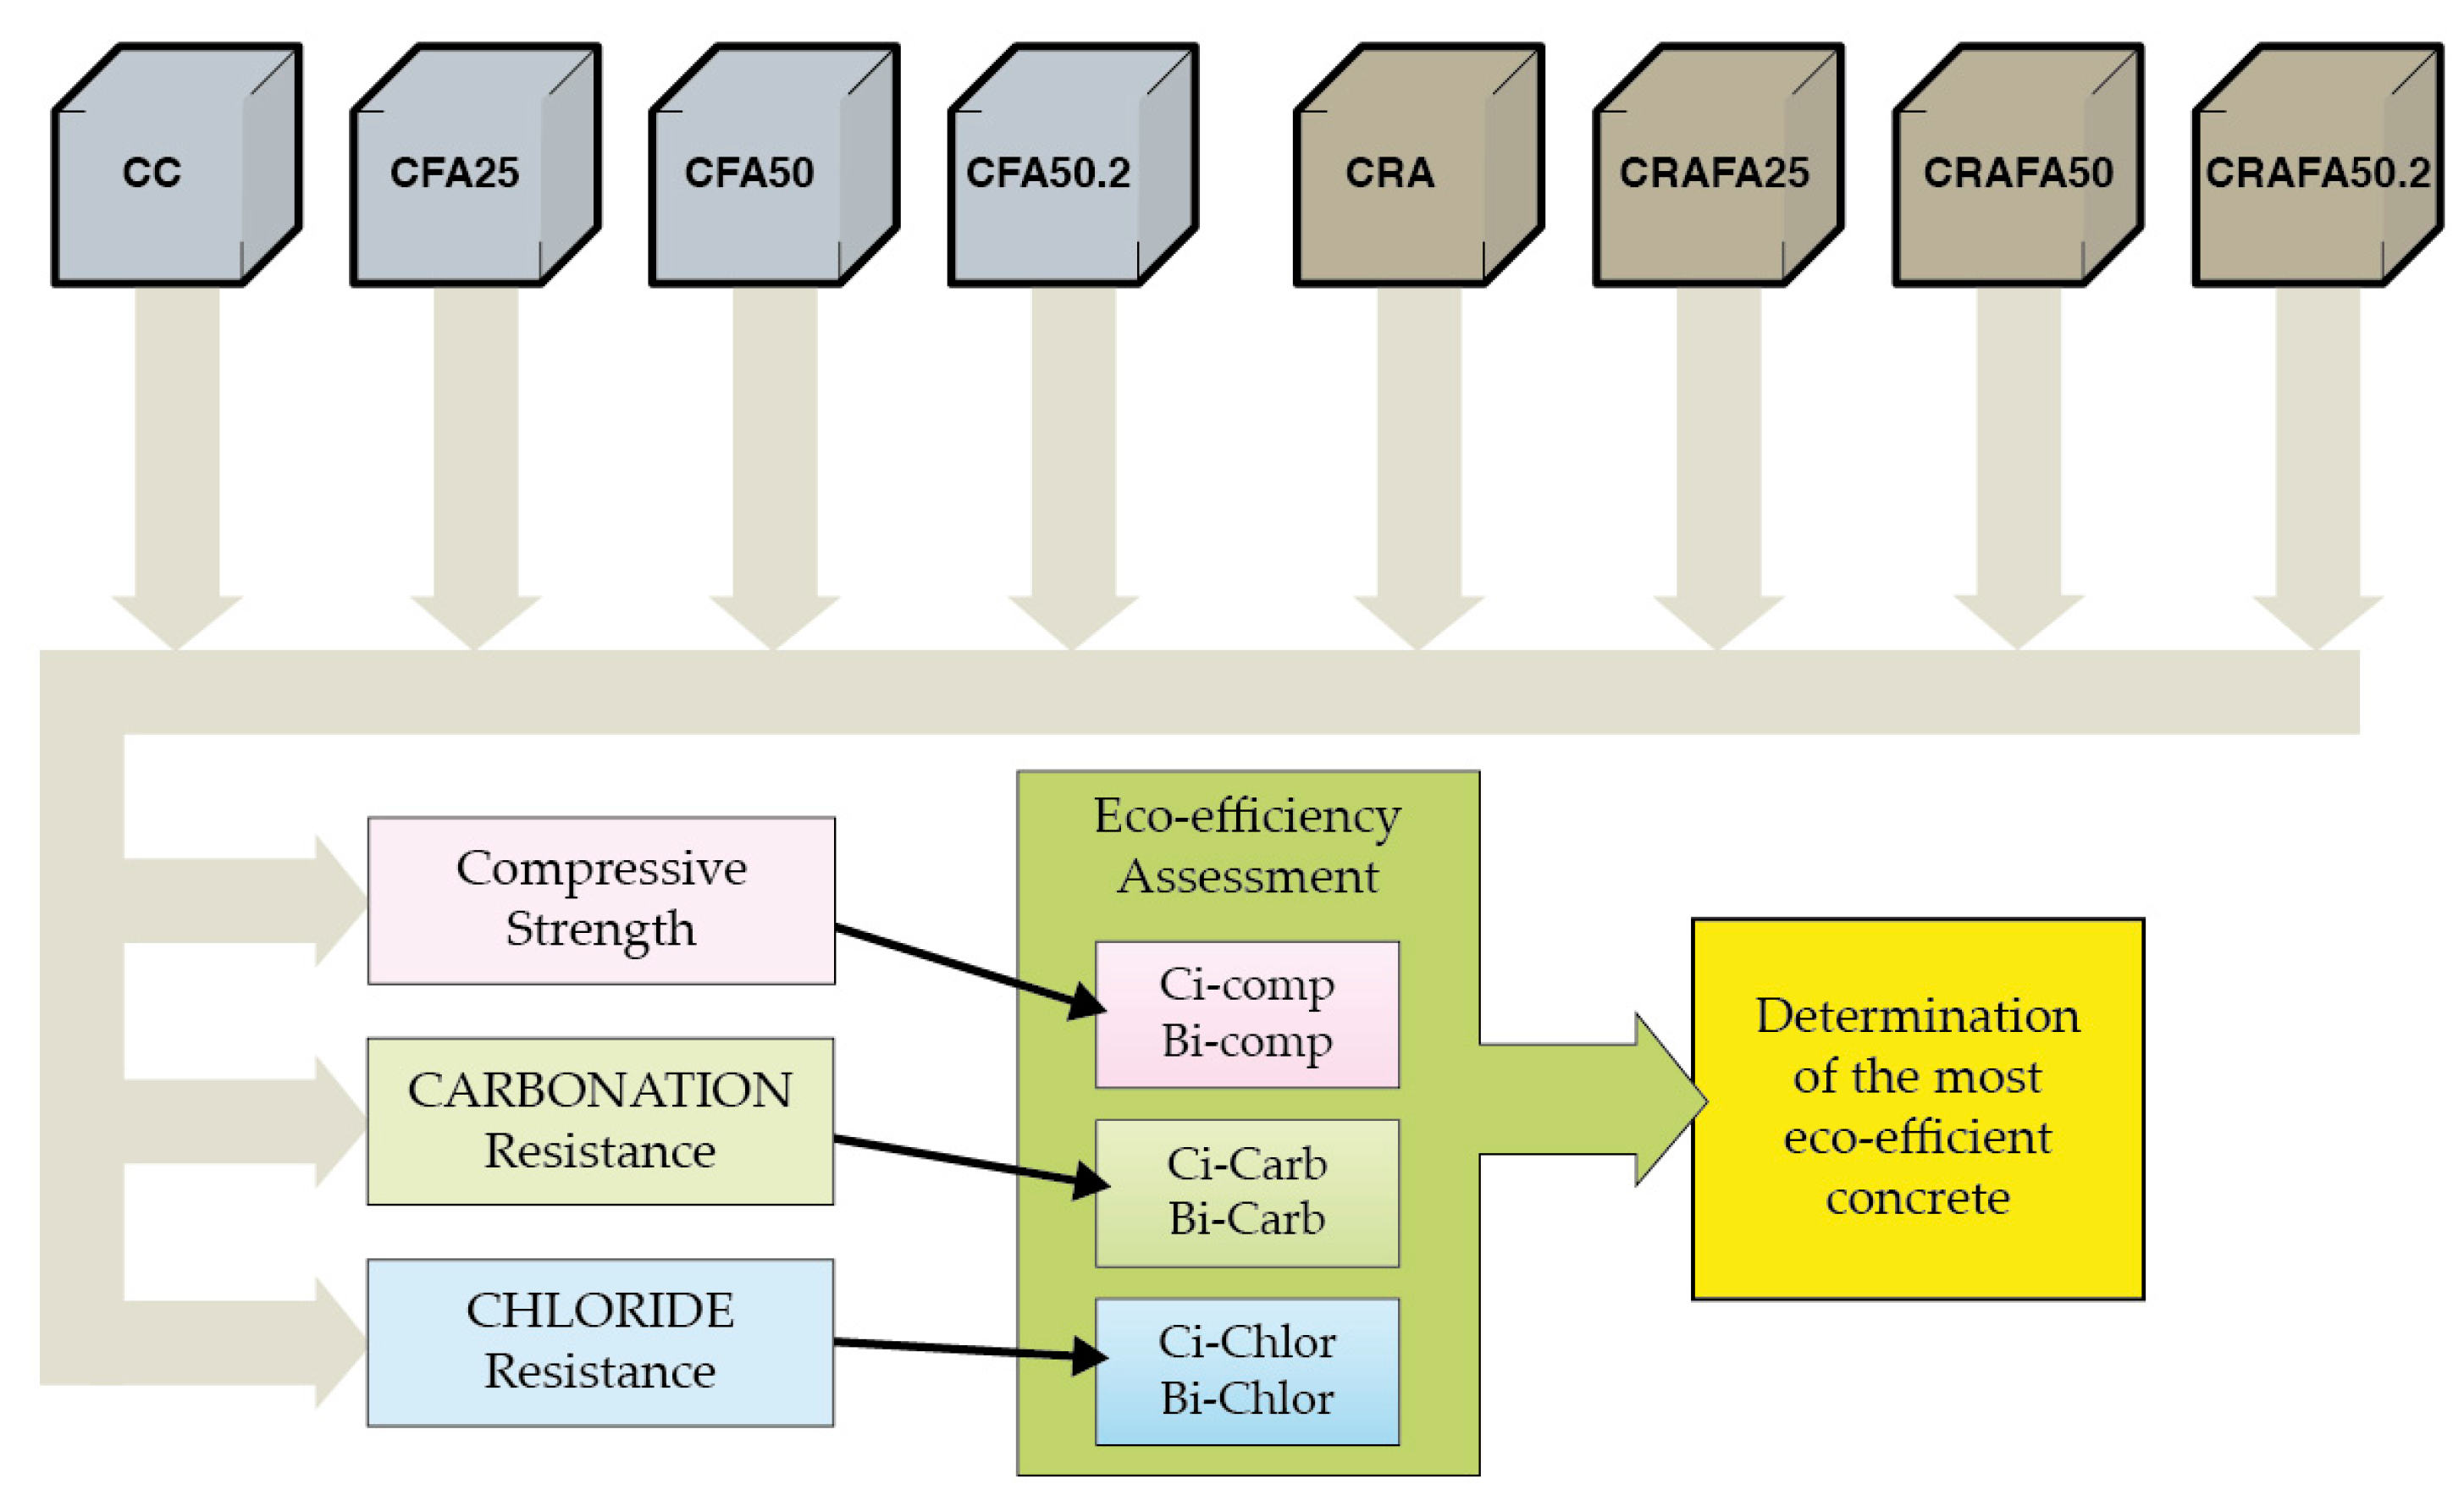
2. Materials and Methods
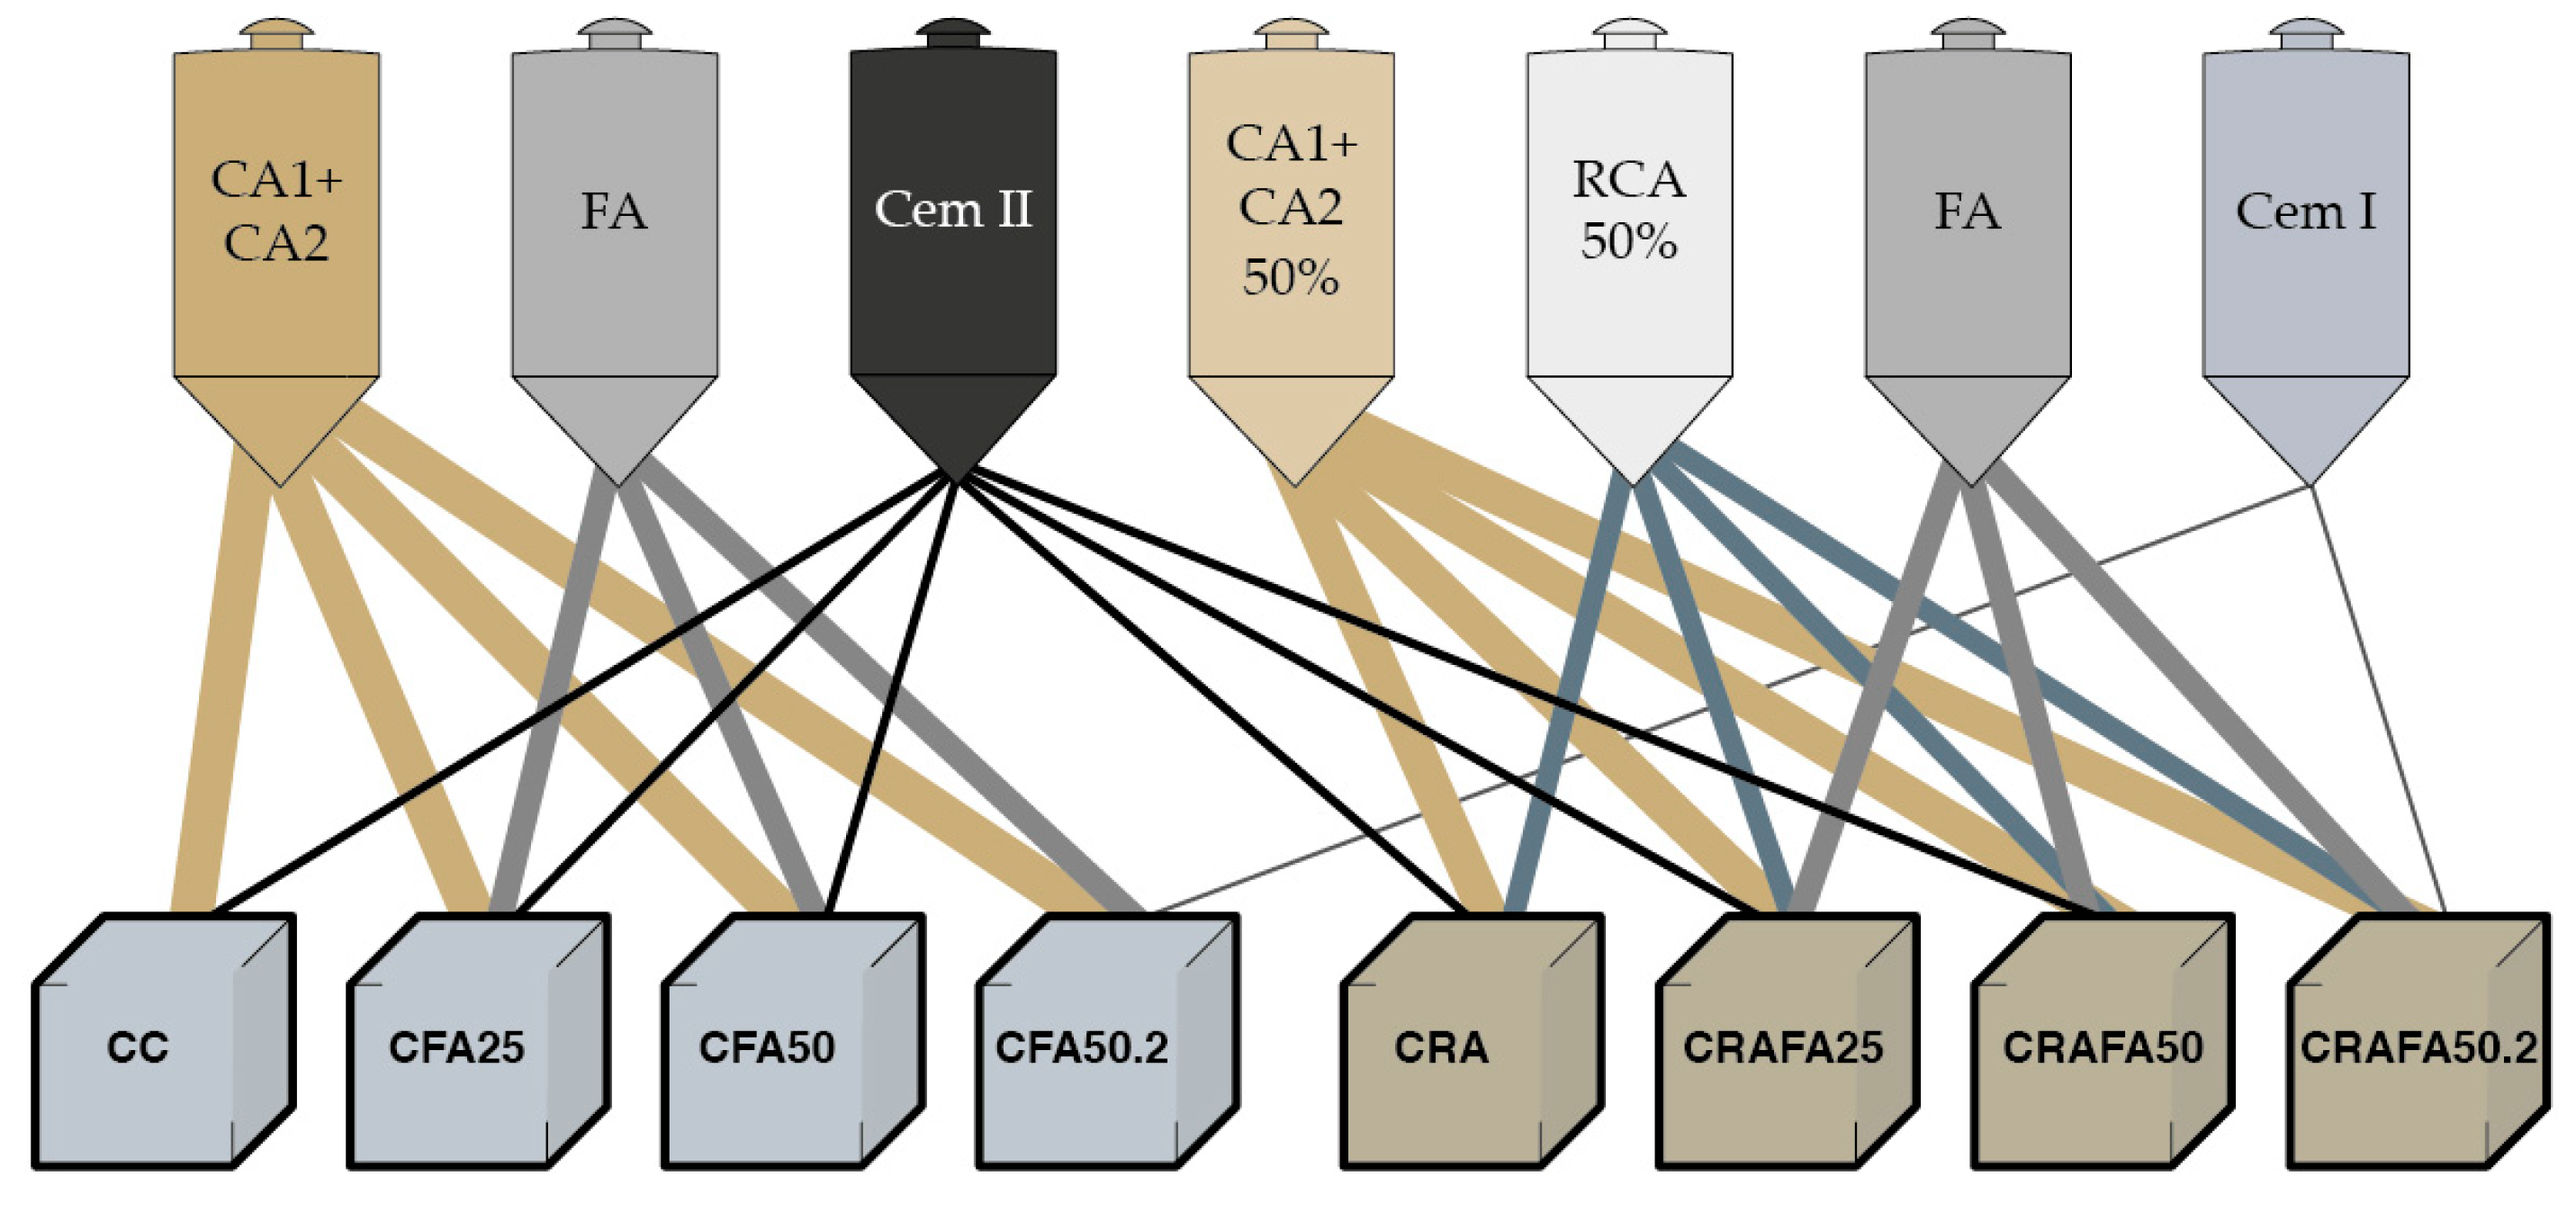
2.1. Binder
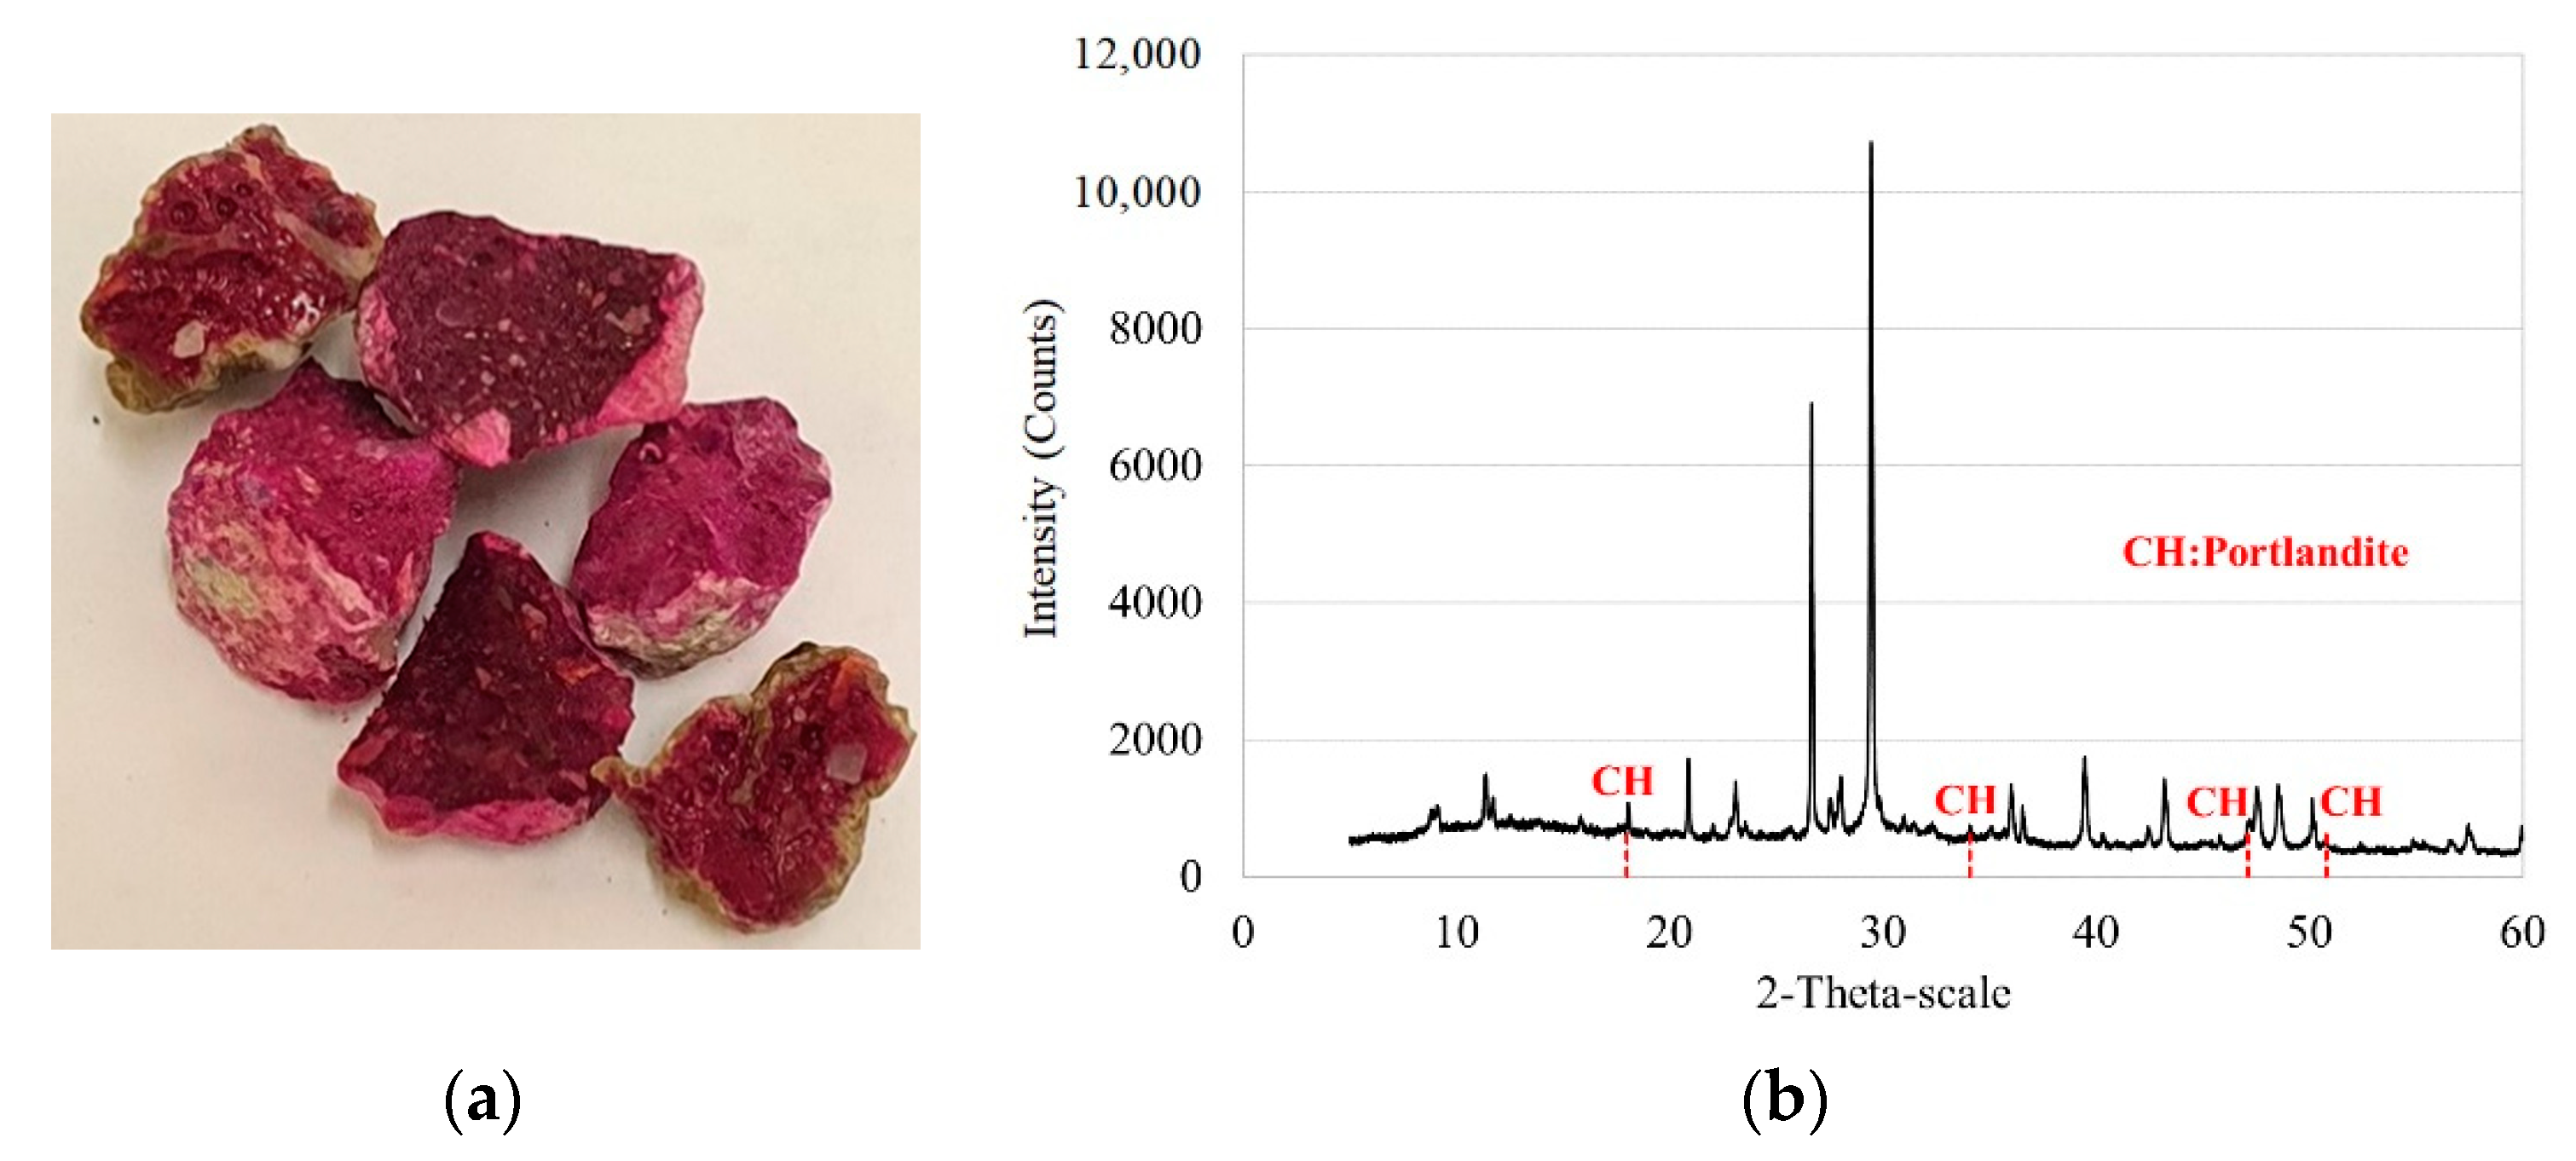
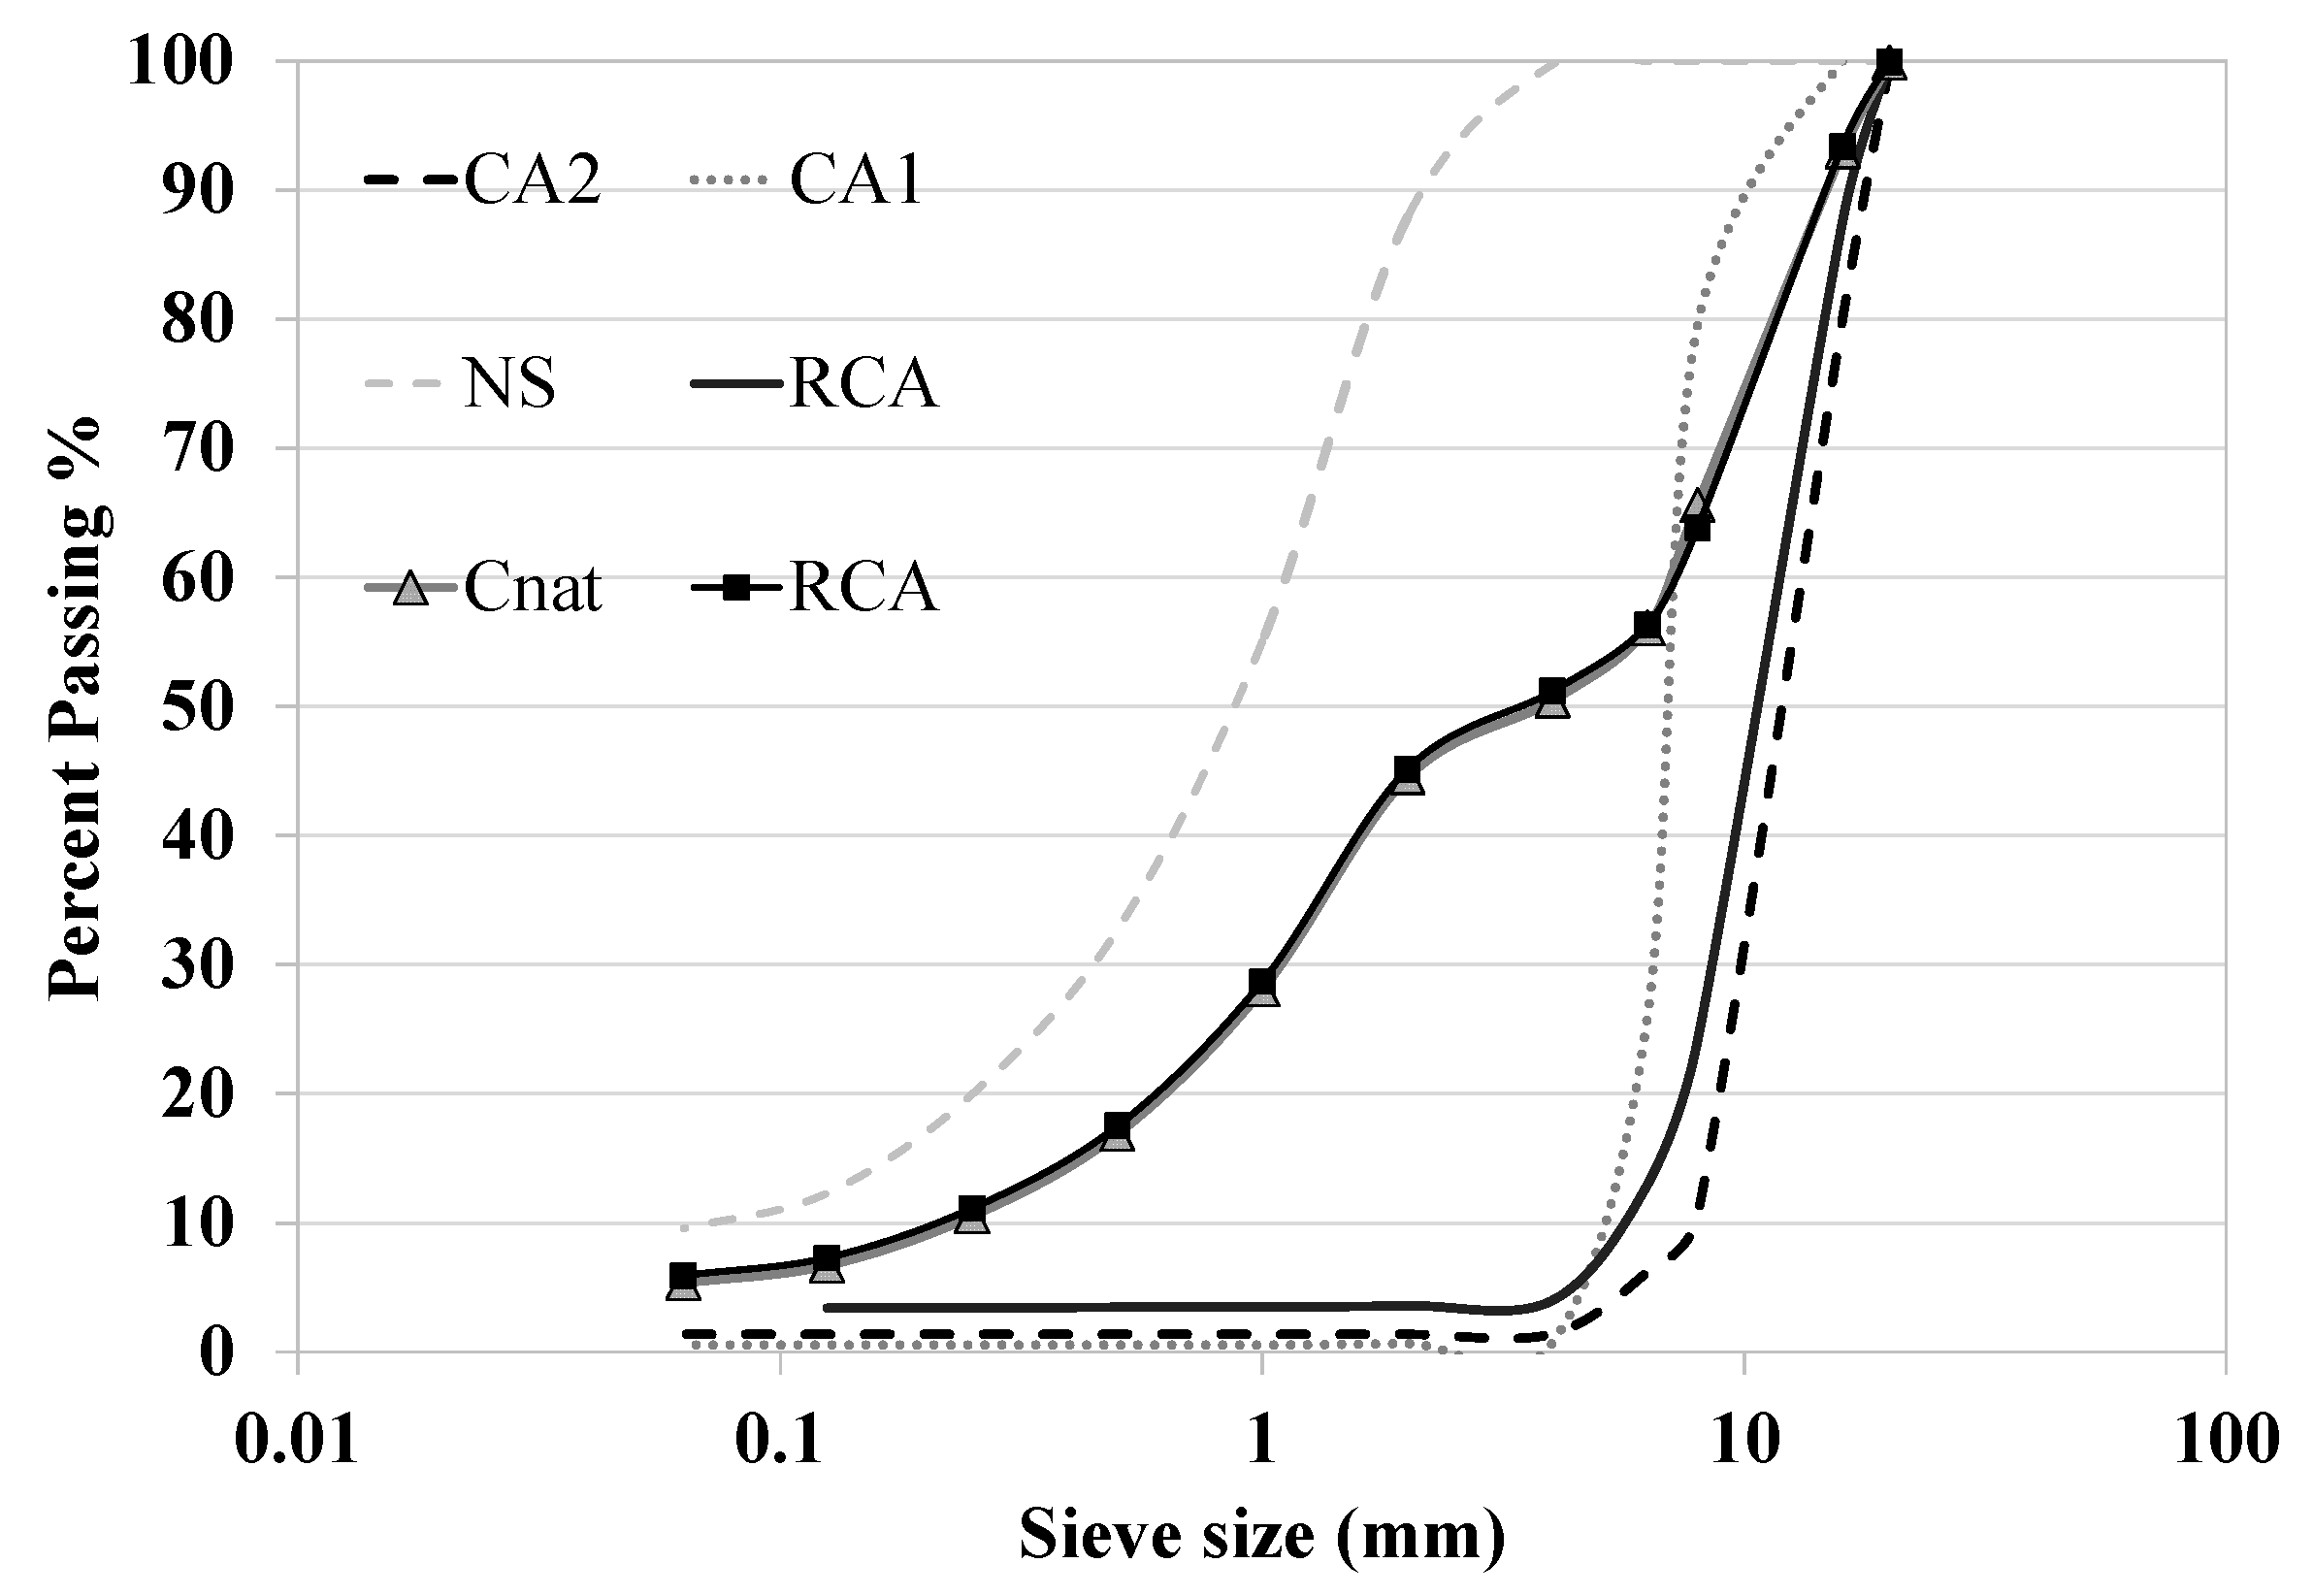
Aggregates
2.2. Mix Design and Production Process
2.3. Test Procedure
2.3.1. Compressive Strength
2.3.2. Carbonation and Chloride Resistance
2.3.3. Eco-Efficiency Assessment
3. Results
3.1. Compressive Strength
3.2. Durability Properties: Carbonation and Chloride Resistance
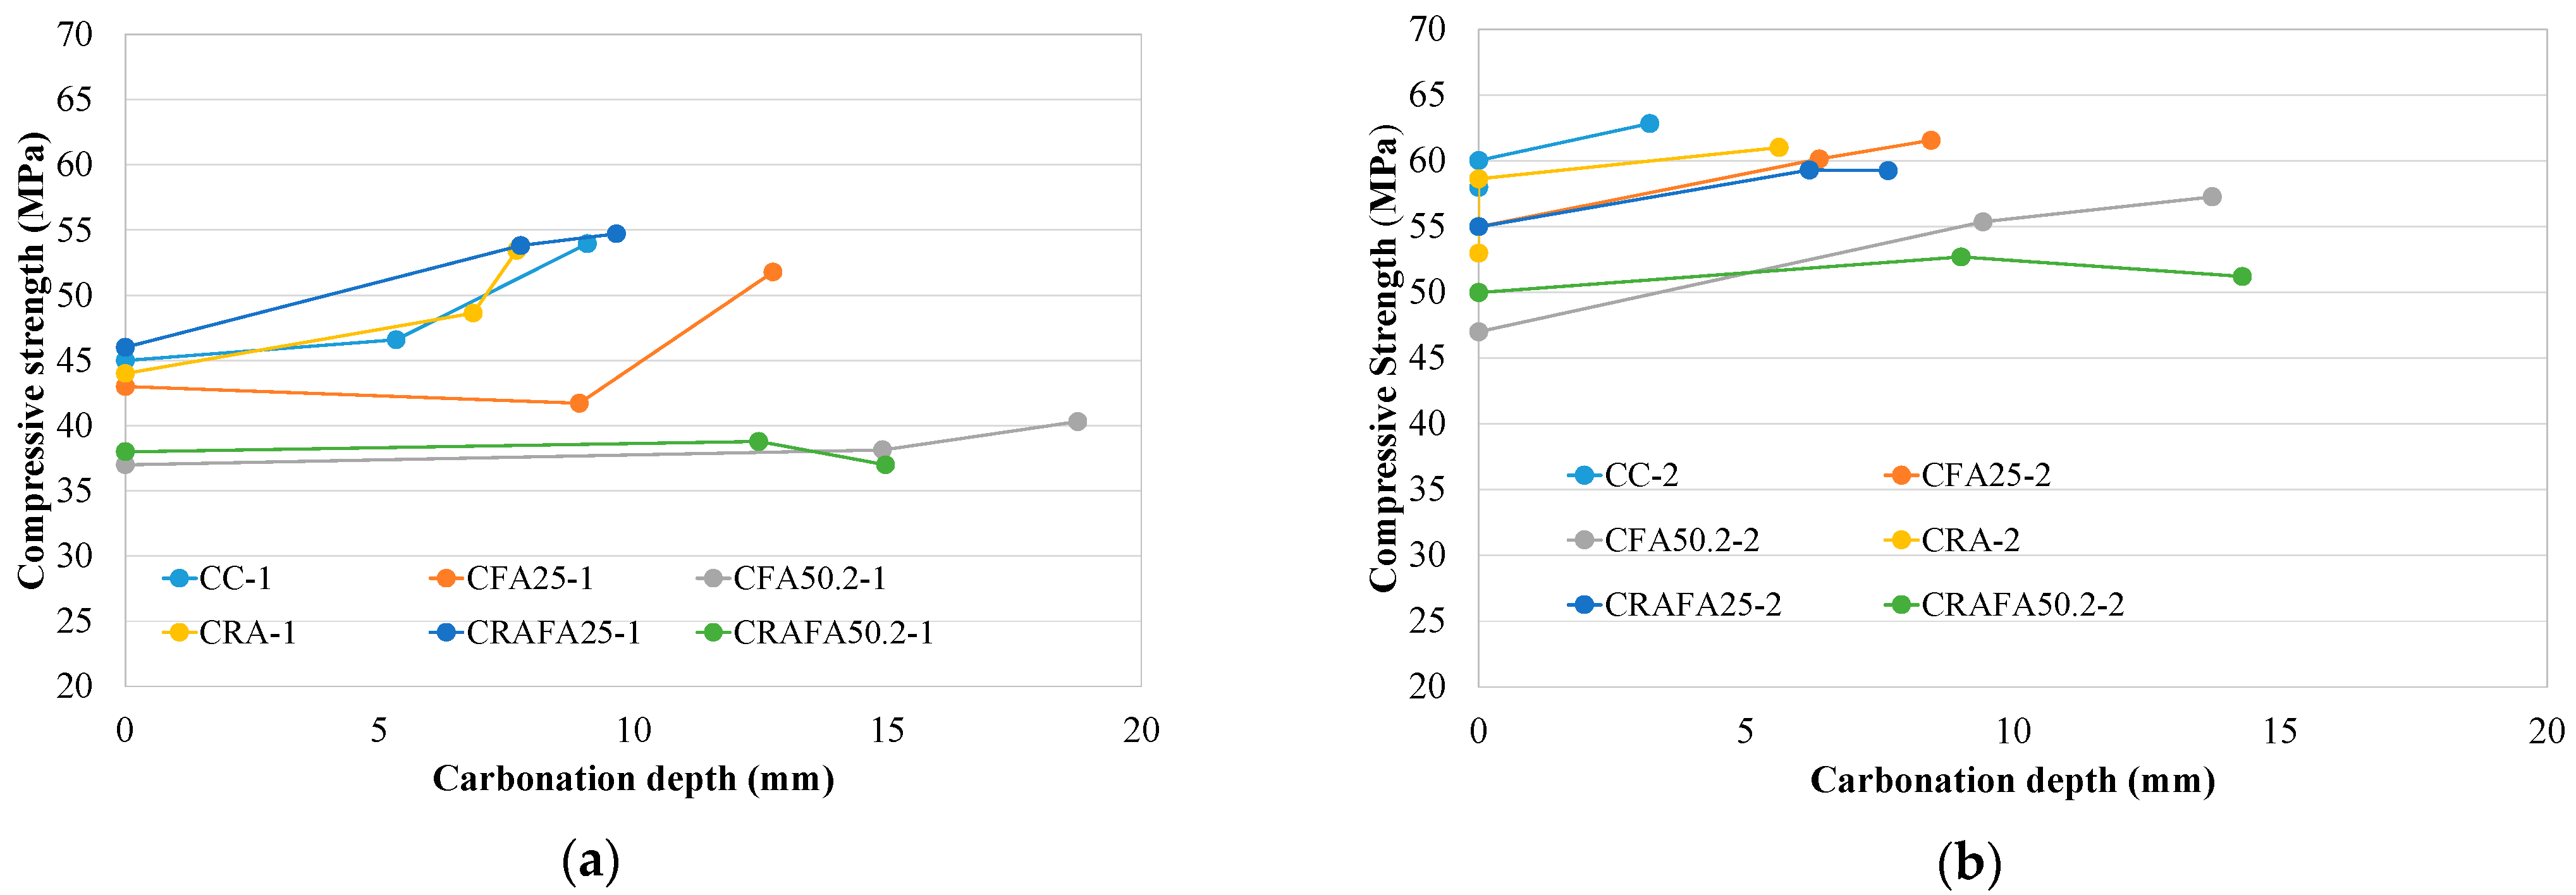
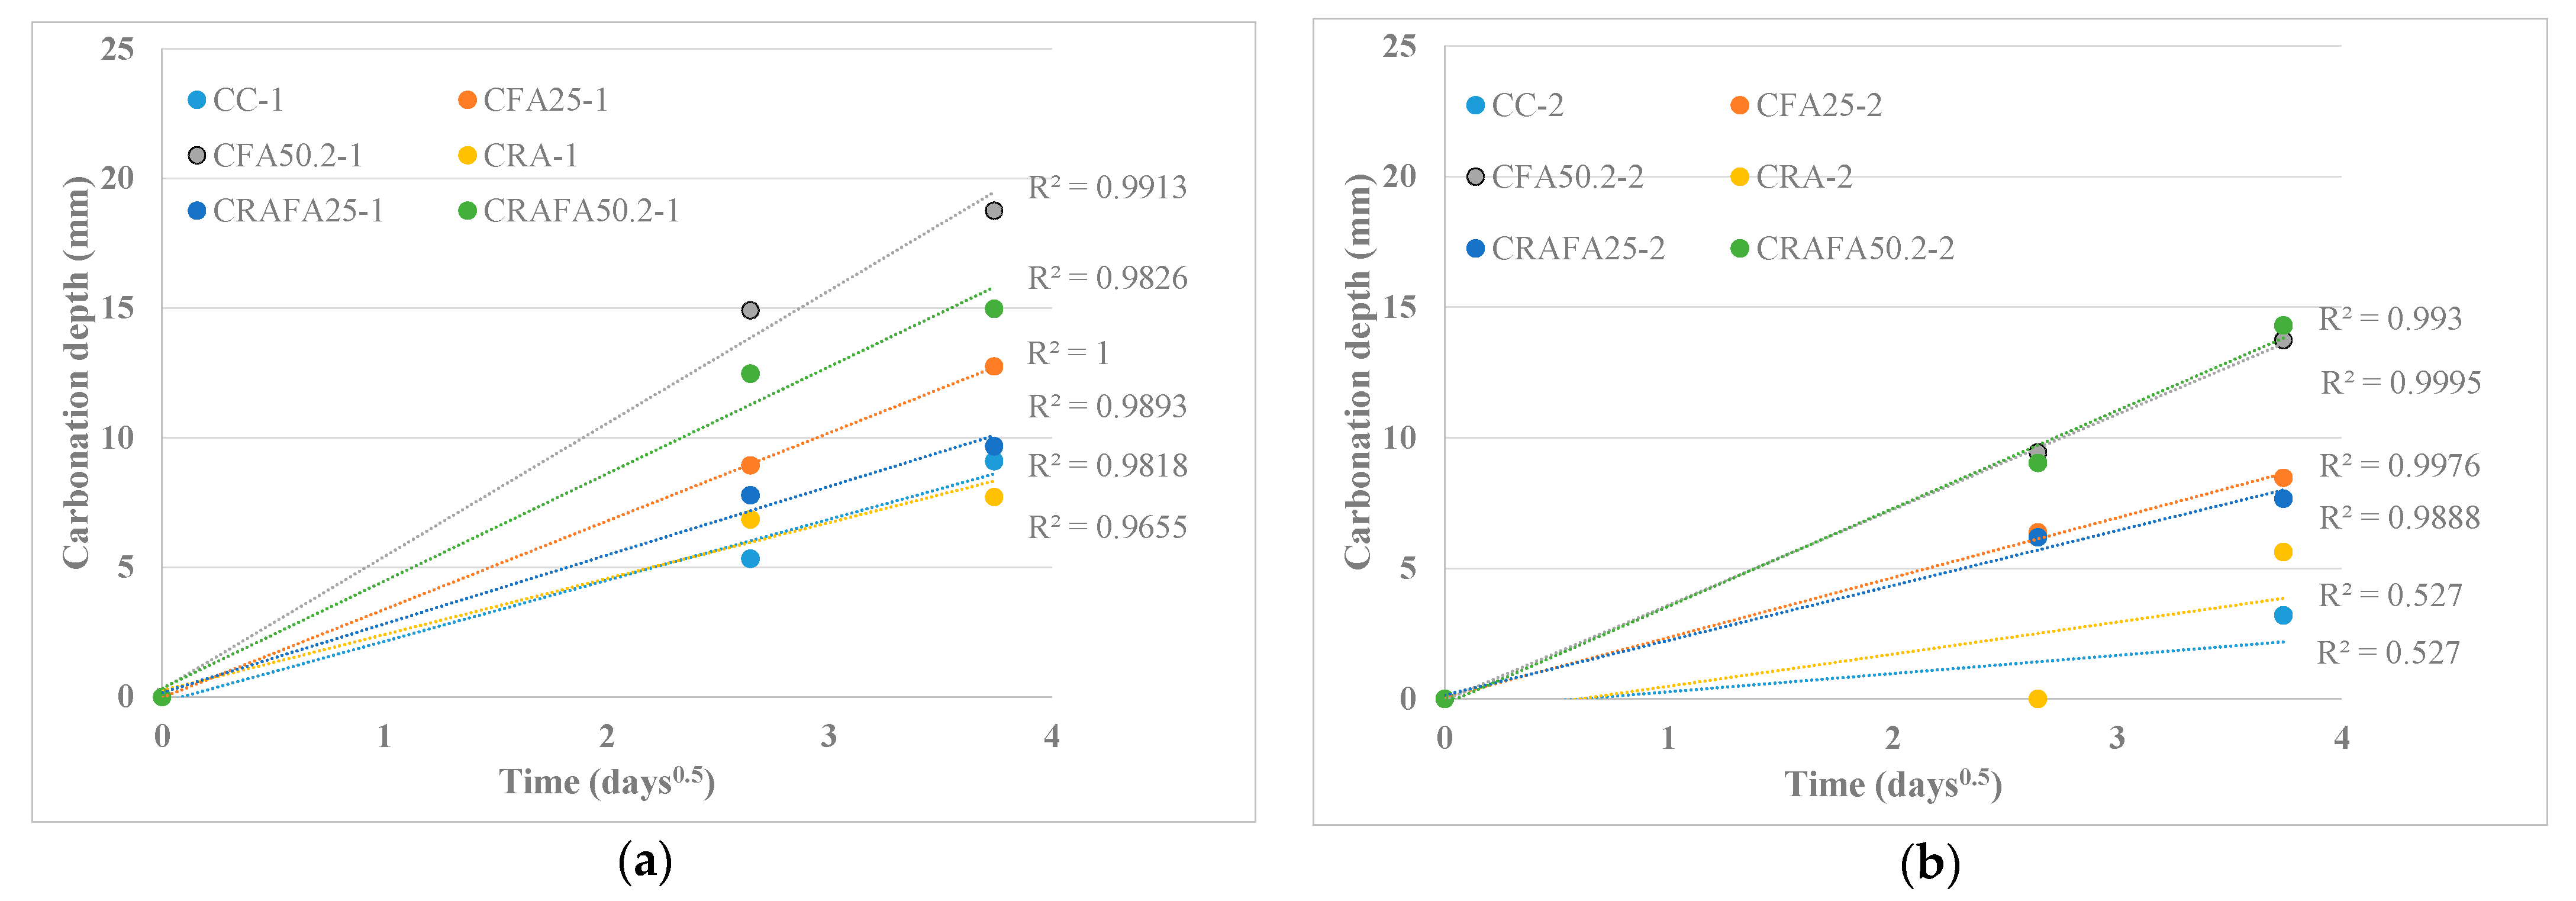
3.2.1. Carbonation Resistance
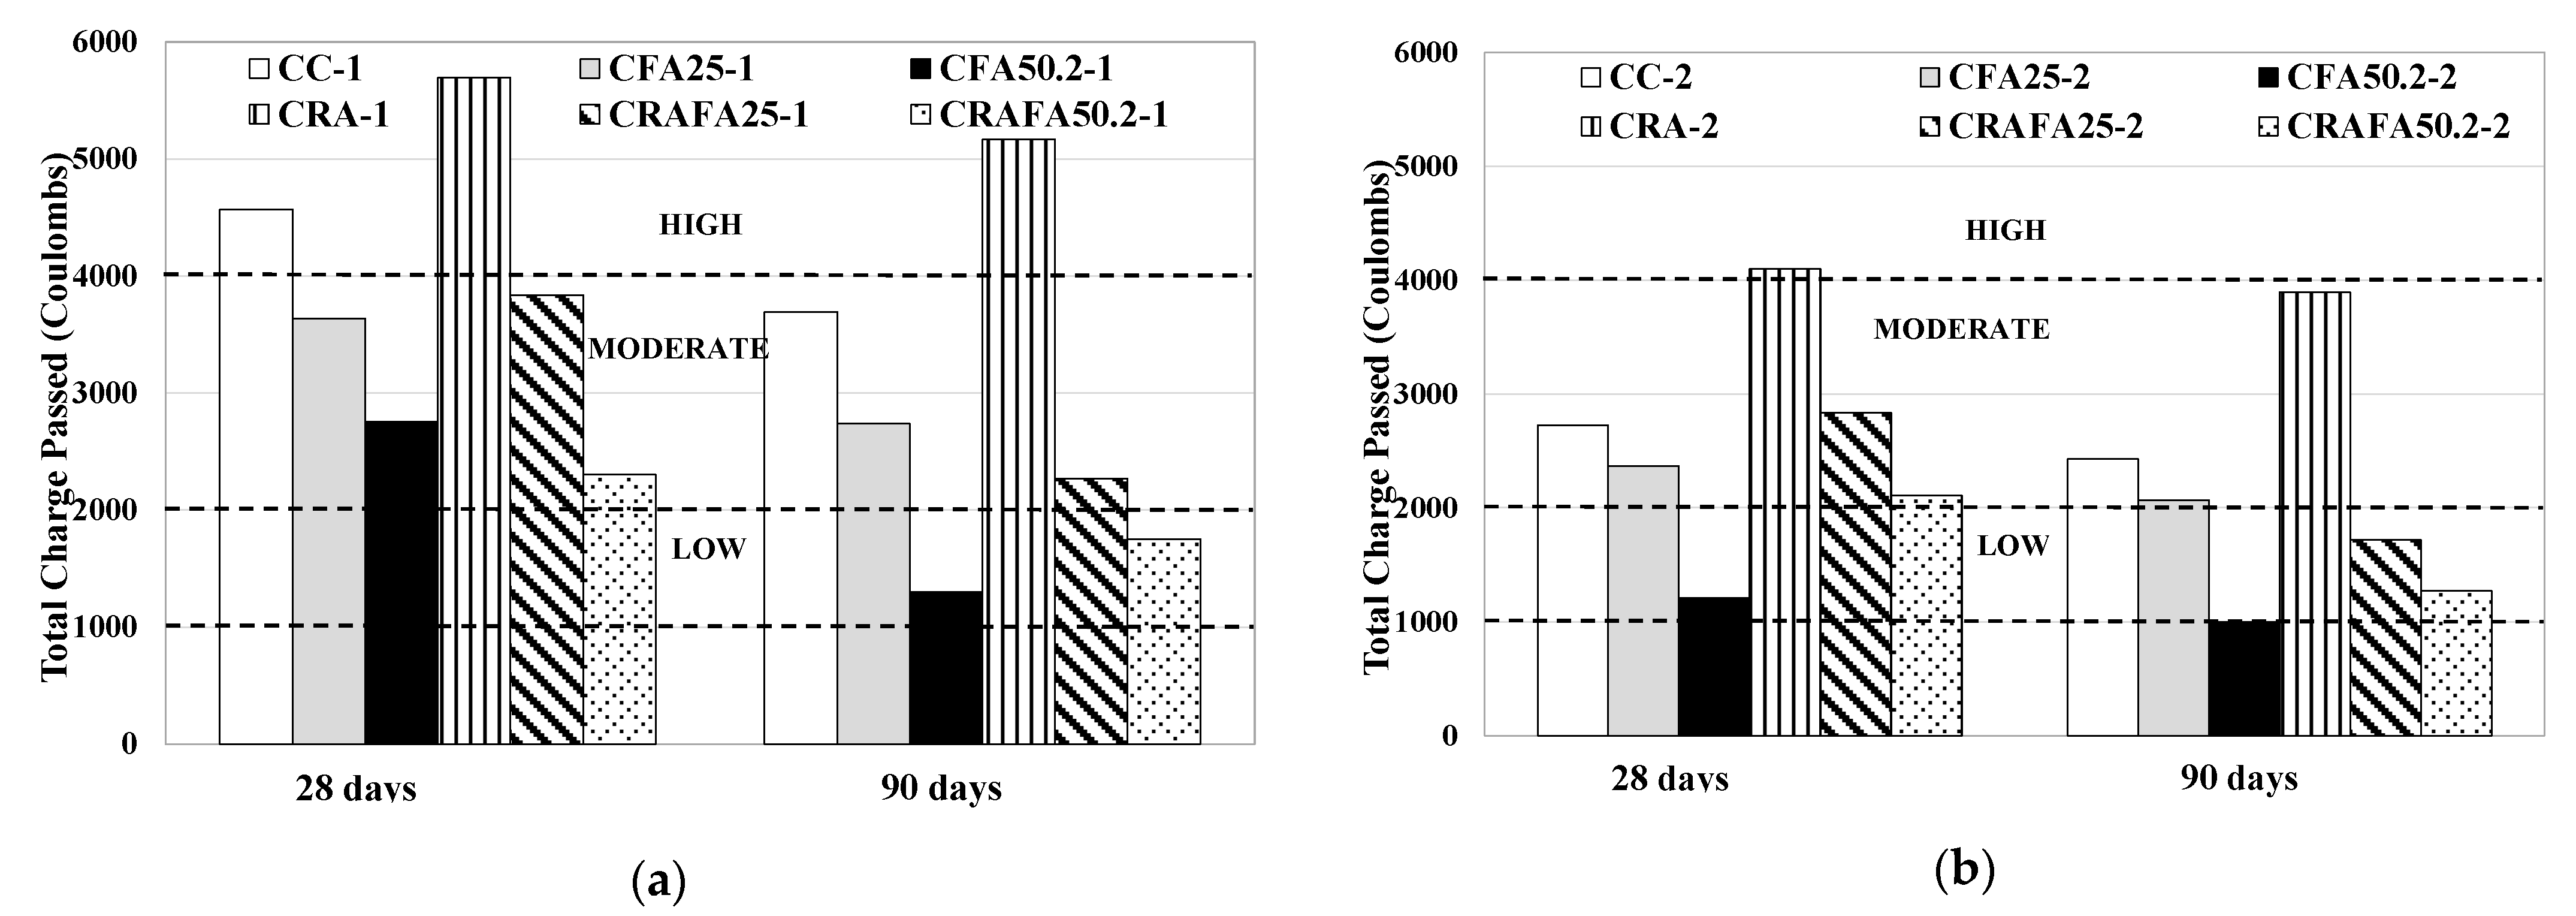
3.2.2. Chloride Resistance
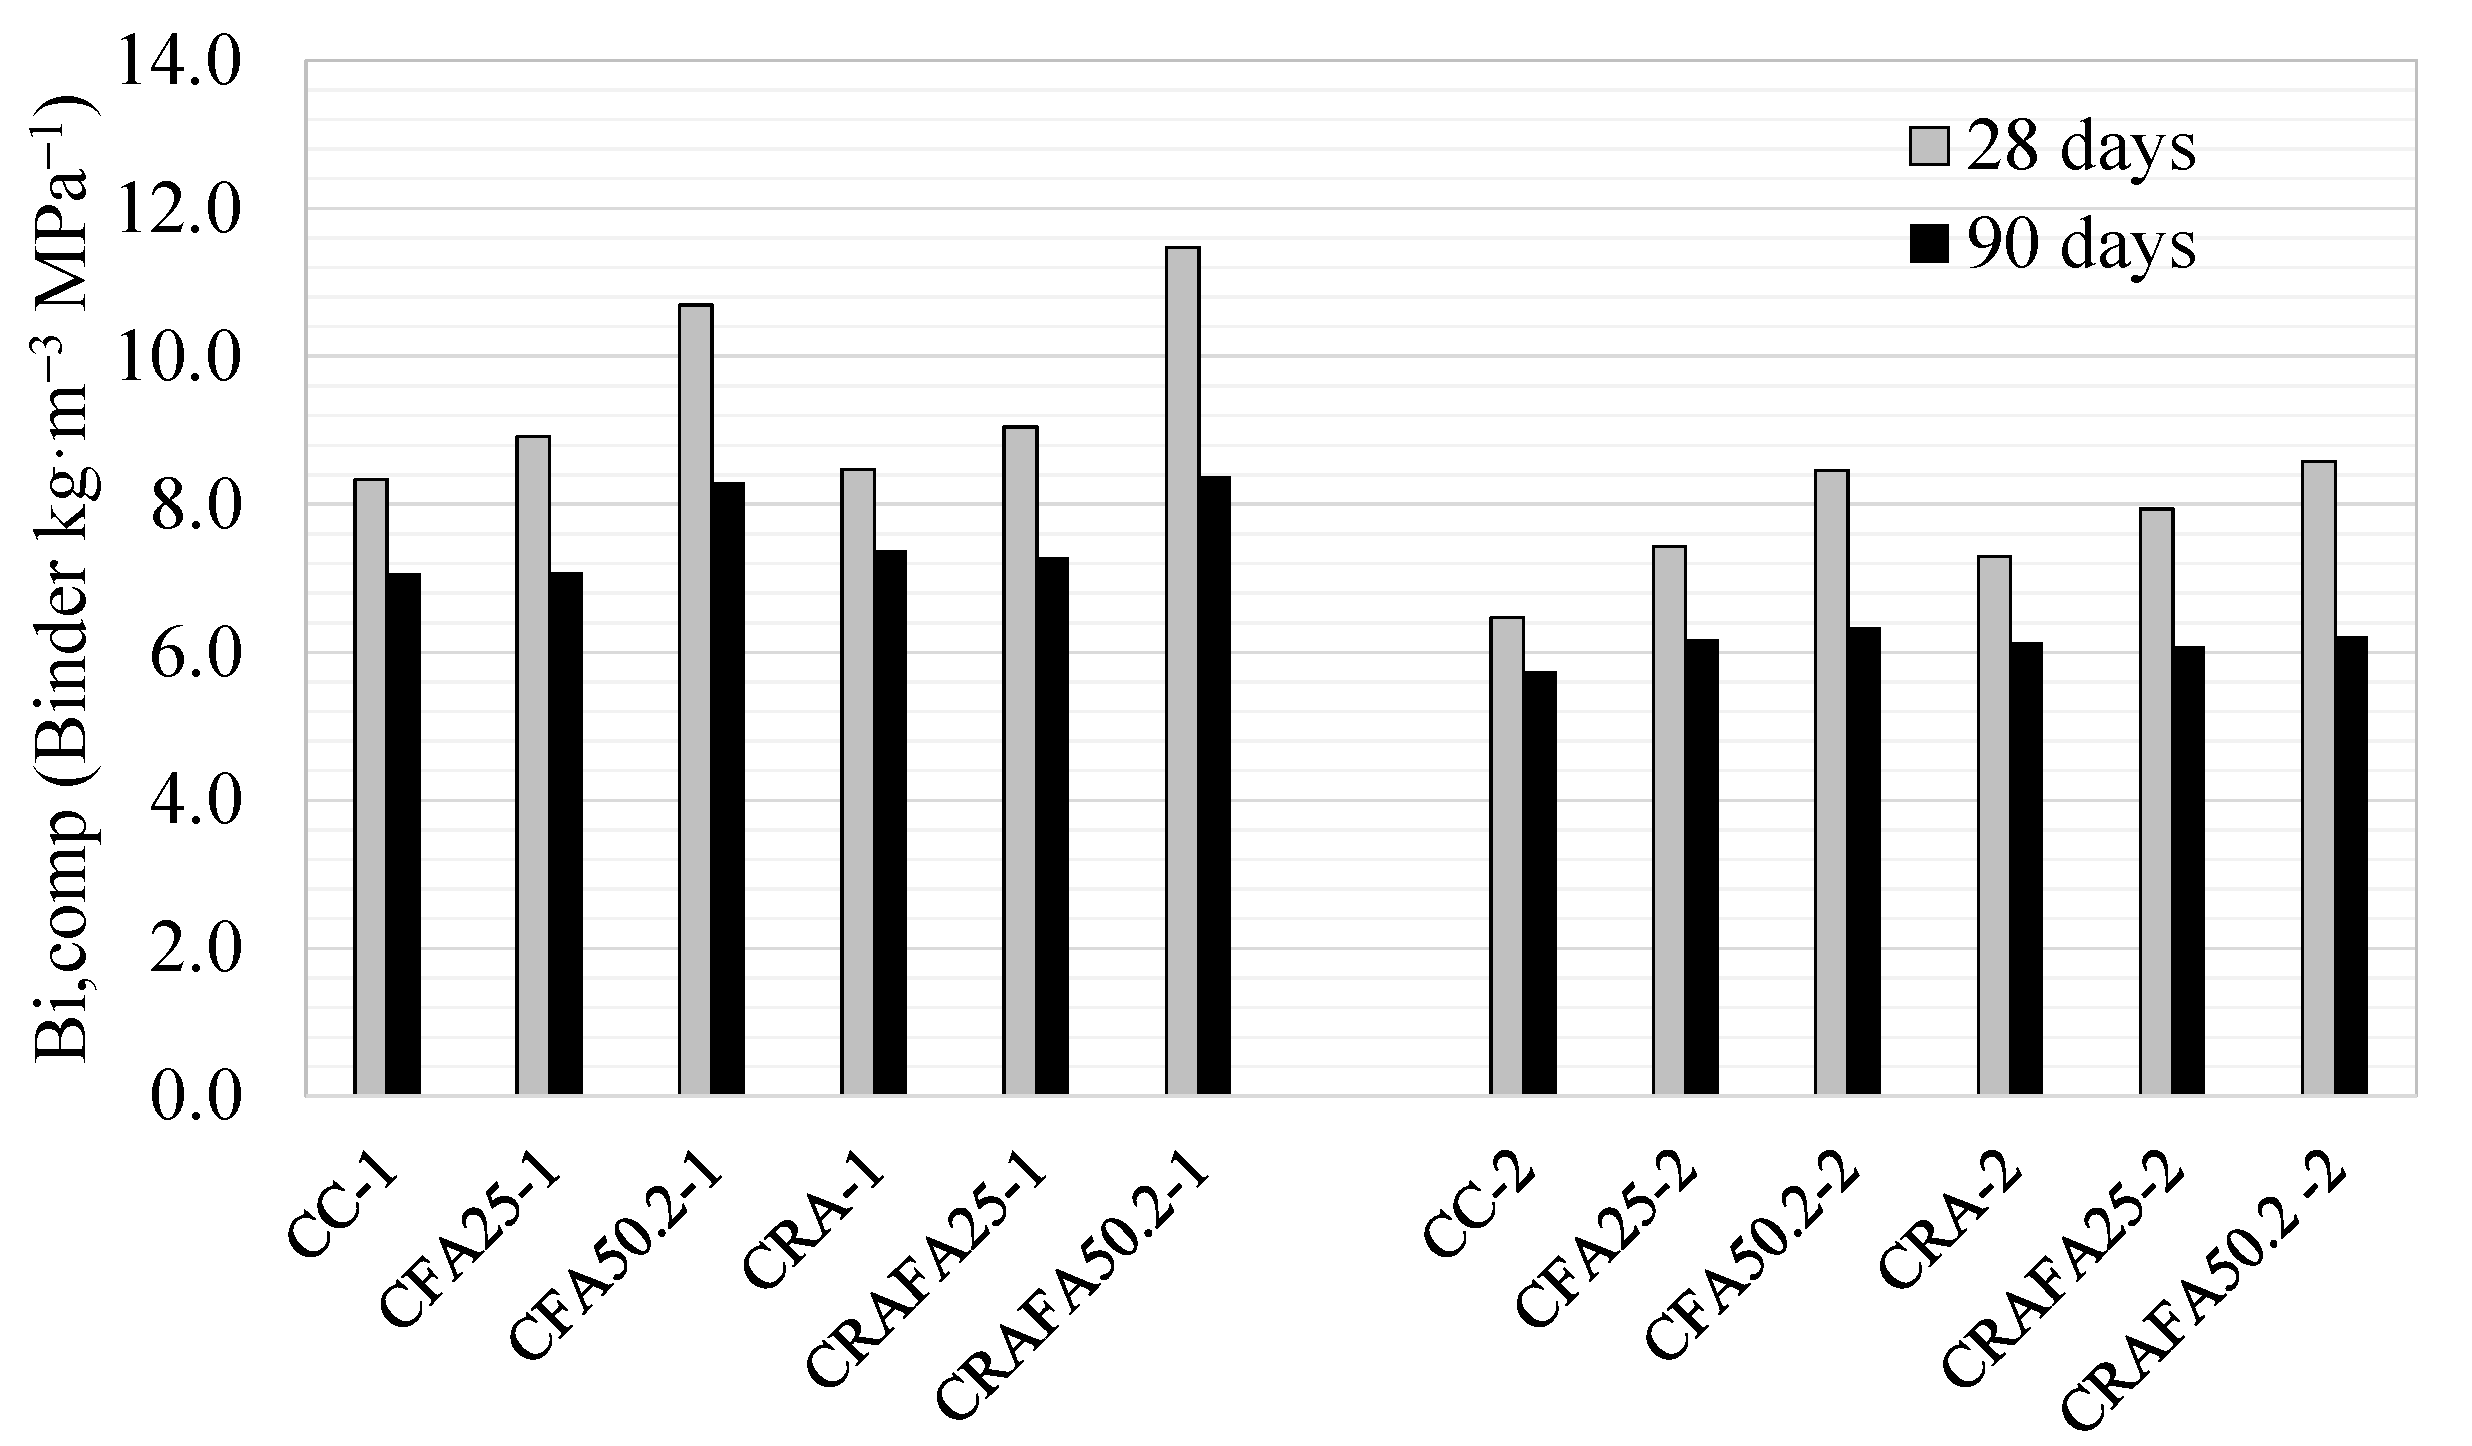
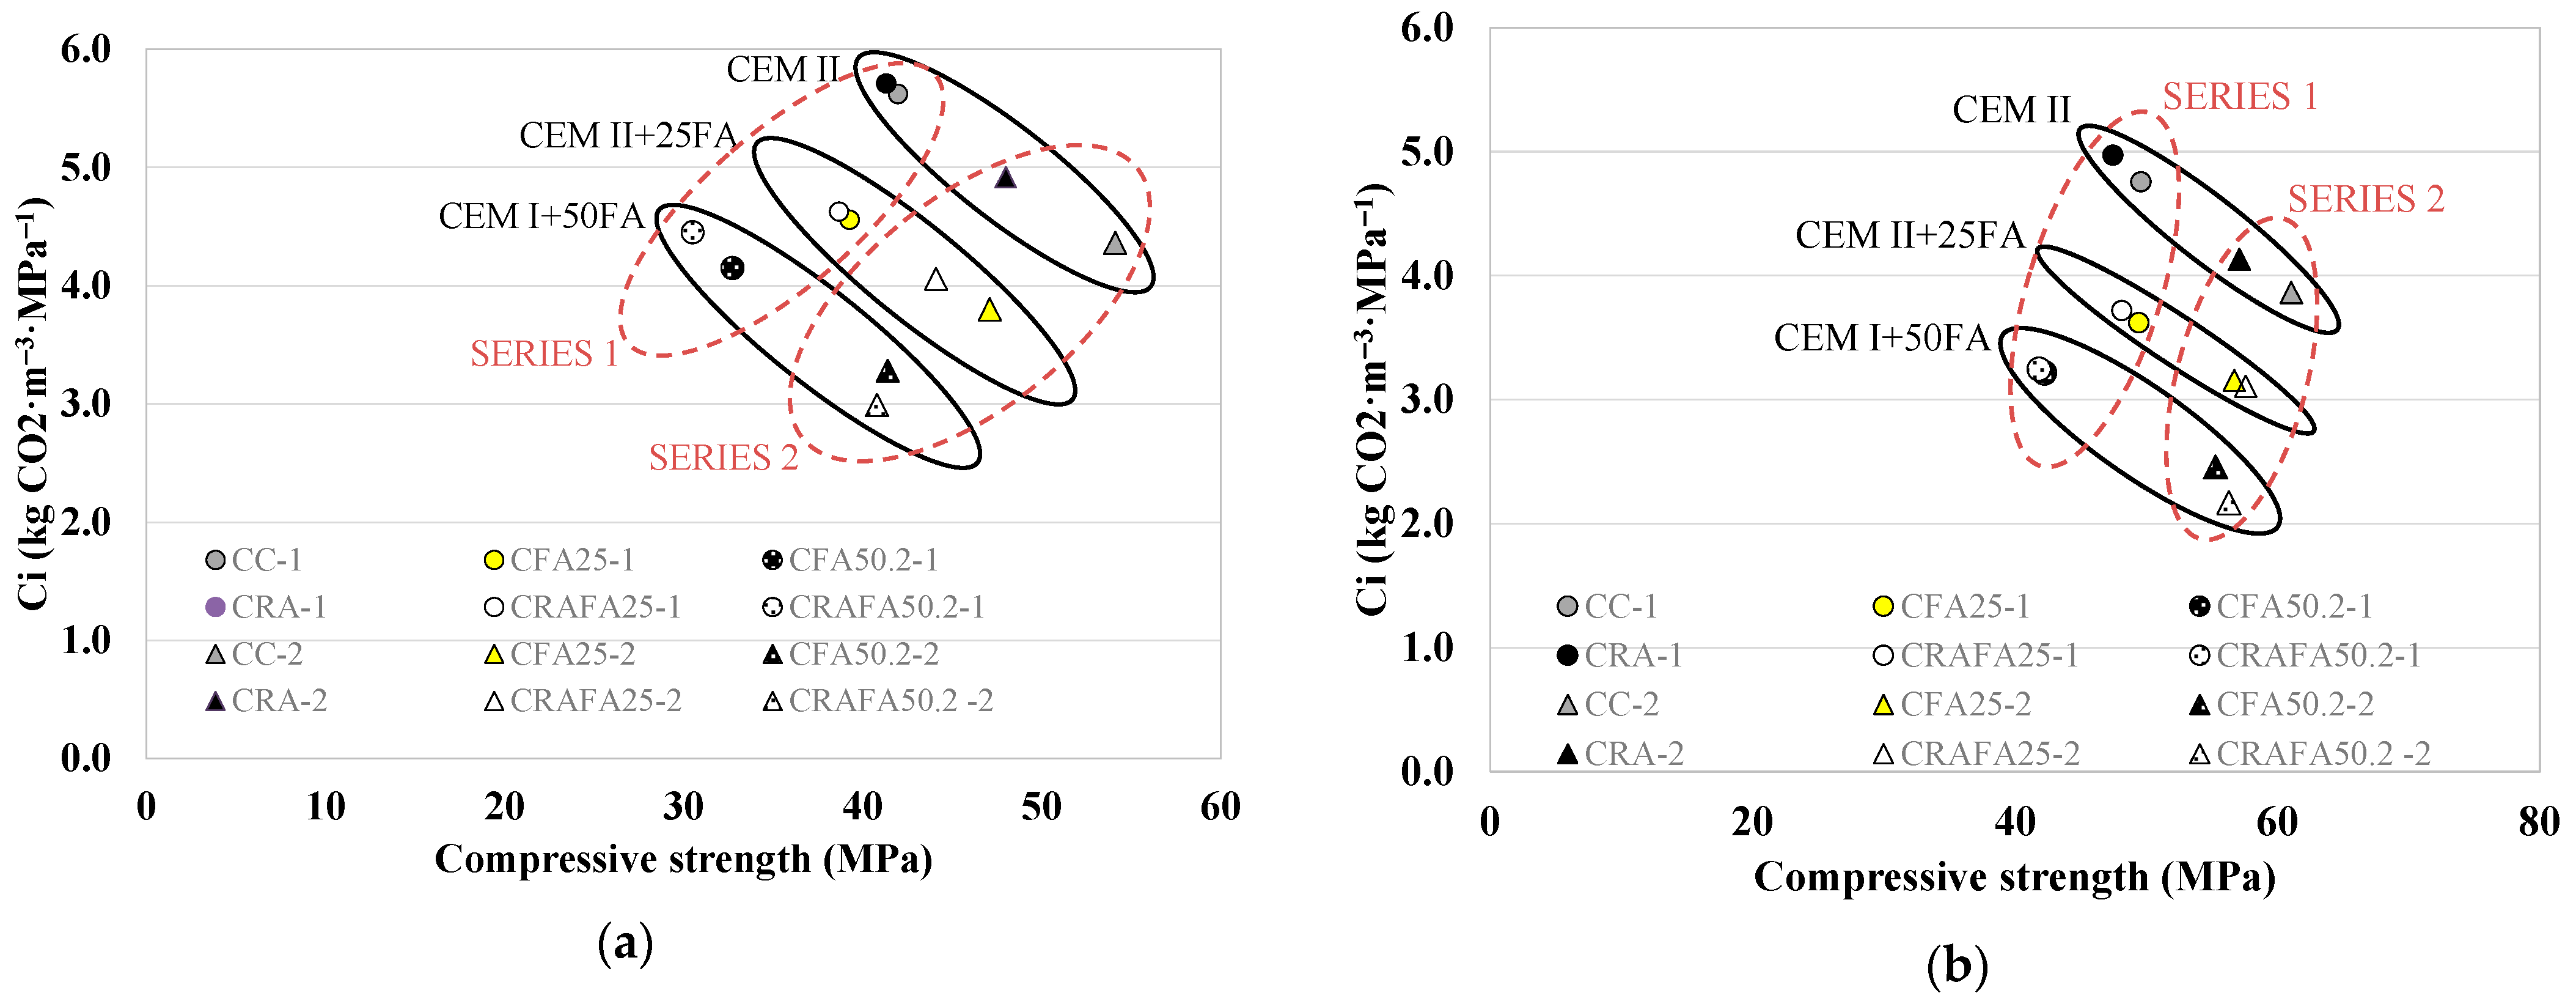
3.3. Eco-Efficiency of Concretes
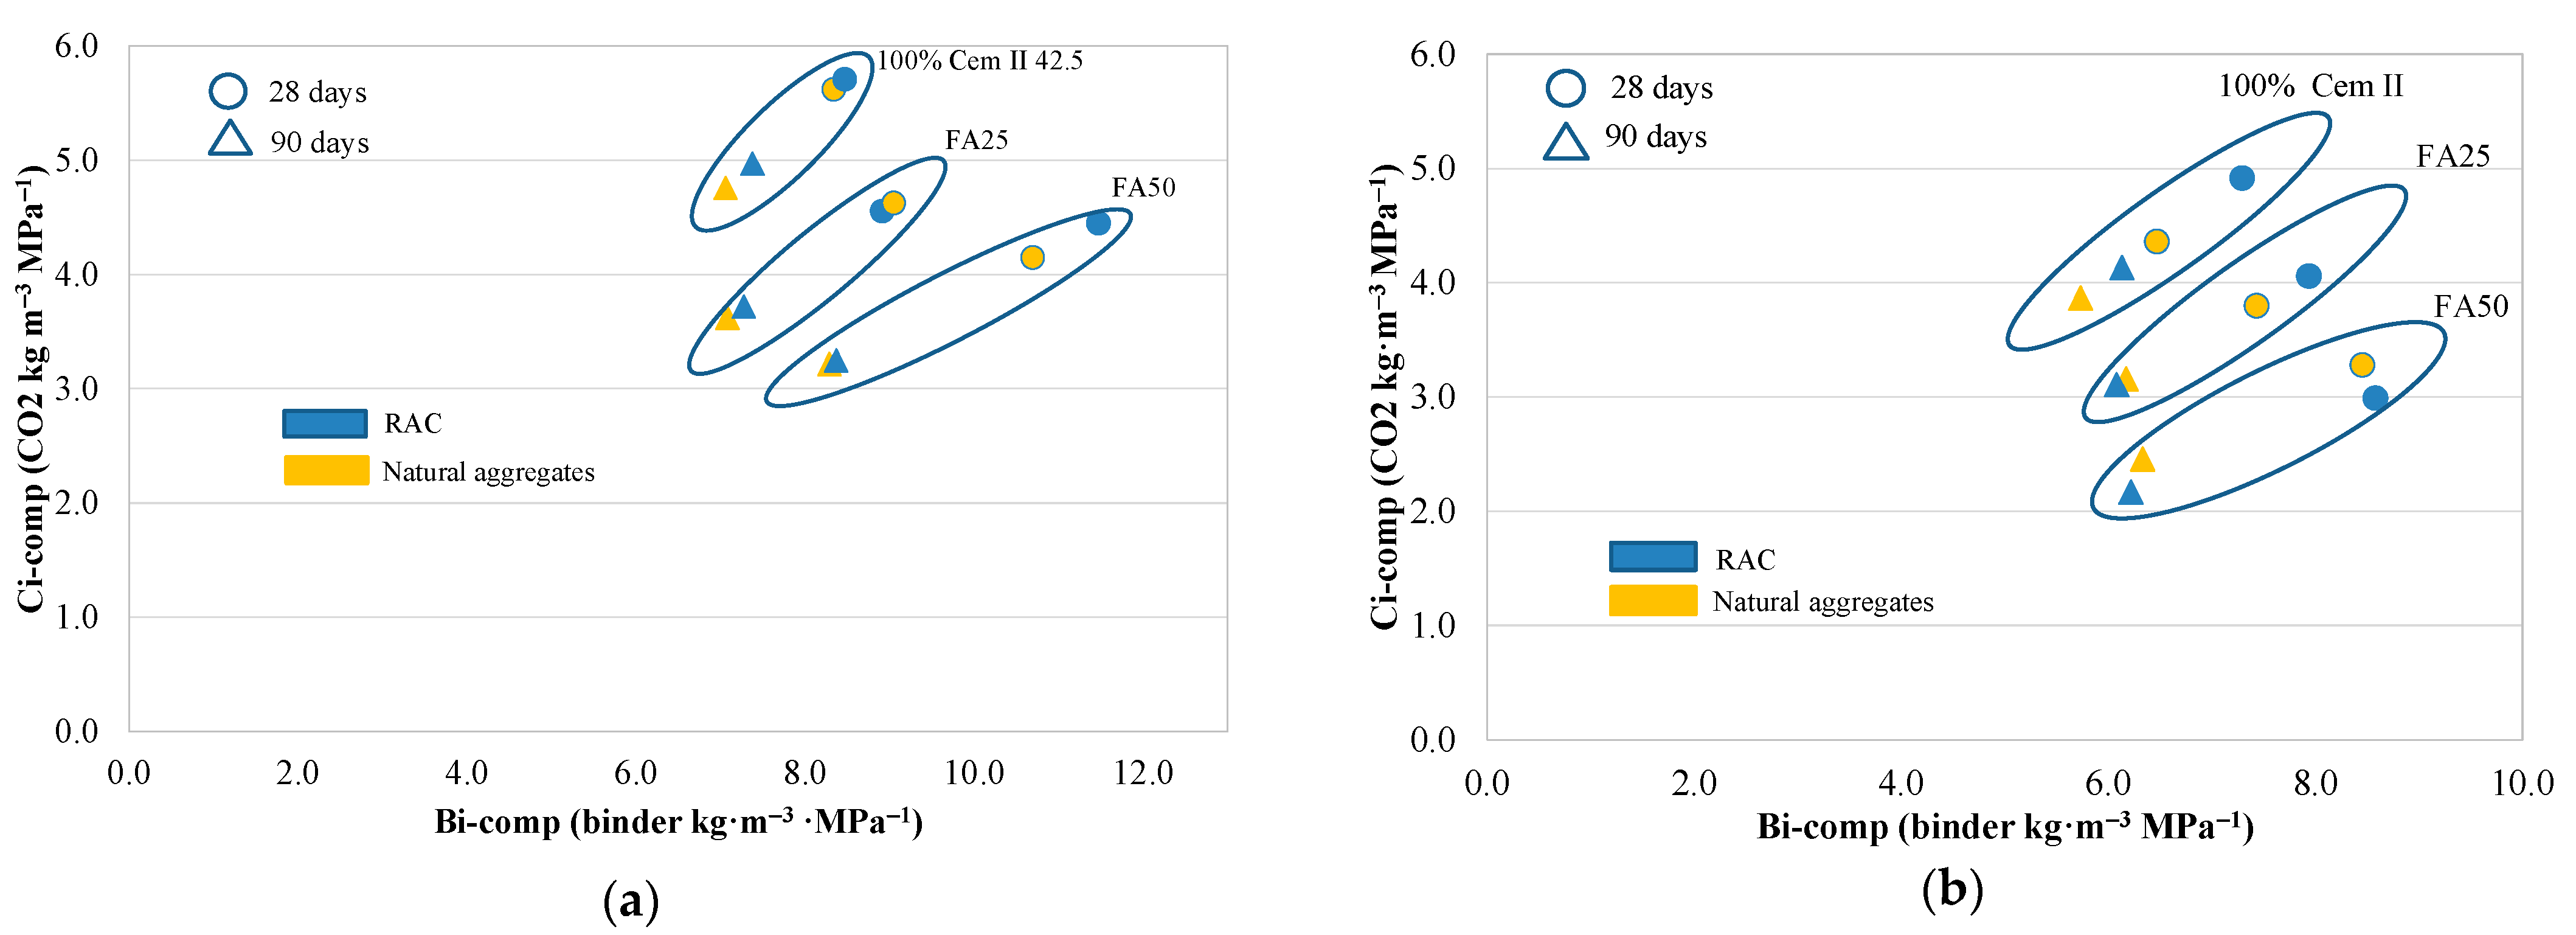
3.3.1. Eco-Efficiency for Mechanical Performance
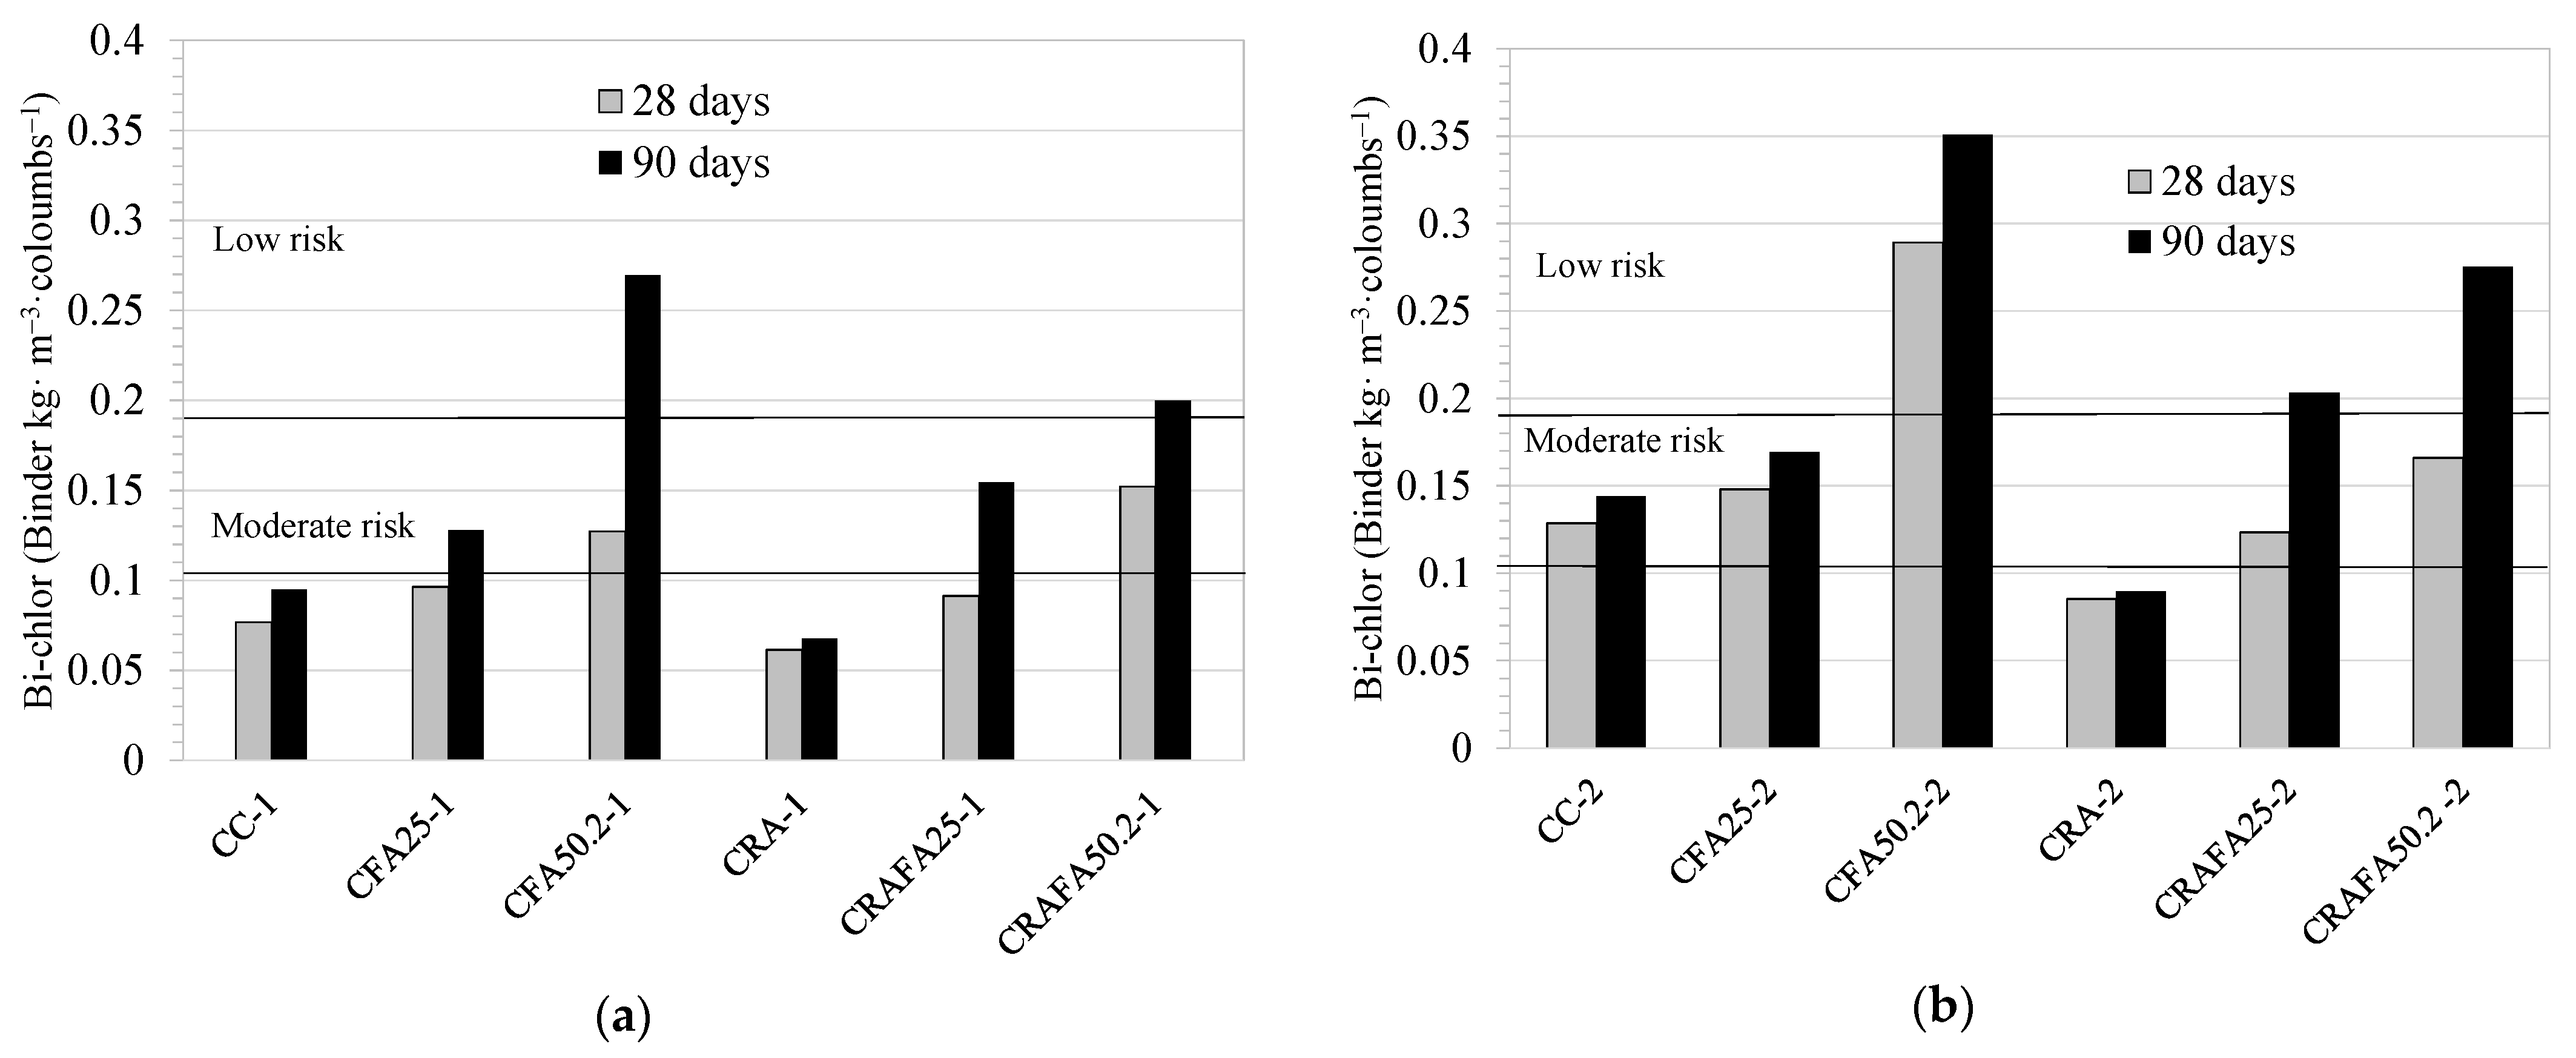
3.3.2. Eco-Efficiency for Durability Performance
4. Discussion
5. Conclusions
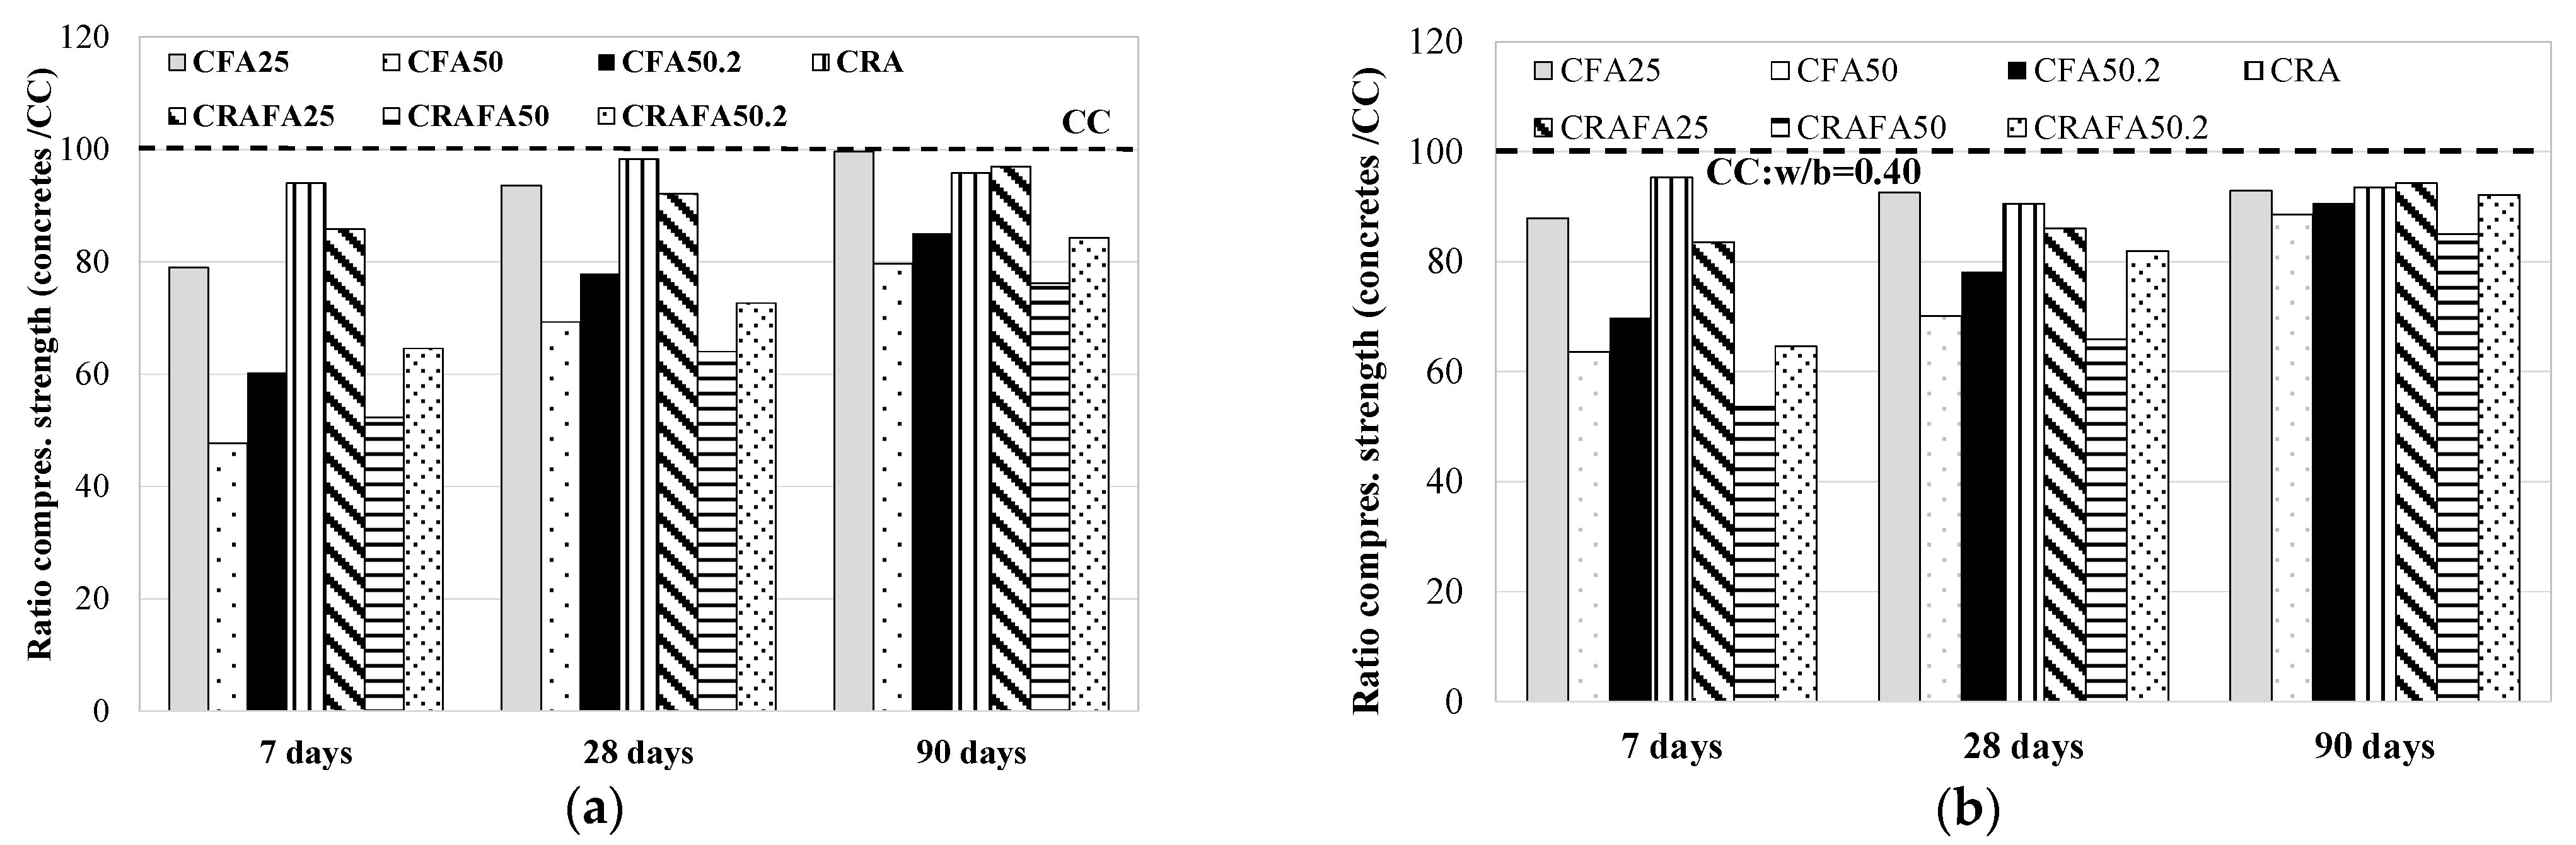
- In concretes produced with a water/cement ratio of 0.50, the use of 50% uncarbonated RCA together with Portland cement did not influence the reduction of compressive strength. In addition, when the concrete was produced with FA, the use of RCA improved the compressive strength of 41.8 MPa compared to concrete employing natural aggregates.
- In concretes produced with a water/cement ratio of 0.40, RCA negatively affected the compressive strength when Portland cement was used for concrete production. However, combining it with FA resulted in the concrete achieving similar compressive strength of 56 MPa to conventional concrete at 90 days.
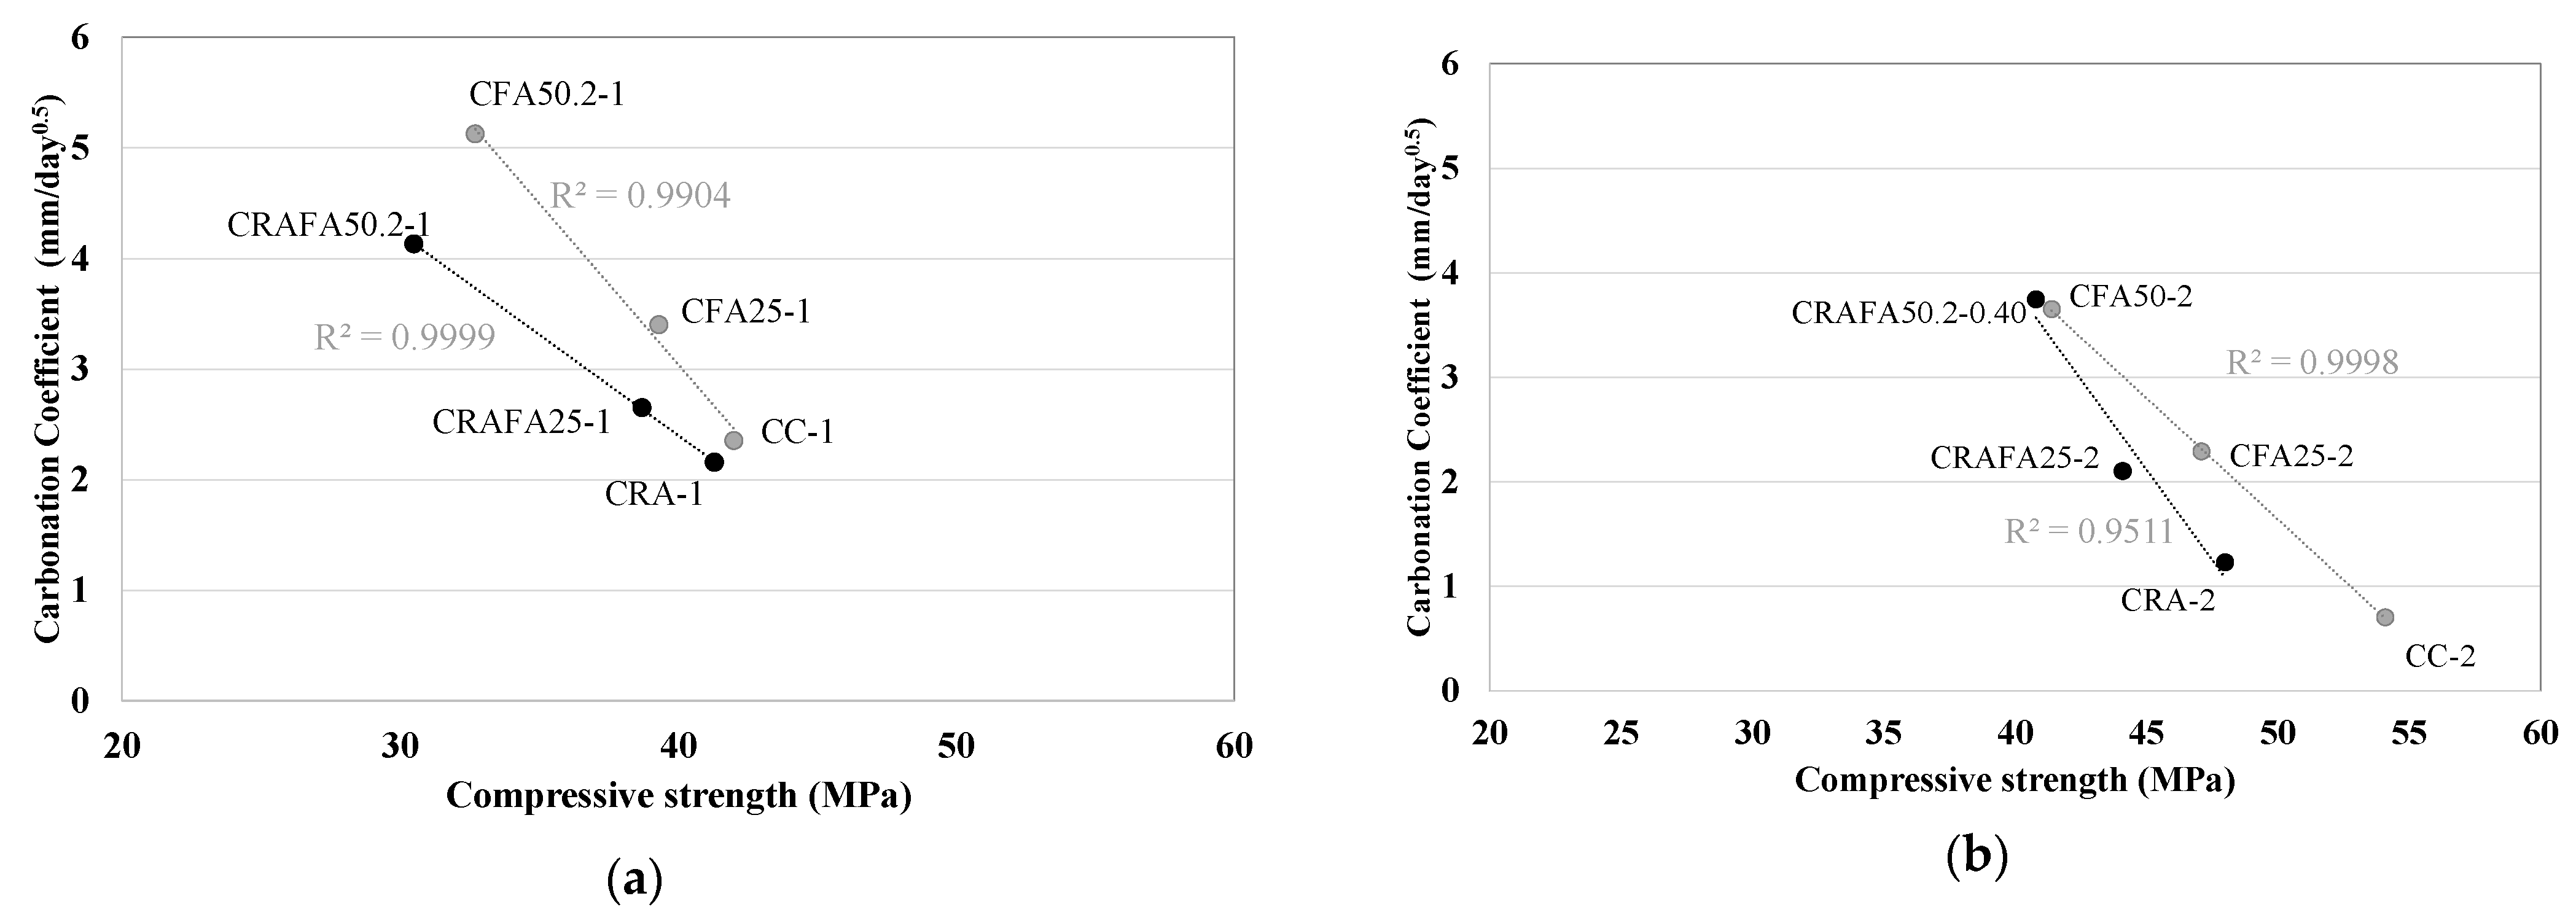
- Concretes with higher compressive strength achieved higher carbonation resistance. While the use of RCA in concrete production increased the carbonation resistance, it was determined that the employment of FA reduced it. Additionally, the carbonation resistance of concretes produced with FA increased when RCA was used in their fabrication.
- The employment of FA improved the chloride ion penetration resistance of the concrete. In addition, the use of RCA together with FA improved the resistance to chloride ion penetration compared to that of the concretes produced with natural aggregates, even more evidently at 90 days of curing.
- Considering the eco-efficiency analysis:
- Based on the mechanical performance at 28 days, the concretes produced with 25% FA and 50% RCA (CRAFA25) achieved the highest eco-efficiency when an effective water/cement ratio of 0.50 and 0.40 was employed. At 90 days of curing, the CRAFA25-1 and CRAFA50.2-2 concretes achieved the highest eco-efficiency.
- Based on the conclusions of carbonation resistance, the CC and CRA concretes achieved the highest durability and the highest value of eco-efficient values. However, for reinforced concrete exposed to the XC4 environment for 100 years of service life (required 35 mm of cover), the CRAFA25-1 and CRAFA50.2-2 concretes also achieved the minimum durability required according to standards and consequently the highest eco-efficiency.
- Based on the results of minimum chloride resistance where the concretes were required to achieve a moderate corrosion risk: the CRAFA50.2-1 and CRAFA50.2-2 concretes, produced with an effective water/cement ratio of 0.50 and 0.40, respectively, had the highest eco-efficiency. The eco-efficiency of the CRAFA25-1 and CRAFA25-2 concretes was also considered valid.
Funding
Institutional Review Board Statement
Informed Consent Statement
Acknowledgments
Conflicts of Interest
References
- Schneider, M. The cement industry on the way to a low-carbon future. Cem. Concr. Res. 2019, 124, 105792. [Google Scholar] [CrossRef]
- Meyer, C. The greening of the concrete industry. Cem. Concr. Compos. 2009, 31, 601–605. [Google Scholar] [CrossRef]
- de Souza, A.M.; de Lima, G.E.S.; Nalon, G.H.; Lopes, M.M.S.; Júnior, A.L.D.O.; Lopes, G.J.R.; de Olivier, M.J.A.; Pedroti, L.G.; Ribeiro, J.C.L.; de Carvalho, J.M.F. Application of the desirability function for the development of new composite eco-efficiency indicators for concrete. J. Build. Eng. 2021, 40, 102374. [Google Scholar] [CrossRef]
- Damineli, B.L.; Kemeid, F.M.; Aguiar, P.S.; John, V.M. Measuring the eco-efficiency of cement use. Cem. Concr. Compos. 2010, 32, 555–562. [Google Scholar] [CrossRef]
- Tam, V.W.Y.; Soomro, M.; Evangelista, A.C.J. A review of recycled aggregate in concrete applications (2000–2017). Constr. Build. Mater. 2018, 172, 272–292. [Google Scholar] [CrossRef]
- European Statistics-Eurostat. Energy, Transport and Environment Statistics 2020 Edition; European Statistics-Eurostat: Luxembourg, 2020. [Google Scholar]
- Marinković, S.; Dragaš, J.; Ignjatović, I.; Tošić, N. Environmental assessment of green concretes for structural use. J. Clean. Prod. 2017, 154, 633–649. [Google Scholar] [CrossRef]
- de Carvalho, J.M.F.; Fontes, W.C.; de Azevedo, C.F.; Brigolini, G.J.; Schmidt, W.; Peixoto, R.A.F. Enhancing the eco-efficiency of concrete using engineered recycled mineral admixtures and recycled aggregates. J. Clean. Prod. 2020, 257, 120530. [Google Scholar] [CrossRef]
- Kurda, R.; de Brito, J.; Silvestre, J.D. Water absorption and electrical resistivity of concrete with recycled concrete aggregates and fly ash. Cem. Concr. Compos. 2019, 95, 169–182. [Google Scholar] [CrossRef]
- Kurda, R.; de Brito, J.; Silvestre, J.D. Influence of recycled aggregates and high contents of fly ash on concrete fresh properties. Cem. Concr. Compos. 2017, 84, 198–213. [Google Scholar] [CrossRef]
- Chen, W.; Jin, R.; Xu, Y.; Wanatowski, D.; Li, B.; Yan, L.; Pan, Z.; Yang, Y. Adopting recycled aggregates as sustainable construction materials: A review of the scientific literature. Constr. Build. Mater. 2019, 218, 483–496. [Google Scholar] [CrossRef]
- Pedro, D.; de Brito, J.; Evangelista, L. Influence of the use of recycled concrete aggregates from different sources on structural concrete. Constr. Build. Mater. 2014, 71, 141–151. [Google Scholar] [CrossRef]
- Etxeberria, M.; Mari, A.; Vázquez, E. Recycled aggregate concrete as structural material. Mater. Struct. 2007, 40, 529–541. [Google Scholar] [CrossRef]
- Otsuki, N.; Miyazato, S.-I.; Yodsudjai, W. Influence of Recycled Aggregate on Interfacial Transition Zone, Strength, Chloride Penetration and Carbonation of Concrete. J. Mater. Civ. Eng. 2003, 15, 443–451. [Google Scholar] [CrossRef]
- Guo, H.; Shi, C.; Guan, X.; Zhu, J.; Ding, Y.; Ling, T.-C.; Zhang, H.; Wang, Y. Durability of recycled aggregate concrete—A review. Cem. Concr. Compos. 2018, 89, 251–259. [Google Scholar] [CrossRef]
- Thomas, C.; Setién, J.; Polanco, J.A.; Alaejos, P.; de Juan, M.S. Durability of recycled aggregate concrete. Constr. Build. Mater. 2013, 40, 1054–1065. [Google Scholar] [CrossRef]
- Adessina, A.; Ben Fraj, A.; Barthélémy, J.-F.; Chateau, C.; Garnier, D. Experimental and micromechanical investigation on the mechanical and durability properties of recycled aggregates concrete. Cem. Concr. Res. 2019, 126, 105900. [Google Scholar] [CrossRef]
- Silva, R.; Neves, R.; de Brito, J.; Dhir, R. Carbonation behaviour of recycled aggregate concrete. Cem. Concr. Compos. 2015, 62, 22–32. [Google Scholar] [CrossRef] [Green Version]
- Zeng, X. Progress in the research of carbonation resistance of RAC. Constr. Build. Mater. 2020, 230, 116976. [Google Scholar] [CrossRef]
- Xiao, J.; Lei, B.; Zhang, C. On carbonation behavior of recycled aggregate concrete. Sci. China Ser. E Technol. Sci. 2012, 55, 2609–2616. [Google Scholar] [CrossRef]
- Leemann, A.; Loser, R. Carbonation resistance of recycled aggregate concrete. Constr. Build. Mater. 2019, 204, 335–341. [Google Scholar] [CrossRef]
- Pedro, D.; De Brito, J.; Evangelista, L. Performance of concrete made with aggregates recycled from precasting industry waste: Influence of the crushing process. Mater. Struct. 2015, 48, 3965–3978. [Google Scholar] [CrossRef]
- Chandra, S.; Bendapudi, K. Contribution of Fly ash to the properties of Mortar and Concreteb. Int. J. Earth Sci. Eng. 2011, 4, 1017–1023. [Google Scholar]
- Xu, G.; Shi, X. Characteristics and applications of fly ash as a sustainable construction material: A state-of-the-art review. Resour. Conserv. Recycl. 2018, 136, 95–109. [Google Scholar] [CrossRef]
- Lothenbach, B.; Scrivener, K.; Hooton, R.D. Supplementary cementitious materials. Cem. Concr. Res. 2011, 41, 1244–1256. [Google Scholar] [CrossRef]
- Kocak, Y.; Nas, S. The effect of using fly ash on the strength and hydration characteristics of blended cements. Constr. Build. Mater. 2014, 73, 25–32. [Google Scholar] [CrossRef]
- Malhotra, V.M. Durability of concrete incorporating high-volume of low-calcium (ASTM Class F) fly ash. Cem. Concr. Compos. 1990, 12, 271–277. [Google Scholar] [CrossRef]
- Lam, L.; Wong, Y.L.; Poon, C.S. Effect of Fly Ash and Silica Fume on Compressive Andfracture Behaviors of Concrete. Cem. Concr. Res. 1998, 28, 271–283. [Google Scholar] [CrossRef]
- Dinakar, P.; Reddy, M.K.; Sharma, M. Behaviour of self compacting concrete using Portland pozzolana cement with different levels of fly ash. Mater. Des. 2013, 46, 609–616. [Google Scholar] [CrossRef]
- Kurda, R.; de Brito, J.; Silvestre, J.D. Carbonation of concrete made with high amount of fly ash and recycled concrete aggregates for utilization of CO2. J. CO2 Util. 2019, 29, 12–19. [Google Scholar] [CrossRef]
- Sunayana, S.; Barai, S.V. Partially fly ash incorporated recycled coarse aggregate based concrete: Microstructure perspectives and critical analysis. Constr. Build. Mater. 2021, 278, 122322. [Google Scholar] [CrossRef]
- Faella, C.; Lima, C.; Martinelli, E.; Pepe, M.; Realfonzo, R. Mechanical and durability performance of sustainable structural concretes: An experimental study. Cem. Concr. Compos. 2016, 71, 85–96. [Google Scholar] [CrossRef]
- Kurda, R.; de Brito, J.; Silvestre, J.D. Combined influence of recycled concrete aggregates and high contents of fly ash on concrete properties. Constr. Build. Mater. 2017, 157, 554–572. [Google Scholar] [CrossRef]
- Kim, K.; Shin, M.; Cha, S. Combined effects of recycled aggregate and fly ash towards concrete sustainability. Constr. Build. Mater. 2013, 48, 499–507. [Google Scholar] [CrossRef]
- Kou, S.-C.; Poon, C.S. Long-term mechanical and durability properties of recycled aggregate concrete prepared with the incorporation of fly ash. Cem. Concr. Compos. 2013, 37, 12–19. [Google Scholar] [CrossRef]
- Corinaldesi, V.; Moriconi, G. Influence of mineral additions on the performance of 100% recycled aggregate concrete. Constr. Build. Mater. 2009, 23, 2869–2876. [Google Scholar] [CrossRef]
- Yang, H.F.; Deng, Z.H.; Li, X.L. Microscopic Mechanism Study on Carbonation Resistance of Recycled Aggregate Concrete. Adv. Mater. Res. 2011, 194–196, 1001–1006. [Google Scholar] [CrossRef]
- Kou, S.; Poon, C.S. Enhancing the durability properties of concrete prepared with coarse recycled aggregate. Constr. Build. Mater. 2012, 35, 69–76. [Google Scholar] [CrossRef]
- Tian, F.; Hu, W.X.; Cheng, H.M.; Sun, Y.L. Carbonation Depth of Recycled Aggregate Concrete Incorporating Fly Ash. Adv. Mater. Res. 2011, 261–263, 217–222. [Google Scholar] [CrossRef]
- Pelisser, F.; Vieira, A.; Bernardin, A.M. Efficient self-compacting concrete with low cement consumption. J. Clean. Prod. 2018, 175, 324–332. [Google Scholar] [CrossRef]
- de Matos, P.R.; Sakata, R.D.; Prudêncio, L.R. Eco-efficient low binder high-performance self-compacting concretes. Constr. Build. Mater. 2019, 225, 941–955. [Google Scholar] [CrossRef]
- Randl, N.; Steiner, T.; Ofner, S.; Baumgartner, E.; Mészöly, T. Development of UHPC mixtures from an ecological point of view. Constr. Build. Mater. 2014, 67, 373–378. [Google Scholar] [CrossRef] [Green Version]
- Celik, K.; Meral, C.; Gursel, A.P.; Mehta, P.K.; Horvath, A.; Monteiro, P.J.M. Mechanical properties, durability, and life-cycle assessment of self-consolidating concrete mixtures made with blended portland cements containing fly ash and limestone powder. Cem. Concr. Compos. 2015, 56, 59–72. [Google Scholar] [CrossRef] [Green Version]
- Neville, A.M. Properties of Concrete; Pearson: London, UK, 2011. [Google Scholar]
- Poon, C.; Shui, Z.; Lam, L.; Fok, H.; Kou, S. Influence of moisture states of natural and recycled aggregates on the slump and compressive strength of concrete. Cem. Concr. Res. 2004, 34, 31–36. [Google Scholar] [CrossRef]
- UNE-EN 12350-2. Testing Fresh Concrete—Part 2: Slump Test-Ensayos de Hormigón Fresco. (Parte 2: Ensayo de Asentamiento.); AENOR: Madrid, Spain, 2020. [Google Scholar]
- UNE-EN 12390-2. Testing Hardened Concrete–Part 2: Making and Curing Specimens for Strength Tests. (Ensayos de Hormigón Endurecido-Parte 2. Fabricación y Curado de Probetas para Ensayos de Resistencia); AENOR: Madrid, Spain, 2020. [Google Scholar]
- UNE-EN-12390-3. Testing Hardened Concrete—Part 3: Compressive Strength of Test Specimens. (Ensayos de Hormigón Endurecido. Parte 3. Determinación de la Resistencia a Compresión de Probetas); AENOR: Madrid, Spain, 2020. [Google Scholar]
- GB/T50082-2009. Standard for Test Method of Long Term Performance and Durability of Ordinary Concrete; China Architecture and Building Press: Beijing, China, 2009. [Google Scholar]
- Shah, V.; Bishnoi, S. Carbonation resistance of cements containing supplementary cementitious materials and its relation to various parameters of concrete. Constr. Build. Mater. 2018, 178, 219–232. [Google Scholar] [CrossRef]
- Castellote, M.; Fernandez, L.; Andrade, C.; Alonso, C. Chemical changes and phase analysis of OPC pastes carbonated at different CO2 concentrations. Mater. Struct. 2009, 42, 515–525. [Google Scholar] [CrossRef]
- Hyvert, N.; Sellier, A.; Duprat, F.; Rougeau, P.; Francisco, P. Dependency of C–S–H carbonation rate on CO2 pressure to explain transition from accelerated tests to natural carbonation. Cem. Concr. Res. 2010, 40, 1582–1589. [Google Scholar] [CrossRef]
- ASTM C1202. Standard Test Method for Electrical Indication of Concrete’s Ability to Resist Chloride Ion Penetration; American Society for Testing Materials: West Conshohocken, PA, USA, 2019. [Google Scholar]
- Kubissa, W.; Jaskulski, R.; Chen, J.; Ng, P.-L.; Godlewska, W.; Reiterman, P. Evaluation of Ecological Concrete Using Multi-criteria Ecological Index and Performance Index Approach. Arch. Civ. Eng. Environ. 2019, 12, 97–107. [Google Scholar] [CrossRef] [Green Version]
- Ministry of Presindency; Ministerio de la Presidencia. Codigo Estructural (Structural code-Concrete), Boletín Oficial del Estado, Madrid, España. 2021. Available online: https://www.boe.es/eli/es/rd/2021/06/29/470 (accessed on 3 December 2021).
- Nath, P.; Sarker, P. Effect of Fly Ash on the Durability Properties of High Strength Concrete. Procedia Eng. 2011, 14, 1149–1156. [Google Scholar] [CrossRef] [Green Version]
- Hemalatha, T.; Ramaswamy, A. A review on fly ash characteristics–Towards promoting high volume utilization in developing sustainable concrete. J. Clean. Prod. 2017, 147, 546–559. [Google Scholar] [CrossRef]
- Leemann, A.; Nygaard, P.; Kaufmann, J.; Loser, R. Relation between carbonation resistance, mix design and exposure of mortar and concrete. Cem. Concr. Compos. 2015, 62, 33–43. [Google Scholar] [CrossRef]
- Khunthongkeaw, J.; Tangtermsirikul, S.; Leelawat, T. A study on carbonation depth prediction for fly ash concrete. Constr. Build. Mater. 2006, 20, 744–753. [Google Scholar] [CrossRef]
- Parrott, L. A Review of Carbonation in Reinforced Concrete; British Cement Association; BRE/BCA Report C/1; 1987; Available online: https://trid.trb.org/view.aspx?id=280156 (accessed on 2 December 2021).
- Heede, P.V.D.; De Belie, N. A service life based global warming potential for high-volume fly ash concrete exposed to carbonation. Constr. Build. Mater. 2014, 55, 183–193. [Google Scholar] [CrossRef]
- Etxeberria, M.; Vázquez, E.; Mari, A.; Barra, M. Influence of amount of recycled coarse aggregates and production process on properties of recycled aggregate concrete. Cem. Concr. Res. 2007, 37, 735–742. [Google Scholar] [CrossRef]


| CaO | SiO2 | Fe2O3 | Al2O3 | MgO | SO3 | Na2O | K2O | LOI | |
|---|---|---|---|---|---|---|---|---|---|
| CEM II | 61.8 | 18.3 | 3.3 | 4.1 | 1.4 | 2.9 | 0.1 | 0.8 | 5.1 |
| CEM I | 63.5 | 19.4 | 3.4 | 4.2 | 1.4 | 3.0 | 0.12 | 0.53 | 3.7 |
| FA | 2.3 | 58.4 | 7.3 | 21.6 | 1.9 | 0.2 | 0.9 | 2.1 | 3.1 |
| CEM | FA | W Total | NS | CA1 | CA2 | RCA | Ad. (%) | Slump Test (cm) | |
|---|---|---|---|---|---|---|---|---|---|
| Series 1 | |||||||||
| CC-1 | 350 | - | 192.5 | 900 | 275.2 | 647 | - | 0.50 | 20 |
| CFA25-1 | 262.5 | 87.5 | 192.5 | 867.9 | 275.2 | 647 | - | 0.50 | 19 |
| CFA50-1 | 175 | 175 | 192.5 | 835.9 | 275.2 | 647 | - | 0.50 | 19 |
| CFA50.2-1 | 175 | 175 | 192.5 | 835.9 | 275.2 | 647 | - | 0.50 | 19 |
| CRA-1 | 350 | - | 213.4 | 900 | 137.6 | 323.5 | 400 | 0.50 | 20 |
| CRAFA25-1 | 262.5 | 87.5 | 213.4 | 867.9 | 137.6 | 323.5 | 400 | 0.50 | 20 |
| CRAFA50-1 | 175 | 175 | 213.5 | 835.9 | 137.6 | 323.5 | 400 | 0.50 | 19 |
| CRAFA50.2-1 | 175 | 175 | 213.5 | 835.9 | 137.6 | 323.5 | 400 | 0.50 | 20 |
| Series 2 | |||||||||
| CC-2 | 350 | - | 157.5 | 945.3 | 289.1 | 679.6 | - | 1 | 20 |
| CFA25-2 | 262.5 | 87.5 | 157.5 | 913.3 | 289.1 | 679.6 | - | 1.1 | 16 |
| CFA50-2 | 175 | 175 | 157.5 | 881.2 | 289.1 | 679.6 | - | 1.6 | 21 |
| CFA50.2-2 | 175 | 175 | 157.5 | 881.2 | 289.1 | 679.6 | - | 1.6 | 21 |
| CRA-2 | 350 | - | 180.4 | 945.3 | 144.5 | 339.8 | 425.2 | 1 | 18 |
| CRAFA25-2 | 262.6 | 87.5 | 180.4 | 913.3 | 144.5 | 339.8 | 425.2 | 1.2 | 16 |
| CRAFA50-2 | 175 | 175 | 180.5 | 881.2 | 144.5 | 339.8 | 425.2 | 1.4 | 16 |
| CRAFA50.2-2 | 175 | 175 | 180.5 | 881.2 | 144.5 | 339.8 | 425.2 | 1.4 | 16 |
| Series 1 (Effective w/c 0.50) | Series 2 (Effective w/c 0.40) | |||||
| Compressive Strength (MPa) | Compressive Strength (MPa) | |||||
| 7 Days | 28 Days | 90 Days | 7 Days | 28 Days | 90 Days | |
| CC | 36.7 (0.72) | 42.0 (1.4) | 49.6 (0.8) | 45.1 (0.49) | 53.7 (0.41) | 61.1 (1.7) |
| CFA25 | 29.0 (1.9) | 39.3 (1.7) | 49.4 (1.7) | 39.7 (0.90) | 49.7 (1.53) | 56.7 (2.15) |
| CFA50 | 17.5 (0.8) | 29.1 (0.0) | 39.5 (1.6) | 28.6 (0.05) | 37.6 (0.95) | 54.1 (0.85) |
| CFA50.2 | 22.1 (0.6) | 32.7 (0.0) | 42.2 (0.8) | 31.5 (0.28) | 42 (0.17) | 55.3 (2.2) |
| CRA | 34.5 (2.4) | 41.3 (0.3) | 47.5 (1.0) | 43.0 (0.95) | 48.6 (0.65) | 57.1 (1.45) |
| CRAFA25 | 31.5 (0.13) | 38.7 (0.24) | 48.1 (1.1) | 37.7 (0.39) | 46.2 (2.16) | 57.6 (0.6) |
| CRAFA50 | 19.2 (0.33) | 26.9 (0.98) | 37.8 (0.2) | 24.2 (0.76) | 35.4 (0.58) | 51.95 (1.05) |
| CRAFA50.2 | 23.7 (0.61) | 30.5 (1.9) | 41.8 (1.2) | 29.1 (1.07) | 44.01 (0.76) | 56.3 (1.9) |
| Concrete Type | Carbonation Depth (mm) | Kacc (mm/day0.5) | Knat (mm/year0.5) | Compressive Strength (MPa) | ||||
|---|---|---|---|---|---|---|---|---|
| 0 Day | 7 Day | 14 Day | 0 Day | 7 Day | 14 Day | |||
| Series 1 (effective w/c 0.50) | ||||||||
| CC-1 | 0 | 5.3 | 9.1 | 2.35 | 2.08 | 45.0 | 46.6 | 53.9 |
| CFA25-1 | 0 | 8.9 | 12.8 | 3.4 | 3.01 | 43.0 | 41.7 | 51.8 |
| CFA50.2-1 | 0 | 14.9 | 18.8 | 5.1 | 4.49 | 37.0 | 38.1 | 40.3 |
| CRA-1 | 0 | 6.9 | 7.7 | 2.16 | 1.9 | 44 | 48.6 | 53.4 |
| CRAFA25-1 | 0 | 7.8 | 9.7 | 2.65 | 2.3 | 46 | 53.8 | 54.7 |
| CRAFA50.2-1 | 0 | 12.5 | 15.0 | 4.13 | 3.65 | 38 | 38.8 | 36.8 |
| Series 2 (effective w/c 0.40) | ||||||||
| CC-2 | 0 | 0.0 | 3.2 | 0.702 | 0.62 | 58 | 59.9 | 61.7 |
| CFA25-2 | 0 | 6.34 | 8.47 | 2.290 | 2.03 | 55 | 56.7 | 59.4 |
| CFA50.2-2 | 0 | 9.44 | 13.74 | 3.651 | 3.24 | 47 | 51.8 | 58.2 |
| CRA-2 | 0 | 0.0 | 5.63 | 1.23 | 1.09 | 53 | 55.7 | 55.1 |
| CRAFA25-2 | 0 | 6.19 | 7.67 | 2.1025 | 1.86 | 55 | 55.1 | 55.7 |
| CRAFA50.2-2 | 0 | 9.03 | 14.29 | 3.7452 | 3.32 | 52 | 50.5 | 52.5 |
| Bi-Carb (Binder kg m−3 mm−1 year0.5) | Ci-Carb (kg CO2 m−3 mm−1 year0.5) | Ci-Chlor-28d (kg CO2 m−3 C−1) | Ci-Chlor-90d (kg CO2 m−3 C−1) | |
|---|---|---|---|---|
| Series 1 (effective w/c 0.50) | ||||
| CC-1 | 167.85 | 113.13 | 0.052 | 0.064 |
| CFA25-1 | 116.14 | 59.38 | 0.049 | 0.065 |
| CFA50.2-1 | 77.81 | 30.19 | 0.049 | 0.105 |
| CRA-1 | 183.12 | 123.42 | 0.041 | 0.046 |
| CRAFA25-1 | 149.17 | 76.27 | 0.047 | 0.079 |
| CRAFA50.2-1 | 95.66 | 37.12 | 0.059 | 0.078 |
| Series 2 (effect. w/c 0.40) | ||||
| CC-2 | 564.51 | 380.48 | 0.087 | 0.097 |
| CFA25-2 | 172.53 | 88.21 | 0.076 | 0.087 |
| CFA50.2-2 | 108.18 | 41.98 | 0.112 | 0.136 |
| CRA-2 | 320.52 | 216.038 | 0.058 | 0.061 |
| CRAFA25-2 | 187.95 | 96.098 | 0.063 | 0.104 |
| CRAFA50.2-2 | 105.49 | 36.77 | 0.058 | 0.096 |
| CC | CFA25 | CFA50.2 | CRA | CRAFA25 | CRAFA50.2 | |
|---|---|---|---|---|---|---|
| Optimum Ci-carb | 67.4 | 51.12 | 38.8 | 67.4 | 51.12 | 38.8 |
| Series 1 (effective w/b = 0.50) | ||||||
| Ratio Ci-carb/optimum Ci-carb | 1.68 | 1.16 | 0.78 | 1.83 | 1.49 | 0.96 |
| Series 2 (effect. w/b = 0.40) | ||||||
| Ratio Ci-carb/optimum Ci-carb | 5.65 | 1.73 | 1.08 | 3.21 | 1.88 | 1.05 |
| CC | CFA25 | CFA50.2 | CRA | CRAFA25 | CRAFA50.2 | |
|---|---|---|---|---|---|---|
| Optimum Ci-chlor | 0.059 | 0.045 | 0.034 | 0.059 | 0.045 | 0.034 |
| Series 1 (effective w/b = 0.50) | ||||||
| Ratio Ci-chlor/optimum Ci-chlor, 28 days | 0.88 | 1.10 | 1.45 | 0.70 | 1.04 | 1.74 |
| Series 2 (effect. w/b = 0.40) | ||||||
| Ratio Ci-chlor/optimum Ci-chlor, 90 days | 1.47 | 1.69 | 3.30 | 0.98 | 1.41 | 1.90 |
Publisher’s Note: MDPI stays neutral with regard to jurisdictional claims in published maps and institutional affiliations. |
© 2021 by the author. Licensee MDPI, Basel, Switzerland. This article is an open access article distributed under the terms and conditions of the Creative Commons Attribution (CC BY) license (https://creativecommons.org/licenses/by/4.0/).
Share and Cite
Etxeberria, M. Evaluation of Eco-Efficient Concretes Produced with Fly Ash and Uncarbonated Recycled Aggregates. Materials 2021, 14, 7499. https://doi.org/10.3390/ma14247499
Etxeberria M. Evaluation of Eco-Efficient Concretes Produced with Fly Ash and Uncarbonated Recycled Aggregates. Materials. 2021; 14(24):7499. https://doi.org/10.3390/ma14247499
Chicago/Turabian StyleEtxeberria, Miren. 2021. "Evaluation of Eco-Efficient Concretes Produced with Fly Ash and Uncarbonated Recycled Aggregates" Materials 14, no. 24: 7499. https://doi.org/10.3390/ma14247499
APA StyleEtxeberria, M. (2021). Evaluation of Eco-Efficient Concretes Produced with Fly Ash and Uncarbonated Recycled Aggregates. Materials, 14(24), 7499. https://doi.org/10.3390/ma14247499