
Evaluation of the Behavior of Carbon Short Fiber Reinforced Concrete (CSFRC) Based on a Multi-Sensory Experimental Investigation and a Numerical Multiscale Approach

 , , and
Abstract
1. Introduction
2. Raw Material and Sample Preparation
2.1. Preparation of Miniature Bending Beams for Three-Point Bending Tests
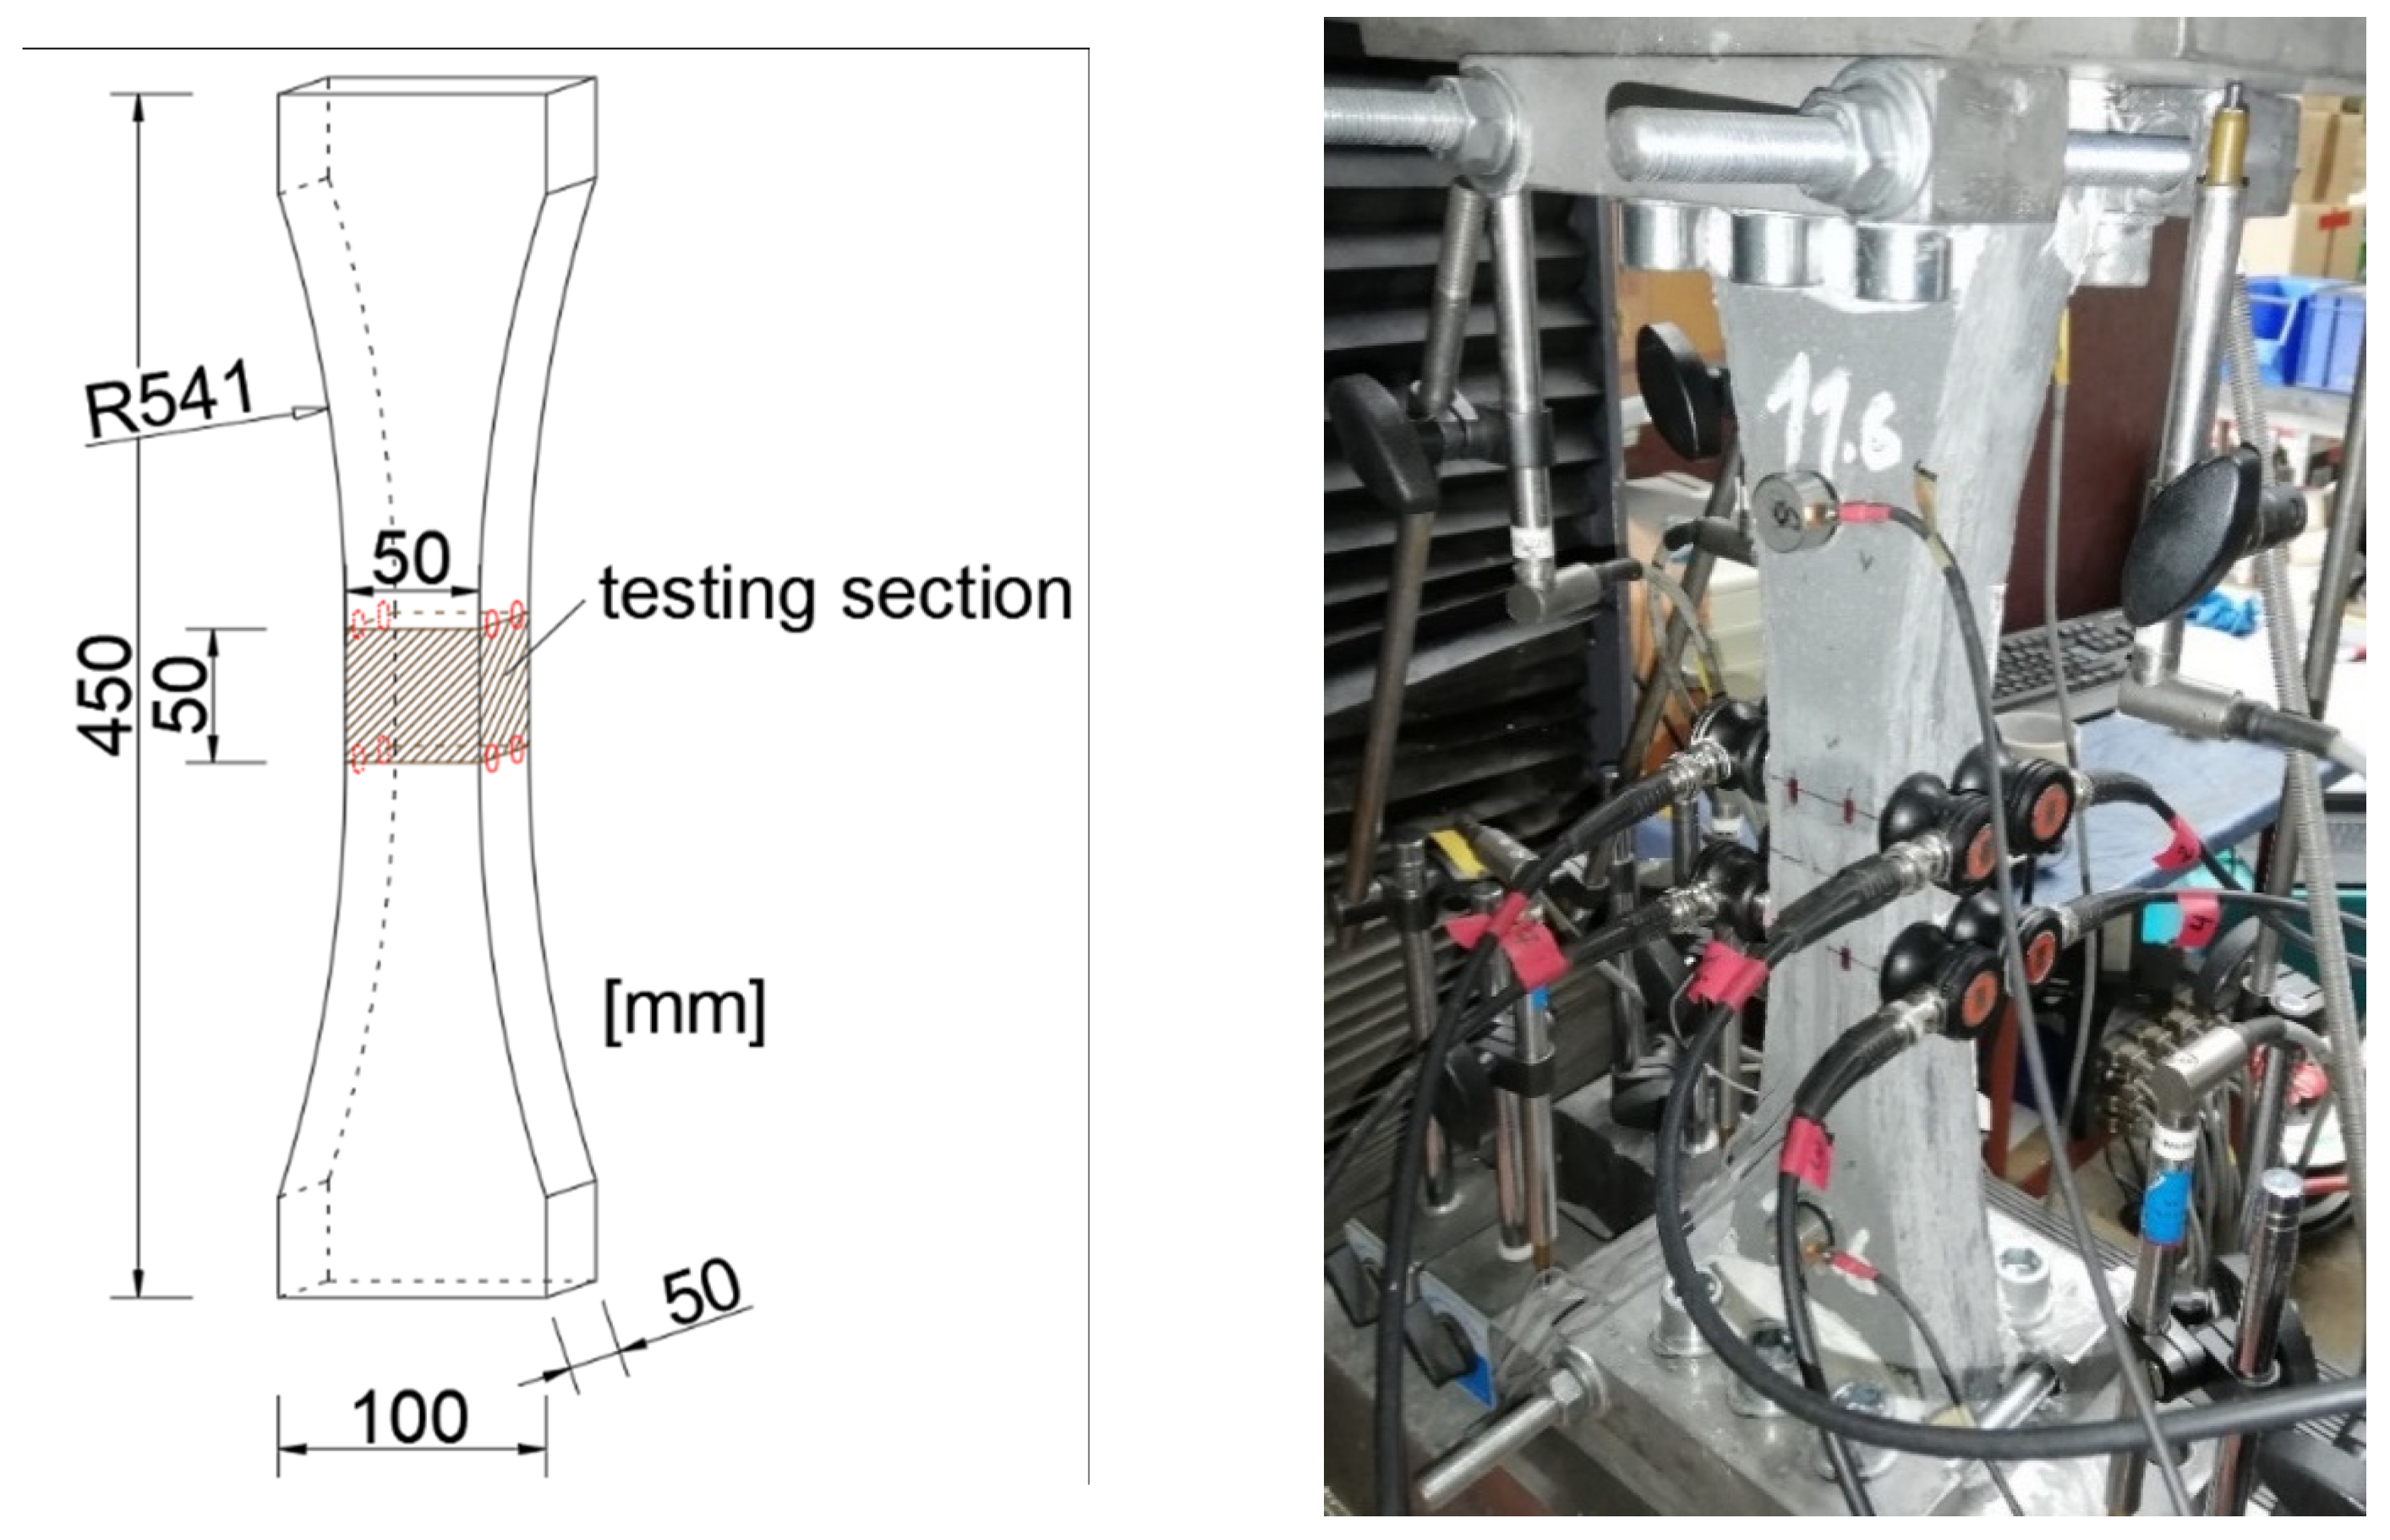
2.2. Macro Scaled Specimen for Uniaxial Tension Tests
3. CT Investigation and Numerical Simulation
3.1. X-ray Computed Tomography
3.1.1. Measurement
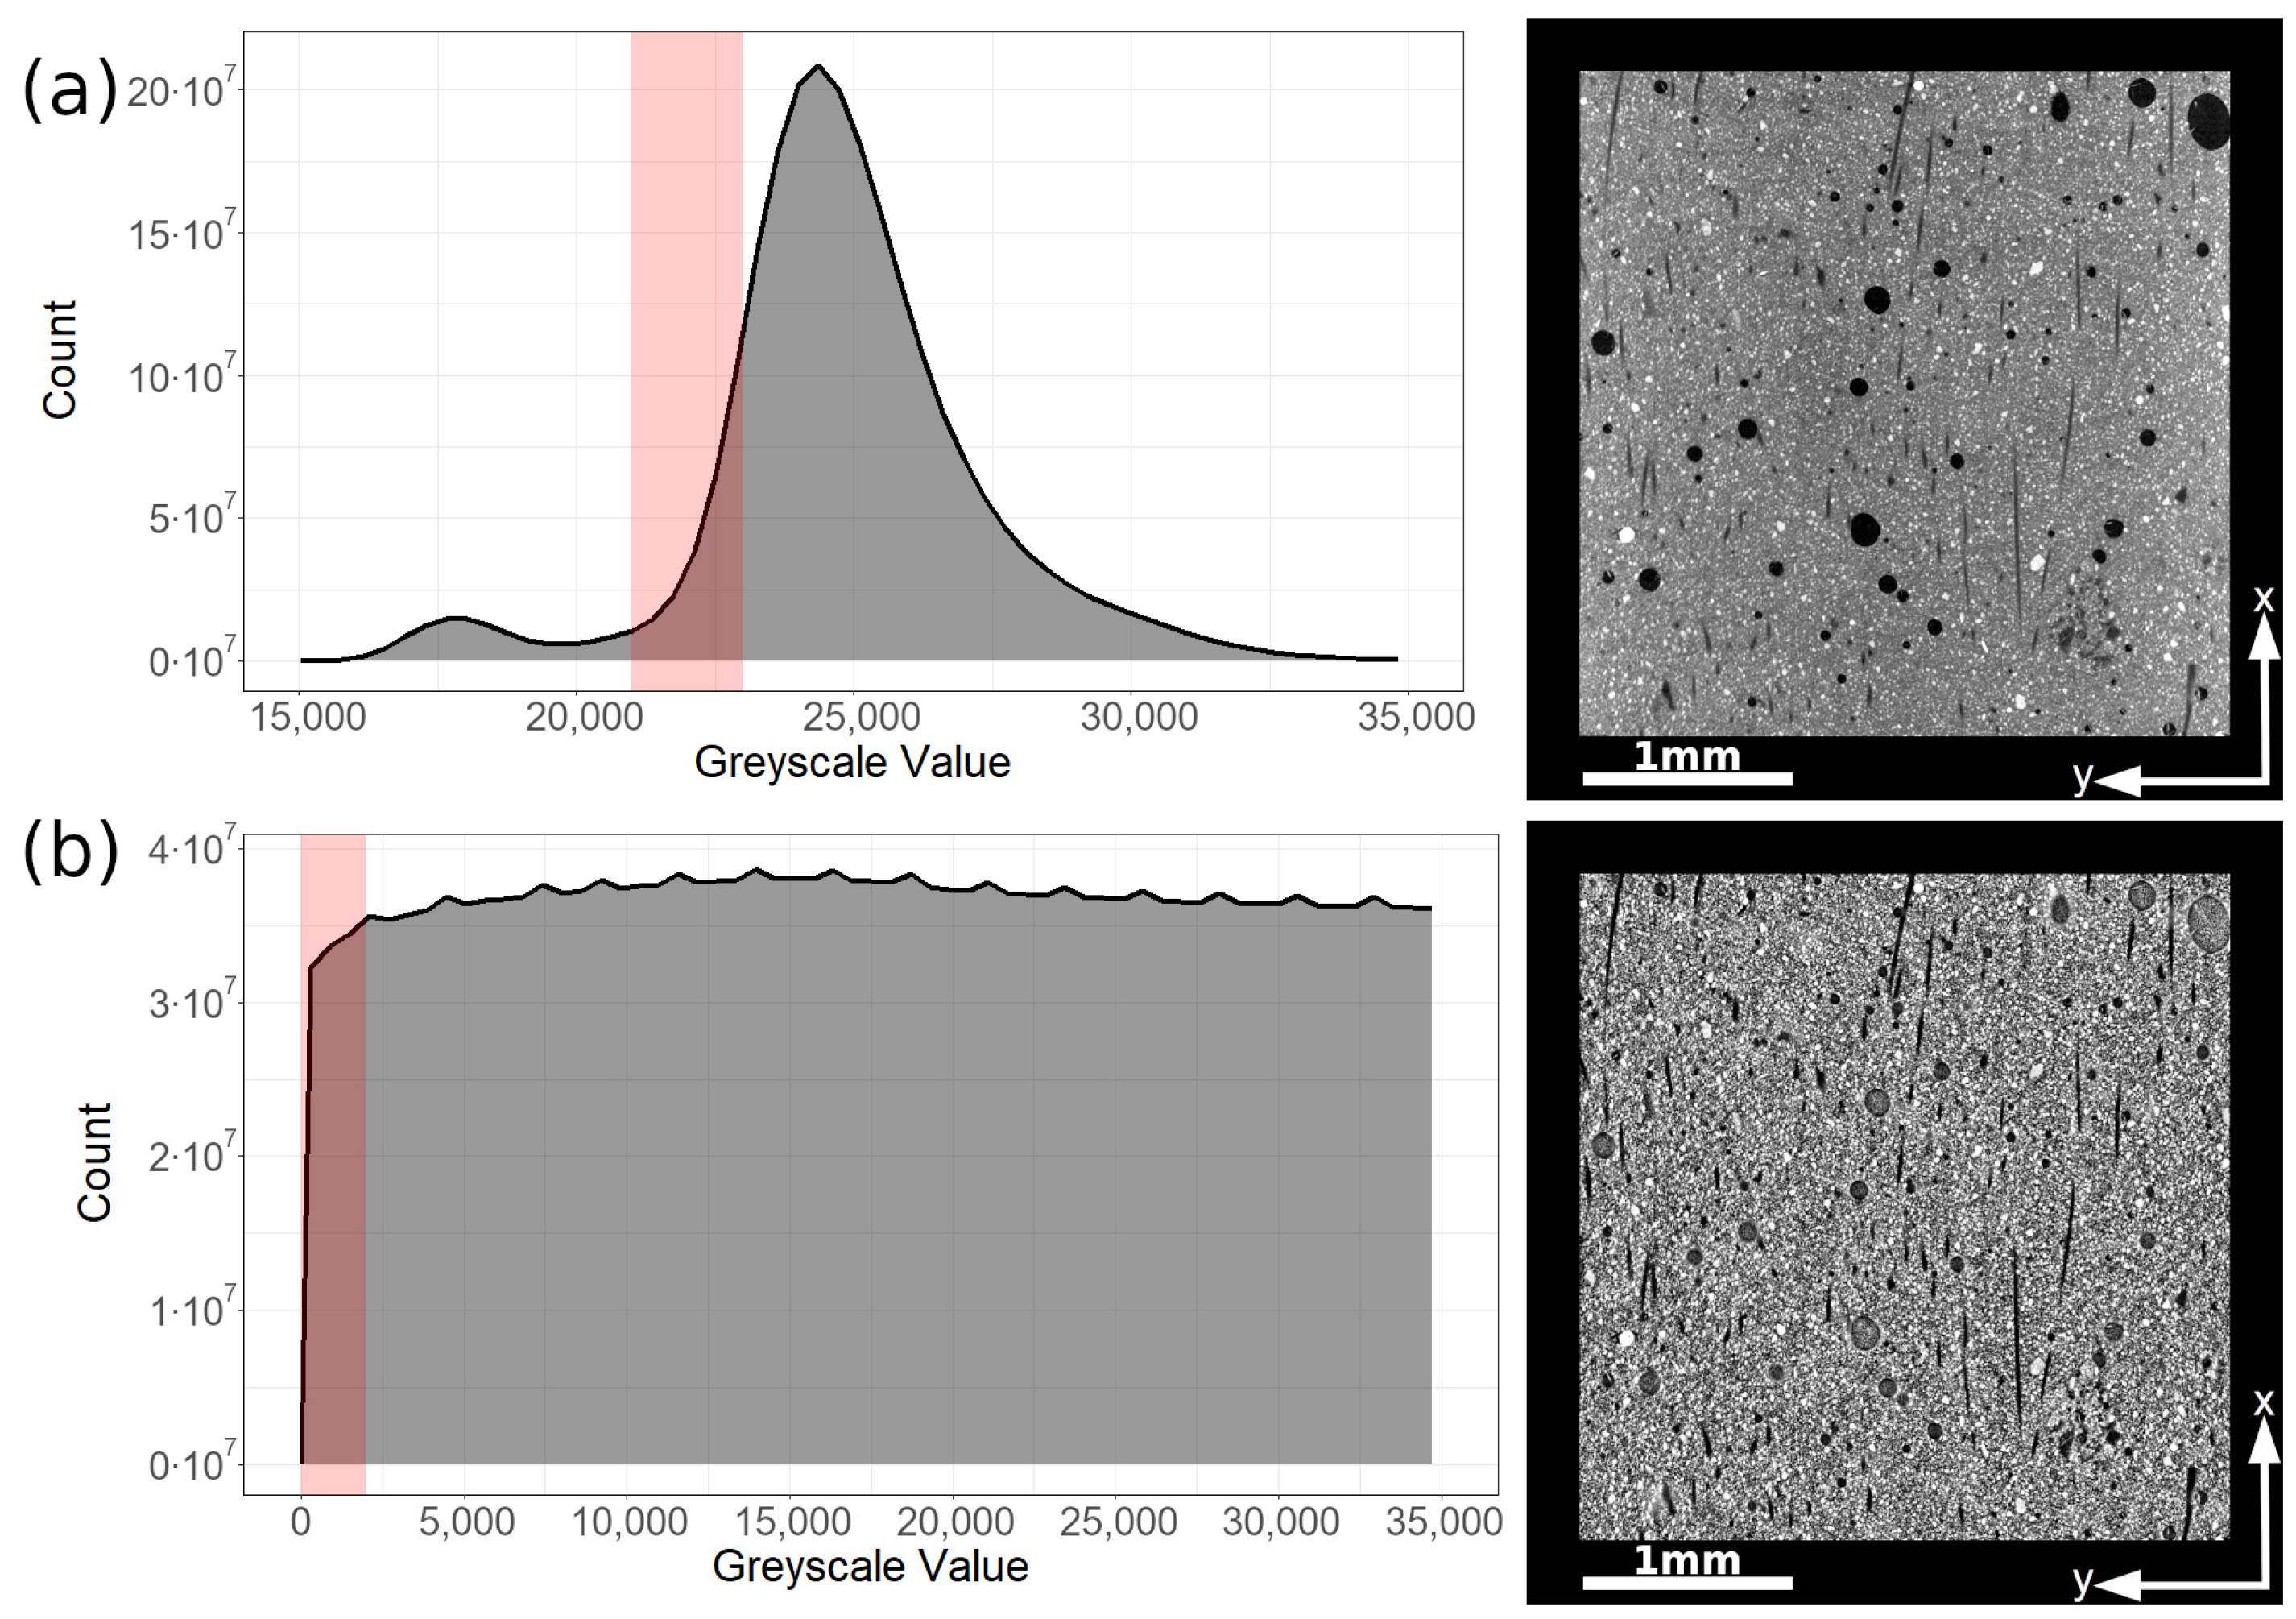
3.1.2. Segmentation Procedure
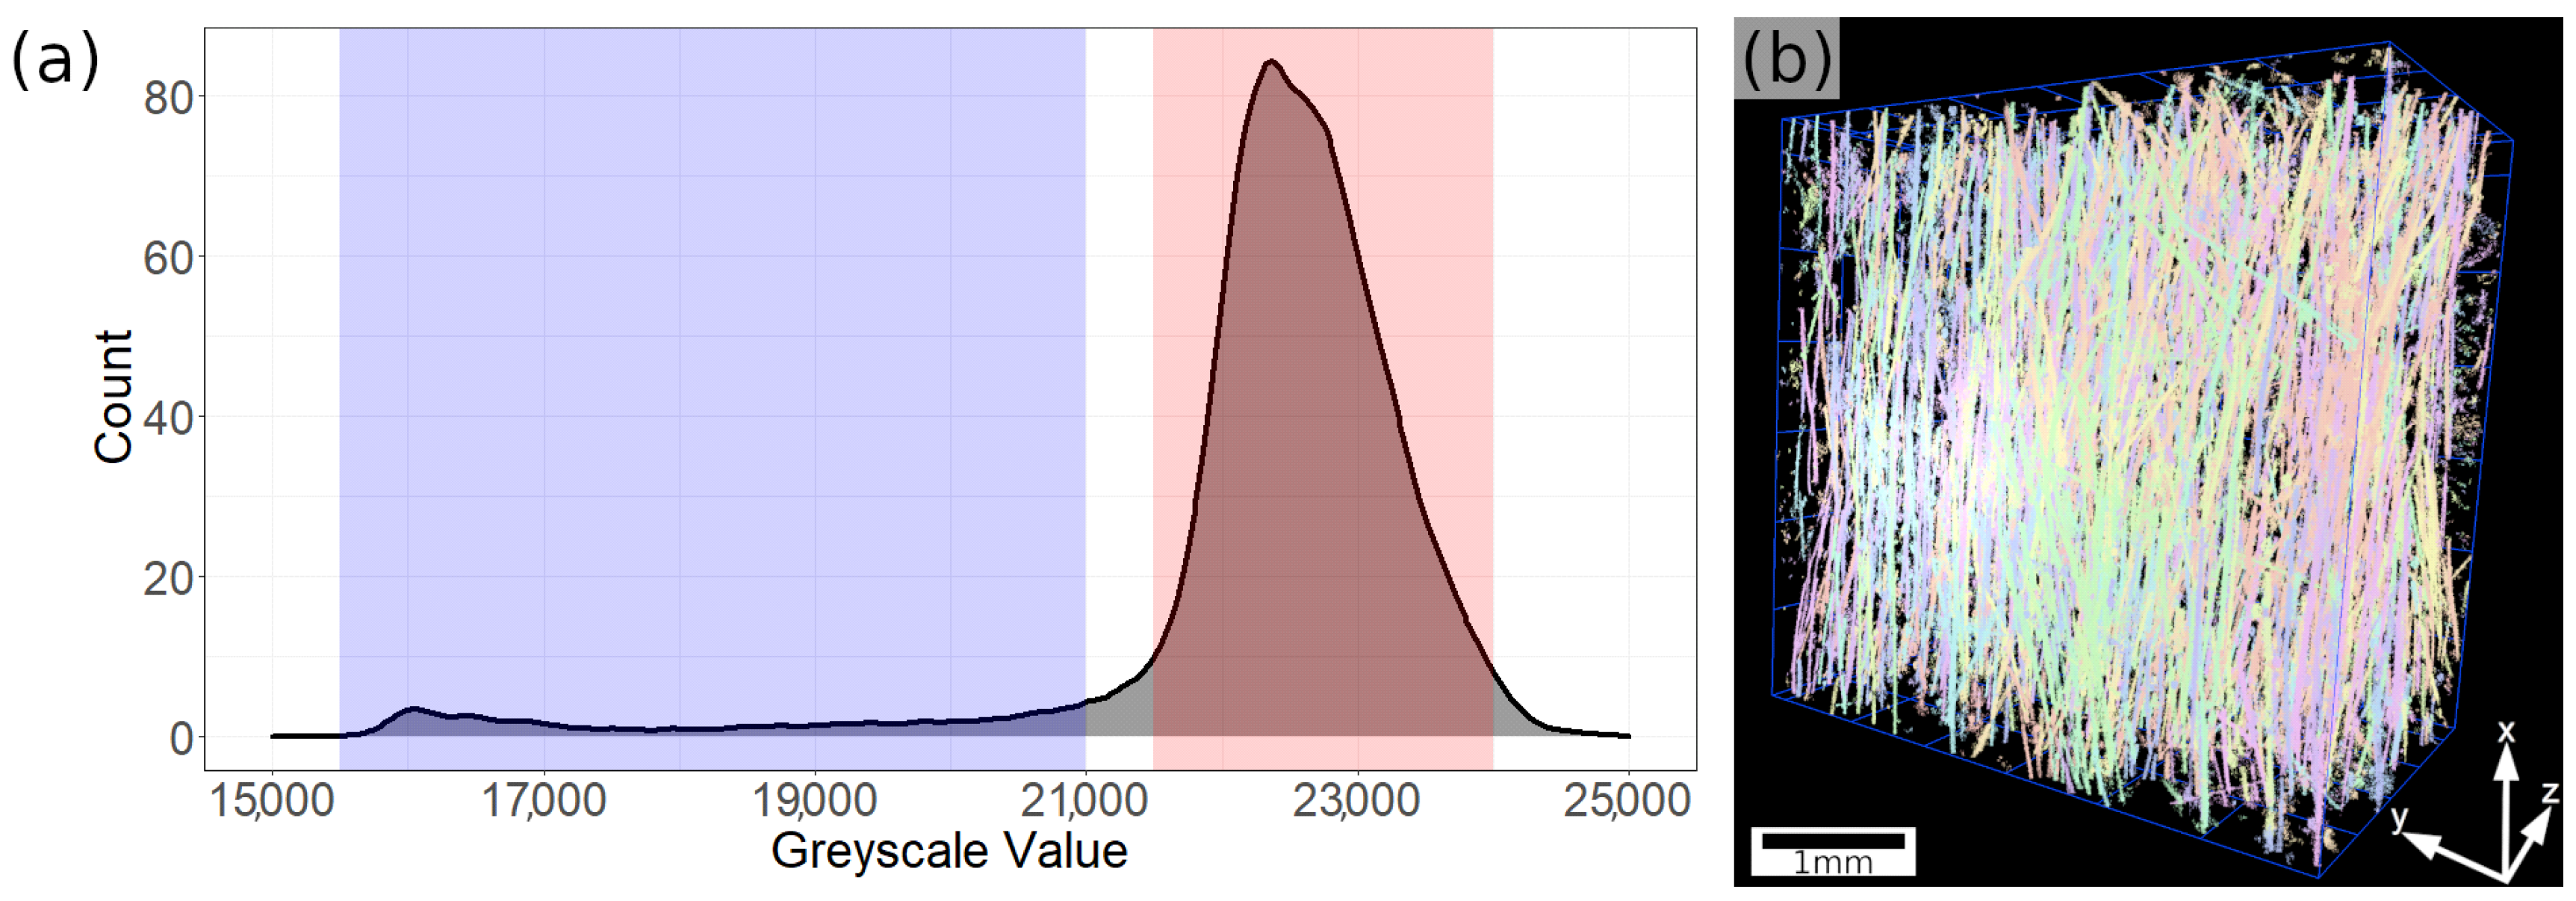
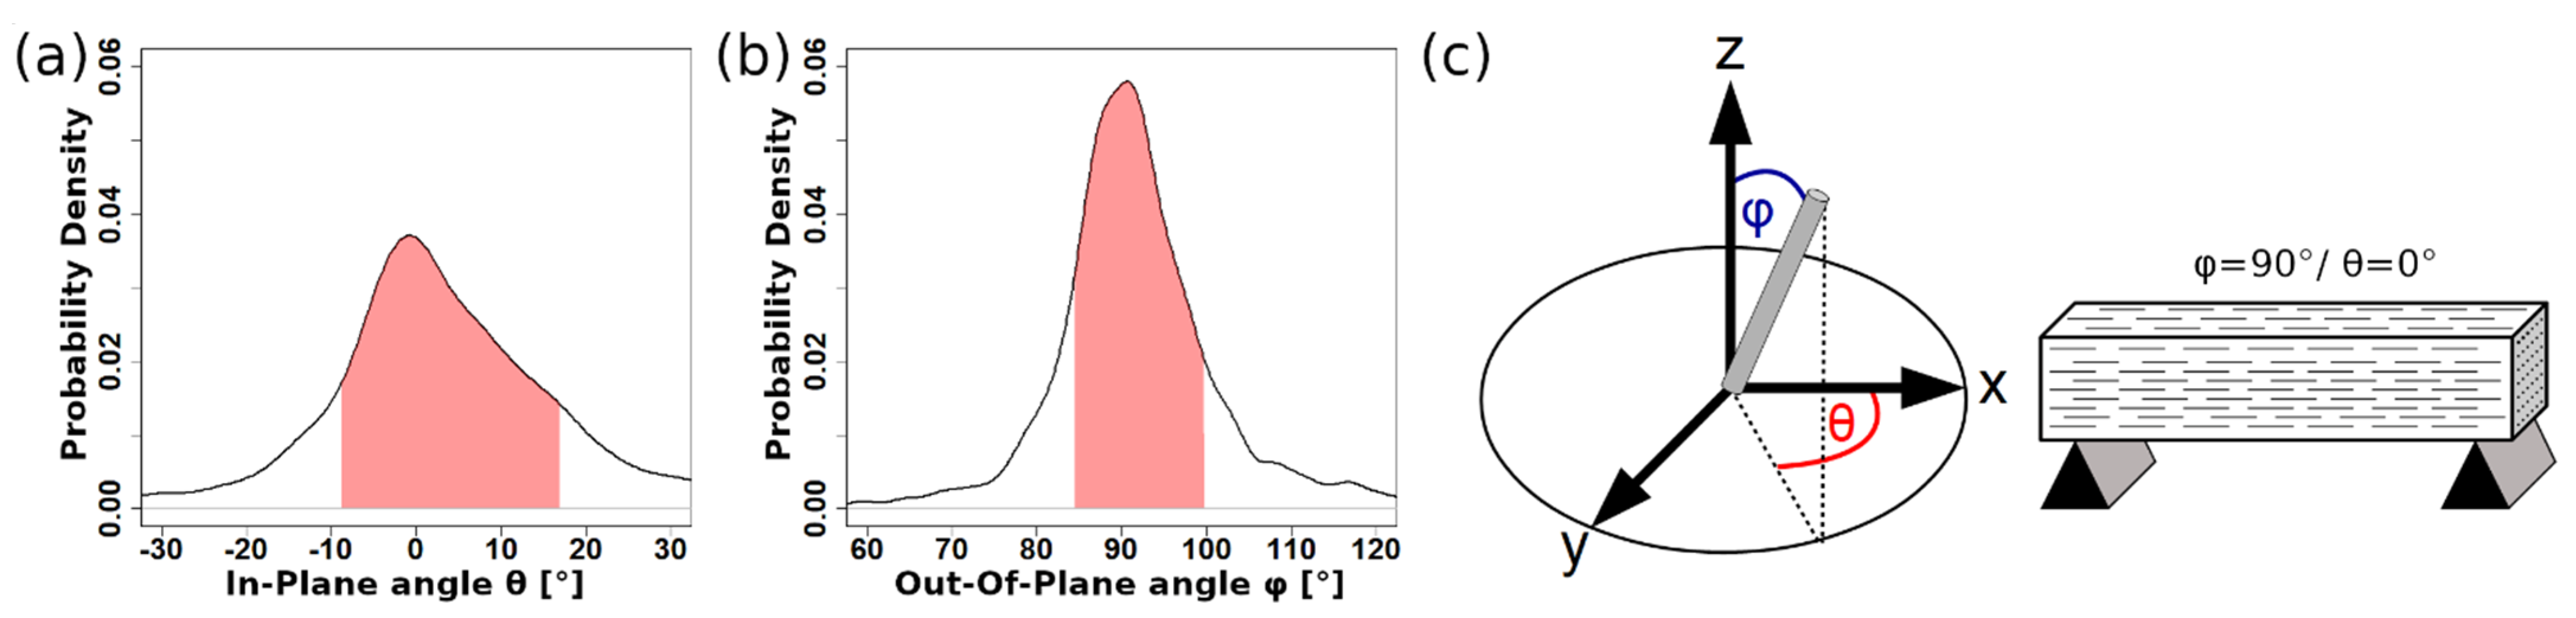
3.1.3. Alignment Analysis
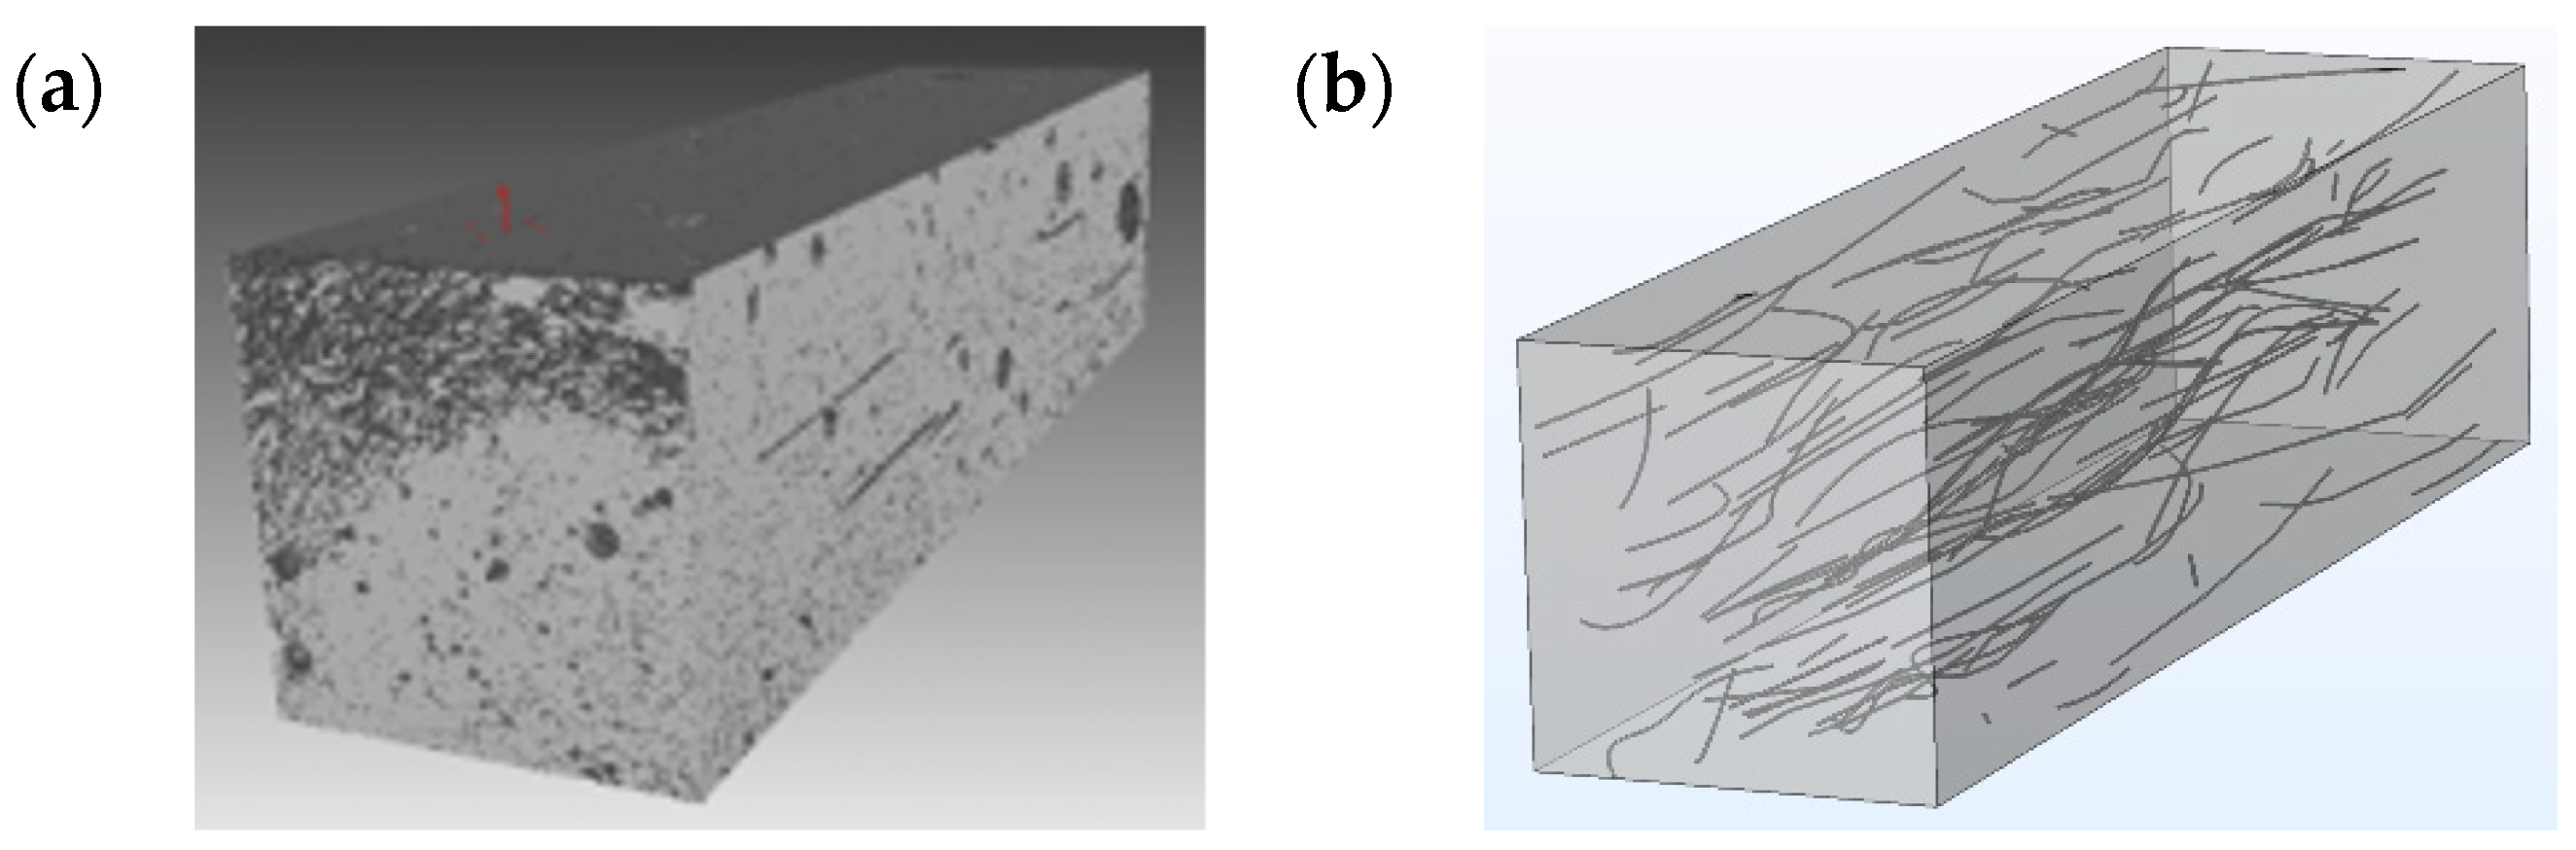
3.2. Numerical Simulations Based on μ-CT Data
3.2.1. Convergence Studies for Resolution
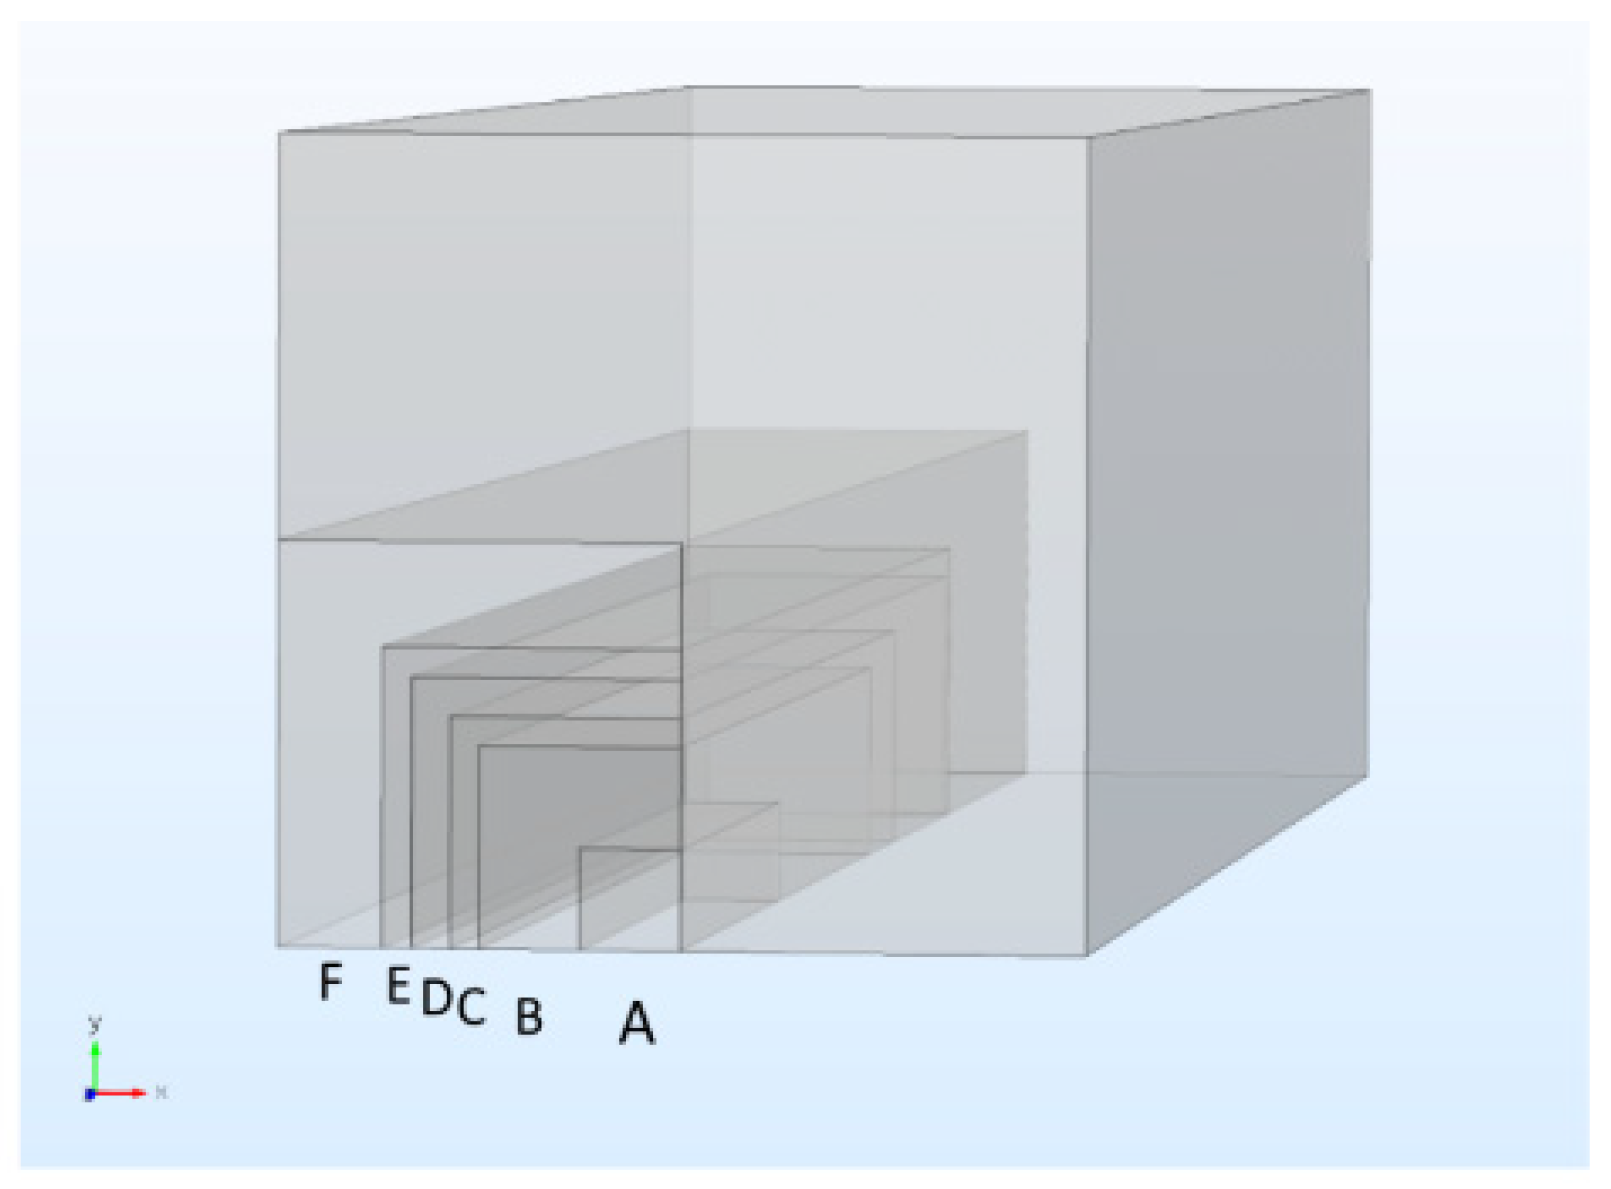
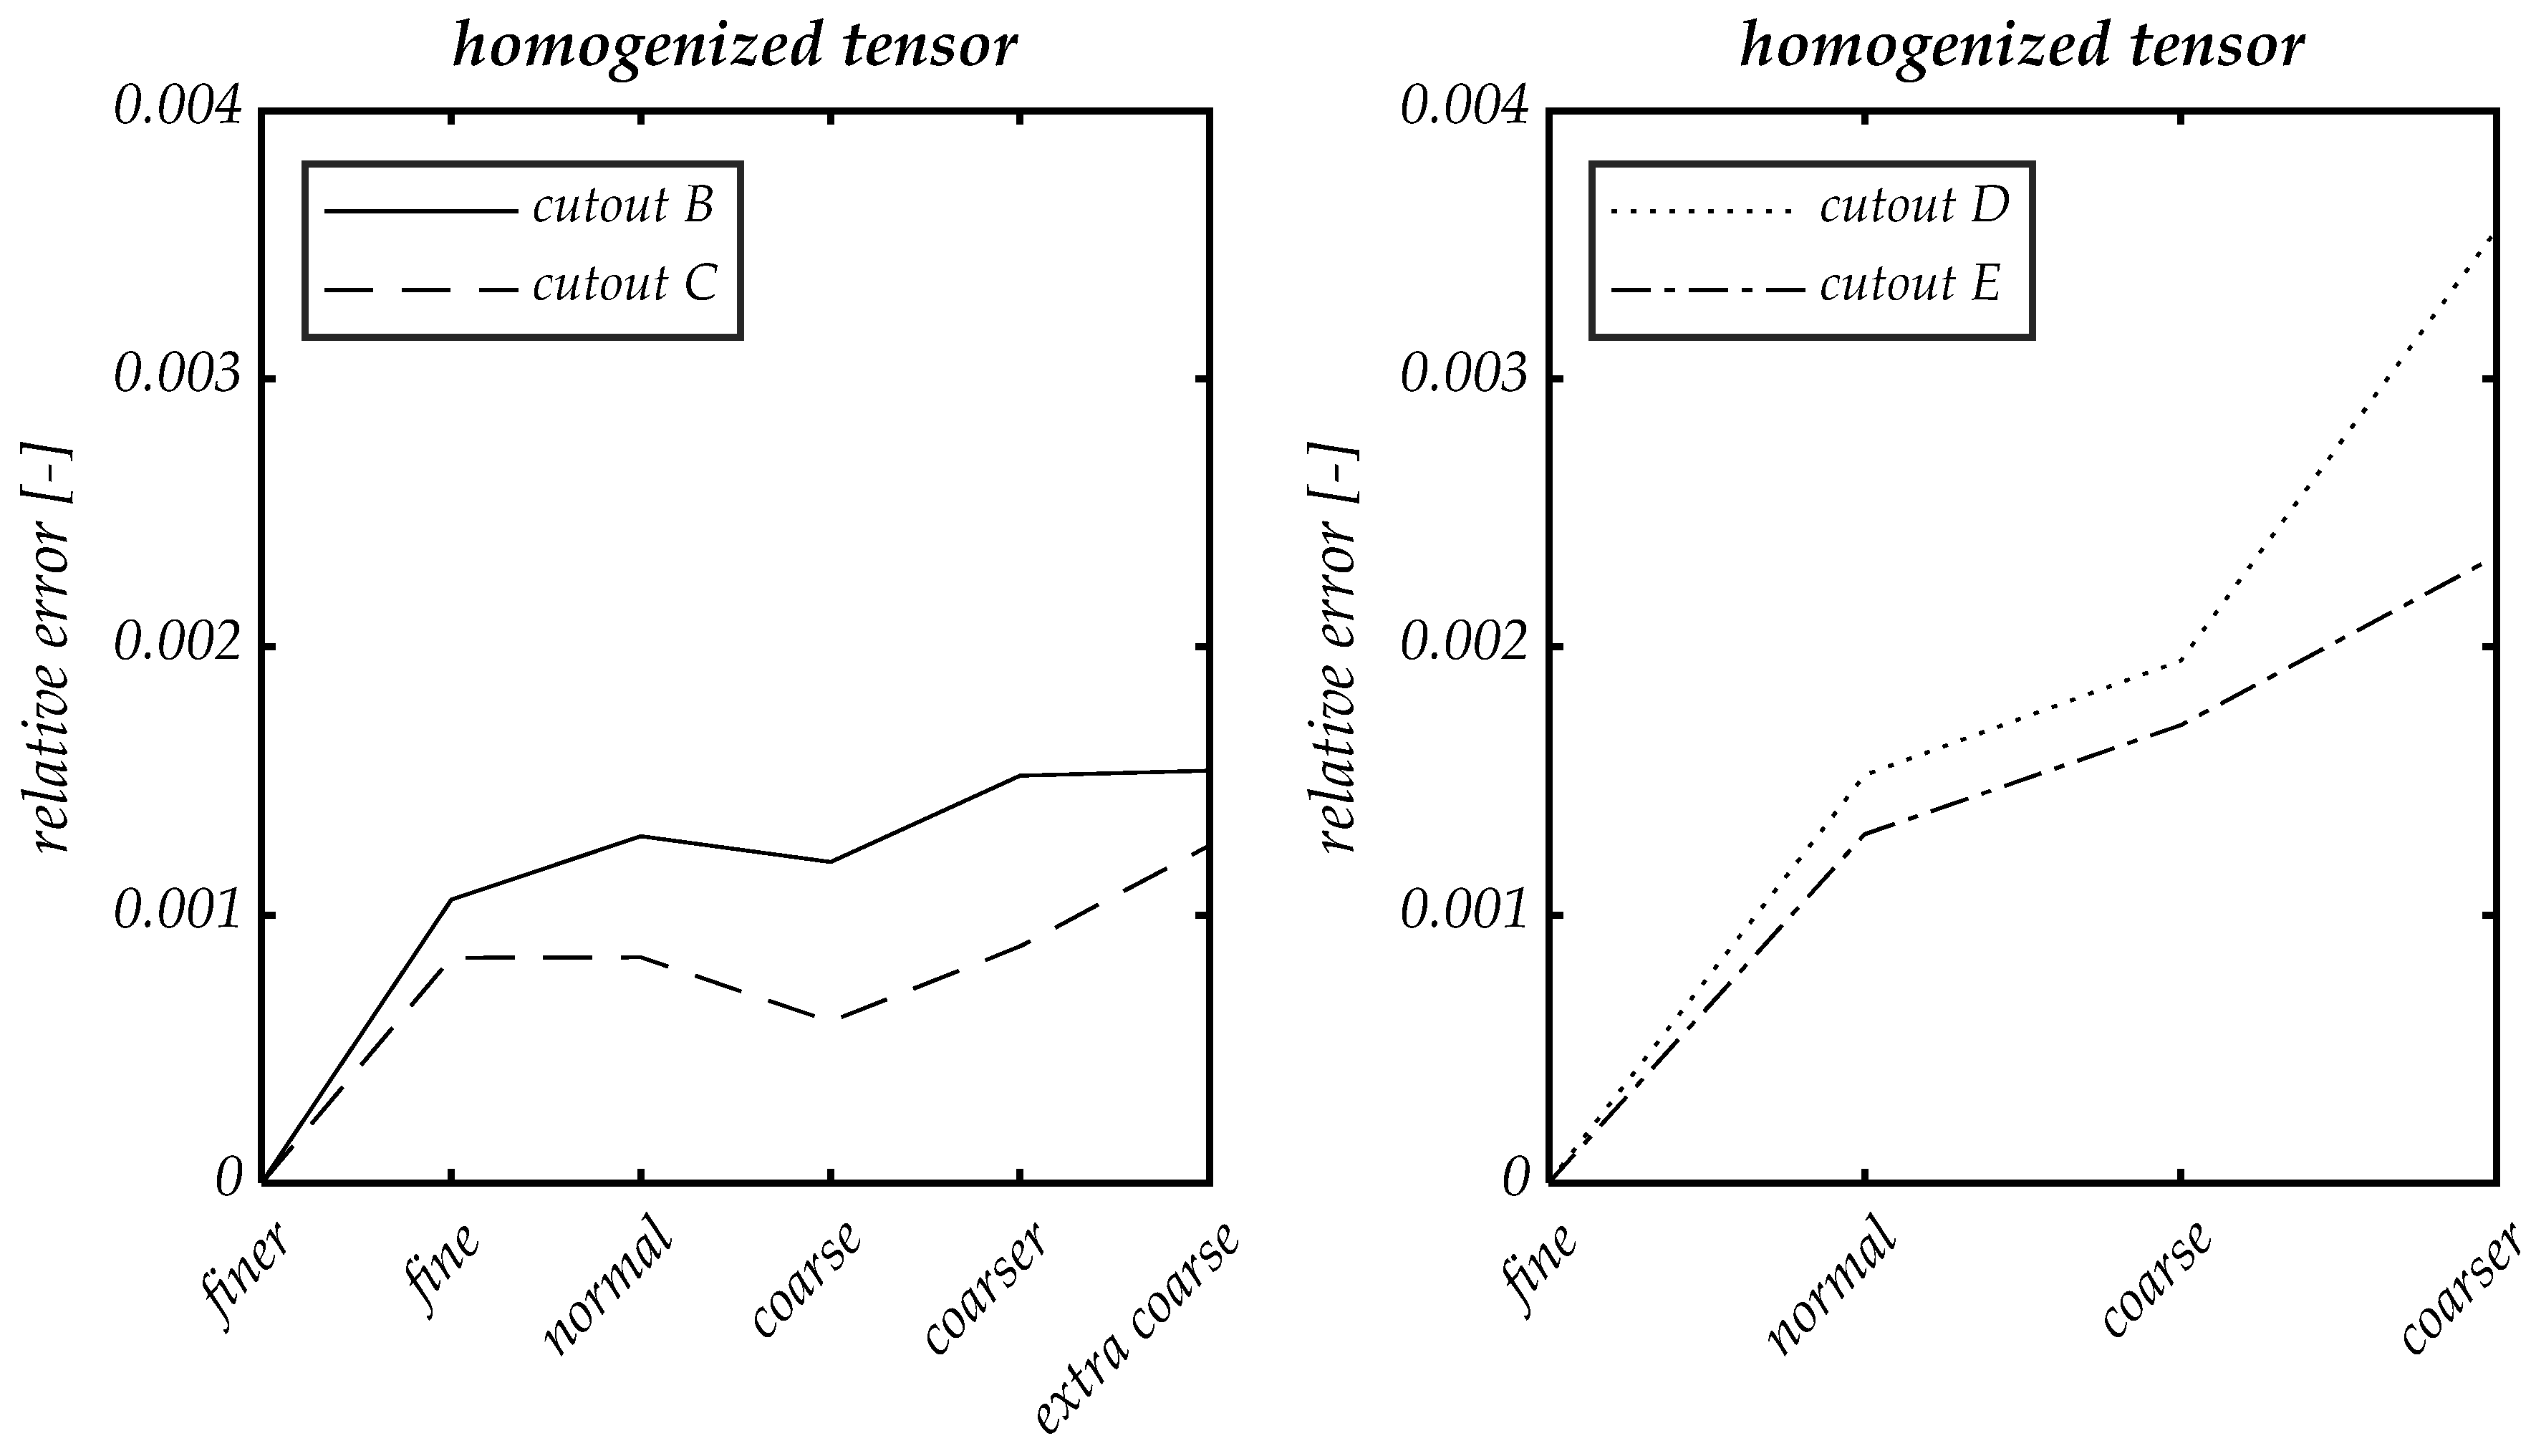
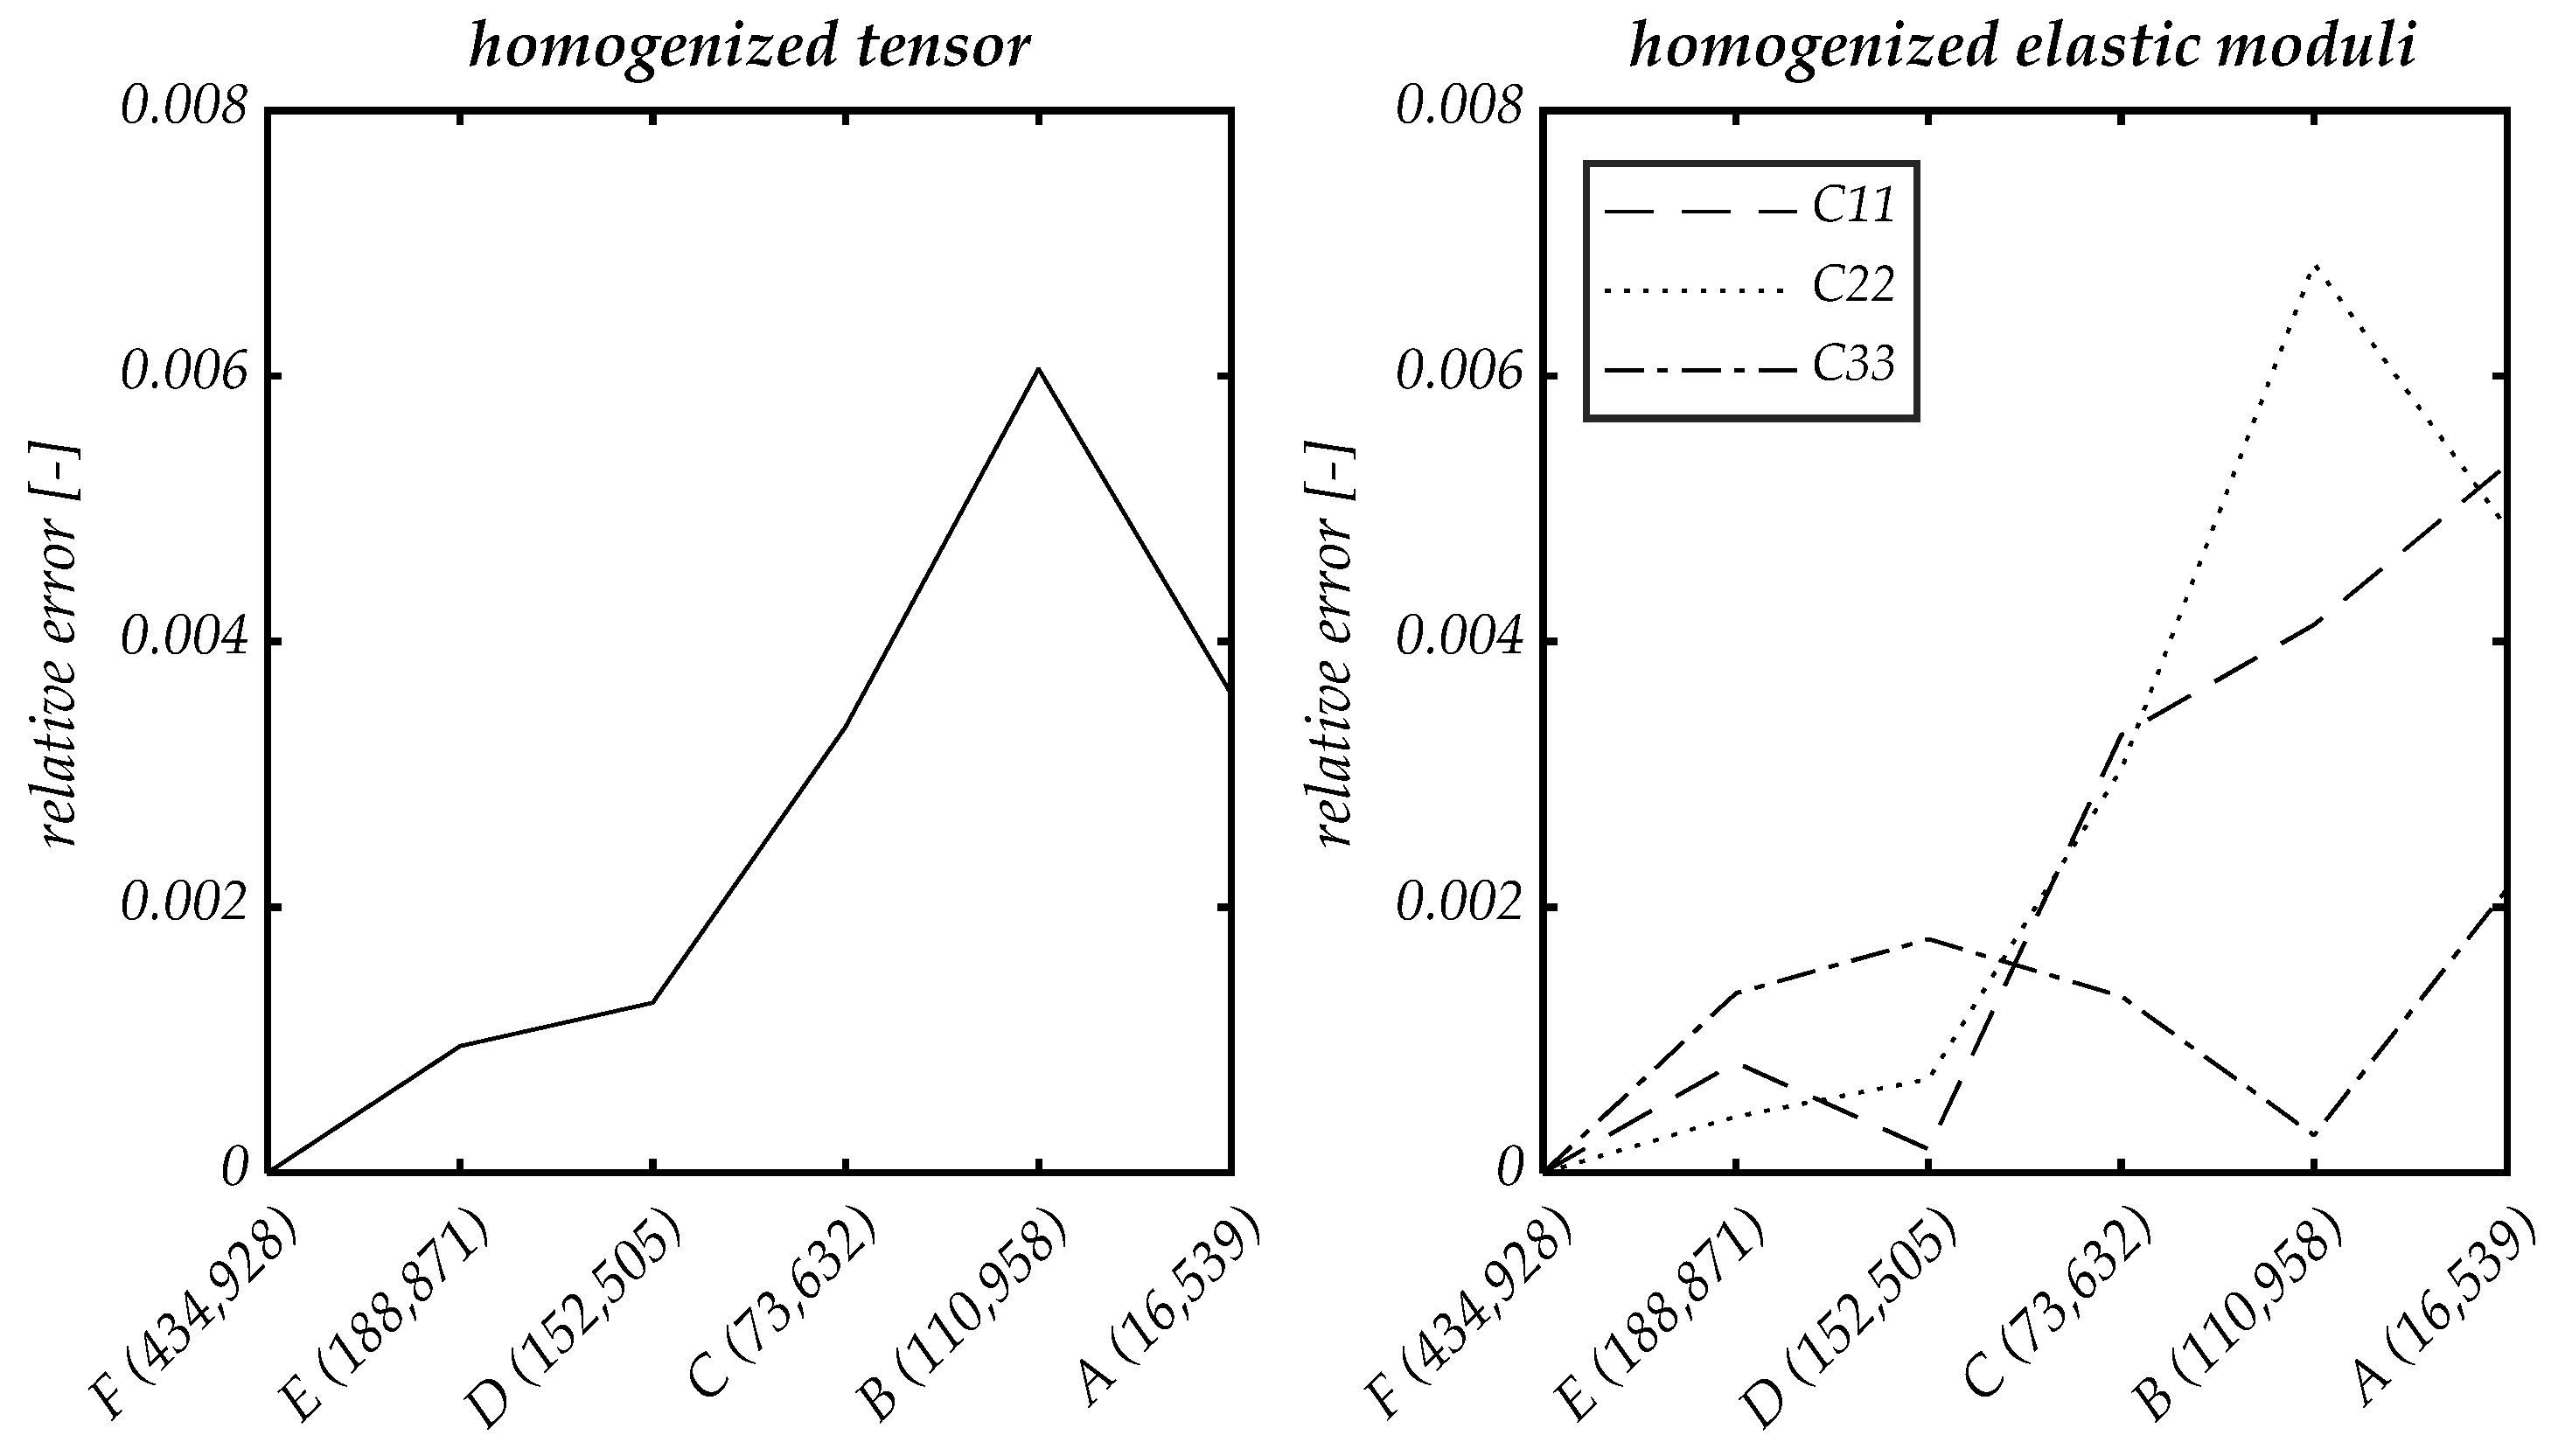
3.2.2. Convergence Study on the Size of the RVE
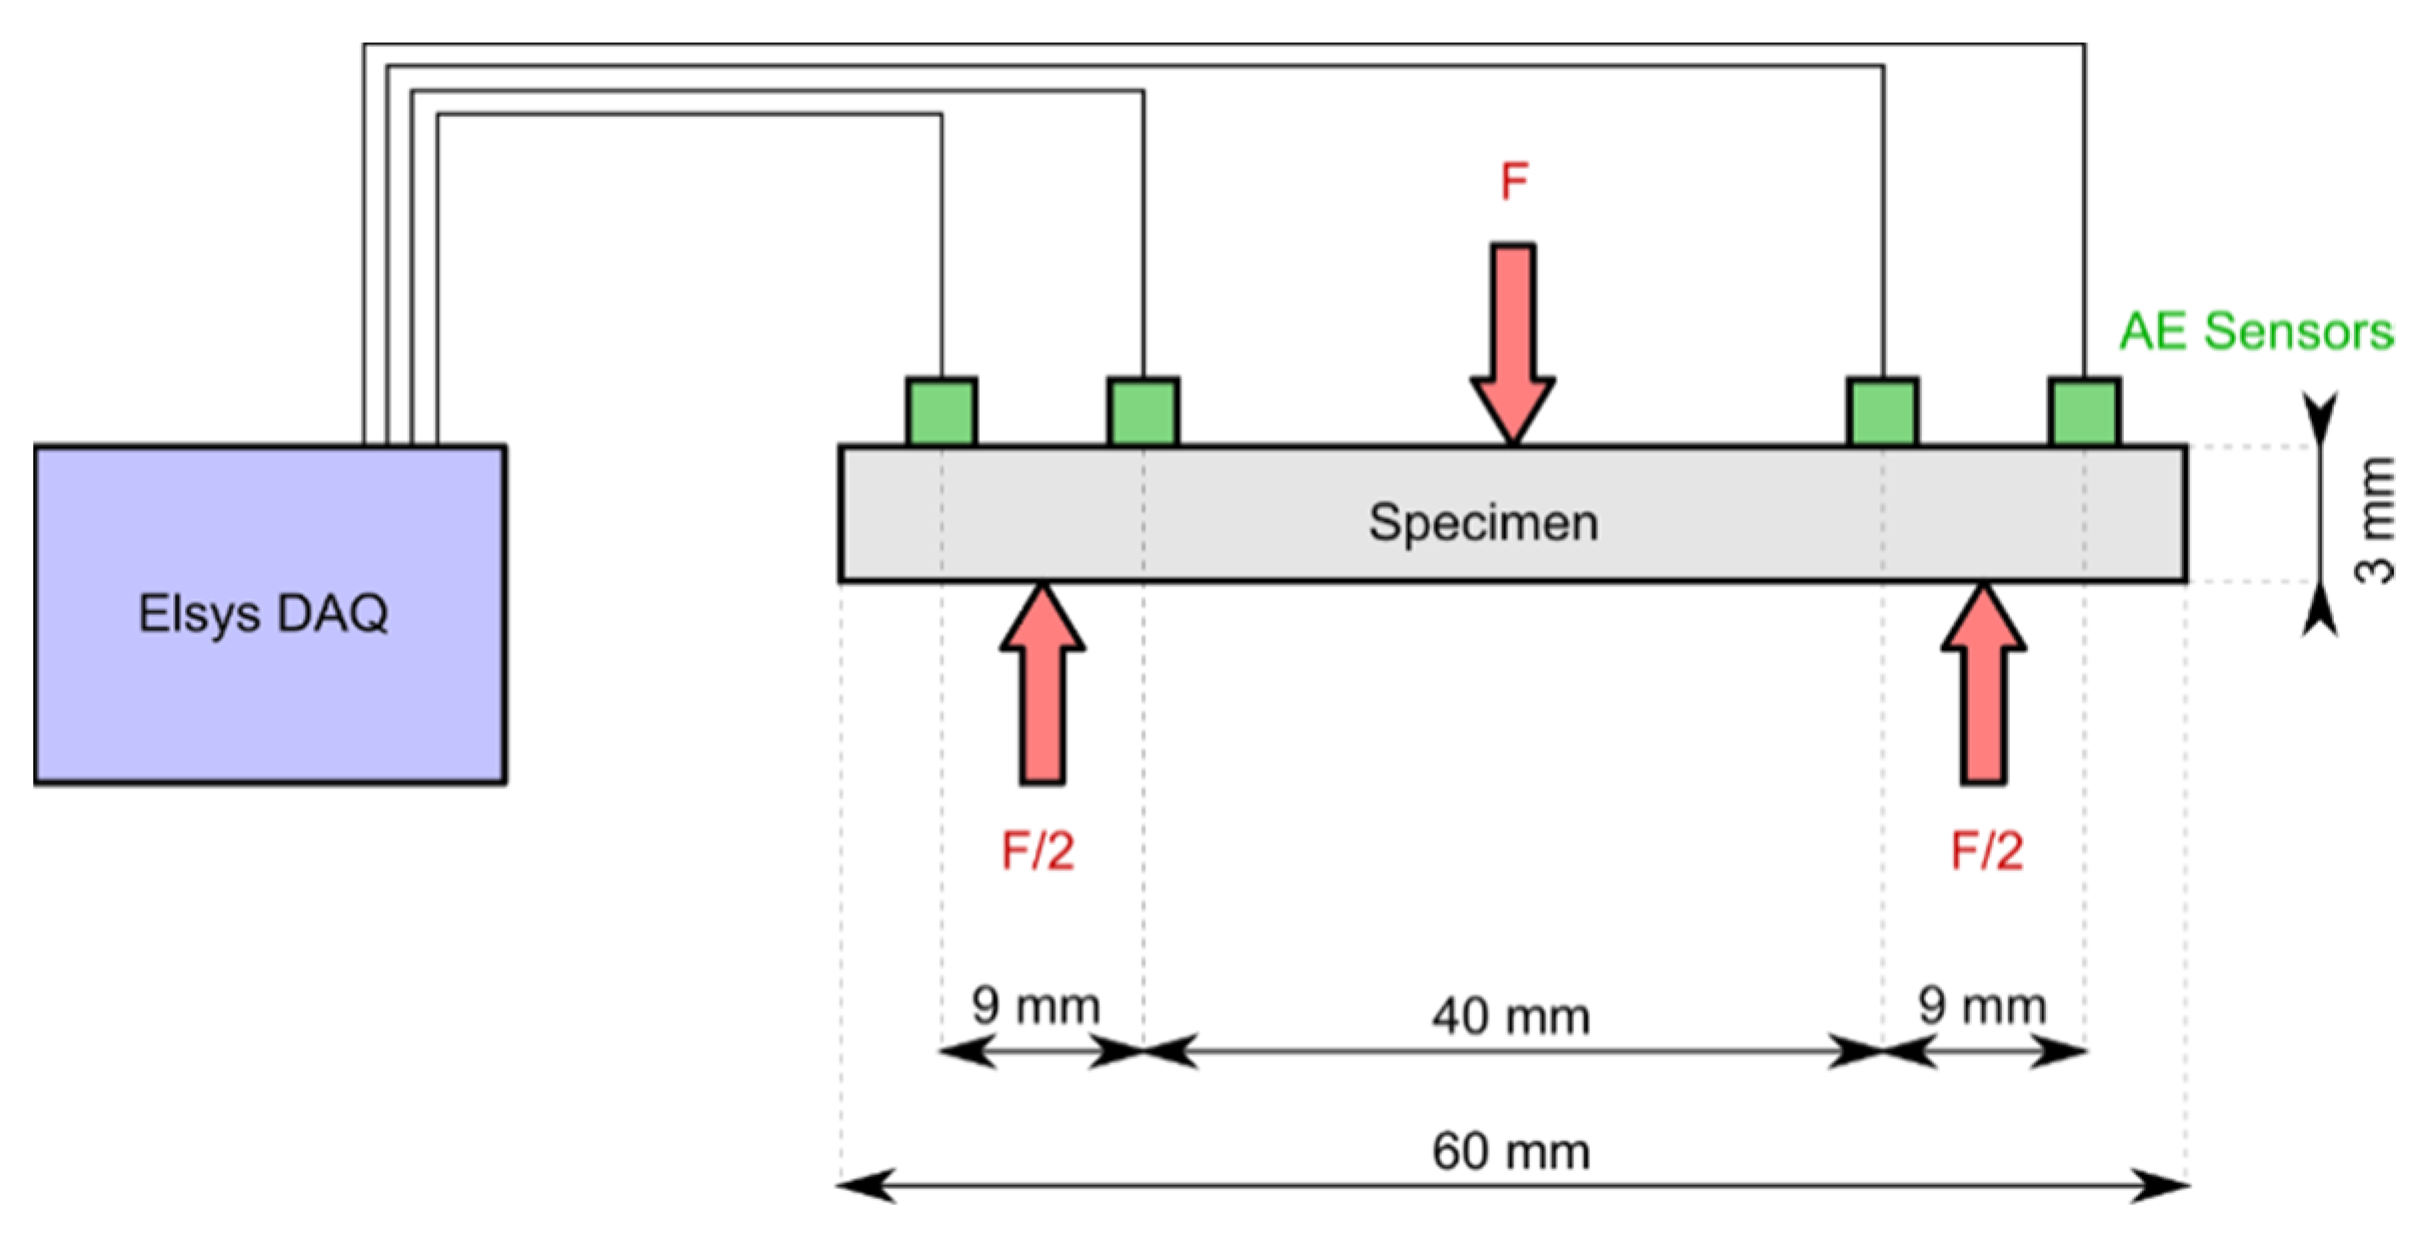
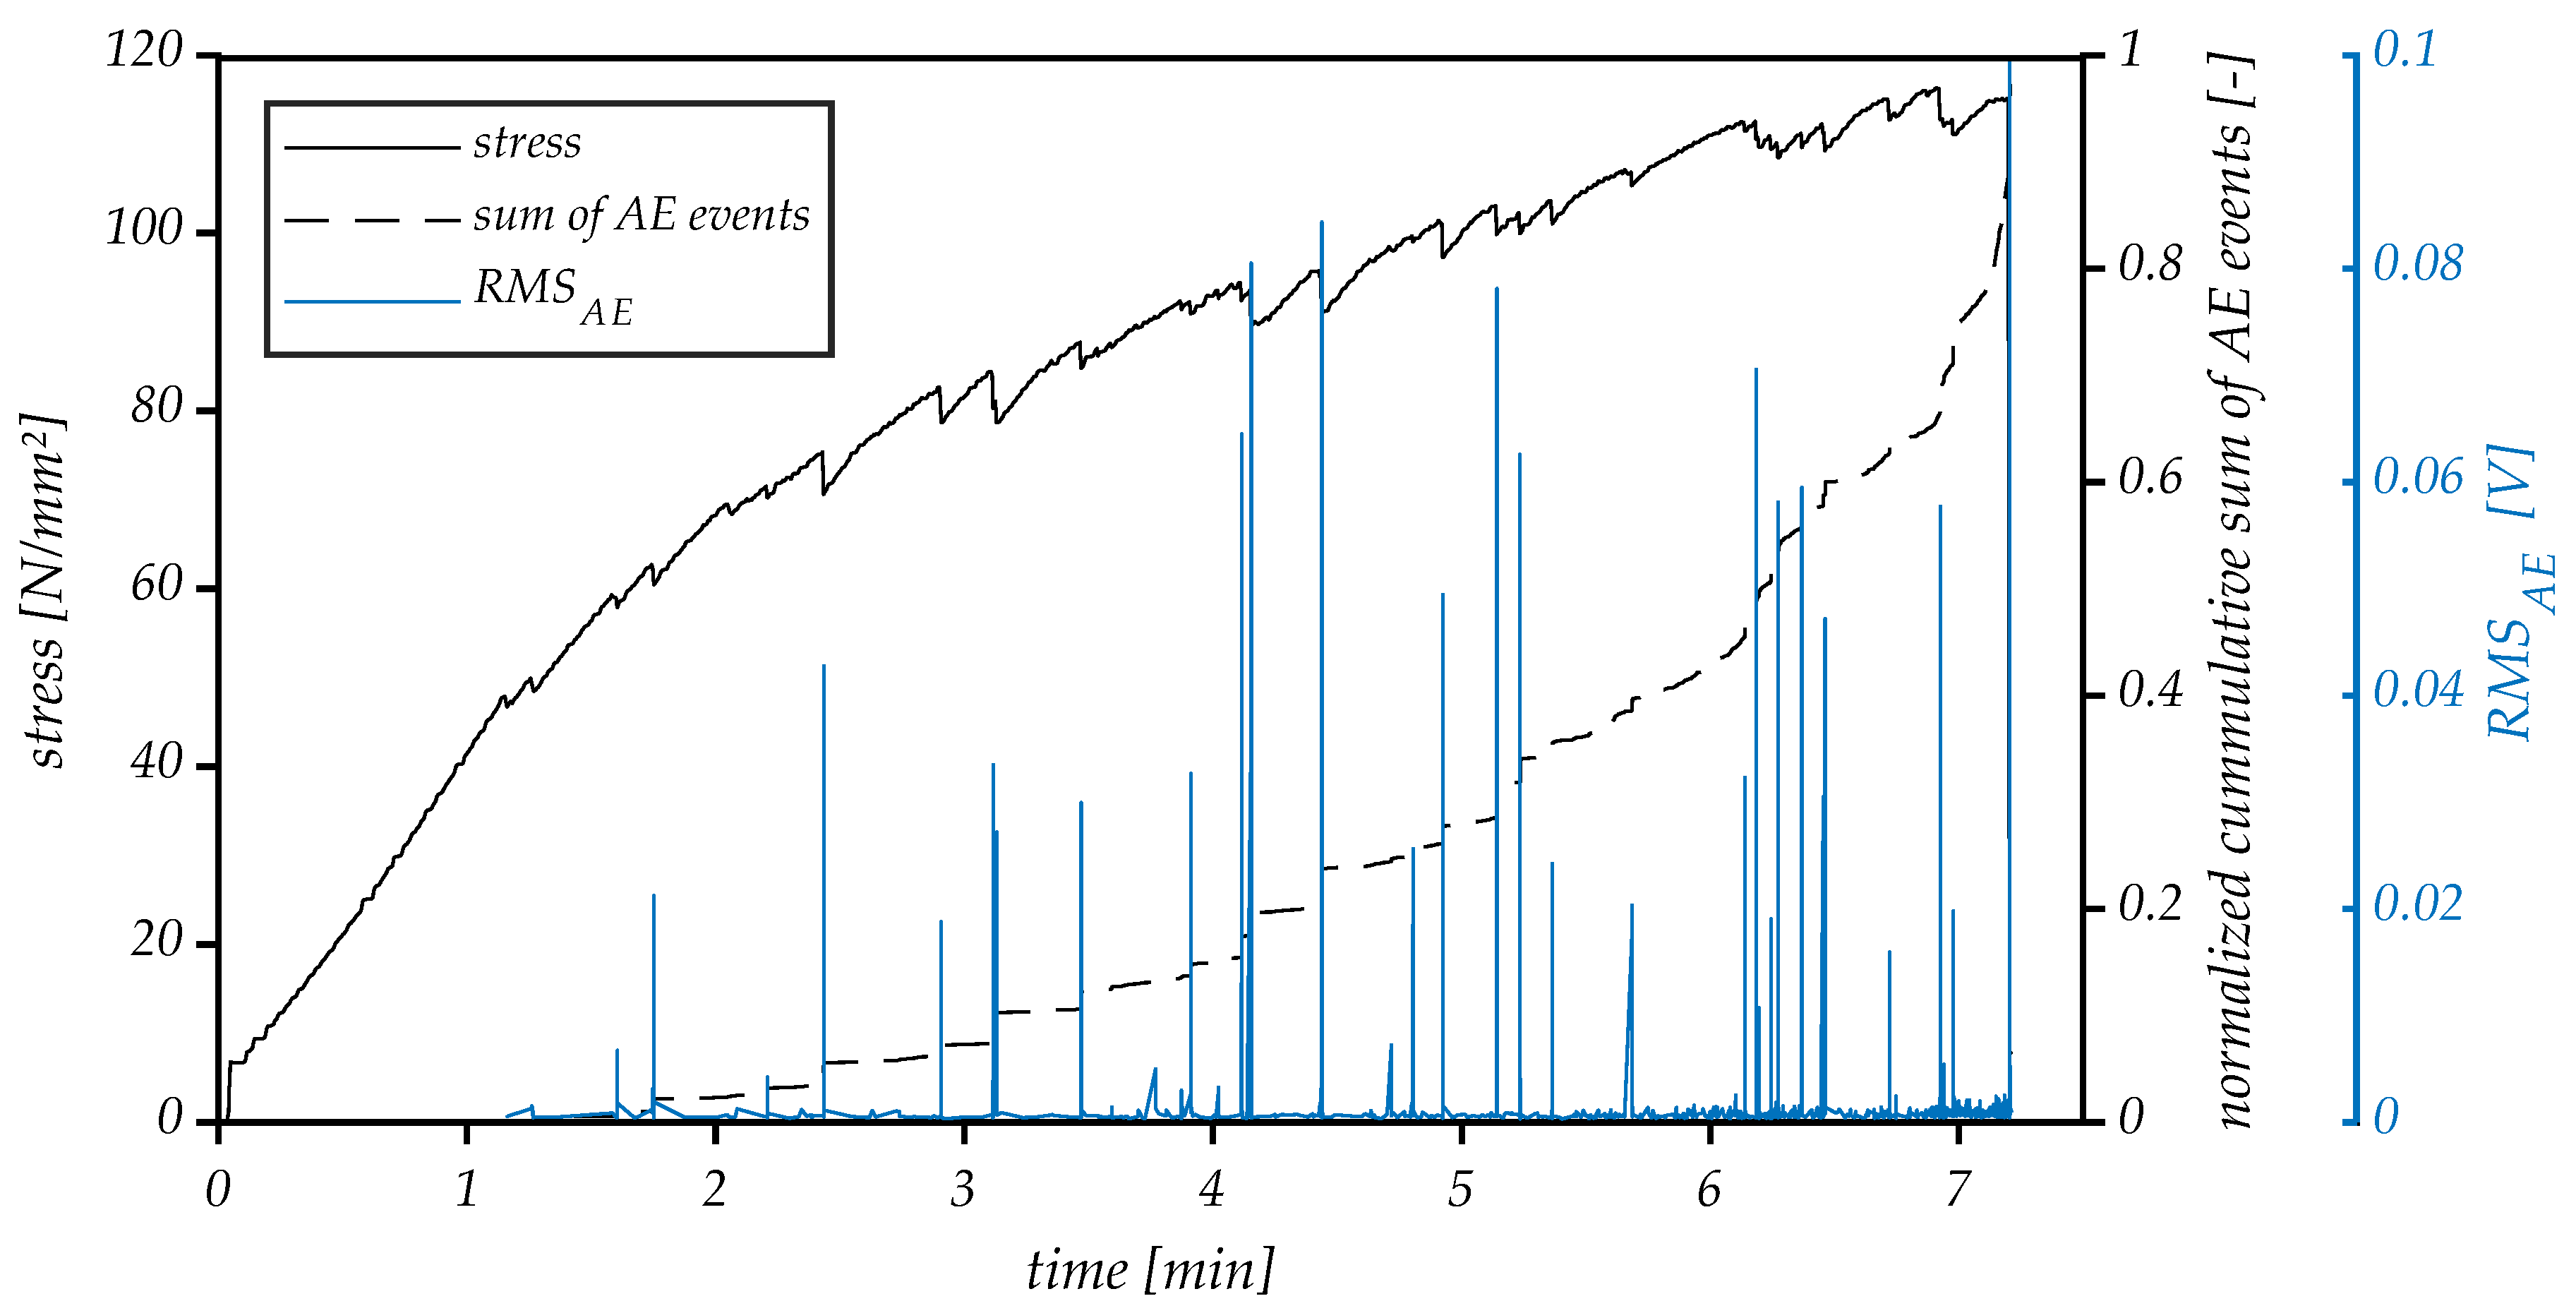
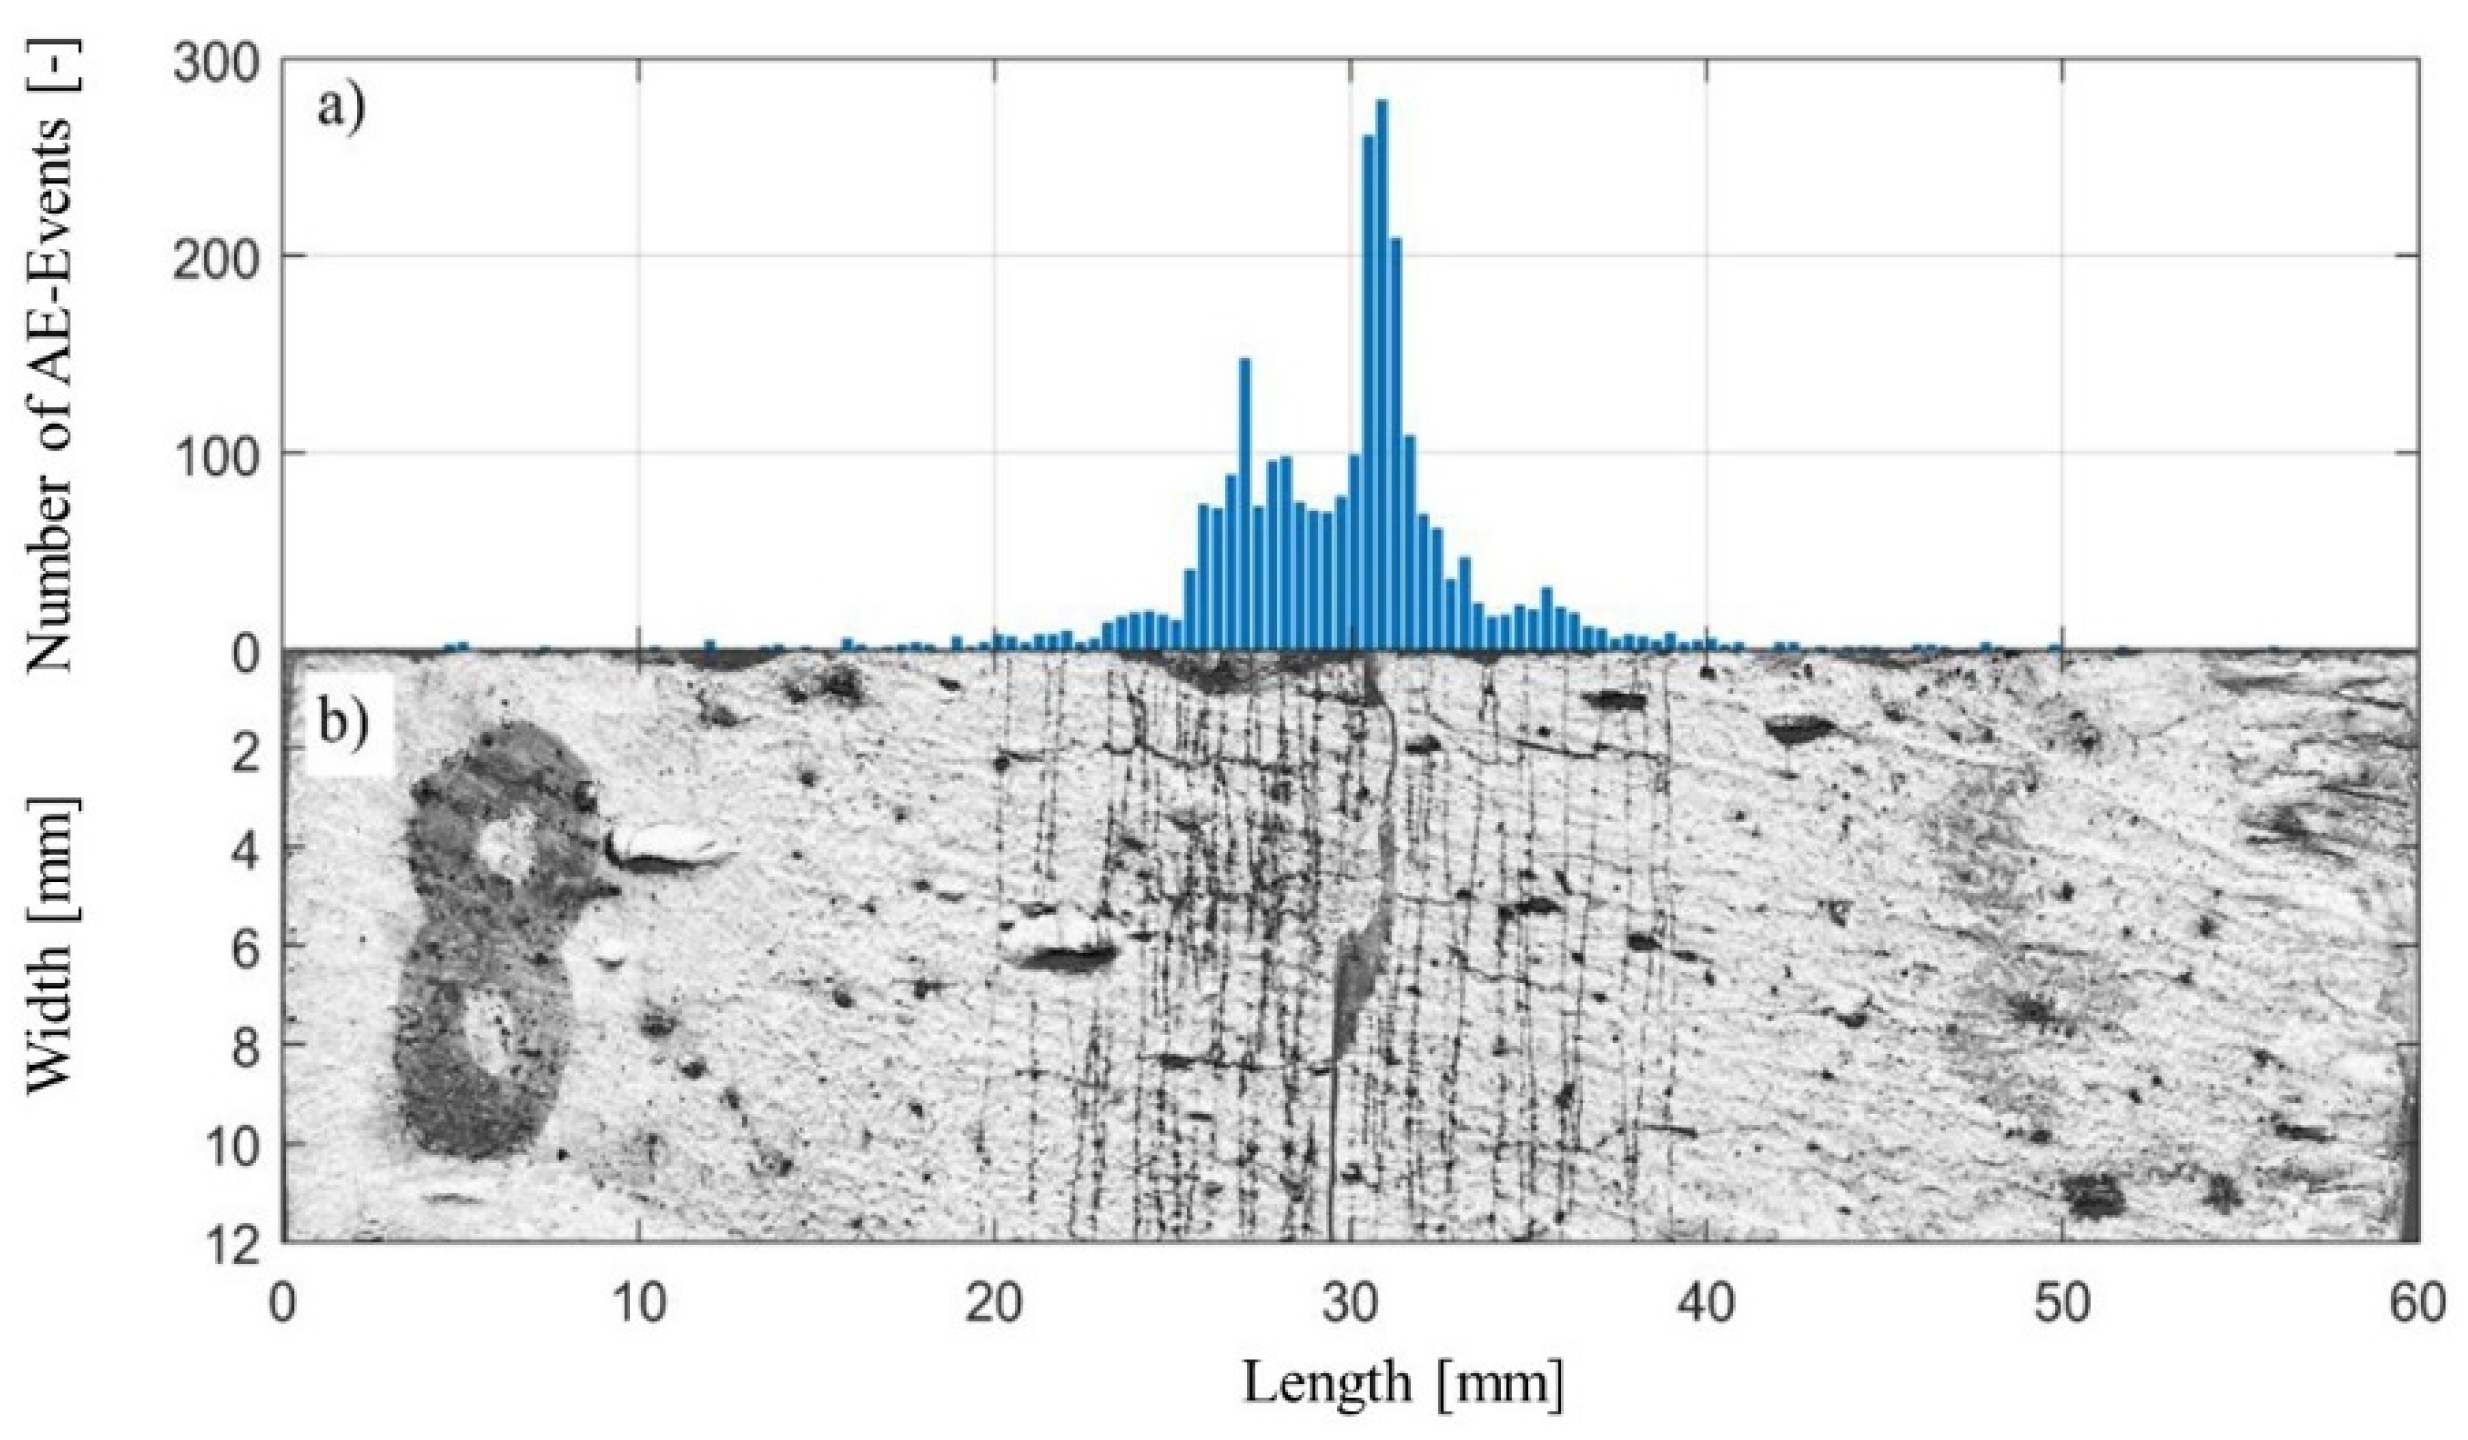
4. Flexural Testing of Miniature Bending Beams Combined with AE
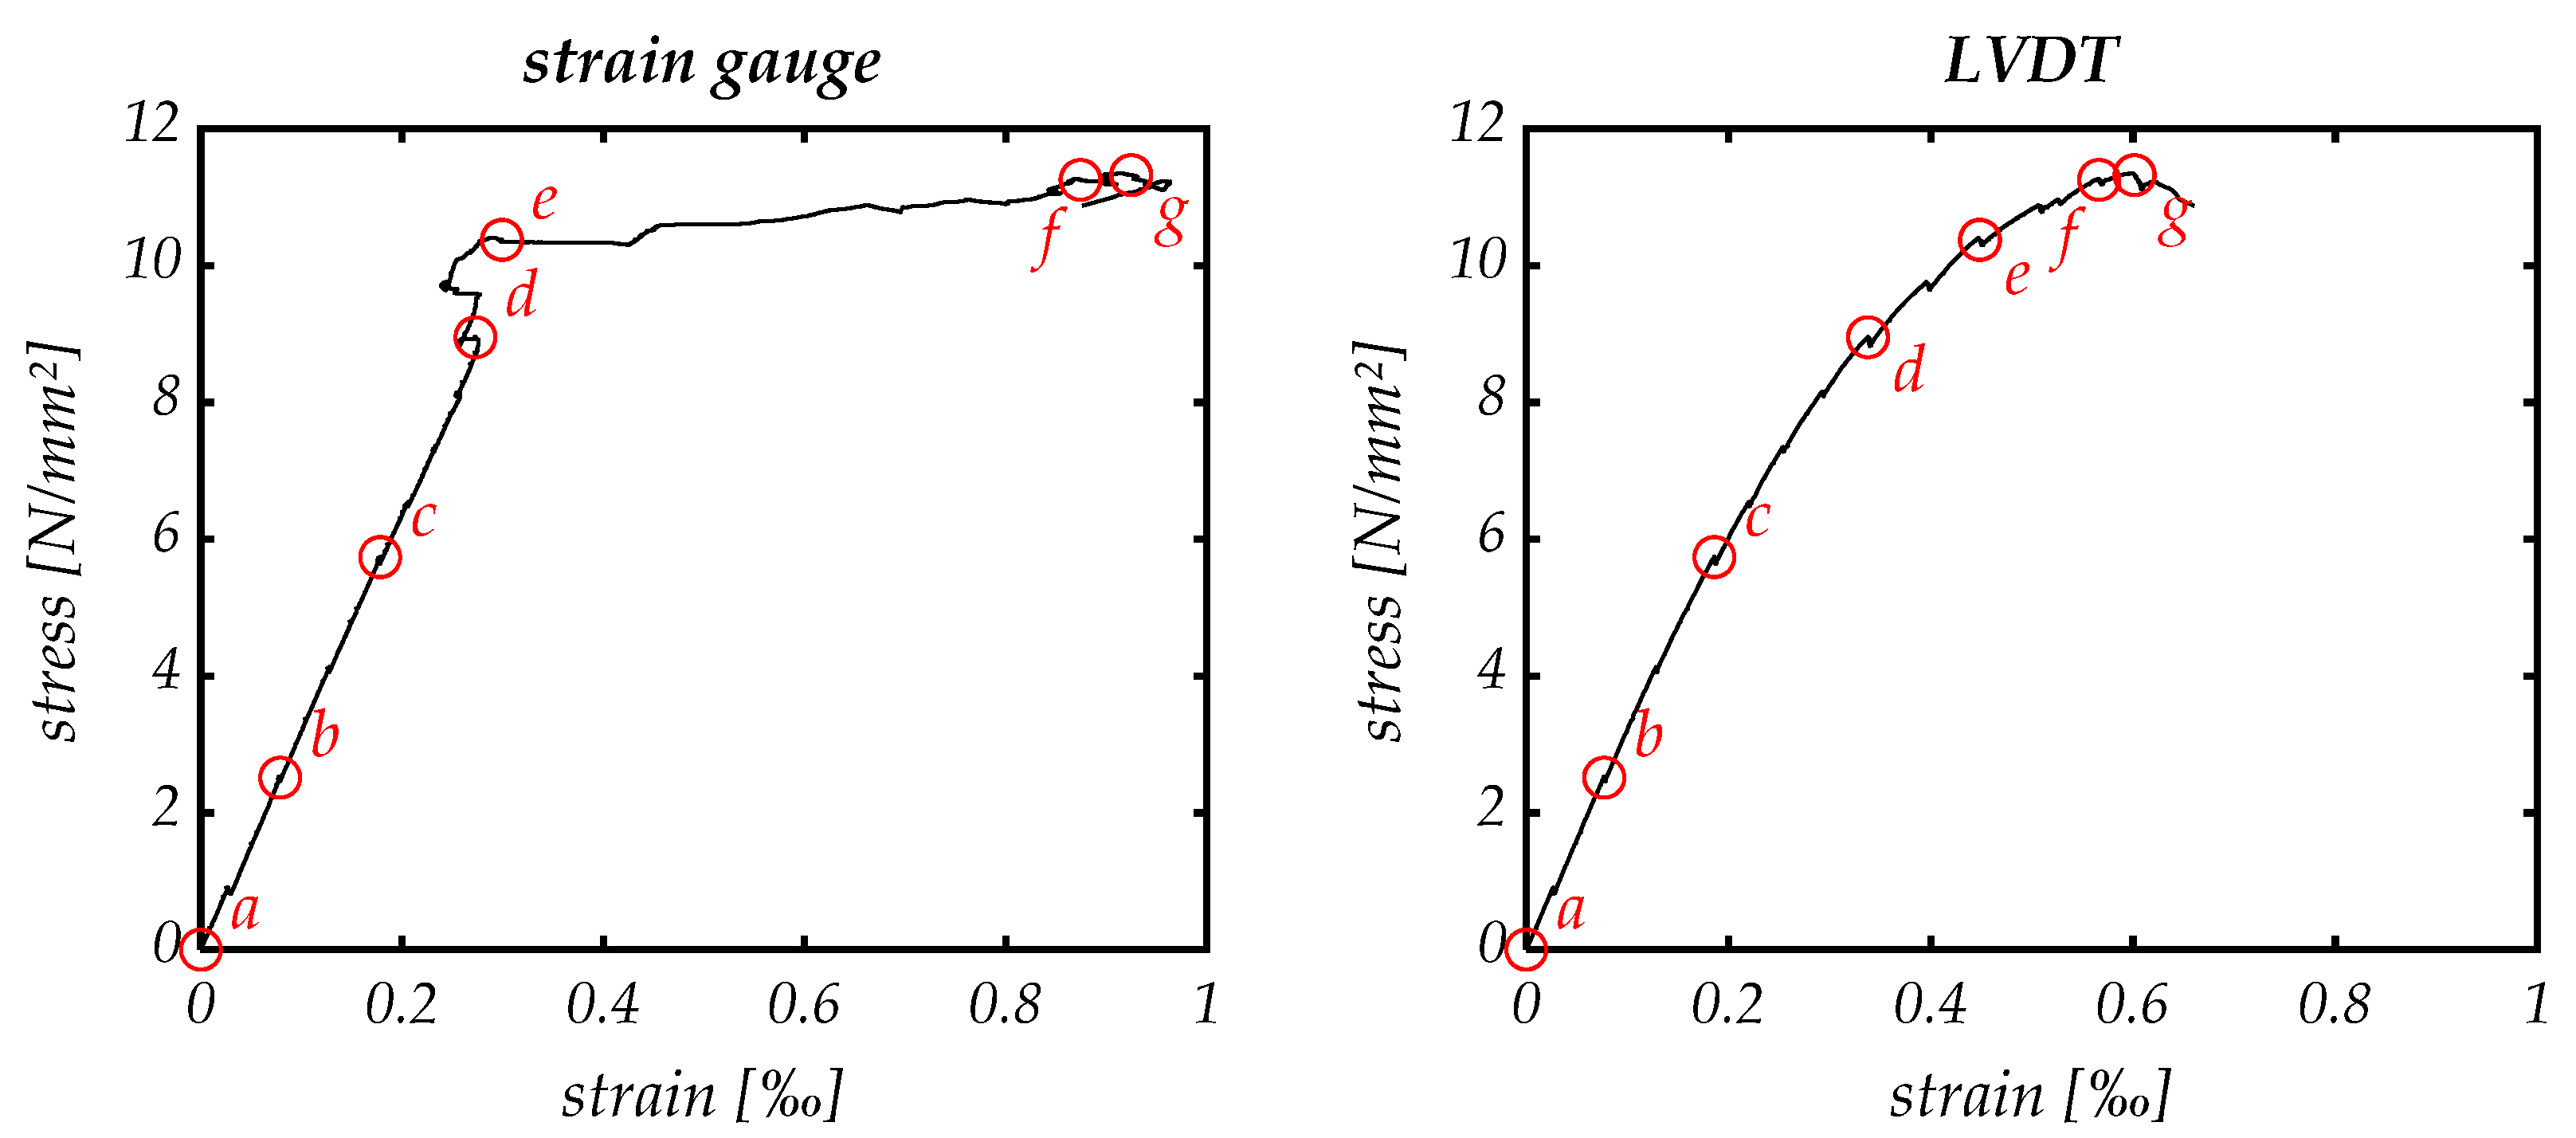
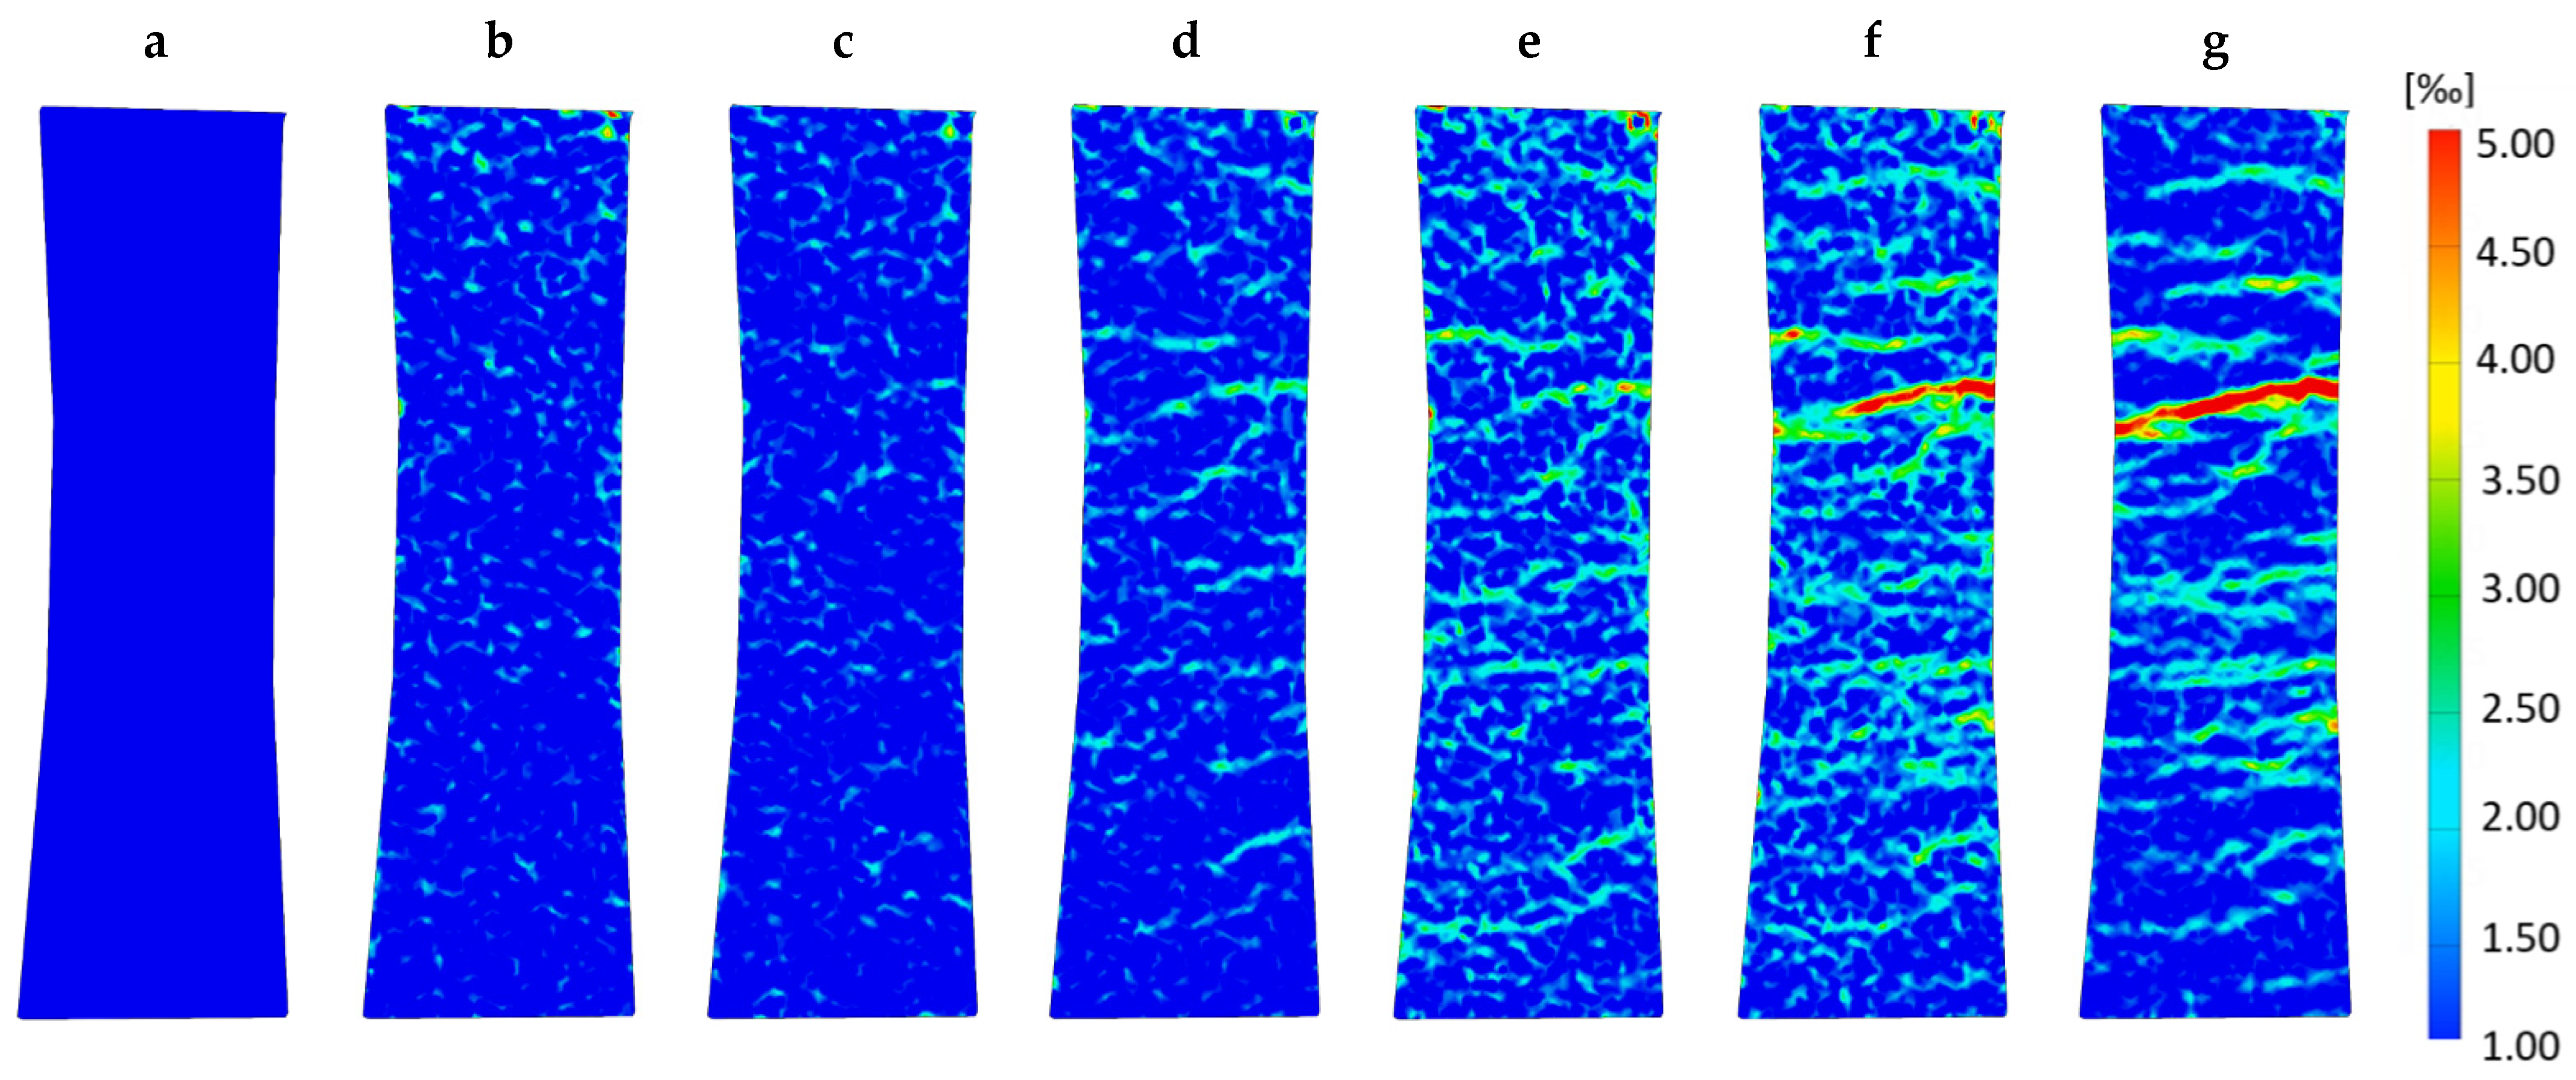
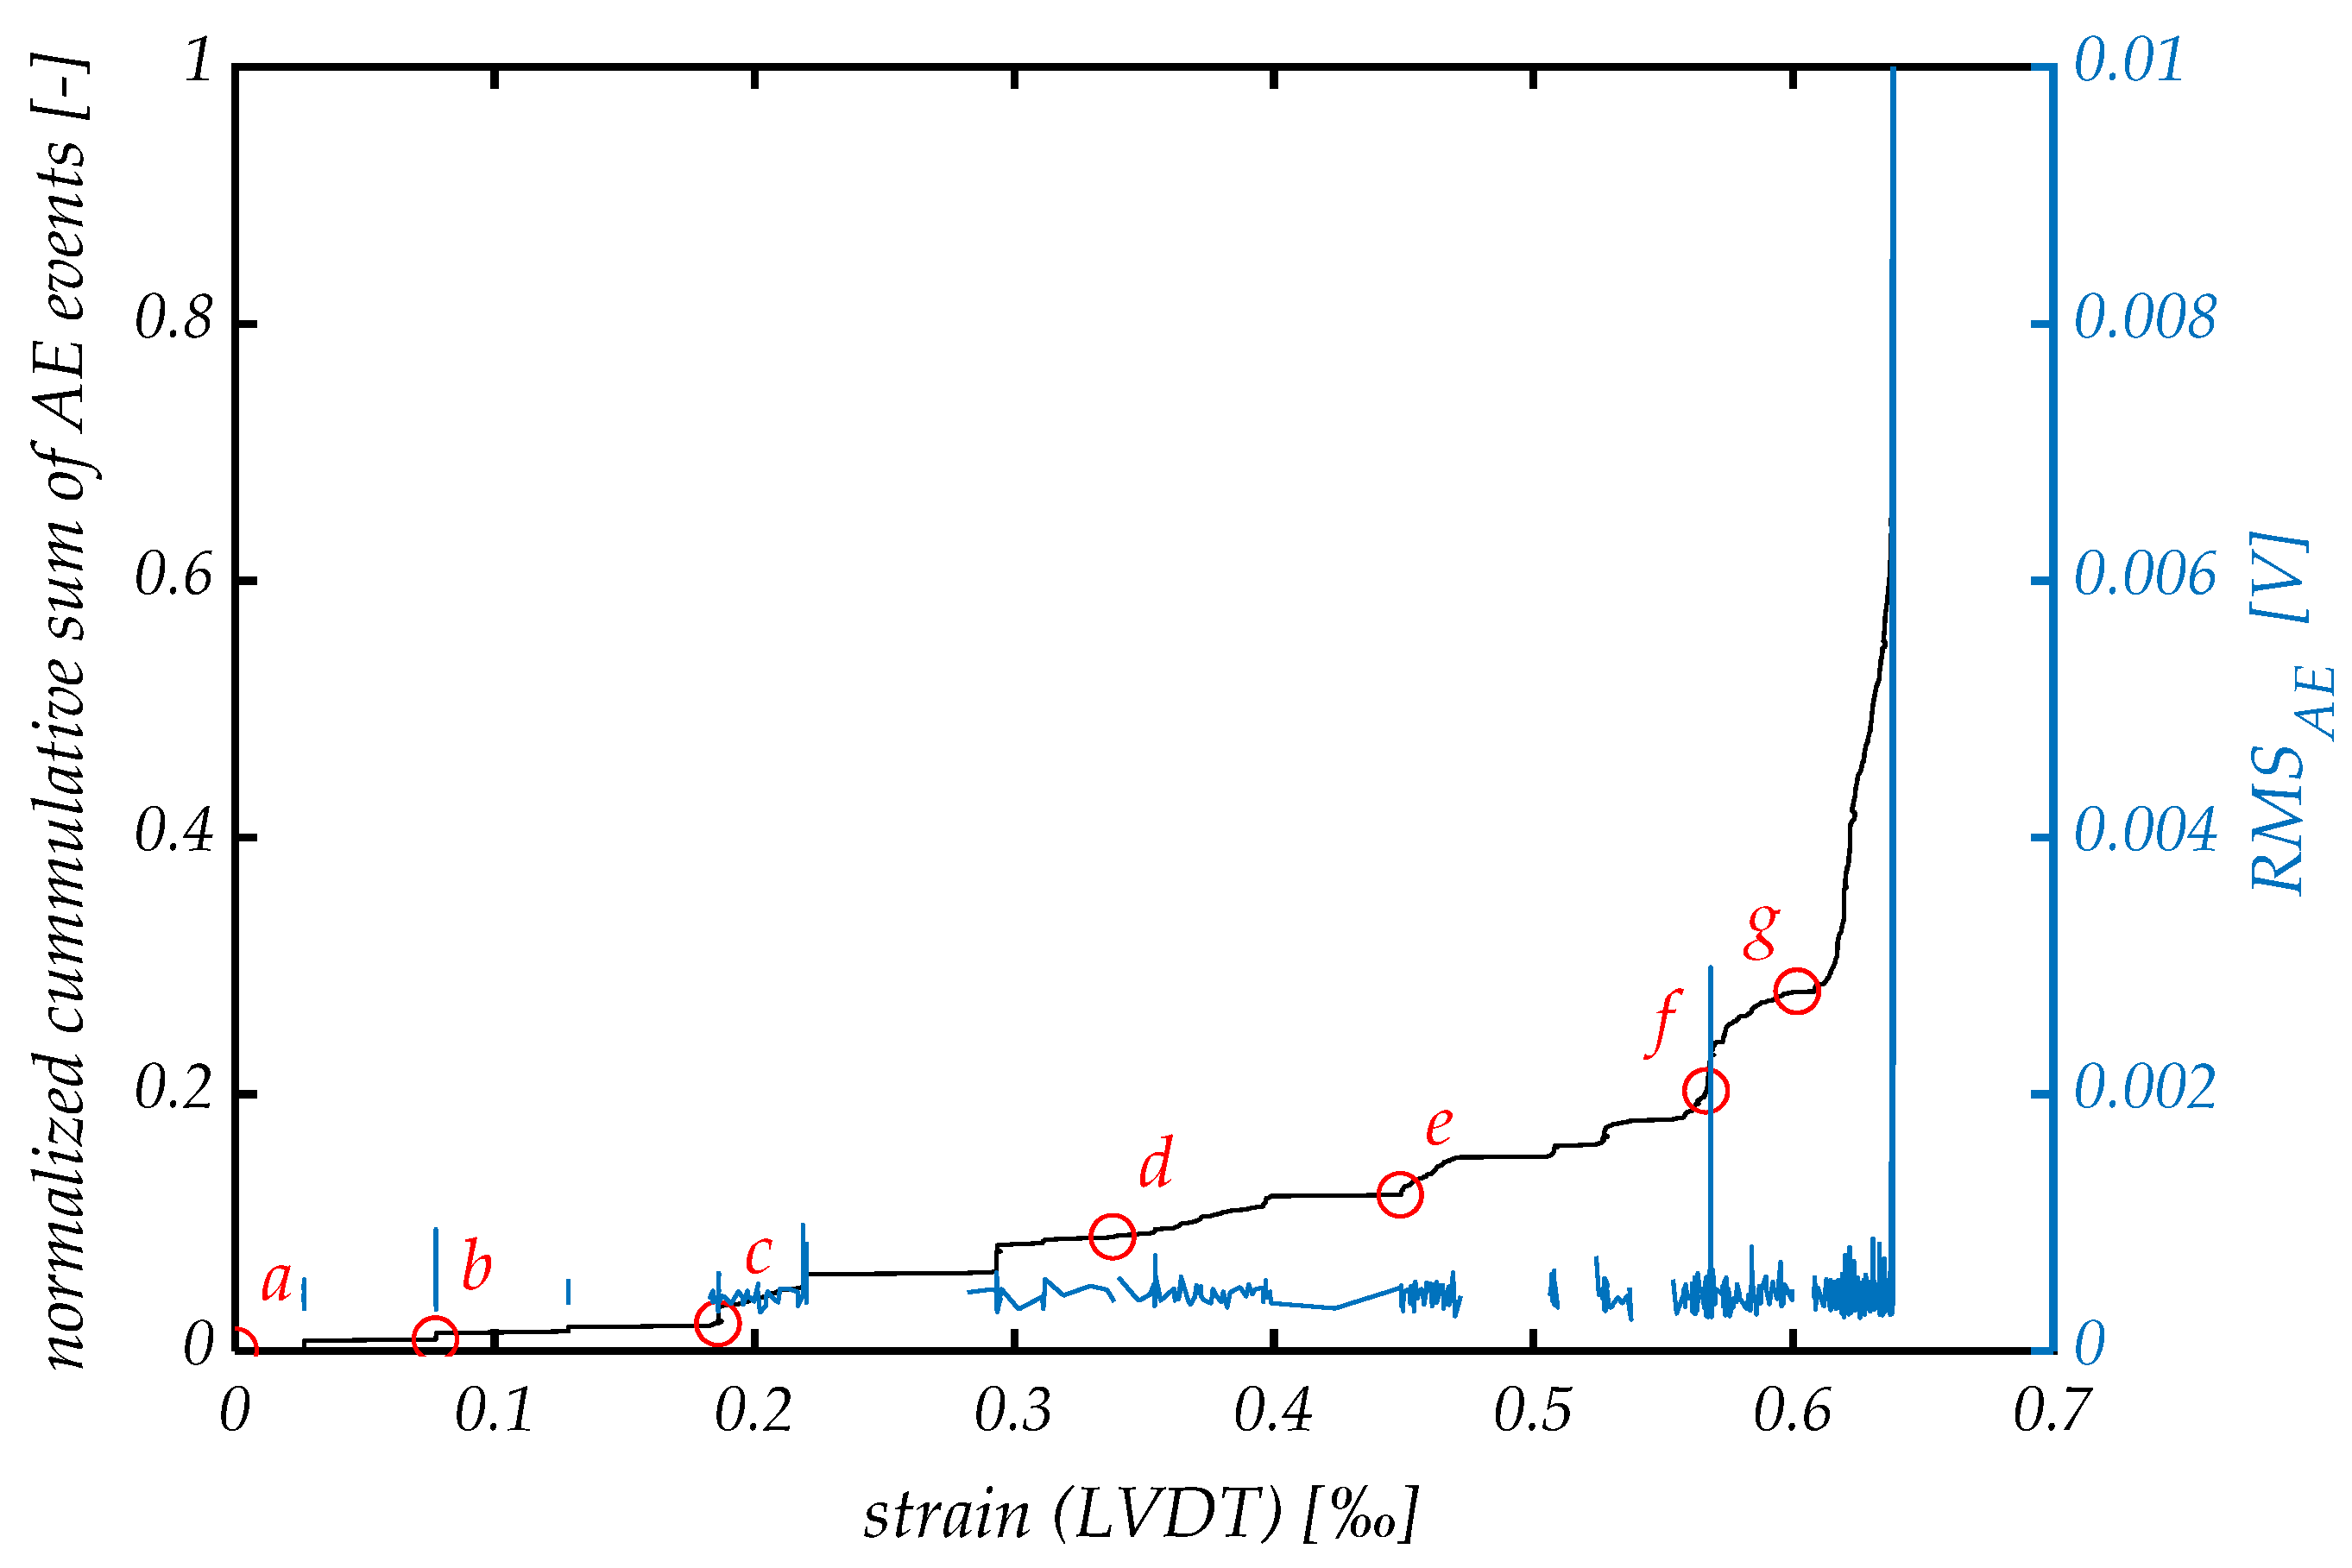
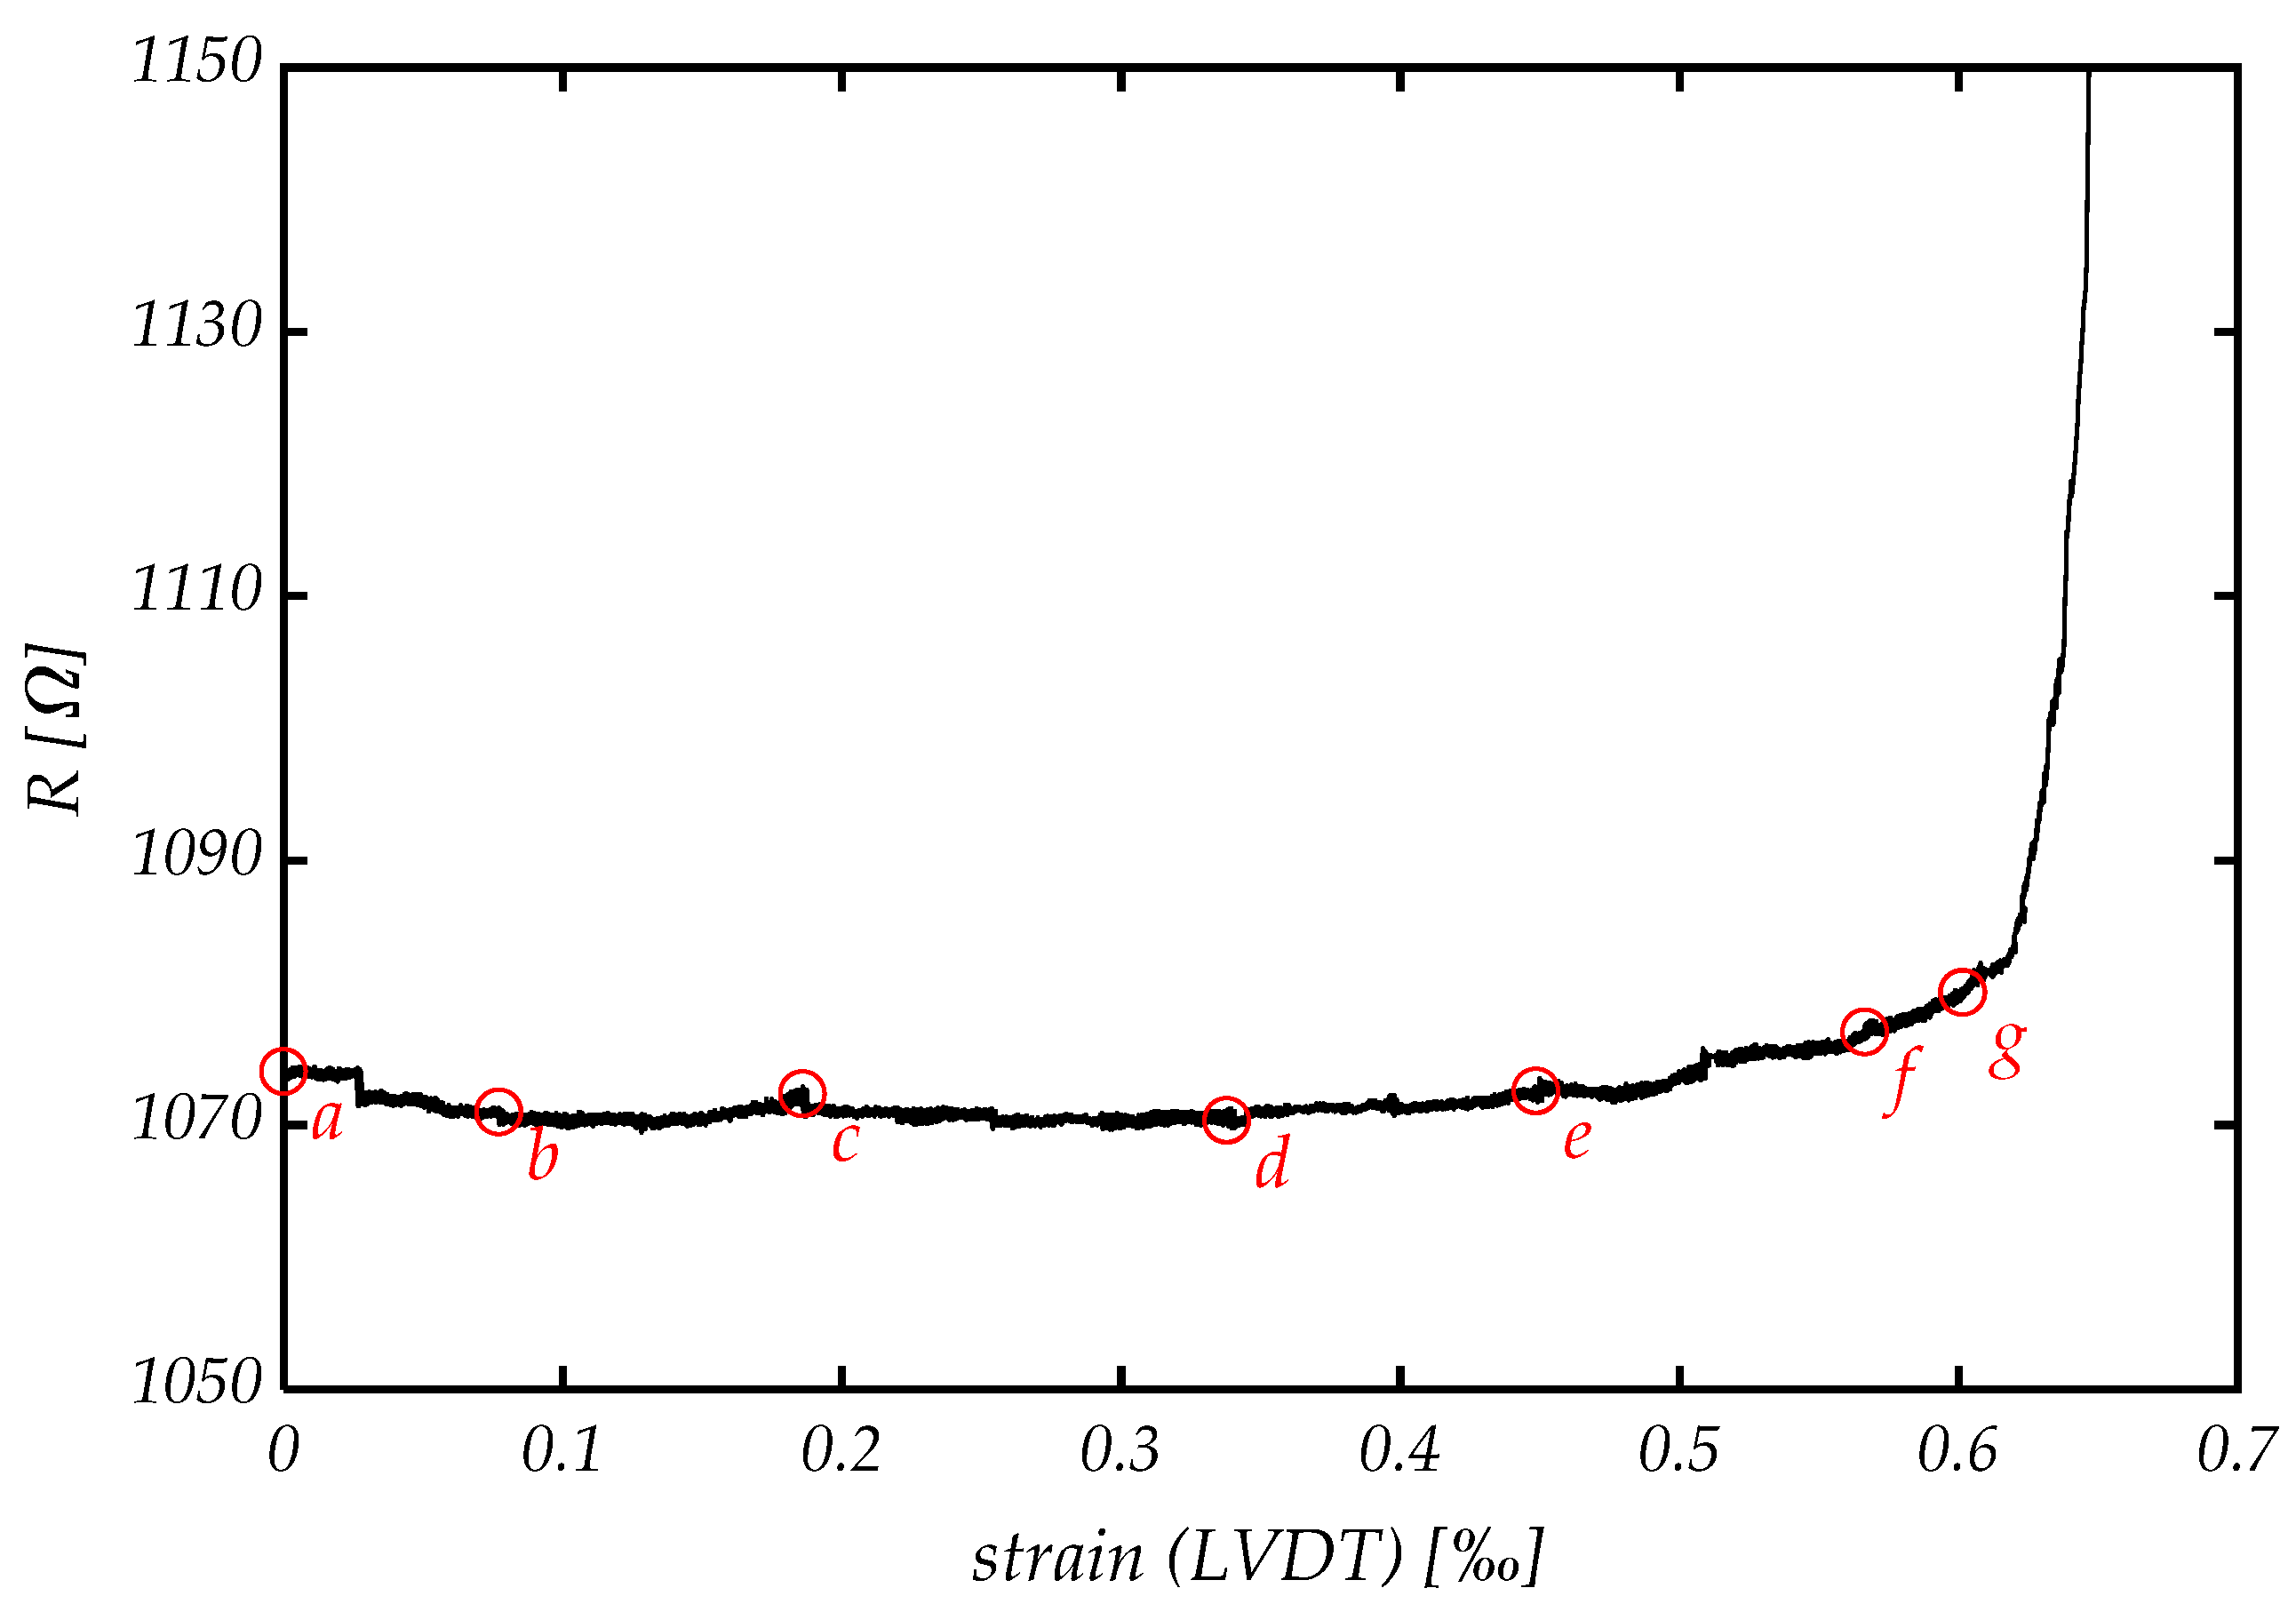
5. Tensional Testing of Large Bone-Shaped Specimen Combined with DIC, AE and Electrical Resistivity Measurement
6. Conclusions
Author Contributions
Funding
Institutional Review Board Statement
Informed Consent Statement
Data Availability Statement
Acknowledgments
Conflicts of Interest
References
- Fu, S.; Lauke, B. Effects of fiber length and fiber orientation distributions on the tensile strength of short-fiber-reinforced polymers. Compos. Sci. Technol. 1996, 56, 1179–1190. [Google Scholar] [CrossRef]
- Banthia, N.; Sappakittipakorn, M. Toughness enhancement in steel fiber reinforced concrete through fiber hybridization. Cem. Concr. Res. 2007, 37, 1366–1372. [Google Scholar] [CrossRef]
- Li, V.C.; Wu, C.; Wang, S.; Ogawa, A.; Saito, T. Interface tailoring for strain-hardening polyvinyl alcohol-engineered cementitious composite (PVA-ECC). ACI Mater. J. 2002, 99, 463–472. [Google Scholar]
- Li, V. Engineered Cementitious Composites (ECC): Bendable Concrete for Sustainable and Resilient Infrastructure/Victor C. Li; with 410 Figures and 37 Tables; Springer: Berlin, Germany, 2019; ISBN 978-3-662-58437-8. [Google Scholar]
- Mechtcherine, V. Novel cement-based composites for the strengthening and repair of concrete structures. Constr. Build. Mater. 2013, 41, 365–373. [Google Scholar] [CrossRef]
- Kanada, T.; Li, V.C. Multiple Cracking Sequence and Saturation in Fiber Reinforced Cementitious Composites. Constr. Res. Technol. 1998, 9, 19–33. [Google Scholar]
- van Zijl, G.P.A.G.; Wittmann, F.H. On Durability of SHCC. J. Adv. Concr. Technol. 2010, 8, 261–271. [Google Scholar] [CrossRef][Green Version]
- Zhang, P.; Dai, Y.; Ding, X.; Zhou, C.; Xue, X.; Zhao, T. Self-healing behaviour of multiple microcracks of strain hardening cementitious composites (SHCC). Constr. Build. Mater. 2018, 169, 705–715. [Google Scholar] [CrossRef]
- Li, V.C.; Herbert, E. Robust Self-Healing Concrete for Sustainable Infrastructure. J. Adv. Concr. Technol. 2012, 10, 207–218. [Google Scholar] [CrossRef]
- Hambach, M.; Möller, H.; Neumann, T.; Volkmer, D. Portland cement paste with aligned carbon fibers exhibiting exceptionally high flexural strength (>100 MPa). Cem. Concr. Res. 2016, 89, 80–86. [Google Scholar] [CrossRef]
- Hambach, M.; Volkmer, D. Properties of 3D-printed fiber-reinforced Portland cement paste. Cem. Concr. Compos. 2017, 79, 62–70. [Google Scholar] [CrossRef]
- Fu, X.; Chung, D. Self-monitoring of fatigue damage in carbon fiber reinforced cement. Cem. Concr. Res. 1996, 26, 15–20. [Google Scholar] [CrossRef]
- Guo, Z.; Zhuang, C.; Li, Z.; Chen, Y. Mechanical properties of carbon fiber reinforced concrete (CFRC) after exposure to high temperatures. Compos. Struct. 2021, 256, 113072. [Google Scholar] [CrossRef]
- Hambach, M. Hochfeste Multifunktionale Verbundwerkstoffe auf Basis von Portlandzement und Kohlenstoffkurzfasern. Ph.D. Thesis, Universität Augsburg, Augsburg, Germany, 2017. [Google Scholar]
- Fischer, O.; Volkmer, D.; Lauff, P.; Hambach, M.; Rutzen, M. Zementgebundener Kohlenstofffaserverstärkter Hochleistungswerkstoff (Carbonkurzfaserbeton); Fraunhofer IRB Verlag: Stuttgart, Germany, 2019; ISBN 978-3-7388-0422-5. [Google Scholar]
- Rutzen, M.; Lauff, P.; Niedermeier, R.; Fischer, O.; Raith, M.; Grosse, C.U.; Weiss, U.; Peter, M.A.; Volkmer, D. Influence of fiber alignment on pseudoductility and microcracking in a cementitious carbon fiber composite material. Mater. Struct. 2021, 54, 58. [Google Scholar] [CrossRef]
- Mobasher, B. Mechanics of Fiber and Textile Reinforced Cement Composites; CRC Press: Boca Raton, FL, USA, 2012; ISBN 1283349914. [Google Scholar]
- Shao, Y.; Shah, S.P. Mechanical Properties of PVA Fiber Reinforced Cement Composites Fabricated by Extrusion Processing. ACI Mater. J. 1997, 94, 555–564. [Google Scholar]
- Shao, Y.; Qiu, J.; Shah, S.P. Microstructure of extruded cement-bonded fiberboard. Cem. Concr. Res. 2001, 31, 1153–1161. [Google Scholar] [CrossRef]
- Kuder, K.G.; Shah, S.P. Processing of high-performance fiber-reinforced cement-based composites. Constr. Build. Mater. 2010, 24, 181–186. [Google Scholar] [CrossRef]
- Mu, B.; Cyr, M.F.; Shah, S.P. Extruded Fiber-Reinforced Composite. In Advances in Building Technology; Elsevier: Amsterdam, The Netherlands, 2002; pp. 239–246. ISBN 9780080441009. [Google Scholar]
- Qian, X.; Zhou, X.; Mu, B.; Li, Z. Fiber alignment and property direction dependency of FRC extrudate. Cem. Concr. Res. 2003, 33, 1575–1581. [Google Scholar] [CrossRef]
- Raju, R.A.; Lim, S.; Kageyama, T.; Akiyama, M. Visualization of the Fibre Dispersion in the Steel Fibre Reinforced Concrete Using X-Ray Image. In Proceedings of the FIB Symposium 2019, Concrete—Innovations in Materials, Design and Structures, Krakow, Poland, 27–29 May 2019; Derkowski, W., Gwoździewicz, P., Hojdys, Ł., Krajewski, P., Pańtak, M., Eds.; FIB—International Federation for Structural Concrete: Krakow, Poland, 2019. ISBN 978-2-940643-00-4. [Google Scholar]
- Lauff, P.; Fischer, O. Effizienter Ultrahochleistungsbeton mit innovativer trajektorienorientierter “Bewehrung”. Ce Pap. 2019, 3, 82–88. [Google Scholar] [CrossRef]
- Fitik, B. Ermüdungsverhalten von Ultrahochfestem Beton (UHPC) bei Zyklischen Beanspruchungen im Druck-Zug-Wechselbereich. Ph.D. Thesis, Technical University of Munich, Munich, Germany, 2012. [Google Scholar]
- Sencu, R.M.; Yang, Z.; Wang, Y.C.; Withers, P.J.; Rau, C.; Parson, A.; Soutis, C. Generation of micro-scale finite element models from synchrotron X-ray CT images for multidirectional carbon fibre reinforced composites. Compos. Part A Appl. Sci. Manuf. 2016, 91, 85–95. [Google Scholar] [CrossRef]
- Oesch, T.; Landis, E.; Kuchma, D. A methodology for quantifying the impact of casting procedure on anisotropy in fiber-reinforced concrete using X-ray CT. Mater. Struct. 2018, 51, 73. [Google Scholar] [CrossRef]
- Oesch, T.; Stelzner, L.; Weise, F. Non-destructive evaluation of the contribution of polymer-fibre orientation and distribution characteristics to concrete performance during fire. In Short Fibre Reinforced Cementitious Composites and Ceramics; Herrmann, H., Schnell, J., Eds.; Springer Nature Switzerland AG: Cham, Switzerland, 2019; pp. 51–73. ISBN 978-3-030-00868-0. [Google Scholar]
- Ketcham, D.J.; Lowe, R.W.; Weber, J.W. Image Enhancement Techniques for Cockpit Displays; ADA014928; Hughes Aircraft Co Culver City Ca Display Systems Lab: Culver City, CA, USA, 1974. [Google Scholar]
- Lai, Y.-R.; Tsai, P.-C.; Yao, C.-Y.; Ruan, S.-J. Improved local histogram equalization with gradient-based weighting process for edge preservation. Multimed. Tools Appl. 2017, 76, 1585–1613. [Google Scholar] [CrossRef]
- Zohdi, T.I.; Wriggers, P. An Introduction to Computational Micromechanics: With 9 Tables; Corr. 2. Printing; Springer: Berlin, Germany, 2008; ISBN 9783540774822. [Google Scholar]
- Charalambakis, N. Homogenization Techniques and Micromechanics. A Survey and Perspectives. Appl. Mech. Rev. 2010, 63, 030803. [Google Scholar] [CrossRef]
- Geers, M.; Kouznetsova, V.G.; Brekelmans, W. Multi-scale computational homogenization: Trends and challenges. J. Comput. Appl. Math. 2010, 234, 2175–2182. [Google Scholar] [CrossRef]
- Lauff, P.; Raith, M.; Große, C.; Rutzen, M.; Volkmer, D.; Reischmann, L.; Weiß, U.; Peter, M.A.; Fischer, O. Investigation of Localized Damage Indicators of a Carbon Short-Fibre Reinforced High Performance Concrete under Dynamic and Flexural Load; Federation Internationale du Beton: Lausanne, Switzerland, 2019. [Google Scholar]
- COMSOL Multiphysics® v. 5.6; COMSOL AB: Stockholm, Sweden. Available online: www.comsol.com (accessed on 14 November 2021).
- Green, R.E. Basic Wave Analysis of Acoustic Emission. In Mechanics of Nondestructive Testing; Stinchcomb, W.W., Duke, J.C., Henneke, E.G., Reifsnider, K.L., Eds.; Springer: Boston, MA, USA, 1980; pp. 55–76. ISBN 978-1-4684-3859-8. [Google Scholar]
- Chou, H.Y.; Mouritz, A.P.; Bannister, M.K.; Bunsell, A.R. Acoustic emission analysis of composite pressure vessels under constant and cyclic pressure. Compos. Part A Appl. Sci. Manuf. 2015, 70, 111–120. [Google Scholar] [CrossRef]
- Fotouhi, M.; Heidary, H.; Ahmadi, M.; Pashmforoush, F. Characterization of composite materials damage under quasi-static three-point bending test using wavelet and fuzzy C-means clustering. J. Compos. Mater. 2012, 46, 1795–1808. [Google Scholar] [CrossRef]
- Gutkin, R.; Green, C.J.; Vangrattanachai, S.; Pinho, S.T.; Robinson, P.; Curtis, P.T. On acoustic emission for failure investigation in CFRP: Pattern recognition and peak frequency analyses. Mech. Syst. Signal Process. 2011, 25, 1393–1407. [Google Scholar] [CrossRef]
- Carpinteri, A.; Lacidogna, G.; Accornero, F.; Mpalaskas, A.; Matikas, T.E.; Aggelis, D.G. Influence of damage in the acoustic emission parameters. Cem. Concr. Compos. 2013, 44, 9–16. [Google Scholar] [CrossRef]
- Muralidhara, S.; Prasad, B.R.; Eskandari, H.; Karihaloo, B.L. Fracture process zone size and true fracture energy of concrete using acoustic emission. Constr. Build. Mater. 2010, 24, 479–486. [Google Scholar] [CrossRef]
- Pascoe, J.A.; Zarouchas, D.S.; Alderliesten, R.C.; Benedictus, R. Using acoustic emission to understand fatigue crack growth within a single load cycle. Eng. Fract. Mech. 2018, 194, 281–300. [Google Scholar] [CrossRef]
- Vieille, B.; Chabchoub, M.; Bouscarrat, D.; Gautrelet, C. A fracture mechanics approach using Acoustic Emission Technique to investigate damage evolution in woven-ply thermoplastic structures at temperatures higher than glass transition temperature. Compos. Part B Eng. 2017, 116, 340–351. [Google Scholar] [CrossRef]
- Müller, S.; Mechtcherine, V. Fatigue behaviour of strain-hardening cement-based composites (SHCC). Cem. Concr. Res. 2017, 92, 75–83. [Google Scholar] [CrossRef]
- Paul, S.C.; Pirskawetz, S.; van Zijl, G.; Schmidt, W. Acoustic emission for characterising the crack propagation in strain-hardening cement-based composites (SHCC). Cem. Concr. Res. 2015, 69, 19–24. [Google Scholar] [CrossRef]
- Wang, W.; Wu, S.; Dai, H. Fatigue behavior and life prediction of carbon fiber reinforced concrete under cyclic flexural loading. Mater. Sci. Eng. A 2006, 434, 347–351. [Google Scholar] [CrossRef]
- Aguiar, P.R.; Martins, C.H.; Marchi, M.; Bianchi, E.C. Digital Signal Processing for Acoustic Emission. In Data Acquisition Applications; Karakehayov, Z., Ed.; InTech: London, UK, 2012; ISBN 978-953-51-0713-2. [Google Scholar]
- Kim, H.; Kim, S.; Ahn, J.; Kim, S. Process monitoring of centerless grinding using acoustic emission. J. Mater. Process. Technol. 2001, 111, 273–278. [Google Scholar] [CrossRef]
- Maeda, N. A Method for Reading and Checking Phase Time in Auto-Processing System of Seismic Wave Data. Zisinl 1985, 38, 365–379. [Google Scholar] [CrossRef]
- Joshi, S.B.; Kupke, M.; Schüler, R.; Schulte, K. Ermittlung der Schädigung in CFK-Platten durch systematische Aufzeichnung der elektrischen Leitfähigkeit. In ZfP in Anwendung, Entwicklung und Forschung; DGZfP-Jahrestagung Zerstörungsfreie Materialprüfung: Berlin, Germany, 2001. [Google Scholar]
- Bontea, D.-M.; Chung, D.; Lee, G. Damage in carbon fiber-reinforced concrete, monitored by electrical resistance measurement. Cem. Concr. Res. 2000, 30, 651–659. [Google Scholar] [CrossRef]
- Karhunen, K.; Seppänen, A.; Lehikoinen, A.; Monteiro, P.J.; Kaipio, J.P. Electrical Resistance Tomography imaging of concrete. Cem. Concr. Res. 2010, 40, 137–145. [Google Scholar] [CrossRef]


| Ingredient | Name | Amount |
|---|---|---|
| cement | Holcim Sulfo 52, 5R | 34.6 wt% |
| silica fume | Sika Silicol P | 21.6 wt% |
| quartz flour | Quartzwerke SF500 | 21.6 wt% |
| quartz sand | Quartzwerke H33 | 7.6 wt% |
| water | - | 11.6 wt% |
| plasticizer | BASF Master ACE 460 | 3.0 wt% |
| carbon fiber | Tenax-J HT C261 Zoltek PX35 | 0.82 wt% (per 1 vol.-%) |
| Cut-Out | Width [μm] | Height [μm] | Depth [μm] |
|---|---|---|---|
| A | 119 | 119 | 917 |
| B | 238 | 238 | 1833 |
| C | 271 | 271 | 2100 |
| D | 317 | 317 | 2667 |
| E | 352 | 352 | 2717 |
| F | 475 | 475 | 3650 |
| total CT-Scan | 950 | 950 | 3670 |
Publisher’s Note: MDPI stays neutral with regard to jurisdictional claims in published maps and institutional affiliations. |
© 2021 by the authors. Licensee MDPI, Basel, Switzerland. This article is an open access article distributed under the terms and conditions of the Creative Commons Attribution (CC BY) license (https://creativecommons.org/licenses/by/4.0/).
Share and Cite
Lauff, P.; Pugacheva, P.; Rutzen, M.; Weiß, U.; Fischer, O.; Volkmer, D.; Peter, M.A.; Grosse, C.U. Evaluation of the Behavior of Carbon Short Fiber Reinforced Concrete (CSFRC) Based on a Multi-Sensory Experimental Investigation and a Numerical Multiscale Approach. Materials 2021, 14, 7005. https://doi.org/10.3390/ma14227005
Lauff P, Pugacheva P, Rutzen M, Weiß U, Fischer O, Volkmer D, Peter MA, Grosse CU. Evaluation of the Behavior of Carbon Short Fiber Reinforced Concrete (CSFRC) Based on a Multi-Sensory Experimental Investigation and a Numerical Multiscale Approach. Materials. 2021; 14(22):7005. https://doi.org/10.3390/ma14227005
Chicago/Turabian StyleLauff, Philipp, Polina Pugacheva, Matthias Rutzen, Ursula Weiß, Oliver Fischer, Dirk Volkmer, Malte A. Peter, and Christian U. Grosse. 2021. "Evaluation of the Behavior of Carbon Short Fiber Reinforced Concrete (CSFRC) Based on a Multi-Sensory Experimental Investigation and a Numerical Multiscale Approach" Materials 14, no. 22: 7005. https://doi.org/10.3390/ma14227005
APA StyleLauff, P., Pugacheva, P., Rutzen, M., Weiß, U., Fischer, O., Volkmer, D., Peter, M. A., & Grosse, C. U. (2021). Evaluation of the Behavior of Carbon Short Fiber Reinforced Concrete (CSFRC) Based on a Multi-Sensory Experimental Investigation and a Numerical Multiscale Approach. Materials, 14(22), 7005. https://doi.org/10.3390/ma14227005