1. Introduction
Due to their high energy density and cycle stability, lithium-ion batteries (LIB) are one of the most common battery types in mobile and stationary applications today [
1,
2]. However, after almost 30 years of development and optimization since their market launch, LIBs are about to reach their physicochemical limit [
3]. For even higher energy densities, new battery concepts are currently being developed which could theoretically outperform conventional LIBs. Advanced battery concepts such as all-solid-state batteries (ASB) are considered as one of the most promising candidates for future energy storage technologies. They offer several advantages over conventional LIBs with regard to stability, safety, and energy density [
4,
5]. Especially in regard to safety (flammability and toxicity), ASBs based on ceramic electrolytes are not surpassed by any other class of materials [
6]. Due to its high Li-ion conductivity (up to 1 × 10
−3 S/cm), garnet-based Li
7Zr
3La
2O
12 compounds are considered the most promising for oxide-based ceramic electrolyte ASSB. Its stability towards metallic lithium allows the direct use of lithium as an anode material without any further stabilization [
7,
8]. To stabilize the high lithium-ion conducting cubic garnet phase at room temperature, substitution of Li
7Zr
3La
2O
12 is necessary. Several substituents were investigated in the literature, such as Al, Ta, Ga, Te, W, Fe, or Nb [
9,
10,
11,
12,
13,
14]. Thus far, the highest conductivities were reached using tantalum (1.35 × 10
−3 S/cm) [
15] and gallium (1.84 × 10
−3 S/cm) [
16]. However, as the required substitution levels and their prices are rather high, they also make the material more expensive.
Depending on the application, a balancing between conductivity and price needs to be carefully evaluated. High Li-ion conductivity is crucial for mobile devices, especially in the automotive sector, where fast charging and power densities are important. For other applications, for example, stationary storage, other properties are more crucial, such as safety aspects or price per kWh stored. Especially with respect to cost-effectiveness, Al-doped LLZO is an interesting candidate. Aluminum was one of the first substituents for LLZO that was investigated, initially by accident, since the LLZO samples were sintered in Al
2O
3-crucibles, later on purpose, forming the highly conductive cubic garnet structure [
13,
17]. The highest total Li-ion conductivity reached for Al:LLZO was 6.8 × 10
−4 S/cm [
18]. Since the discovery of highly conductive LLZO, various synthesis routes were investigated to synthesize Al:LLZO, with a classical solid-state reaction being the most common one [
11,
13,
19]. In addition, wet-chemical methods such as sol-gel [
20], Pechini [
21], nebulized spray pyrolysis [
22], chemical co-precipitation [
23], or combustion [
24] were shown to be suitable for the synthesis of Al-doped cubic LLZO. Comparing the results of the different methods is hard since they not only differ in the obtained particle size but also in stoichiometry (especially Al-content) and sintering conditions to obtain the samples for conductivity measurements.
Table 1 shows total conductivities and sintering conditions for some selected Al:LLZO, ranging between 10
−6 and 10
−4 S/cm. It has to be noted that some of the synthesis methods require high amounts of solvents or additives (e.g., the sol-gel and combustion methods), making them unattractive for industrial up-scaling.
In this work, we synthesized Al:LLZO (Li6.4Al0.2La3Zr2O12) via four different synthesis routes with a focus on scalability: solid-state reaction (SSR), solution-assisted solid-state reaction (SASSR), spray-drying (SD), and co-precipitation (CP). We only used water as the solvent and omitted synthesis routes that require additional additives such as sol-gel and the combustion method. Keeping the stoichiometry and sintering conditions constant allows us to evaluate the impact of the different synthesis routes on the electrochemical performance and enables us to evaluate scalability, cost, and industrial applicability.
3. Results
In this study, a substitution of 0.2 mol Al per sum formula was chosen as it results in a fully stabilized cubic phase [
13], resulting in a target composition of Li
6.4Al
0.2La
3Zr
2O
12. The substitution degree was kept constant to make a correct comparison of the impact of the synthesis routes on the final performance of the material. As mentioned in the Introduction, four different synthesis routes were chosen to assess their potential for industrial upscaling. Next to a classical solid-state reaction (SSR) as a dry synthesis route, three different wet-chemical routes based on an aqueous solution were used: spray-drying (SD), co-precipitation (CP), and a solution-assisted solid-state reaction (SASSR). The solution-assisted solid-state reaction method was first used by Ma et al. for the synthesis of NASICON Na-ion solid electrolyte [
29]. We adapted the method for the application of Al:LLZO materials. This synthesis method is similar to the sol-gel method by Pechini but without additional additives, which makes this synthesis route even more viable for an industrial scale.
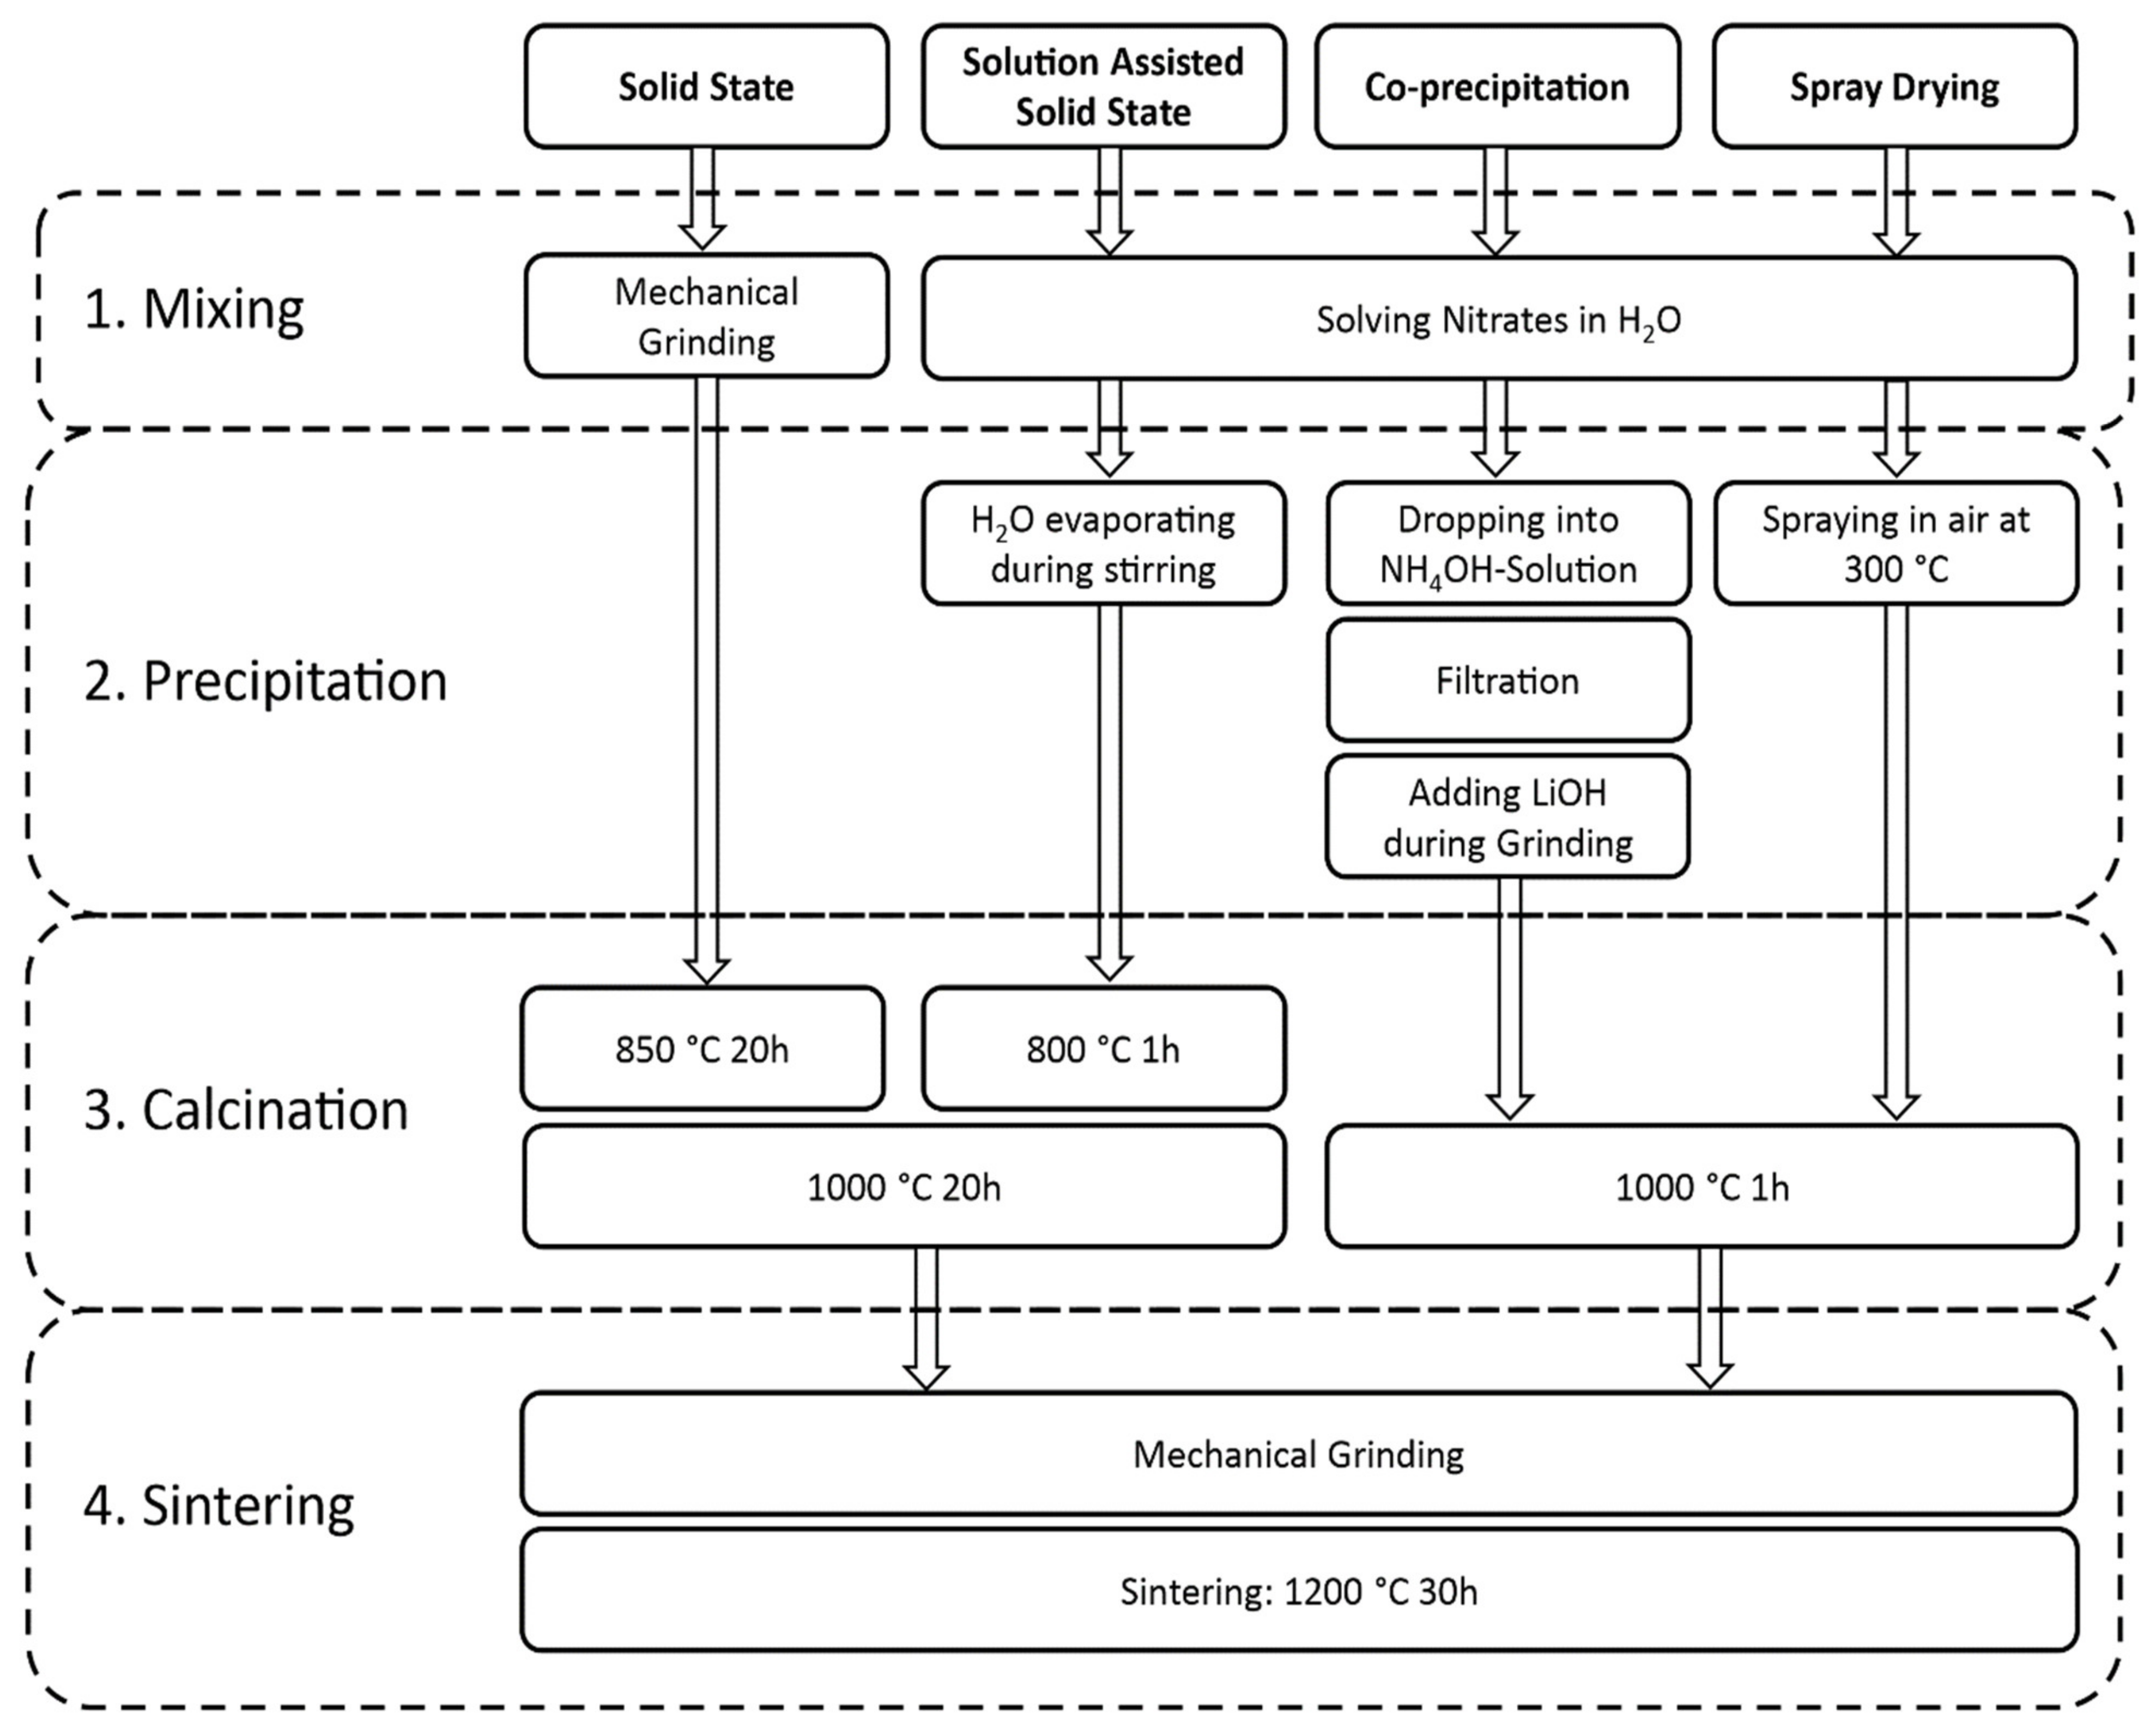
Figure 1 shows a flowchart for the different synthesis methods. All synthesis processes can be divided into four major parts: 1. mixing, 2. precipitation, 3. calcination, and 4. sintering.
The mixing of the precursors for the SSR is completed mechanically with an electrical mortar grinder. A SEM picture of the mixed powder can be seen in
Figure S1a in the supporting information. For the wet-chemical methods, the nitrate-based precursors are solved in a nitric acid solution to ensure mixing on an atomic scale.
The precipitation step is omitted for the solid-state reaction but is the major difference in the three wet-chemical methods. In SASSR, the water is slowly evaporated while the aqueous solution is heated at 150 °C and stirred. During the slow evaporation, different stages can be observed, which are similar to a sol-gel reaction: first, the mixture becomes milky, while under further heating and stirring, a gel is formed, which is finally dried.
Figure S1b–d shows the as precipitated material for the three different wet chemical synthesis routes. During co-precipitation, the nitric acid solution (without Li) is dropped into a NH
4OH solution with a pH value of 9.5. Under these conditions, lanthanum, zirconium, and aluminum are precipitated as hydroxides. They were filtrated, dried, and afterward mixed with LiOH in an electrical mortar. The main advantage of this method is that the anionic species are washed out, and therefore different precursors can be used. Thus, cheap precursors, such as halides, which are often produced during the refining of metal ores, can be used. The fastest precipitation occurs during the spray-drying process. Here, the nitrate solution is sprayed into 300 °C hot air as fine droplets that dry immediately, leaving the precipitate residues as hollow spheres, shown in
Figure S1d.
During calcination, the hydroxides, nitrates, and eventual carbonates are thermally decomposed, resulting in the final oxidic specimens. Thermogravimetric curves for the precipitated/mixed precursor materials are compiled in
Figure 2. The nitrate species that were precipitated during water evaporation (SASSR and SD) show a very similar thermal decomposition behavior. The mass loss is up to 55% with hardly any change above 650 °C. The hydroxide species (SSR and CP) show a lower mass loss of up to 30%. No further significant loss is observed here above 800 °C. Corresponding DTA measurements are shown in
Figure 2b, showing no significant activity above 800 °C except in the SSR sample.
From the TG/DTA measurements, it can be assumed that the calcination is completed at 800 °C for all samples except the SSR sample, where all activities are finished at 900 °C. To assure complete conversion, we chose a slightly higher calcination temperature of 1000 °C, which has been shown to be sufficient in previous works [
9,
11,
30]. The powders from SD and CP synthesis can be directly calcined at 1000 °C for just 1 h to obtain a fully cubic garnet structure. The materials obtained by SSR and SASSR require an additional pre-calcination step at 800 or 850 °C before the final calcination at 1000 °C for 20 h results in a fully cubic garnet.
Figure 3a shows the diffraction pattern for all synthesis methods after the final calcination step at 1000 °C. The purest material was achieved by SSR, showing no additional impurity peaks in the pattern. From the lattice parameter of the SSR sample, we calculated the crystallographic density of 5.123 g/cm
3, which serves as a reference for the density calculations. All wet-chemical routes show minor additional peaks, which can be identified as the Li
2ZrO
3 phase, as can be seen in
Figure 3b. Additionally, the powder synthesized via co-precipitation shows some additional reflection at 28° and 33° 2Θ, which was identified as pyrochlore-phase La
2Zr
2O
5 (see
Figure 3c). ICP-OES results of the material after calcination and sintering are shown in
Figure S2 in the supporting information. In particular, the Al content of the sintered CP sample shows a strong deviation from the target value, which could be the reason for the pyrochlore formation.
The amounts of secondary phases are quite low so that no major effects on the sintering behavior are to be expected. We expect a little effect on the electrochemical performance of the material due to the lower ionic conductivity of Li
2ZrO
3 and the insulating nature of the pyrochlore phase La
2Zr
2O
5. To determine the amount of the impurities, Rietveld refinements were performed for each sample. The results of the refinement can be seen in
Table S2.
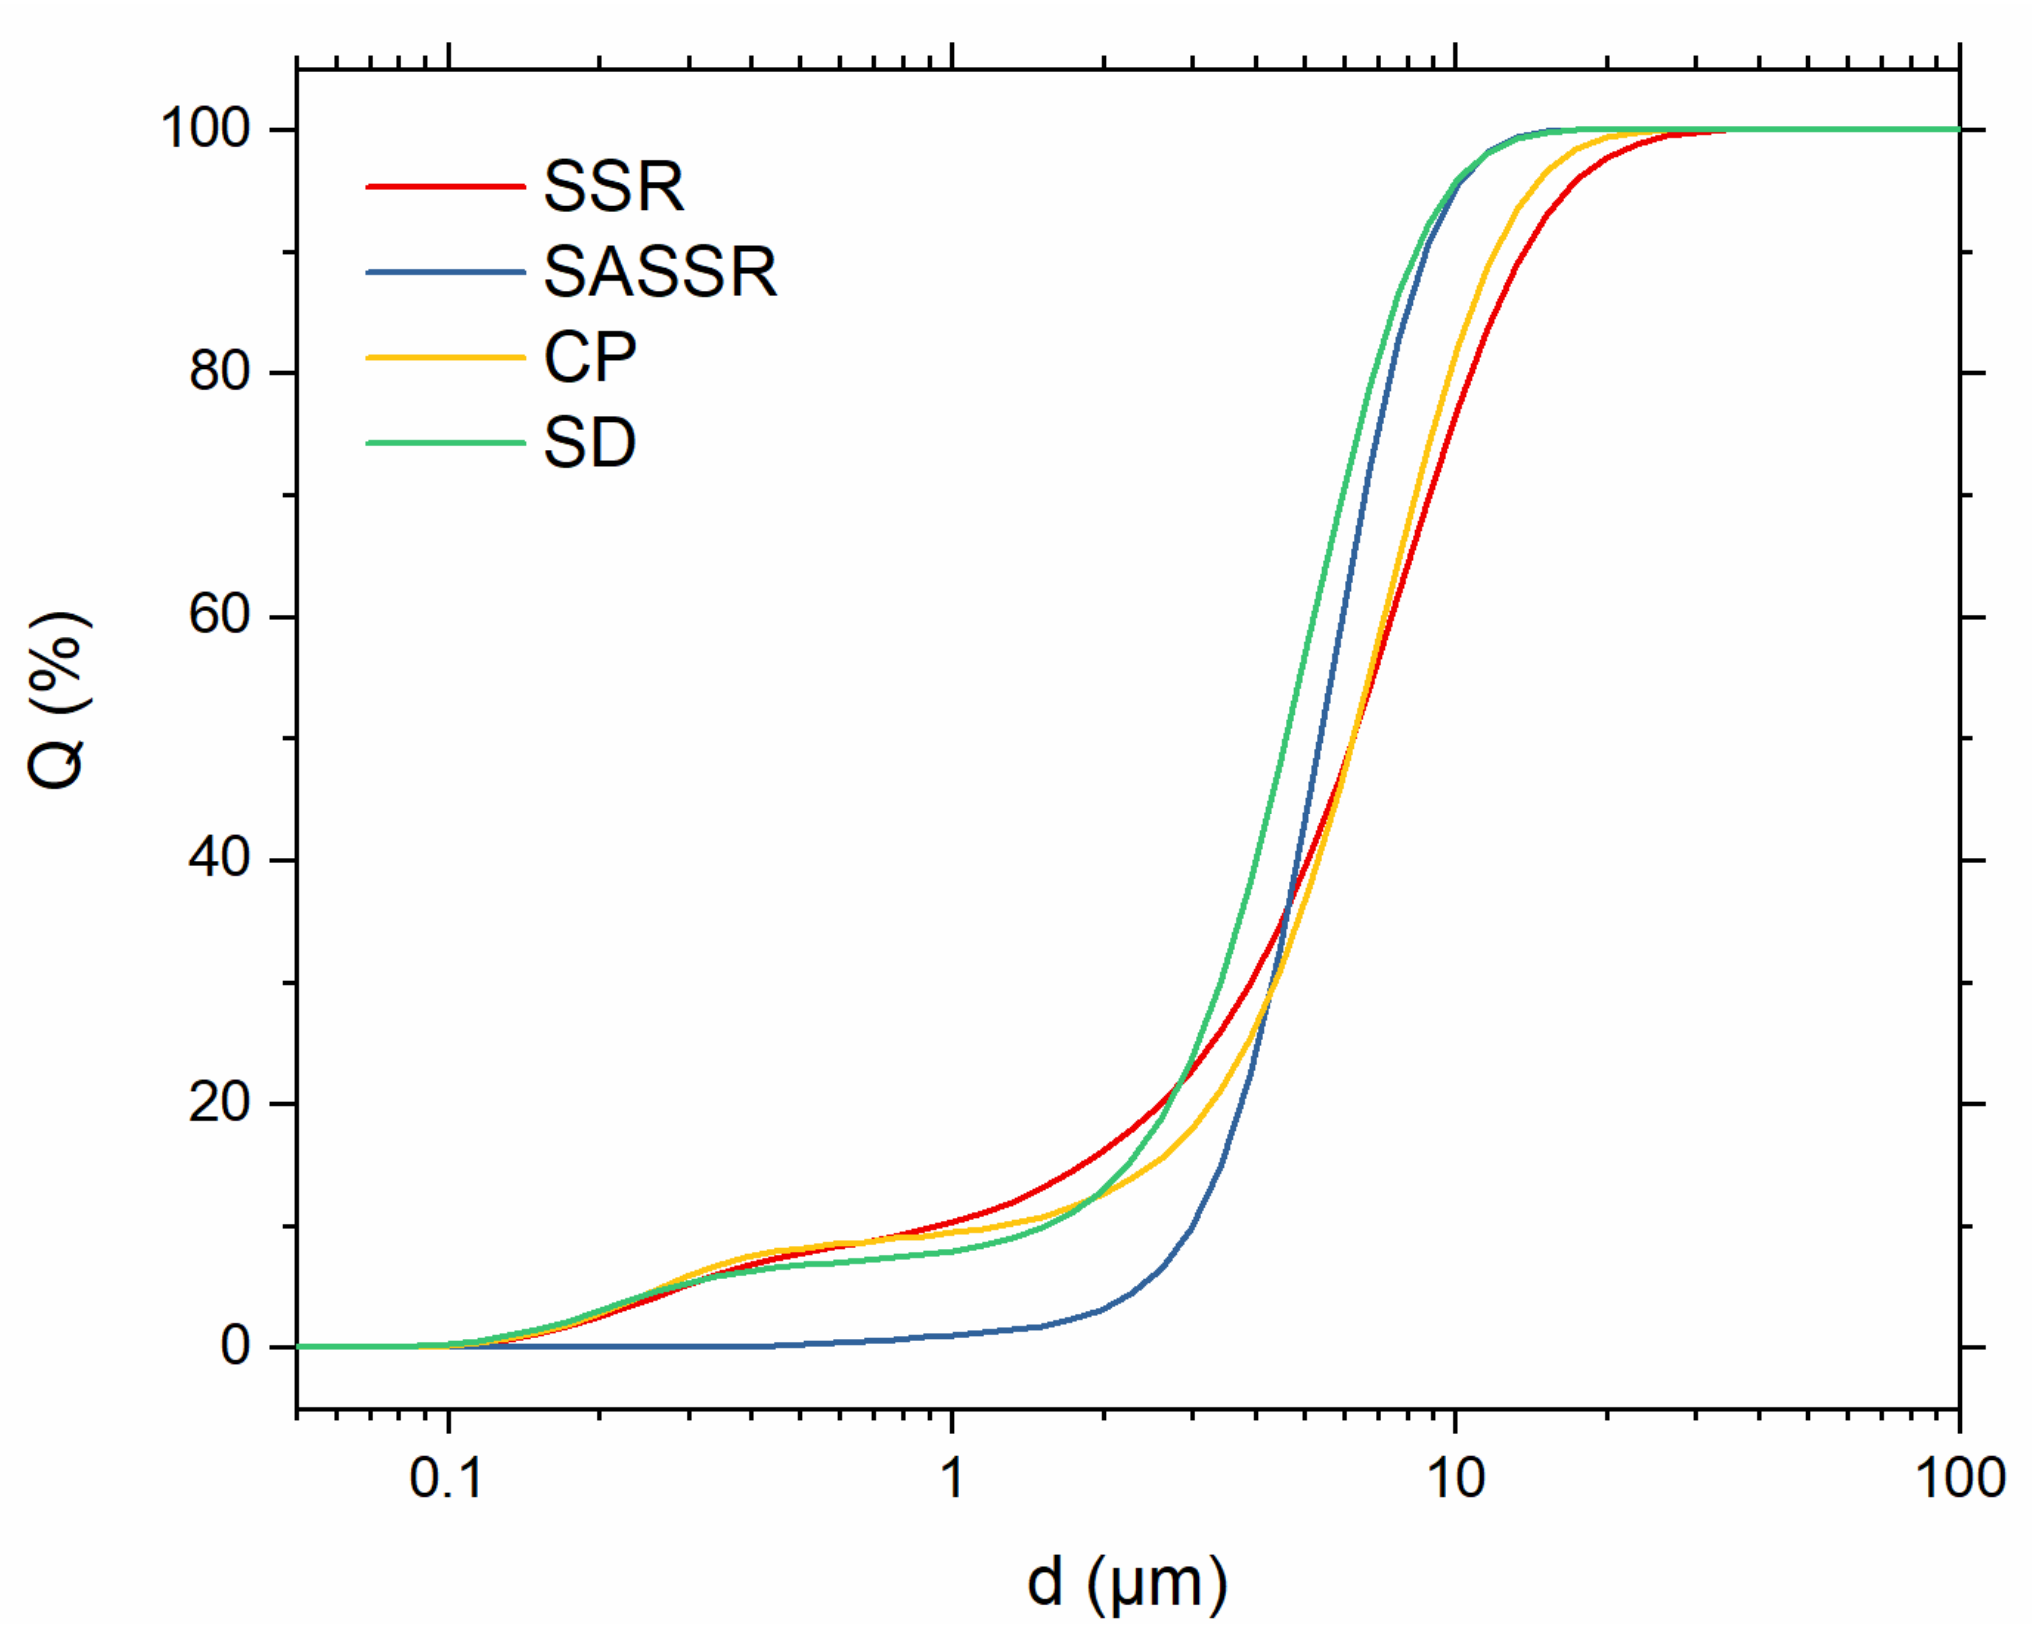
Before sintering, the powders were ground using an auto grinder to mill down larger agglomerates and, in the case of SSR, further homogenize the powder. Particle size distributions of the powders before sintering are shown in
Figure 4 and
Table 2. The particle sizes (d
50) are quite similar for all powders and range from 4.60 to 6.22 μm. The narrowest distribution was achieved via the SASSR with particle sizes between 3.0 μm (d
10) and 8.70 μm (d
90). All other powders show a bilateral distribution, with a smaller d
10 value of around 1 μm and a larger d
90 value of 8.34–13.71 μm. The SSR and CP powders have the broadest distribution with the smallest d
10 and highest d
90 values for all powders.
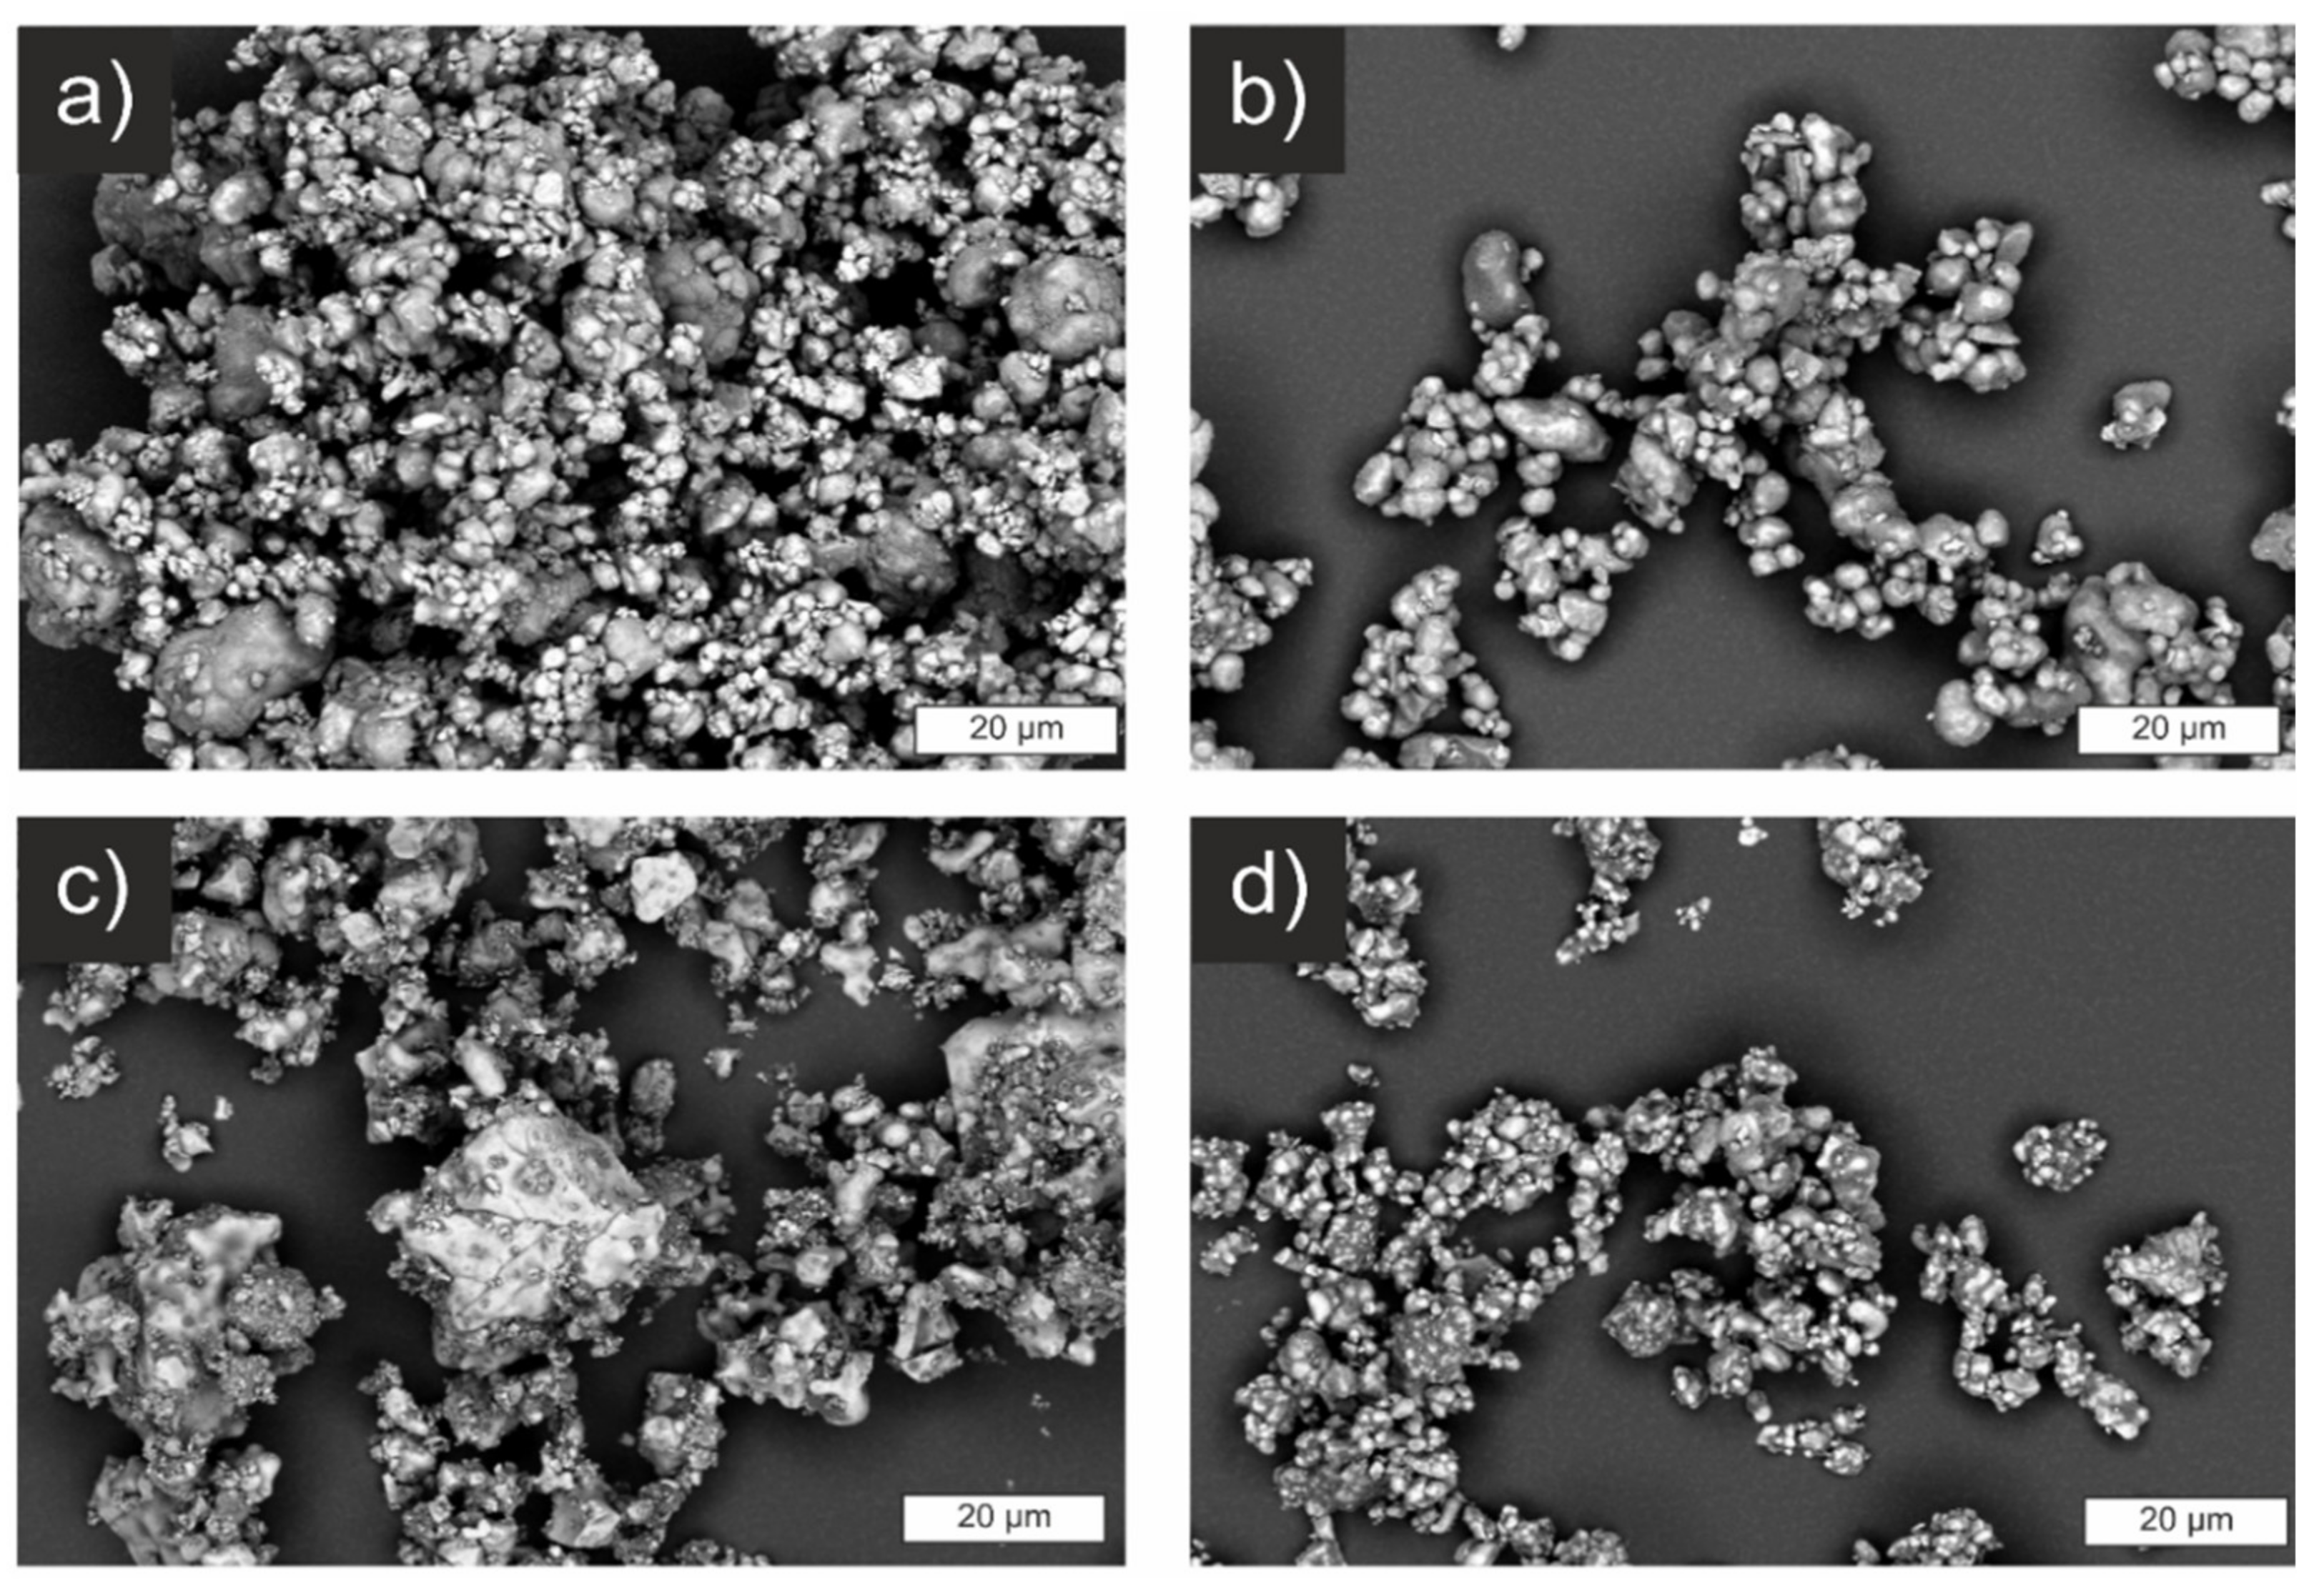
Electron micrographs of the powders before sintering are shown in
Figure 5. The images strongly confirm the results of the laser-scattering measurements with primary particles in the range of a couple of µm. SSR and CP show larger particles next to smaller ones, while the powder of SASSR is more homogeneous but with generally bigger particles. Especially for the SSR-synthesized powder, larger agglomerates of approx. 50–100 µm are apparent. These were only weakly bound and were easily destroyed during the ultrasonic treatment before the laser-scattering measurement. The only deviation is observed for the SD sample. Similar to the SSR sample, larger agglomerates of smaller particles are visible (
Figure 5d). However, the agglomerate size apparent in the micrographs falls within the range measured via light scattering. Thus, they are probably harder and not as easily destroyed by ultrasonic treatment, shifting the measured PSD to higher values. Even though the SD powder already showed the smallest particle size in the laser-scattering measurement, it can be assumed that the de-agglomeration was not complete, and the real particle sizes are even smaller.
To investigate the sintering behavior, dilatometry measurements for all four powders were performed and are compiled in
Figure 6. The densification of the powders produced by SSR and SASSR starts at around 1100 °C and shows a very similar shrinkage behavior. The powder from CP shows some shrinkage around 700 °C. Together with the XRD data, one could suggest that the calcinated powder is not fully converted yet, and a chemical reaction towards LLZO can be observed here. The actual onset of densification is, similar to SSR and SASSR, at 1100 °C. Again, the SD powder shows a different trend. Shrinkage already starts at 1000 °C, which is 100 °C lower than for the other three. Most likely, this behavior is due to the much smaller primary particle size obtained in the spray-drying process, which results in higher sintering activity [
31].
To keep the conditions similar for all samples, the sintering temperature was set at 1200 °C. At this temperature, all powders are sintering and shrinking. The sintering time was set to 30 h to ensure the highest density for all powders. By excluding the impact of sintering time and temperature, our samples only show differences in relative density of 90 ± 3%, making them ideal for further electrochemical analysis. In an industrially scaled process, the sintering temperature and time would, of course, be adapted to obtain the required density, component performance, and cost target.
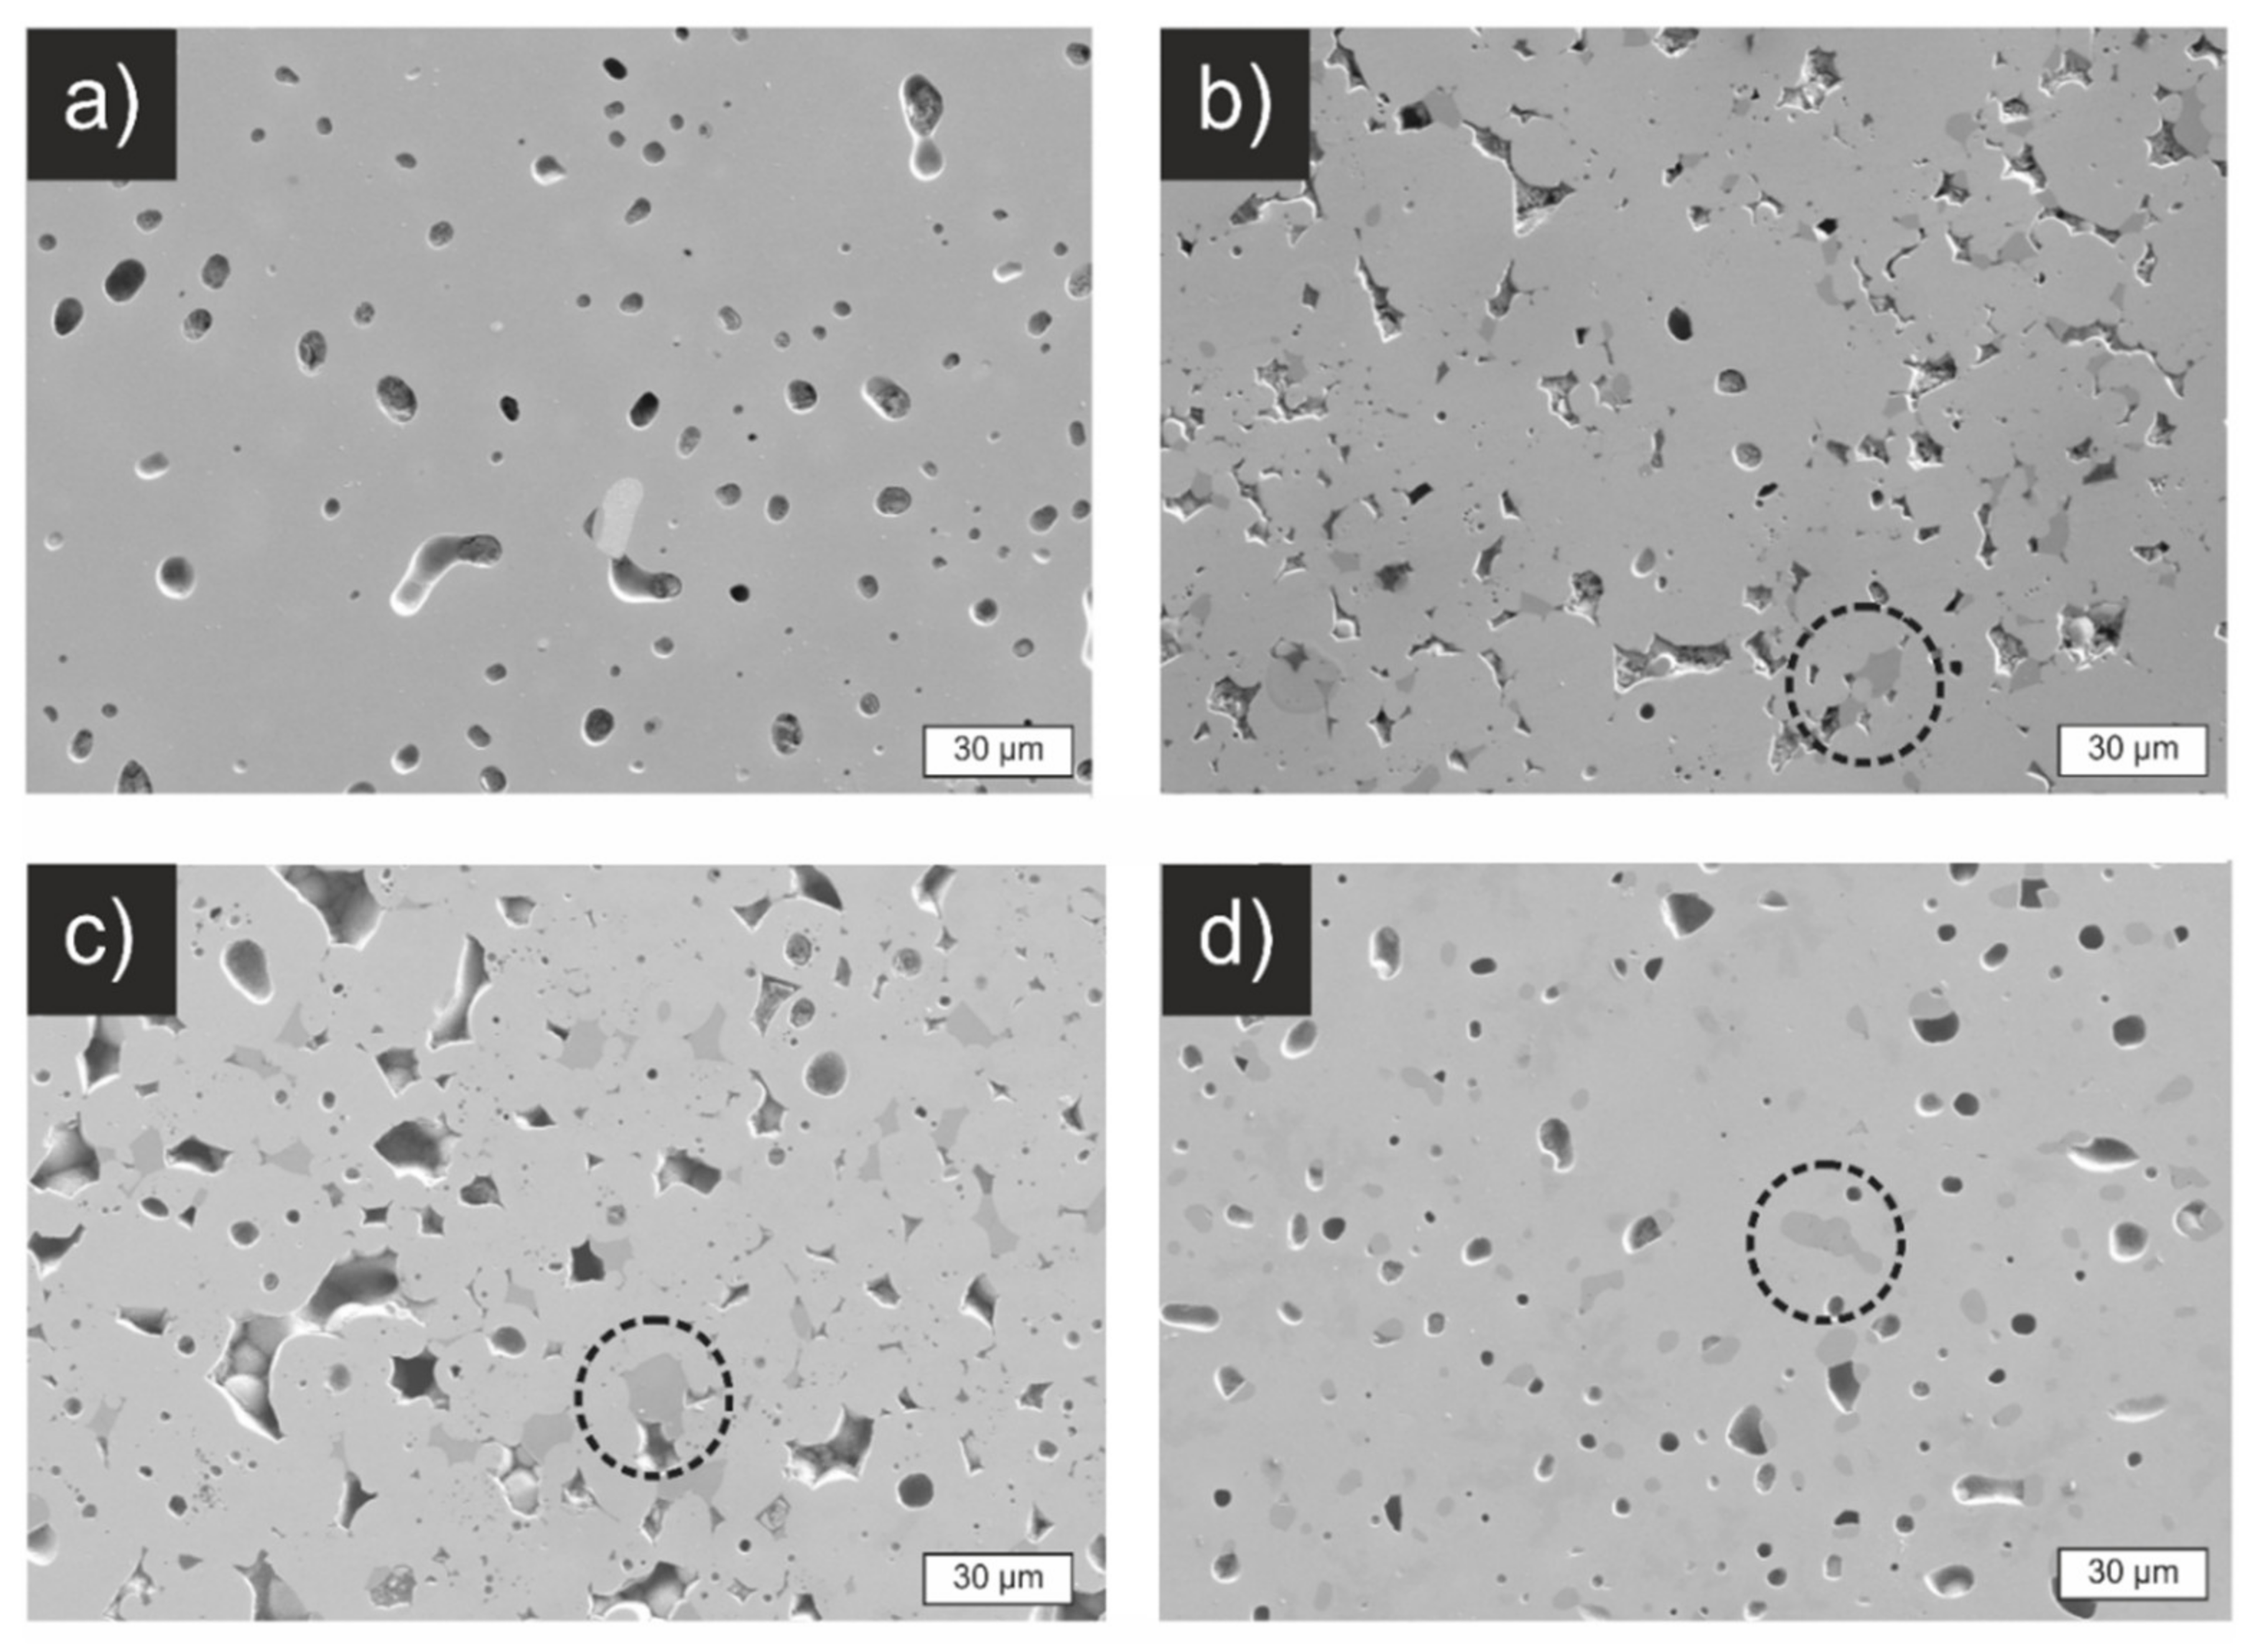
Figure 7 shows polished cross-sections of sintered pellets from the four different materials. The SSR pellet (
Figure 7a) shows 93% relative density and features a closed porosity with pore sizes of around 10 µm. The pellets from SASSR and CP show a higher, more open porosity, as can be seen in
Figure 7b,c. This is also reflected in a lower relative density, around 87% (
Table 3). They also show darker areas that can be explained by the secondary Li
2ZrO
3 phase that is also observable in the XRD pattern (
Figure S3 in the supporting information). The cross-section of the SD sample is again similar to the SSR with closed porosity and a relative density of 93%. Since the same morphology is observed for the SD and SSR samples, an effect of the minor Li
2ZrO
3 phase on the sintering behavior can be excluded.
The XRD pattern (
Figure S3) of crushed and ground pellets shows that the cubic garnet phase is not influenced by the rather long sintering procedure. The wet-chemical synthesis routes still show the small impurity of Li
2ZrO
3, which was already observed in the calcined material. The CP sample shows a shoulder, indicating a splitting into the tetragonal garnet phase, but the small pyrochlore phase observed in the calcined powder is not visible any longer. This confirms the assumption that a chemical reaction takes place between the pyrochlore phase and the excess LiOH during the sintering process, producing cubic LLZO. A similar reaction was previously observed in LLZO produced via flame-spray pyrolysis [
32] and could also contribute to the unusual shrinkage behavior of this material observed in TG/DTA (
Figure 6).
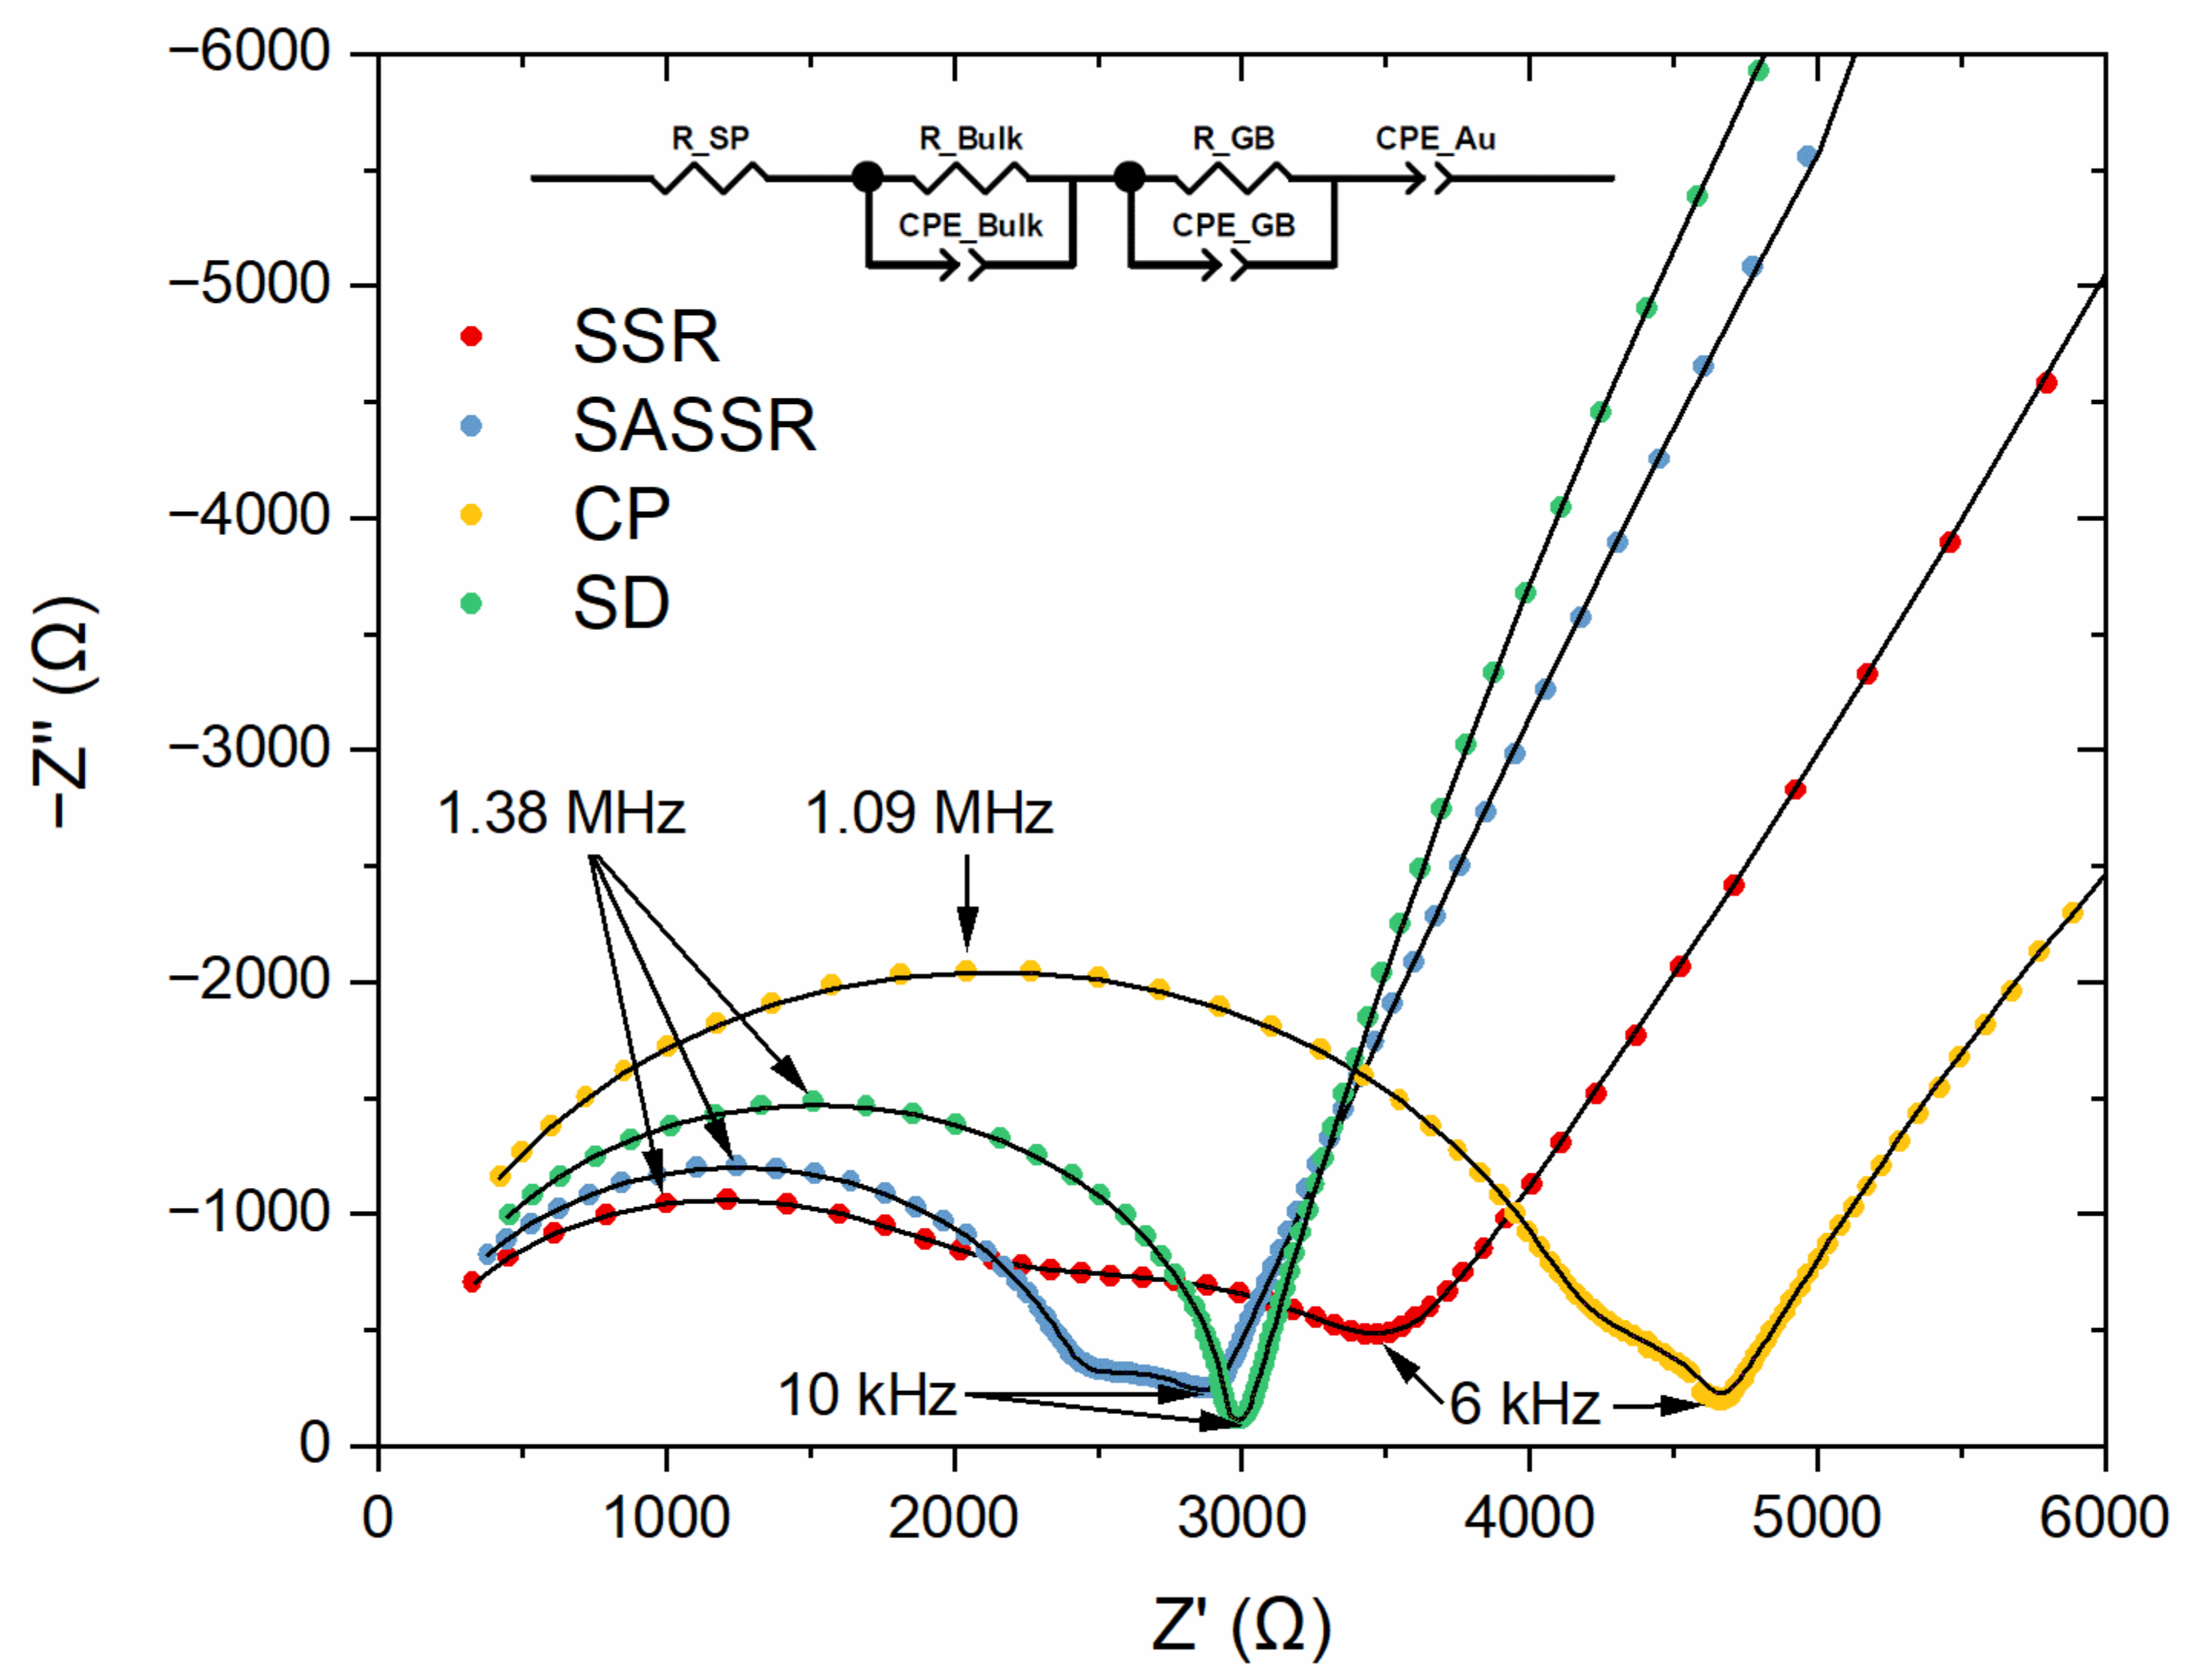
The electrical properties of the samples were investigated using impedance spectroscopy.
Figure 8 shows the Nyquist plots and the fits of the impedance spectra for all samples. The spectra show two contributing semicircles in the high-frequency range and a capacitive tail in the low-frequency region. The semicircles correspond to the bulk resistance and the grain boundary resistance of LLZO and can be described with two R-CPE elements. For the samples with side phases, an additional resistor (
RSP) was necessary for a good description. The low-frequency tail is a clear sign for ion-blocking electrodes, typical for gold electrodes, and may be described, for example, by a CPE element, as reported before [
4,
9].
In order to assign the R-CPE elements to the corresponding physical counterparts, the effective capacitance
C was calculated from the fitted resistance
R, CPE coefficient
Q, and the exponential parameter α (Equation (1)). [
33,
34] α describes the non-homogeneity in the system. For example, a rough or porous surface can cause a double-layer capacitance to appear as a constant phase element with an α value between 0.9 and 1. The case α = 1 describes an ideal capacitor, while the case α = 0 describes a pure resistor. For the mentioned capacitance calculation, α should be at least 0.75. The fitted resistances and effective capacitances can be found in
Table 4.
The capacitances fit quite well to the reported values for the bulk (10
−11 F) and the grain boundaries (10
−7–10
−9 F) of an ion conductor and are in the same regime as shown for Al:LLZO samples with similar Al concentrations in literature before [
35,
36]. However, the lower capacitance combined with higher resistance (SSR) and the higher capacitance with lower resistance (SD) indicate a larger and smaller amount of grain boundaries, respectively. This is due to the grain sizes in the sintered materials [
37] and shows a better grain growth for wet-chemical routes. All resistances and the pellet geometry (L, S) were used to calculate the total ionic conductivity σ
total, respectively; only
RBulk was used to calculate the bulk conductivity σ
Bulk of LLZO (Equation (2)). The conductivity of the grain boundaries was calculated from the pellet geometry, the fitted grain boundary resistance, and the ratio of bulk and grain boundary capacitance (Equation (3)) [
38,
39]. The calculated conductivities can be found in
Table 4.
The total conductivities mirror the density and the purity of the materials, the highest σtotal being observed in the SD sample (3.28(3) × 10−4 S/cm), followed by SSR (3.14(7) × 10−4 S/cm), which are also the two samples with the highest observed density. The CP sample shows the lowest σtotal (2.02(2) × 10−4 S/cm), and SASSR has a mediocre σtotal of 2.64(3) × 10−4 S/cm. The phase purity shows its influence on the bulk conductivities of the materials. While the pure SSR product shows bulk conductivity of 5.19(7) × 10−4 S/cm, the materials with only Li2ZrO3 contamination show just ~64% of this conductivity. It becomes even further reduced to 44% if the tetragonal LLZO phase is present. As can be seen in the SEM images, the side phases form grains within the LLZO phase and therefore lower the conductivity due to an effective prolonged path for lithium ions. The grain boundary conductivities of all routes are quite similar and typically one to two orders of magnitude lower than the bulk conductivity (σGB ≈ 10−5–10−6 S/cm). However, the large errors also reveal the limitations of the calculation method, and this calculation is only used to calculate the order of magnitude of σGB.
In total, the impedance spectra show that the atomic mixing of the wet-chemical routes results in clean interfaces between the grains and supports grain growth, while the SSR route seems to have higher grain boundary resistances due to diffusion-controlled chemical processes in precursor particles.
4. Discussion
This discussion will focus on connecting the obtained material parameters, such as phase purity, particle size, sintering behavior, density, and conductivity, to a cost-sensitivity analysis for industrial production of Al:LLZO via the four synthesis routes. Even though a specific price estimate is only possible for industrial material manufacturers, we are still able to identify possible cost advantages (or at least sensitivities) of the used synthesis methods with respect to precursor price, effective workload, scale-up potential, and calcination time. Unfortunately, we are not able to assess the initial investment cost for equipment, although it is an important factor for industrial production.
To enable this comparison, we show, in the Results section, that all material parameters were similar after sintering.
Table 5 summarizes the main results for a better discussion.
If performed correctly, all four synthesis methods yield the same high-quality powder in terms of material parameters. In each case, cubic Al:LLZO with a purity of at least 93% and total Li-ion conductivity of at least 2 × 10⁻⁴ S/cm was achieved. The fact that the electrochemical performance is relatively independent of the synthesis route is a result of the sintering conditions we chose, which were specifically selected to demonstrate that the desired properties can be achieved by all four routes, which allows a cost-sensitivity analysis.
For an industrial production process of all-solid-state batteries, the particle size distribution will also be highly relevant since it has a major impact on the sintering behavior in the component-manufacturing step. Unfortunately, since we cannot analyze all possible component manufacturing processes and requirements, the impact of the particle size obtained in synthesis and its resulting impact on sintering behavior needs to be omitted from the cost-sensitivity analysis.
Nevertheless, an evaluation of the scaling potential of each synthesis route is possible, using five synthesis parameters that have the highest impacts on the price of the final material:
Precursor price—raw material cost;
Calcination time (as a measure of energy cost);
Scale—initial investment and output (economy of scale);
Workload—personnel costs;
Material performance.
The parameters given here are experimental results from our laboratory-scale production. It is important to keep in mind that when upscaling to large-scale industrial production, parameters such as workload and scale may differ drastically from those of laboratory production.
4.1. Precursor Price
The main advantage of the solid-state reaction is that relatively cheap oxidic precursors can be used. In comparison to this, the wet-chemical synthesis methods require much more expensive solvable species. In our case, we used nitrate species, but in general, it should be possible to use all soluble and flammable compounds, such as organic materials. Here, co-precipitation has another advantage. Since its anionic species are not burned out like in SD and SASSR but washed out during the filtration step, cheaper, non-combustible species such as halides might also be suitable. The prices for the precursors will drop dramatically when large quantities of the material are needed. However, the ratios between the different kinds of materials will stay similar. For example, will nitrates always be more expensive than oxides?
4.2. Calcination Time
At 40 h, the SSR requires, by far, the longest calcination time. The educts are physically mixed and ground. The grains must react with each other, and the final product is formed by the relatively slow solid-state diffusion. It is reduced to 21 h for SASSR due to the atomical premixing in the solution. However, since it is dried by a relatively slow water-evaporation process, not all reactants precipitate at the same time, and segregation occurs to some extent. A longer calcination step is still required. This demixing is avoided in the CP and SD processes. Here, the precipitated product is mixed at the atomic level, no slow diffusion is required, and the calcination time is reduced to only 1 h.
Long calcination times at high temperatures are crucial within continuous processes, which are required for large-scale industrial production. Not only does the energy cost drop by reducing the calcination time, but the investment price also drops, since smaller furnaces are sufficient for shorter calcination times.
4.3. Scale
We are in a comfortable position to have a pilot plant-sized spray dryer in our institute, which can produce up to 1 kg Al:LLZO per hour. Therefore, scaling up this synthesis into a kg scale was rather easy. The other routes were performed on a normal lab scale between 0.05 and 0.1 kg. As described in the introduction, all of these methods are saleable and already established in the industry on large scales for other materials. Thus, we set the scale to max (kg range) for all four methods to distinguish them from experimental methods such as nebulized spray pyrolysis, etc., which are not easily scalable and produce only mg amounts.
4.4. Workload
Again, the presence of the pilot plant spray dryer reduces the workload drastically in comparison to the other methods. The solid-state reaction is pretty much straightforward, requiring more equipment but keeping the effective workload relatively low. In addition, the solid precursors are easier to handle and require less attention from the manufacturer. In contrast, SASSR, and especially CP, require quite a large amount of effort in the lab. This might change on an industrial scale but, in our opinion, follows a similar overall trend.
4.5. Material Performance
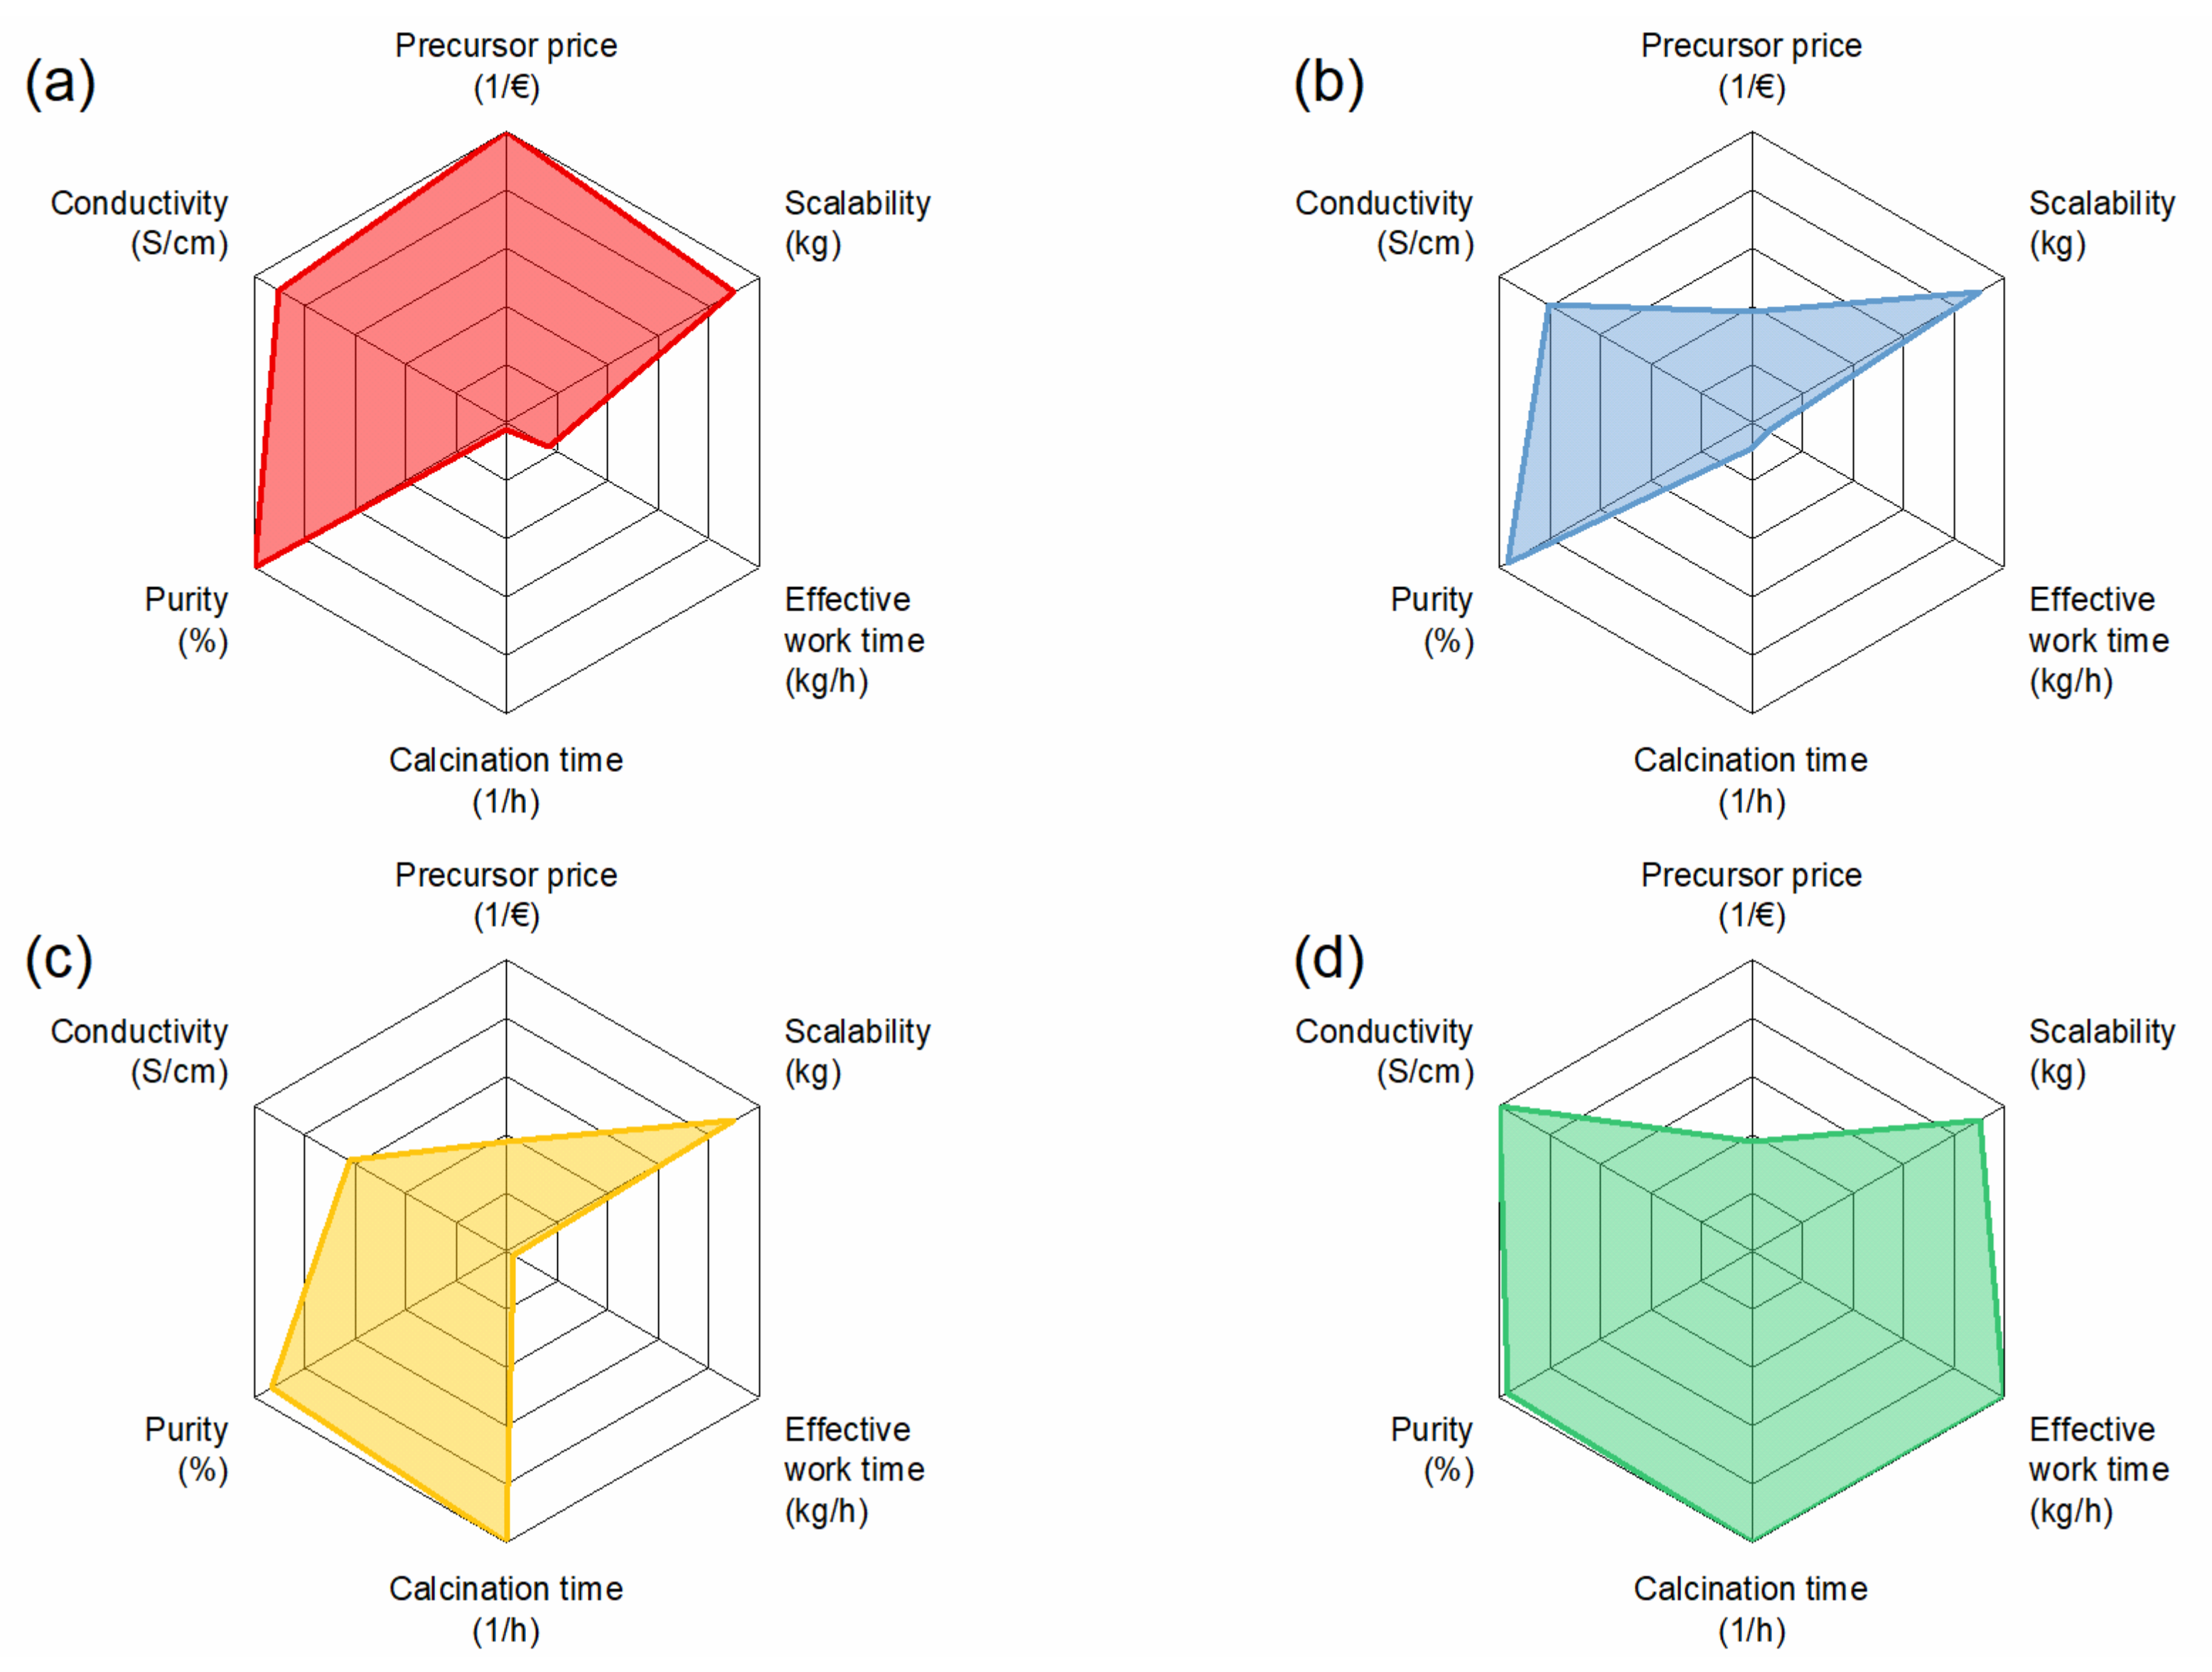
In our process, we chose long and high sintering conditions to omit the differences between the powders (particle size, sinterability) to obtain a maximal high-performing LLZO pellet. Still, there are small differences between the sintered pellets. While the total conductivity is very similar, there are big differences in the grain boundary resistance, which is significantly lower for the wet-chemical routes in comparison to the SSR. The density is around 90% for all samples and the highest for SSR and SD. The phase purity was high for all samples, but the CP route, in particular, produced an unwanted pyrochlore phase, which is why it ranks slightly lower than the other three. However, we are sure that with an optimized process design, the side phases can be avoided. To compare material performance with the cost-determining parameters, we chose conductivity and purity for comparison.
For better visualization of the evaluation, the parameters were plotted in a radar plot for each synthesis, as can be seen in
Figure 9. From the results, the solution-assisted solid-state reaction has the lowest potential for low-cost production of Al:LLZO due to long calcination times and only medium precursors prices. The solid-state reaction scores particularly well in terms of precursor price, which makes it attractive for scaling up, but it also has disadvantages in terms of calcination time, which leads to high energy costs. Co-precipitation has a high potential as it requires low calcination times and allows the use of cheaper precursors, but purity needs to be tightly controlled to achieve optimal performance. Overall, the highest potential for low-cost production of Al:LLZO was determined as the spray-drying route, with the lowest calcination time and workload, compensating for the medium precursor prices.


 ,
, 


