
Durability and Self-Sealing Examination of Concretes Modified with Crystalline Waterproofing Admixtures


Abstract
:1. Introduction
1.1. Crystalline Waterproofing Admixtures (CWA): Background
1.2. Effects of CWA on Concrete Properties
1.3. Effects of CWA on Concrete Self-Sealing
1.4. Effects of CWA on Concrete Properties: Authors Previous Findings
1.5. Methodological Approach and Research Significance
2. Experimental Methodology
2.1. Materials and Mixture Proportions
2.2. Specimen Preparation
2.3. Items of Investigation
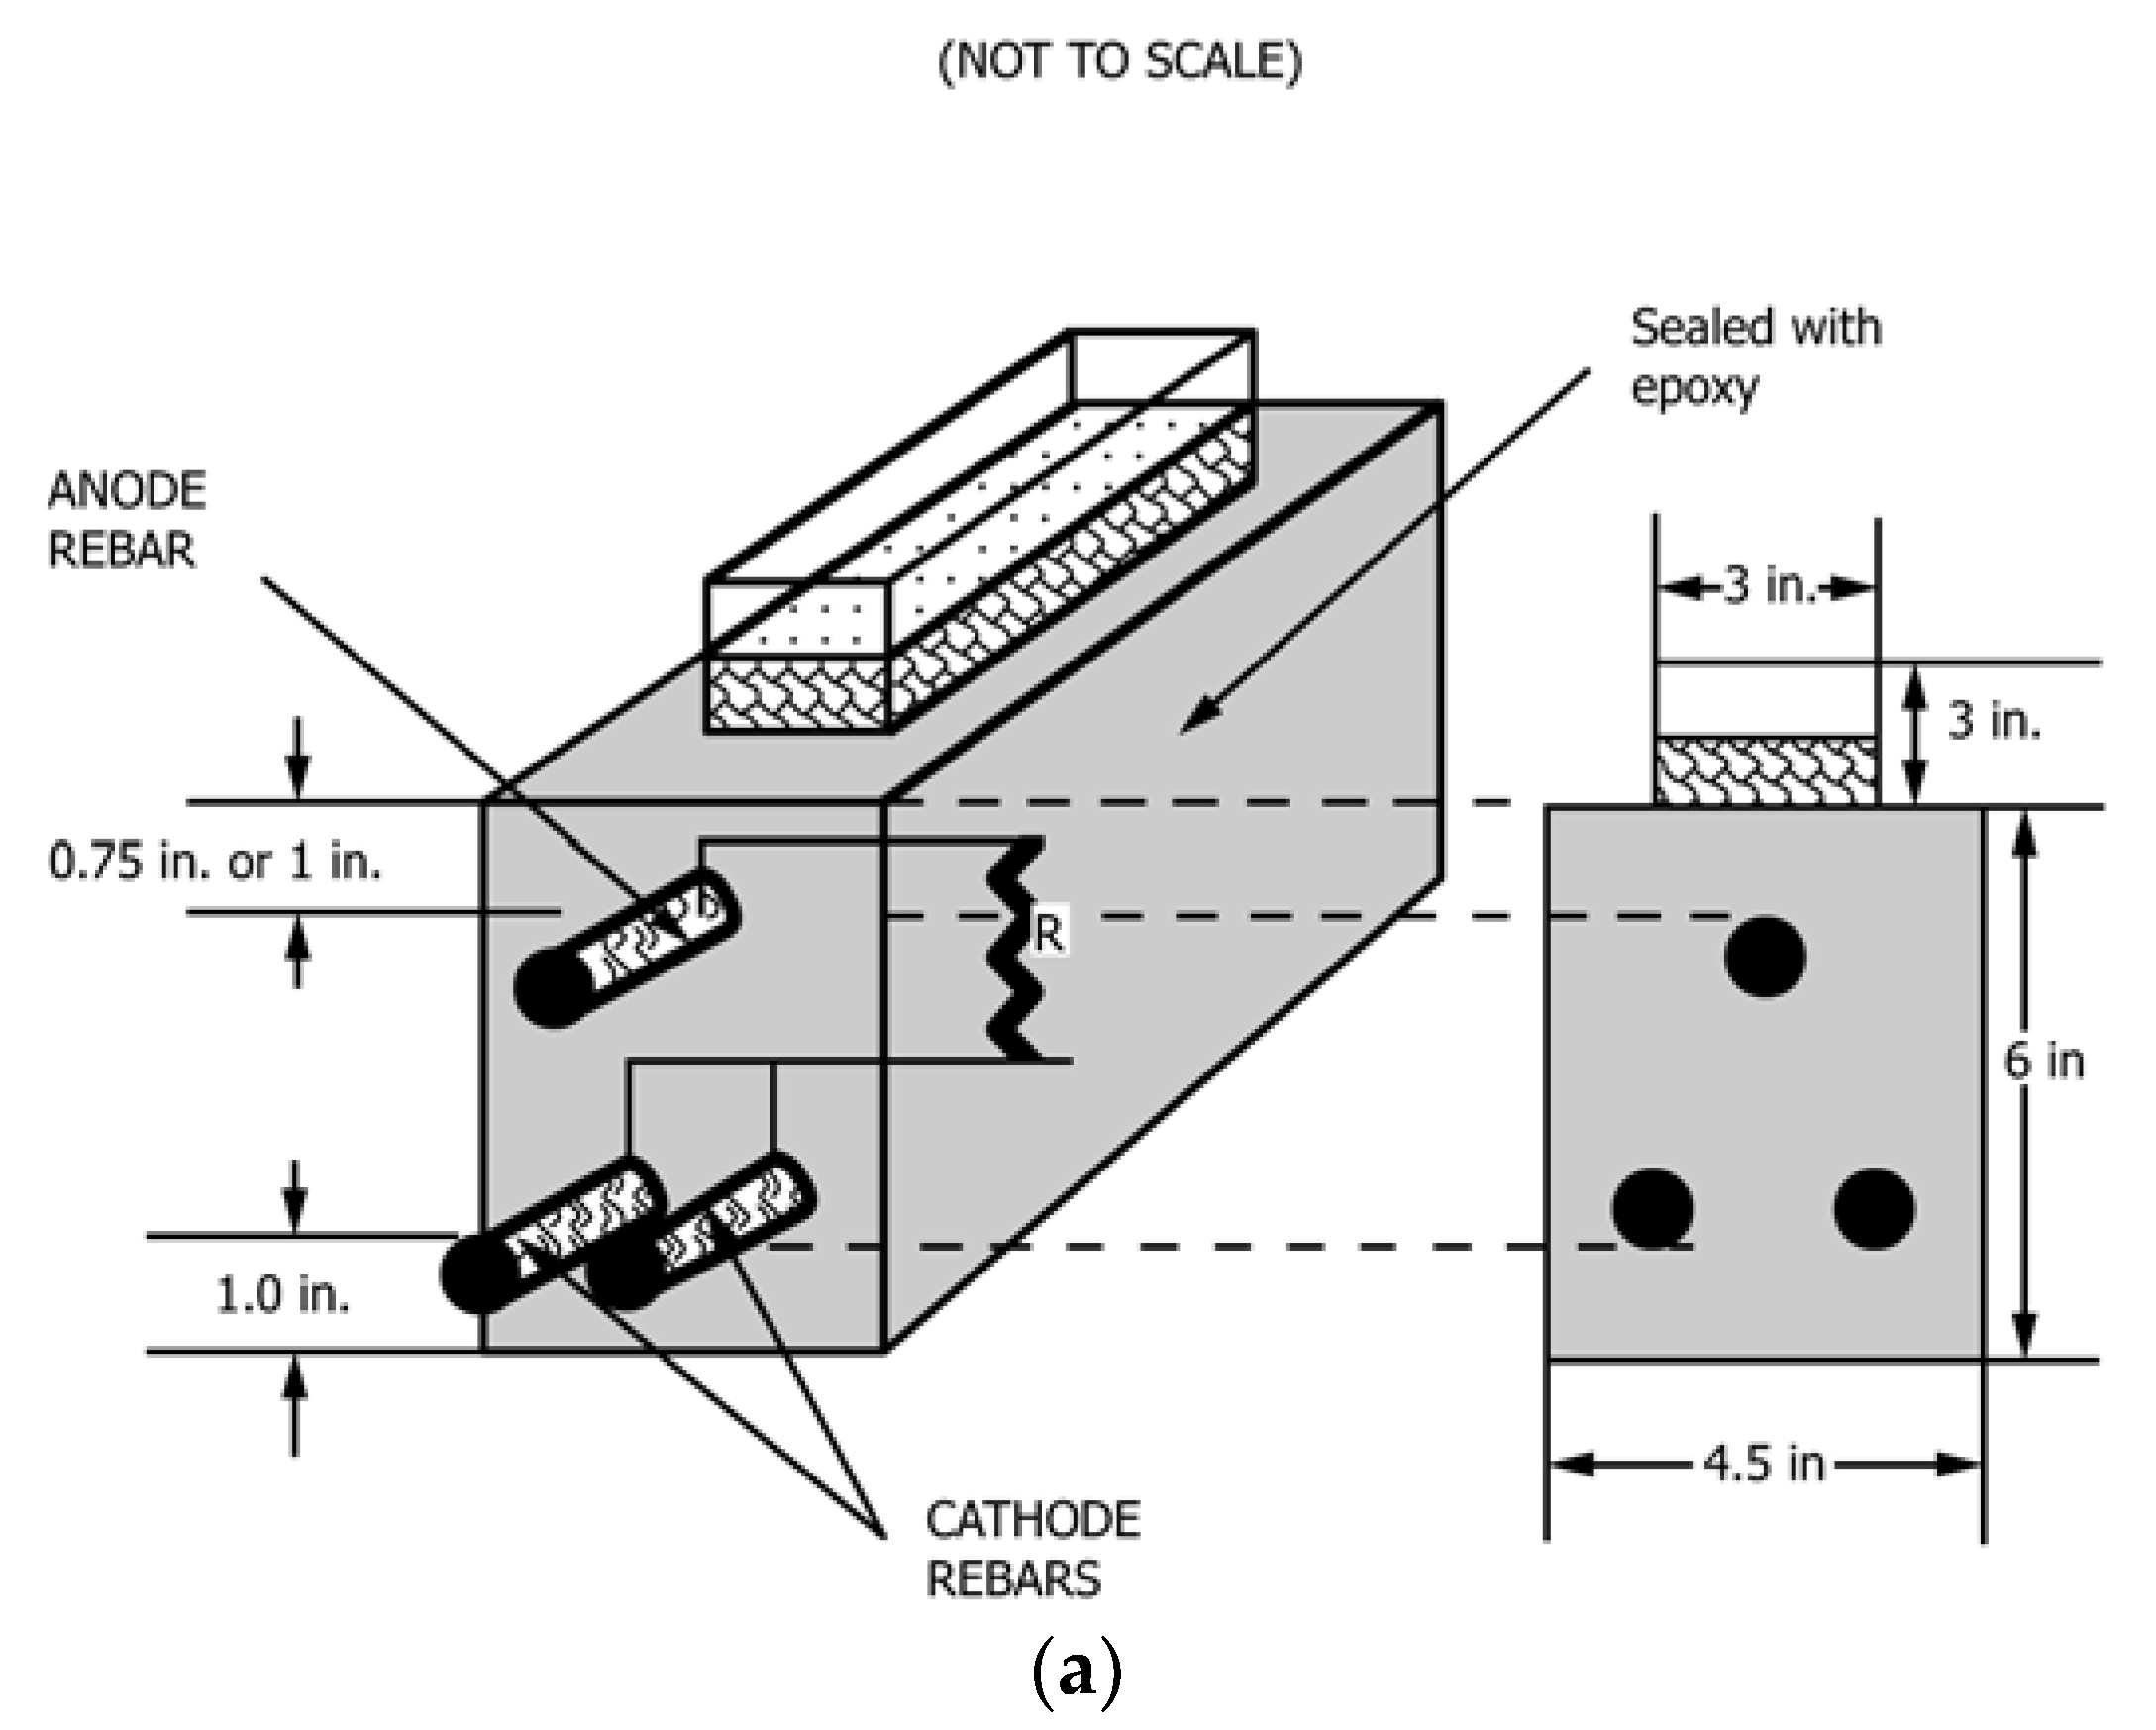
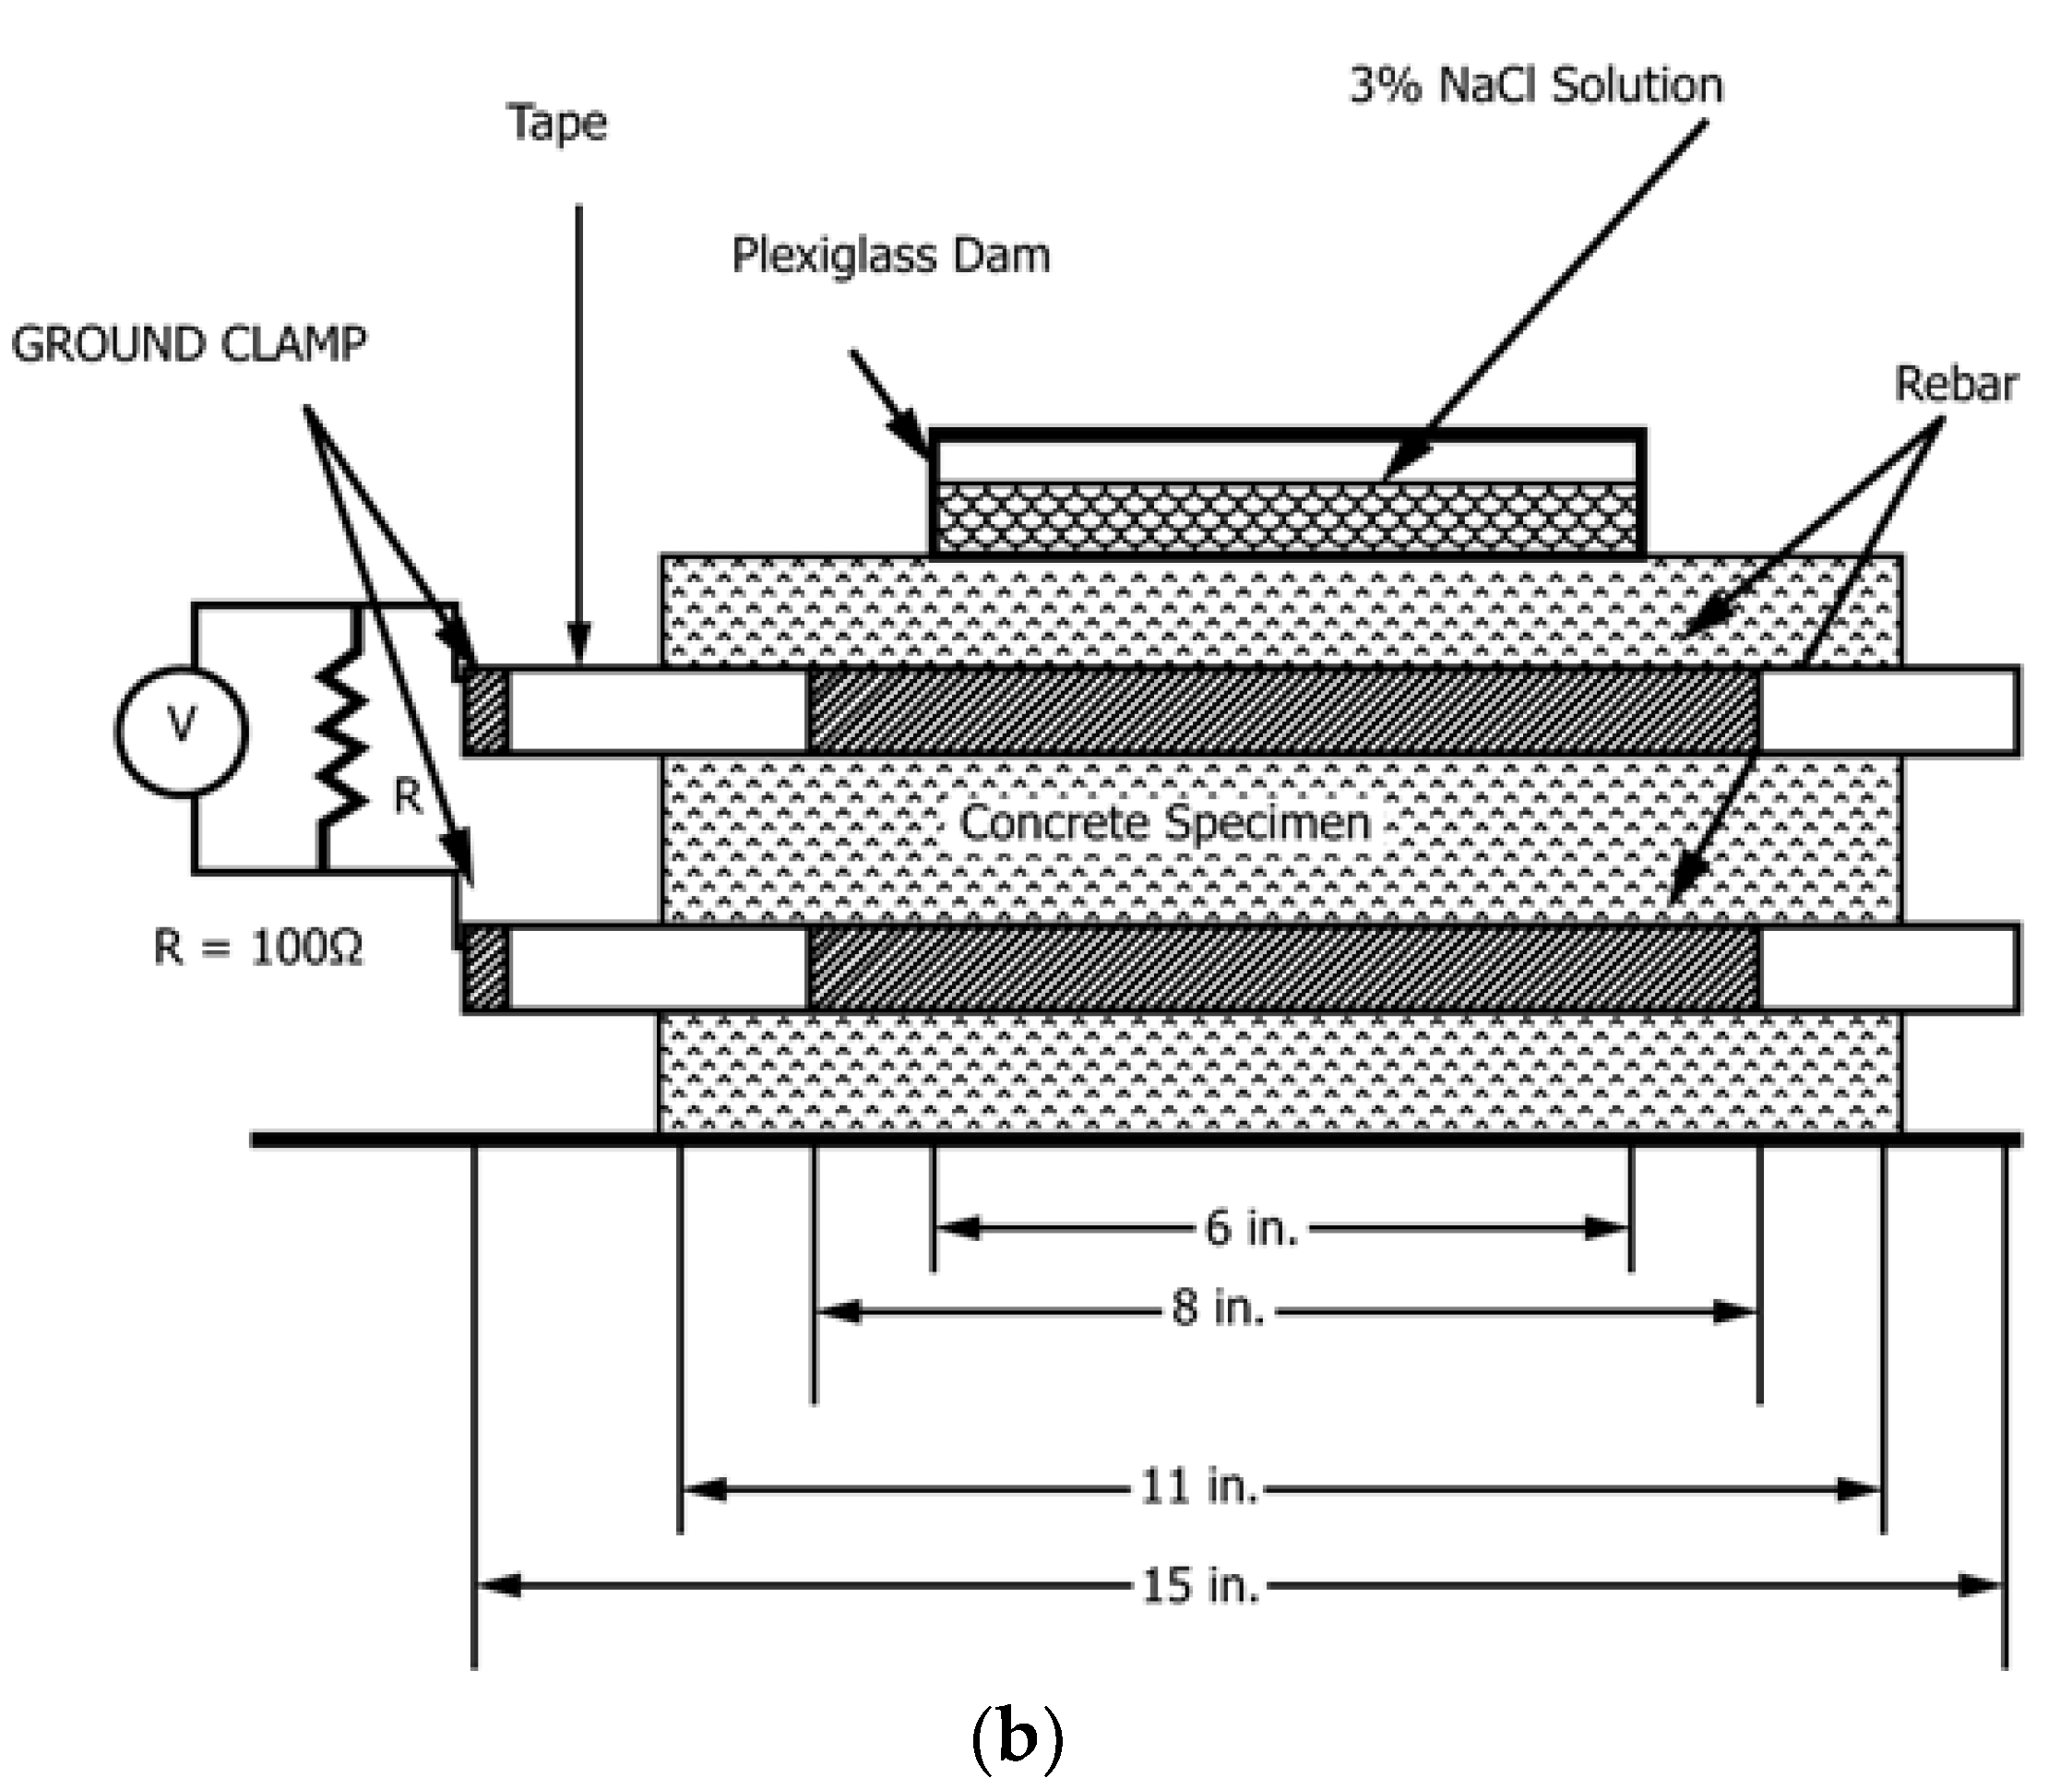
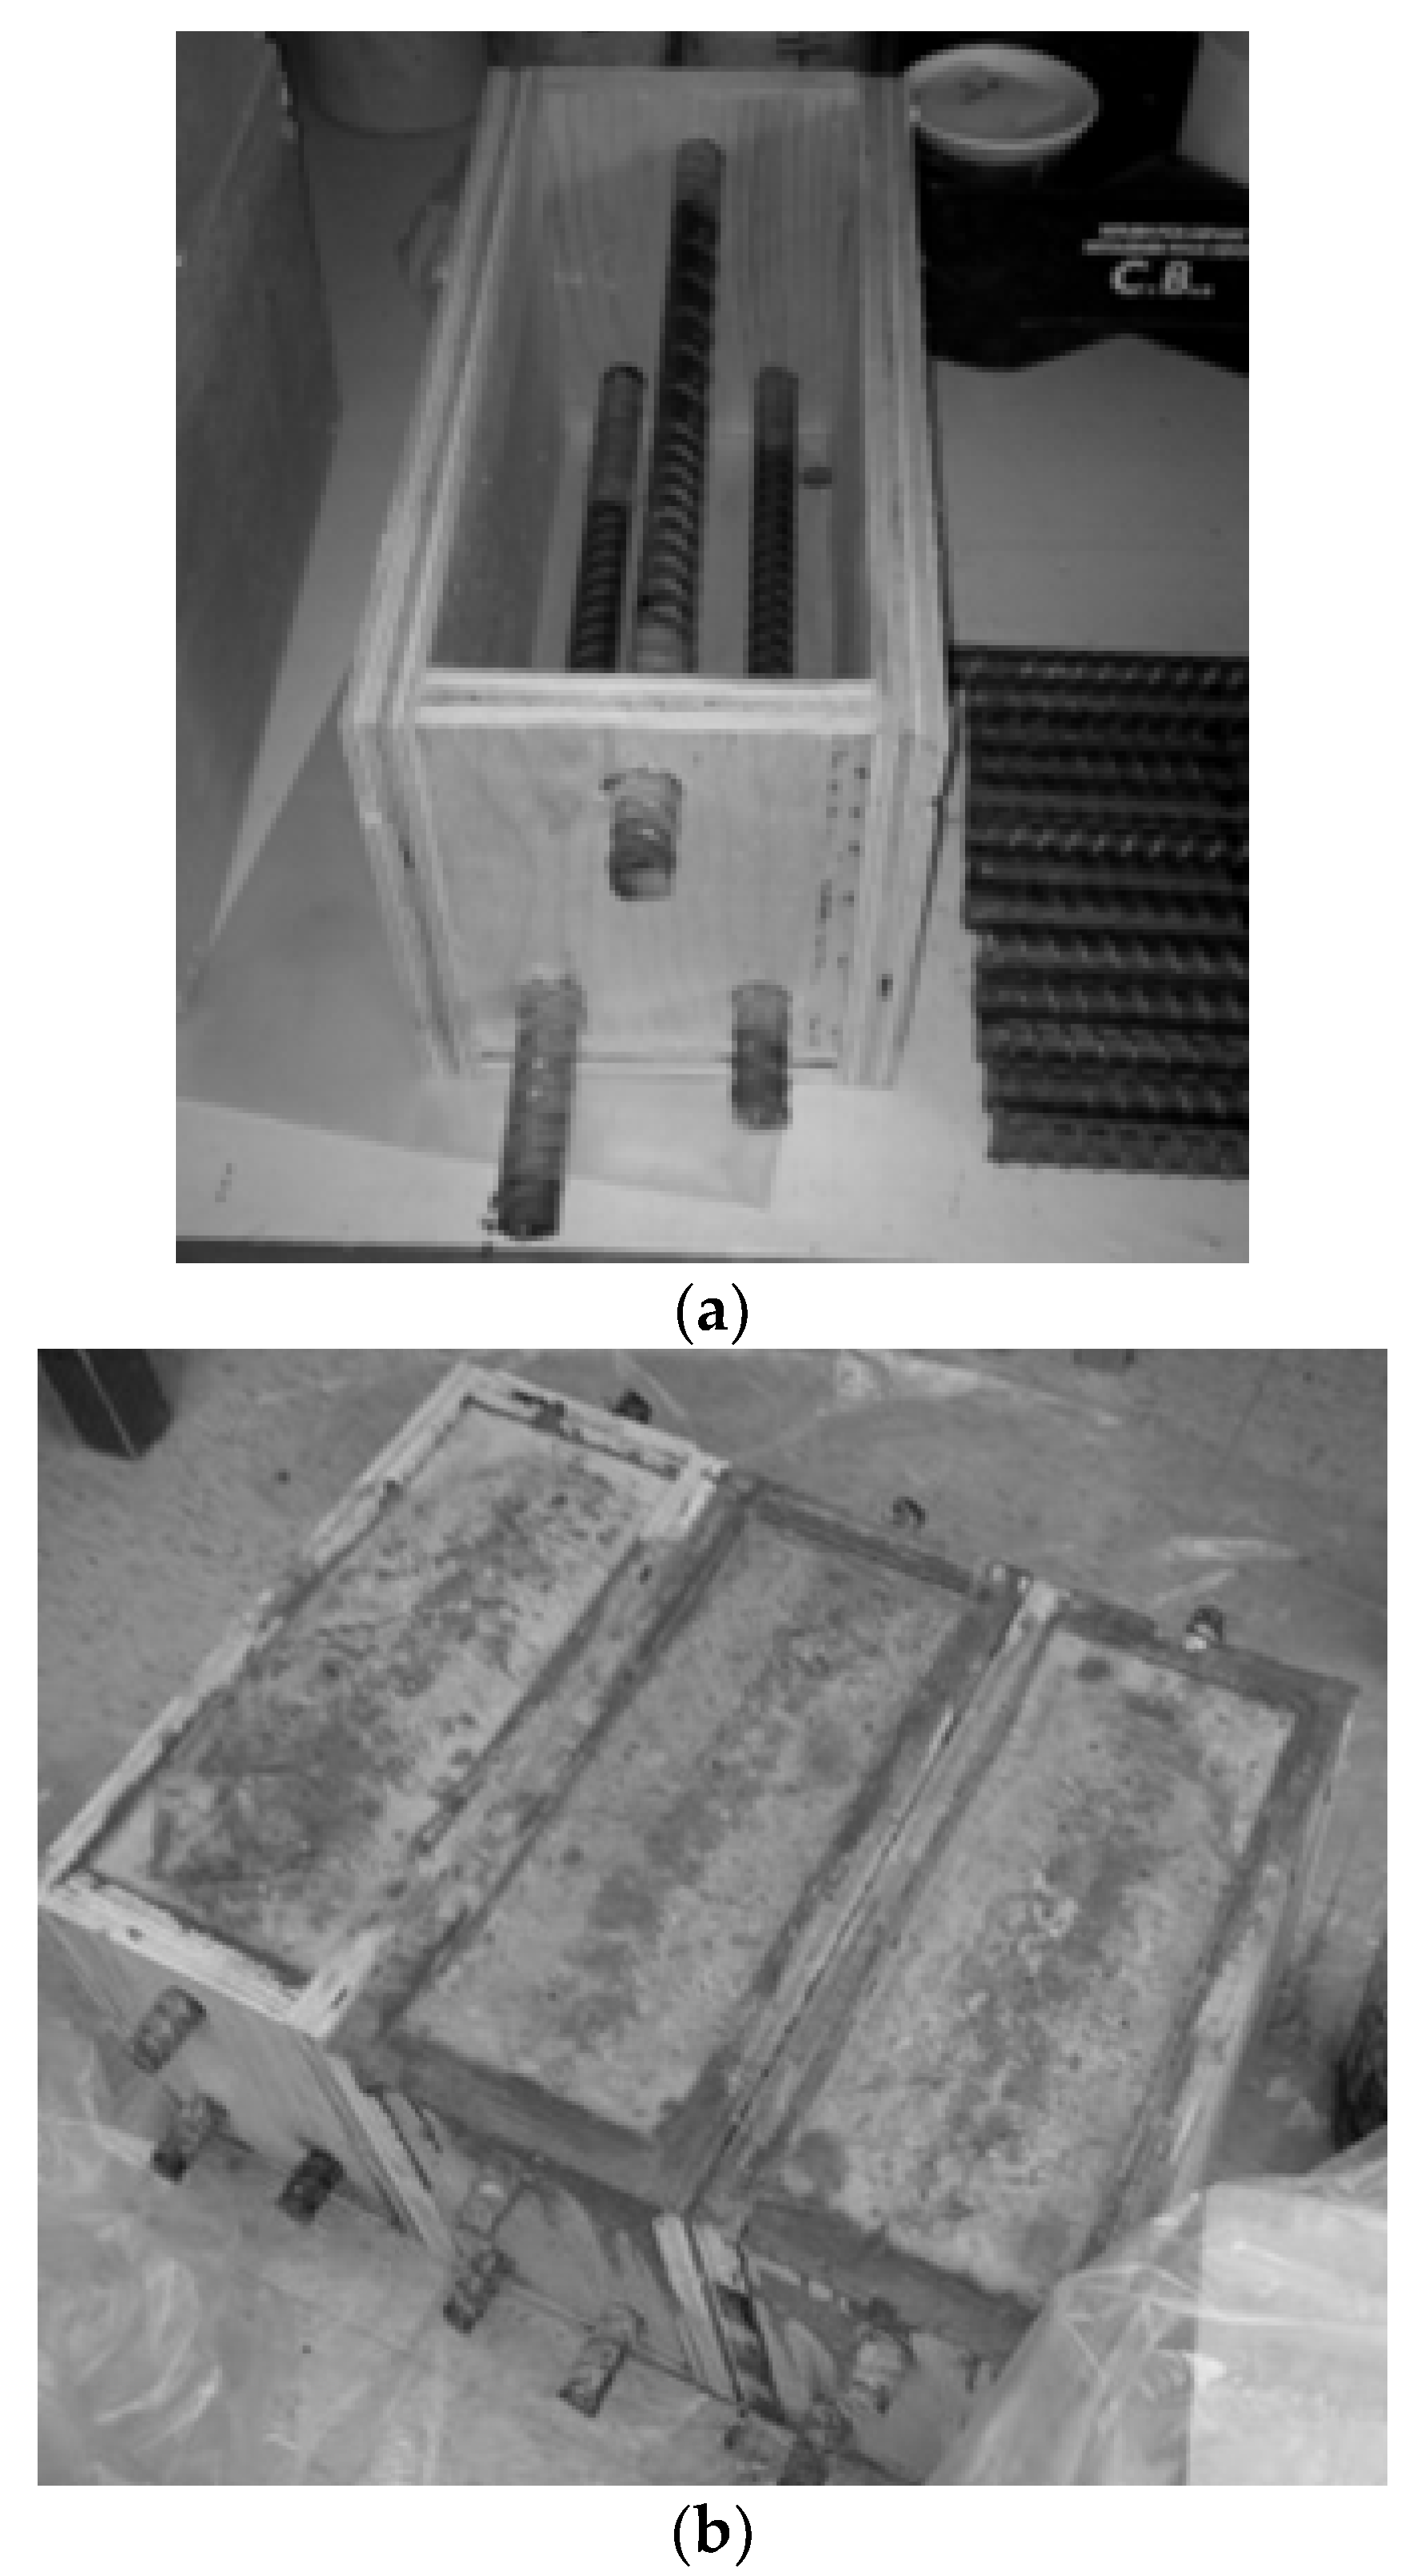
2.3.1. Steel Reinforcement Corrosion
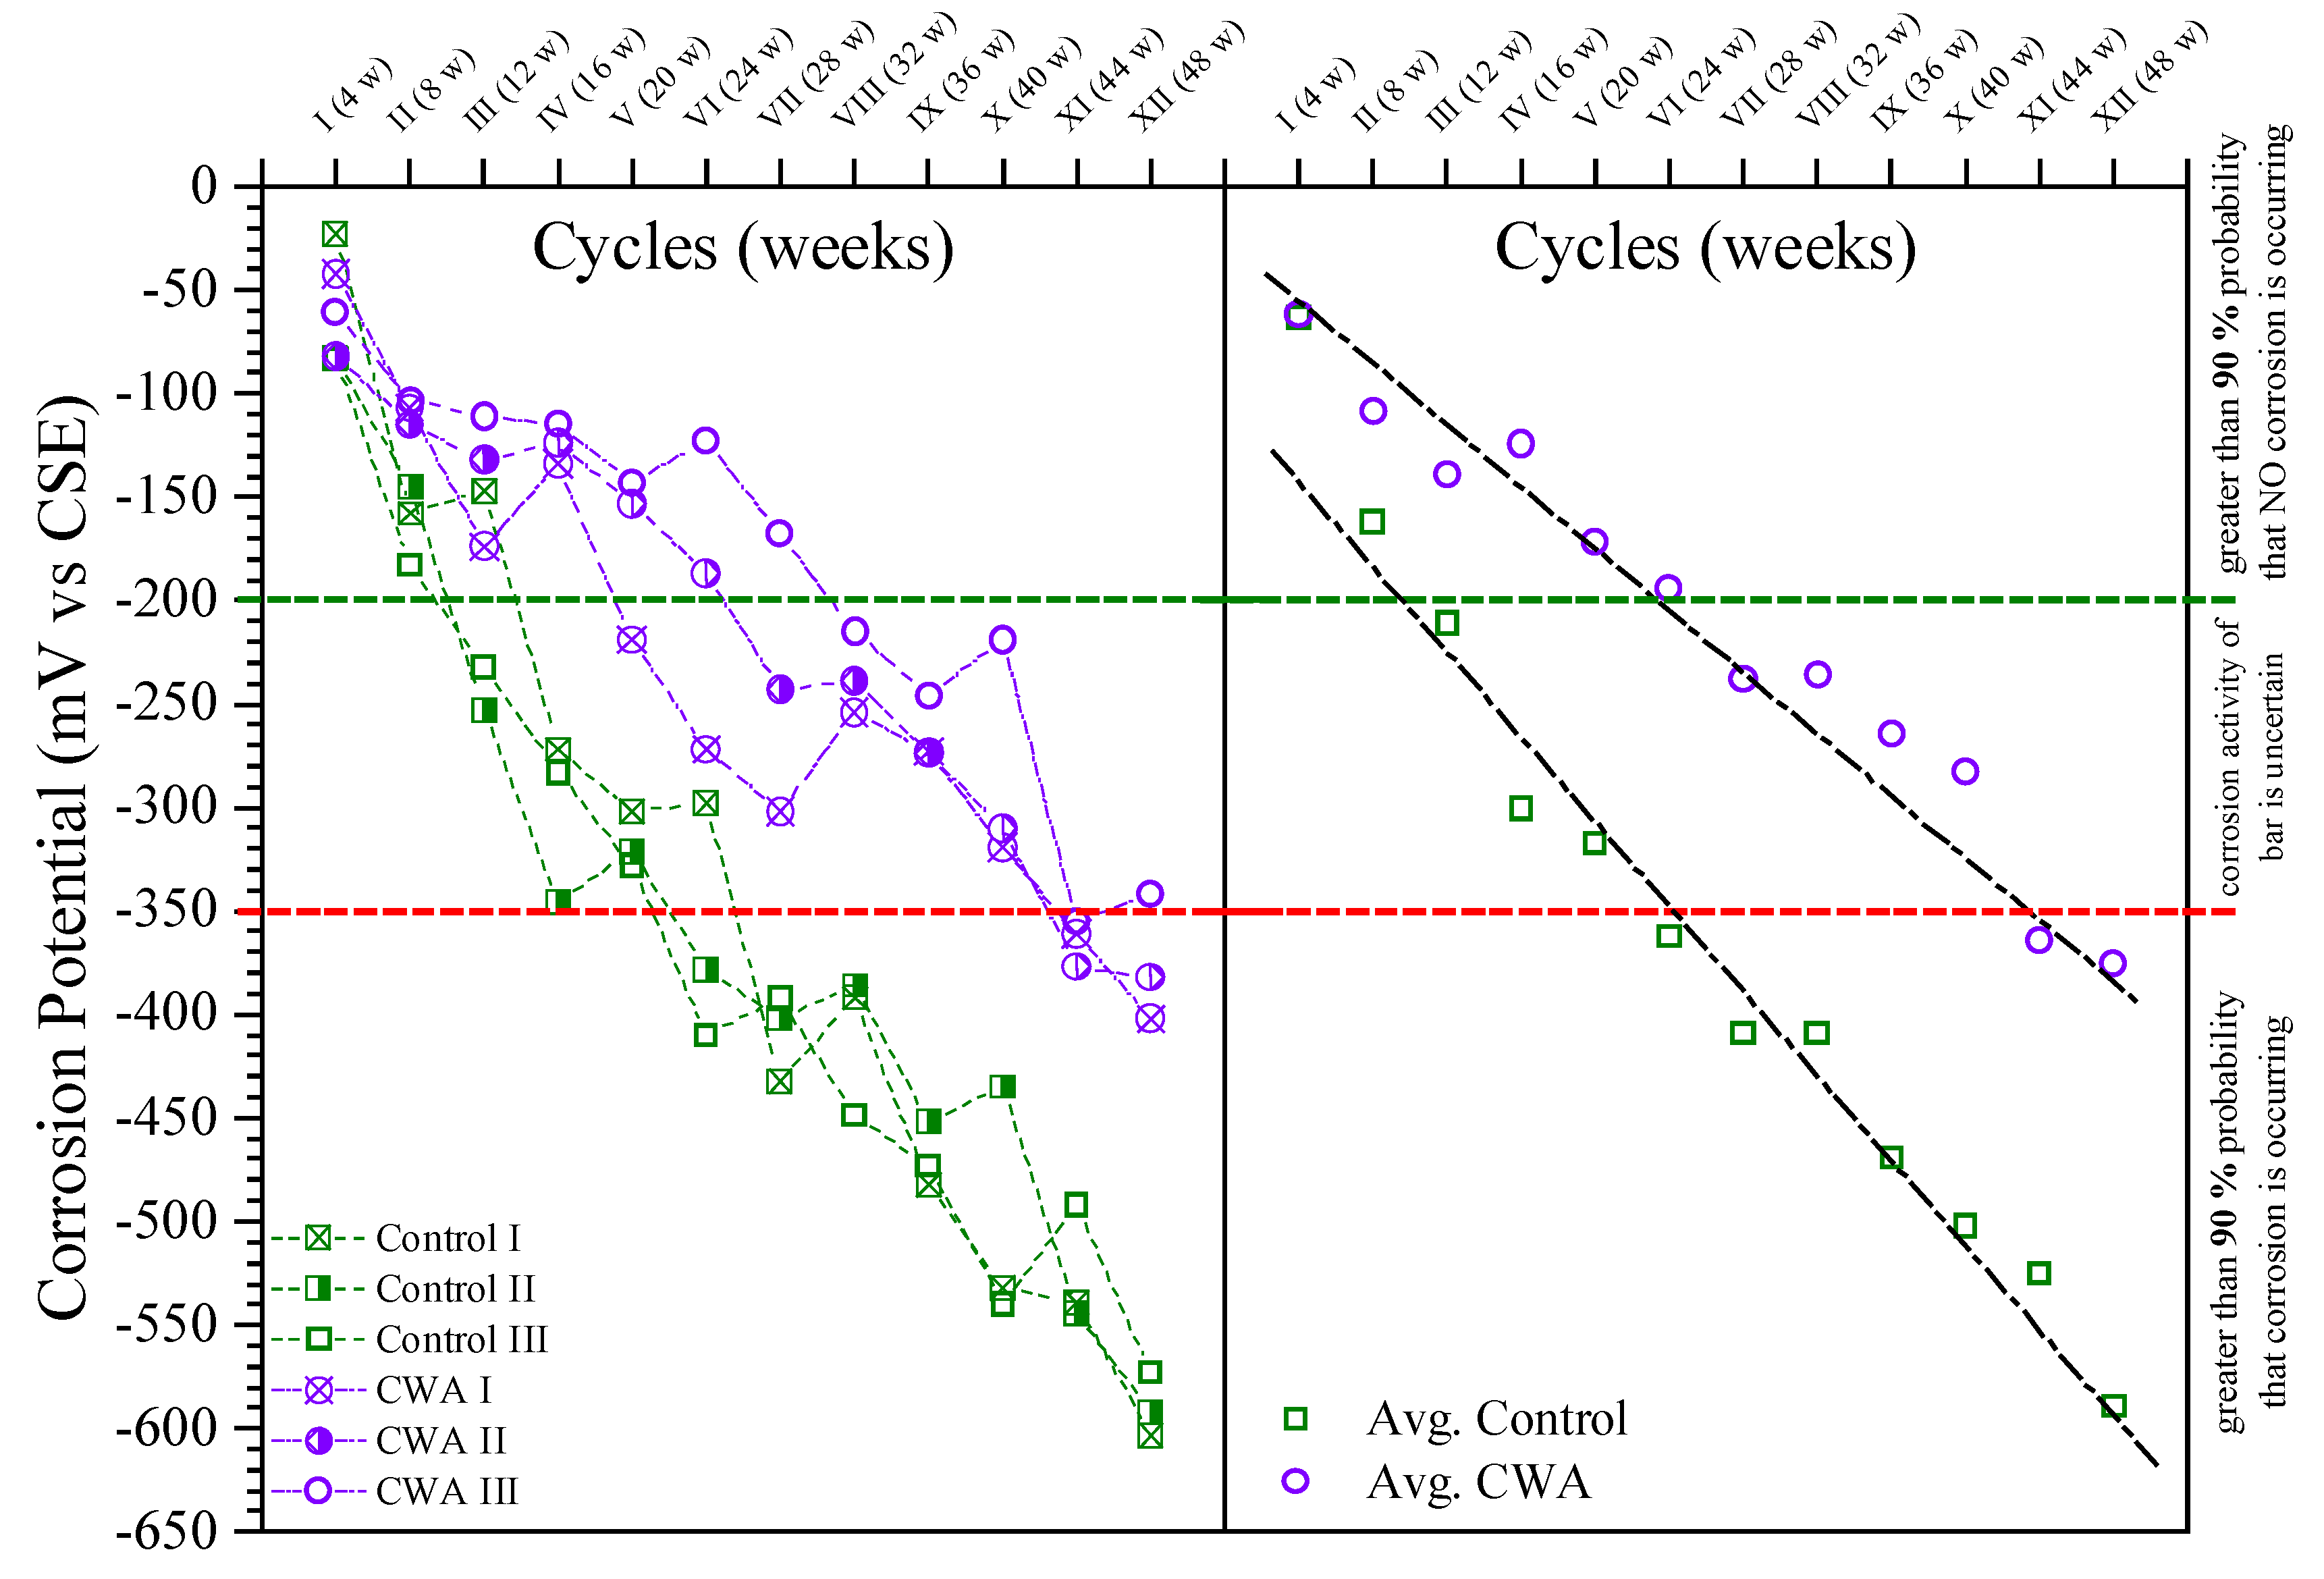
2.3.2. Corrosion Potential (Half-Cell Potential)
2.3.3. Macro-Cell Corrosion Rate
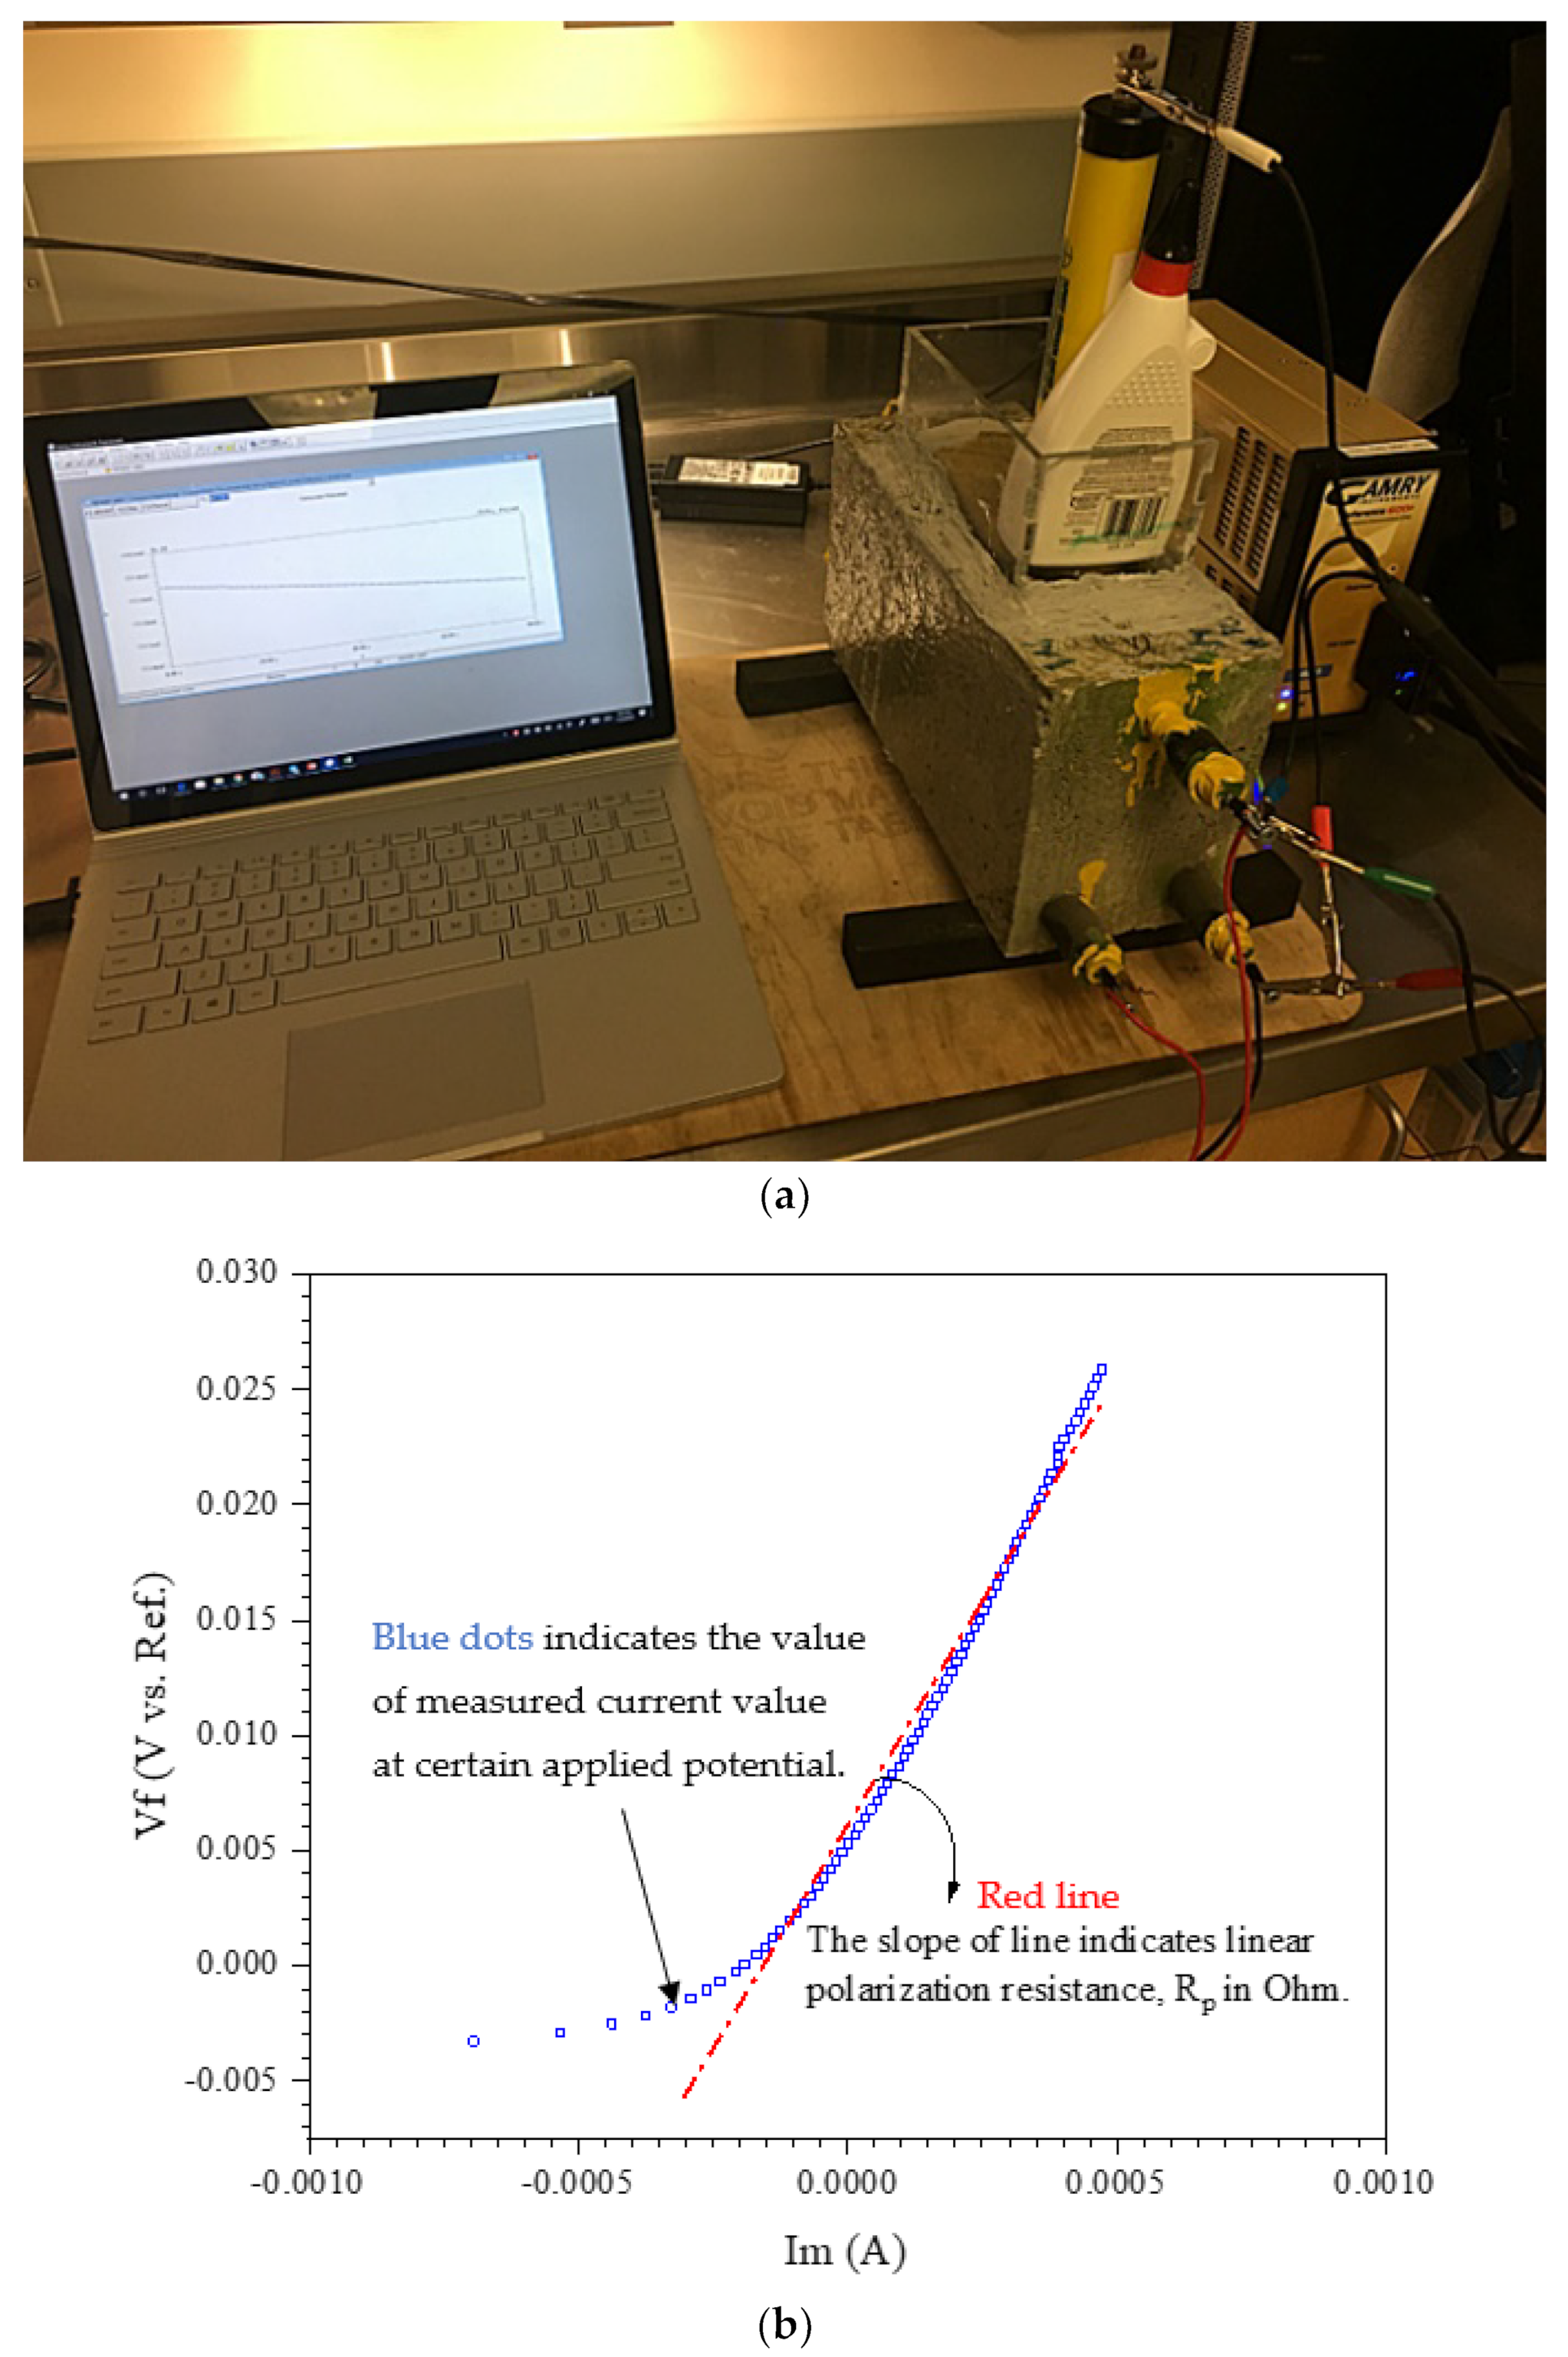
2.3.4. Linear Polarization Resistance (LPR)
2.3.5. Freeze–Thaw Resistance of Concrete
Freeze–Thaw Resistance Testing (ASTM C666)
Resonant Frequency Testing (RFT) (ASTM C215)
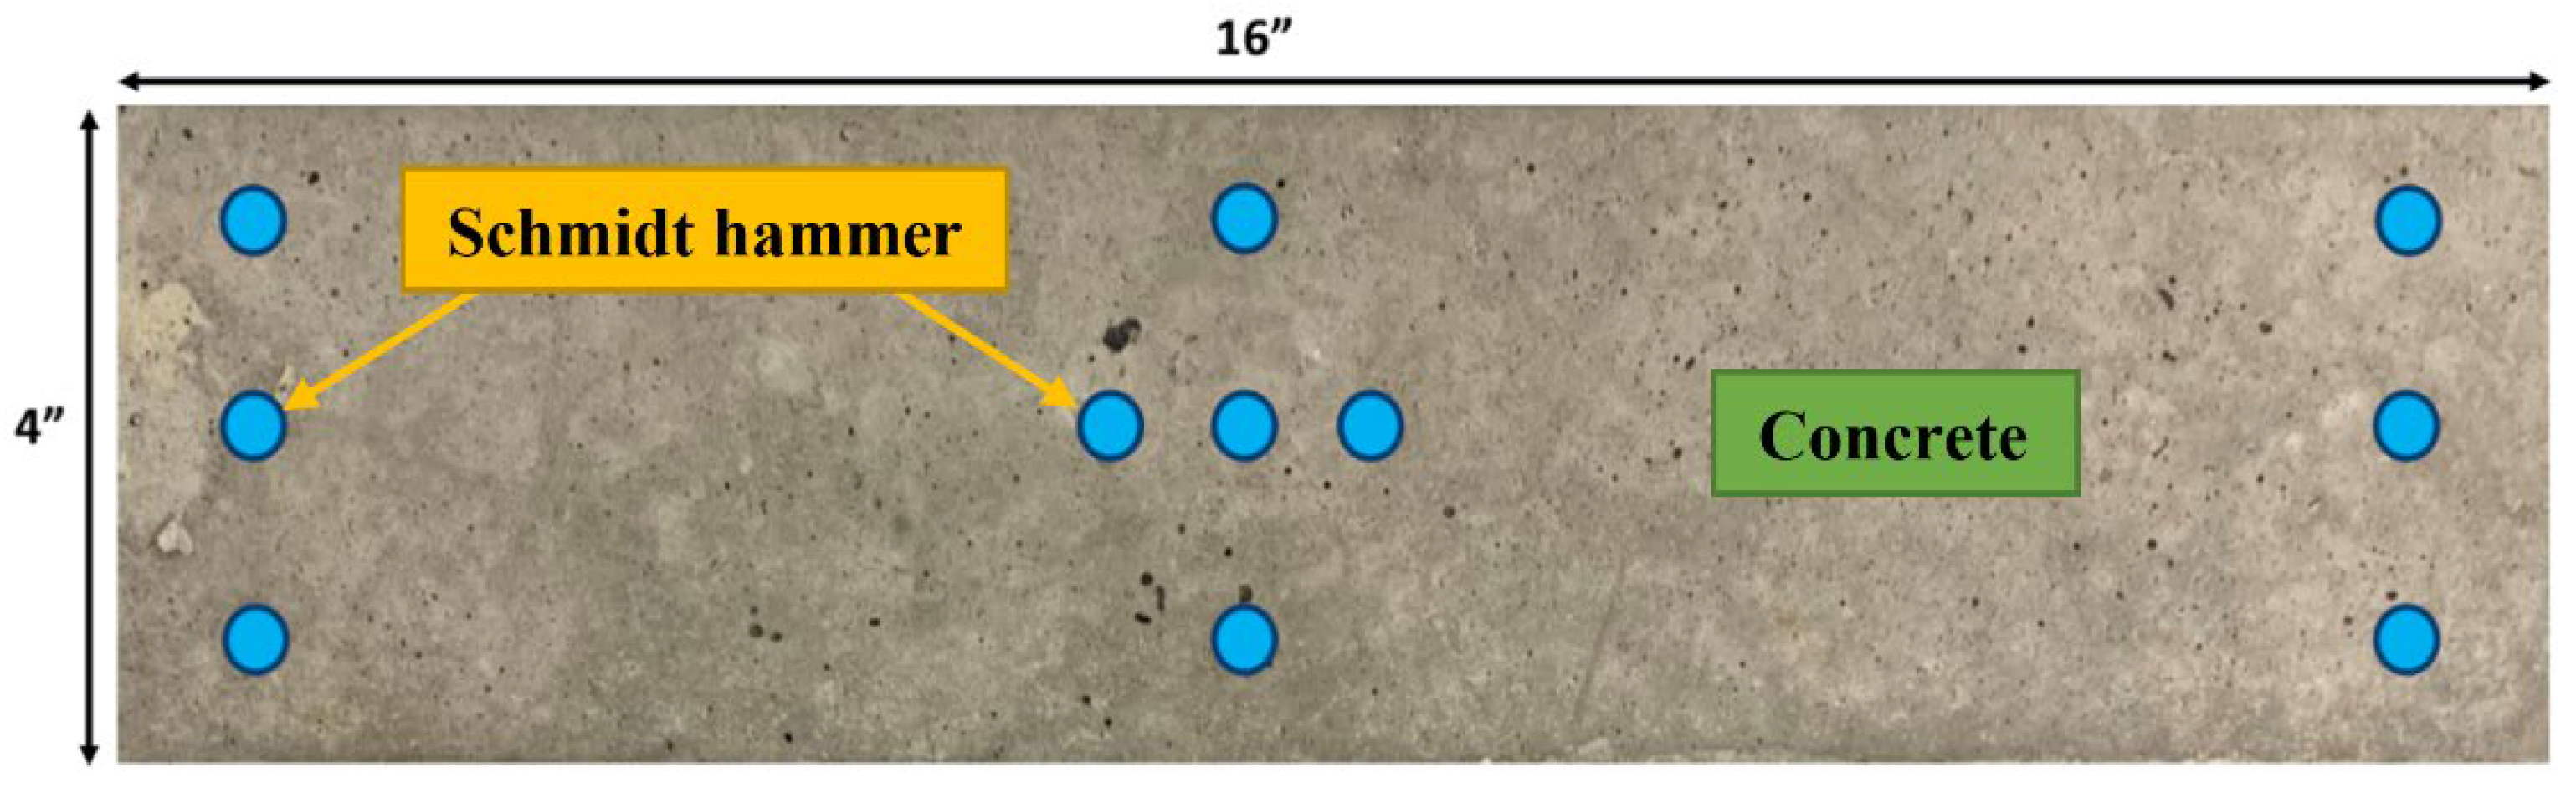
Compressive Strength Test (ASTM C39 & ASTM C805)
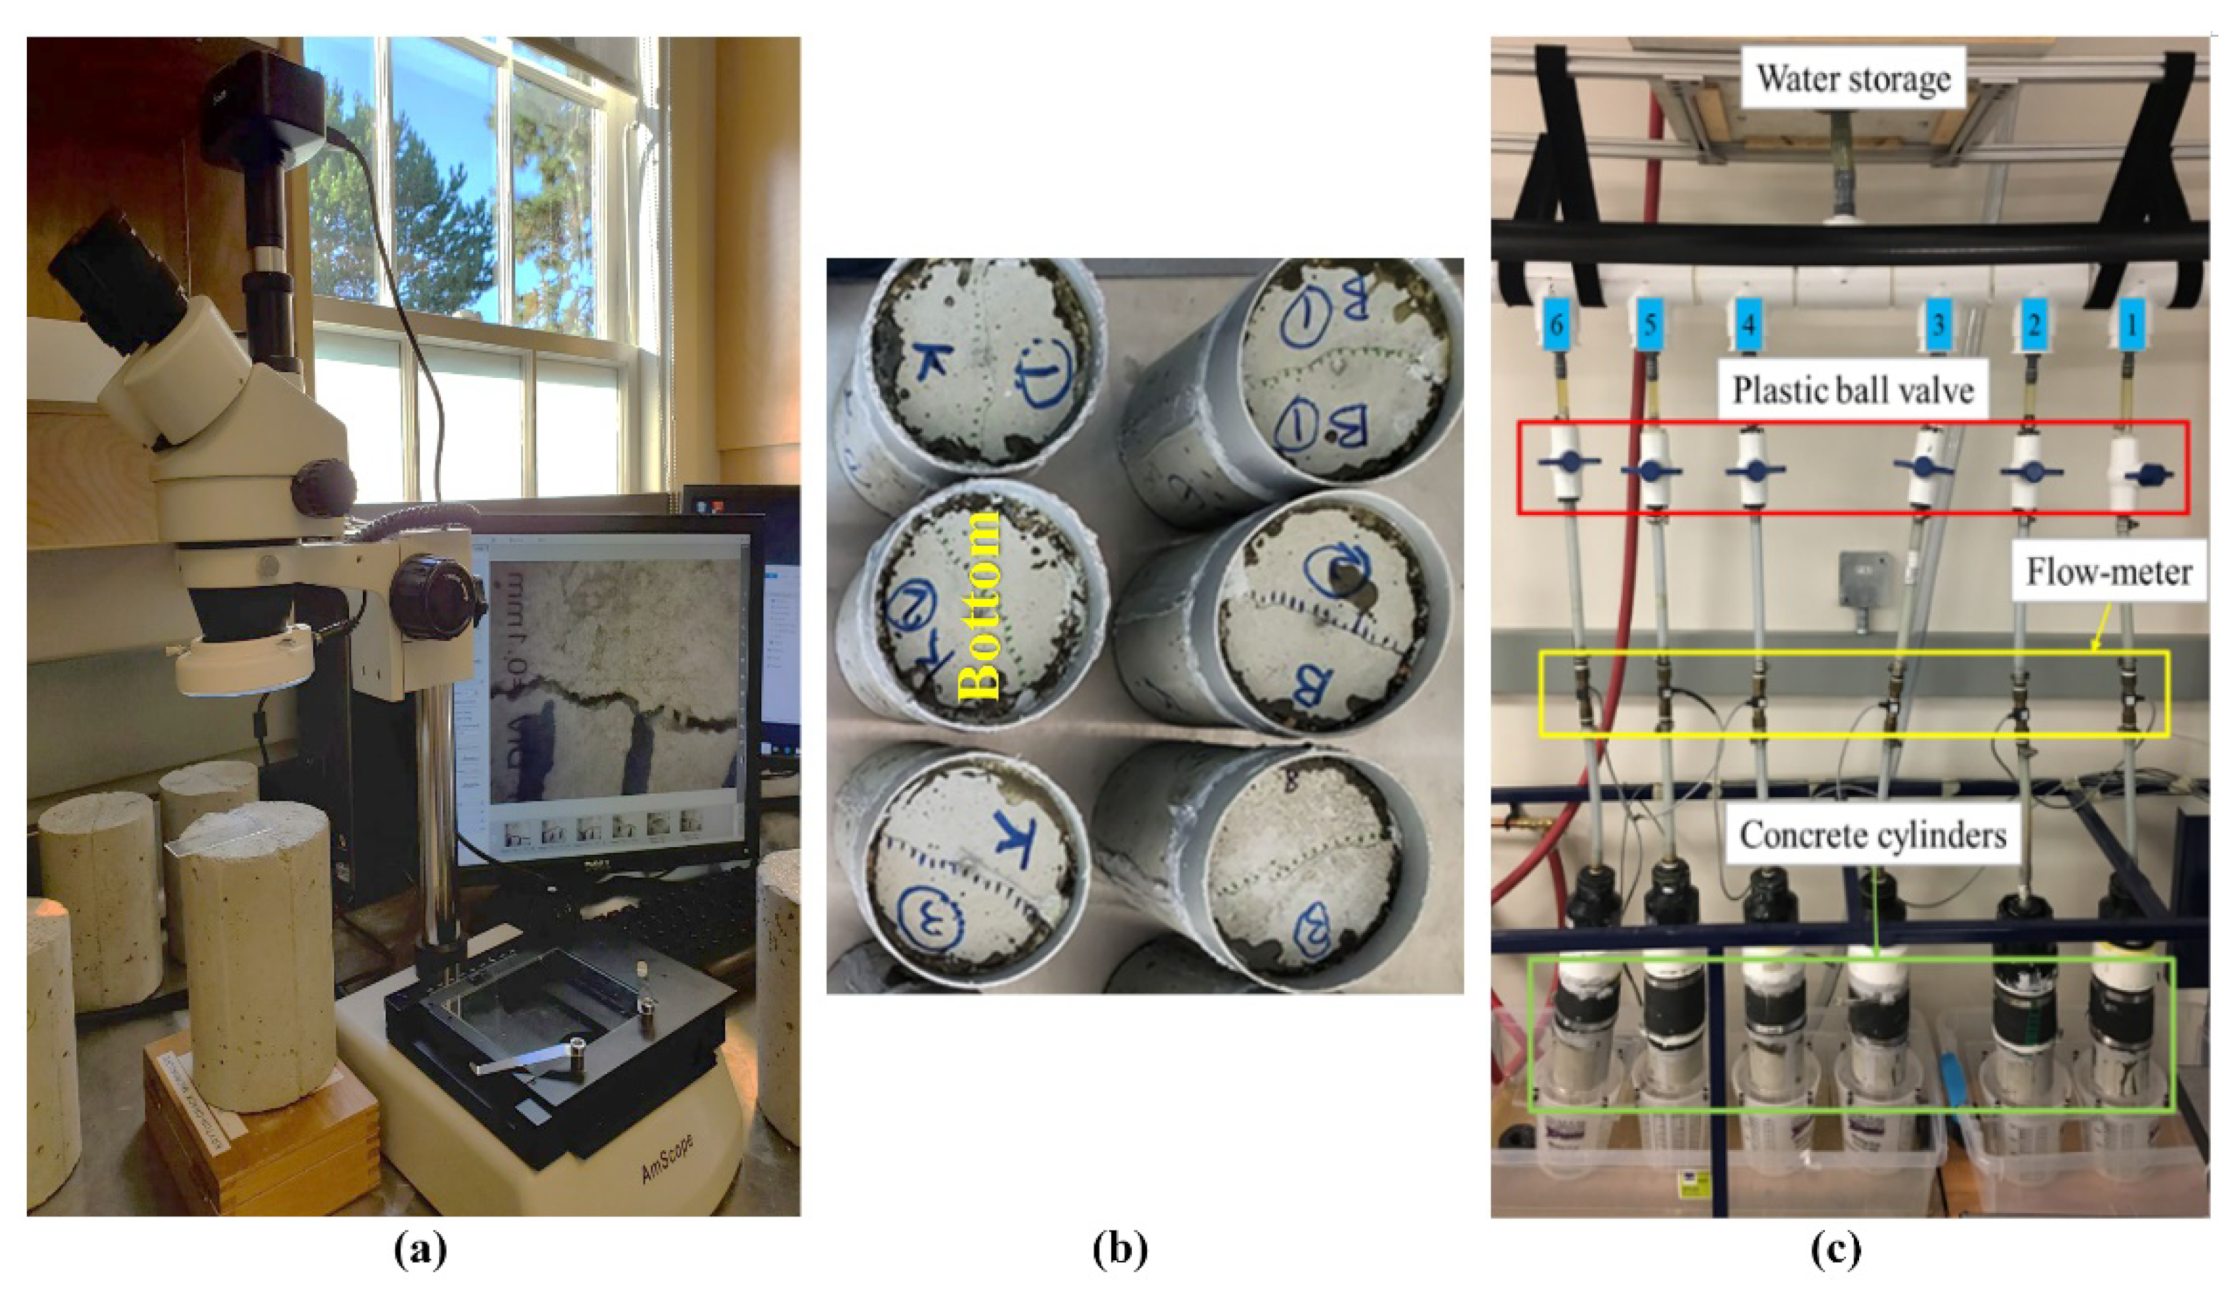
2.3.6. Self-Sealing Capability of Concrete
3. Results and Discussion
3.1. Steel Reinforcement Corrosion
3.1.1. Fresh and Hardened Properties
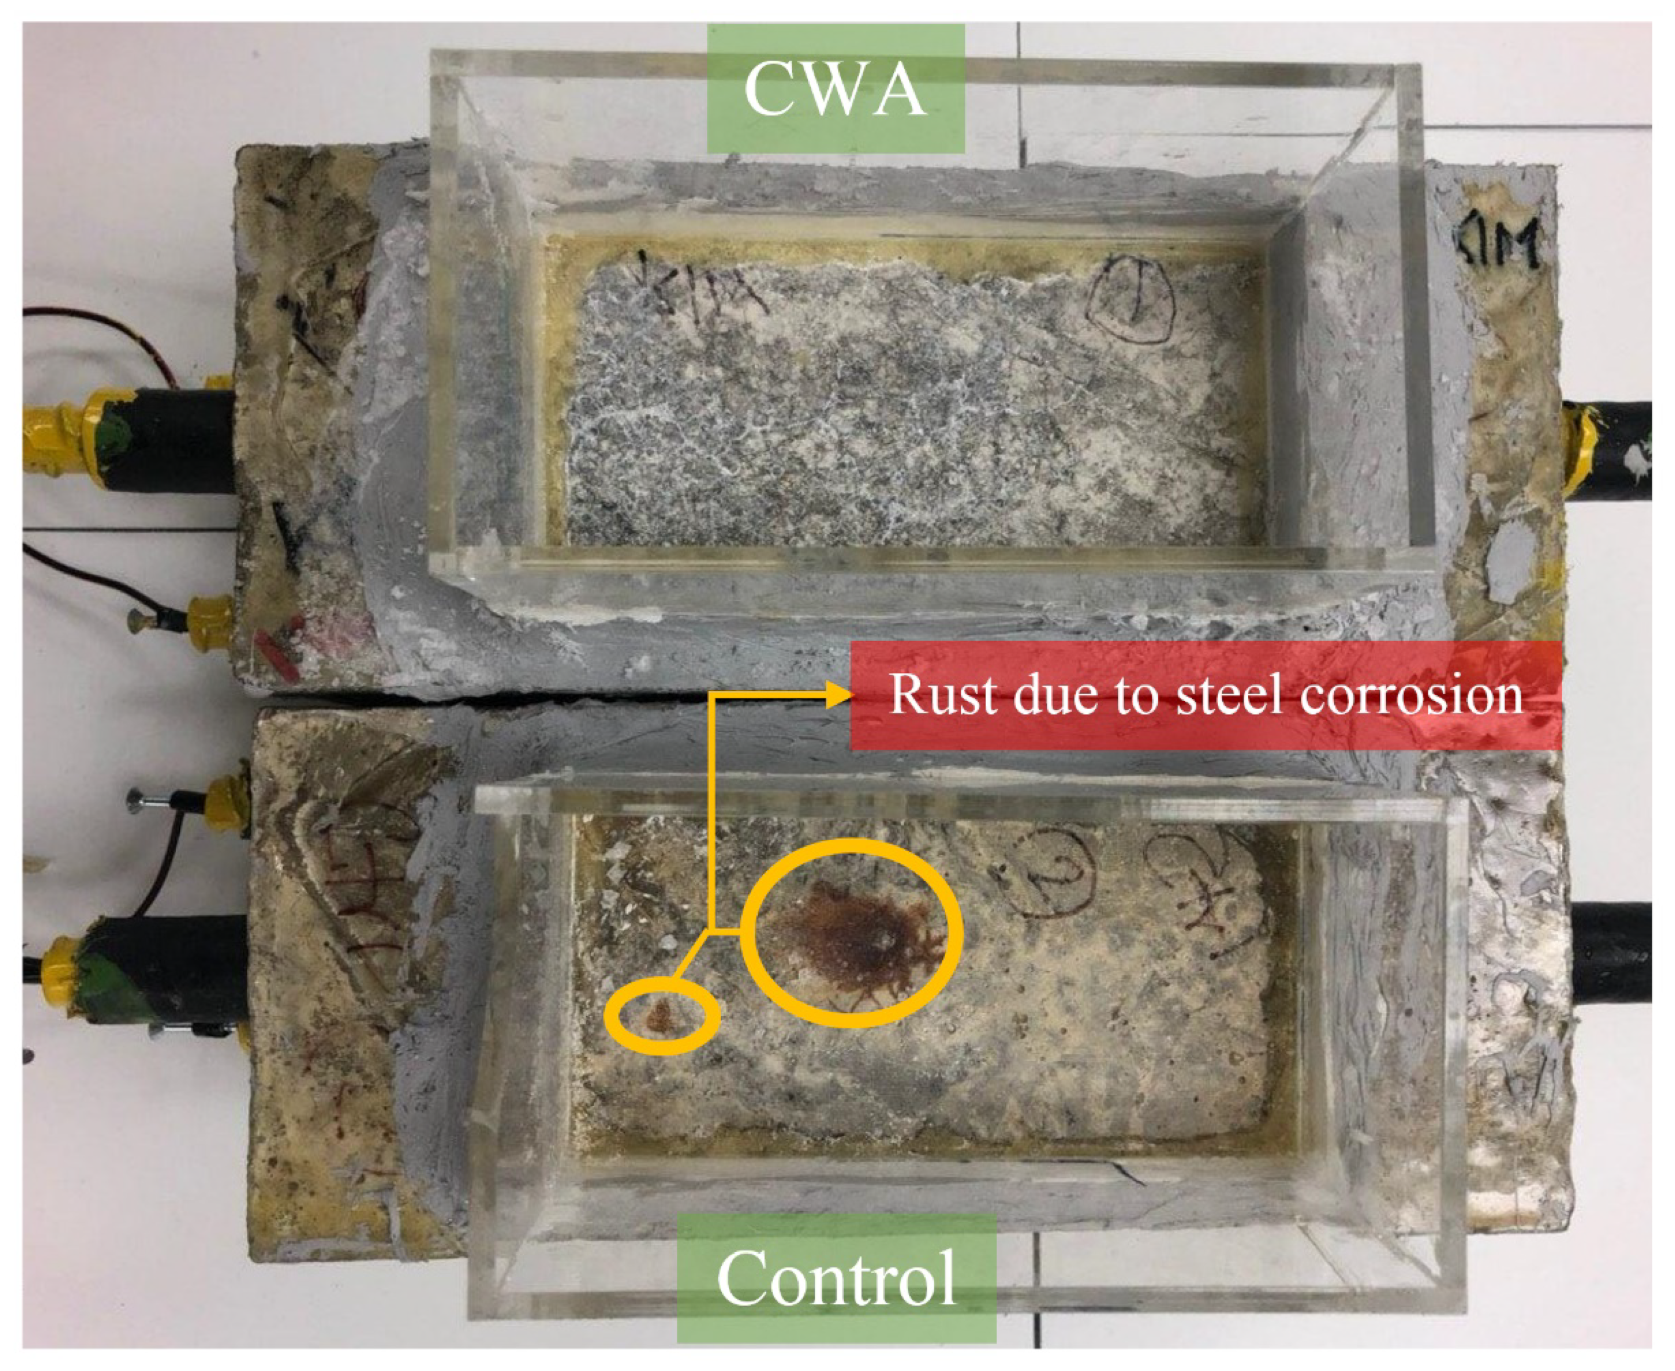
3.1.2. Visual Observation
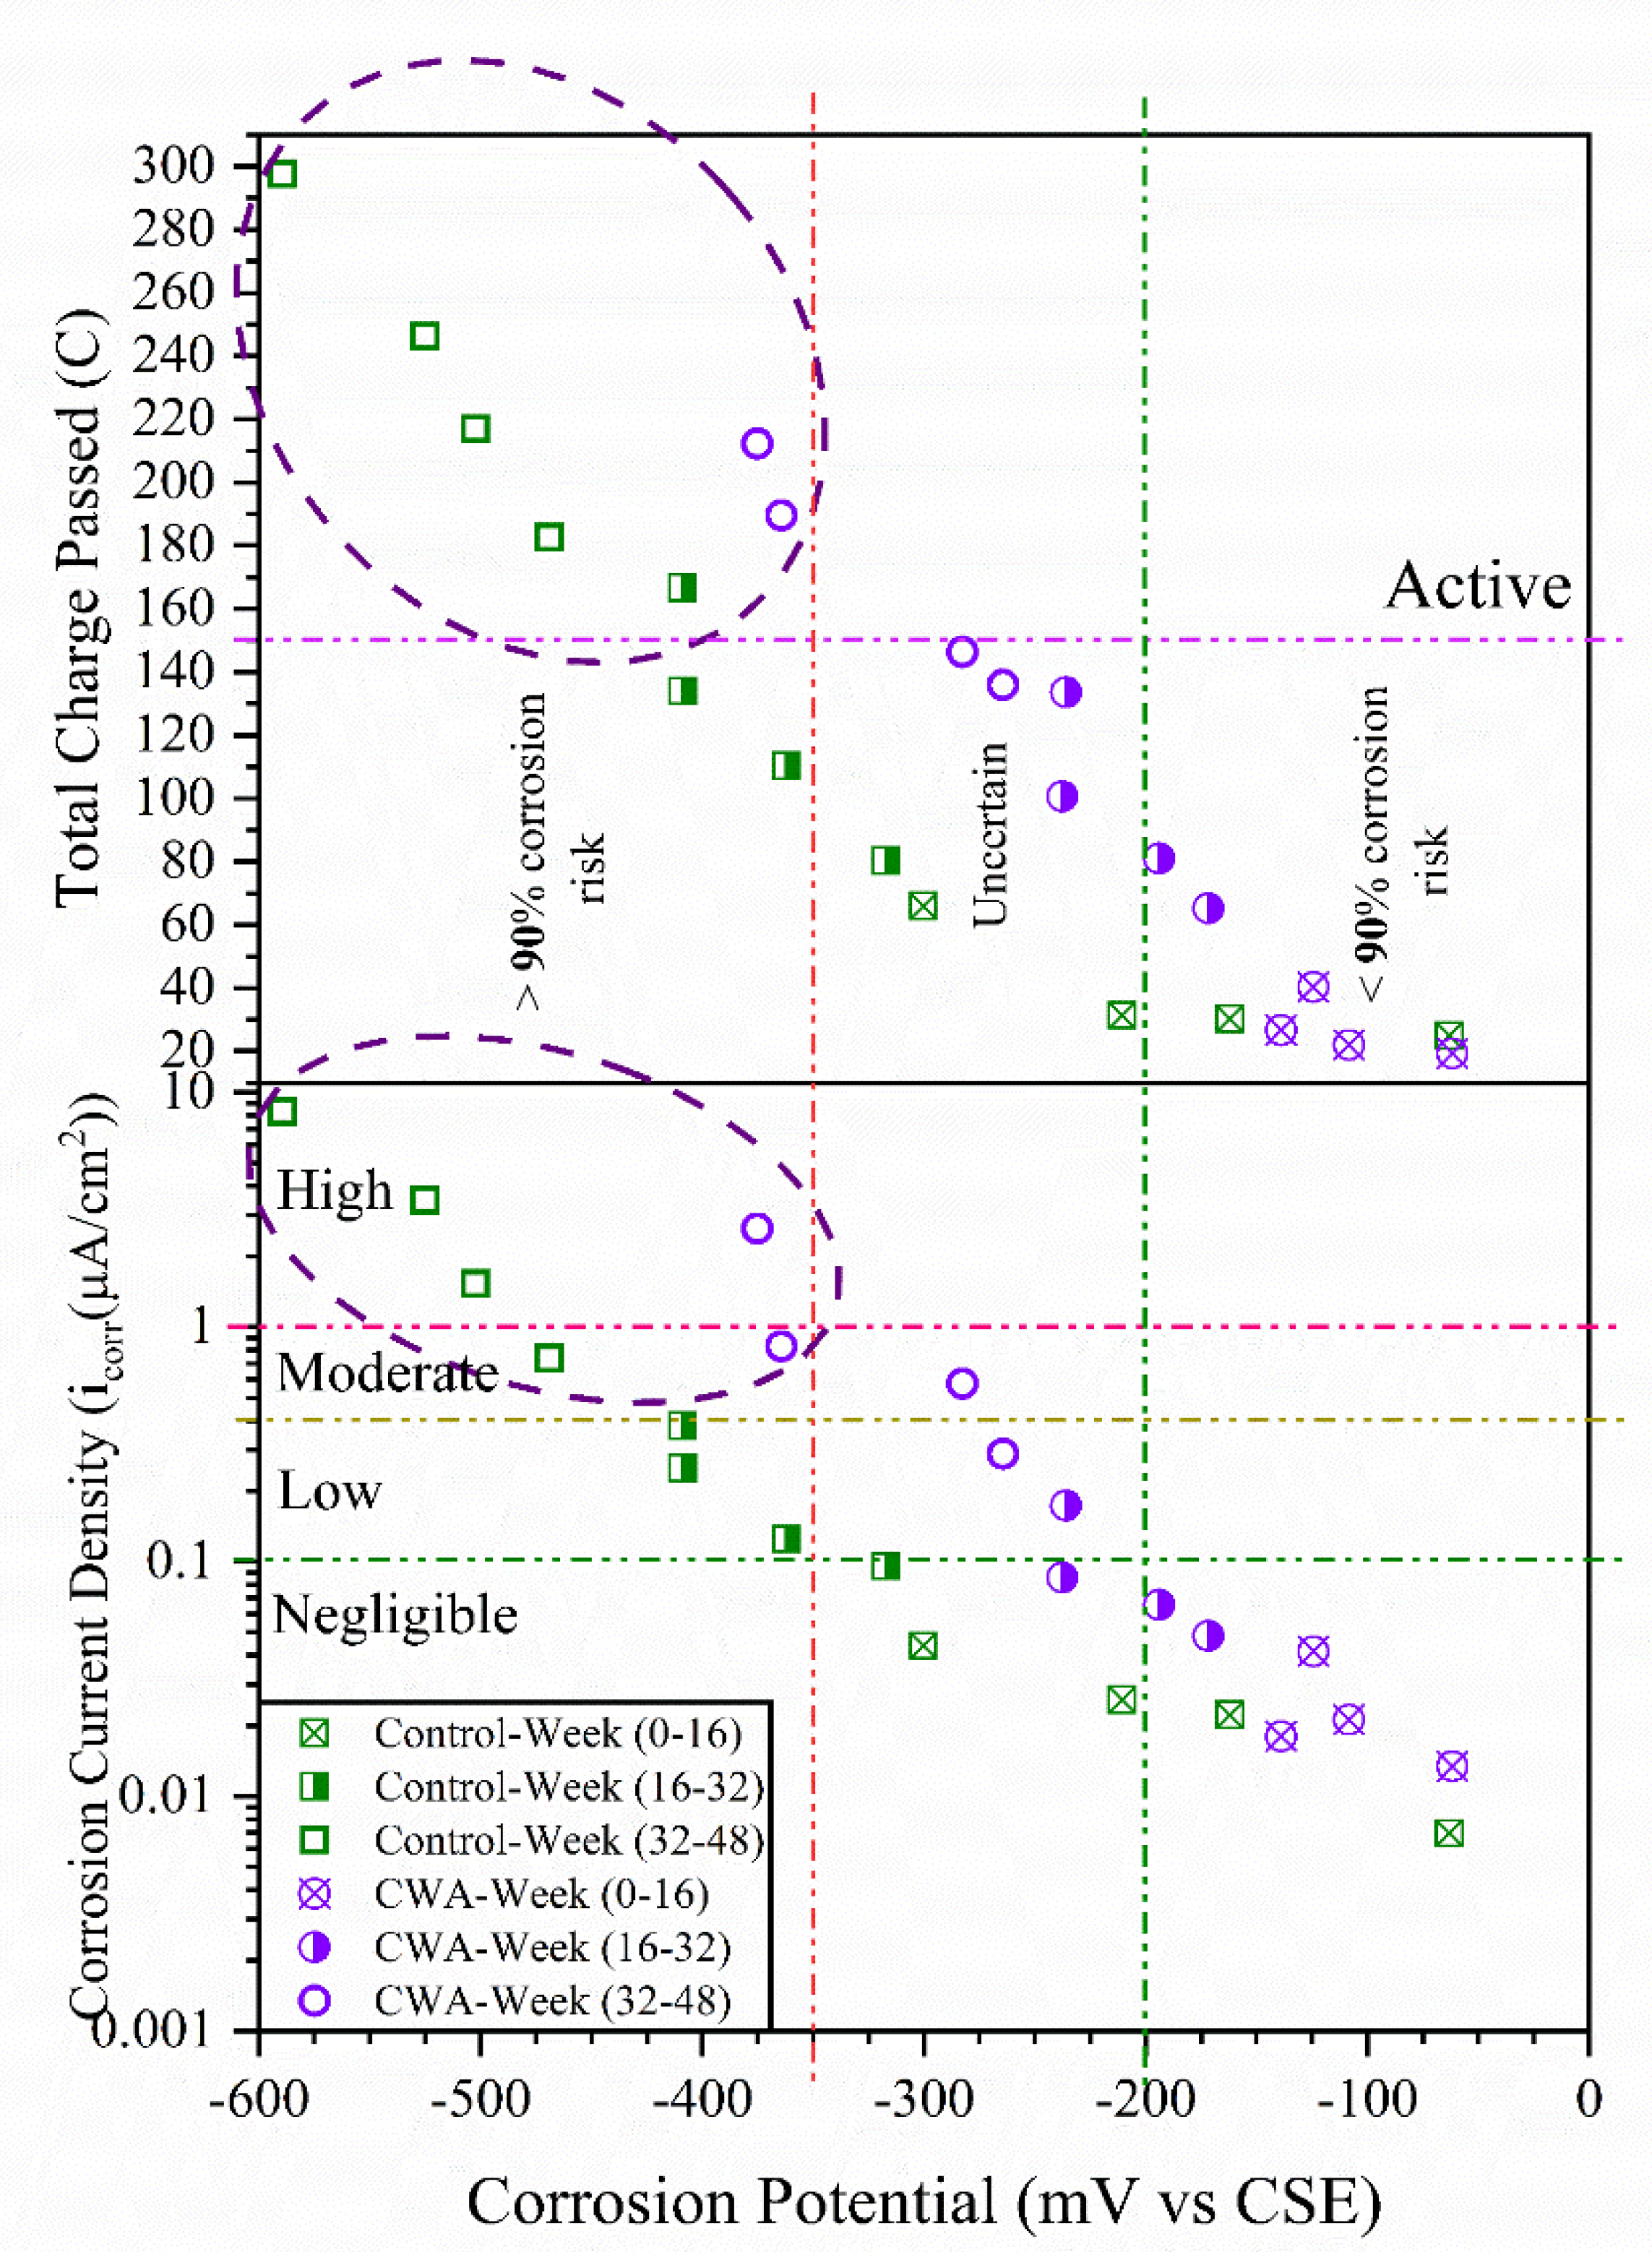
3.1.3. Half-Cell Potential (HCP) Results
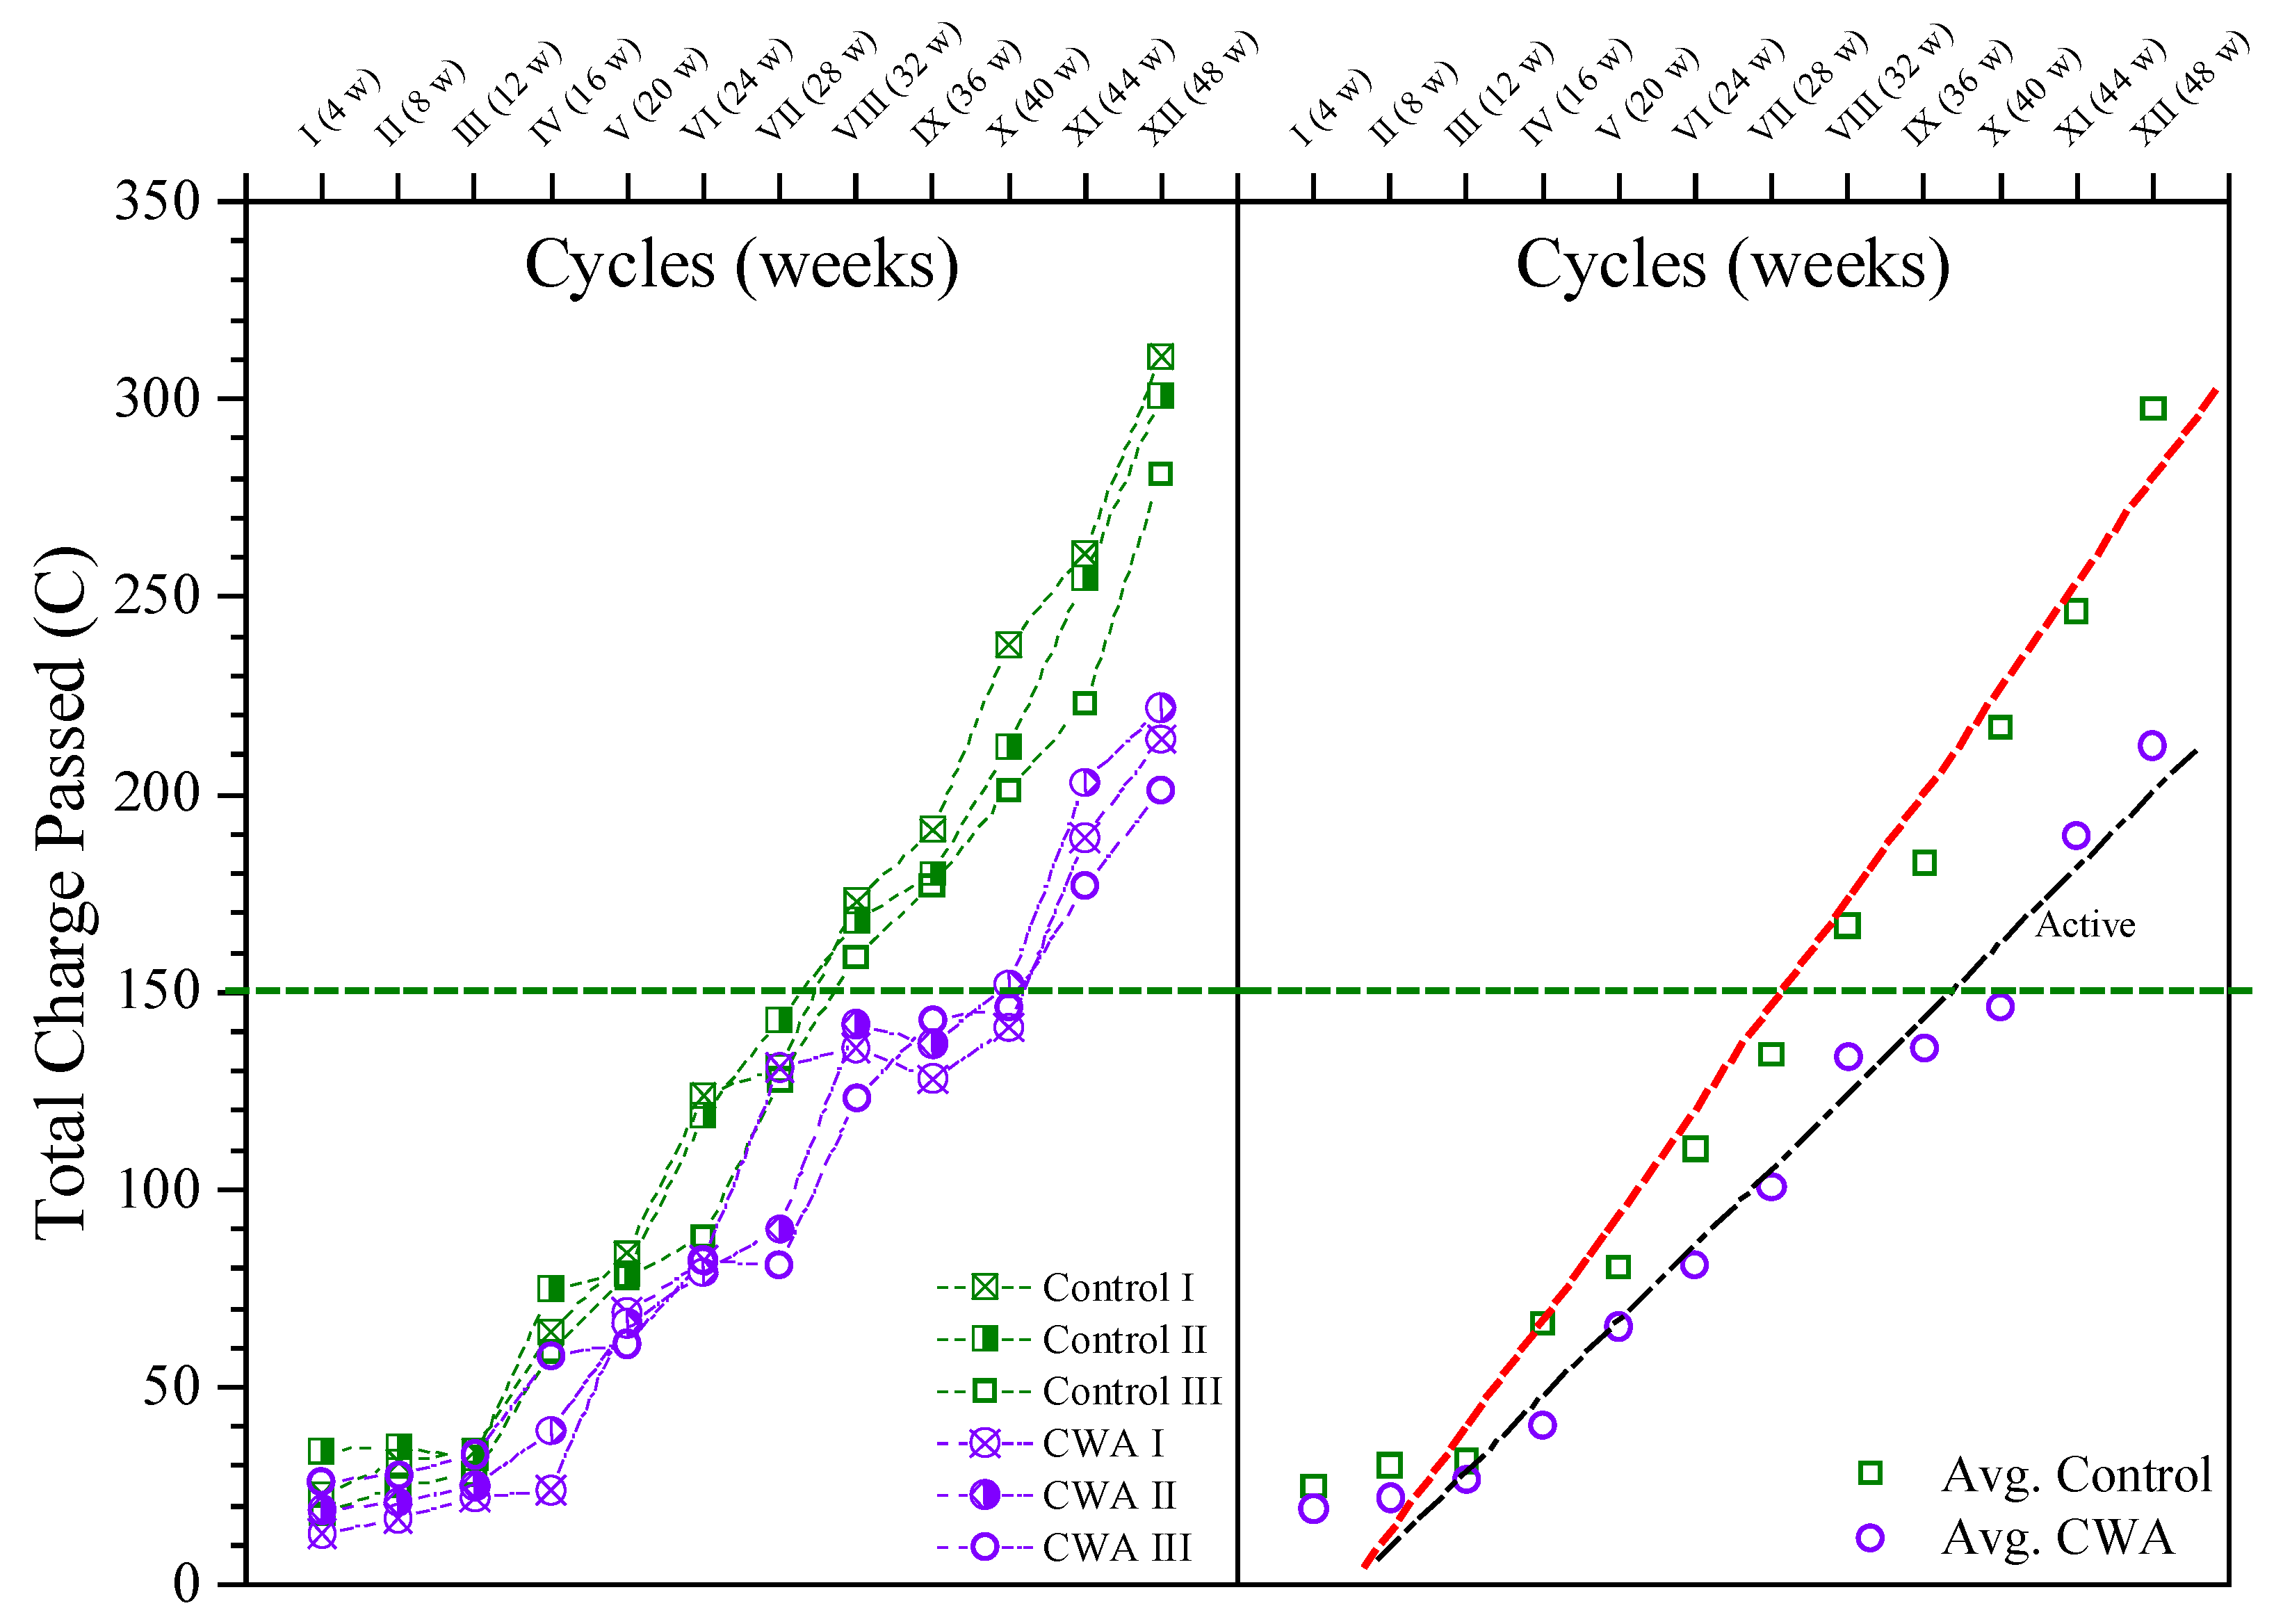
3.1.4. Macrocell Corrosion Results
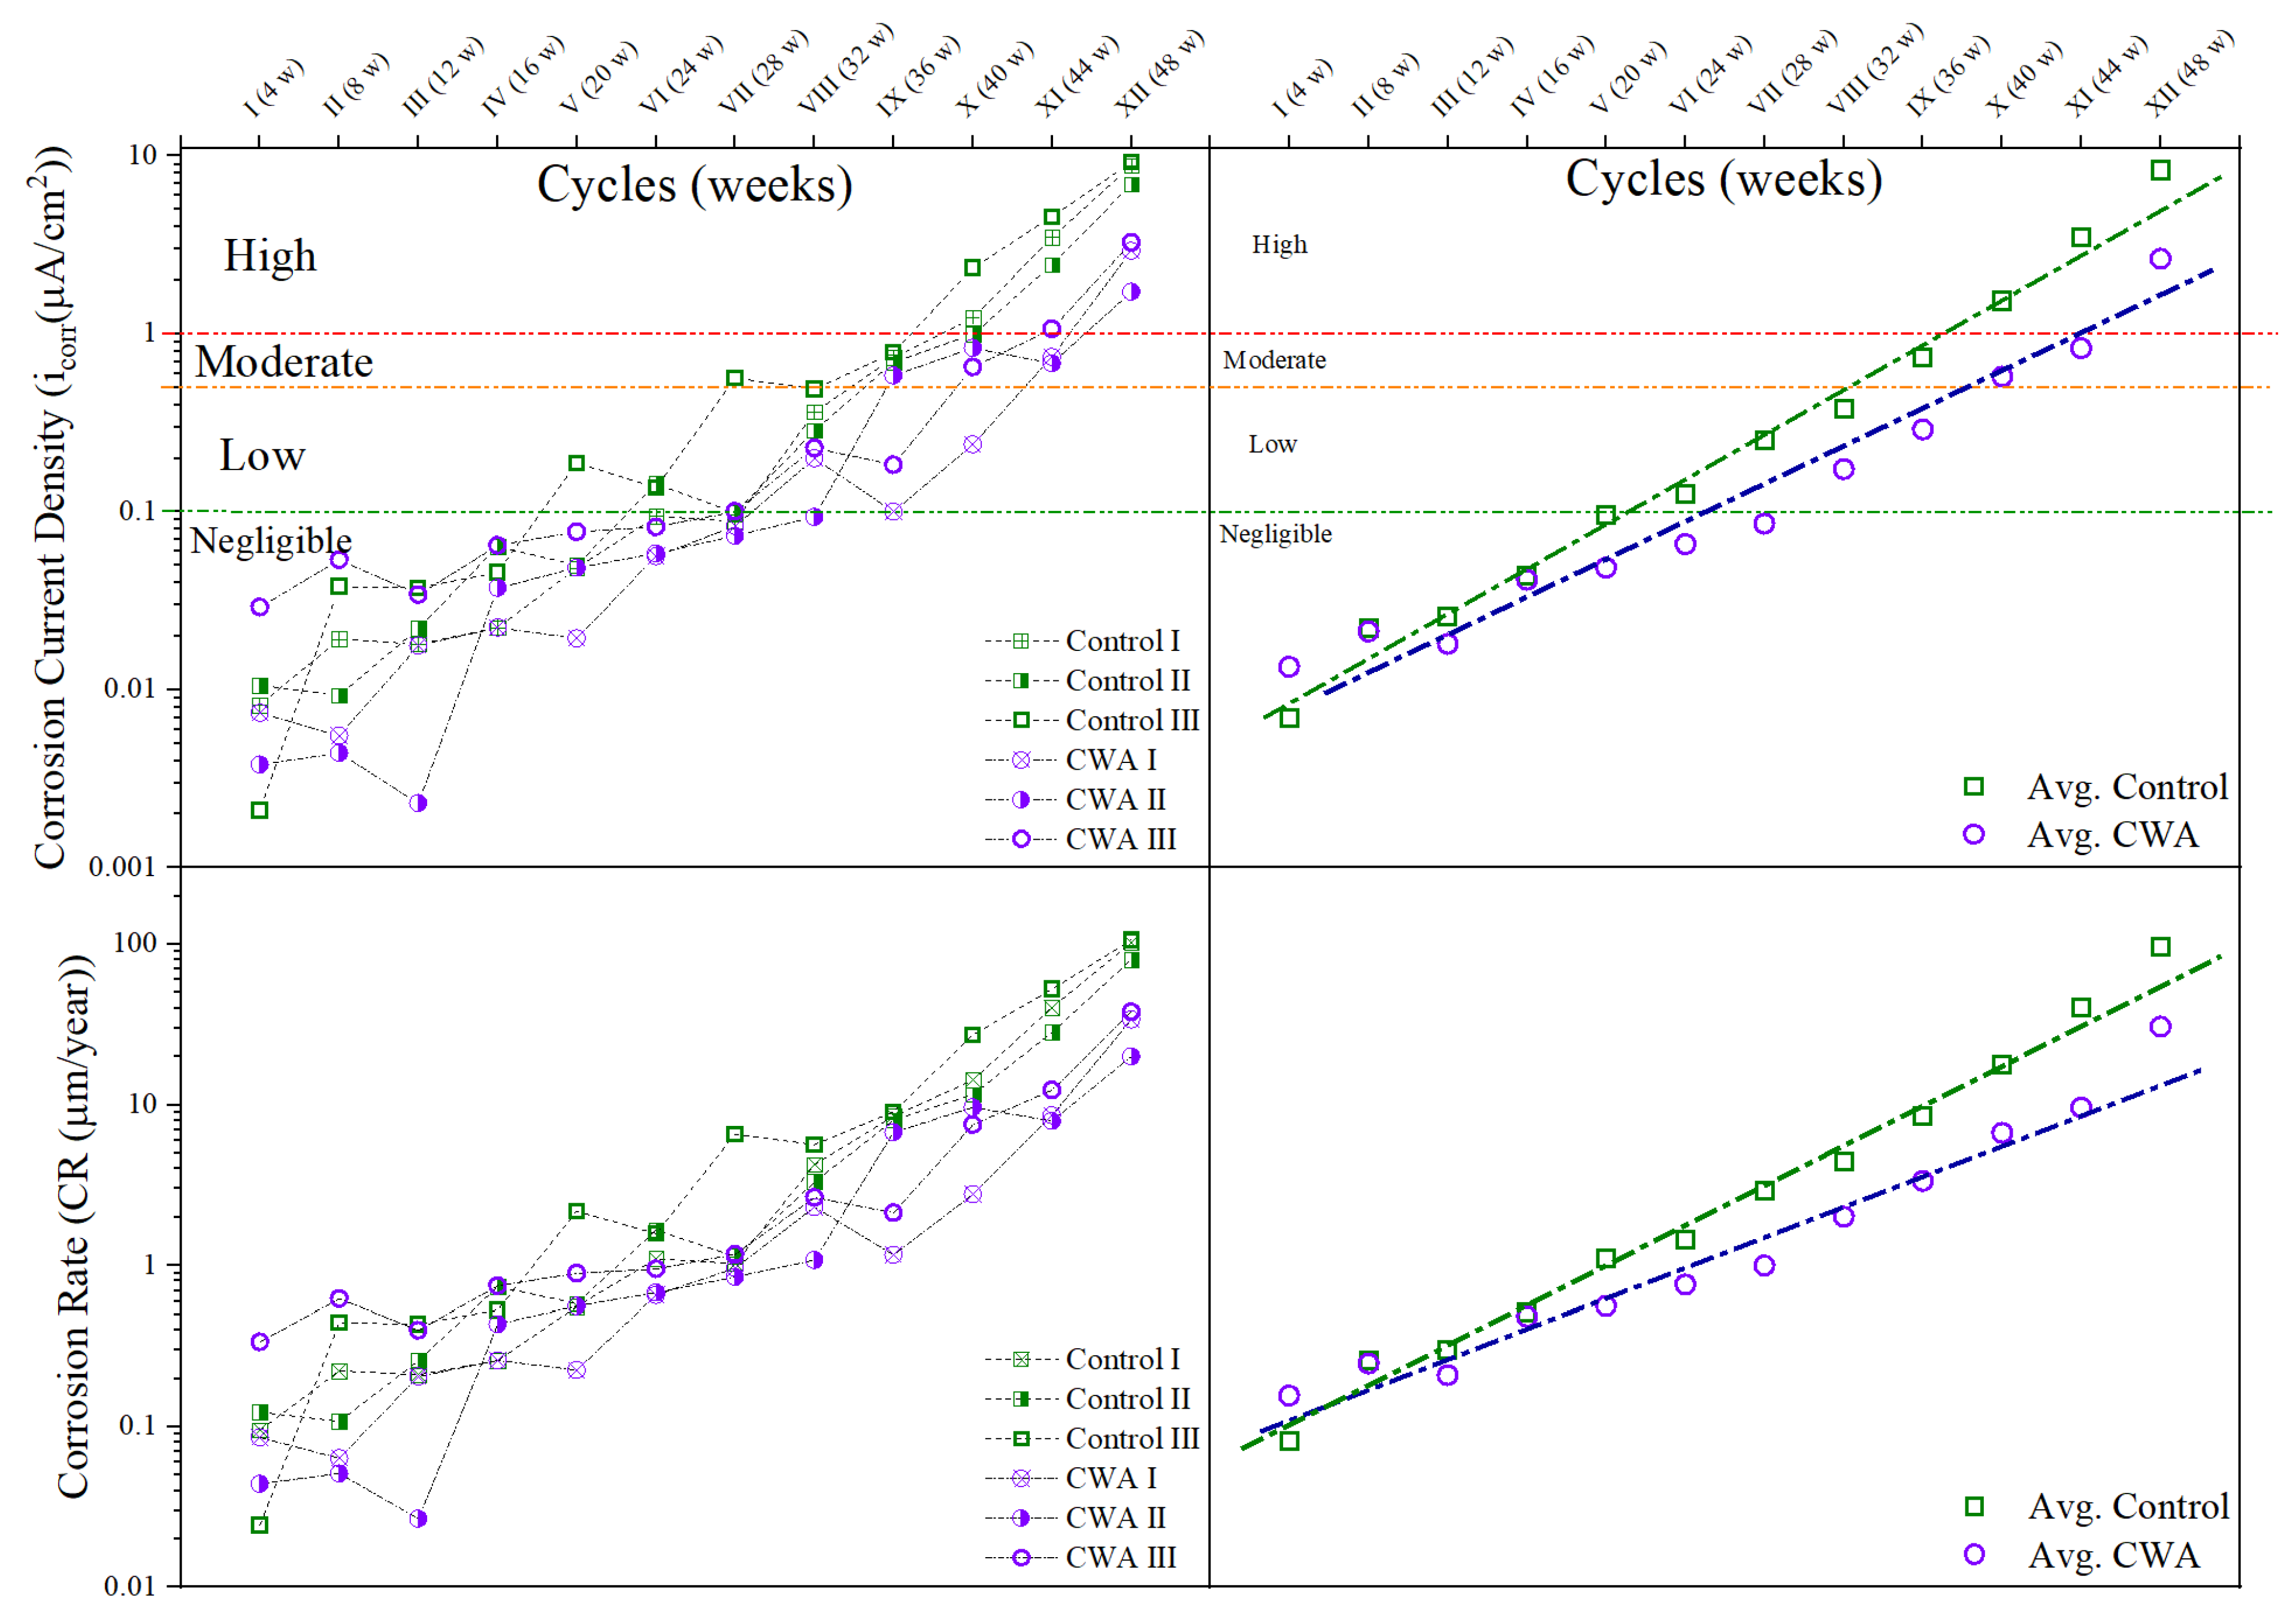
3.1.5. Corrosion Current Density and Rate Results
3.1.6. Freeze–Thaw Resistance of Concrete
Fresh and Hardened Properties
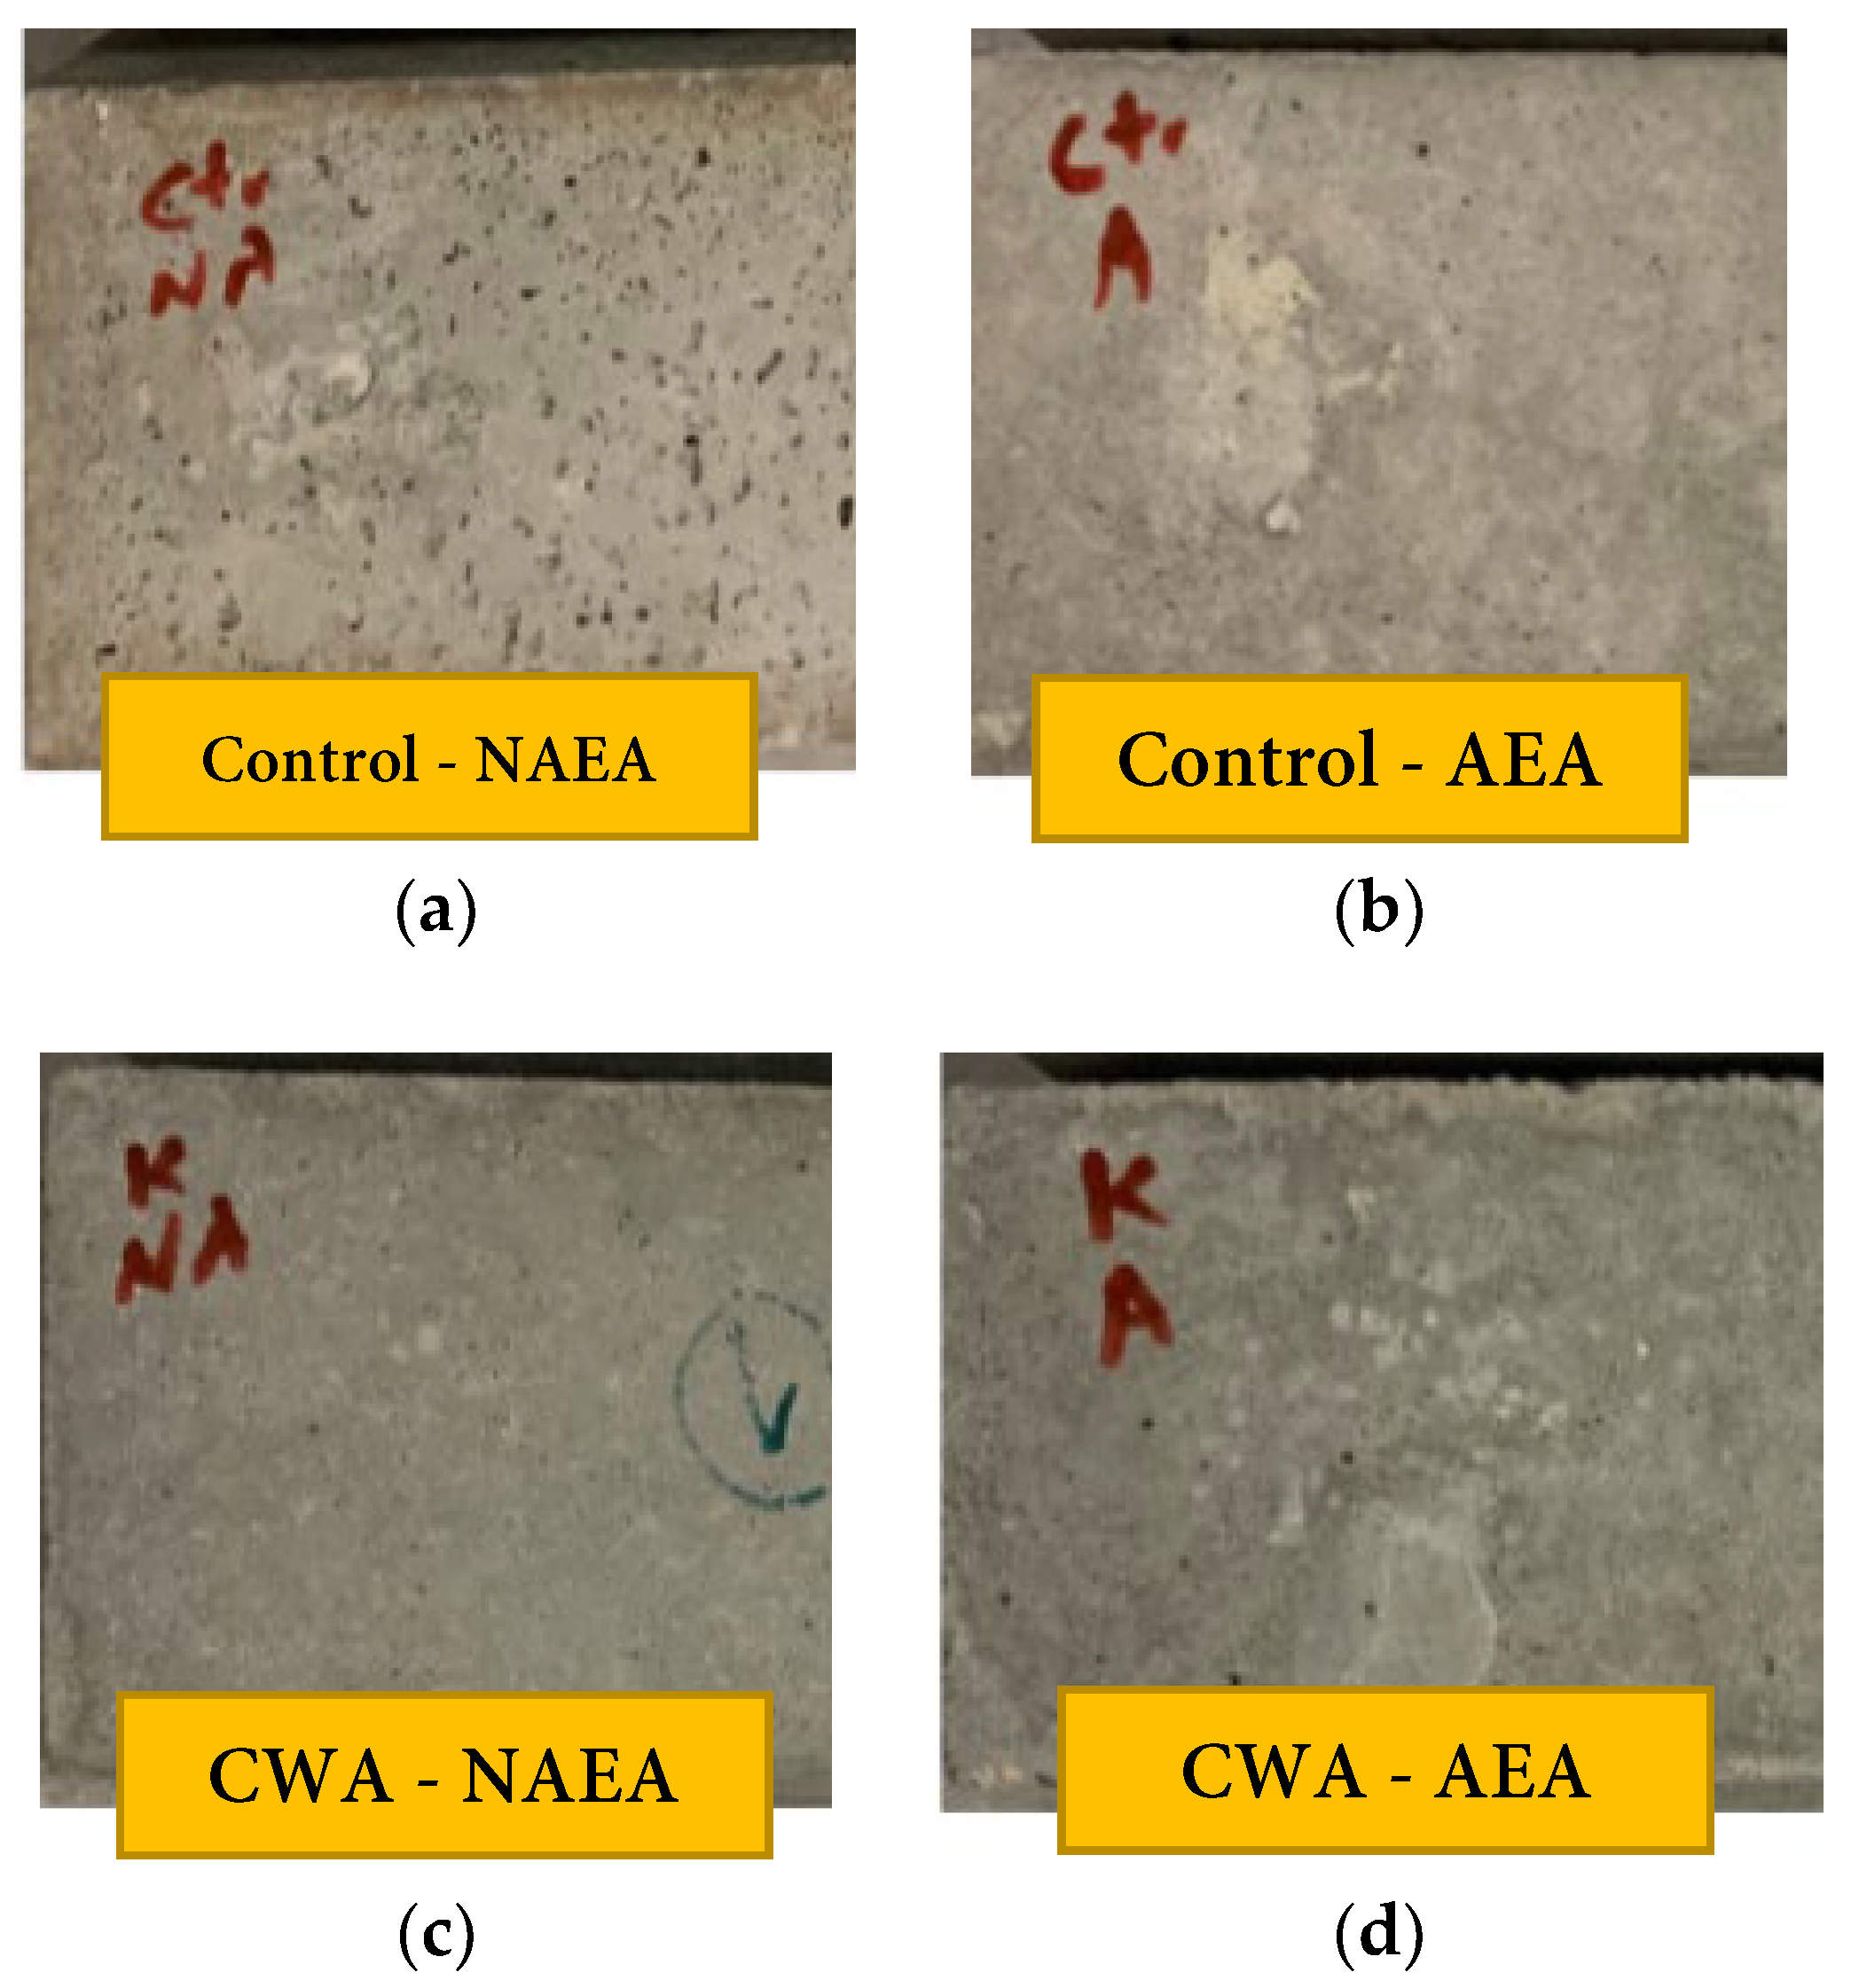
Visual Observations
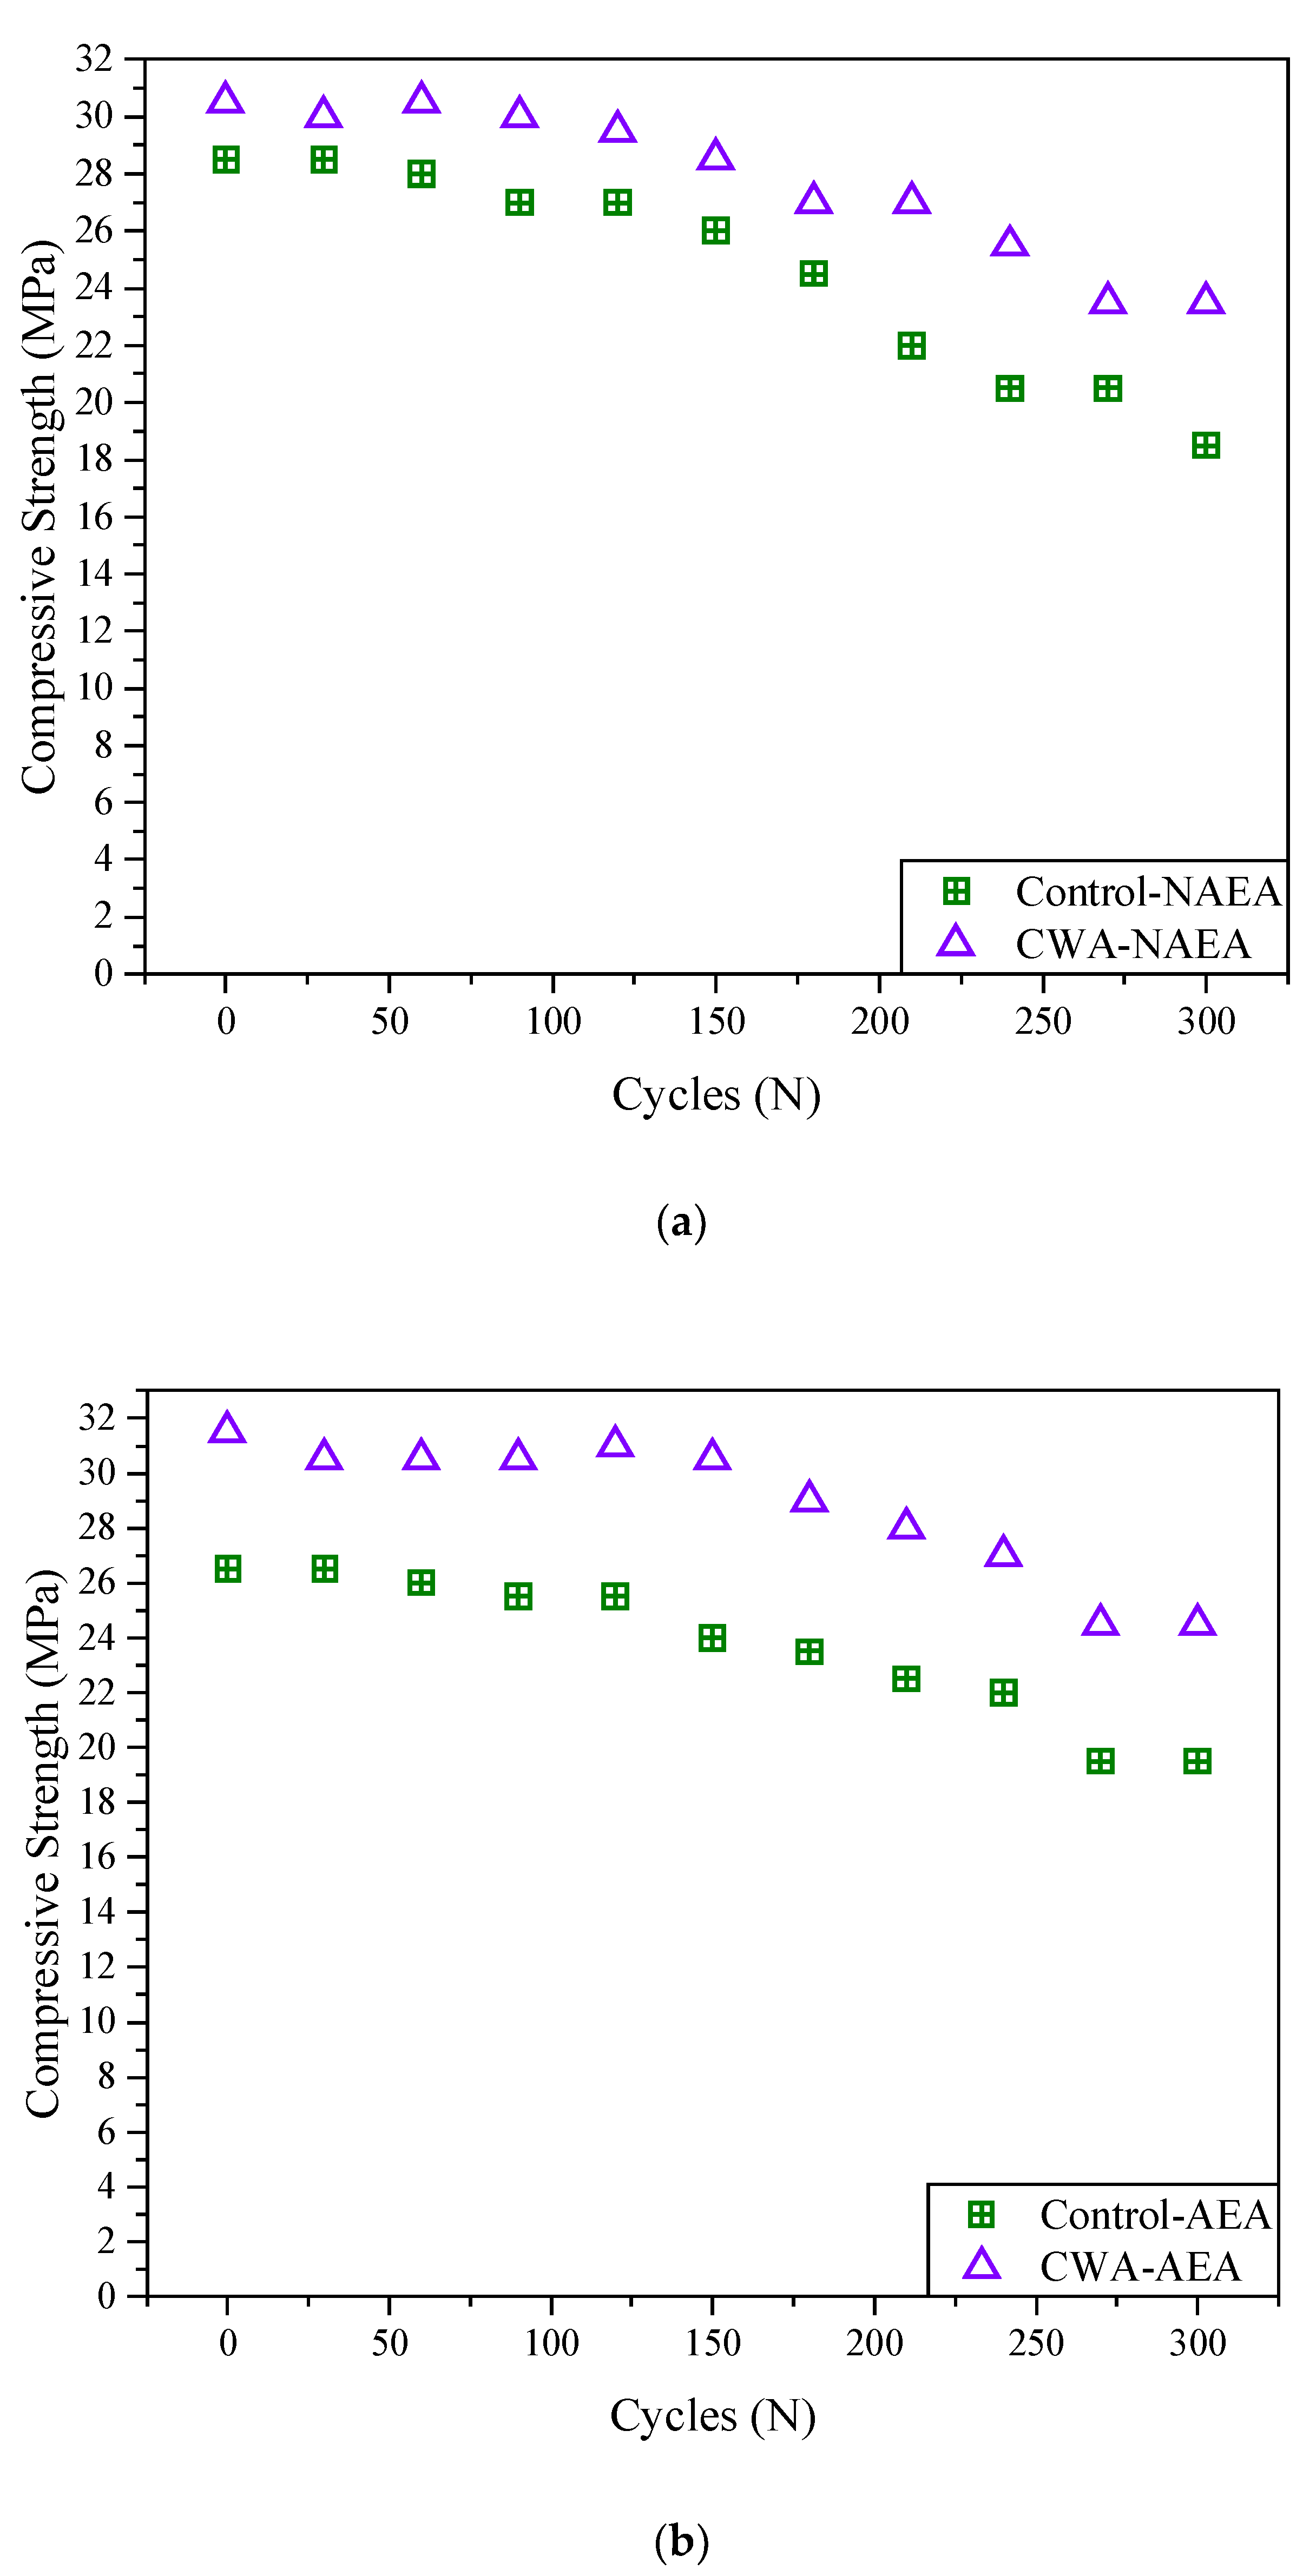
Compressive Strength Results Using Schmidt Hammer
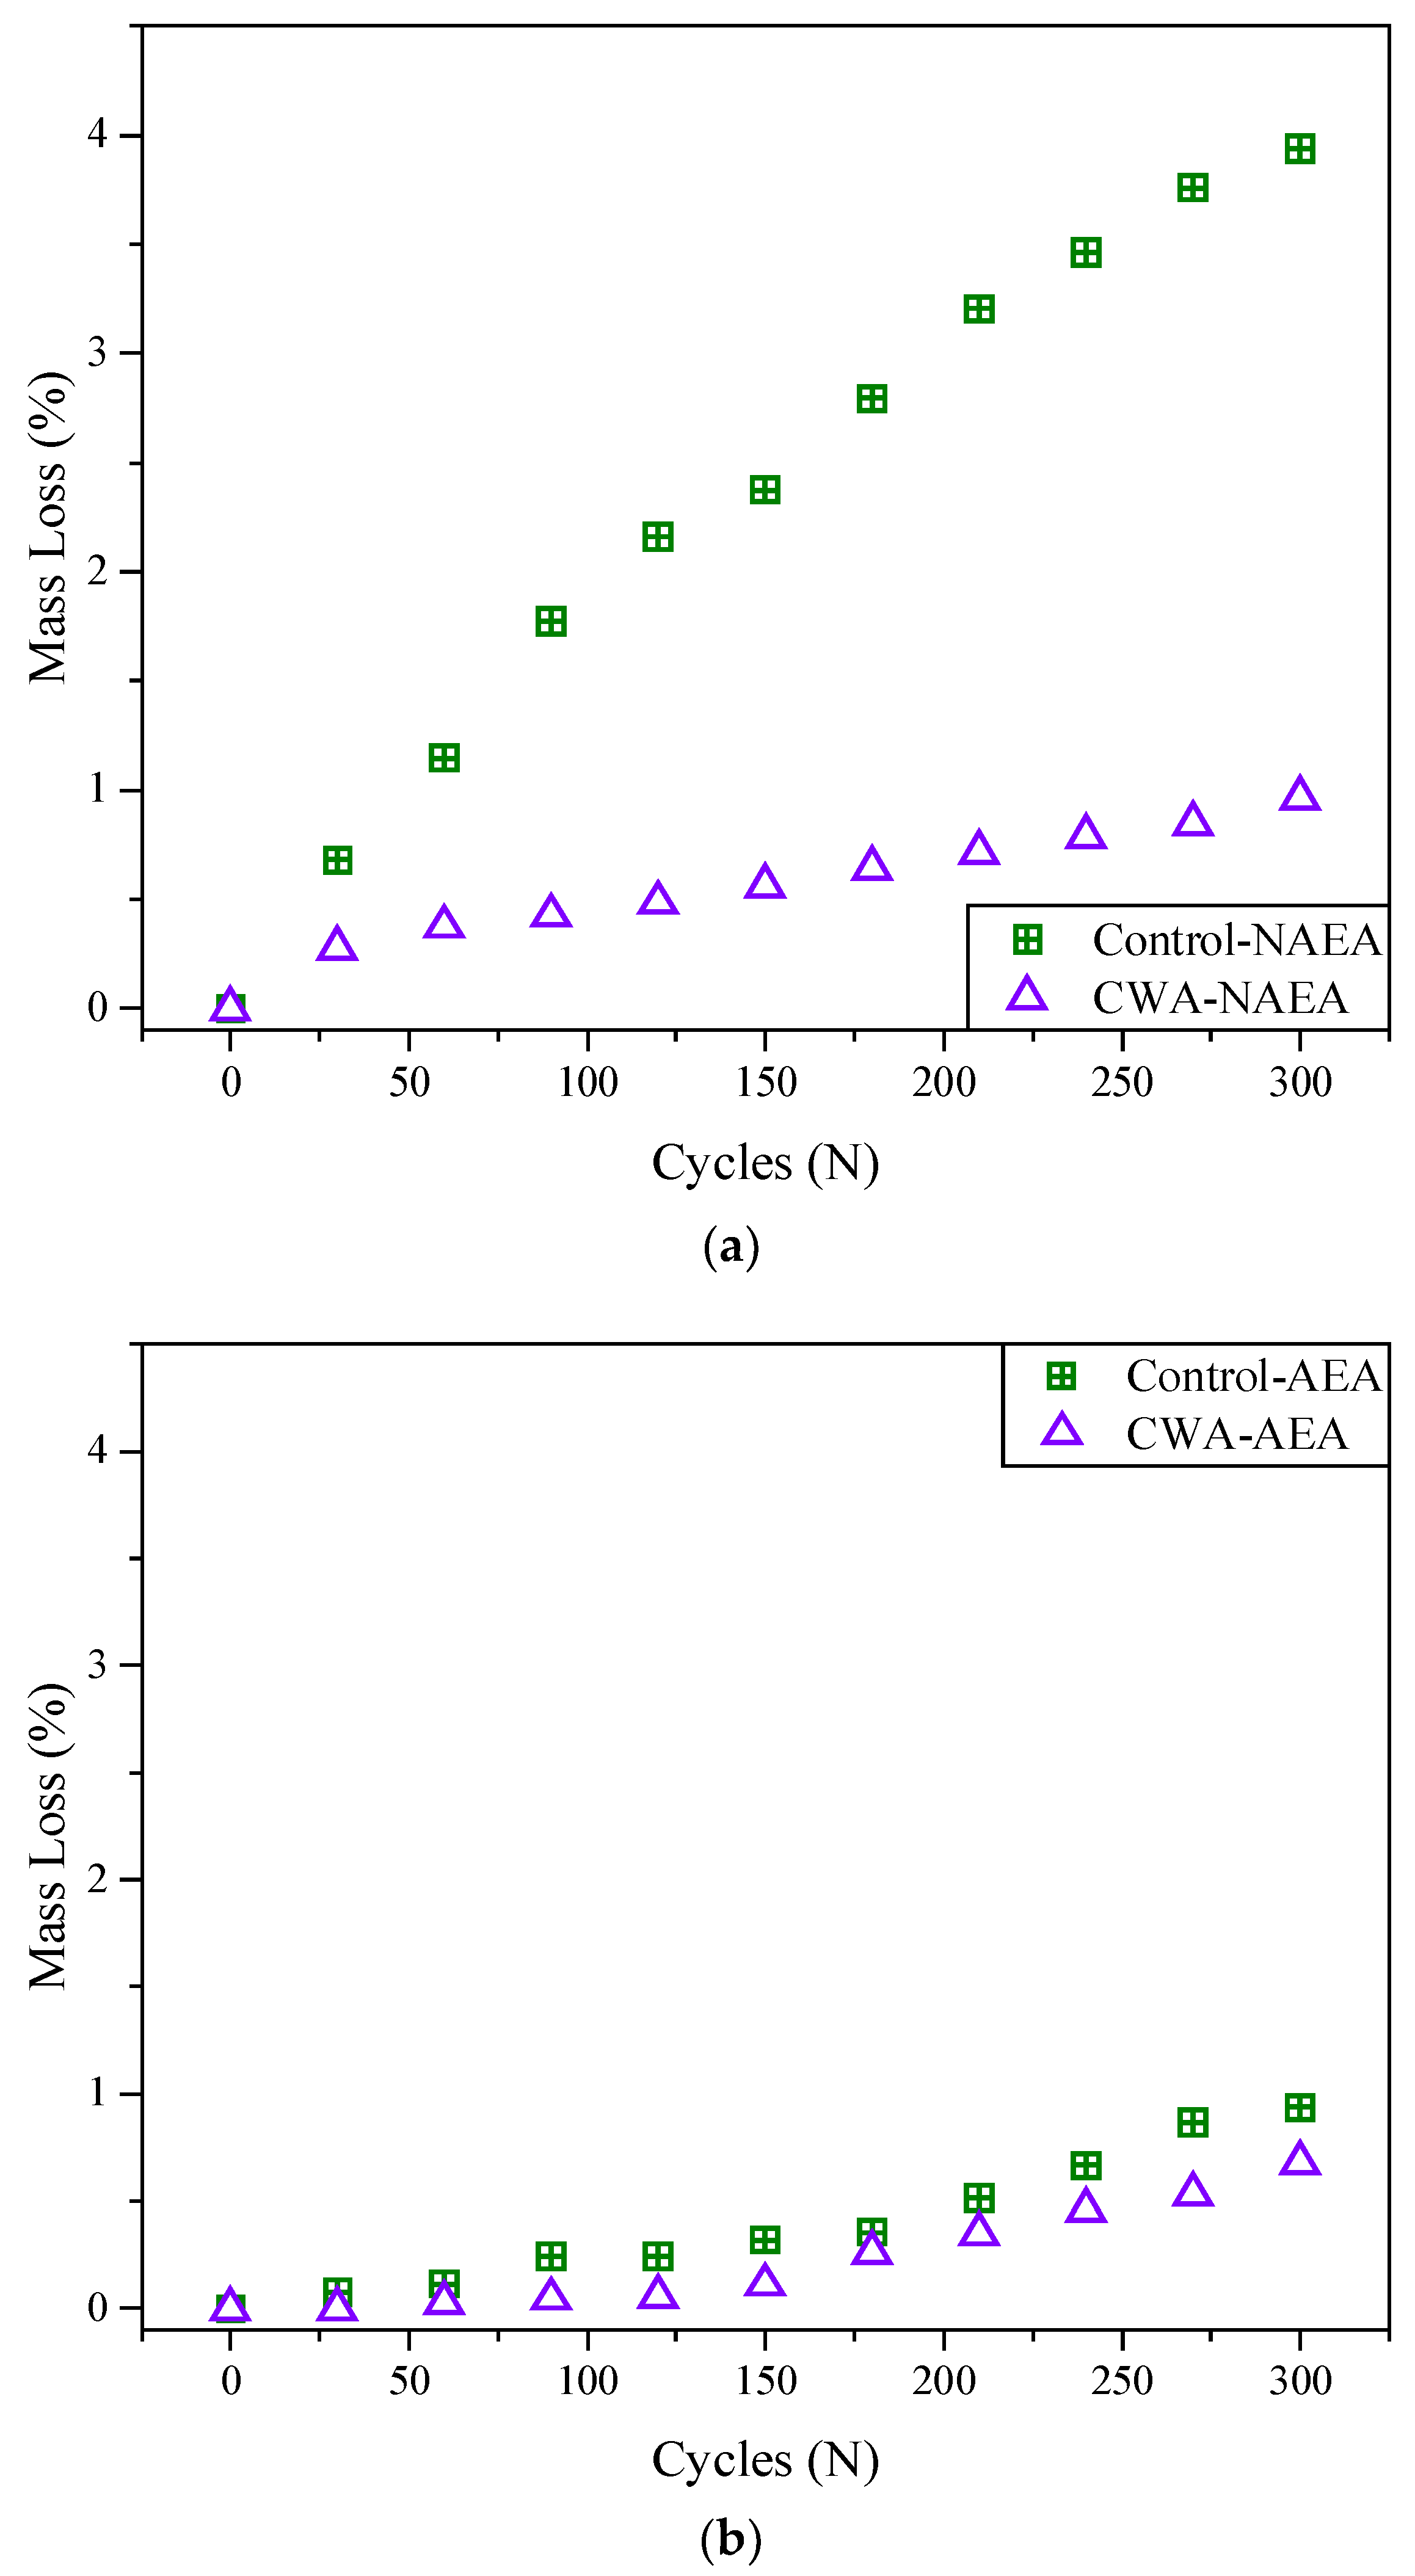
Mass Loss
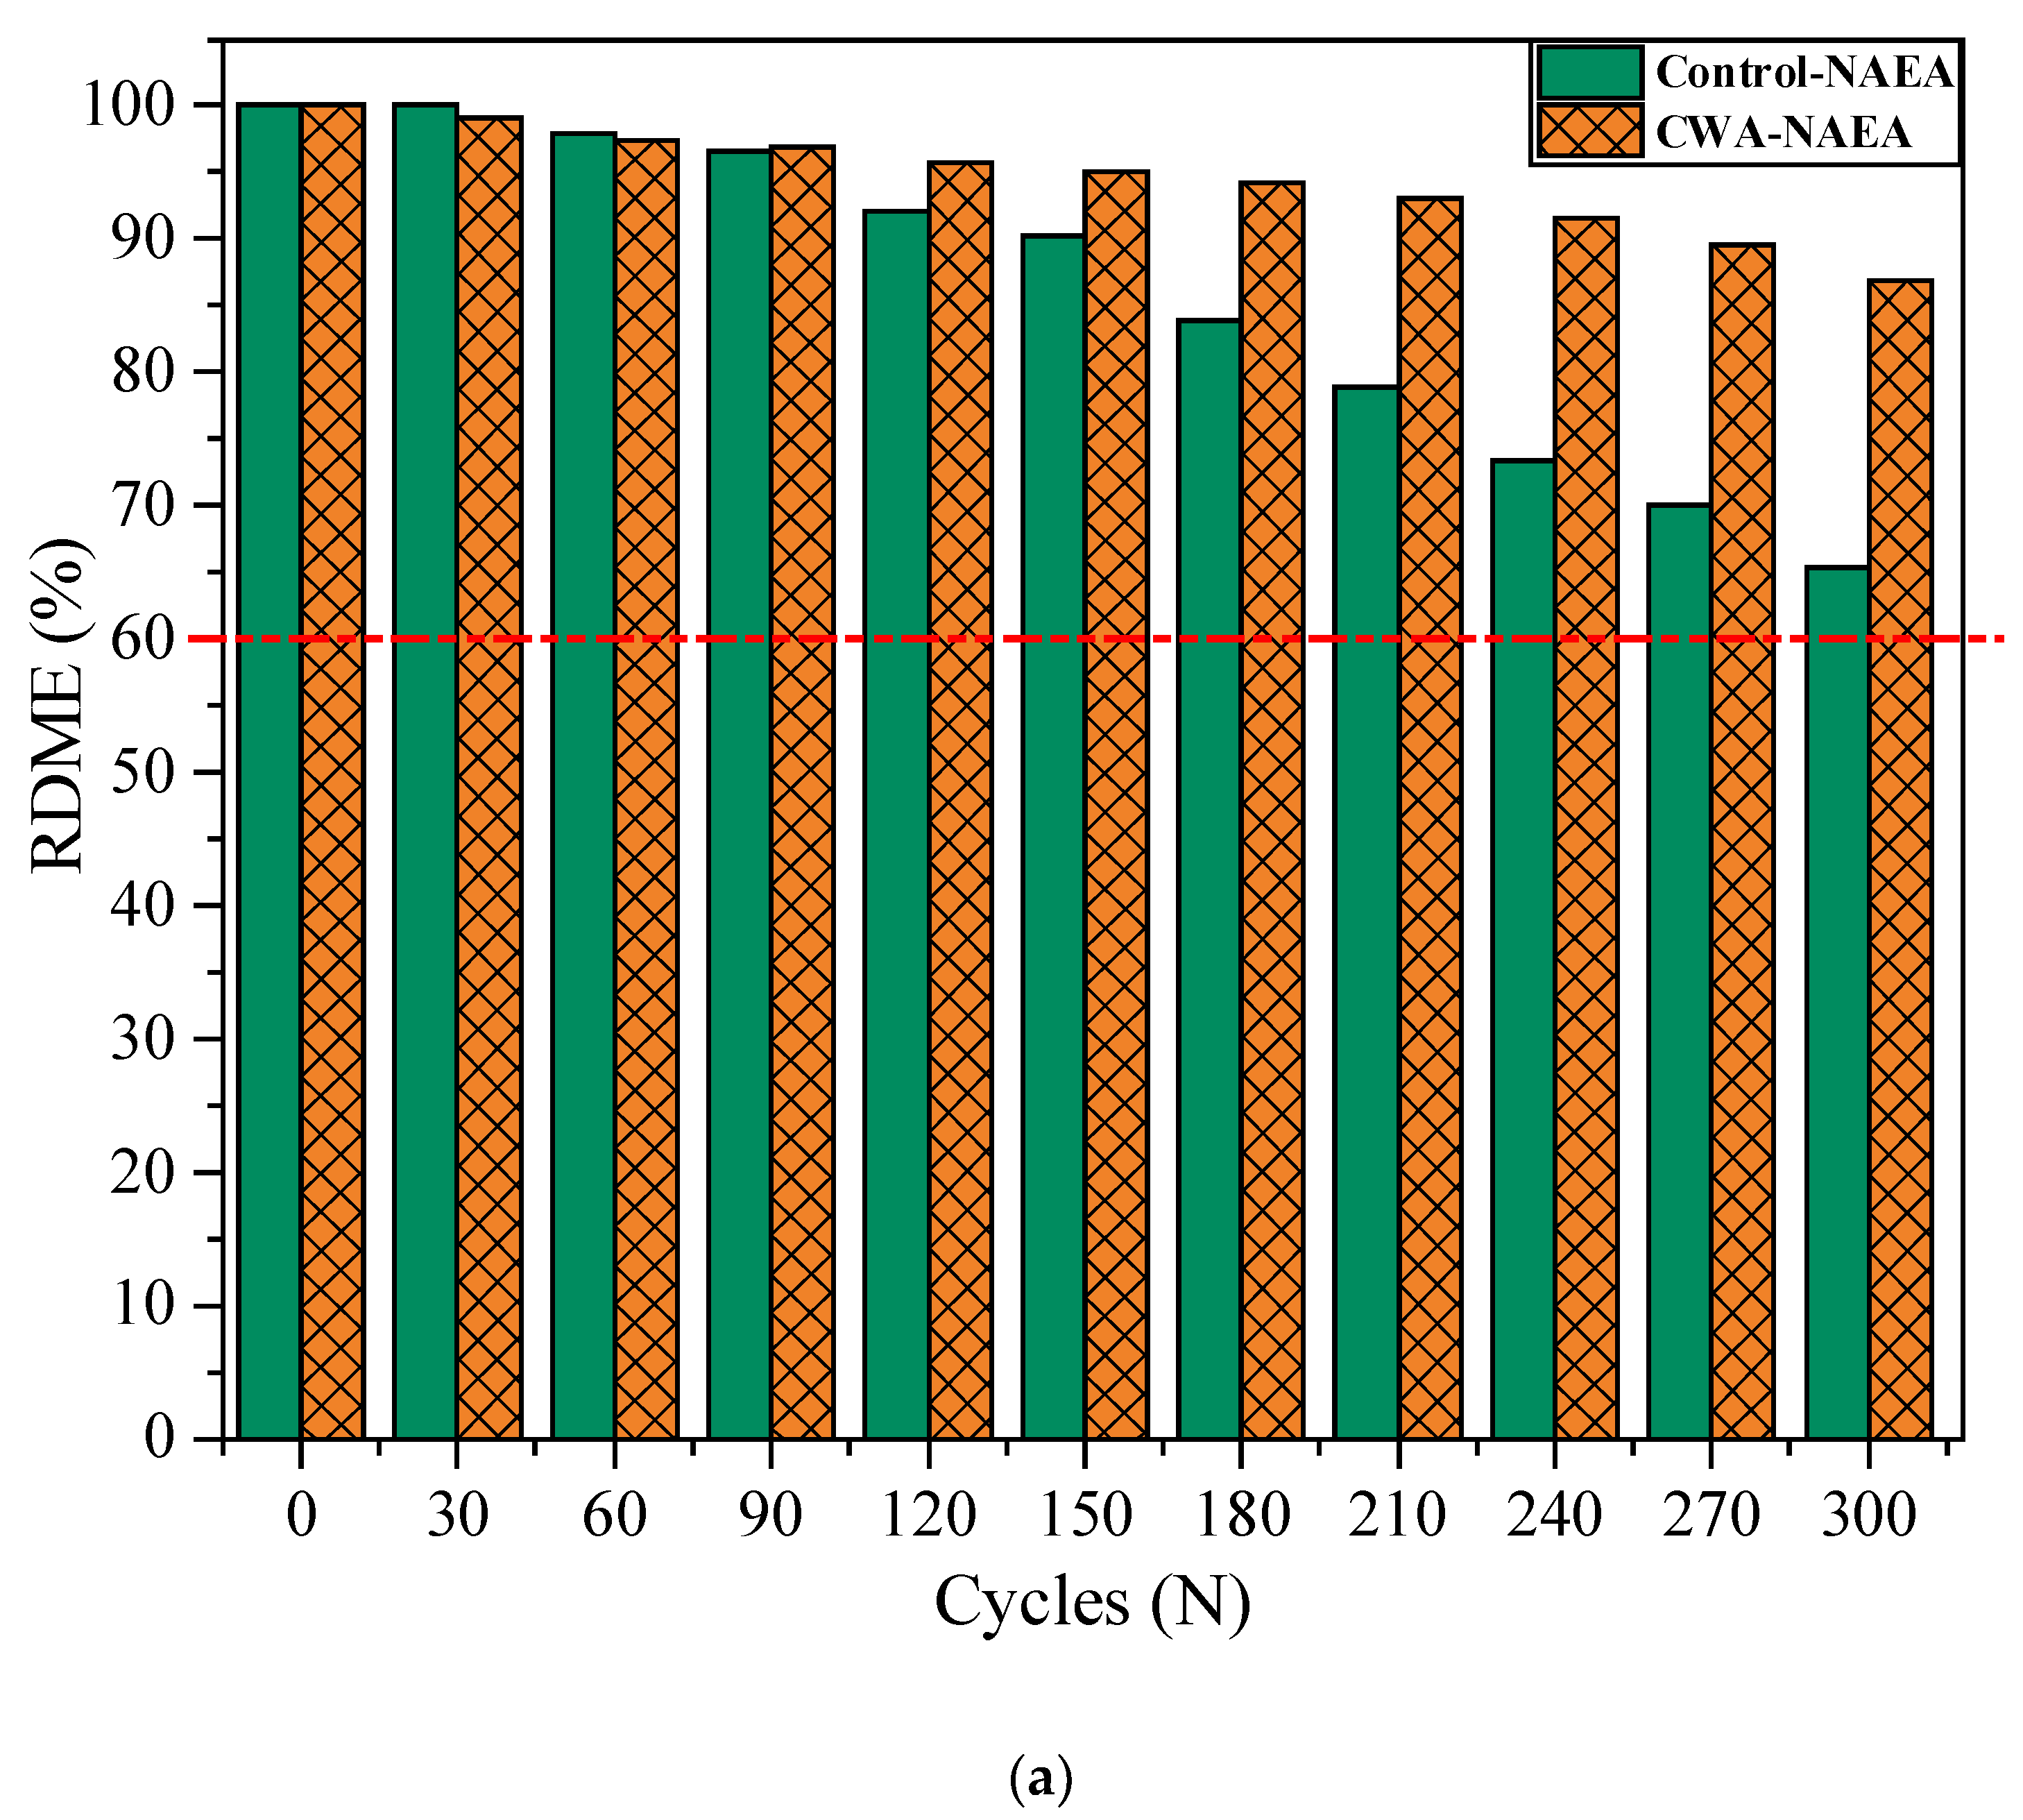
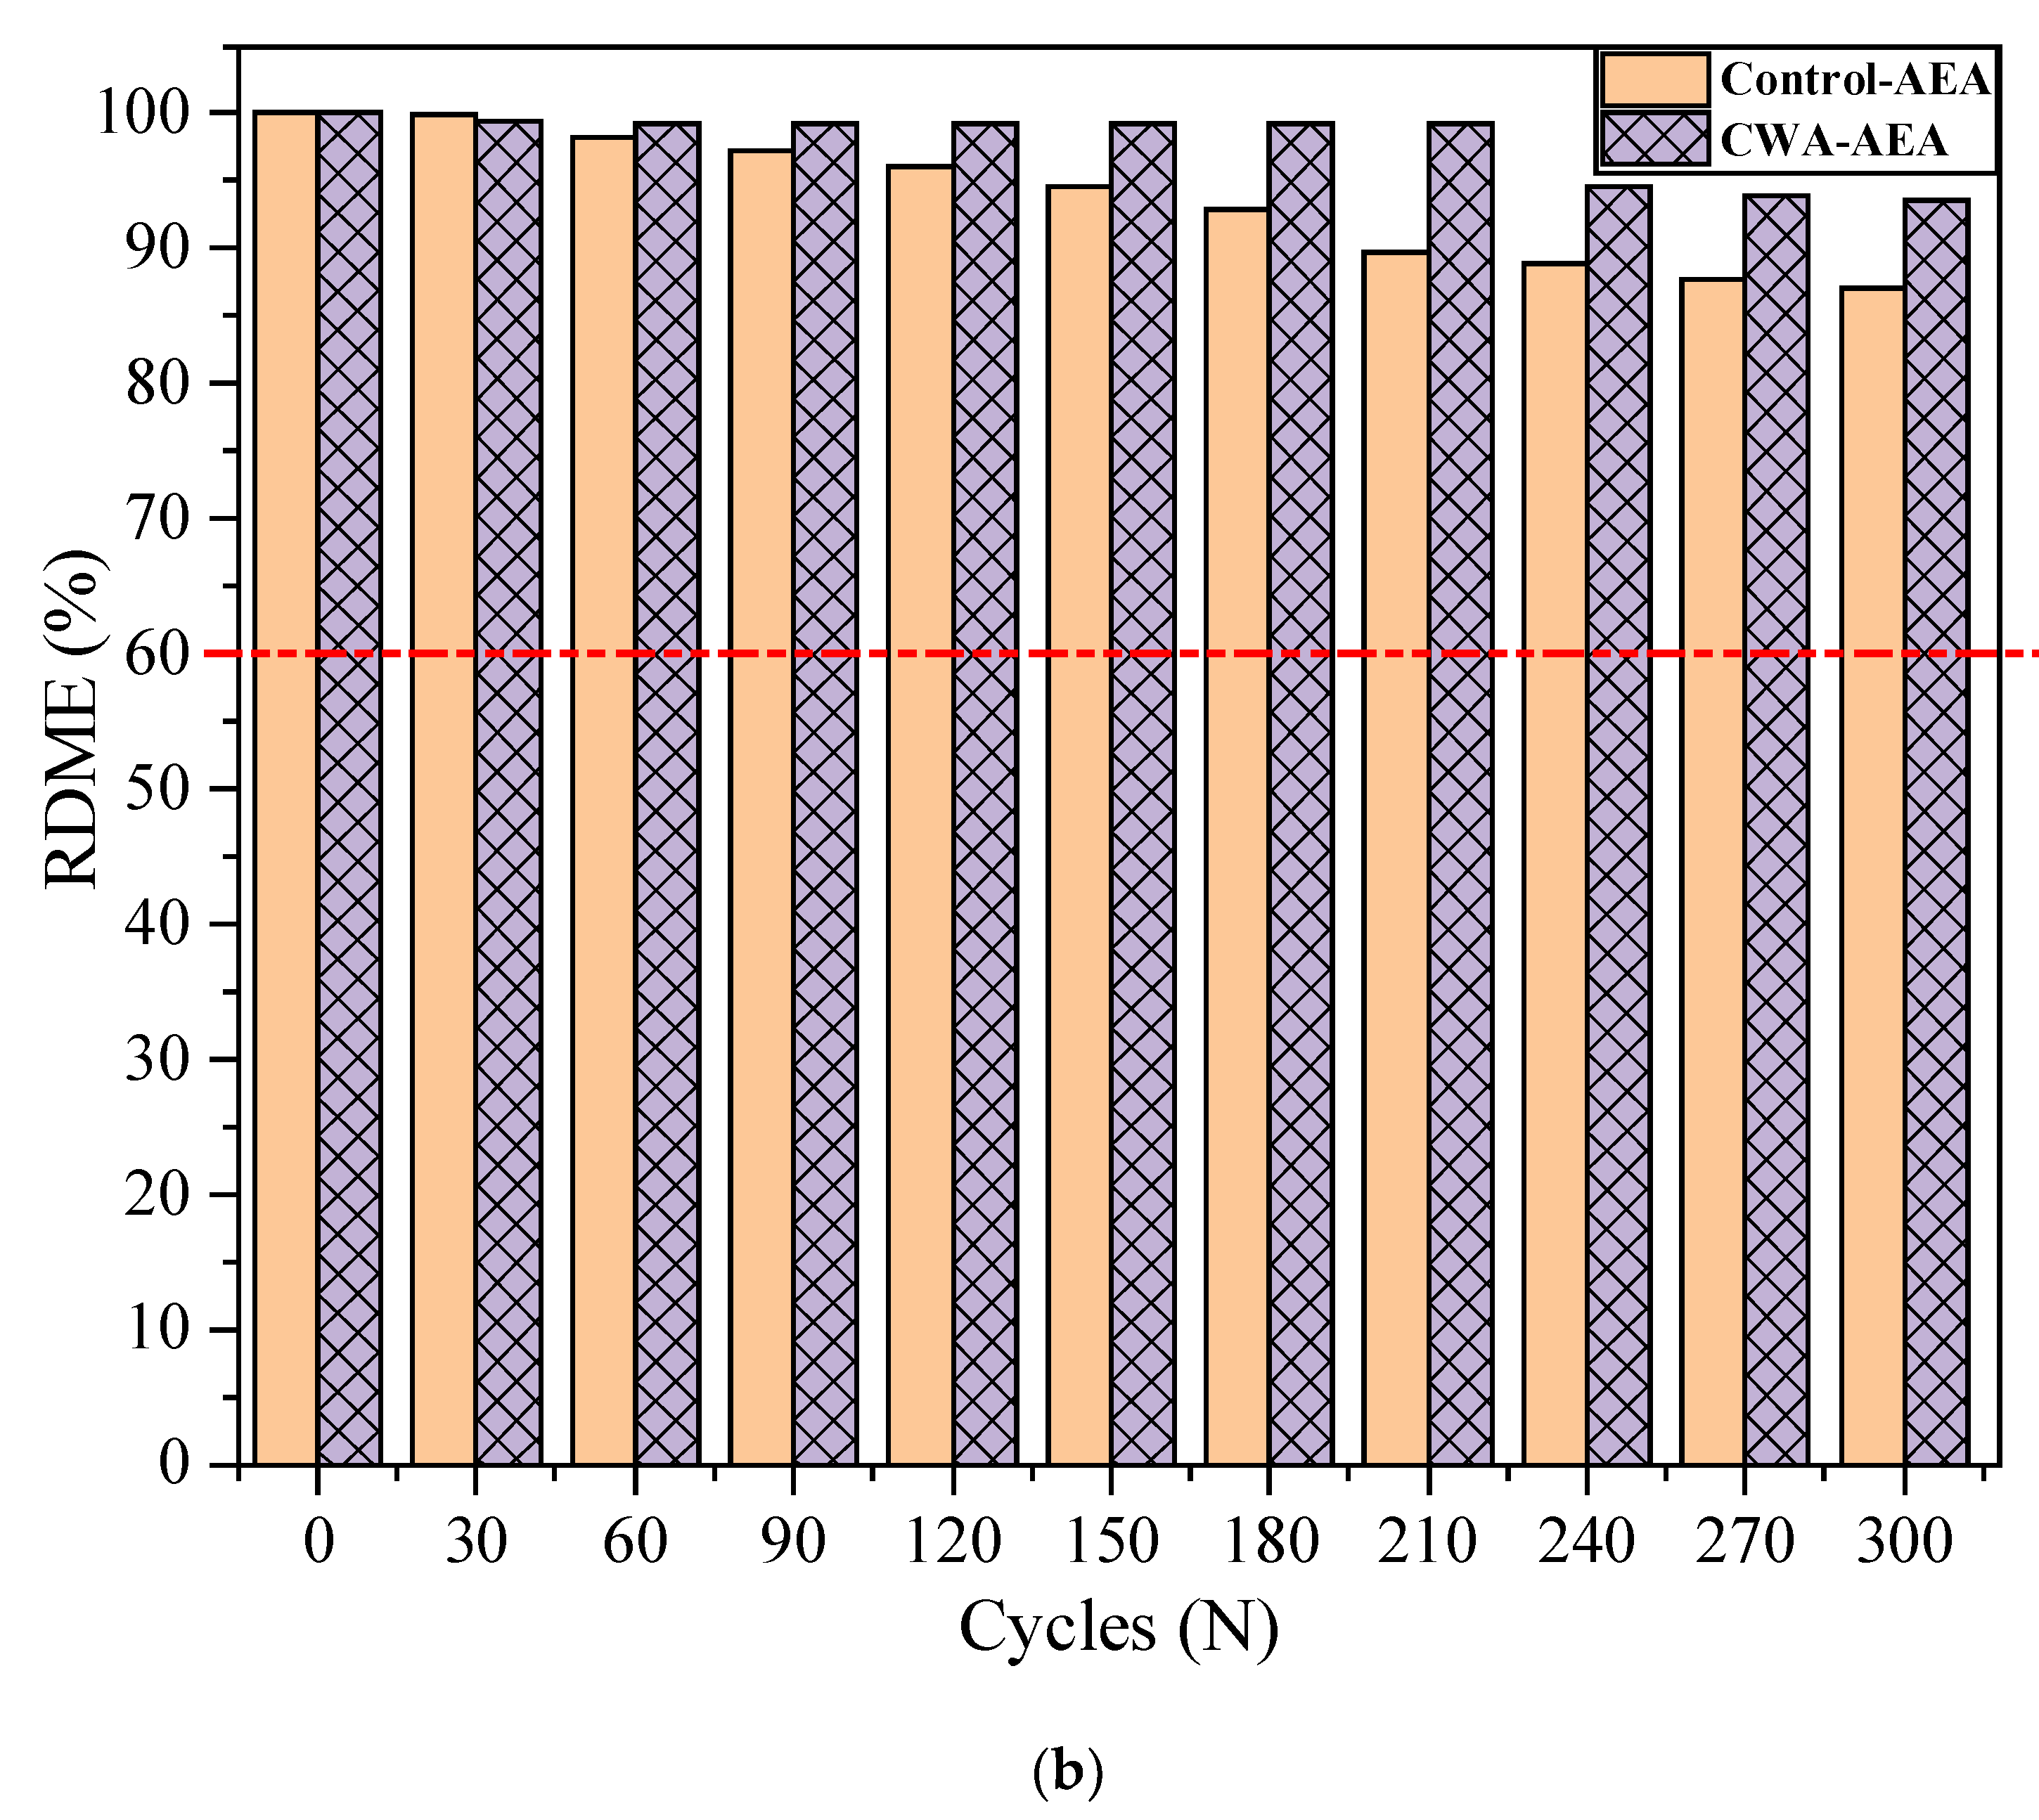
Relative Dynamic Modulus of Elasticity (RDME) of Concrete
Durability Factor (DF)
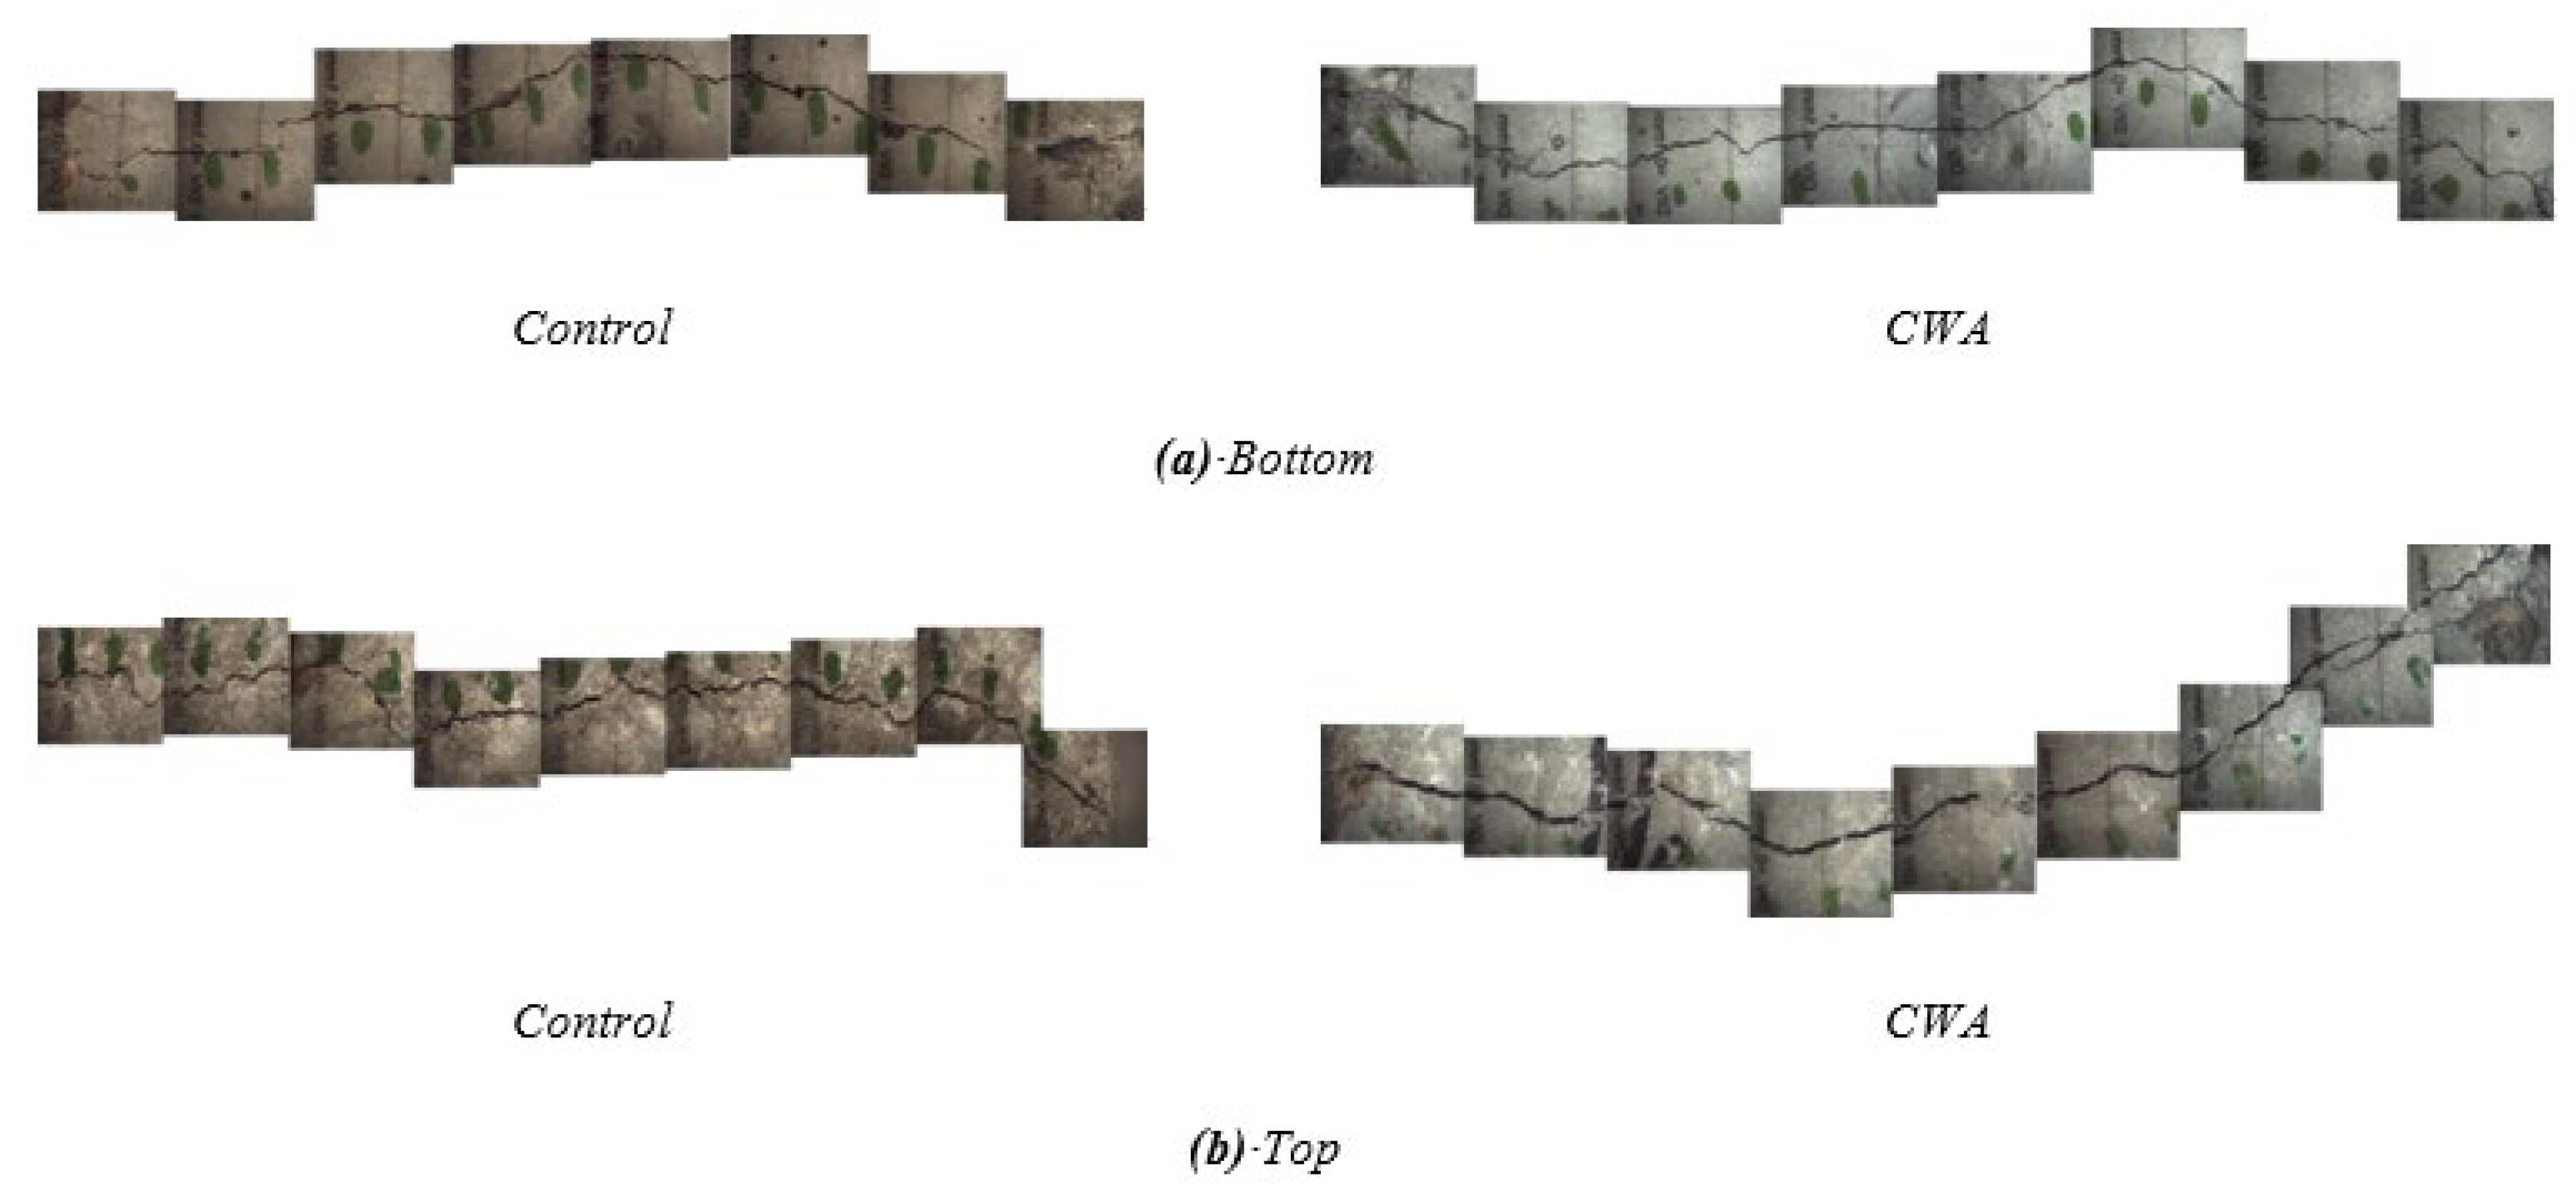
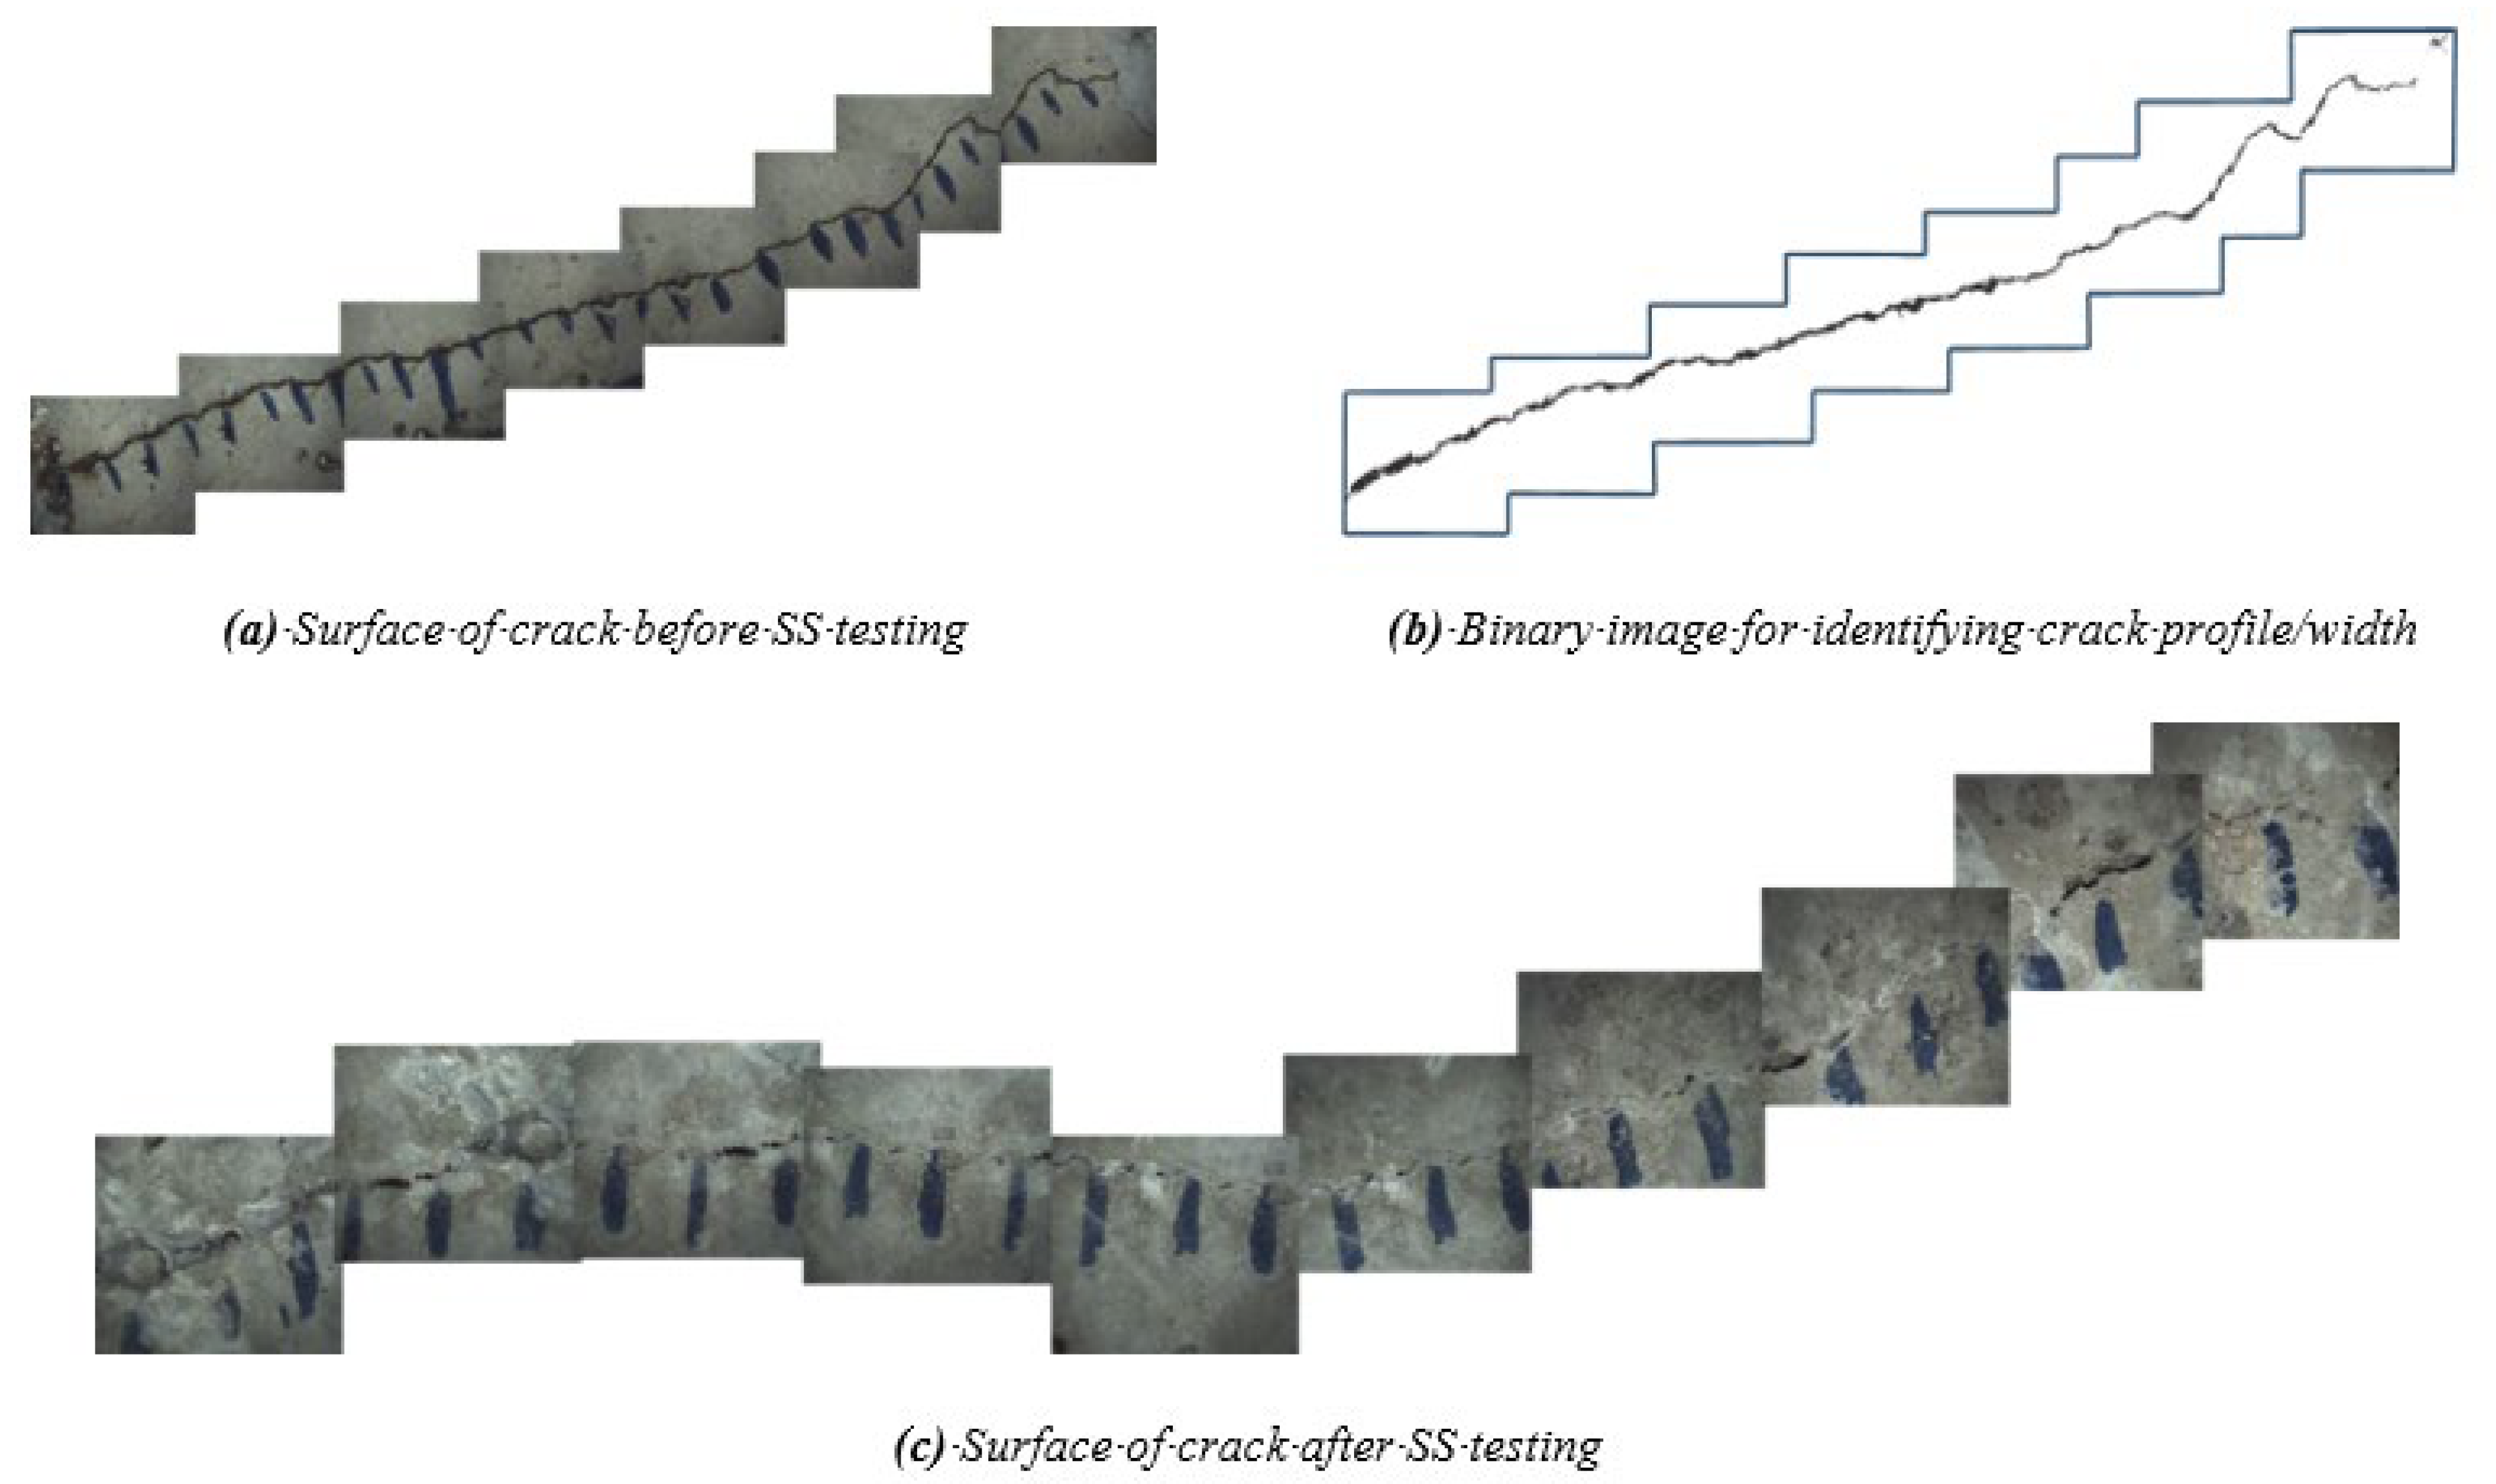
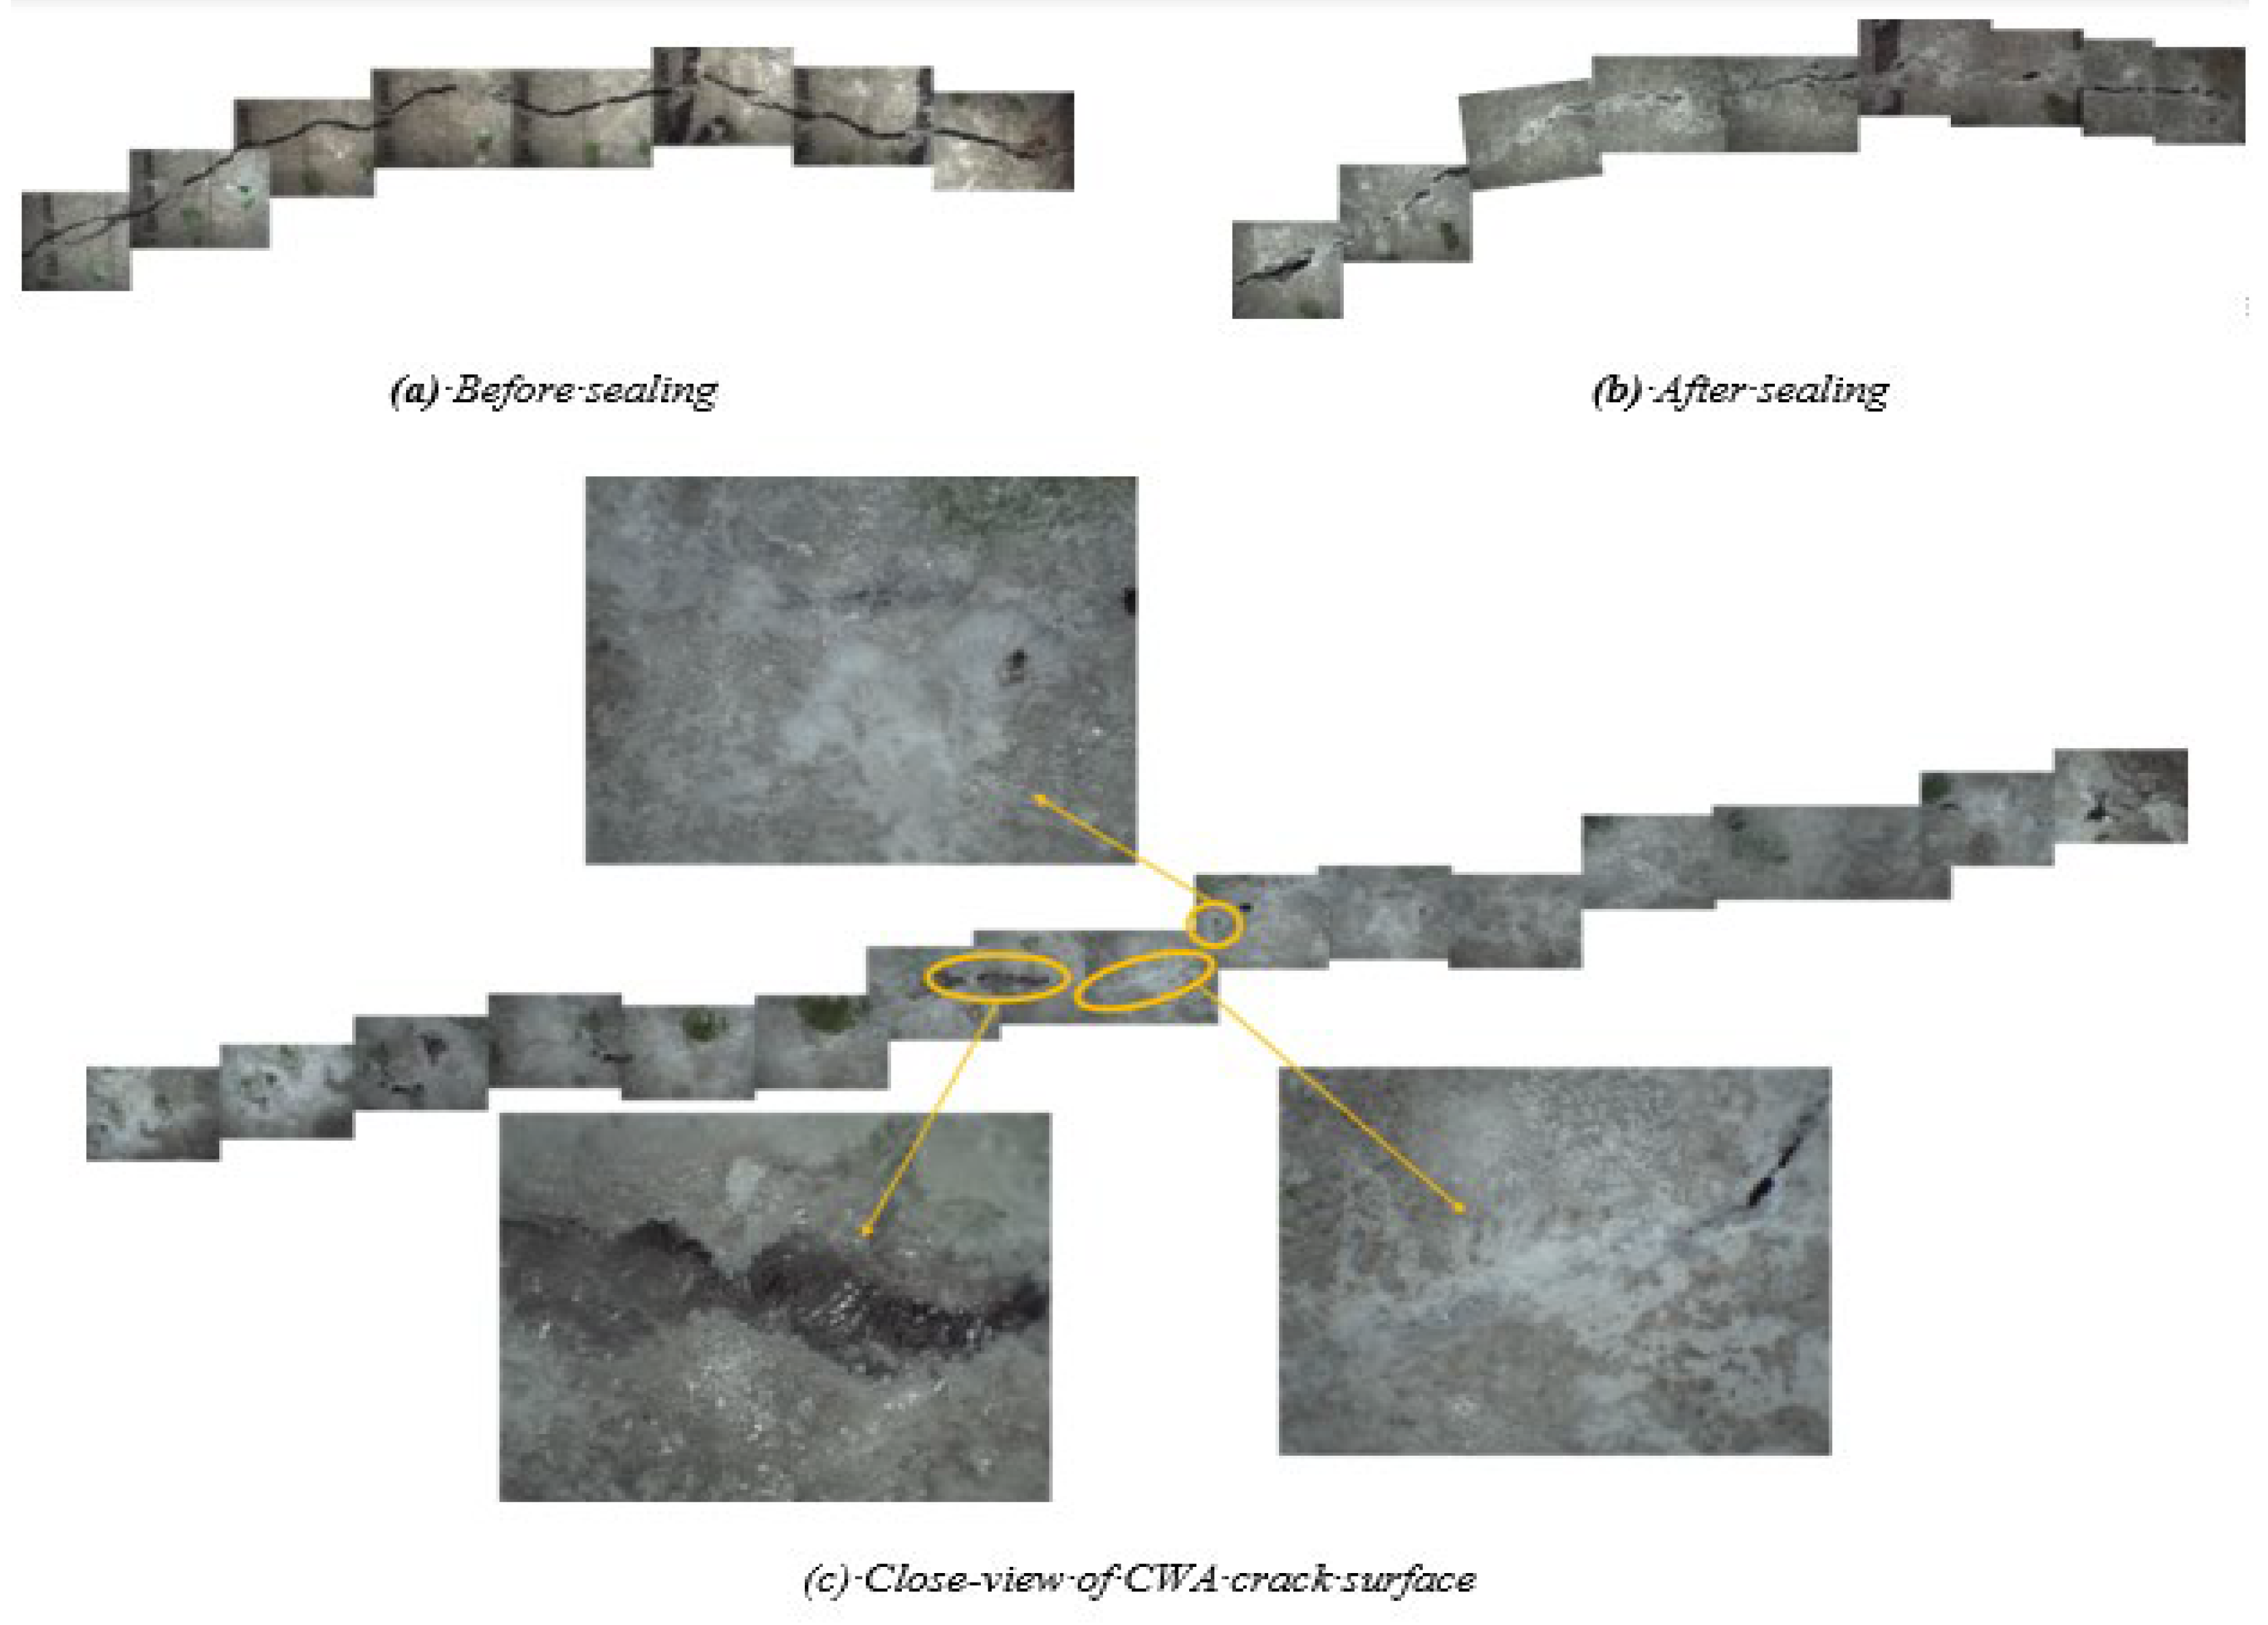
3.1.7. Self-Sealing Capability of Concrete
Microscopical Observations
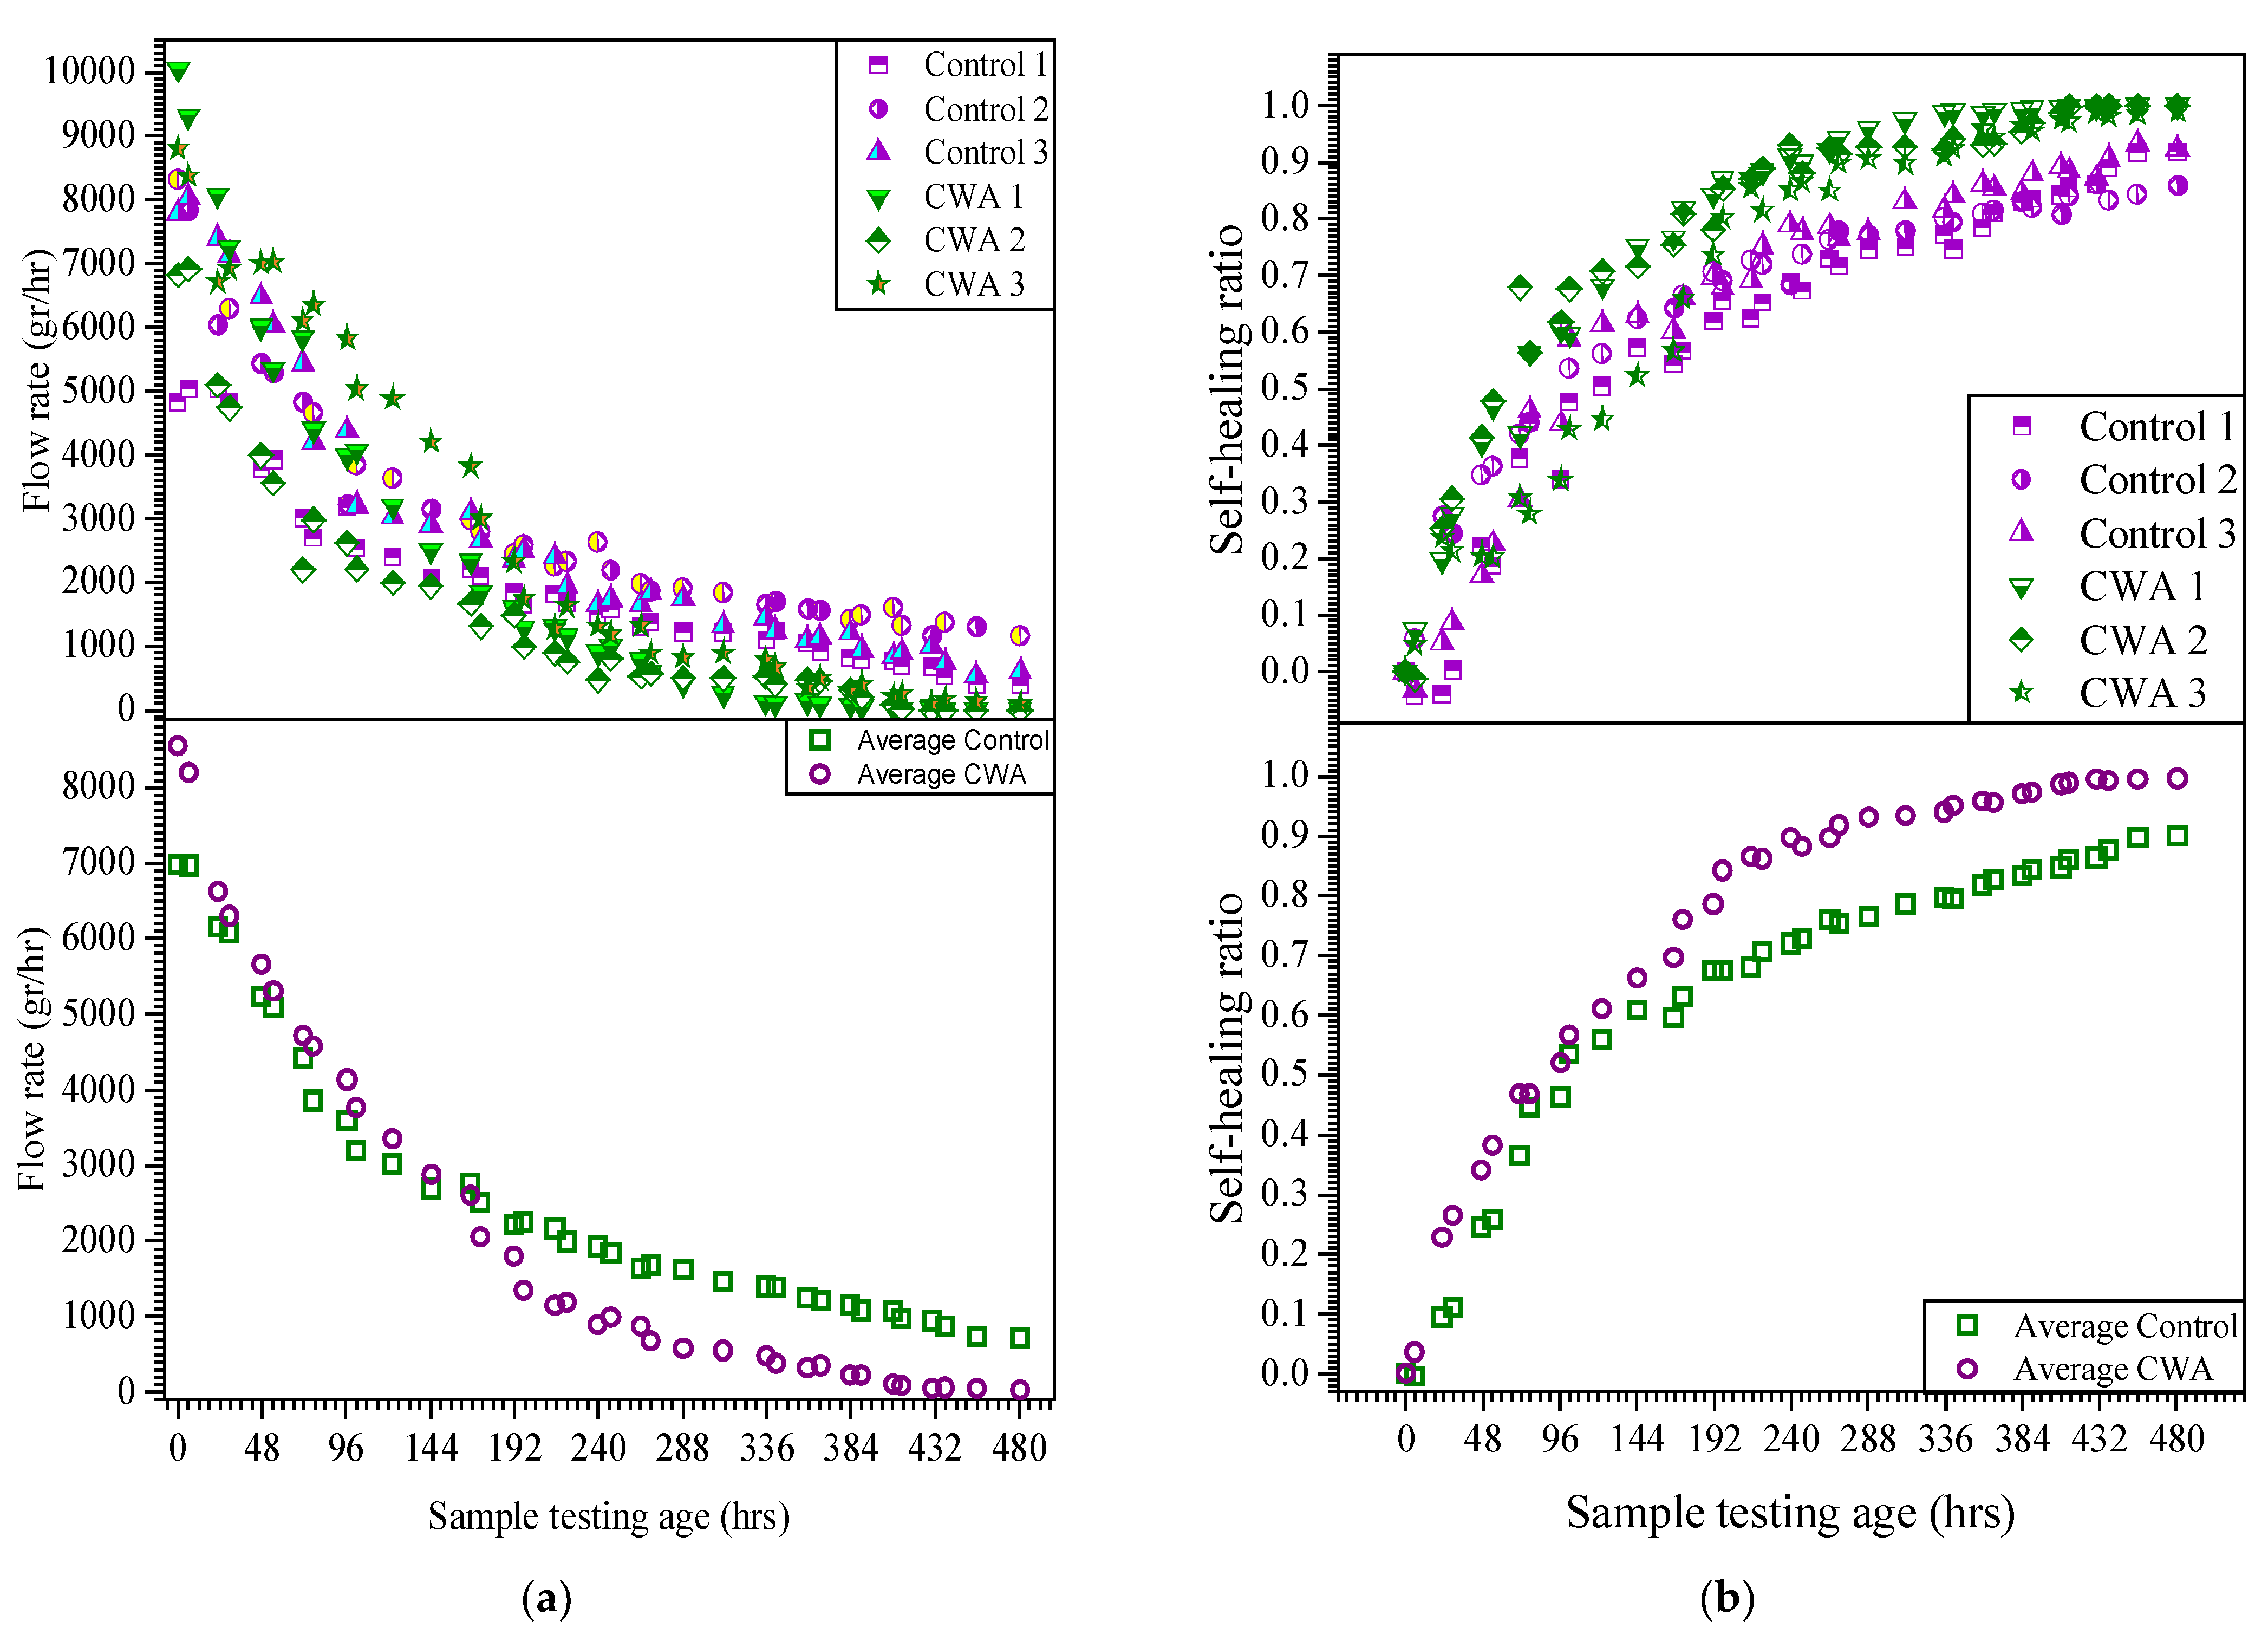
3.1.8. Crack Width and Flow Measurement Results:
4. Conclusions
Author Contributions
Funding
Institutional Review Board Statement
Informed Consent Statement
Data Availability Statement
Acknowledgments
Conflicts of Interest
References
- Escoffres, P.; Desmettre, C.; Charron, J.-P. Effect of a crystalline admixture on the self-healing capability of high-performance fiber reinforced concretes in service conditions. Constr. Build. Mater. 2018, 173, 763–774. [Google Scholar] [CrossRef]
- Perkins, P.H. Repair, Protection and Waterproofing of Concrete Structures, 3rd ed.; E. & F.N. Spon: London, UK, 1997; ISBN 978-0-419-20280-6. [Google Scholar]
- Goguen, C. 5 Rules of Watertightness. Available online: https://precast.org/2012/11/5-rules-of-watertightness/ (accessed on 10 July 2021).
- ACI Committee 212. Report on Chemical Admixtures for Concrete; American Concrete Institute (ACI): Farmington Hills, MI, USA, 2016; ISBN 978-1-942727-80-4. [Google Scholar]
- García Calvo, J.L.; Sánchez Moreno, M.; Carballosa, P.; Pedrosa, F.; Tavares, F. Improvement of the Concrete Permeability by Using Hydrophilic Blended Additive. Materials 2019, 12, 2384. [Google Scholar] [CrossRef] [PubMed] [Green Version]
- Pazderka, J.; Hájková, E. Crystalline Admixtures and Their Effect on Selected Properties of Concrete. Acta Polytech. 2016, 56, 306–311. [Google Scholar] [CrossRef] [Green Version]
- Drochytka, R.; Ledl, M.; Bydzovsky, J.; Zizkova, N.; Bester, J. Use of Secondary Crystallization and Fly Ash in Waterproofing Materials to Increase Concrete Resistance to Aggressive Gases and Liquids. Adv. Civ. Eng. 2019, 2019, 1–12. [Google Scholar] [CrossRef] [Green Version]
- Žižková, N.; Nevřivová, L.; Lédl, M. Durability of Cement Based Mortars Containing Crystalline Additives. Defect Diffus. Forum 2018, 382, 246–253. [Google Scholar] [CrossRef]
- Žižková, N.; Nevřivová, L.; Lédl, M. Effect of Humidity on the Properties of Cement Mortars with a Crystalline Additive. Solid State Phenom. 2018, 276, 53–59. [Google Scholar] [CrossRef]
- Zizkova, N.; Nevrivova, L.; Ledl, M.; Keprdova, S. Mortars with crystalline additive in aggressive environments. IOP Conf. Ser. Mater. Sci. Eng. 2018, 385, 012066. [Google Scholar] [CrossRef]
- Nevřivová, L.; Žižková, N.; Lédl, M. Influence of a Crystalline Additive on the Porosity of Cement Mortars. Defect Diffus. Forum 2018, 382, 254–260. [Google Scholar] [CrossRef]
- Elsalamawy, M.; Mohamed, A.R.; Abosen, A.E. Performance of crystalline forming additive materials in concrete. Constr. Build. Mater. 2020, 230, 117056. [Google Scholar] [CrossRef]
- Azarsa, P.; Gupta, R.; Biparva, A. Assessment of self-healing and durability parameters of concretes incorporating crystalline admixtures and Portland Limestone Cement. Cem. Concr. Compos. 2019, 99, 17–31. [Google Scholar] [CrossRef]
- Azarsa, P. Multi-Scale Investigation and Resistivity-Based Durability Modeling of EShC Containing Crystalline Admixtures. Ph.D. Thesis, University of Victoria, Victoria, BC, Canada, 2018. [Google Scholar]
- Azarsa, P.; Gupta, R.; Biparva, A. Inventive Microstructural and Durability Investigation of Cementitious Composites Involving Crystalline Waterproofing Admixtures and Portland Limestone Cement. Materials 2020, 13, 1425. [Google Scholar] [CrossRef] [Green Version]
- Azarsa, P.; Gupta, R. Specimen preparation for nano-scale investigation of cementitious repair material. Micron 2018, 107, 43–54. [Google Scholar] [CrossRef] [PubMed]
- Azarsa, P.; Gupta, R. Electrical Resistivity of Concrete for Durability Evaluation: A Review. Adv. Mater. Sci. Eng. 2017, 2017, 1–30. [Google Scholar] [CrossRef] [Green Version]
- Azarsa, P.; Gupta, R.; Biparva, A. Crystalline Waterproofing Admixtures Effects on Self-healing and Permeability of Concrete. In Proceedings of the International Conference on New Horizons in Green Civil Engineering, Victoria, BC, Canada, 25–27 April 2018. [Google Scholar]
- ACI 318. Building Code Requirements for Structural Concrete; American Concrete Institute (ACI): Farmington Hills, MI, USA, 2019. [Google Scholar]
- Abro, F.u.R.; Buller, A.S.; Lee, K.-M.; Jang, S.Y. Using the Steady-State Chloride Migration Test to Evaluate the Self-Healing Capacity of Cracked Mortars Containing Crystalline, Expansive, and Swelling Admixtures. Materials 2019, 12, 1865. [Google Scholar] [CrossRef] [PubMed] [Green Version]
- Jaroenratanapirom, D.; Sahamitmongkol, R. Self-Crack Closing Ability of Mortar with Different Additives. J. Met. Mater. Miner. 2011, 21, 9–17. [Google Scholar]
- Jaroenratanapirom, D.; Sahamitmongkol, R. Effects of Different Mineral Additives and Cracking Ages on Self-Healing Performance of Mortar. In Proceedings of the 6th Annual Concrete Conference, Phetchaburi, Thailand, 20–22 October 2010. [Google Scholar]
- Sisomphon, K.; Copuroglu, O.; Koenders, E.A.B. Self-healing of surface cracks in mortars with expansive additive and crystalline additive. Cem. Concr. Compos. 2012, 34, 566–574. [Google Scholar] [CrossRef]
- Sisomphon, K.; Copuroglu, O.; Koenders, E.A.B. Effect of exposure conditions on self healing behavior of strain hardening cementitious composites incorporating various cementitious materials. Constr. Build. Mater. 2013, 42, 217–224. [Google Scholar] [CrossRef]
- Ferrara, L.; Krelani, V.; Carsana, M. A “fracture testing” based approach to assess crack healing of concrete with and without crystalline admixtures. Constr. Build. Mater. 2014, 68, 535–551. [Google Scholar] [CrossRef]
- Roig-Flores, M.; Moscato, S.; Serna, P.; Ferrara, L. Self-healing capability of concrete with crystalline admixtures in different environments. Constr. Build. Mater. 2015, 86, 1–11. [Google Scholar] [CrossRef]
- Roig-Flores, M.; Pirritano, F.; Serna, P.; Ferrara, L. Effect of crystalline admixtures on the self-healing capability of early-age concrete studied by means of permeability and crack closing tests. Constr. Build. Mater. 2016, 114, 447–457. [Google Scholar] [CrossRef]
- Ferrara, L.; Krelani, V.; Moretti, F. On the use of crystalline admixtures in cement based construction materials: From porosity reducers to promoters of self healing. Smart Mater. Struct. 2016, 25, 084002. [Google Scholar] [CrossRef]
- Cuenca, E.; Tejedor, A.; Ferrara, L. A methodology to assess crack-sealing effectiveness of crystalline admixtures under repeated cracking-healing cycles. Constr. Build. Mater. 2018, 179, 619–632. [Google Scholar] [CrossRef]
- Li, D.; Chen, B.; Chen, X.; Fu, B.; Wei, H.; Xiang, X. Synergetic effect of superabsorbent polymer (SAP) and crystalline admixture (CA) on mortar macro-crack healing. Constr. Build. Mater. 2020, 247, 118521. [Google Scholar] [CrossRef]
- Robertson, I. Performance of Corrosion Inhibiting Admixtures in a Marine Environment. In Construction Materials and Structures; IOS Press: Amsterdam, The Netherlands, 2014. [Google Scholar]
- Gupta, R.; Biparva, A. Innovative Test Technique to Evaluate “Self-Sealing” of Concrete. J. Test. Eval. 2015, 43, 20130285. [Google Scholar] [CrossRef]
- Gupta, R.; Biparva, A. Do crystalline water proofing admixtures affect restrained plastic shrinkage behavior of concrete? Rev. Alconpat 2017, 7, 15. [Google Scholar] [CrossRef] [Green Version]
- ASTM C876. Test Method for Corrosion Potentials of Uncoated Reinforcing Steel in Concrete; ASTM International: West Conshohocken, PA, USA, 2015. [Google Scholar] [CrossRef]
- ASTM G109. Standard Test Method for Determining Effects of Chemical Admixtures on Corrosion of Embedded Steel Reinforcement in Concrete Exposed to Chloride Environments; ASTM International: West Conshohocken, PA, USA, 2013. [Google Scholar]
- ASTM C666. Test Method for Resistance of Concrete to Rapid Freezing and Thawing; ASTM International: West Conshohocken, PA, USA, 2015. [Google Scholar]
- ASTM C215. Test Method for Fundamental Transverse, Longitudinal, and Torsional Resonant Frequencies of Concrete Specimens; ASTM International: West Conshohocken, PA, USA, 2019. [Google Scholar]
- 38. CSA Standard A23.1. Concrete Materials and Methods of Concrete Construction/Test Methods and Standard Practices for Concrete; CSA Group: Toronto, ON, USA, 2019. [Google Scholar]
- ASTM C150. Standard Specification for Portland Cement; ASTM International: West Conshohocken, PA, USA, 2019. [Google Scholar]
- 40. CSA A23.1-14. Standard for Concrete Materials and Methods of Concrete Construction; Canadian Standard Association: Toronto, ON, Canada, 2014. [Google Scholar]
- ASTM C33/C33M-18. Standard Specification for Concrete Aggregates; ASTM International: West Conshohocken, PA, USA, 2018. [Google Scholar]
- ASTM C127-15. Standard Test Method for Relative Density (Specific Gravity) and Absorption of Coarse Aggregate; ASTM International: West Conshohocken, PA, USA, 2015. [Google Scholar]
- ASTM C192/C192M-15. Standard Practice for Making and Curing Concrete Test Specimens in the Laboratory; ASTM International: West Conshohocken, PA, USA, 2015. [Google Scholar]
- ASTM C39. Test Method for Compressive Strength of Cylindrical Concrete Specimens; ASTM International: West Conshohocken, PA, USA, 2020. [Google Scholar]
- ASTM C143. Test Method for Slump of Hydraulic-Cement Concrete; ASTM International: West Conshohocken, PA, USA, 2020. [Google Scholar]
- ASTM C231. Test Method for Air Content of Freshly Mixed Concrete by the Pressure Method; ASTM International: West Conshohocken, PA, USA, 2017. [Google Scholar]
- Trejo, D.; Halmen, C.; Reinschmidt, K. Corrosion Performance Tests for Reinforcing Steel in Concrete; Texas Department of Transportation and the U.S. Department of Transportation, Federal Highway Administration: Austin, TX, USA, 2008. [Google Scholar]
- ASTM G59. Standard Test Method for Conducting Potentiodynamic Polarization Resistance Measurements; ASTM International: West Conshohocken, PA, USA, 2014. [Google Scholar]
- ASTM G102. Standard Practice for Calculation of Corrosion Rates and Related Information from Electrochemical Measurements; ASTM International: West Conshohocken, PA, USA, 2015. [Google Scholar]
- Song, H.H.; Yalagandula, P. Real-time End-to-end Network Monitoring in Large Distributed Systems. In Proceedings of the 2007 2nd International Conference on Communication Systems Software and Middleware, Bangalore, India, 7–12 January 2007; pp. 1–10. [Google Scholar]
- Al-Tholaia, M.M.H.; Azad, A.K.; Ahmad, S.; Baluch, M.H. A comparative study of corrosion resistance of different coatings for mortar–embedded steel plates. Constr. Build. Mater. 2014, 56, 74–80. [Google Scholar] [CrossRef]
- Stern, M.; Geaby, A.L. Electrochemical Polarization. J. Electrochem. Soc. 1957, 104, 56. [Google Scholar] [CrossRef]
- Andrade, C.; Alonso, C. Test methods for on-site corrosion rate measurement of steel reinforcement in concrete by means of the polarization resistance method. Mater. Struct. 2004, 37, 623–643. [Google Scholar] [CrossRef]
- Morris, W.; Vico, A.; Vazquez, M.; de Sanchez, S.R. Corrosion of reinforcing steel evaluated by means of concrete resistivity measurements. Corros. Sci. 2002, 44, 81–99. [Google Scholar] [CrossRef]
- Millard, S.G.; Law, D.; Bungey, J.H.; Cairns, J. Environmental influences on linear polarisation corrosion rate measurement in reinforced concrete. NDT E Int. 2001, 34, 409–417. [Google Scholar] [CrossRef]
- ASTM C805. Test Method for Rebound Number of Hardened Concrete; ASTM International: West Conshohocken, PA, USA, 2018. [Google Scholar]
- Biparva, A.; Gupta, R.; Gavrilovic, S. Self-Sealing Concrete: Innovative Test Technique and Method of Analysis. In Proceedings of the International Conference of Future Concrete, Dubai, United Arab Emirates, 12 December 2011. [Google Scholar]
- Erdoğdu, Ş.; Bremner, T.W.; Kondratova, I.L. Accelerated testing of plain and epoxy-coated reinforcement in simulated seawater and chloride solutions. Cem. Concr. Res. 2001, 31, 861–867. [Google Scholar] [CrossRef]
- Wheat, H.G.; Eliezer, Z. Some Electrochemical Aspects of Corrosion of Steel in Concrete. Corrosion 1985, 41, 640–645. [Google Scholar] [CrossRef]
- Broomfield, J.P. Corrosion of Steel in Concrete: Understanding, Investigation and Repair, 2nd ed.; CRC Press: Boca Raton, FL, USA, 2019; ISBN 978-0-367-86470-5. [Google Scholar]
- Tarranza, N.; Sanchez, K. Reliability of Rebound Hammer Test in Concrete Compressive Strength Estimation. Int. J. Adv. Agric. Environ. Eng. 2014, 1, 2. [Google Scholar]
- Paine, K.A.; Dhir, R.K.; Moroney, R.; Kopasakis, K. Use of crumb rubber to achieve freeze thaw resisting concrete. In Proceedings of the International Conference on Concrete for Extreme Conditions, Scotland, UK, 9–11 September 2002. [Google Scholar]
- Yu, H.; Ma, H.; Yan, K. An equation for determining freeze-thaw fatigue damage in concrete and a model for predicting the service life. Constr. Build. Mater. 2017, 137, 104–116. [Google Scholar] [CrossRef]
- Zaharieva, R.; Buyle-Bodin, F.; Wirquin, E. Frost resistance of recycled aggregate concrete. Cem. Concr. Res. 2004, 34, 1927–1932. [Google Scholar] [CrossRef]
- Rasband, W. ImageJ Software; National Institutes of Health: Rockville Pike, MD, USA, 2018. [Google Scholar]
- Hu, X.; Hu, S.; Fan, X. Influence of Defects on Reinforced Concrete Fracture Performance in Improved Wedge Splitting Tests. J. Test. Eval. 2019, 47, 20170176. [Google Scholar] [CrossRef]
- Veselý, V.; Konečný, P.; Lehner, P. Influence of crack propagation on electrical resistivity and ultrasonic characteristics of normal concrete assessed by sequential TPB fracture test. Theor. Appl. Fract. Mech. 2015, 80, 70–76. [Google Scholar] [CrossRef]
- Huang, Y.; He, X.; Sun, H.; Sun, Y.; Wang, Q. Effects of coral, recycled and natural coarse aggregates on the mechanical properties of concrete. Constr. Build. Mater. 2018, 192, 330–347. [Google Scholar] [CrossRef]


| Sample ID/Mix Proportions (kg/m3) | Portland Cement | Coarse Aggregates | Sand | Water | CWA |
|---|---|---|---|---|---|
| Control | 340 | 1120 | 820 | 181 | – |
| CWA | 6.8 |
| Sample ID | Slump (mm) | Air Content (%) | Fresh Density (kg/m3) | 28 Days Compressive Strength (MPa) |
|---|---|---|---|---|
| Control | 125 | 1.9 | 2345 | 31.8 |
| CWA | 110 | 1.8 | 2328 | 34.2 |
| Half-Cell Potential Reading (mV) [34] | Corrosion Activity | Corrosion Current Density (µA/cm2) [53] | Mean Corrosion Penetration Rate (µm/Year) | Corrosion Classification | Total Charge Passed (C) [35] | Macrocell Corrosion Status |
|---|---|---|---|---|---|---|
| Copper–Copper Sulfate Electrode (CSE) | ||||||
| >−200 | Greater than 90% probability of no corrosion | ≤0.1 | ≤1.2 | Very low or passive | ≤150 | Passive |
| −200 to −350 | An increasing probability of corrosion | 0.1–0.5 | 1.2–6 | Low to moderate | >150 | Active |
| <−350 | Greater than 90% probability of corrosion | 0.5–1 | 6–12 | Moderate to high | - | - |
| - | - | >1 | >12 | High | - | - |
| Sample ID | Air Content (%)ASTM C231 [6] | Density (kg/m3) | Average Compressive Strength (MPa)—21 Days (ASTM C39 [3]) |
|---|---|---|---|
| Control-AEA | 6.8 | 2241 | 33.4 |
| Control-NAEA | 2.1 | 2345 | 36.3 |
| CWA-AEA | 7 | 2079 | 35.6 |
| CWA-NAEA | 1.8 | 2284 | 36.8 |
| Sample ID | Calculated Average DF (%) | Range of Average DF (ASTM C666) | DF Status | RDME Status (Below 60%) |
|---|---|---|---|---|
| Control-NAEA | 62.4 | 50–70 | Traversable freeze–thaw resistance | Fail |
| CWA-NAEA | 86.9 | 80–90 | Freeze–thaw resistant | Pass |
| Control-AEA | 87.1 | 80–90 | Freeze–thaw resistant | Pass |
| CWA-AEA | 93.5 | 90–95 | Freeze–thaw resistant | Pass |
| Sample ID | Surface Crack Width (mm) | Real Initial Flow q0 (mL/h) | Sealing Ratio (%) | |||||
|---|---|---|---|---|---|---|---|---|
| Top | Bottom | Average | ||||||
| Control | I | 0.317 | 0.263 | 0.290 | 0.359 | 4.834 | 92% | 91.9 |
| II | 0.486 | 0.469 | 0.477 | 8.325 | 86% | 85.9 | ||
| III | 0.328 | 0.293 | 0.311 | 7.793 | 92% | 92.3 | ||
| CWA | I | 0.467 | 0.275 | 0.371 | 0.355 | 10.045 | 100% | 100 |
| II | 0.400 | 0.344 | 0.372 | 6.822 | 100% | 100 | ||
| III | 0.331 | 0.313 | 0.322 | 8.799 | 99% | 98.9 | ||
Publisher’s Note: MDPI stays neutral with regard to jurisdictional claims in published maps and institutional affiliations. |
© 2021 by the authors. Licensee MDPI, Basel, Switzerland. This article is an open access article distributed under the terms and conditions of the Creative Commons Attribution (CC BY) license (https://creativecommons.org/licenses/by/4.0/).
Share and Cite
Azarsa, P.; Gupta, R.; Azarsa, P.; Biparva, A. Durability and Self-Sealing Examination of Concretes Modified with Crystalline Waterproofing Admixtures. Materials 2021, 14, 6508. https://doi.org/10.3390/ma14216508
Azarsa P, Gupta R, Azarsa P, Biparva A. Durability and Self-Sealing Examination of Concretes Modified with Crystalline Waterproofing Admixtures. Materials. 2021; 14(21):6508. https://doi.org/10.3390/ma14216508
Chicago/Turabian StyleAzarsa, Pejman, Rishi Gupta, Peiman Azarsa, and Alireza Biparva. 2021. "Durability and Self-Sealing Examination of Concretes Modified with Crystalline Waterproofing Admixtures" Materials 14, no. 21: 6508. https://doi.org/10.3390/ma14216508
APA StyleAzarsa, P., Gupta, R., Azarsa, P., & Biparva, A. (2021). Durability and Self-Sealing Examination of Concretes Modified with Crystalline Waterproofing Admixtures. Materials, 14(21), 6508. https://doi.org/10.3390/ma14216508