
1D-Zigzag Eu3+/Tb3+ Coordination Chains as Luminescent Ratiometric Thermometers Endowed with Multicolor Emission

 ,
,  , ,
, , 
 ,
, 
Abstract
:
1. Introduction
2. Materials and Methods
2.1. Synthesis of [Eu(hfac)3(bipy)]n (1)
2.2. Synthesis of [Tb(hfac)3(bipy)]n (2)
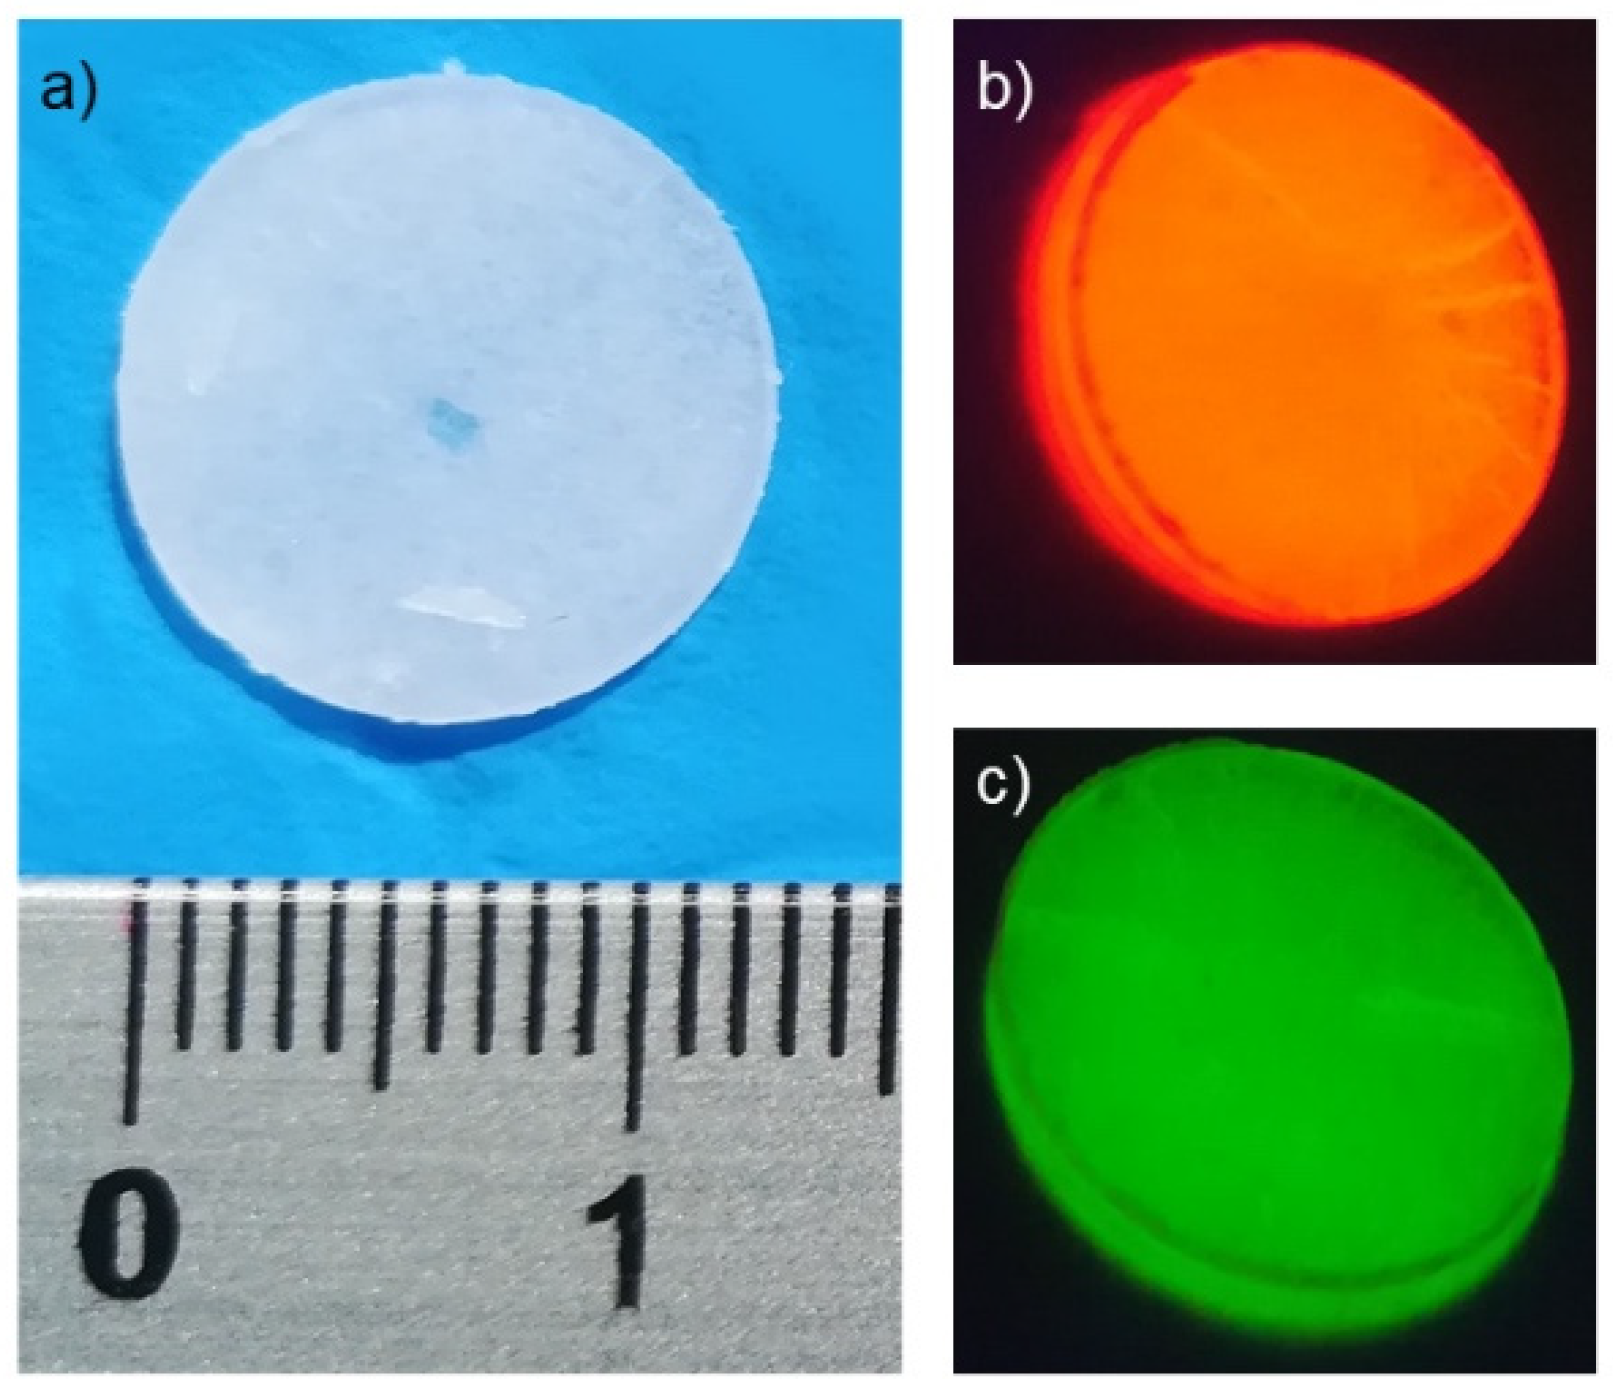
2.3. Preparation of KBr Pellets Containing [Ln(hfac)3(bipy)]n (Ln3+ = Eu3+, Tb3+) CPs
3. Results and Discussion
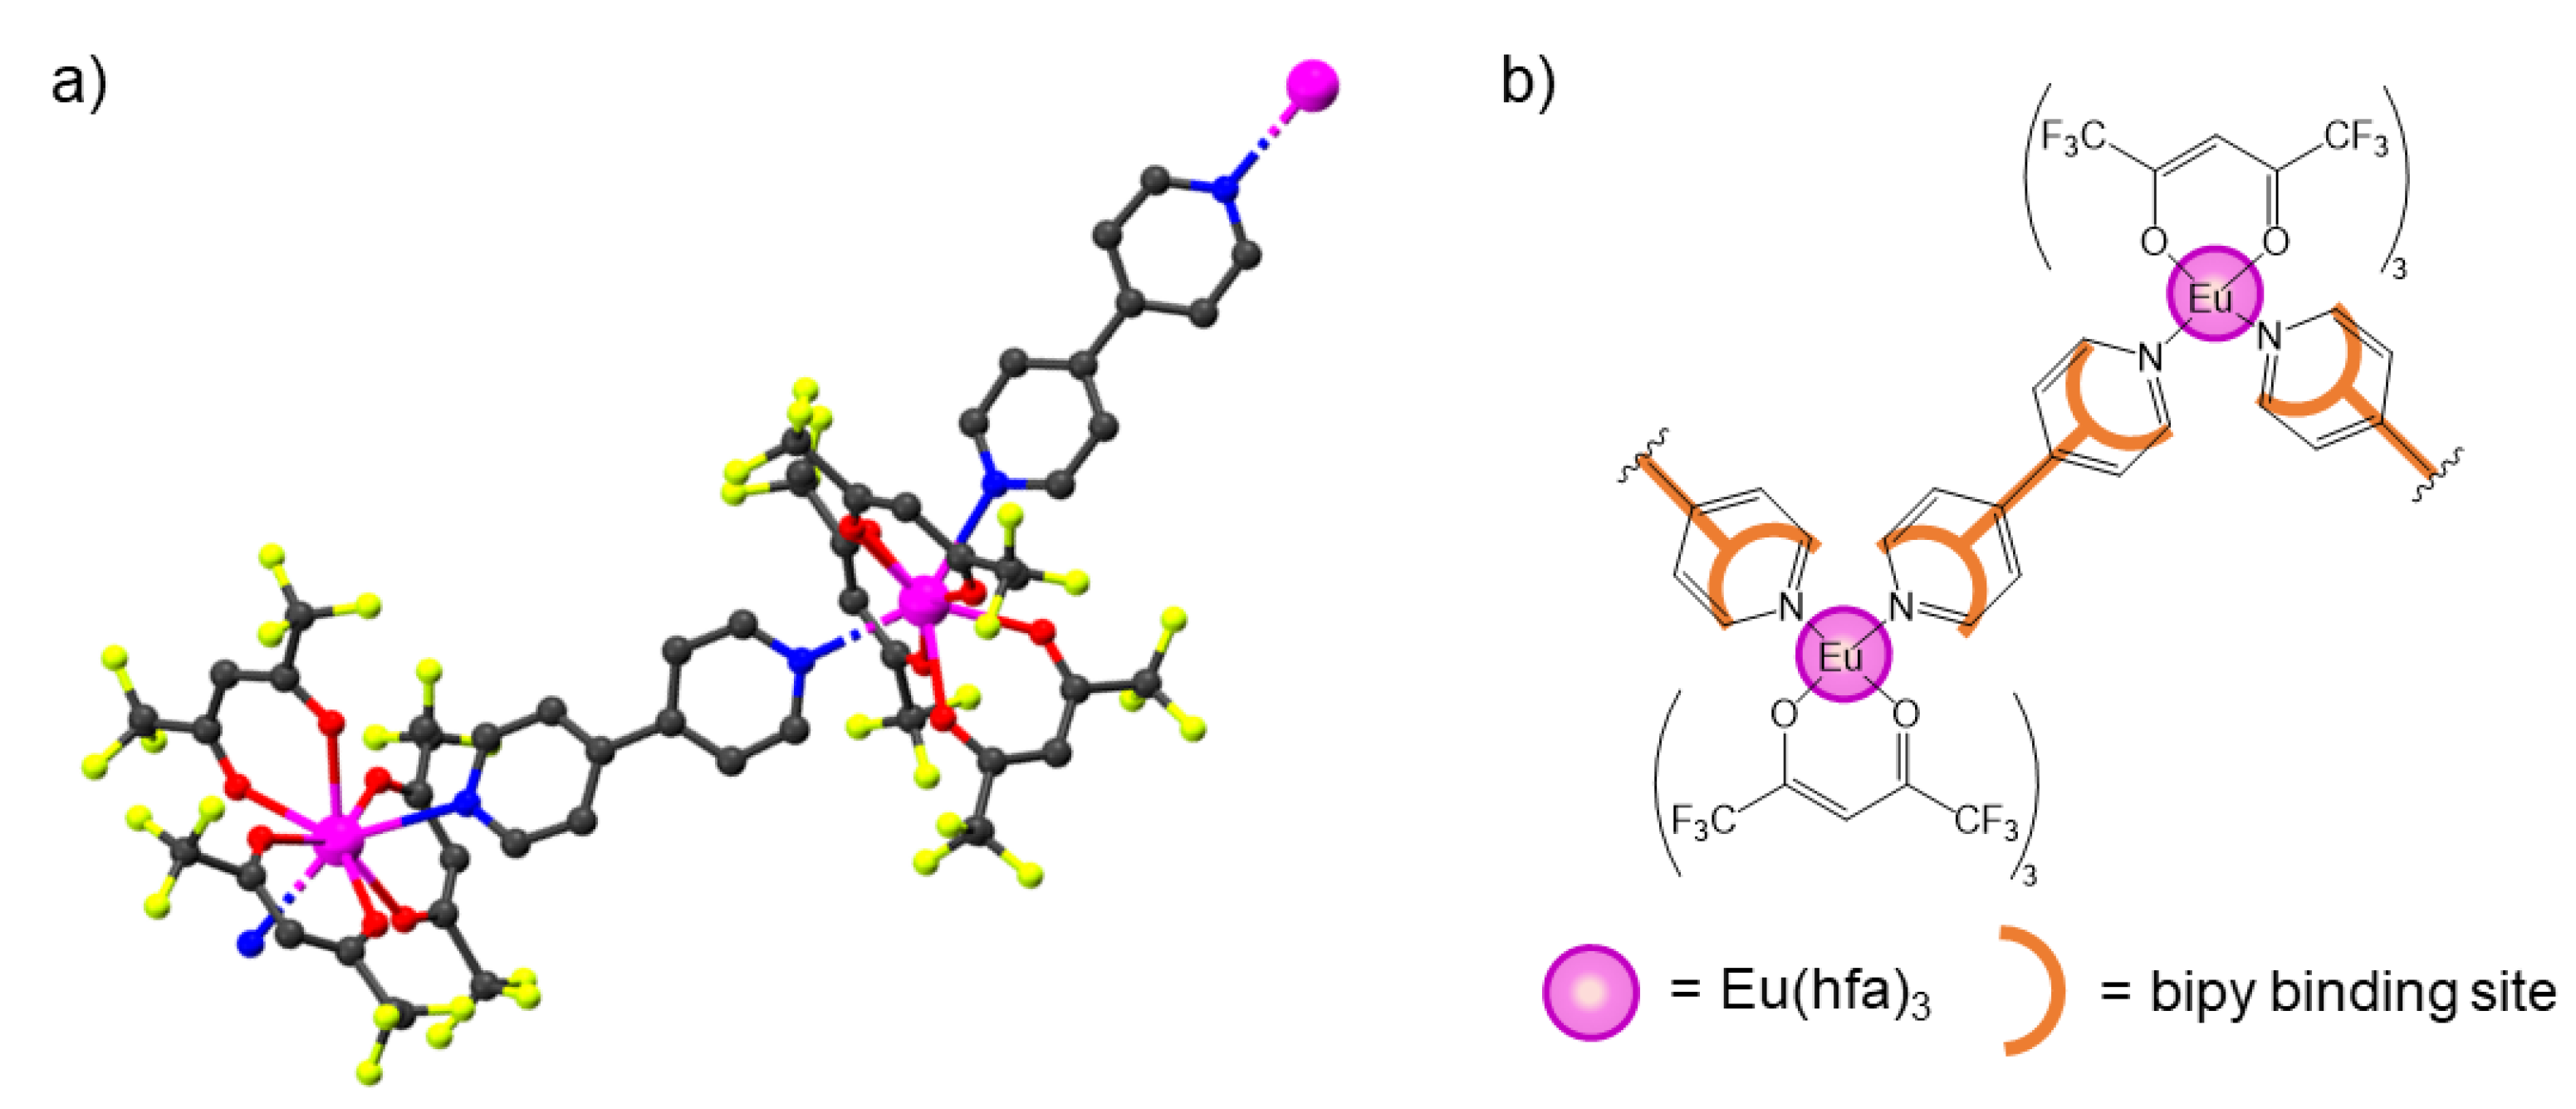
3.1. Synthesis and Characterization
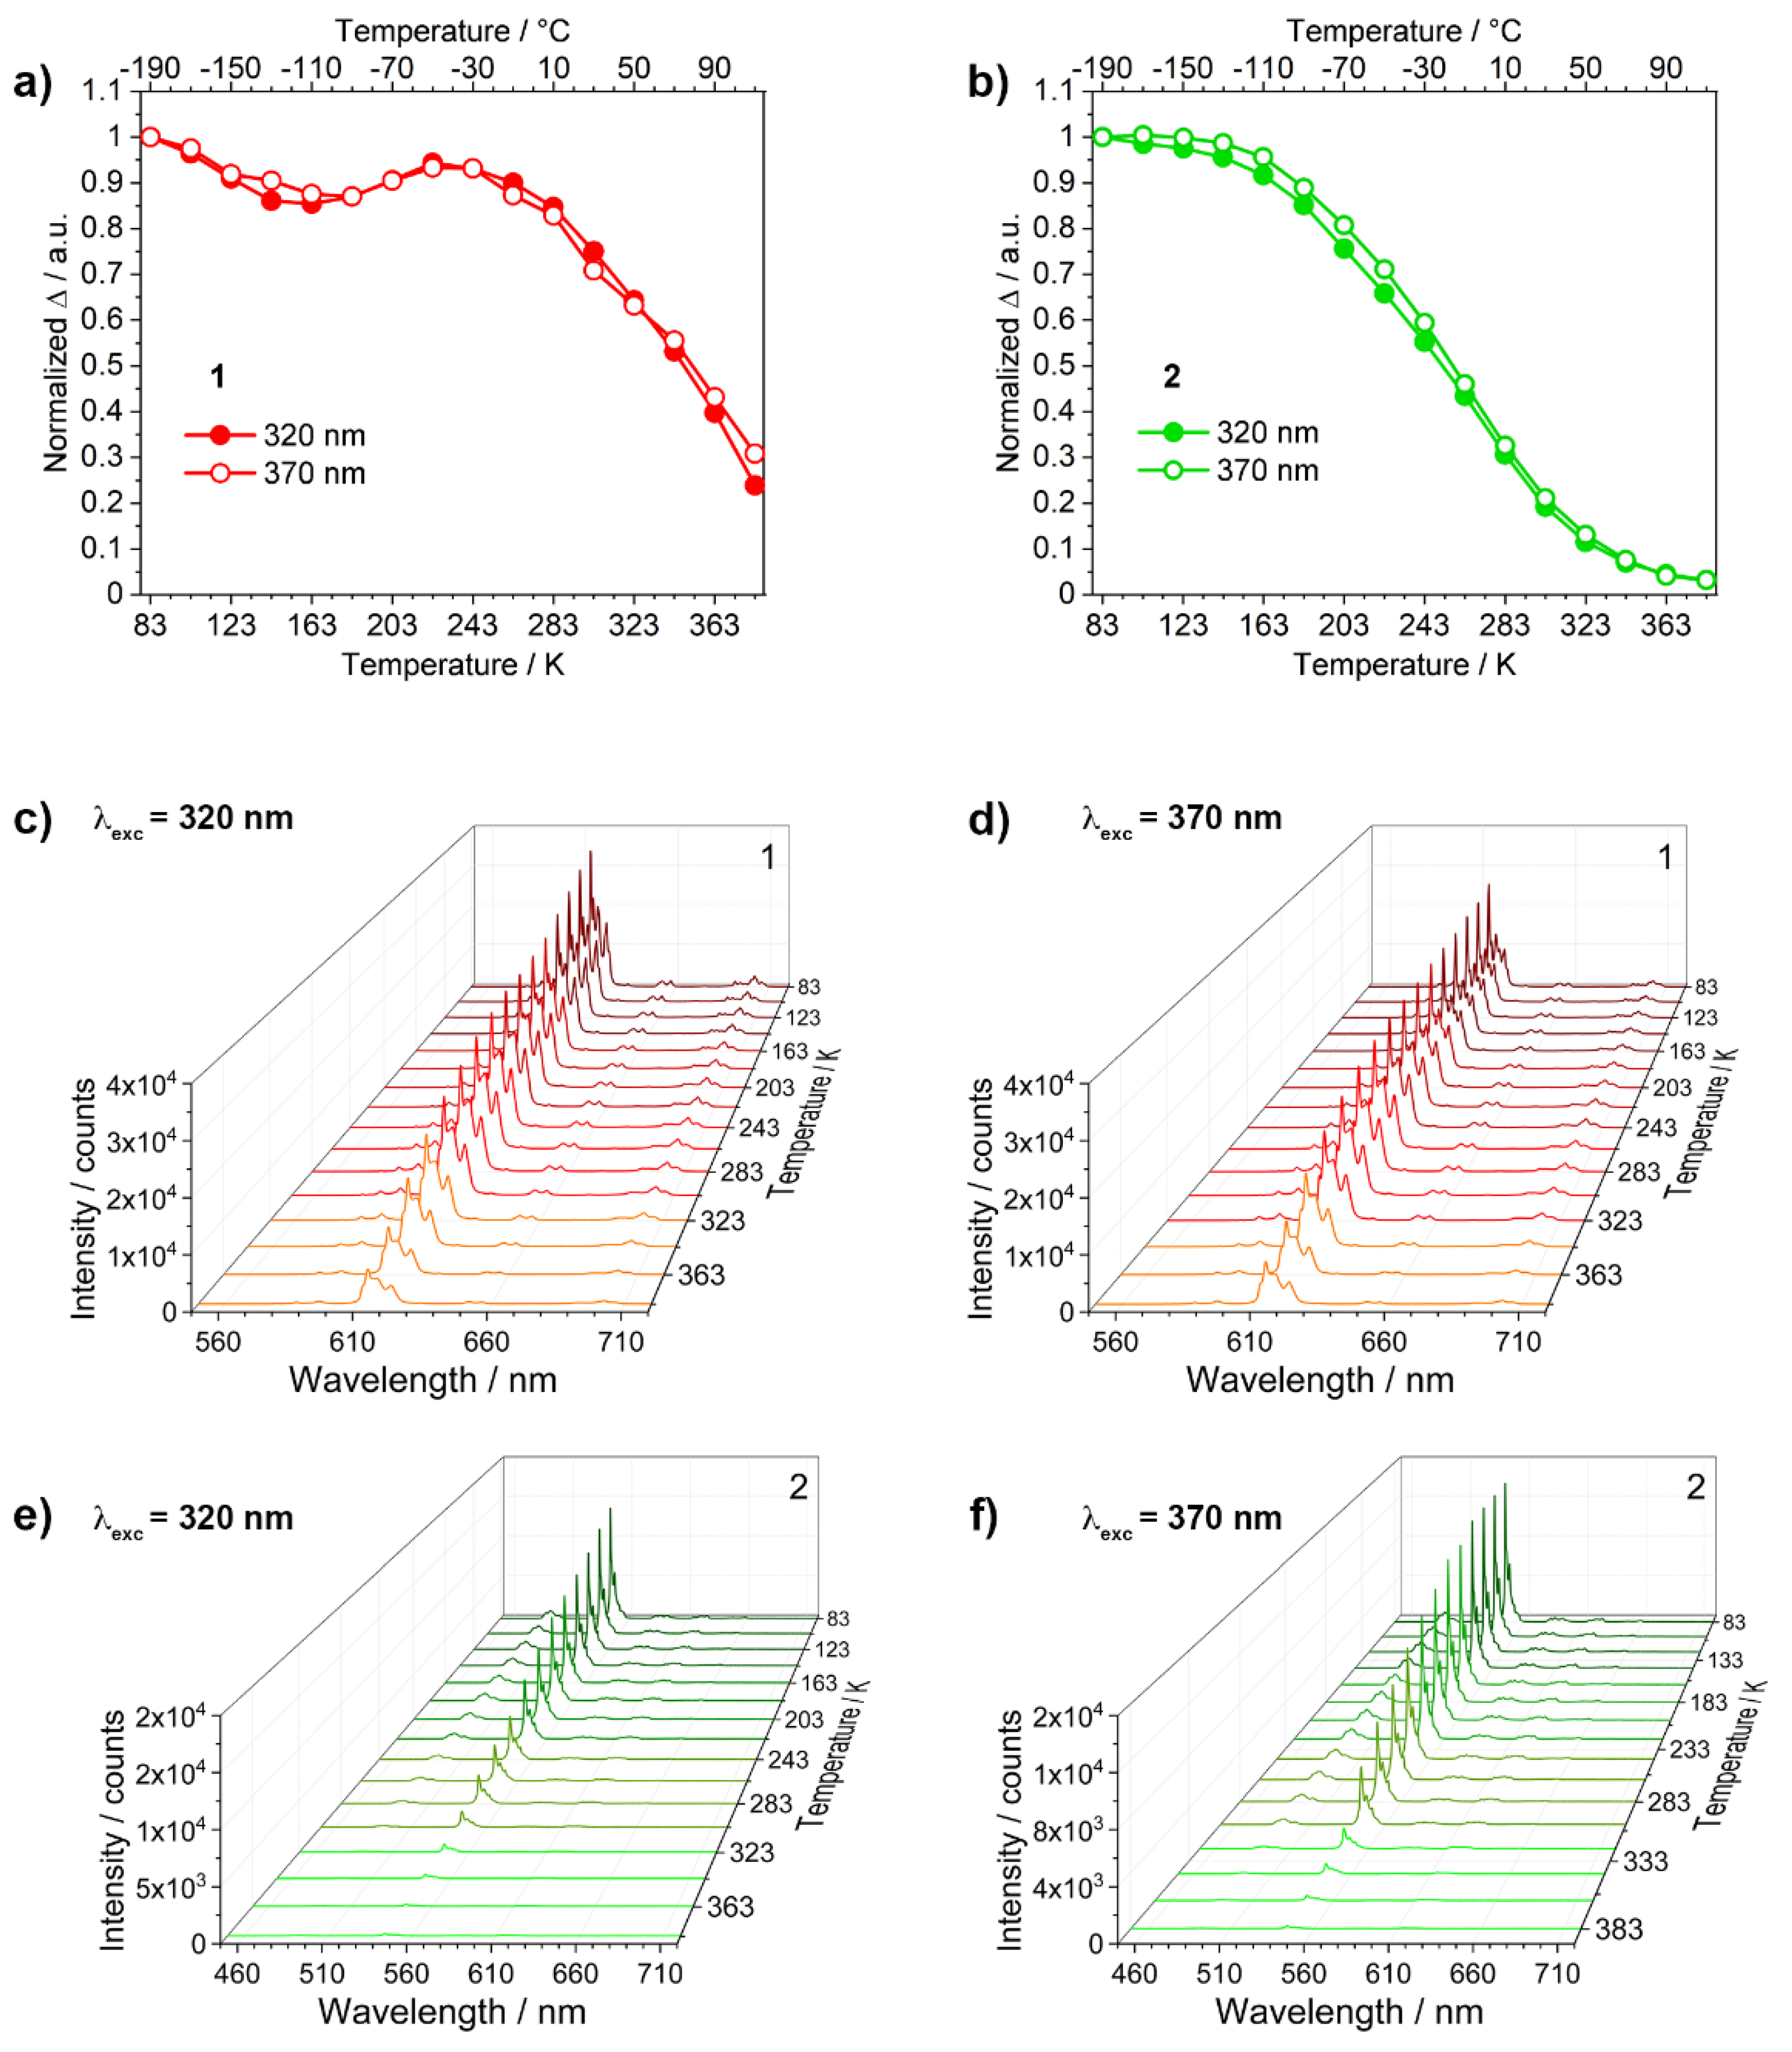
3.2. Photoluminescence and Thermometric Studies
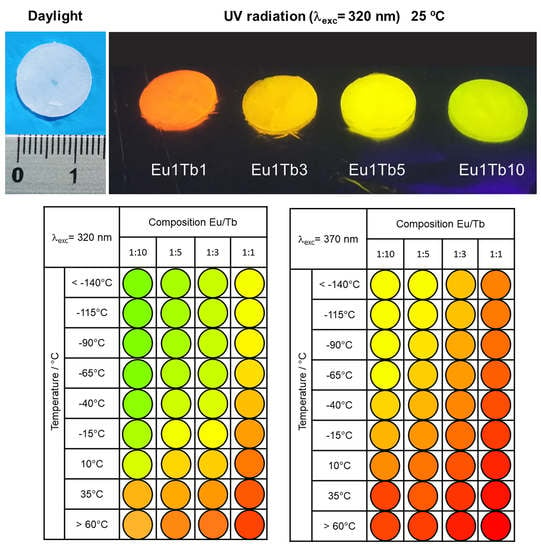
3.3. Development of Eu3+-Tb3+ Ratiometric Thermometers
4. Conclusions
Supplementary Materials
Author Contributions
Funding
Institutional Review Board Statement
Informed Consent Statement
Data Availability Statement
Conflicts of Interest
References
- Uchiyama, S.; Gota, C.; Tsuji, T.; Inada, N. Intracellular temperature measurements with fluorescent polymeric thermometers. Chem. Commun. 2017, 53, 10976–10992. [Google Scholar] [CrossRef]
- Brites, C.D.S.; Millán, A.; Carlos, L.D. Lanthanides in Luminescent Thermometry. In Handbook on the Physics and Chemistry of Rare Earths; Elsevier B.V.: Amsterdam, The Netherlands, 2016; Volume 49, pp. 339–427. [Google Scholar]
- Brites, C.D.S.; Balabhadra, S.; Carlos, L.D. Lanthanide-Based Thermometers: At the Cutting-Edge of Luminescence Thermometry. Adv. Opt. Mater. 2019, 7, 1801239. [Google Scholar] [CrossRef] [Green Version]
- Liu, T.; Campbell, B.T.; Burns, S.P.; Sullivan, J.P. Temperature- and Pressure-Sensitive Luminescent Paints in Aerodynamics. Appl. Mech. Rev. 2009, 50, 227–246. [Google Scholar] [CrossRef]
- Liu, T. Pressure- and Temperature-Sensitive Paints. In Encyclopedia of Aerospace Engineering; John Wiley & Sons, Ltd.: Hoboken, NJ, USA, 2011. [Google Scholar]
- Carlos, L.D.; Palacio, F.; Quintanilla, M.; Benayas, A.; Naccache, R.; Vetrone, F.; Carlos, L.D.; Palacio, F. Thermometry at the Nanoscale: Techniques and Selected Applications; The Royal Society of Chemistry: London, UK, 2016. [Google Scholar]
- Dramićanin, M. Luminescence Thermometry; Elsevier: Amsterdam, The Netherlands, 2018. [Google Scholar]
- Brites, C.D.S.; Lima, P.P.; Silva, N.J.O.; Millán, A.; Amaral, V.S.; Palacio, F.; Carlos, L.D. Thermometry at the nanoscale. Nanoscale 2012, 4, 4799–4829. [Google Scholar] [CrossRef] [PubMed] [Green Version]
- Brites, C.D.S.; Lima, P.P.; Carlos, L.D. Tuning the sensitivity of Ln3+-based luminescent molecular thermometers through ligand design. J. Lumin. 2016, 169, 497–502. [Google Scholar] [CrossRef]
- Ross, D.; Gaitan, M.; Locascio, L.E. Temperature Measurement in Microfluidic Systems Using a Temperature-Dependent Fluorescent Dye. Anal. Chem. 2001, 73, 4117–4123. [Google Scholar] [CrossRef]
- Rocha, J.; Brites, C.D.S.; Carlos, L.D. Lanthanide Organic Framework Luminescent Thermometers. Chem. Eur. J. 2016, 22, 14782–14795. [Google Scholar] [CrossRef]
- Peng, H.; Stich, M.I.J.; Yu, J.; Sun, L.; Fischer, L.H.; Wolfbeis, O.S. Luminescent Europium(III) Nanoparticles for Sensing and Imaging of Temperature in the Physiological Range. Adv. Mater. 2010, 22, 716–719. [Google Scholar] [CrossRef] [PubMed]
- Brites, C.D.S.; Lima, P.P.; Silva, N.J.O.; Millán, A.; Amaral, V.S.; Palacio, F.; Carlos, L.D. A luminescent molecular thermometer for long-term absolute temperature measurements at the nanoscale. Adv. Mater. 2010, 22, 4499–4504. [Google Scholar] [CrossRef] [Green Version]
- Cadiau, A.; Brites, C.D.S.; Costa, P.M.F.J.; Ferreira, R.A.S.; Rocha, J.; Carlos, L.D. Ratiometric Nanothermometer Based on an Emissive Ln3+-Organic Framework. ACS Nano 2013, 7, 7213–7218. [Google Scholar] [CrossRef]
- Wang, Z.; Ananias, D.; Carné-Sánchez, A.; Brites, C.D.S.; Imaz, I.; Maspoch, D.; Rocha, J.; Carlos, L.D. Lanthanide-Organic Framework Nanothermometers Prepared by Spray-Drying. Adv. Funct. Mater. 2015, 25, 2824–2830. [Google Scholar] [CrossRef]
- Brites, C.D.S.; Lima, P.P.; Silva, N.J.O.; Millán, A.; Amaral, V.S.; Palacio, F.; Carlos, L.D. Lanthanide-based luminescent molecular thermometers. New J. Chem. 2011, 35, 1177. [Google Scholar] [CrossRef] [Green Version]
- Cui, Y.; Zhu, F.; Chen, B.; Qian, G. Metal–organic frameworks for luminescence thermometry. Chem. Commun. 2015, 51, 7420–7431. [Google Scholar] [CrossRef]
- De Bellis, J.; Bellucci, L.; Bottaro, G.; Labella, L.; Marchetti, F.; Samaritani, S.; Belli Dell’Amico, D.; Armelao, L. Single-crystal-to-single-crystal post-synthetic modifications of three-dimensional LOFs (Ln = Gd, Eu): A way to modulate their luminescence and thermometric properties. Dalt. Trans. 2020, 49, 6030–6042. [Google Scholar] [CrossRef]
- Osborn Popp, T.M.; Yaghi, O.M. Sequence-Dependent Materials. Acc. Chem. Res. 2017, 50, 532–534. [Google Scholar] [CrossRef]
- Bellucci, L.; Bottaro, G.; Labella, L.; Marchetti, F.; Samaritani, S.; Belli Dell’Amico, D.; Armelao, L. Luminescent sequence-dependent materials through a step by step assembly of RE1-1,4-benzendicarboxylate-RE2 (REx = Y3+, Eu3+ and Tb3+) architectures on a silica surface. J. Mater. Chem. C 2019, 7, 4415–4423. [Google Scholar] [CrossRef]
- Zhou, H.C.J.; Kitagawa, S. Metal-Organic Frameworks (MOFs). Chem. Soc. Rev. 2014, 43, 5415–5418. [Google Scholar] [CrossRef] [Green Version]
- Farrusseng, D. Metal-Organic Frameworks: Applications from Catalysis to Gas Storage; Wiley: Hoboken, NJ, USA, 2011. [Google Scholar]
- Rao, X.; Song, T.; Gao, J.; Cui, Y.; Yang, Y.; Wu, C.; Chen, B.; Qian, G. A Highly Sensitive Mixed Lanthanide Metal–Organic Framework Self-Calibrated Luminescent Thermometer. J. Am. Chem. Soc. 2013, 135, 15559–15564. [Google Scholar] [CrossRef]
- Ramalho, J.F.C.B.; Correia, S.F.H.; Fu, L.; António, L.L.F.; Brites, C.D.S.; André, P.S.; Ferreira, R.A.S.; Carlos, L.D. Luminescence Thermometry on the Route of the Mobile-Based Internet of Things (IoT): How Smart QR Codes Make It Real. Adv. Sci. 2019, 6, 1900950. [Google Scholar] [CrossRef] [PubMed] [Green Version]
- Liu, X.; Akerboom, S.; De Jong, M.; Mutikainen, I.; Tanase, S.; Meijerink, A.; Bouwman, E. Mixed-Lanthanoid Metal-Organic Framework for Ratiometric Cryogenic Temperature Sensing. Inorg. Chem. 2015, 54, 11323–11329. [Google Scholar] [CrossRef] [PubMed]
- Cui, Y.; Zou, W.; Song, R.; Yu, J.; Zhang, W.; Yang, Y.; Qian, G. A ratiometric and colorimetric luminescent thermometer over a wide temperature range based on a lanthanide coordination polymer. Chem. Commun. 2014, 50, 719–721. [Google Scholar] [CrossRef]
- Miyata, K.; Konno, Y.; Nakanishi, T.; Kobayashi, A.; Kato, M.; Fushimi, K.; Hasegawa, Y. Chameleon luminophore for sensing temperatures: Control of metal-to-metal and energy back transfer in lanthanide coordination polymers. Angew. Chemie Int. Ed. 2013, 52, 6413–6416. [Google Scholar] [CrossRef] [PubMed]
- Hatanaka, M.; Hirai, Y.; Kitagawa, Y.; Nakanishi, T.; Hasegawa, Y.; Morokuma, K. Organic linkers control the thermosensitivity of the emission intensities from Tb(III) and Eu(III) in a chameleon polymer. Chem. Sci. 2016, 8, 423–429. [Google Scholar] [CrossRef] [Green Version]
- Bellucci, L.; Bottaro, G.; Labella, L.; Causin, V.; Marchetti, F.; Samaritani, S.; Belli Dell’Amico, D.; Armelao, L. Composition—Thermometric properties correlations in homodinuclear Eu3+ luminescent complexes. Inorg. Chem. 2020, 59, 18156–18167. [Google Scholar] [CrossRef]
- Swavey, S.; Krause, J.A.; Collins, D.; D’Cunha, D.; Fratini, A. X-ray structure and temperature dependent luminescent properties of two bimetallic europium complexes. Polyhedron 2008, 27, 1061–1069. [Google Scholar] [CrossRef]
- Sato, S.; Wada, M. Relations between Intramolecular Energy Transfer Efficiencies and Triplet State Energies in Rare Earth β-diketone Chelates. Bull. Chem. Soc. Jpn. 1970, 43, 1955–1962. [Google Scholar] [CrossRef] [Green Version]
- Carlotto, A.; Babetto, L.; Carlotto, S.; Miozzi, M.; Seraglia, R.; Casarin, M.; Bottaro, G.; Rancan, M.; Armelao, L. Luminescent Thermometers: From a Library of Europium(III) β-Diketonates to a General Model for Predicting the Thermometric Behaviour of Europium-Based Coordination Systems. ChemPhotoChem 2020, 4, 644. [Google Scholar] [CrossRef]
- Armelao, L.; Belli Dell’Amico, D.; Bellucci, L.; Bottaro, G.; Labella, L.; Marchetti, F.; Samaritani, S. A convenient synthesis of highly luminescent lanthanide 1D-zigzag coordination chains based only on 4,4′-bipyridine as connector. Polyhedron 2016, 119, 371–376. [Google Scholar] [CrossRef]
- Bellucci, L.; Labella, L.; Marchetti, F.; Pineider, F.; Poneti, G.; Samaritani, S. Magnetic relaxation in dysprosium and terbium 1D-zigzag coordination chains having only 4,4′-bipyridine as connector. Inorg. Chim. Acta 2021, 516, 120165. [Google Scholar] [CrossRef]
- Biradha, K.; Sarkar, M.; Rajput, L. Crystal engineering of coordination polymers using 4,4′-bipyridine as a bond between transition metal atoms. Chem. Commun. 2006, 4169–4179. [Google Scholar] [CrossRef]
- Quici, S.; Scalera, C.; Cavazzini, M.; Accorsi, G.; Bolognesi, M.; Armelao, L.; Bottaro, G. Highly photoluminescent silica layers doped with efficient Eu(III) and Tb(III) antenna complexes. Chem. Mater. 2009, 21, 2941–2949. [Google Scholar] [CrossRef]
- Eliseeva, S.V.; Pleshkov, D.N.; Lyssenko, K.A.; Lepnev, L.S.; Bünzli, J.C.G.; Kuzmina, N.P. Highly luminescent and triboluminescent coordination polymers assembled from lanthanide β-diketonates and aromatic bidentate O-donor ligands. Inorg. Chem. 2010, 49, 9300–9311. [Google Scholar] [CrossRef] [PubMed]
- Binnemans, K. Interpretation of europium(III) spectra. Coord. Chem. Rev. 2015, 295, 1–45. [Google Scholar] [CrossRef] [Green Version]
- Gónzalez-Fabra, J.; Bandeira, N.A.G.; Velasco, V.; Barrios, L.A.; Aguilà, D.; Teat, S.J.; Roubeau, O.; Bo, C.; Aromí, G. Thermodynamic Stability of Heterodimetallic [LnLn′] Complexes: Synthesis and DFT Studies. Chem. Eur. J. 2017, 23, 5117–5125. [Google Scholar] [CrossRef] [Green Version]
- André, N.; Jensen, T.B.; Scopelliti, R.; Imbert, D.; Elhabiri, M.; Hopfgartner, G.; Piguet, C.; Bünzli, J.C.G. Supramolecular Recognition of Heteropairs of Lanthanide Ions: A Step toward Self-Assembled Bifunctional Probes. Inorg. Chem. 2004, 43, 515–529. [Google Scholar] [CrossRef] [PubMed]
- Armelao, L.; Belli Dell’Amico, D.; Bellucci, L.; Bottaro, G.; Ciattini, S.; Labella, L.; Manfroni, G.; Marchetti, F.; Mattei, C.A.; Samaritani, S. Homodinuclear Lanthanide Complexes with the Divergent Heterotopic 4,4′-Bipyridine N-Oxide (bipyMO) Ligand. Eur. J. Inorg. Chem. 2018, 2018, 4421–4428. [Google Scholar] [CrossRef]
- Seward, C.; Wang, S. Dimeric and polymeric [Eu(tta)3L] complexes (tta = thenoyltrifluoroacetonato, L = 4,4′-bipyridine, trans-1,2-bis(4-pyridyl)ethylene, 4,4′-bipyridine-N,N′-dioxide). Can. J. Chem. 2001, 79, 1187–1193. [Google Scholar] [CrossRef]
- Lima, P.P.; Paz, F.A.A.; Brites, C.D.S.; Quirino, W.G.; Legnani, C.; Costa E Silva, M.; Ferreira, R.A.S.; Júnior, S.A.; Malta, O.L.; Cremona, M.; et al. White OLED based on a temperature sensitive Eu3+/Tb3+ β-diketonate complex. Org. Electron. 2014, 15, 798–808. [Google Scholar] [CrossRef]
- Bünzli, J.-C.G. On the design of highly luminescent lanthanide complexes. Coord. Chem. Rev. 2015, 293, 19–47. [Google Scholar] [CrossRef]
- Armelao, L.; Belli Dell’Amico, D.; Biagini, P.; Bottaro, G.; Chiaberge, S.; Falvo, P.; Labella, L.; Marchetti, F.; Samaritani, S. Preparation of N,N-Dialkylcarbamato Lanthanide Complexes by Extraction of Lanthanide Ions from Aqueous Solution into Hydrocarbons. Inorg. Chem. 2014, 53, 4861–4871. [Google Scholar] [CrossRef]
- Binnemans, K. Rare-Earth Beta-Diketonates. In Handbook on the Physics and Chemistry of Rare Earths; Elsevier B.V.: Amsterdam, The Netherlands, 2005; Volume 225, pp. 111–277. [Google Scholar]
- Miyata, K.; Ohba, T.; Kobayashi, A.; Kato, M.; Nakanishi, T.; Fushimi, K.; Hasegawa, Y. Thermostable Organo-phosphor: Low-Vibrational Coordination Polymers That Exhibit Different Intermolecular Interactions. Chempluschem 2012, 77, 277–280. [Google Scholar] [CrossRef]


| Sample | [Eu(hfac)3(bipy)] (mmol) | [Tb(hfac)3(bipy)]n (mmol) | KBr (mmol) |
|---|---|---|---|
| 1 | 1.49 mg (1.60 × 10⁻³) | // | 151.5 mg (1.27) |
| 2 | // | 1.30 mg (1.39 × 10⁻³) | 133.6 mg (1.12) |
| Eu1Tb1 | 1.05 mg (1.13 × 10⁻³) | 1.04 mg (1.12 × 10⁻³) | 209.6 mg (1.76) |
| Eu1:Tb3 | 0.55 mg (0.59 × 10⁻³) | 1.65 mg (1.77 × 10⁻³) | 222.8 mg (1.87) |
| Eu1:Tb5 | 0.59 mg (0.64 × 10⁻³) | 2.99 mg (3.20 × 10⁻³) | 362.1 mg (3.04) |
| Eu1:Tb10 | 0.28 mg (0.31 × 10⁻³) | 2.90 mg (3.10 × 10⁻³) | 325.3 mg (2.73) |
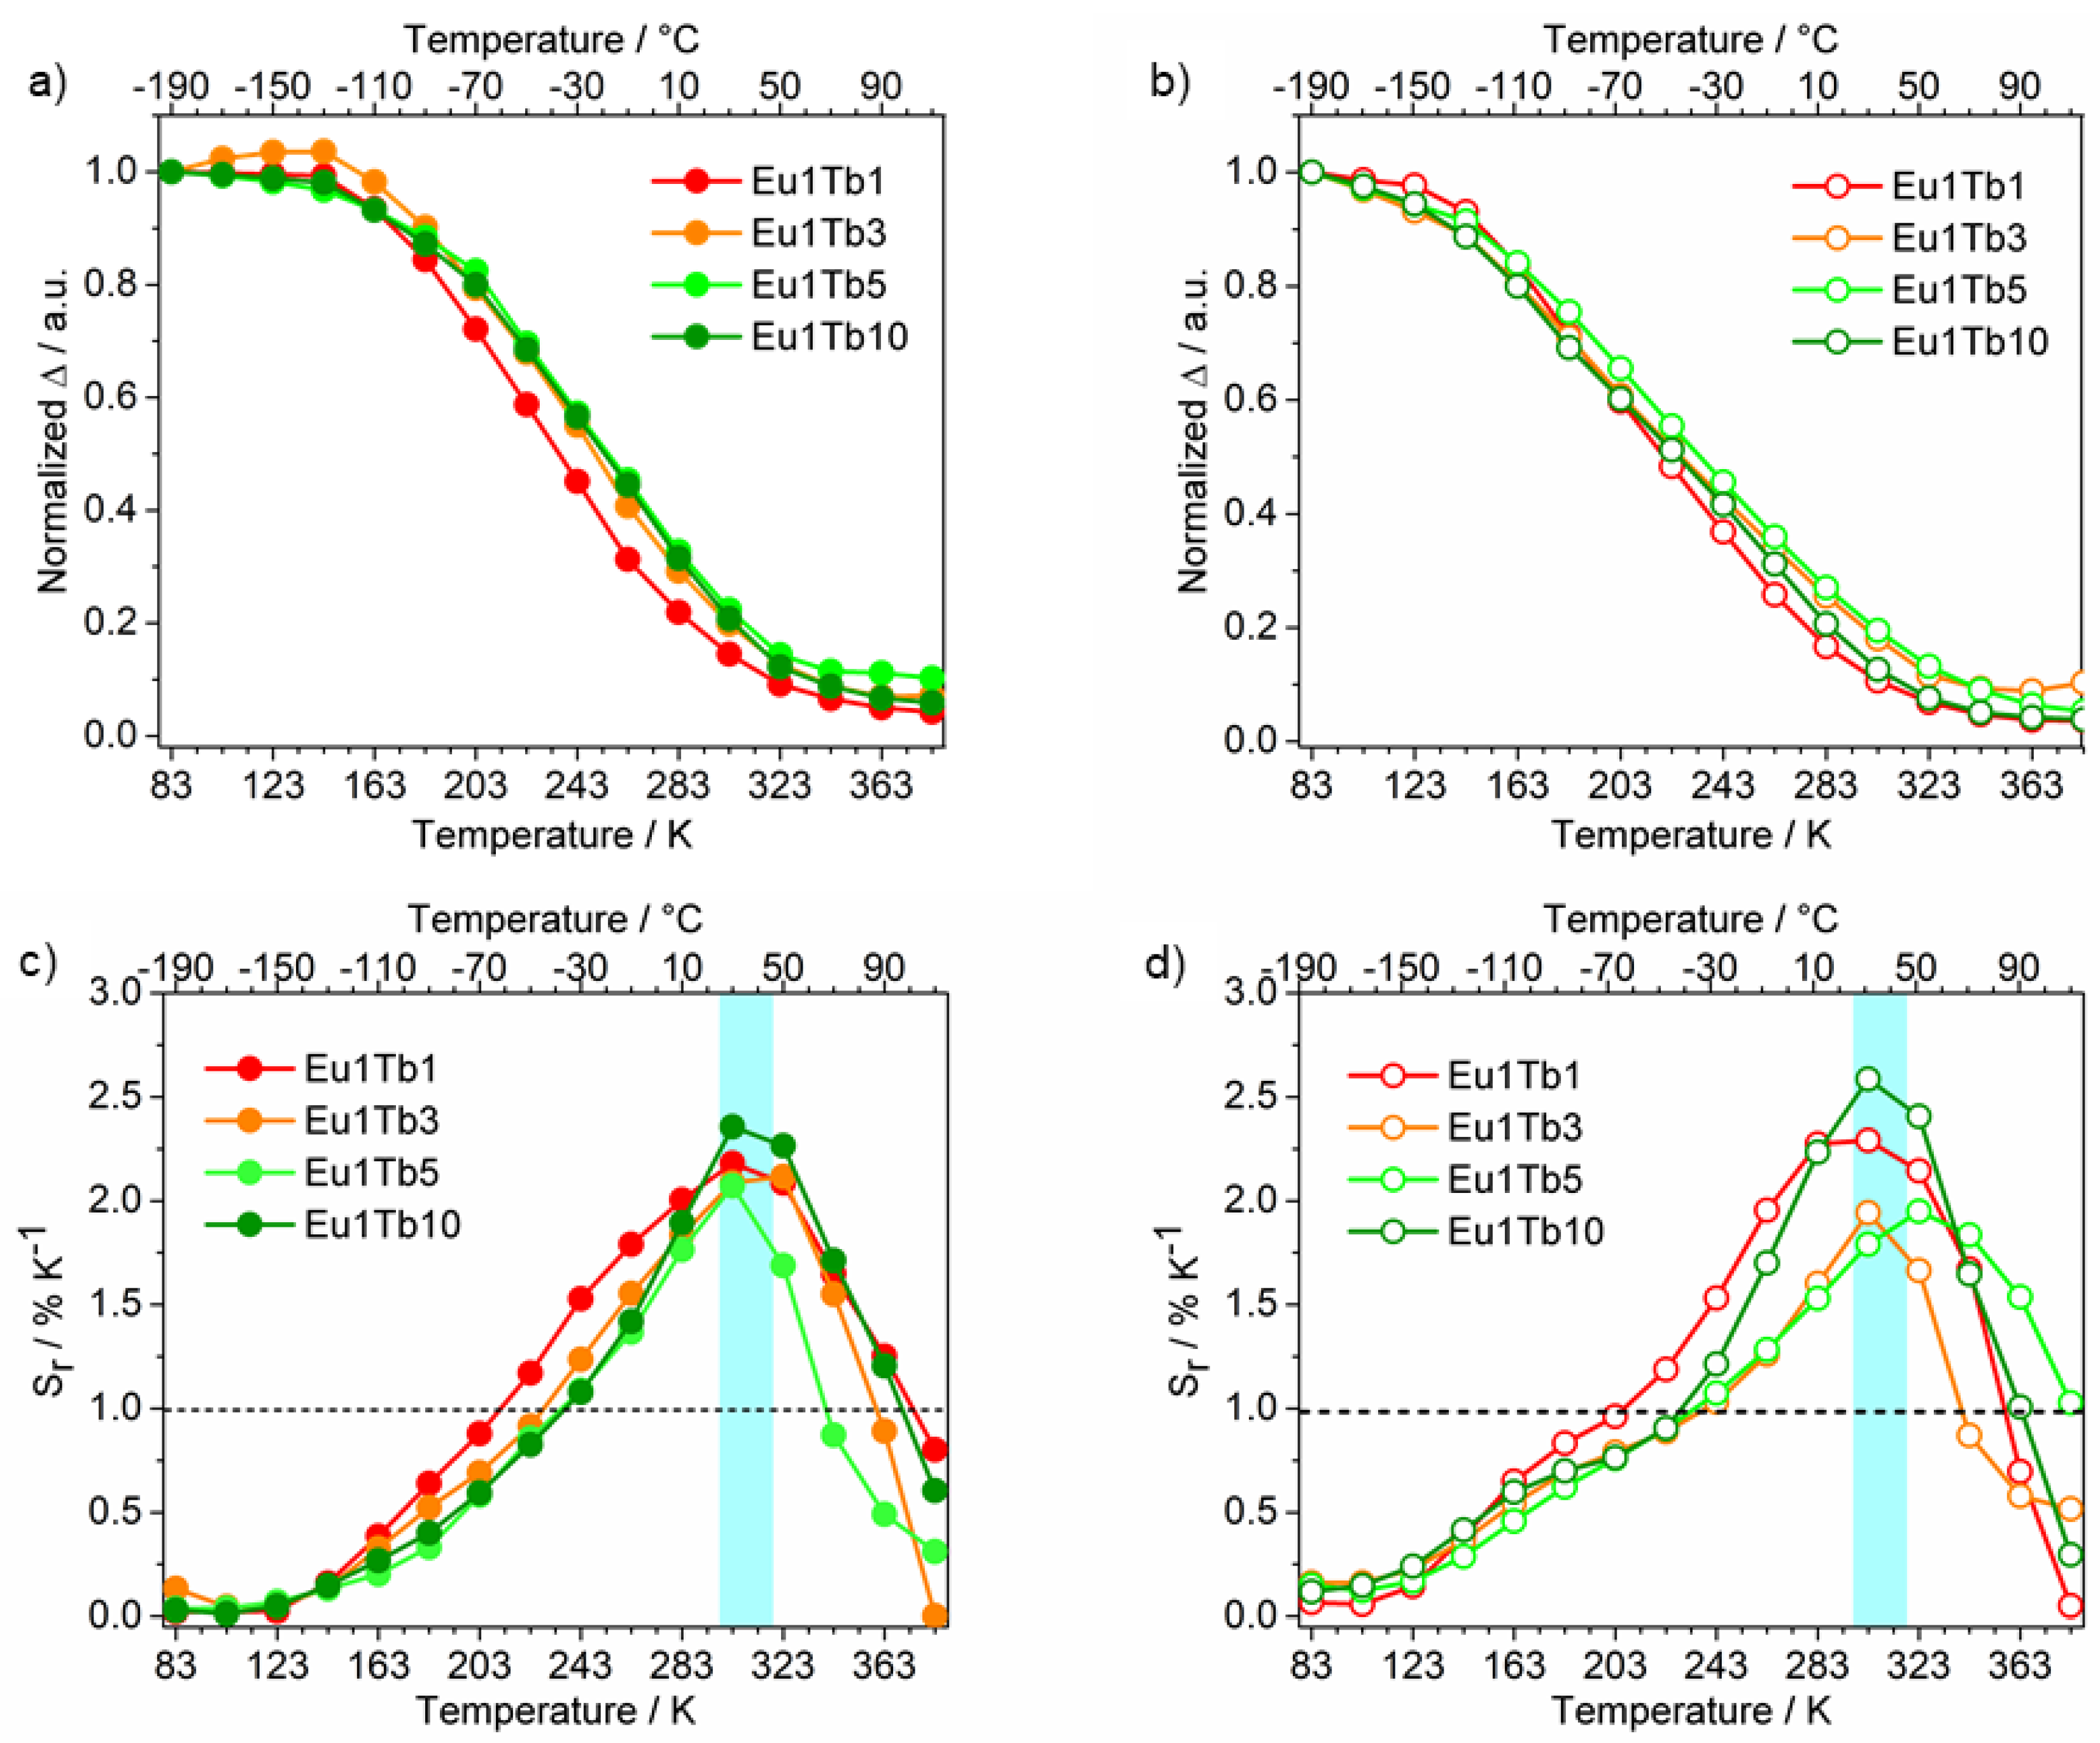
| λexc = 320 nm. | λexc = 370 nm. | |||
|---|---|---|---|---|
| Sample | Applicative Temperature Range | Srmax (T) | Applicative Temperature Range | Srmax (T) |
| Eu1Tb1 | 213–373 K | 2.20 (303 K) | 203–353 K | 2.30 (303 K) |
| Eu1Tb3 | 223–363 K | 2.10 (323 K) | 243–343 K | 1.95 (303 K) |
| Eu1Tb5 | 233–373 K | 2.10 (303 K) | 243–383 K | 1.95 (323 K) |
| Eu1Tb10 | 233–373 K | 2.40 (303 K) | 233–363 K | 2.60 (303 K) |
Publisher’s Note: MDPI stays neutral with regard to jurisdictional claims in published maps and institutional affiliations. |
© 2021 by the authors. Licensee MDPI, Basel, Switzerland. This article is an open access article distributed under the terms and conditions of the Creative Commons Attribution (CC BY) license (https://creativecommons.org/licenses/by/4.0/).
Share and Cite
Bellucci, L.; Bottaro, G.; Labella, L.; Marchetti, F.; Samaritani, S.; Belli Dell'Amico, D.; Armelao, L. 1D-Zigzag Eu3+/Tb3+ Coordination Chains as Luminescent Ratiometric Thermometers Endowed with Multicolor Emission. Materials 2021, 14, 6445. https://doi.org/10.3390/ma14216445
Bellucci L, Bottaro G, Labella L, Marchetti F, Samaritani S, Belli Dell'Amico D, Armelao L. 1D-Zigzag Eu3+/Tb3+ Coordination Chains as Luminescent Ratiometric Thermometers Endowed with Multicolor Emission. Materials. 2021; 14(21):6445. https://doi.org/10.3390/ma14216445
Chicago/Turabian StyleBellucci, Luca, Gregorio Bottaro, Luca Labella, Fabio Marchetti, Simona Samaritani, Daniela Belli Dell'Amico, and Lidia Armelao. 2021. "1D-Zigzag Eu3+/Tb3+ Coordination Chains as Luminescent Ratiometric Thermometers Endowed with Multicolor Emission" Materials 14, no. 21: 6445. https://doi.org/10.3390/ma14216445
APA StyleBellucci, L., Bottaro, G., Labella, L., Marchetti, F., Samaritani, S., Belli Dell'Amico, D., & Armelao, L. (2021). 1D-Zigzag Eu3+/Tb3+ Coordination Chains as Luminescent Ratiometric Thermometers Endowed with Multicolor Emission. Materials, 14(21), 6445. https://doi.org/10.3390/ma14216445