
Optimizing the Texturing Parameters of Concrete Pavement by Balancing Skid-Resistance Performance and Driving Stability


Abstract
:1. Introduction
2. Objectives and Scope of this Study
- (1)
- An evaluation method for the contact mechanics was established to describe the skid resistance and influence of the cement pavement on the driving stability, which should be verified based on engineering test results.
- (2)
- A set of small texturing equipment that can help prepare specimens with different texture parameters in the laboratory was developed. Pressure-sensitive films were used to obtain the contact stress distribution between the tire and different pavements. Texture parameters that can provide a balance between driving stability and skid resistance performance are recommended by conducting orthogonal and kneading tests.
3. Methodology
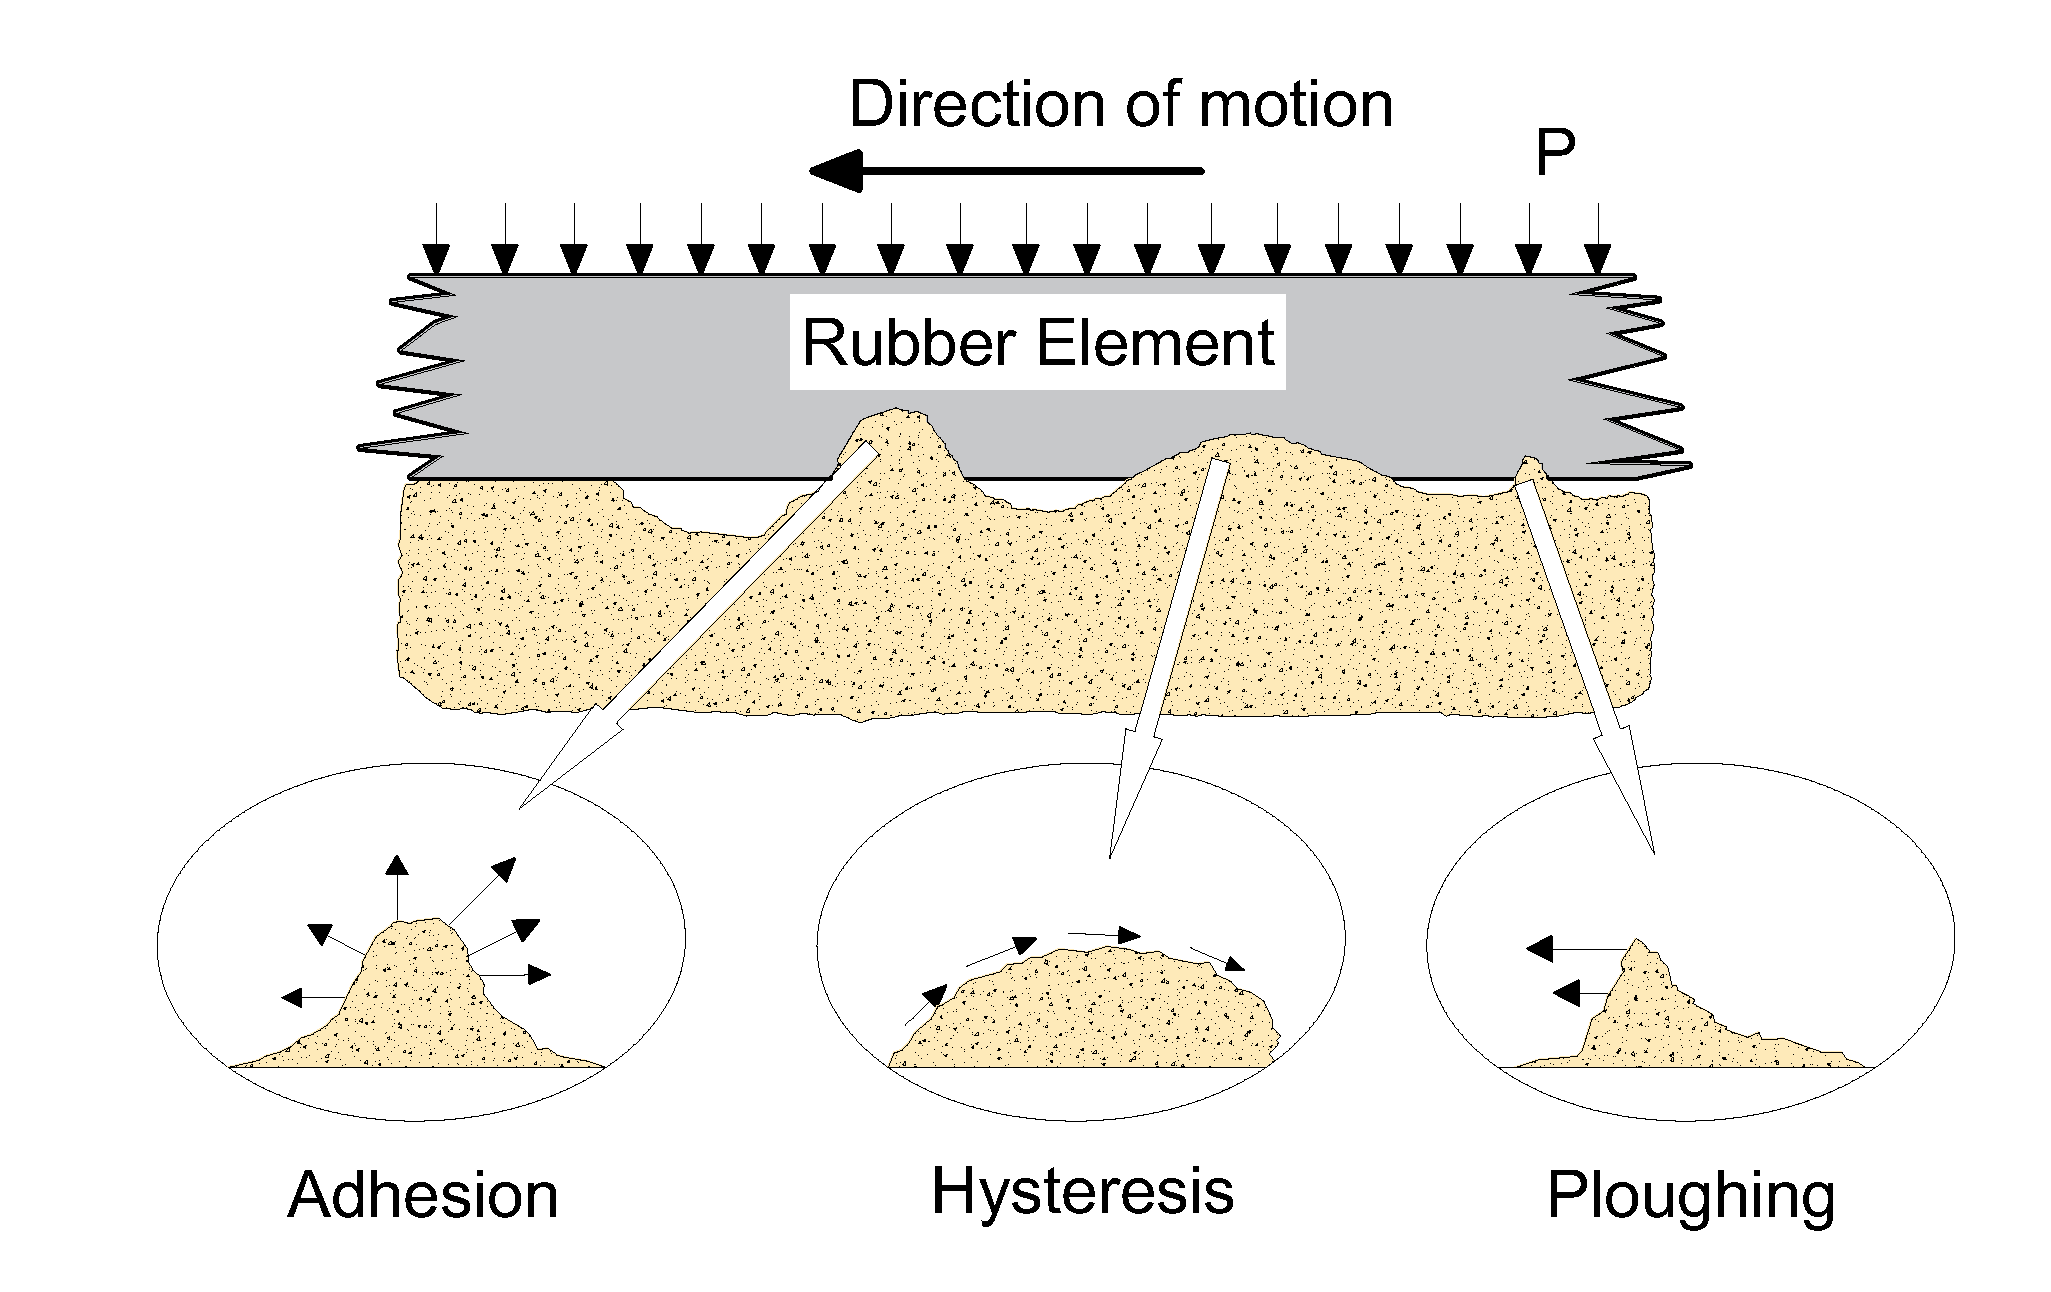
3.1. Tire–Pavement Friction
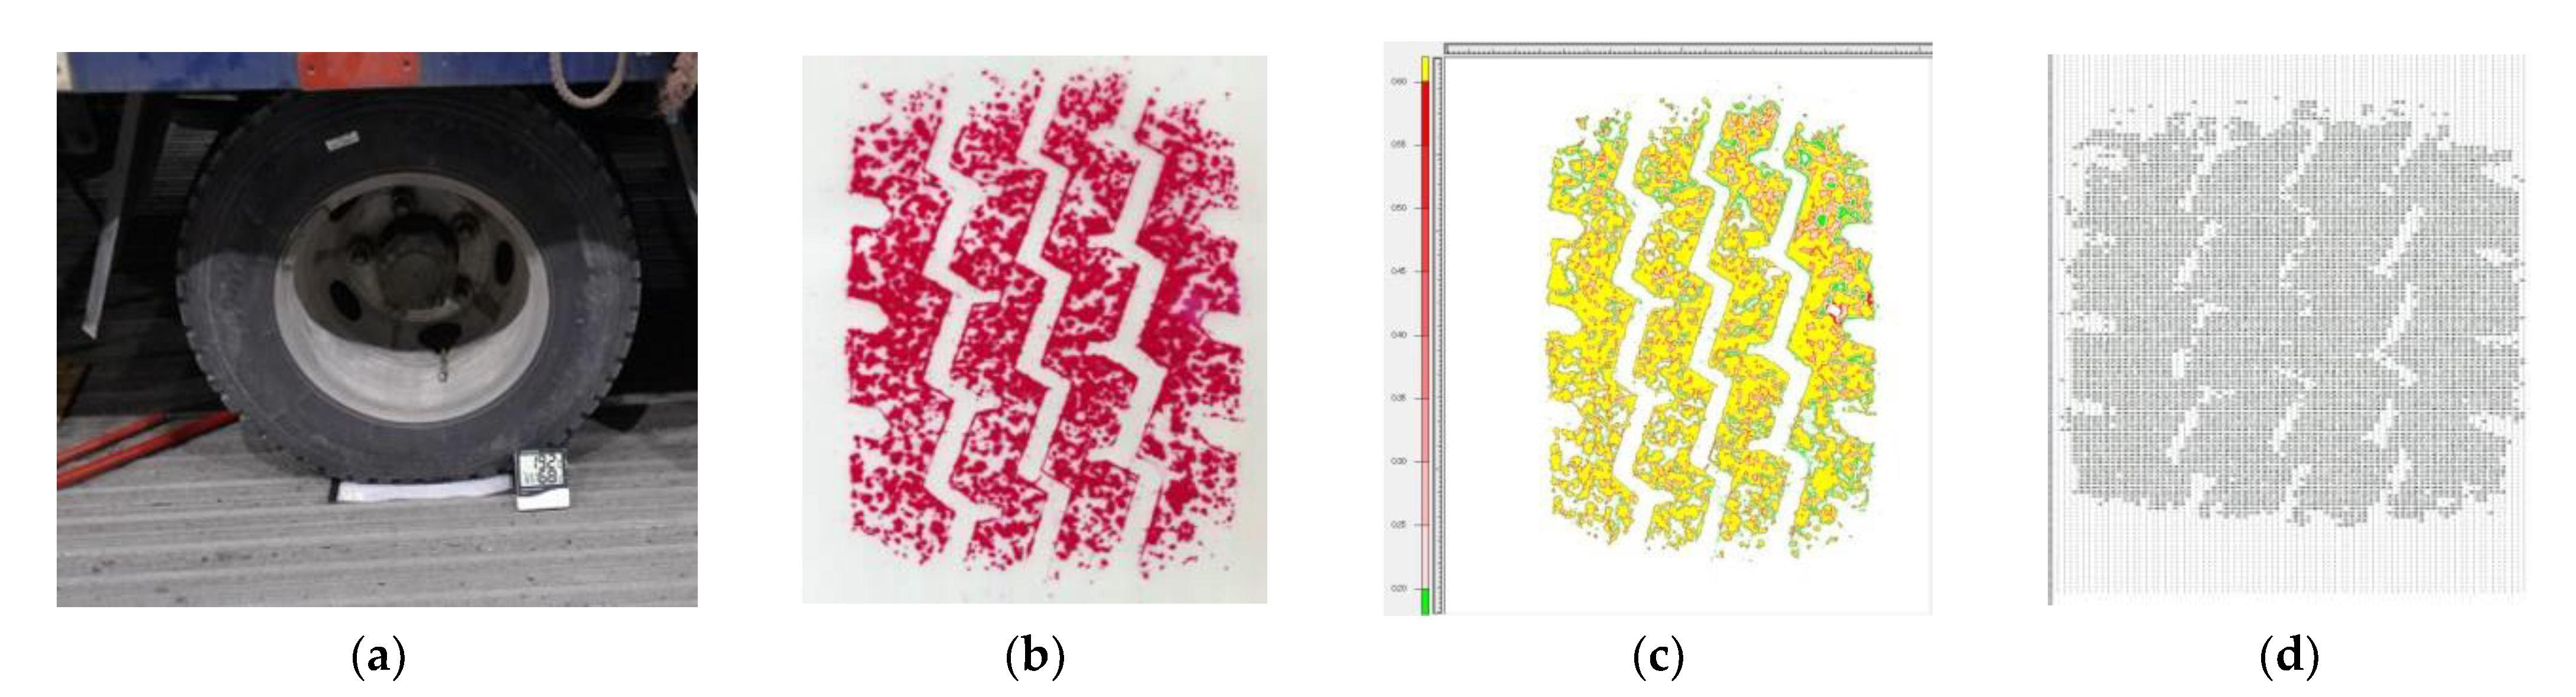
3.2. Pressure Film Testing
- (1)
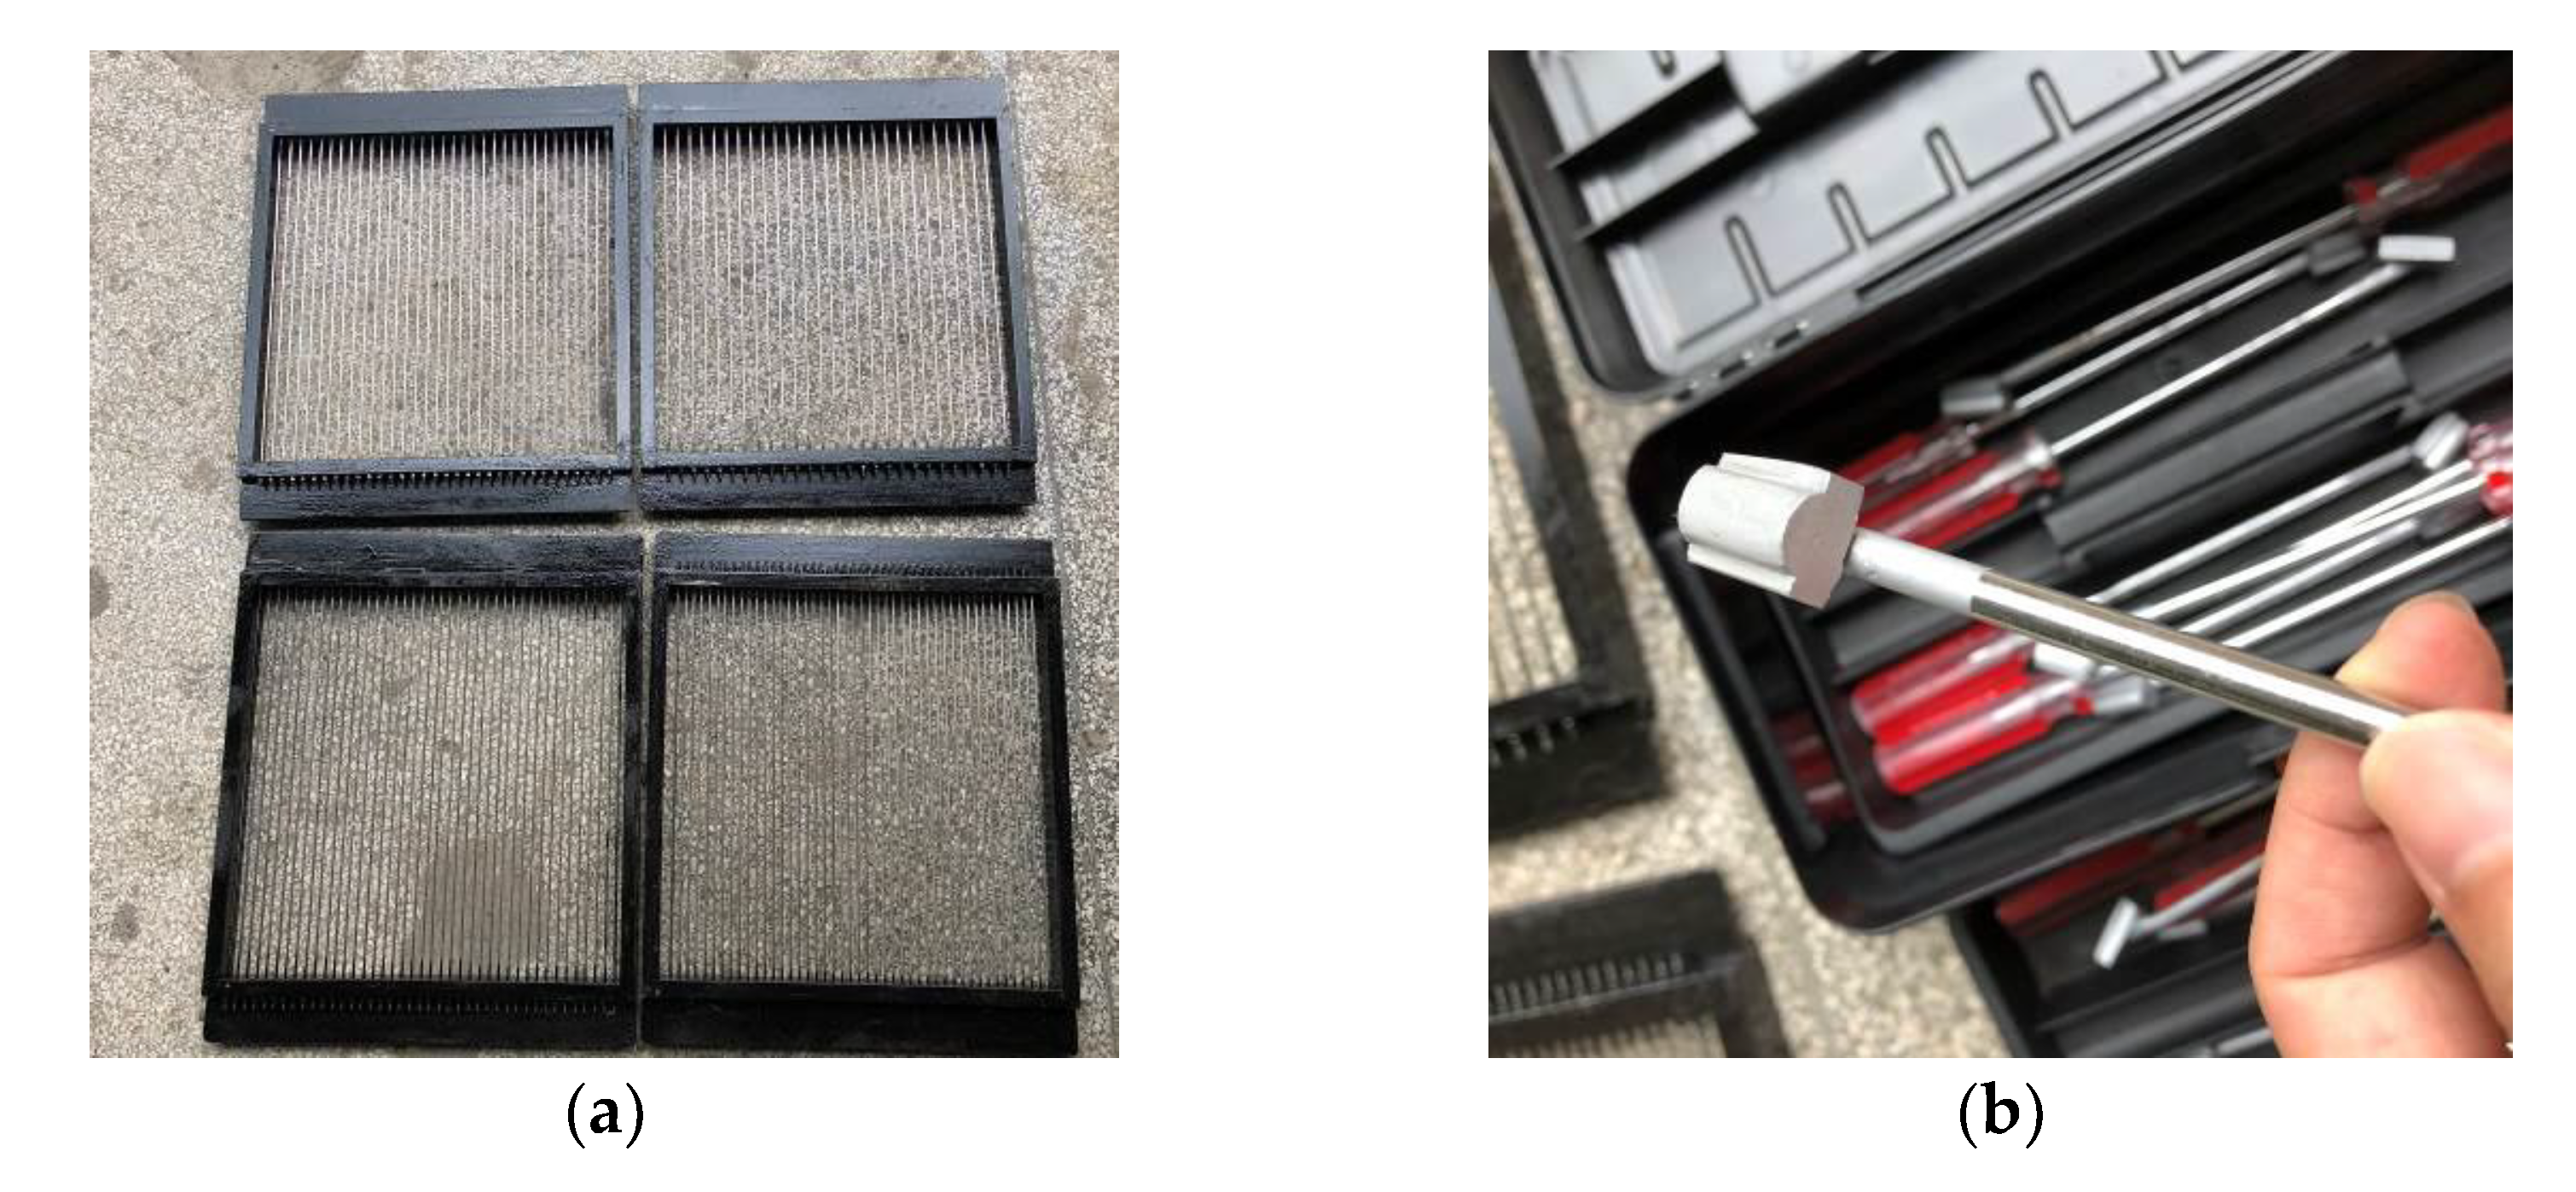
- The film is placed between the tire and the road and statically loaded for more than two mins (Figure 3a).
- (2)
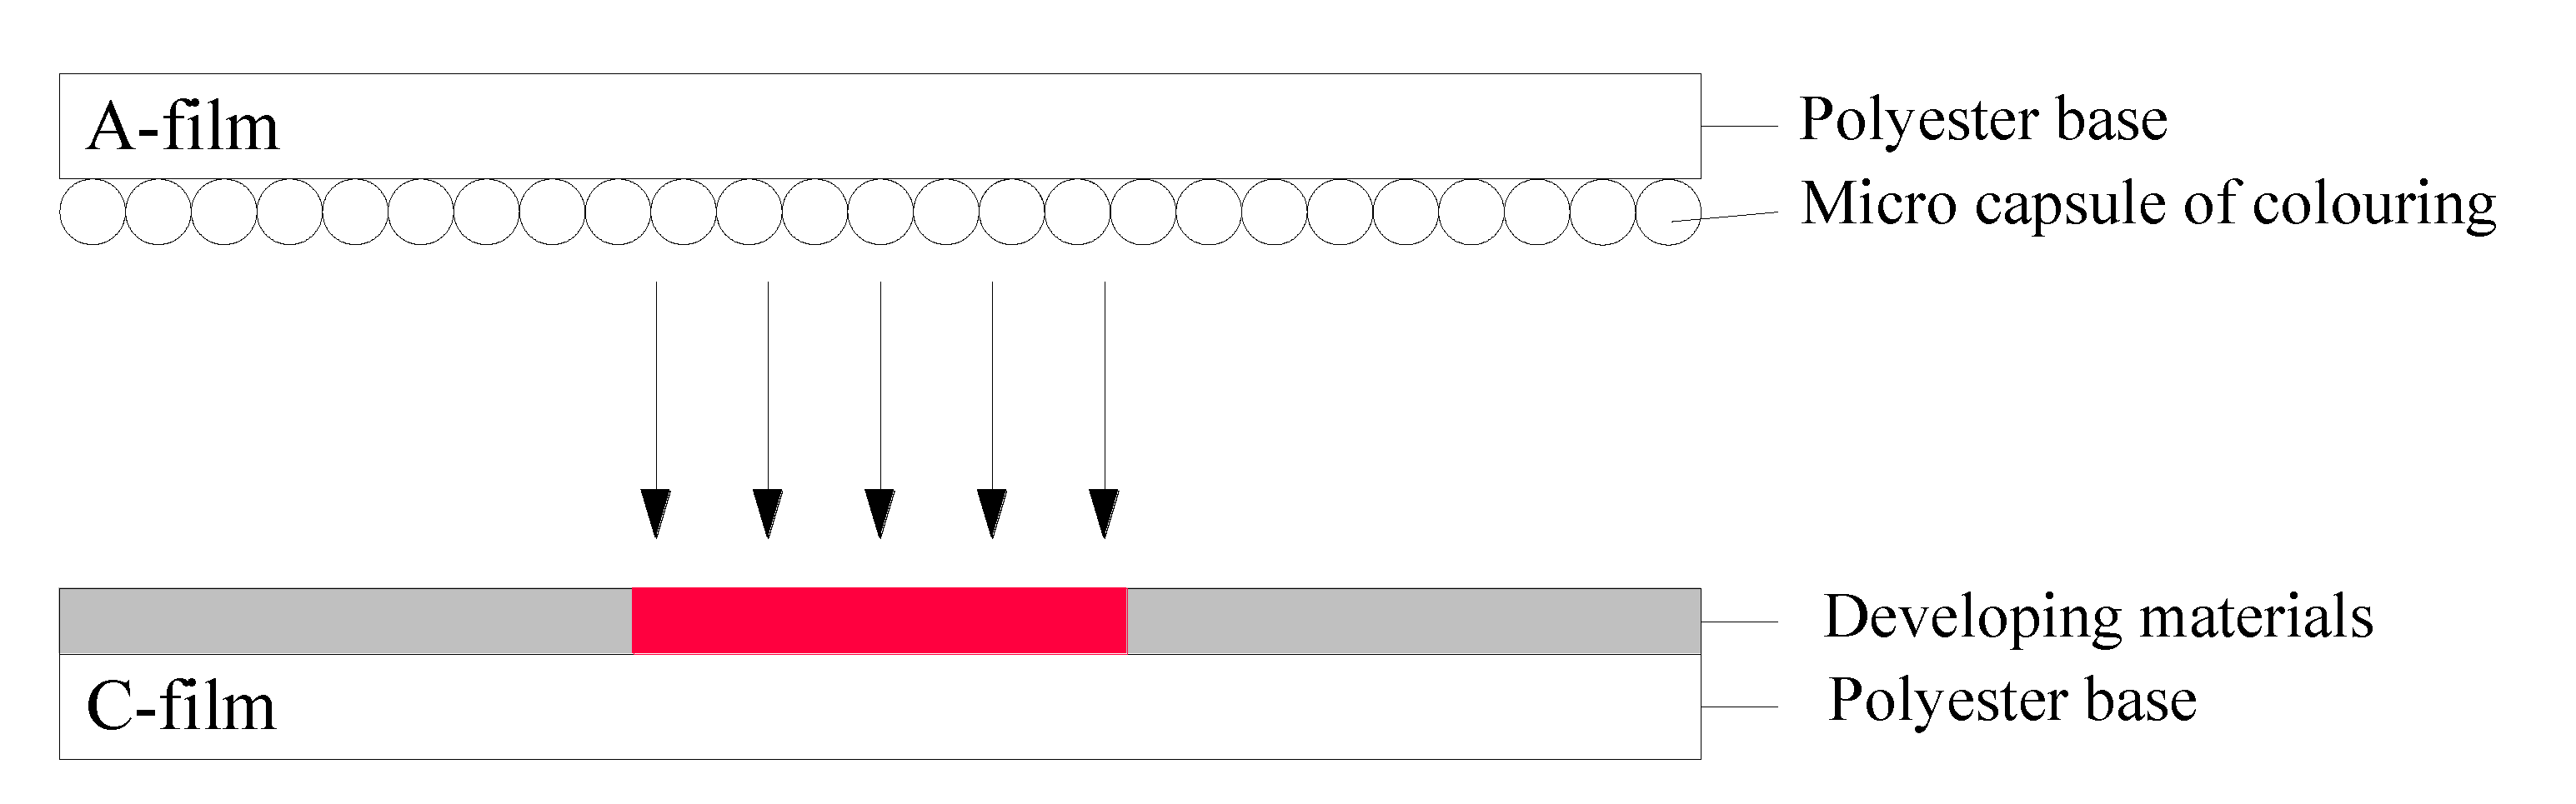
- The temperature and humidity of the test site are recorded, and the correct model of the pressure and color density is determined.
- (3)
- After the color reaction is complete, the test film is calibrated and scanned and identified in the FPD-8010E (Version 1.1, 2007, FIJIFILM Corporation; Tokyo, Japan) dedicated software (Figure 3b,c).
- (4)
- The test results corresponding to the different specifications of the pressure film are analyzed in MATLAB(Version 9.1, 2016, MathWorks company; Natick, MA, USA) and a numerical quantification and statistical analysis is performed (Figure 3d).
3.3. Stress Concentration Effect
3.4. Stationary Steering Resistance Torque
4. Materials and Methods
4.1. Materials and Mixture Design
4.2. Sample Preparation
- (1)
- (2)
- Before the concrete sets and solidifies, the slurry on the specimen surface is scraped off.
- (3)
- The rail mold is set, and the steel wire is made to adhere to the sample surface.
- (4)
- A texturing tool is used to carve curved grooves between the two steel wires.
- (5)
- The samples are placed in a standard curing room for seven days, and the texturing tool is used to scrape off the slurry on the groove surface to restore the rough texture.
5. Orthogonal Designs
5.1. Orthogonal Design
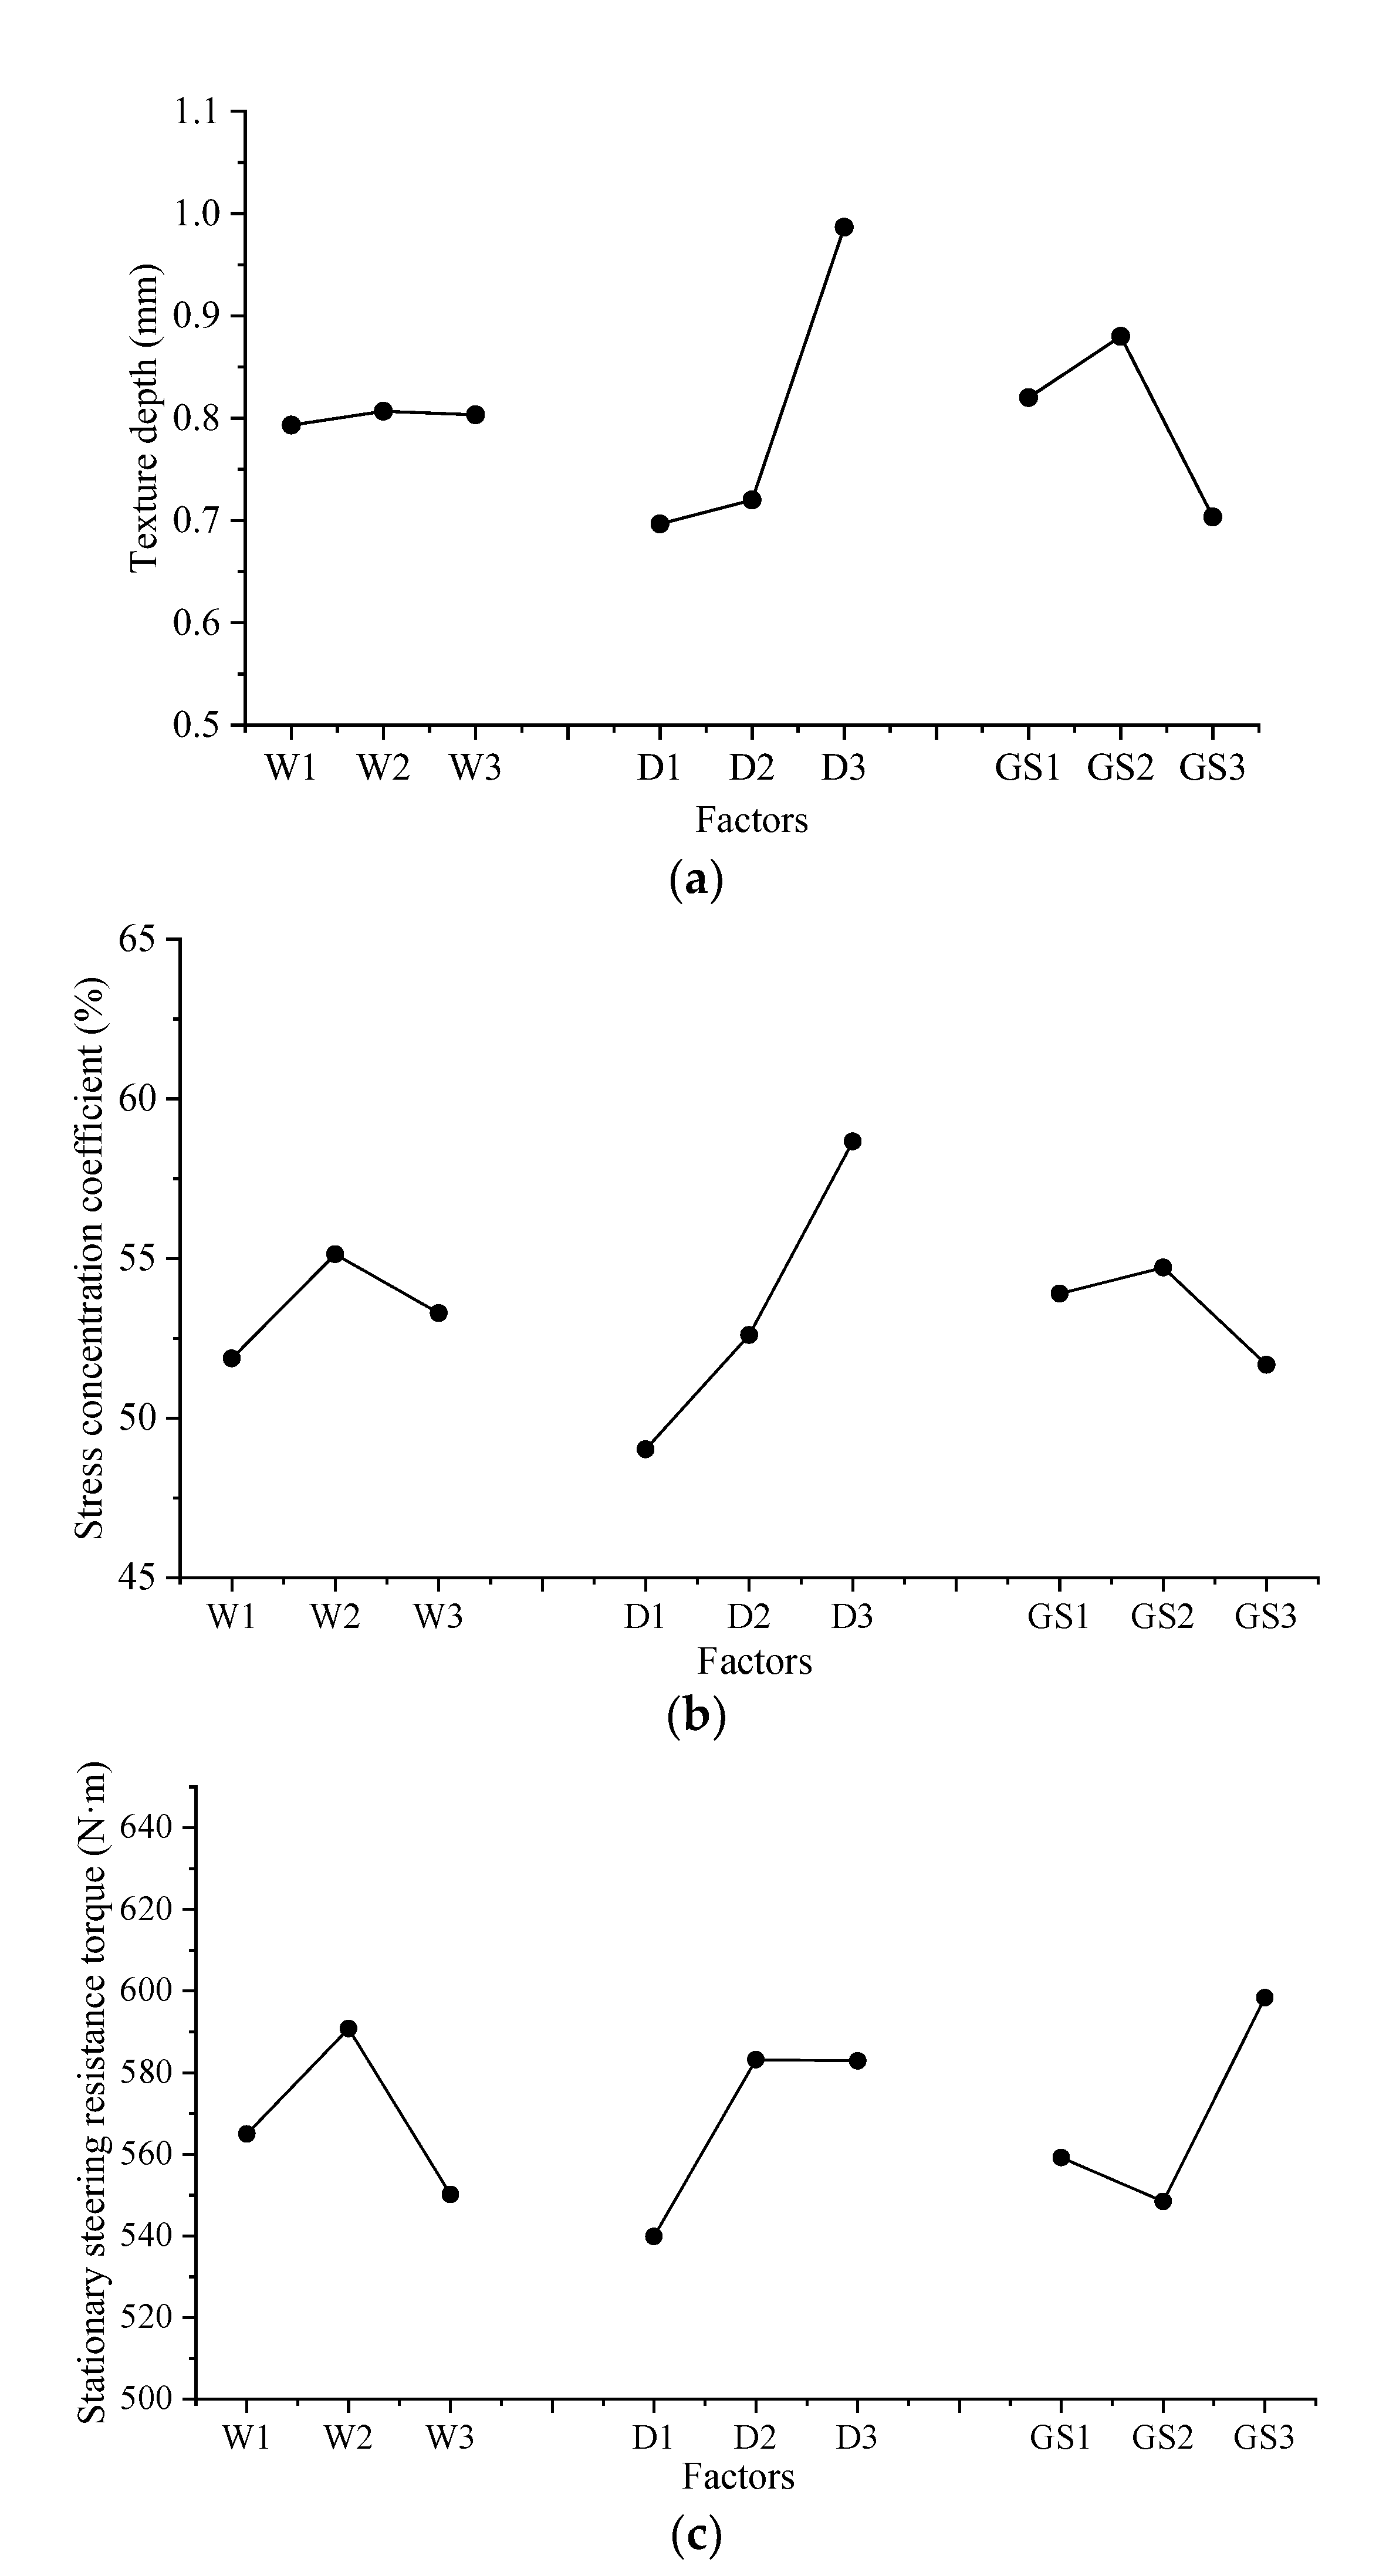
5.2. Analysis of Orthogonal Test of Results
6. Durability Research Based on Abrasion Test
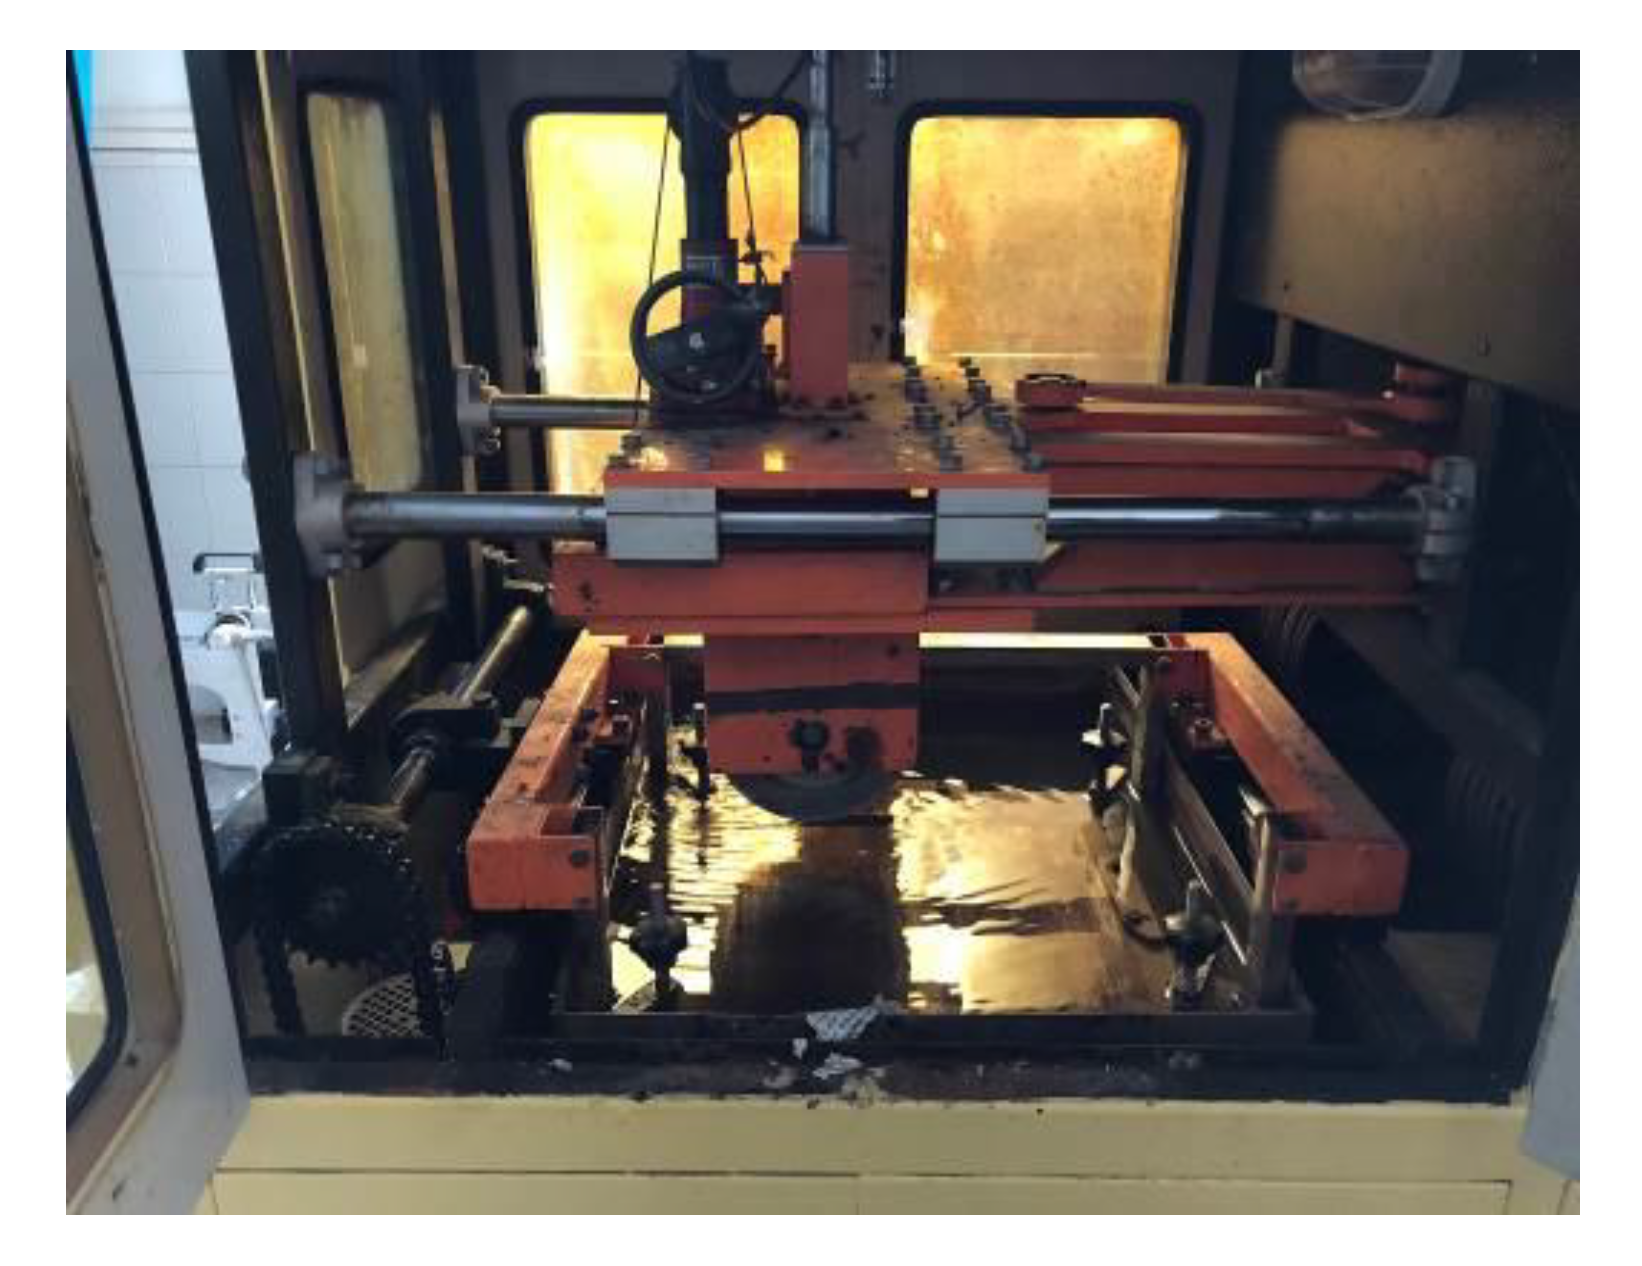
6.1. Design of Abrasion Test
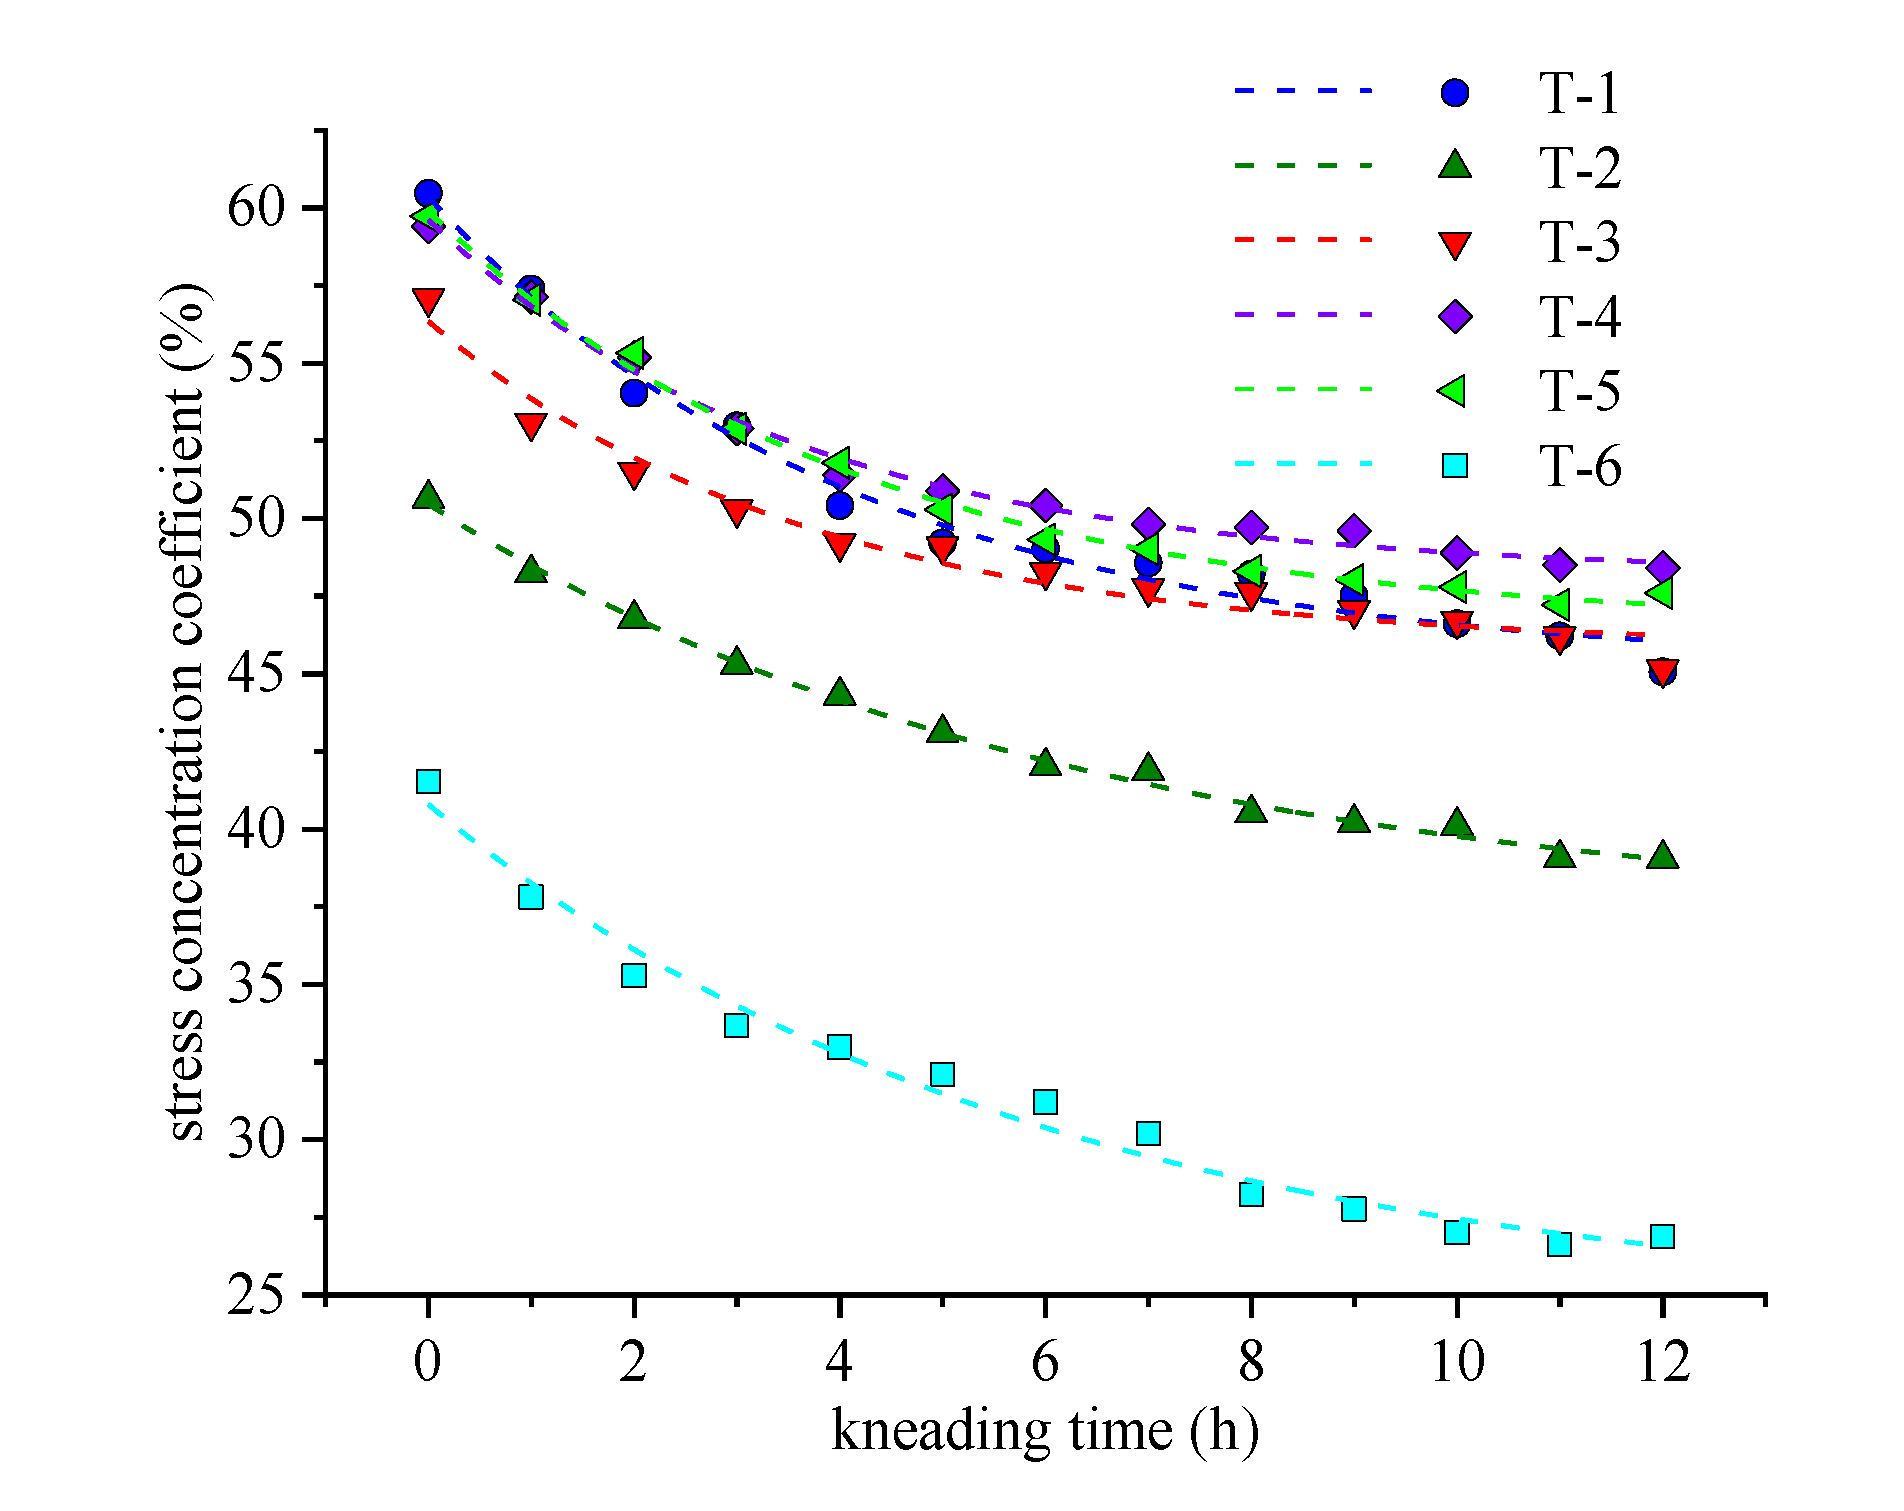
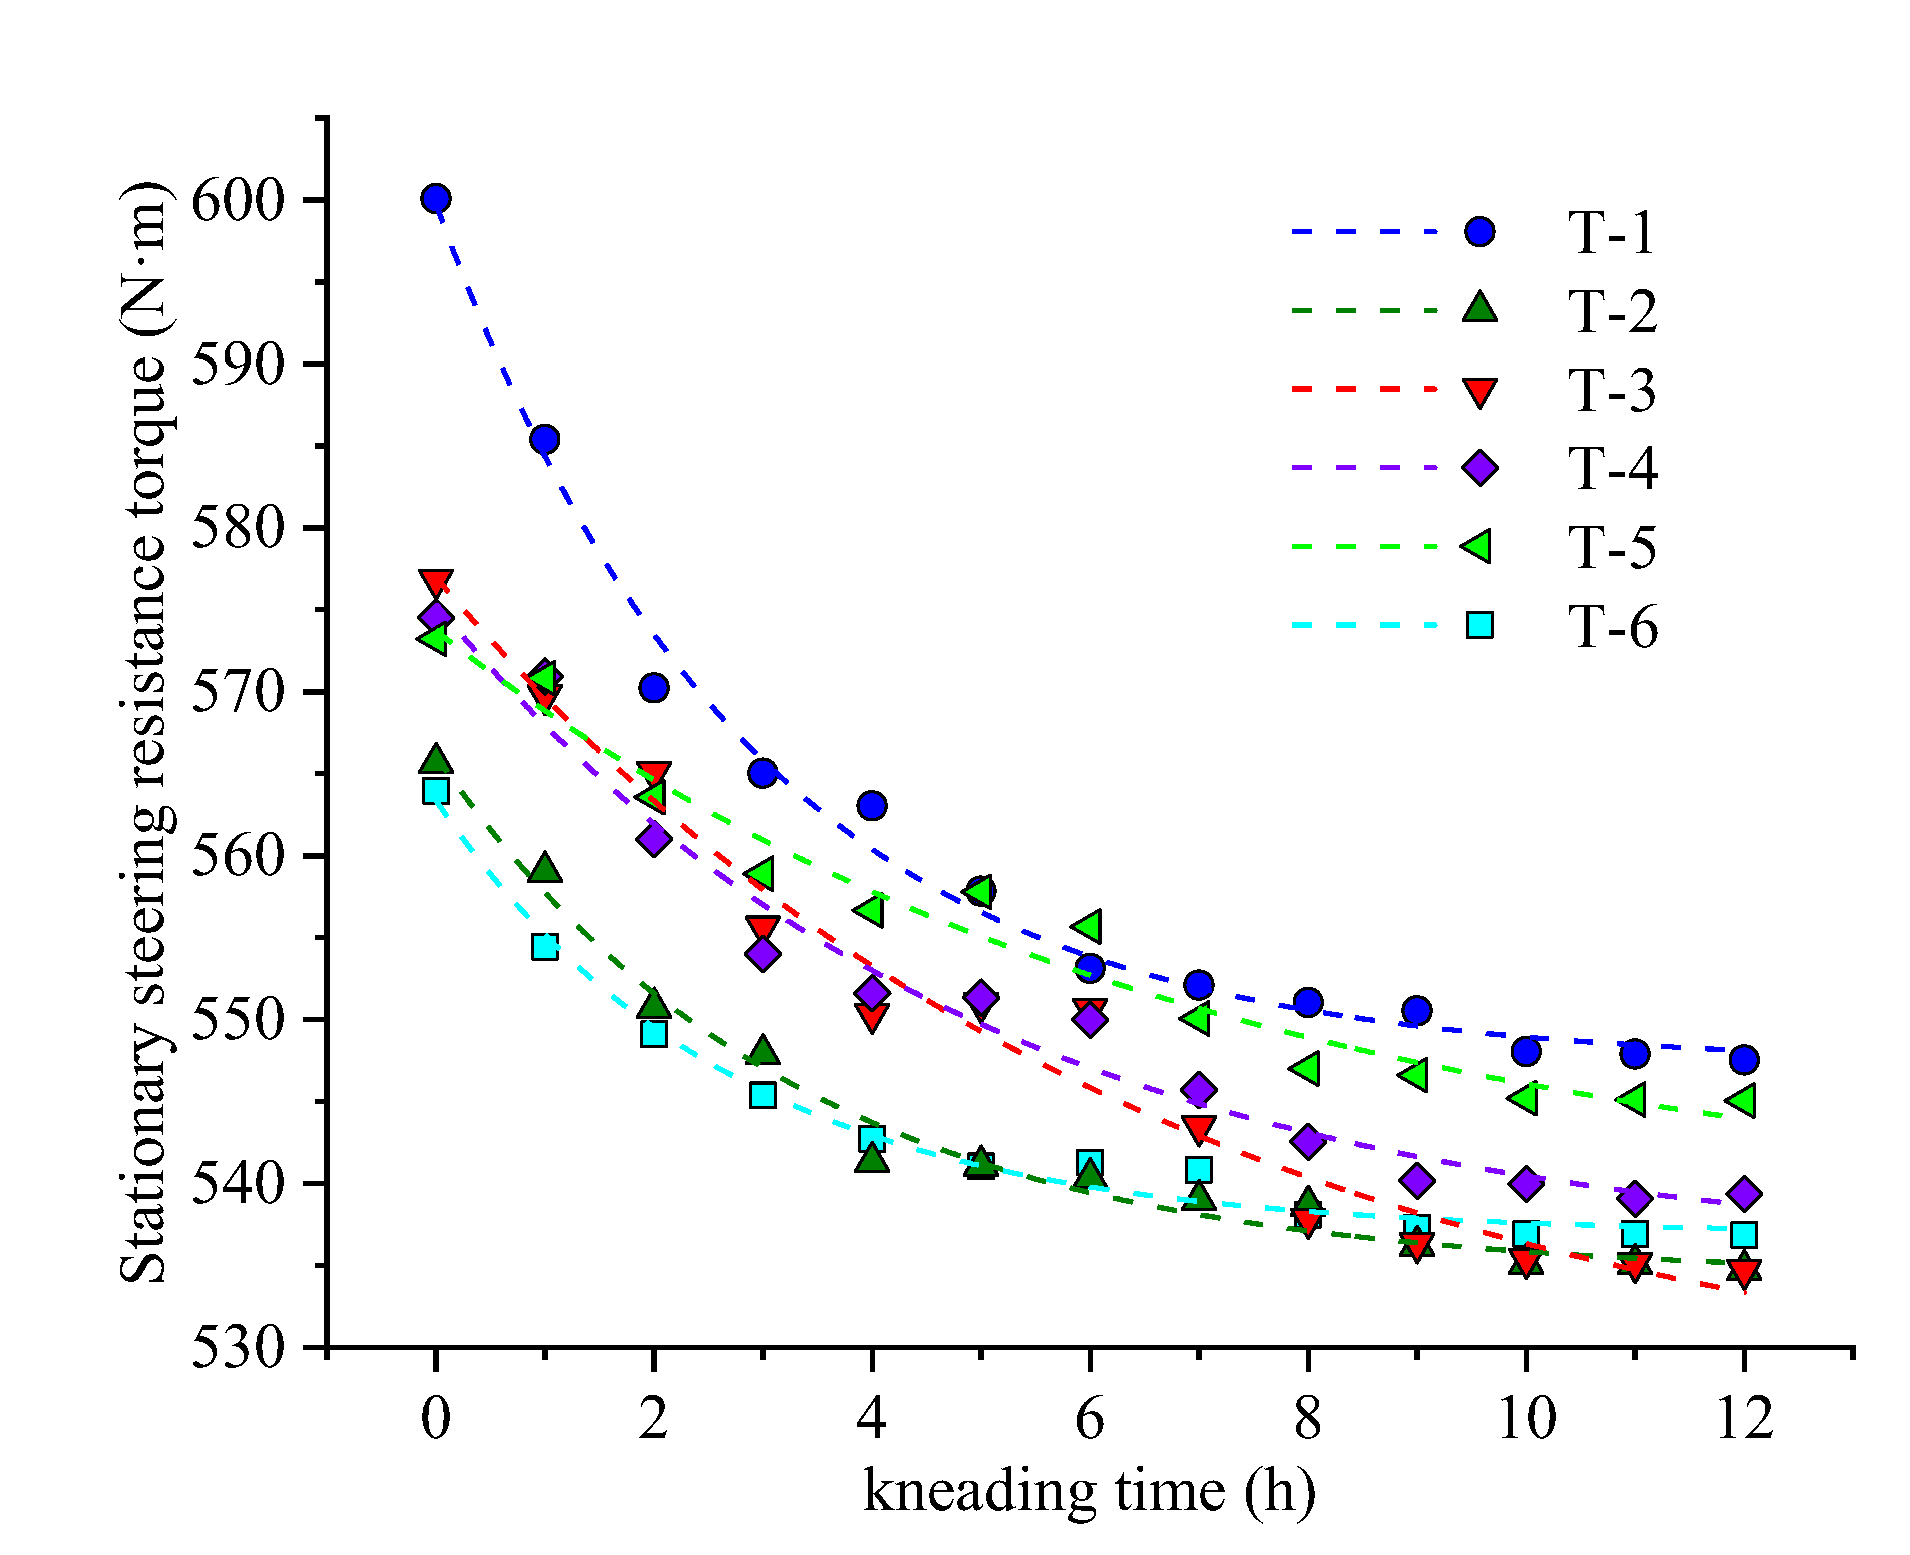
6.2. Analysis of Abrasion Test Results
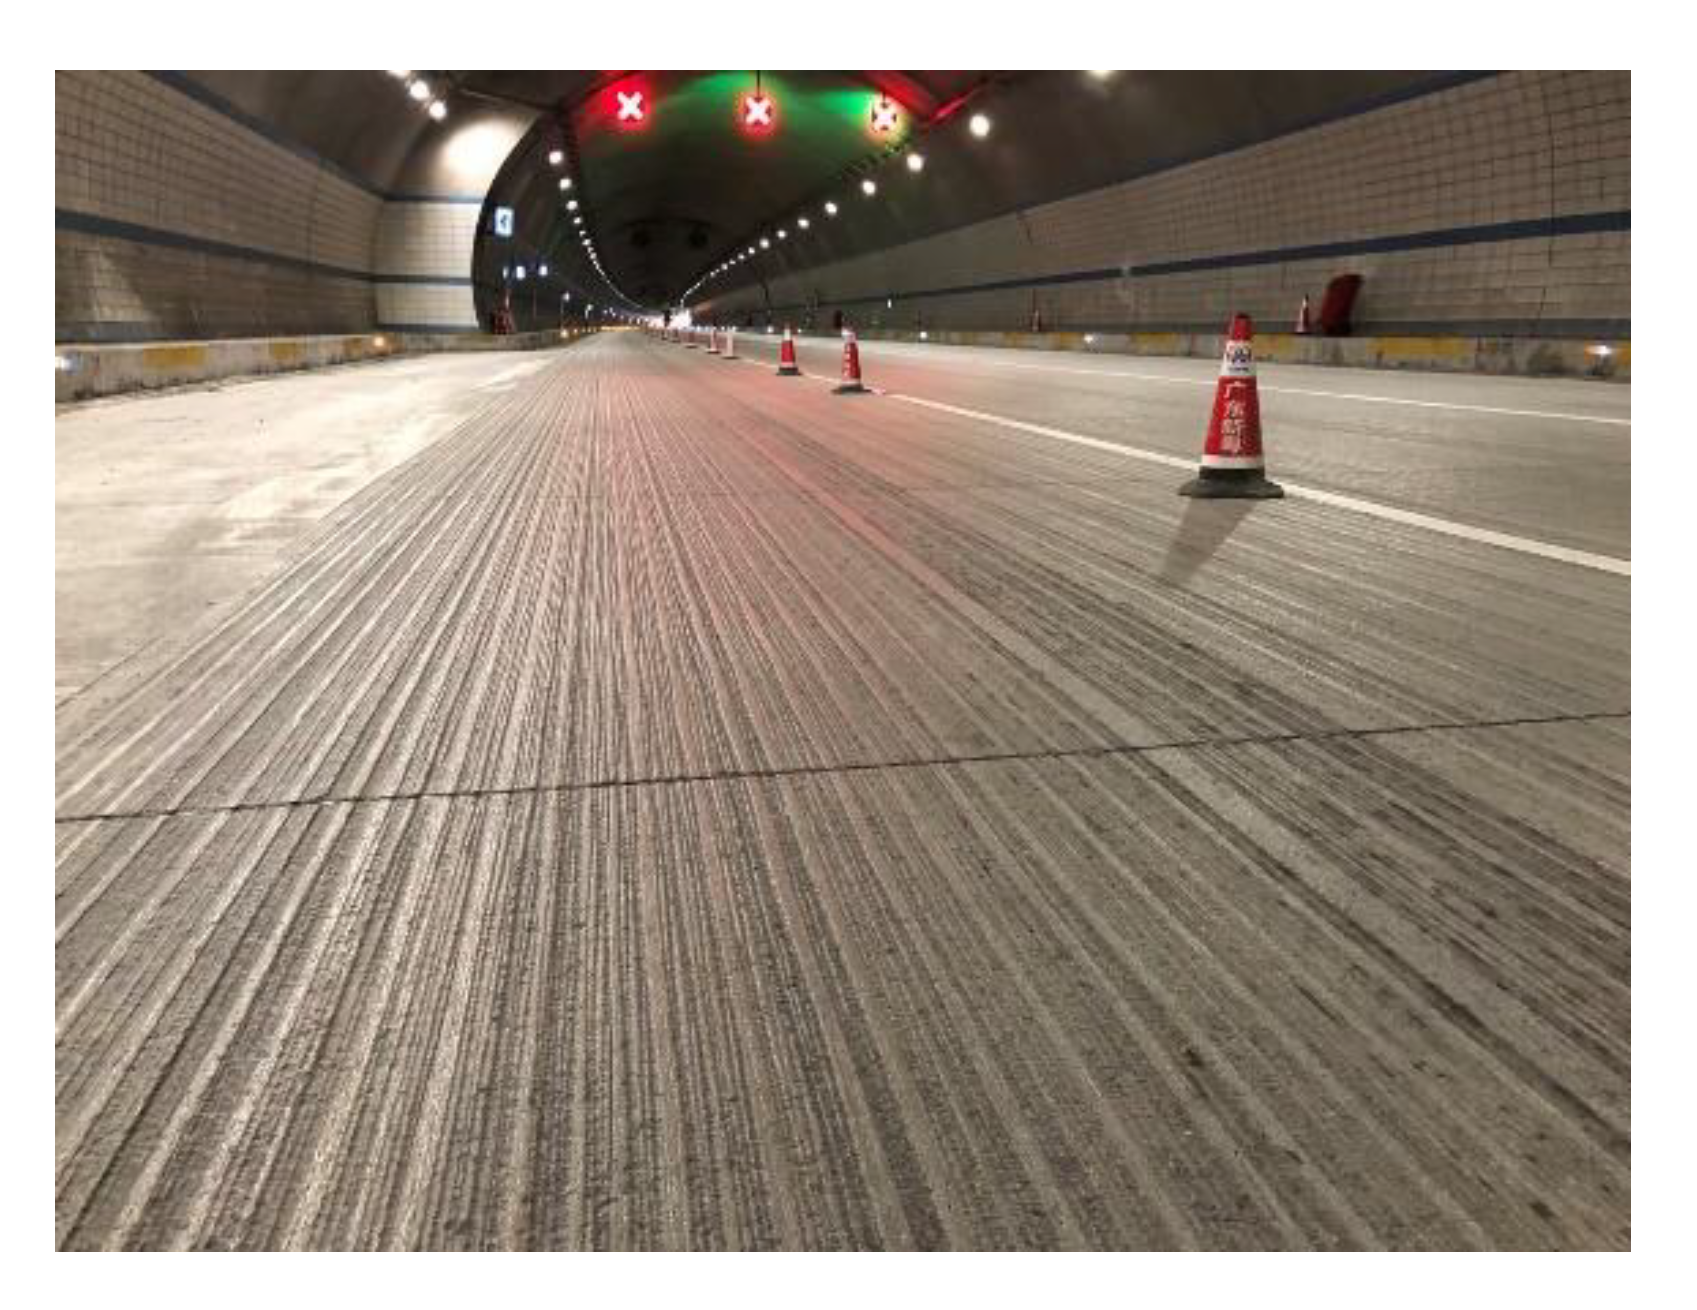
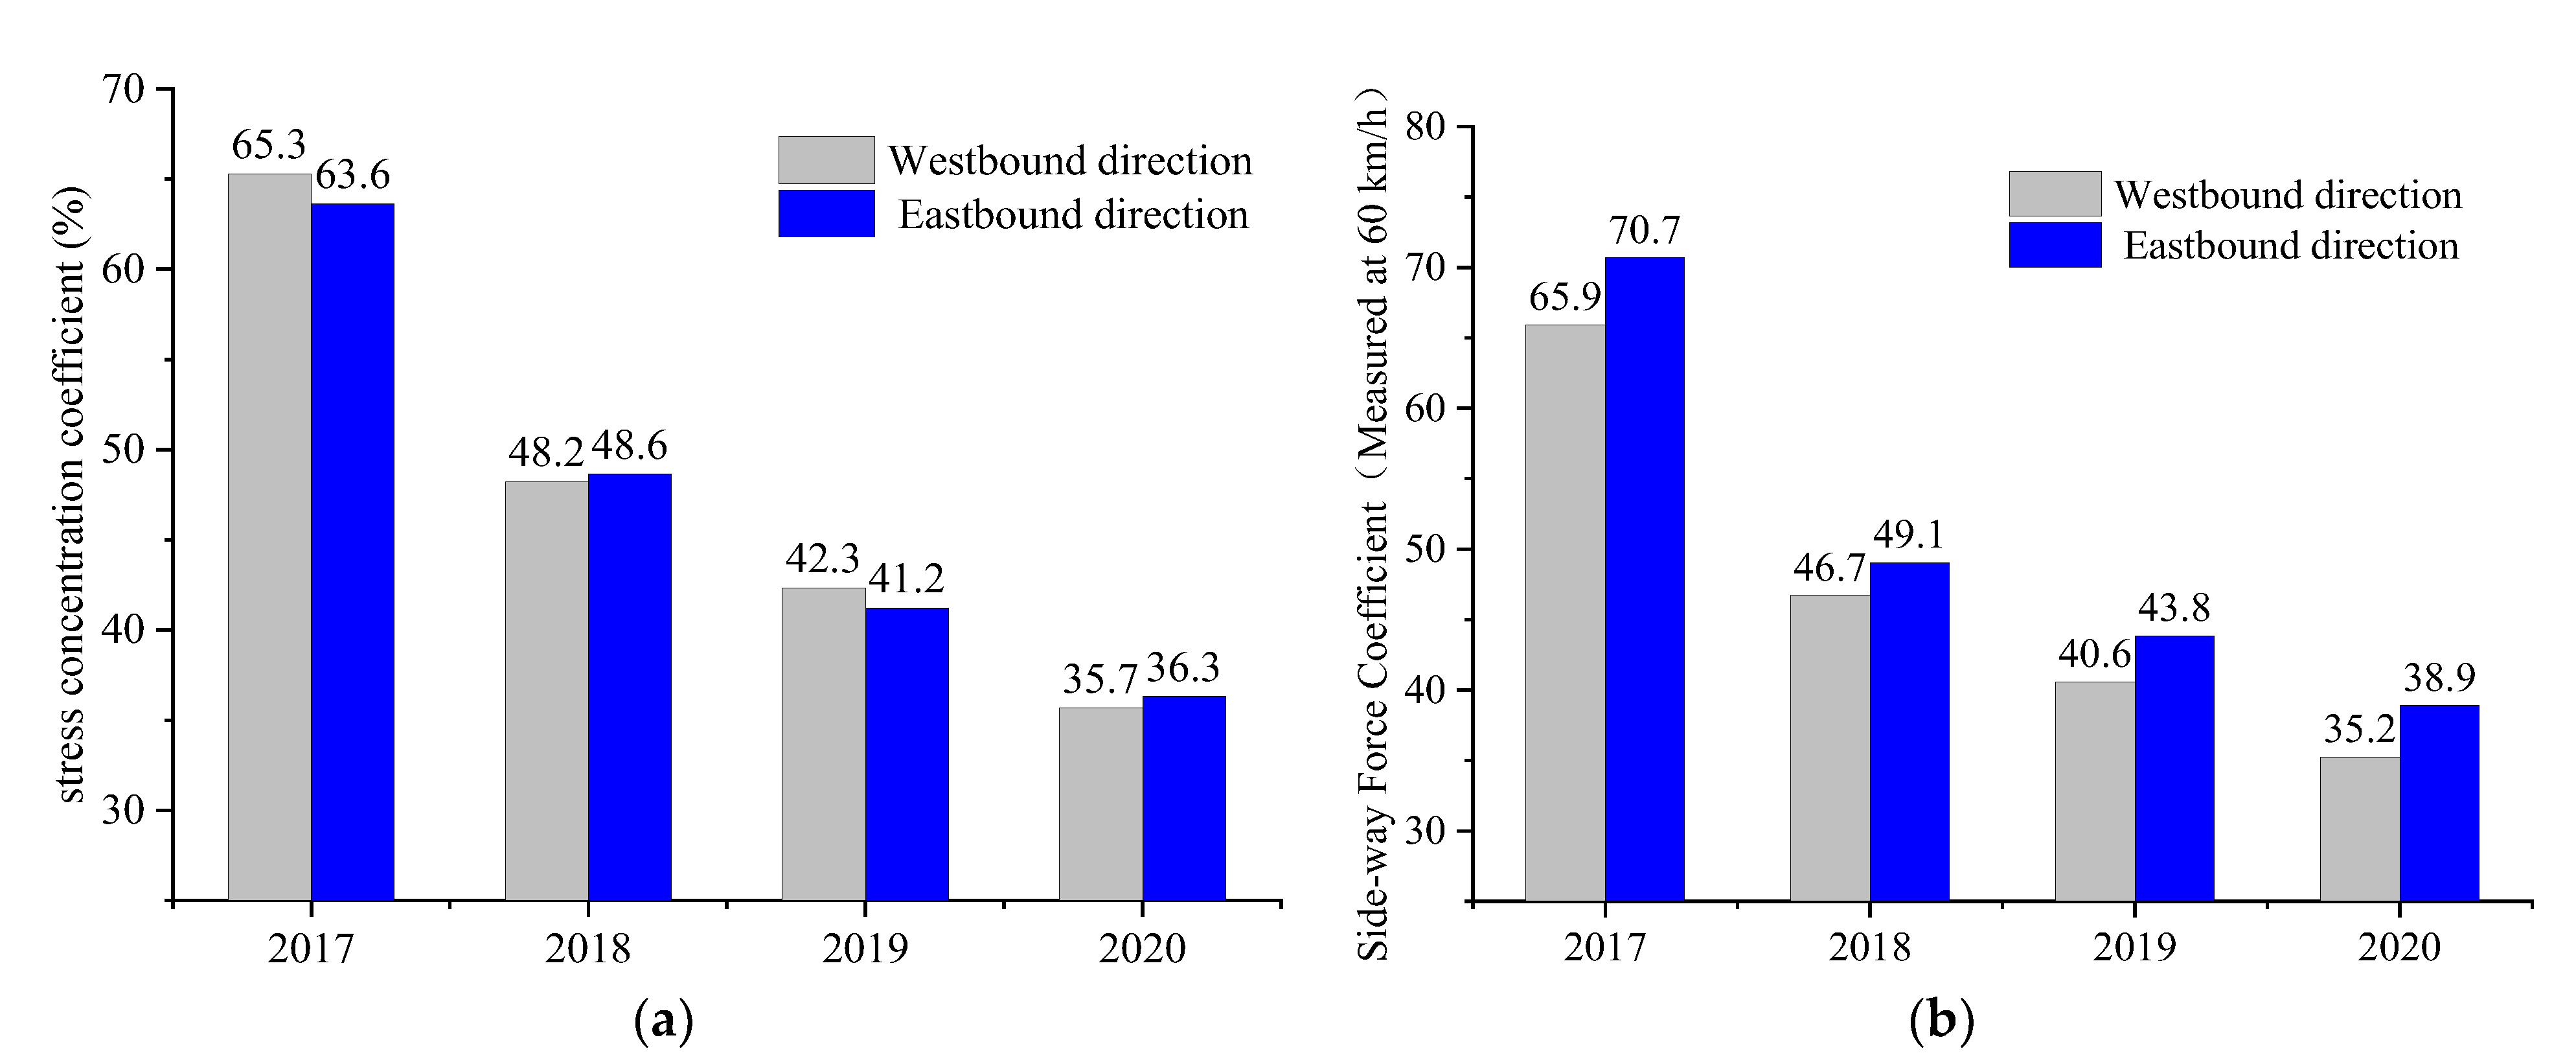
7. Engineering Verification
8. Conclusions
- (1)
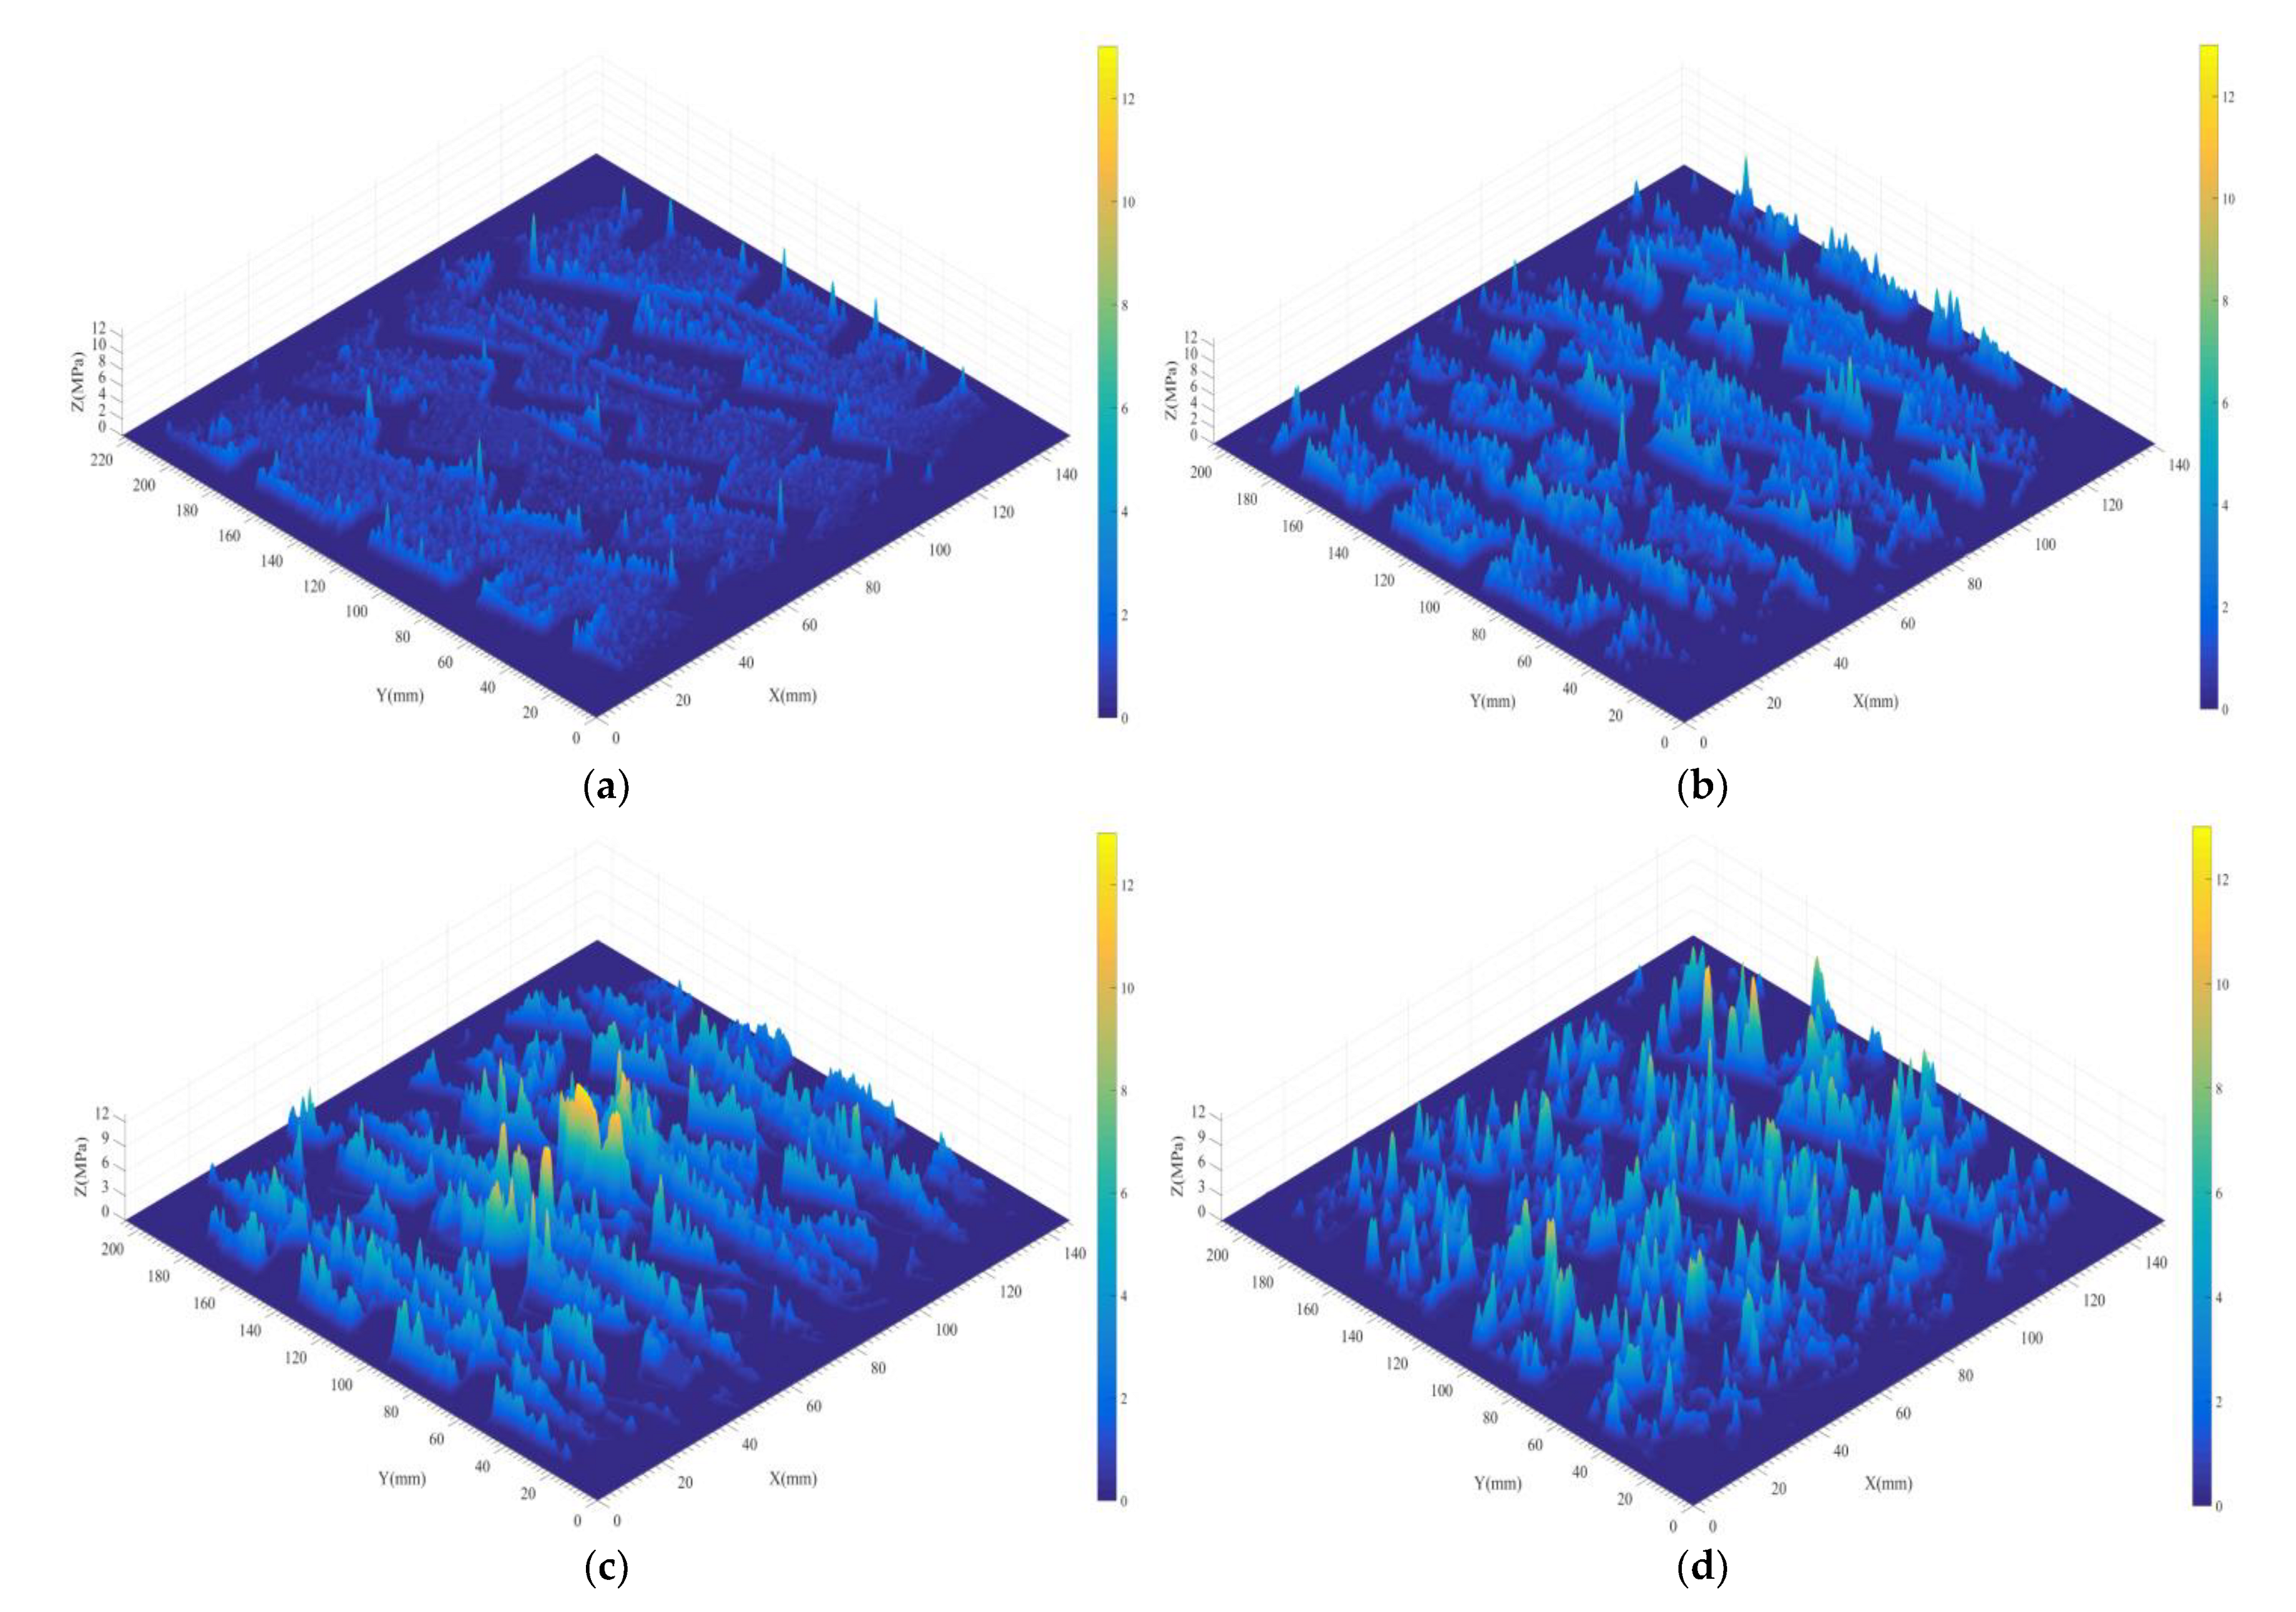
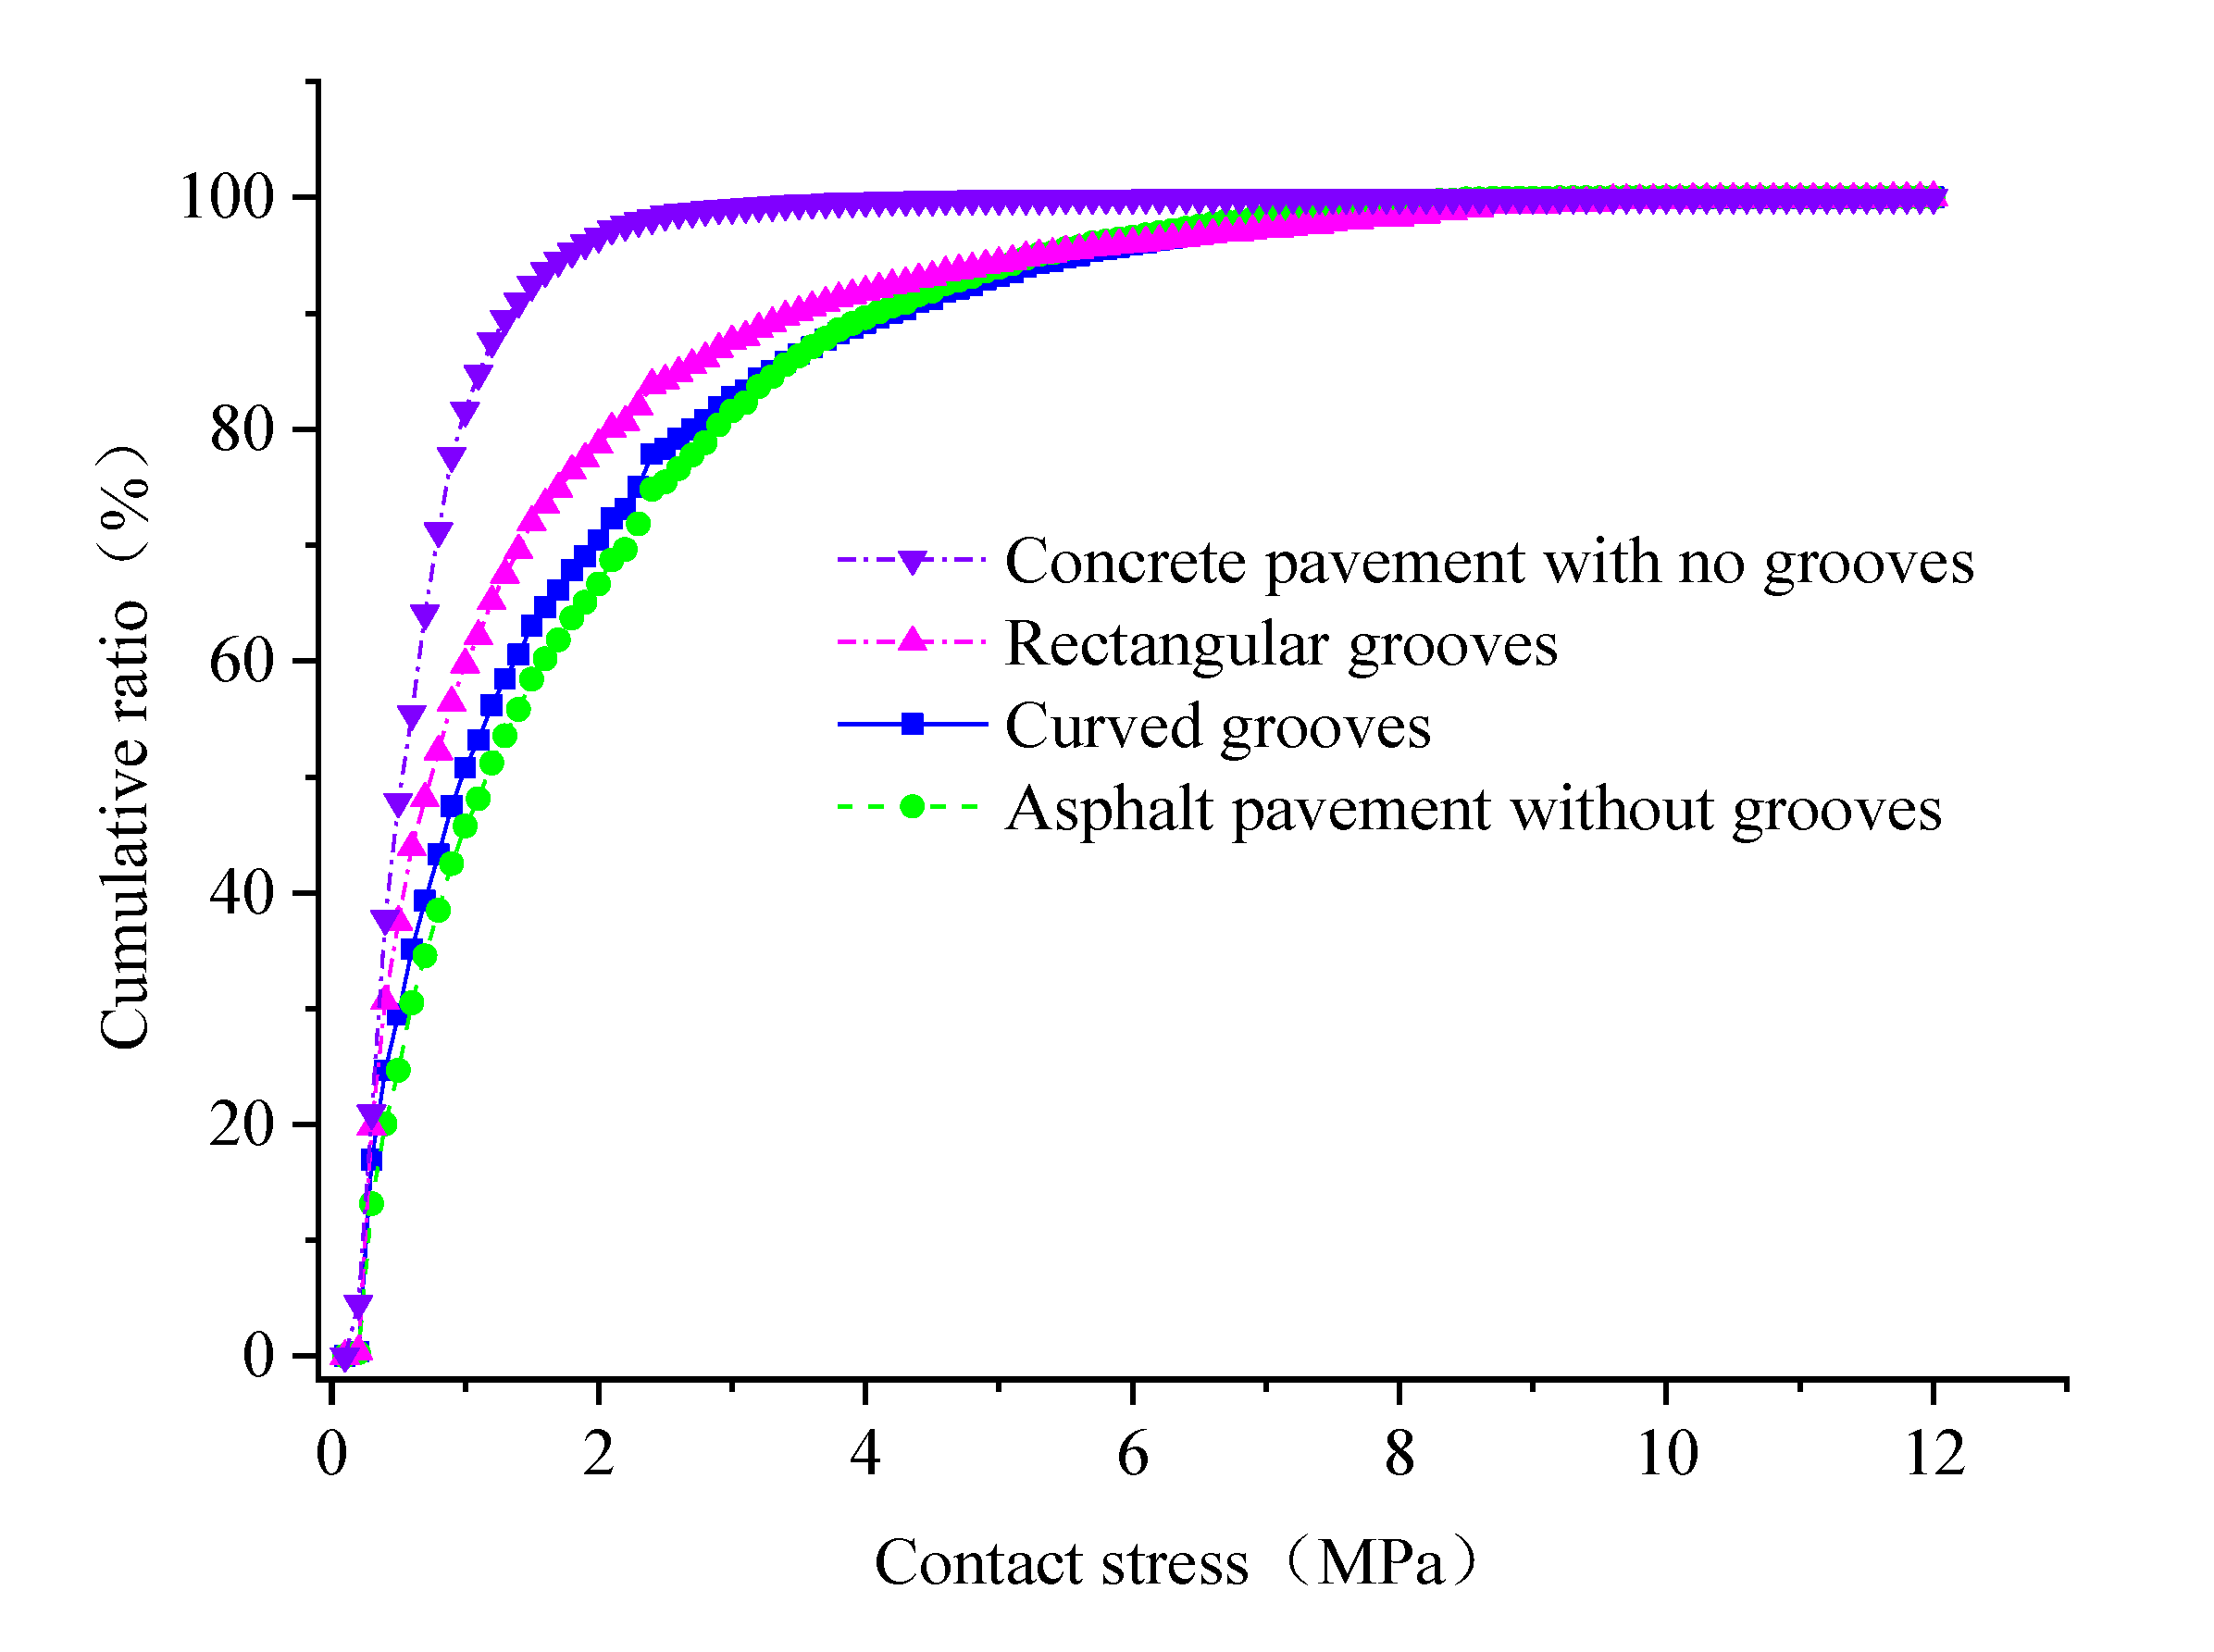
- The actual contact stress between the tire and the pavement can be characterized by the Weibull model. The discrete degree of the contact stress of different pavements can be ranked (from high to low) as follows: asphalt pavement (AC-16), curved grooved pavement, rectangular grooved pavement, and concrete pavements with no grooves.
- (2)
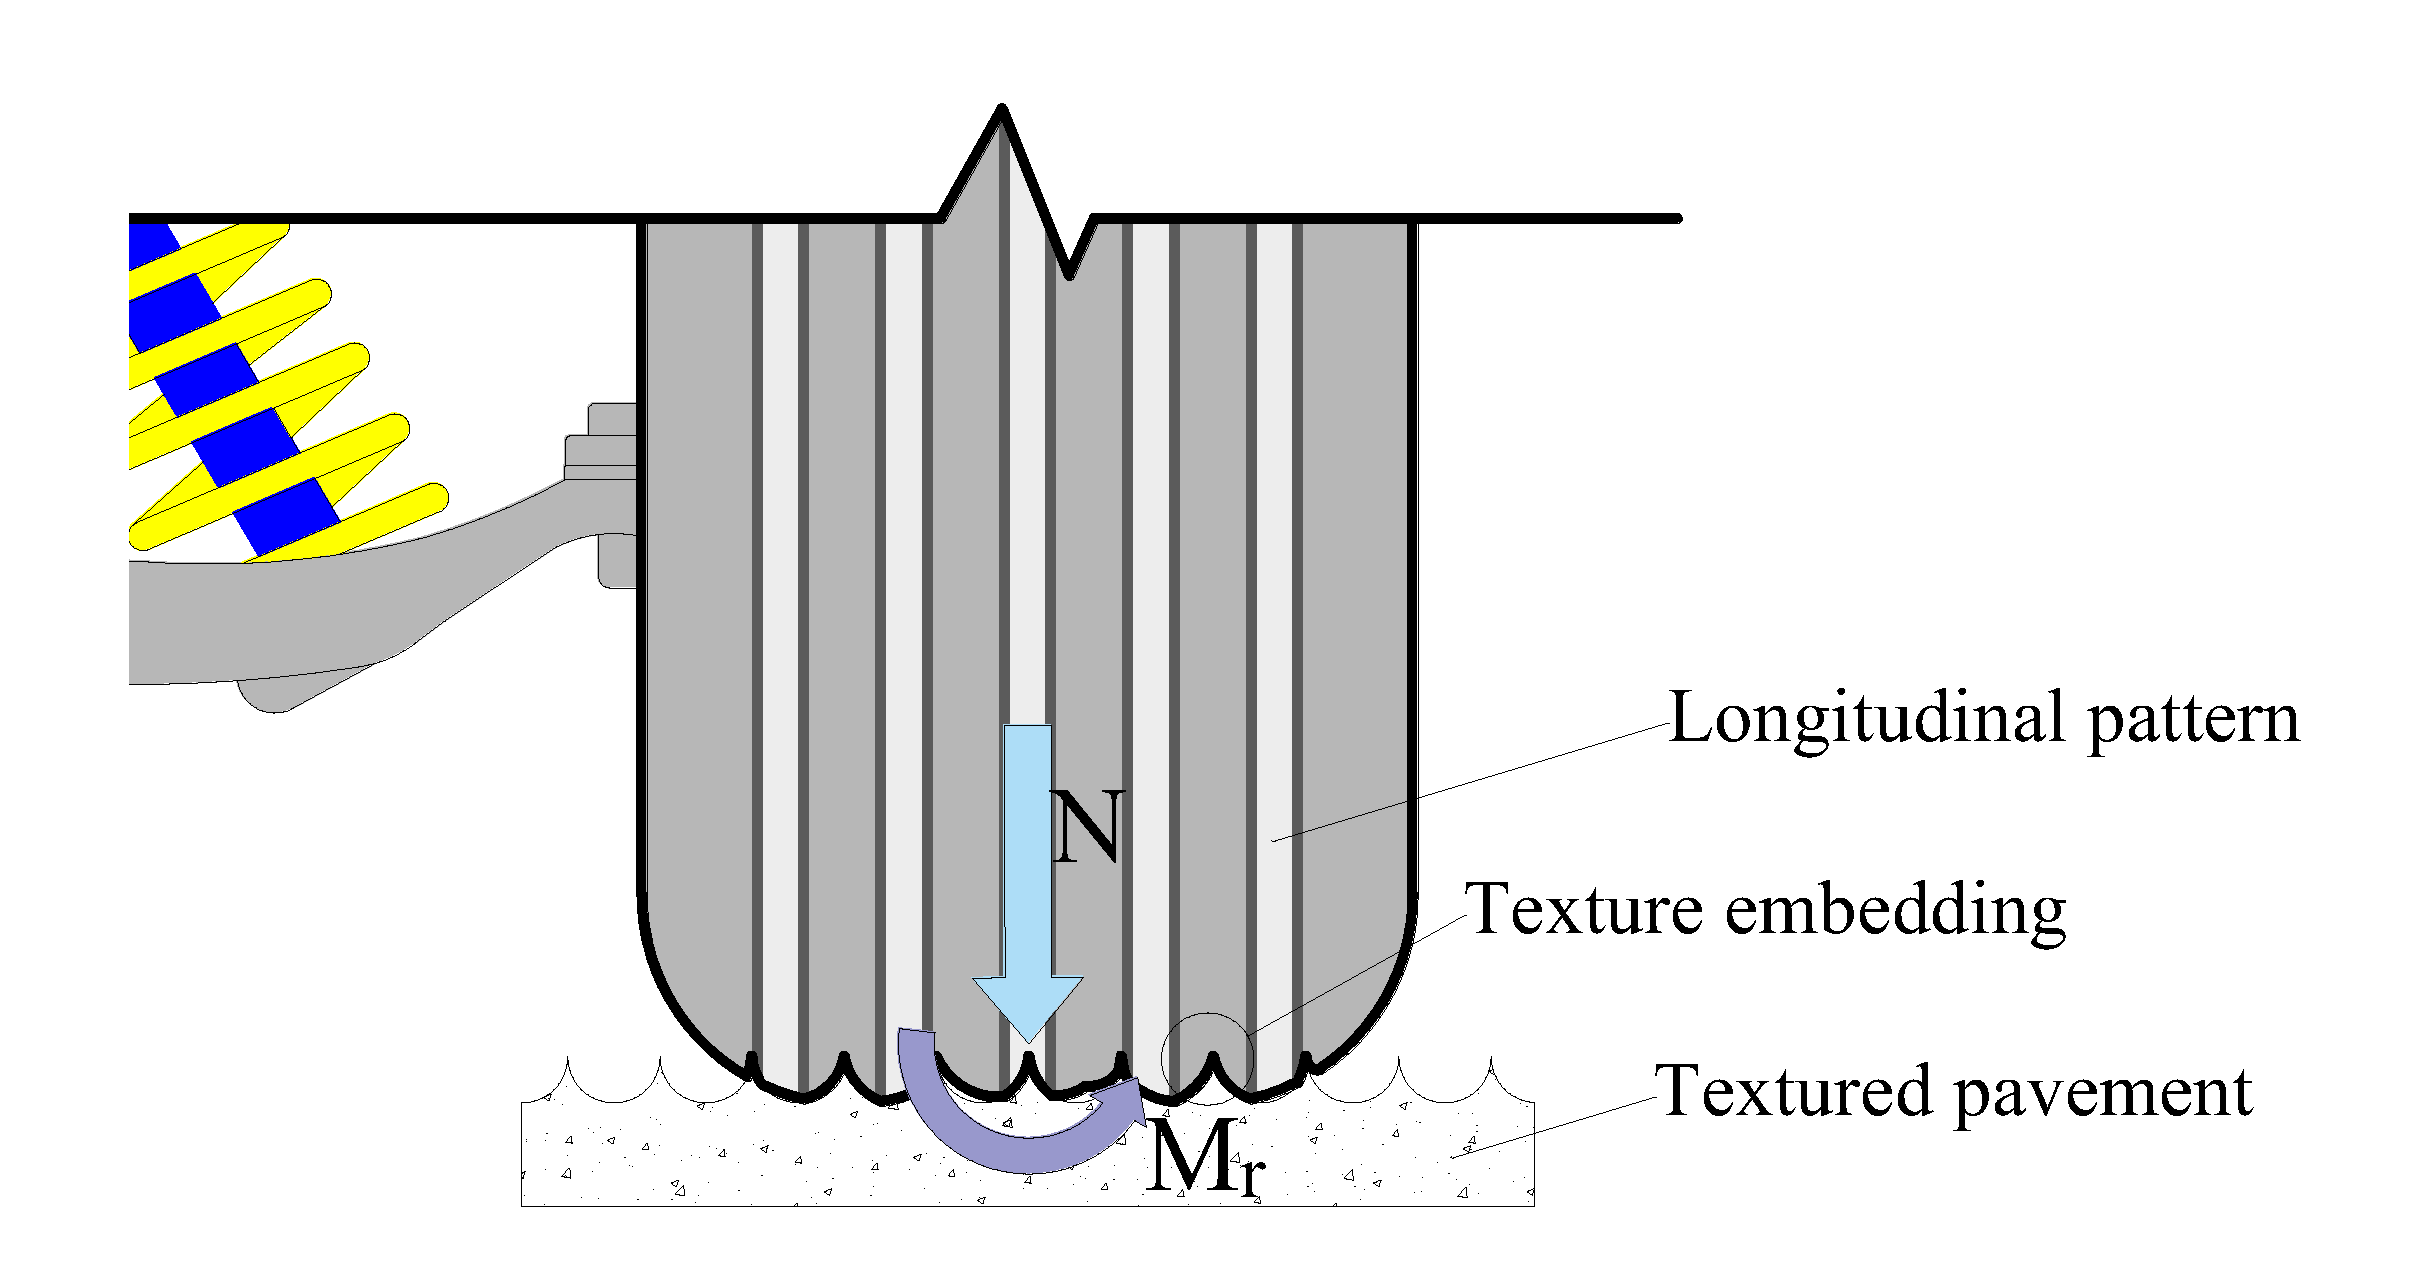
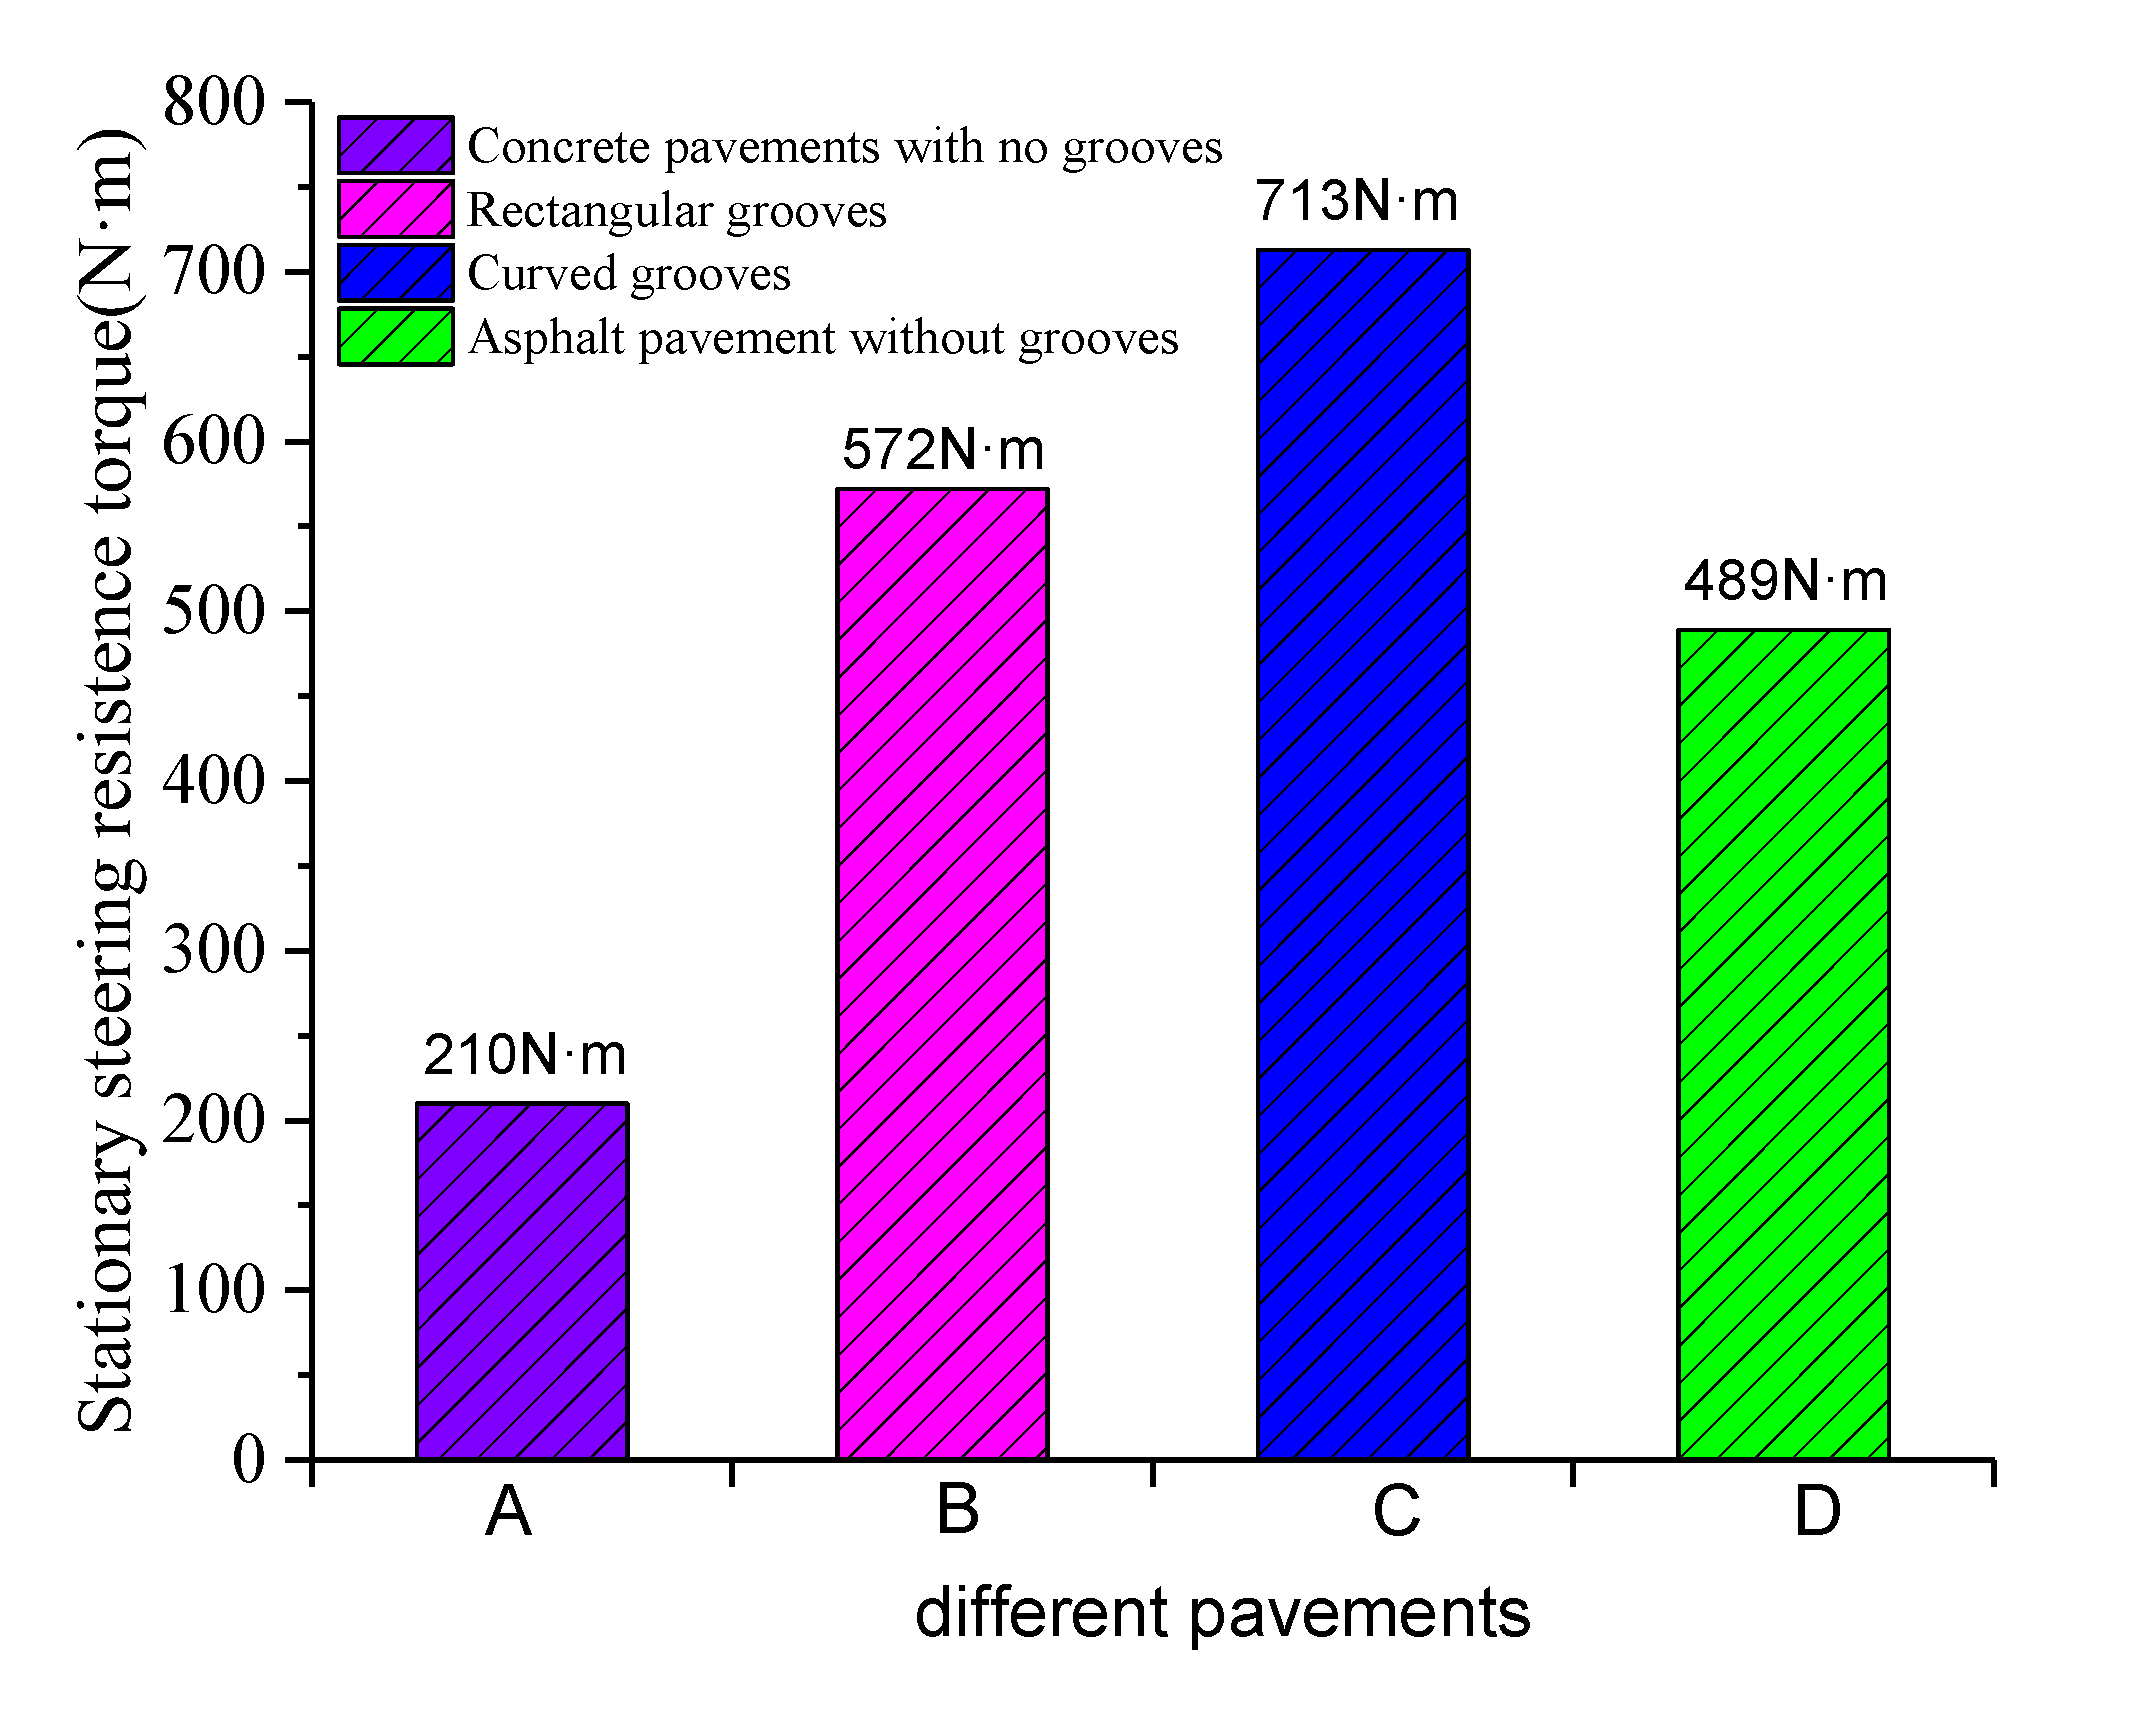
- The compact texture structure of the textured pavement improved the friction resistance but reduced the driving stability. Theoretical and experimental analyses showed that the stationary steering resistance torque based on the measured stress could effectively help evaluate the steering effect of textured pavements on tires.
- (3)
- The most important factors influencing the texture depth, stress concentration coefficient, and steering resistance torque were the groove depth, groove width, and groove spacing. Through the analysis of variance, we found that each texture parameter had a significant influence on the stress concentration coefficient and stationary steering resistance torque.
- (4)
- An asymptotic attenuation model successfully described the attenuation laws of the stress concentration coefficient and stationary steering resistance torque. Based on the results of orthogonal and abrasion resistance tests, we suggest a sample with optimal dimensions (8 mm in width, 3 mm in depth, 15 mm in spacing, and 50 mm in groove group width) for balancing skid-resistance performance and driving stability.
- (5)
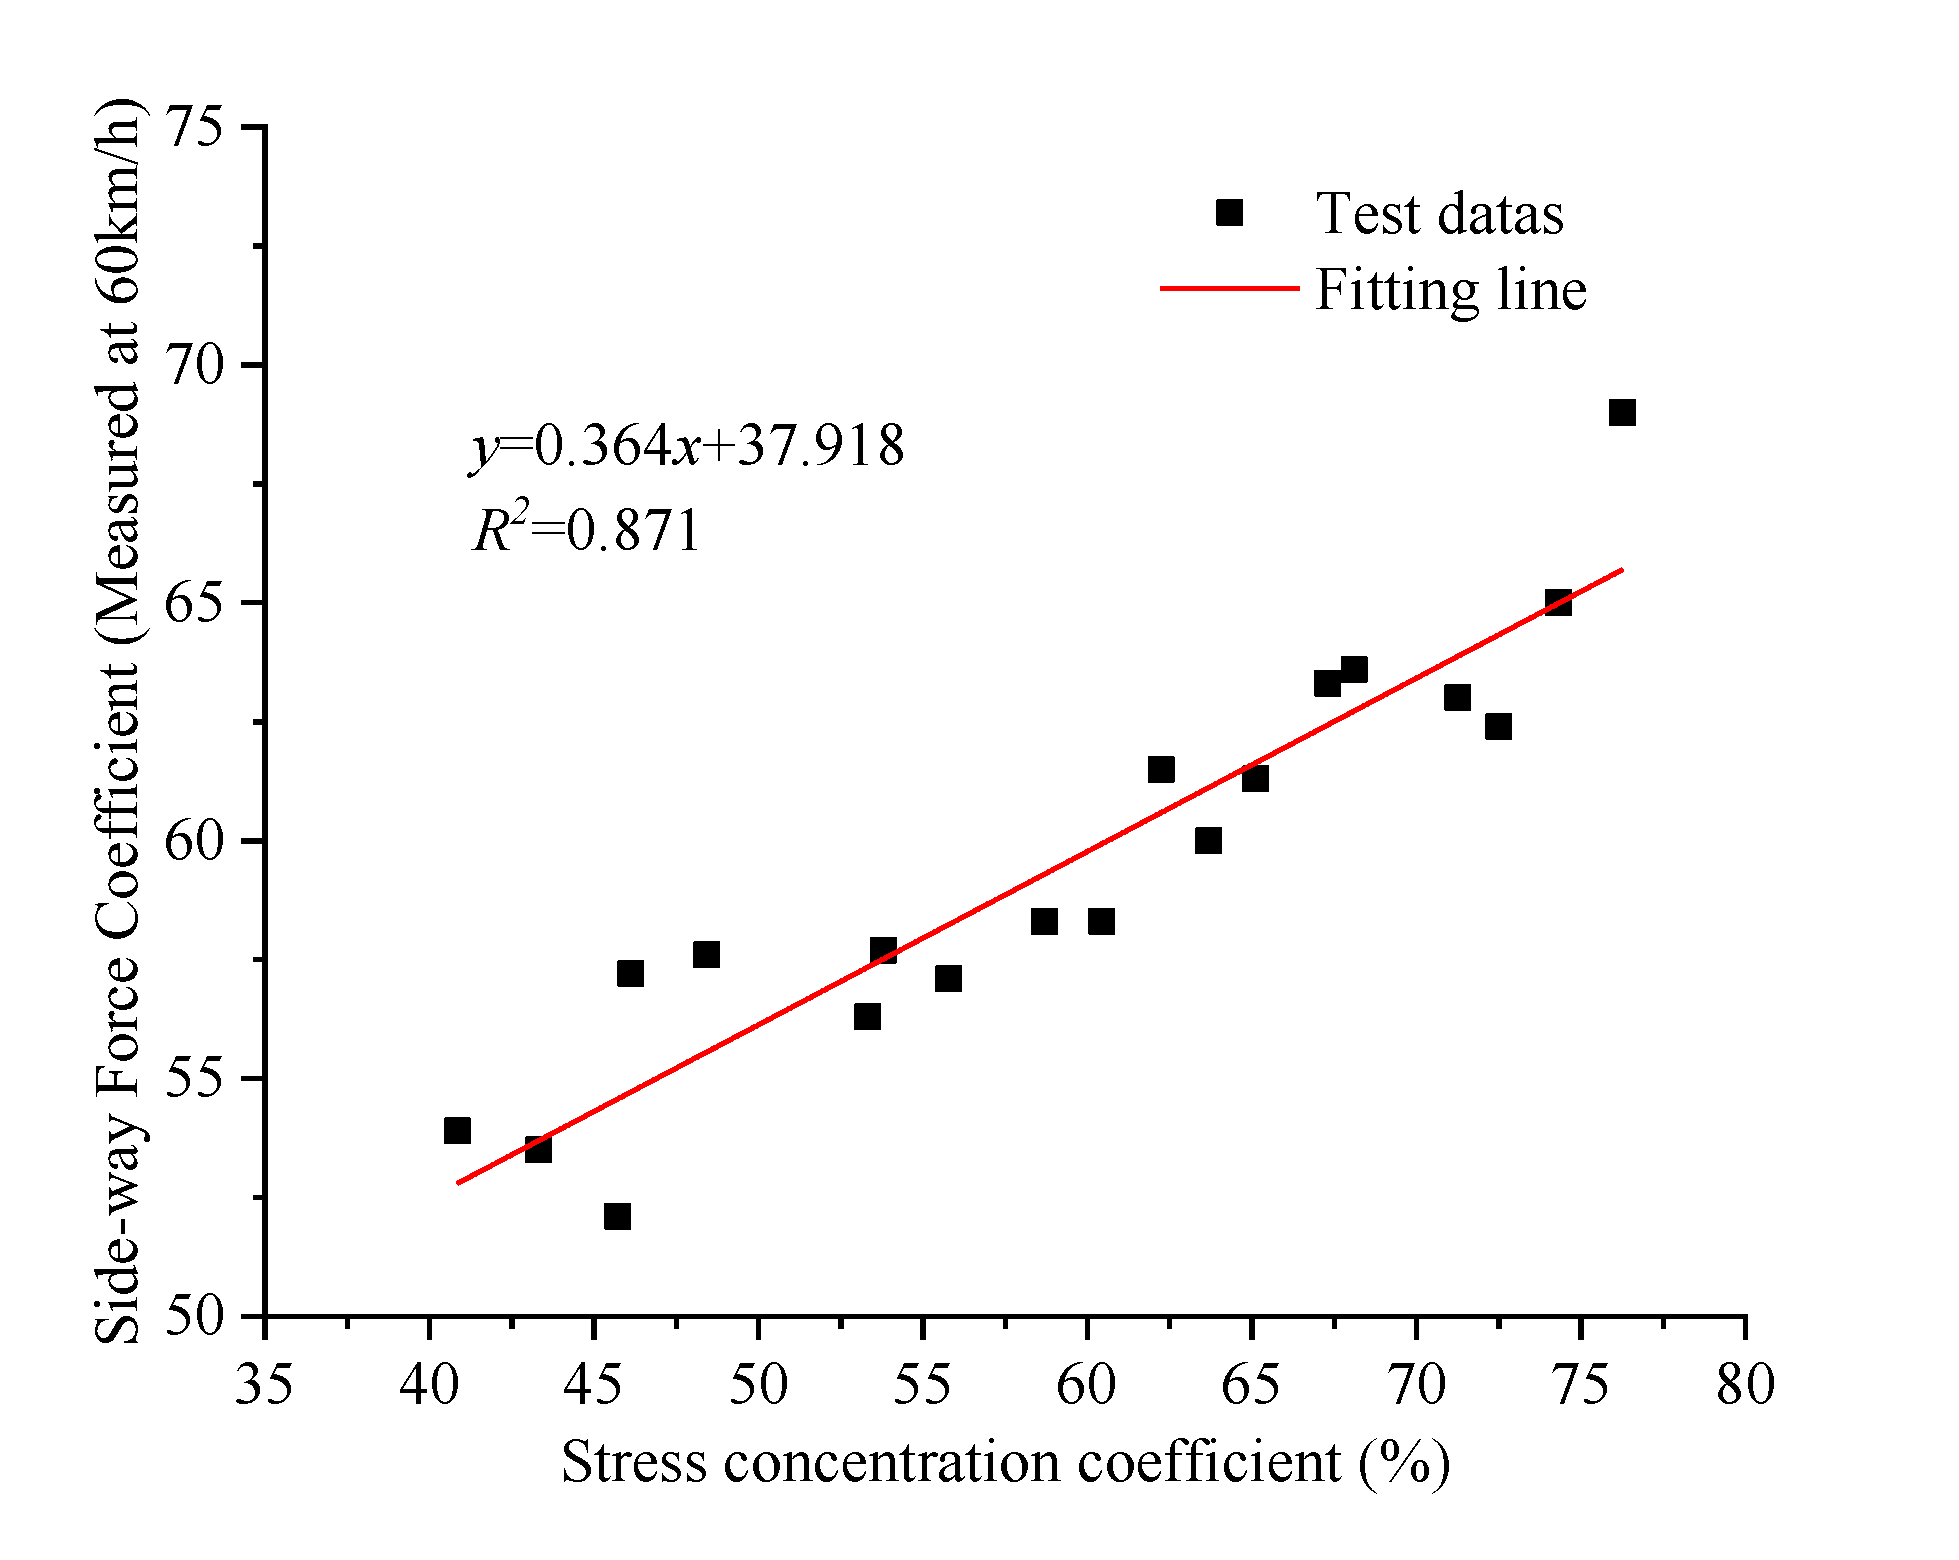
- The stress concentration coefficient and SFC (measured at 60 km/h) exhibited a good linear correlation, indicating that the stress concentration coefficient can effectively characterize the skid-resistance performance of textured concrete pavements.
Author Contributions
Funding
Institutional Review Board Statement
Informed Consent Statement
Data Availability Statement
Conflicts of Interest
References
- Rith, M.; Kim, Y.K.; Lee, S.W. Characterization of long-term skid resistance in exposed aggregate concrete pavement. Constr. Build. Mater. 2020, 256, 119423. [Google Scholar] [CrossRef]
- Gao, L.; de Fortier Smit, A.; Prozzi, J.A.; Buddhavarapu, P.; Murphy, M.; Song, L. Milled pavement texturing to optimize skid improvements. Constr. Build. Mater. 2015, 101, 602–610. [Google Scholar] [CrossRef]
- Wasilewska, M.; Gardziejczyk, W.; Gierasimiuk, P. Evaluation of skid resistance of exposed aggregate concrete pavement in the initial exploitation period. Roads Bridges-Drog. I Mosty 2017, 16, 295–308. [Google Scholar]
- Chen, J.; Huang, X.; Zheng, B.; Zhao, R.; Liu, X.; Cao, Q.; Zhu, S. Real-time identification system of asphalt pavement texture based on the close-range photogrammetry. Constr. Build. Mater. 2019, 226, 910–919. [Google Scholar] [CrossRef]
- Lin, C.; Tongjing, W. Effect of fine aggregate angularity on skid-resistance of asphalt pavement using accelerated pavement testing. Constr. Build. Mater. 2018, 168, 41–46. [Google Scholar] [CrossRef]
- Yu, H.; Leng, Z.; Zhou, Z.; Shih, K.; Xiao, F.; Gao, Z. Optimization of preparation procedure of liquid warm mix additive modified asphalt rubber. J. Clean. Prod. 2017, 141, 336–345. [Google Scholar] [CrossRef]
- Wang, K.; Lin, L.; Li, Q.J.; Nguyen, V.; Hayhoe, G.; Larkin, A. Runway groove identification and evaluation using 1 mm 3D image data. In Proceedings of the Airfield and Highway Pavement 2013: Sustainable and Efficient Pavements, Los Angeles, CA, USA, 9–12 June 2013; pp. 730–741. [Google Scholar]
- de Oliveira, A.L.; Prudêncio, L.R., Jr. Evaluation of the superficial texture of concrete pavers using digital image processing. J. Constr. Eng. Manag. 2015, 141, 04015034. [Google Scholar] [CrossRef]
- White, G. State of the art: Asphalt for airport pavement surfacing. Int. J. Pavement Res. Technol. 2018, 11, 77–98. [Google Scholar] [CrossRef]
- Pranjić, I.; Deluka-Tibljaš, A.; Cuculić, M.; Šurdonja, S. Influence of pavement surface macrotexture on pavement skid resistance. Transp. Res. Procedia 2020, 45, 747–754. [Google Scholar] [CrossRef]
- Fwa, T.; Ong, G.P. Transverse pavement grooving against hydroplaning. II: Design. J. Transp. Eng. 2006, 132, 449–457. [Google Scholar] [CrossRef]
- Zhang, Z.; Luan, B.; Liu, X.; Zhang, M. Effects of surface texture on tire-pavement noise and skid resistance in long freeway tunnels: From field investigation to technical practice. Appl. Acoust. 2020, 160, 107120. [Google Scholar] [CrossRef]
- Kogbara, R.B.; Masad, E.A.; Kassem, E.; Scarpas, A.; Anupam, K. A state-of-the-art review of parameters influencing measurement and modeling of skid resistance of asphalt pavements. Constr. Build. Mater. 2016, 114, 602–617. [Google Scholar] [CrossRef]
- Plati, C. Sustainability factors in pavement materials, design, and preservation strategies: A literature review. Constr. Build. Mater. 2019, 211, 539–555. [Google Scholar] [CrossRef]
- Chen, L.; Cong, L.; Dong, Y.; Yang, G.; Tang, B.; Wang, X.; Gong, H. Investigation of influential factors of tire/pavement noise: A multilevel Bayesian analysis of full-scale track testing data. Constr. Build. Mater. 2021, 270, 121484. [Google Scholar] [CrossRef]
- Yu, H.; Zhu, Z.; Leng, Z.; Wu, C.; Zhang, Z.; Wang, D.; Oeser, M. Effect of mixing sequence on asphalt mixtures containing waste tire rubber and warm mix surfactants. J. Clean. Prod. 2020, 246, 119008. [Google Scholar] [CrossRef]
- Zhang, S.; Wang, D.; Guo, F.; Deng, Y.; Feng, F.; Wu, Q.; Chen, Z.; Li, Y. Properties investigation of the SBS modified asphalt with a compound warm mix asphalt (WMA) fashion using the chemical additive and foaming procedure. J. Clean. Prod. 2021, 319, 128789. [Google Scholar] [CrossRef]
- Guada, I.; Rezaei, A.; Harvey, J.; Spinner, D. Evaluation of Grind and Groove (Next Generation Concrete Surface) Pilot Projects in California; Working Paper Series; Institute of Transportation Studies: Berkeley, CA, USA, 2012. [Google Scholar]
- Skarabis, J.; Stöckert, U. Noise emission of concrete pavement surfaces produced by diamond grinding. J. Traffic Transp. Eng. Engl. Ed. 2015, 2, 81–92. [Google Scholar] [CrossRef] [Green Version]
- Ling, S.; Yu, F.; Sun, D.; Sun, G.; Xu, L. A comprehensive review of tire-pavement noise: Generation mechanism, measurement methods, and quiet asphalt pavement. J. Clean. Prod. 2021, 287, 125056. [Google Scholar] [CrossRef]
- Beji, A.; Deboudt, K.; Khardi, S.; Muresan, B.; Lumière, L. Determinants of rear-of-wheel and tire-road wear particle emissions by light-duty vehicles using on-road and test track experiments. Atmos. Pollut. Res. 2021, 12, 278–291. [Google Scholar] [CrossRef]
- Ran, S.; Besselink, I.; Nijmeijer, H. Energy Balance and Tyre Motions During Shimmy. In Proceedings of the 4th International Tyre Colloquium, Guilford, UK, 20–21 April 2015; University of Surrey: Guildford, UK, 2015; pp. 129–138. [Google Scholar]
- Mi, T.; Stepan, G.; Takacs, D.; Chen, N.; Zhang, N. Model establishment and parameter analysis on shimmy of electric vehicle with independent suspensions. Procedia IUTAM 2017, 22, 259–266. [Google Scholar] [CrossRef]
- Yu, M.; Xiao, B.; You, Z.; Wu, G.; Li, X.; Ding, Y. Dynamic friction coefficient between tire and compacted asphalt mixtures using tire-pavement dynamic friction analyzer. Constr. Build. Mater. 2020, 258, 119492. [Google Scholar] [CrossRef]
- Zhuravlev, V.P.; Klimov, D.; Plotnikov, P. A new model of shimmy. Mech. Solids 2013, 48, 490–499. [Google Scholar] [CrossRef]
- Araújo, J.P.C.; Palha, C.A.O.; Martins, F.F.; Silva, H.M.R.D.; Oliveira, J.R.M. Estimation of energy consumption on the tire-pavement interaction for asphalt mixtures with different surface properties using data mining techniques. Transp. Res. Part D Transp. Environ. 2019, 67, 421–432. [Google Scholar] [CrossRef] [Green Version]
- Yu, M.; You, Z.; Wu, G.; Kong, L.; Liu, C.; Gao, J. Measurement and modeling of skid resistance of asphalt pavement: A review. Constr. Build. Mater. 2020, 260, 119878. [Google Scholar] [CrossRef]
- Lee, Y.; Yurong, L.; Ying, L.; Fwa, T.; Choo, Y. Skid resistance prediction by computer simulation. In Proceedings of the Applications of Advanced Technologies in Transportation Engineering (2004), Beijing, China, 24–26 May 2004; pp. 465–469. [Google Scholar]
- Bawono, A.A.; Lechner, B.; Yang, E.-H. Skid resistance and surface water drainage performance of engineered cementitious composites for pavement applications. Cem. Concr. Compos. 2019, 104, 103387. [Google Scholar] [CrossRef]
- Yu, H.; Deng, G.; Zhang, Z.; Zhu, M.; Gong, M.; Oeser, M. Workability of rubberized asphalt from a perspective of particle effect. Transp. Res. Part D: Transp. Environ. 2021, 91, 102712. [Google Scholar] [CrossRef]
- Yu, H.; Leng, Z.; Dong, Z.; Tan, Z.; Guo, F.; Yan, J. Workability and mechanical property characterization of asphalt rubber mixtures modified with various warm mix asphalt additives. Constr. Build. Mater. 2018, 175, 392–401. [Google Scholar] [CrossRef]
- Xu, C.; Wang, D.; Zhang, S.; Guo, E.; Luo, H.; Zhang, Z.; Yu, H. Effect of Lignin Modifier on Engineering Performance of Bituminous Binder and Mixture. Polymers 2021, 13, 1083. [Google Scholar] [CrossRef]
- Zhang, X.; Liu, T.; Liu, C.; Chen, Z. Research on skid resistance of asphalt pavement based on three-dimensional laser-scanning technology and pressure-sensitive film. Constr. Build. Mater. 2014, 69, 49–59. [Google Scholar] [CrossRef]
- Araujo, V.M.C.; Bessa, I.S.; Castelo Branco, V.T.F. Measuring skid resistance of hot mix asphalt using the aggregate image measurement system (AIMS). Constr. Build. Mater. 2015, 98, 476–481. [Google Scholar] [CrossRef]
- Liu, Y.; Tian, B.; Niu, K.-M. Research on skid resistance and noise reduction properties of cement concrete pavements with different surface textures. J. Highw. Transp. Res. Dev. Engl. Ed. 2013, 7, 22–27. [Google Scholar] [CrossRef]
- Deng, Q.; Zhan, Y.; Liu, C.; Qiu, Y.; Zhang, A. Multiscale power spectrum analysis of 3D surface texture for prediction of asphalt pavement friction. Constr. Build. Mater. 2021, 293, 123506. [Google Scholar] [CrossRef]
- Uz, V.E.; Gökalp, İ. Comparative laboratory evaluation of macro texture depth of surface coatings with standard volumetric test methods. Constr. Build. Mater. 2017, 139, 267–276. [Google Scholar] [CrossRef]
- Chu, L.; Cui, X.; Zhang, K.; Fwa, T.F.; Han, S. Directional Skid Resistance Characteristics of Road Pavement: Implications for Friction Measurements by British Pendulum Tester and Dynamic Friction Tester. Transp. Res. Rec. 2019, 2673, 793–803. [Google Scholar] [CrossRef]
- Guo, F.; Pei, J.; Zhang, J.; Li, R.; Zhou, B.; Chen, Z. Study on the skid resistance of asphalt pavement: A state-of-the-art review and future prospective. Constr. Build. Mater. 2021, 303, 124411. [Google Scholar] [CrossRef]
- Liang, J.; Gu, X.; Deng, H.; Ni, F. Detecting device and technology of pavement texture depth based on high precision 3D laser scanning technology. IOP Conf. Ser. Mater. Sci. Eng. 2019, 652, 012063. [Google Scholar] [CrossRef]
- Lee, M.-H.; Chou, C.-P.; Li, K.-H. Automatic measurement of runway grooving construction for pavement skid evaluation. Autom. Constr. 2009, 18, 856–863. [Google Scholar] [CrossRef]
- Zheng, M.; Tian, Y.; Wang, X.; Peng, P. Research on Grooved Concrete Pavement Based on the Durability of Its Anti-Skid Performance. Appl. Sci. 2018, 8, 891. [Google Scholar] [CrossRef] [Green Version]
- Dong, S.; Han, S.; Zhang, Q.; Han, X.; Zhang, Z.; Yao, T. Three-dimensional evaluation method for asphalt pavement texture characteristics. Constr. Build. Mater. 2021, 287, 122966. [Google Scholar] [CrossRef]
- Persson, B. Theory of rubber friction and contact mechanics. J. Chem. Phys. 2001, 115. [Google Scholar] [CrossRef] [Green Version]
- Al-Assi, M.; Kassem, E. Evaluation of adhesion and hysteresis friction of rubber–pavement system. Appl. Sci. 2017, 7, 1029. [Google Scholar] [CrossRef] [Green Version]
- Chen, B.; Zhang, X.; Yu, J.; Wang, Y. Impact of contact stress distribution on skid resistance of asphalt pavements. Constr. Build. Mater. 2017, 133, 330–339. [Google Scholar] [CrossRef]
- Nicolosi, V.; D’Apuzzo, M.; Evangelisti, A. Cumulated frictional dissipated energy and pavement skid deterioration: Evaluation and correlation. Constr. Build. Mater. 2020, 263, 120020. [Google Scholar] [CrossRef]
- Liang, K.; Tu, Q.-Z.; Shen, X.-M.; Fang, Z.-H.; Yang, X.; Zhang, Y.; Xiang, H.-Y. An improved LuGre model for calculating static steering torque of rubber tracked chassis. Def. Technol. 2021. [Google Scholar] [CrossRef]
- Yunchao, W.; Feng, P.; Pang, W.; Zhou, M. Pivot steering resistance torque based on tire torsion deformation. J. Terramechanics 2014, 52, 47–55. [Google Scholar] [CrossRef]
- Hou, Y.; Zhang, H.; Wu, J.; Wang, L.; Xiong, H. Study on the microscopic friction between tire and asphalt pavement based on molecular dynamics simulation. Int. J. Pavement Res. Technol. 2018, 11, 205–212. [Google Scholar] [CrossRef]


| Contact Interface | a | b | c | R2 |
|---|---|---|---|---|
| Asphalt pavement without grooves | 0.2068 | 0.9199 | 0.6558 | 0.999 |
| Curved grooves | 0.1987 | 1.4898 | 0.7052 | 0.998 |
| Rectangular grooves | 0.1645 | 1.2691 | 0.8465 | 0.998 |
| Concrete pavements with no grooves | 0.1809 | 0.4947 | 0.9754 | 0.999 |
| Initial Setting Time/min | Final Setting Time/min | Seven-Days Bending Strength/MPa | Compressive Strength/MPa |
|---|---|---|---|
| 235 | 287 | 4.95 | 38.1 |
| Material | Cement | Sand | 10–30 mm | 10–20 mm | 5–10 mm | Water | CNF-13 | Water–Cement Ratio |
|---|---|---|---|---|---|---|---|---|
| Amount/(kg) | 378 | 691 | 706 | 449 | 128 | 140 | 7.6 | 0.37 |
| Weight ratio | 1 | 1.828 | 1.868 | 1.188 | 0.34 | 0.37 | 0.02 |
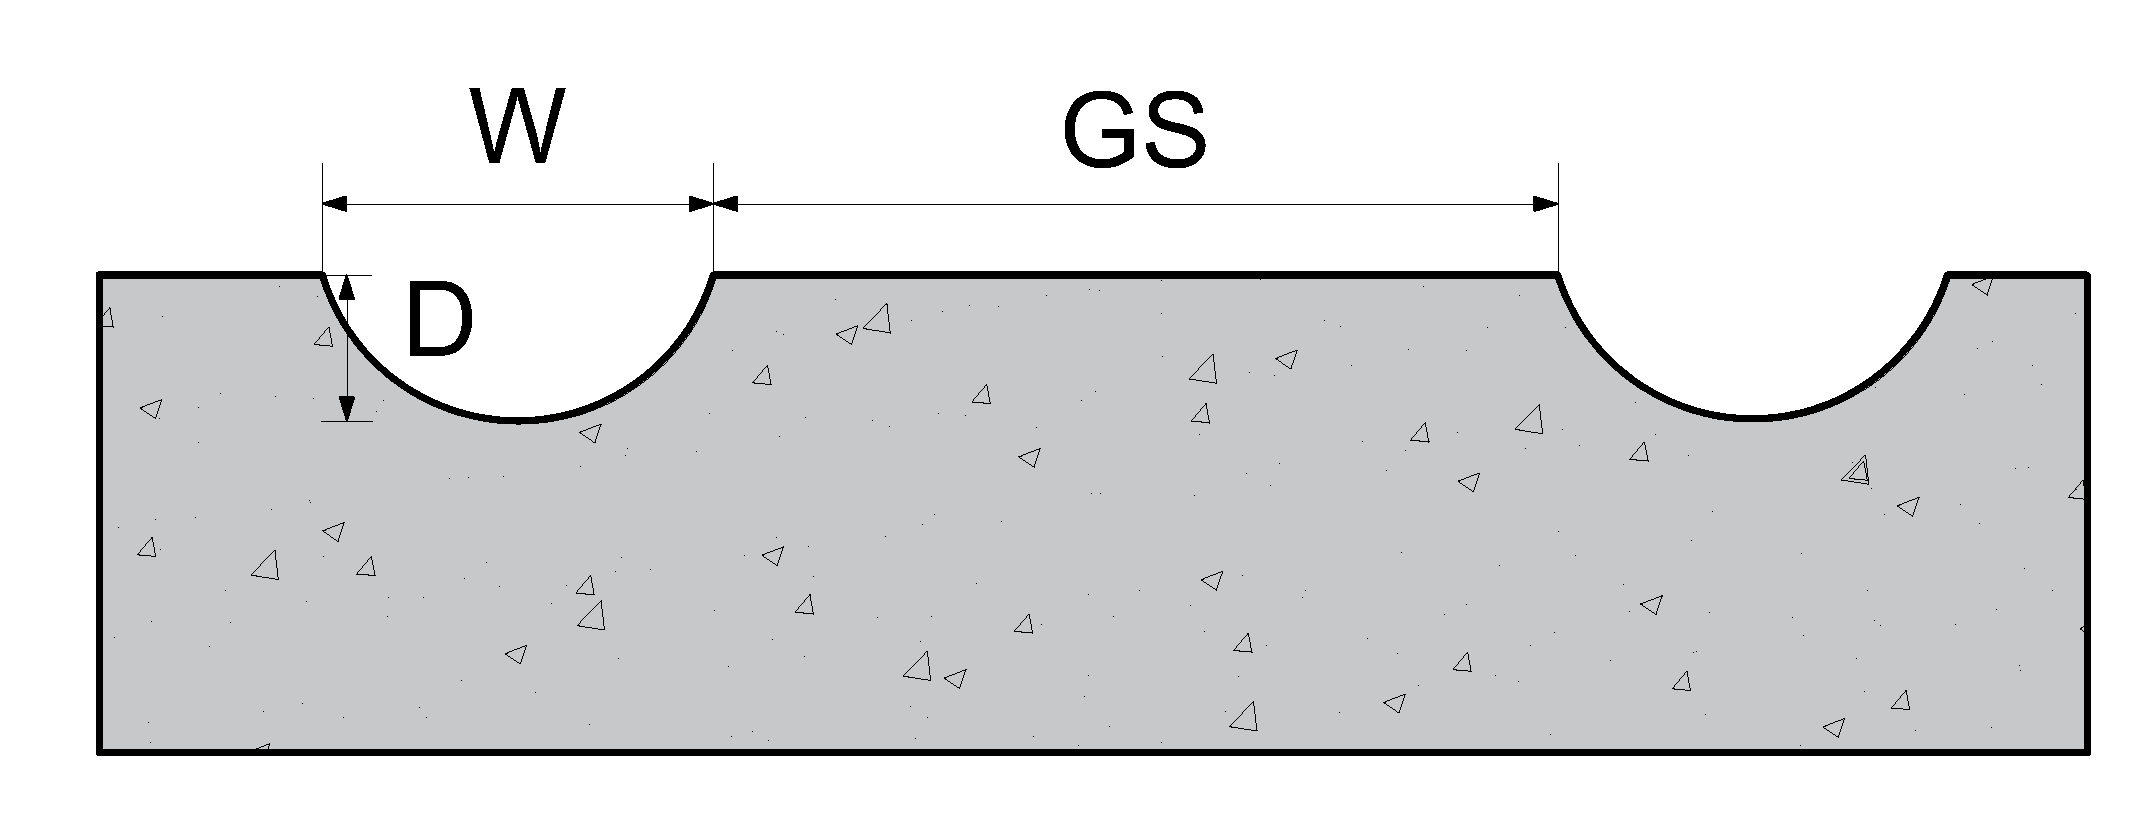
| Test No. | W/mm | D/mm | GS/mm |
|---|---|---|---|
| 1 | 6 | 1 | 0 |
| 2 | 6 | 2 | 15 |
| 3 | 6 | 3 | 25 |
| 4 | 8 | 1 | 15 |
| 5 | 8 | 2 | 25 |
| 6 | 8 | 3 | 0 |
| 7 | 10 | 1 | 25 |
| 8 | 10 | 2 | 0 |
| 9 | 10 | 3 | 15 |
| Test No. | Texture Depth/mm | Stress Concentration Coefficient/% | Stationary Steering Resistance Torque/N·m |
|---|---|---|---|
| 1 | 0.72 | 47.64 | 531.89 |
| 2 | 0.80 | 52.63 | 555.31 |
| 3 | 0.86 | 55.33 | 607.80 |
| 4 | 0.76 | 51.84 | 540.62 |
| 5 | 0.64 | 51.90 | 640.19 |
| 6 | 1.02 | 60.79 | 591.57 |
| 7 | 0.61 | 47.43 | 547.07 |
| 8 | 0.72 | 53.09 | 554.13 |
| 9 | 1.08 | 59.32 | 549.32 |
| Results | Level Factors | |||
|---|---|---|---|---|
| W | D | GS | ||
| Texture depth | K11 | 2.38 | 2.09 | 2.46 |
| K21 | 2.42 | 2.16 | 2.64 | |
| K31 | 2.41 | 2.96 | 2.11 | |
| Rj | 0.01 | 0.29 | 0.18 | |
| Stress concentration coefficient | K12 | 155.6 | 146.91 | 161.52 |
| K22 | 164.53 | 157.62 | 163.79 | |
| K32 | 159.84 | 175.44 | 154.66 | |
| Rj | 2.98 | 9.51 | 3.04 | |
| Stationary steering resistance torque | K13 | 1695 | 1619.58 | 1677.59 |
| K23 | 1772.38 | 1749.63 | 1645.25 | |
| K33 | 1650.52 | 1748.69 | 1795.06 | |
| Rj | 40.62 | 43.35 | 49.94 | |
| Evaluation Index | Factors | Sum of Square between Groups | Degree of Freedom | f Value | Significance Degree |
|---|---|---|---|---|---|
| Texture depth | W | 2.89 × 10⁻⁴ | 2 | 0.14 | not significant |
| D | 1.56 × 10⁻¹ | 2 | 77.02 | moderately significant | |
| GS | 4.84 × 10⁻² | 2 | 23.95 | moderately significant | |
| Stress concentration coefficient | W | 13.30 | 2 | 19.10 | moderately significant |
| D | 138.47 | 2 | 198.82 | highly significant | |
| GS | 15.06 | 2 | 21.63 | moderately significant | |
| Stationary steering resistance torque | W | 2535.11 | 2 | 19.29 | moderately significant |
| D | 3731.48 | 2 | 28.39 | moderately significant | |
| GS | 4143.12 | 2 | 31.53 | moderately significant |
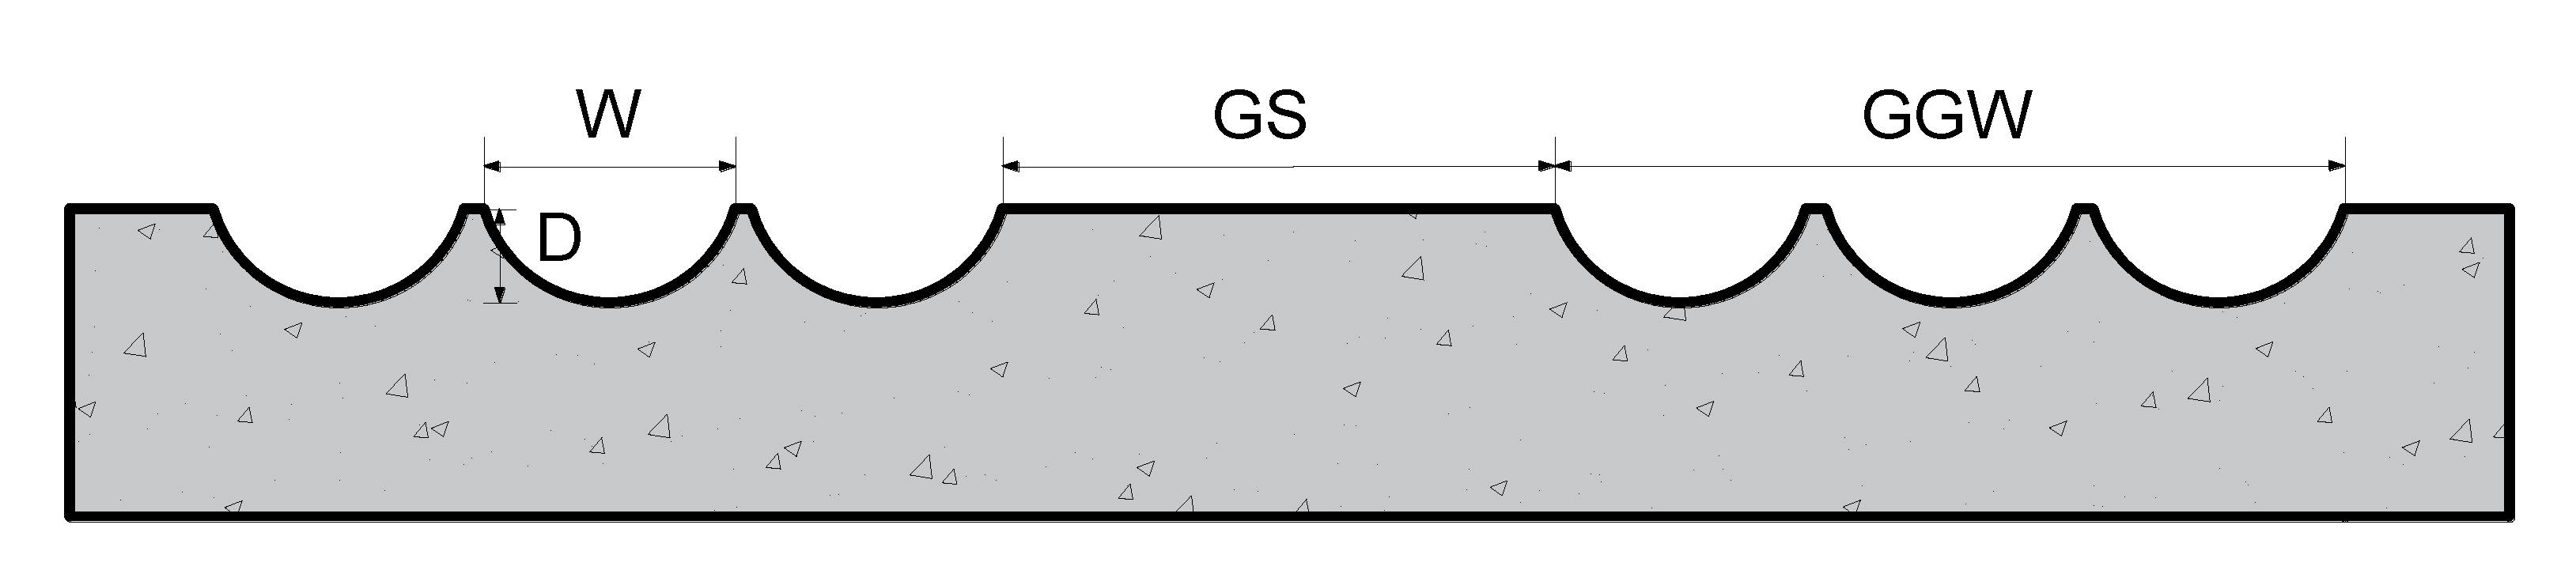
| No. | W | D | GS | GGW |
|---|---|---|---|---|
| T-1 | 8 | 3 | 0 | 8 |
| T-2 | 8 | 3 | 15 | 8 |
| T-3 | 8 | 3 | 15 | 30 |
| T-4 | 8 | 3 | 15 | 50 |
| T-5 | 8 | 3 | 15 | 70 |
| T-6 | Parameters of rectangular groove: 8 mm in width; 3 mm in depth; 15 mm in spacing. | |||
| Lateral Speed (cm/min) | Wheel Movement Frequency (times/min) | Pressure (MPa) |
|---|---|---|
| 10 | 42 ± 1 | 0.7 |
| Parameter Combination | A | B | C | R2 |
|---|---|---|---|---|
| T-1 | 15.166 | −0.238 | 45.184 | 0.983 |
| T-2 | 13.428 | −0.159 | 37.039 | 0.995 |
| T-3 | 10.511 | −0.270 | 45.835 | 0.965 |
| T-4 | 11.421 | −0.279 | 48.196 | 0.991 |
| T-5 | 13.446 | −0.240 | 46.467 | 0.995 |
| T-6 | 16.420 | −0.167 | 24.369 | 0.980 |
| Parameter Combination | A | B | C | R2 |
|---|---|---|---|---|
| T-1 | 52.416 | −0.347 | 547.305 | 0.992 |
| T-2 | 31.743 | −0.304 | 534.328 | 0.988 |
| T-3 | 51.984 | −0.152 | 525.004 | 0.977 |
| T-4 | 40.137 | −0.203 | 535.196 | 0.978 |
| T-5 | 36.042 | −0.146 | 537.679 | 0.970 |
| T-6 | 26.407 | −0.371 | 536.948 | 0.990 |
Publisher’s Note: MDPI stays neutral with regard to jurisdictional claims in published maps and institutional affiliations. |
© 2021 by the authors. Licensee MDPI, Basel, Switzerland. This article is an open access article distributed under the terms and conditions of the Creative Commons Attribution (CC BY) license (https://creativecommons.org/licenses/by/4.0/).
Share and Cite
Yu, J.; Zhang, B.; Long, P.; Chen, B.; Guo, F. Optimizing the Texturing Parameters of Concrete Pavement by Balancing Skid-Resistance Performance and Driving Stability. Materials 2021, 14, 6137. https://doi.org/10.3390/ma14206137
Yu J, Zhang B, Long P, Chen B, Guo F. Optimizing the Texturing Parameters of Concrete Pavement by Balancing Skid-Resistance Performance and Driving Stability. Materials. 2021; 14(20):6137. https://doi.org/10.3390/ma14206137
Chicago/Turabian StyleYu, Jiangmiao, Binhui Zhang, Peiqi Long, Bo Chen, and Feng Guo. 2021. "Optimizing the Texturing Parameters of Concrete Pavement by Balancing Skid-Resistance Performance and Driving Stability" Materials 14, no. 20: 6137. https://doi.org/10.3390/ma14206137
APA StyleYu, J., Zhang, B., Long, P., Chen, B., & Guo, F. (2021). Optimizing the Texturing Parameters of Concrete Pavement by Balancing Skid-Resistance Performance and Driving Stability. Materials, 14(20), 6137. https://doi.org/10.3390/ma14206137