
Urea-Assisted Synthesis of Mesoporous TiO2 Photocatalysts for the Efficient Removal of Clofibric Acid from Water

 ,
, 

Abstract
1. Introduction
2. Materials and Methods
2.1. Chemicals
2.2. Catalyst Preparation
- (1)
- Mixture A: First, 9.1 g CTAB was dissolved for about 30 min in 55 mL H2O under magnetic stirring (500 rpm), then 73 mL EtOH was added and the agitation was continued during the preparation of mixture B;
- (2)
- Mixture B: For this mixture, 35.5 g TTIP was magnetically stirred with 72 mL EtOH for 30 min at 1000 rpm;
- (3)
- Mixture C: Mixture B was added in drops to mixture A under continuous magnetic stirring;
- (4)
- Mixture D: A total of 37.5 g urea was dissolved in 35 mL of water under magnetic agitation and slight heating;
- (5)
- Mixture D was added dropwise to mixture C, under continuous stirring.
2.3. Characterization of the Solids
2.4. Photocatalytic Activity Evaluation
3. Results and Discussion
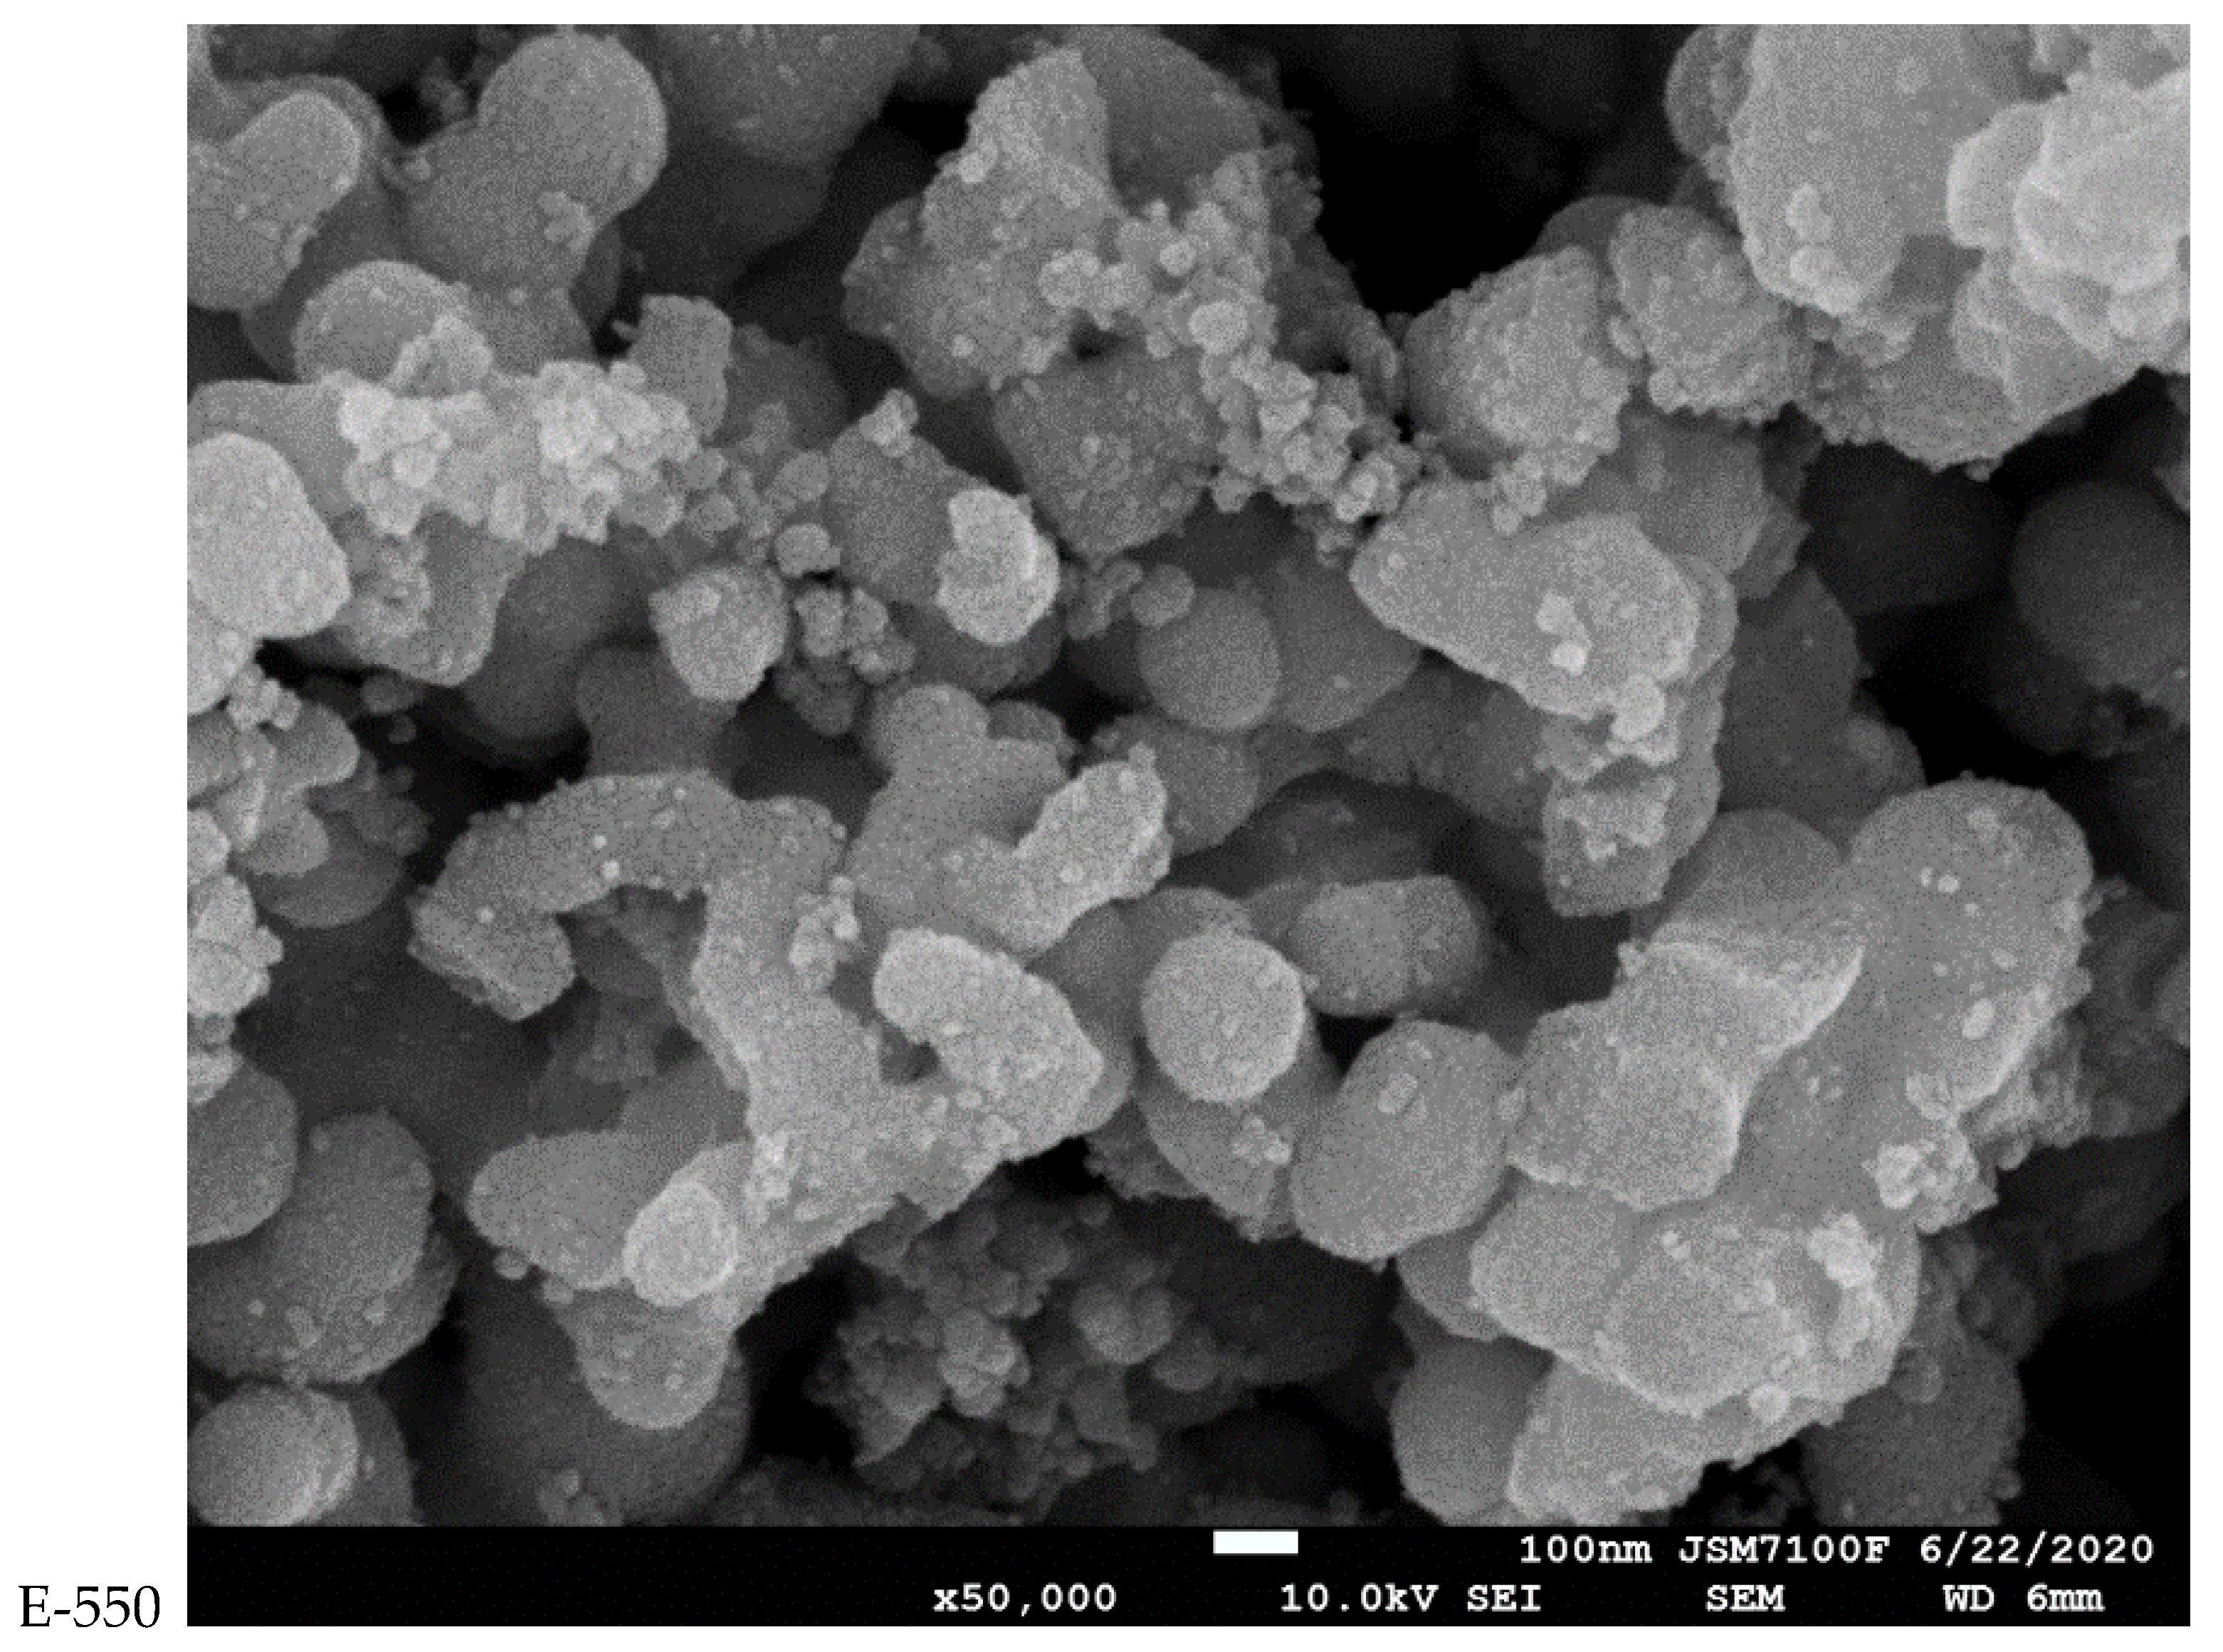
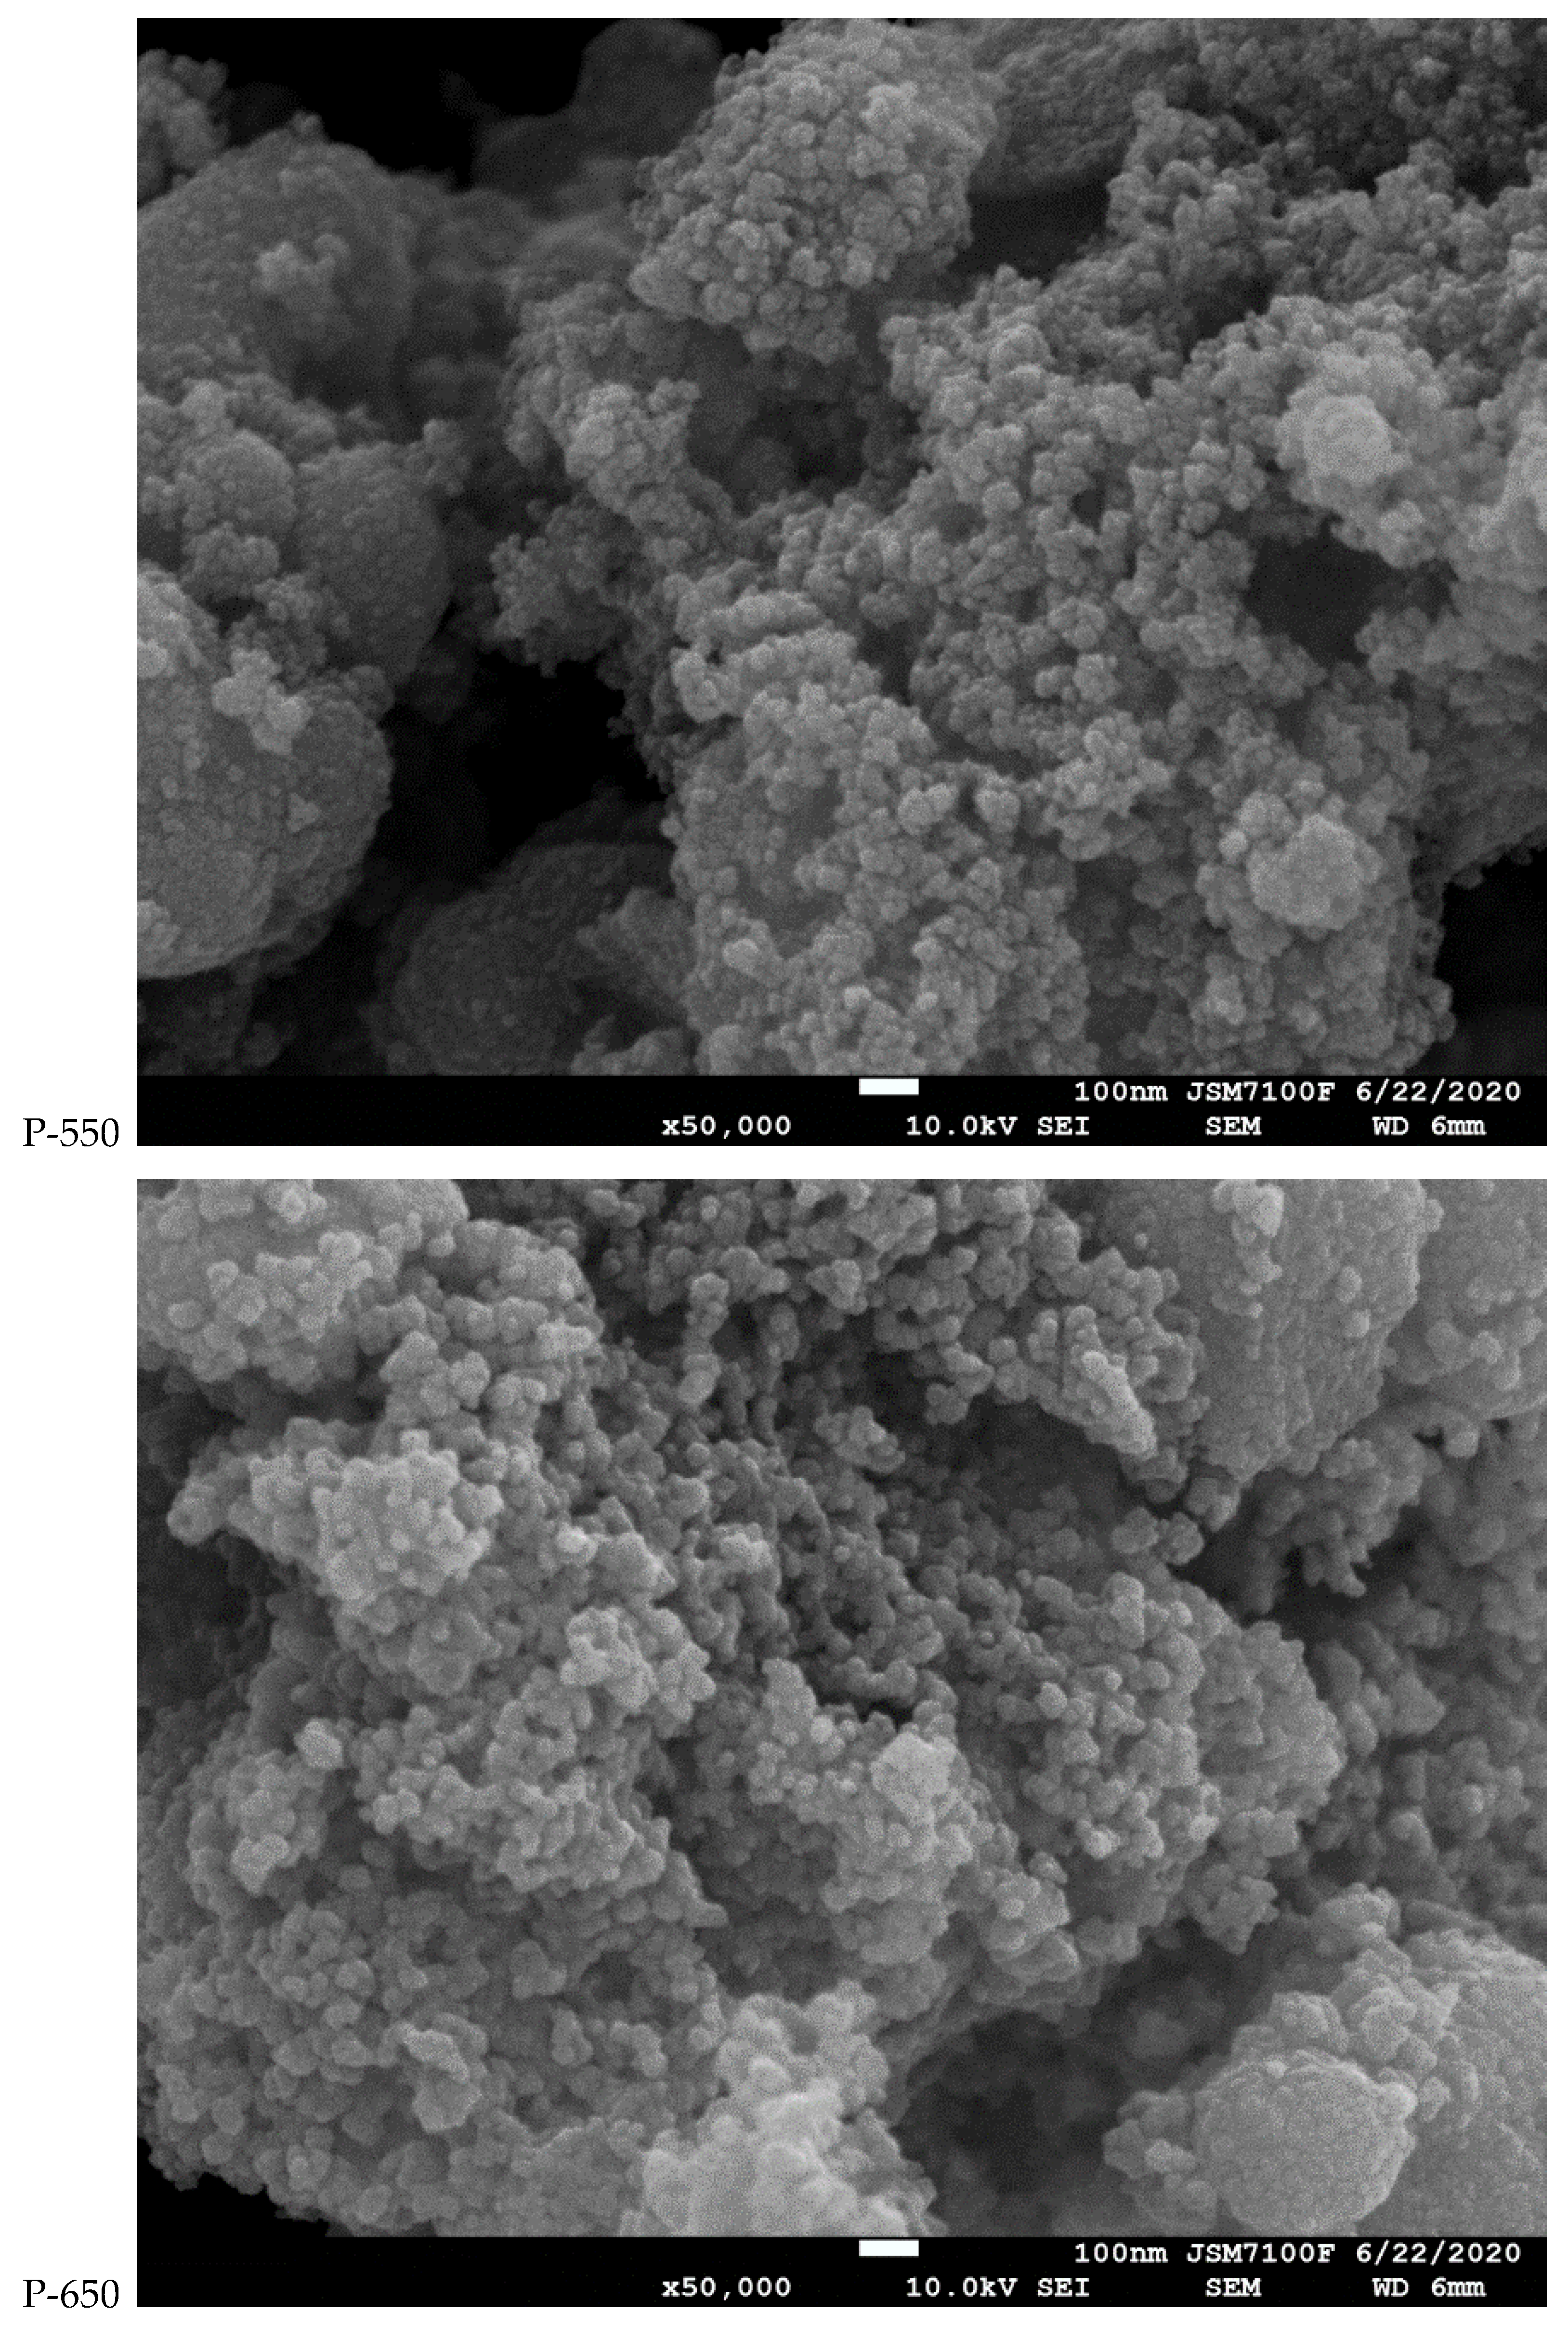
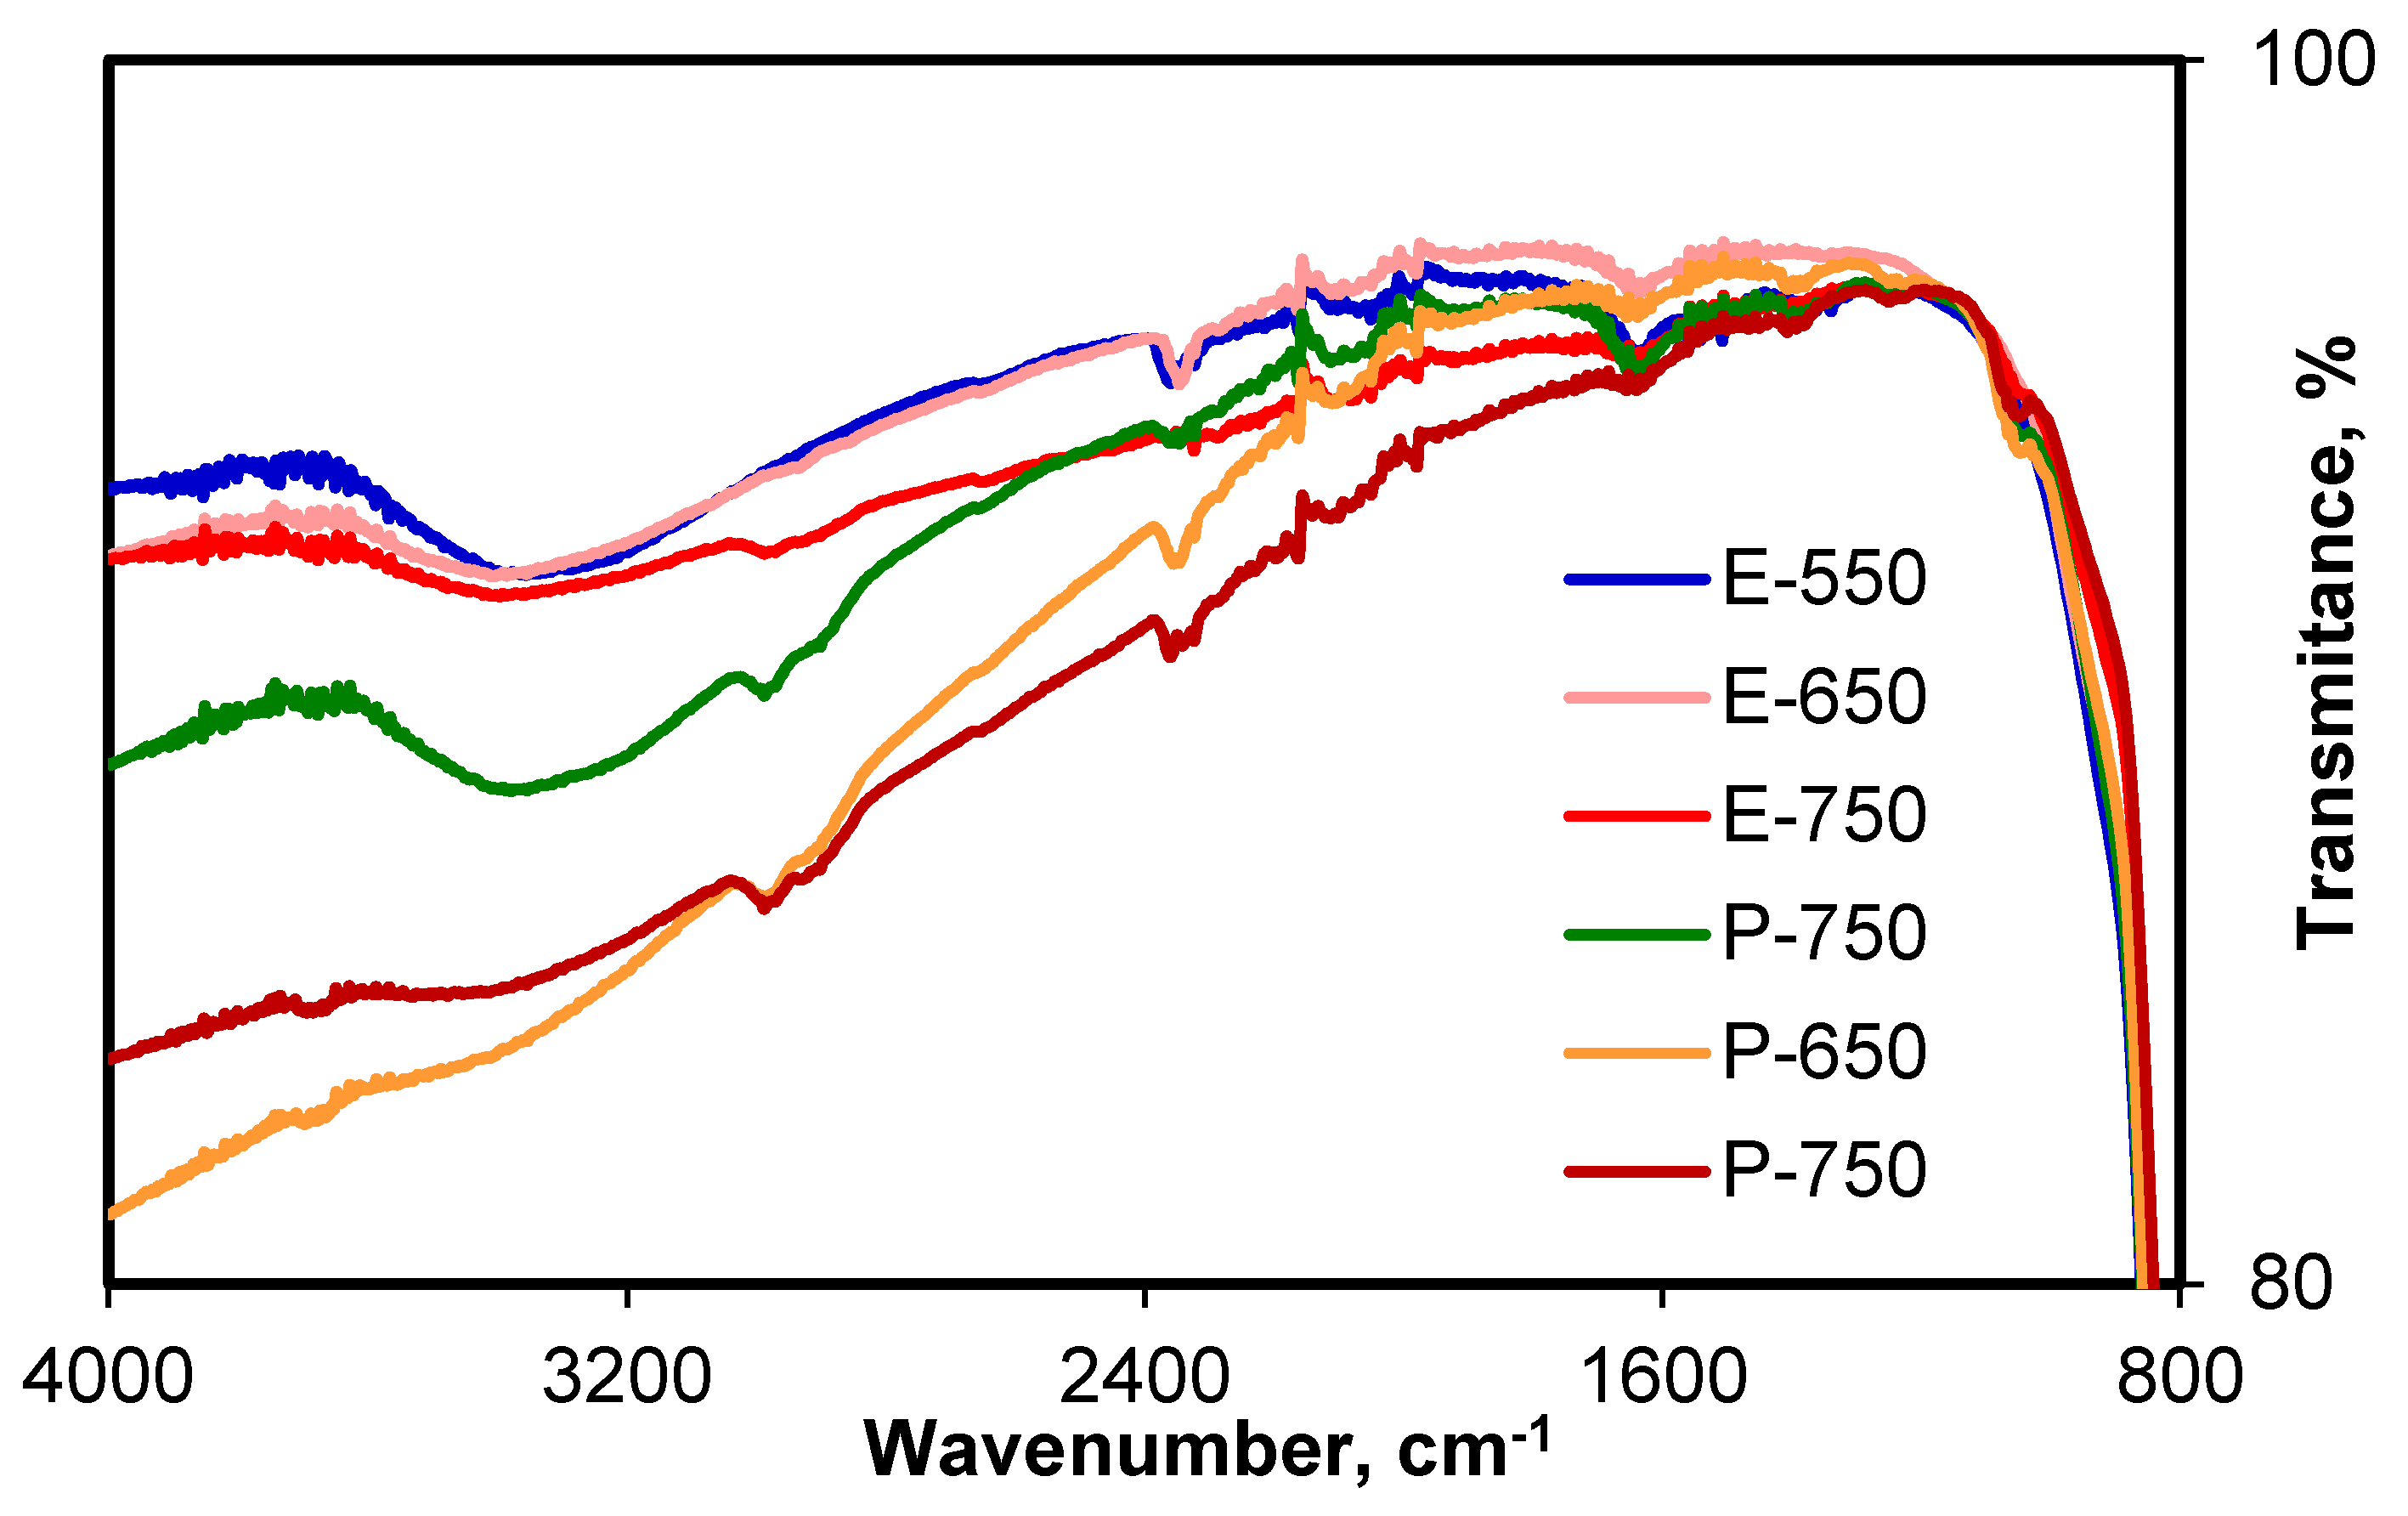
3.1. Structural and Textural Investigations
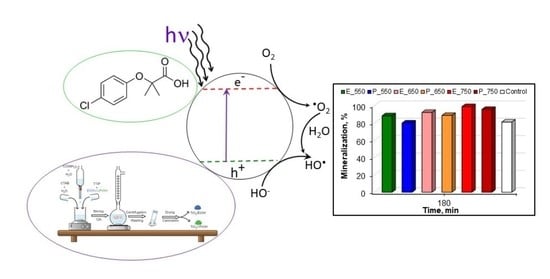
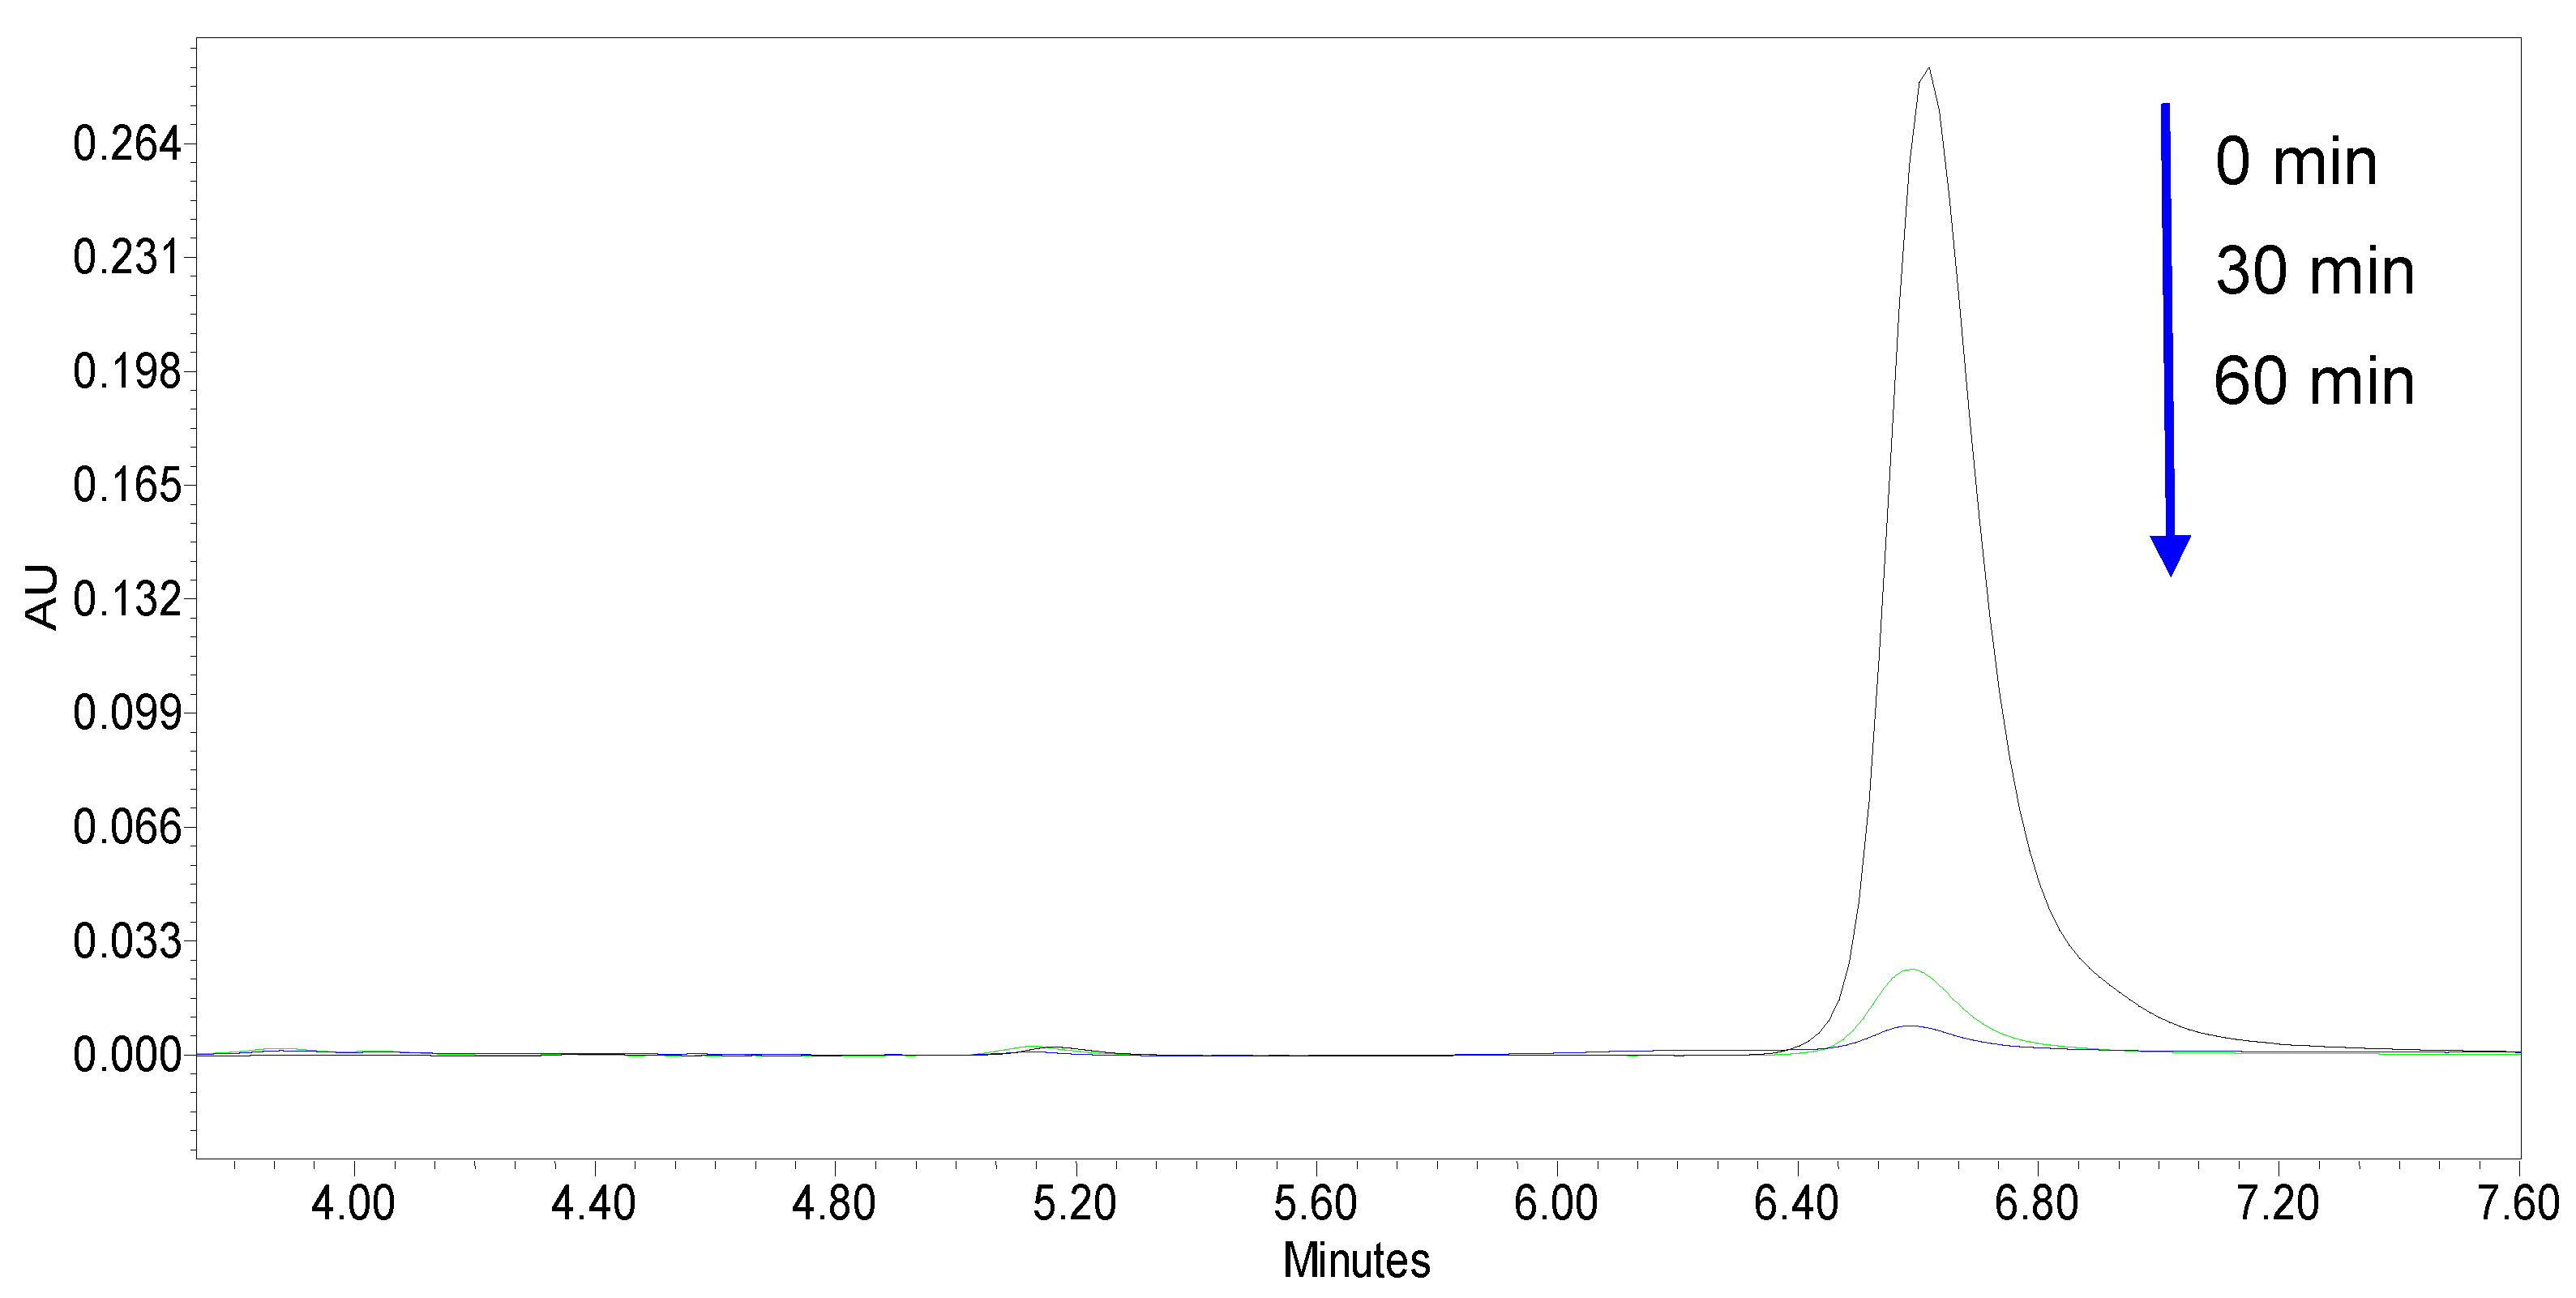
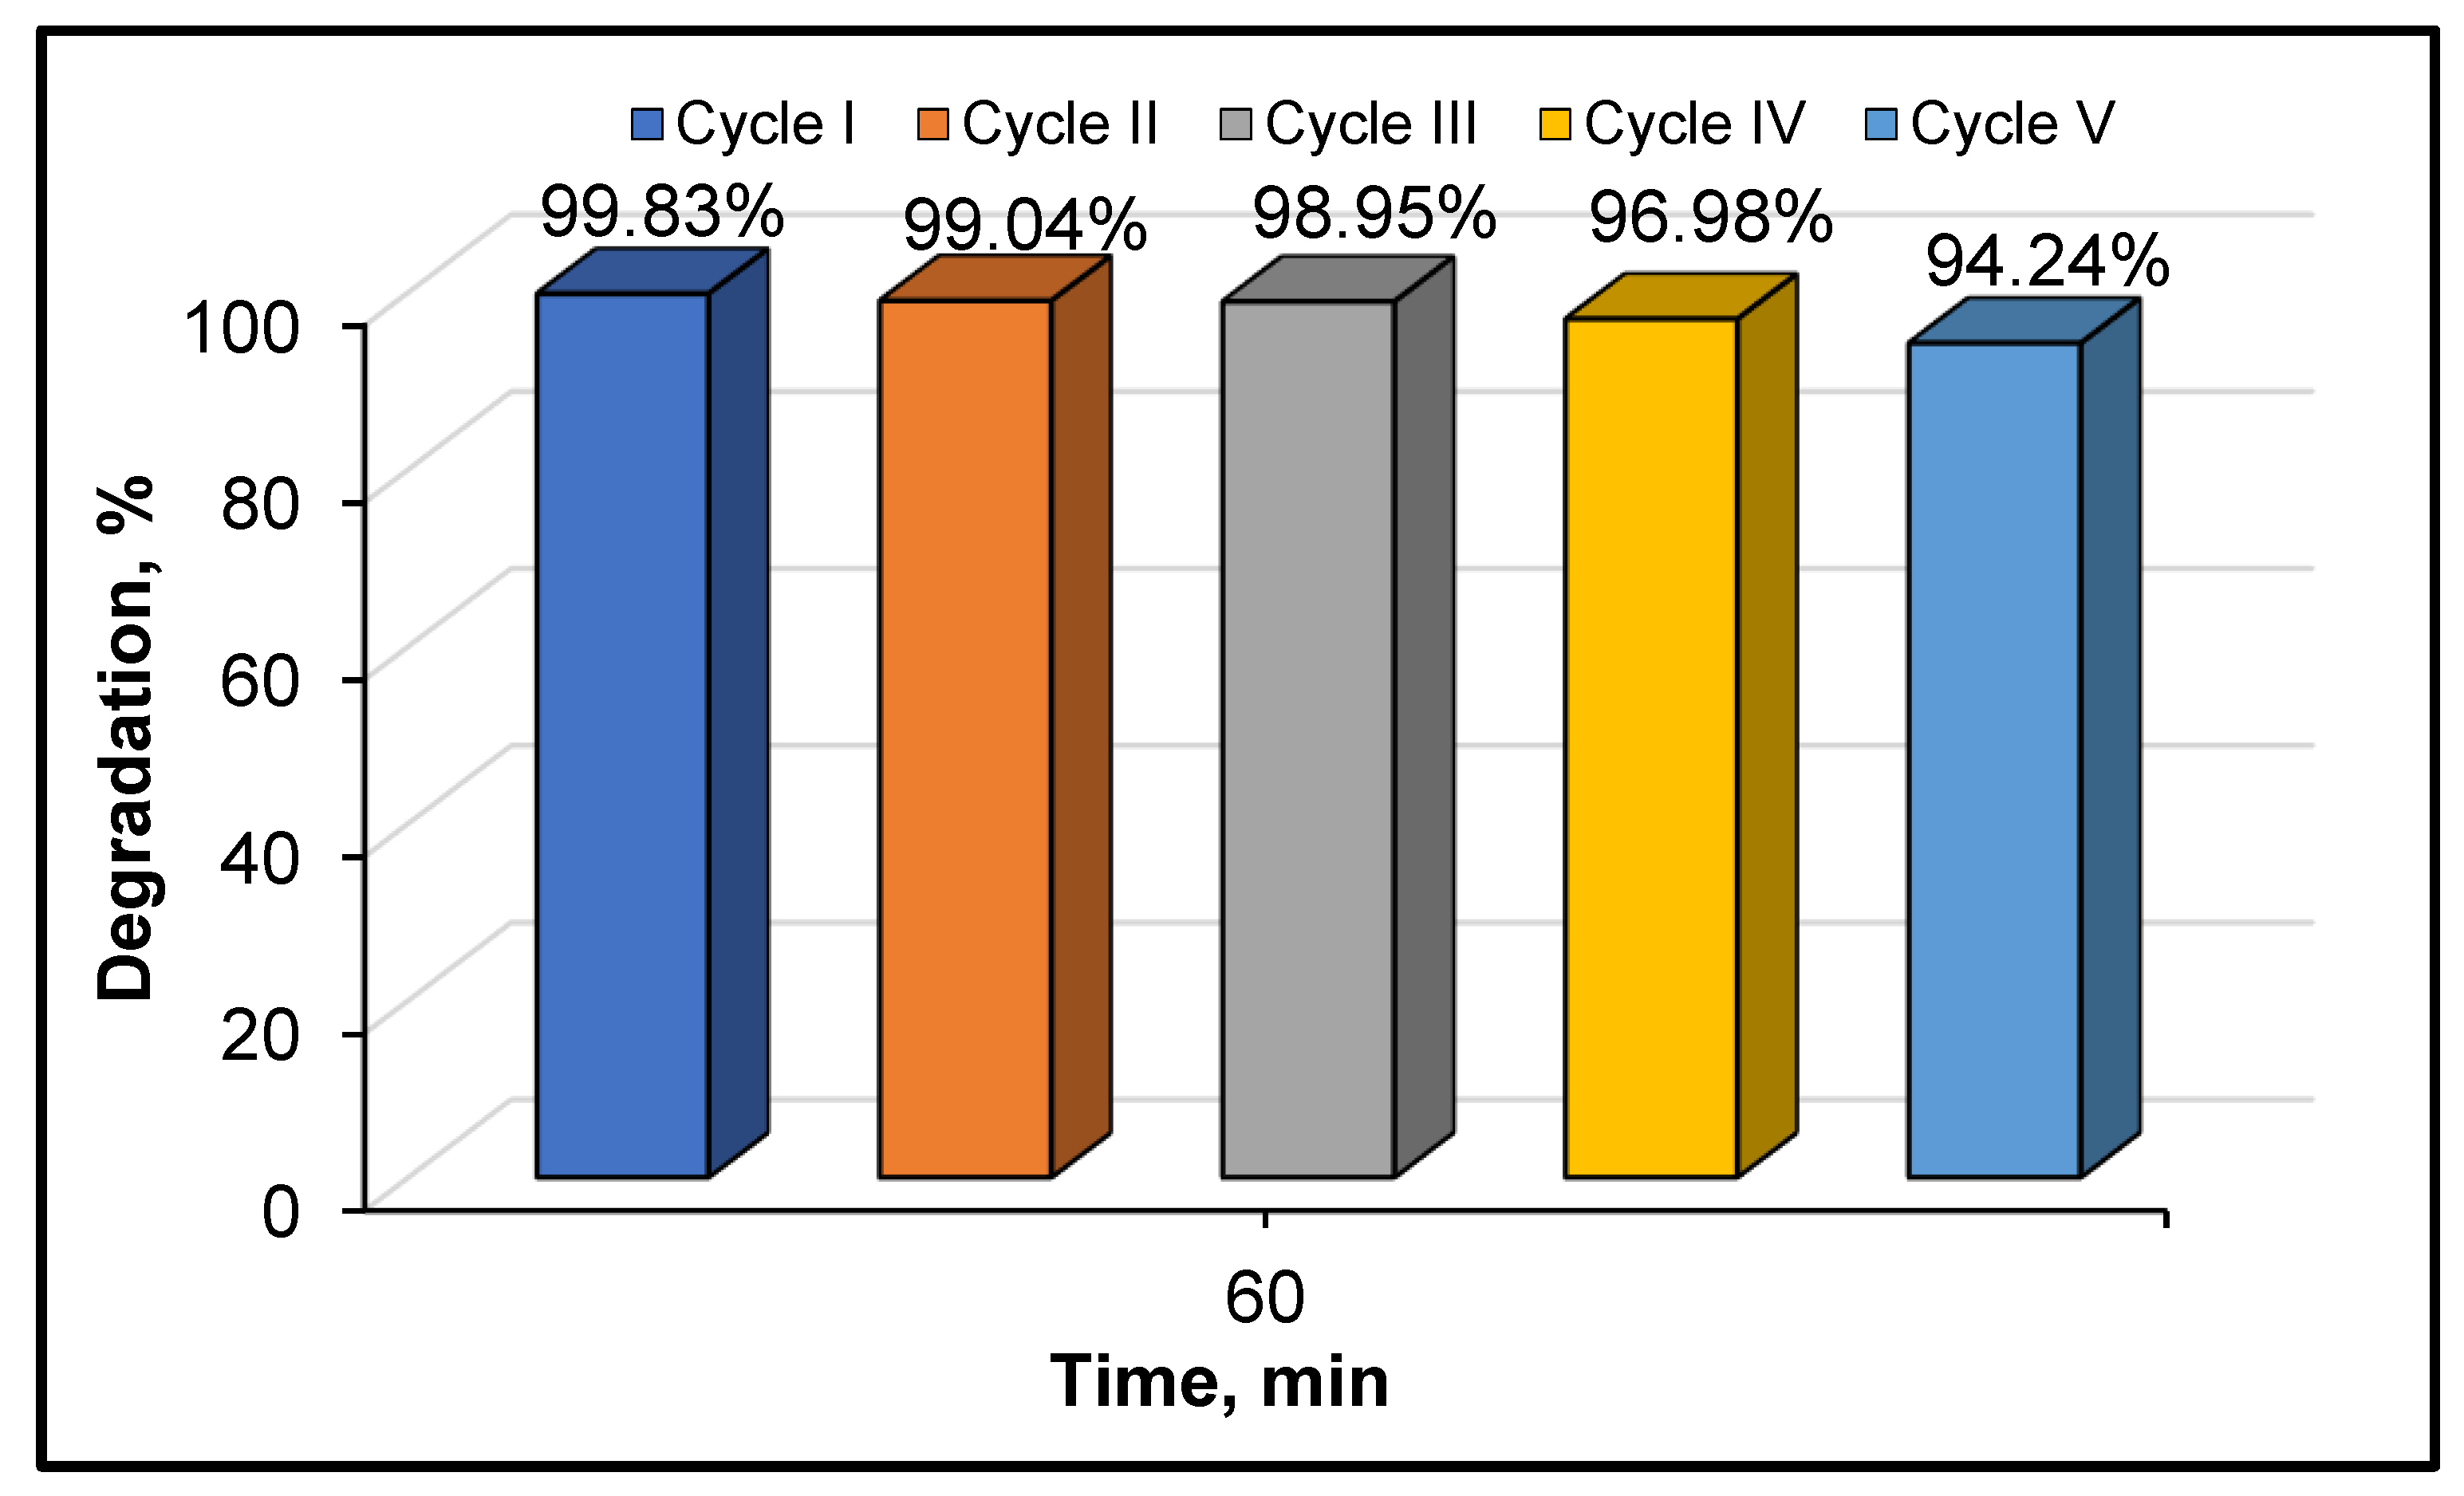
3.2. Photocatalytic Activity of the Samples in the Degradation of Refractory Organic Pollutant
4. Conclusions
Supplementary Materials
Author Contributions
Funding
Institutional Review Board Statement
Informed Consent Statement
Data Availability Statement
Conflicts of Interest
References
- Ochiai, T.; Fujishima, A. Photoelectrochemical properties of TiO2 photocatalyst and its applications for environmental purification. J. Photochem. Photobiol. C 2012, 13, 247–262. [Google Scholar] [CrossRef]
- Lee, S.Y.; Park, S.J. TiO2 photocatalyst for water treatment applications. J. Ind. Eng. Chem. 2013, 19, 1761–1769. [Google Scholar] [CrossRef]
- Chen, D.; Cheng, Y.; Zhou, N.; Chen, P.; Wang, Y.; Li, K.; Huo, S.; Cheng, P.; Peng, P.; Zhang, R.; et al. Photocatalytic degradation of organic pollutants using TiO2-based photocatalysts: A review. J. Clean. Prod. 2020, 268, 121725. [Google Scholar] [CrossRef]
- Shayegan, Z.; Lee, C.S.; Haghighat, F. TiO2 photocatalyst for removal of volatile organic compounds in gas phase—A review. Chem. Eng. J. 2018, 334, 2408–2439. [Google Scholar] [CrossRef]
- Ni, M.; Leung, M.K.; Leung, D.Y.; Sumathy, K. A review and recent developments in photocatalytic water-splitting using TiO2 for hydrogen production. Renew. Sustain. Energy Rev. 2007, 11, 401–425. [Google Scholar] [CrossRef]
- Singh, R.; Dutta, S. A review on H2 production through photocatalytic reactions using TiO2/TiO2-assisted catalysts. Fuel 2018, 220, 607–620. [Google Scholar] [CrossRef]
- Leong, S.; Razmjou, A.; Wang, K.; Hapgood, K.; Zhang, X.; Wang, H. TiO2 based photocatalytic membranes: A review. J. Membr. Sci. 2014, 472, 167–184. [Google Scholar] [CrossRef]
- Google Scholar, on ‘TiO2 Photocatalyst Review’ Topic. Available online: https://scholar.google.com/scholar?as_ylo=2017&q=tio2+photocatalyst+review&hl=en&as_sdt=0,5 (accessed on 29 July 2021).
- Al-Mamun, M.R.; Kader, S.; Islam, M.S.; Khan, M.Z.H. Photocatalytic activity improvement and application of UV-TiO2 photocatalysis in textile wastewater treatment: A review. J. Environ. Chem. Eng 2019, 7, 103248. [Google Scholar] [CrossRef]
- Dąbrowski, A. Adsorption—From theory to practice. Adv. Colloid Interface Sci. 2001, 93, 135–224. [Google Scholar] [CrossRef]
- Ying, J.Y.; Mehnert, C.P.; Wong, M.S. Synthesis and applications of supramolecular-templated mesoporous materials. Angew. Chem. Int. Ed. 1999, 38, 56–77. [Google Scholar] [CrossRef]
- Chircov, C.; Spoială, A.; Păun, C.; Crăciun, L.; Ficai, D.; Ficai, A.; Andronescu, E.; Turculeƫ, Ș.C. Mesoporous Silica Platforms with Potential Applications in Release and Adsorption of Active Agents. Molecules 2020, 25, 3814. [Google Scholar] [CrossRef]
- Tanev, P.T.; Pinnavaia, T.J. Mesoporous silica molecular sieves prepared by ionic and neutral surfactant templating: A comparison of physical properties. Chem. Mater. 1996, 8, 2068–2079. [Google Scholar] [CrossRef]
- Jesus, M.A.M.L.; Ferreira, A.M.; Lima, L.F.S.; Batista, G.F.; Mambrini, R.V.; Mohallem, N.D.S. Micro-mesoporous TiO2/SiO2 nanocomposites: Sol-gel synthesis, characterization, and enhanced photodegradation of quinoline. Ceram. Int. 2021, 47, 23844–23850. [Google Scholar] [CrossRef]
- Li, W.; Wu, Z.; Wang, J.; Elzatahry, A.A.; Zhao, D. A perspective on mesoporous TiO2 materials. Chem. Mater. 2014, 26, 287–298. [Google Scholar] [CrossRef]
- He, G.; Zhang, J.; Hu, Y.; Bai, Z.; Wei, C. Dual-template synthesis of mesoporous TiO2 nanotubes with structure-enhanced functional photocatalytic performance. Appl. Catal. B 2019, 250, 301–312. [Google Scholar] [CrossRef]
- Kim, D.S.; Han, S.J.; Kwak, S.Y. Synthesis and photocatalytic activity of mesoporous TiO2 with the surface area, crystallite size, and pore size. J. Colloid Interface Sci. 2007, 316, 85–91. [Google Scholar] [CrossRef]
- Kim, D.S.; Kwak, S.Y. The hydrothermal synthesis of mesoporous TiO2 with high crystallinity, thermal stability, large surface area, and enhanced photocatalytic activity. Appl. Catal. A Gen. 2007, 323, 110–118. [Google Scholar] [CrossRef]
- Mahoney, L.; Koodali, R.T. Versatility of evaporation-induced self-assembly (EISA) method for preparation of mesoporous TiO2 for energy and environmental applications. Materials 2014, 7, 2697–2746. [Google Scholar] [CrossRef]
- Lutic, D.; Petrovschi, D.; Ignat, M.; Creţescu, I.; Bulai, G. Mesoporous cerium-doped titania for the photocatalytic removal of persistent dyes. Catal. Today 2018, 306, 300–309. [Google Scholar] [CrossRef]
- Gu, D.; Schüth, F. Synthesis of non-siliceous mesoporous oxides. Chem. Soc. Rev. 2014, 43, 313–344. [Google Scholar] [CrossRef]
- Pal, N.; Bhaumik, A. Soft templating strategies for the synthesis of mesoporous materials: Inorganic, organic–inorganic hybrid and purely organic solids. Adv. Colloid Interface Sci. 2013, 189, 21–41. [Google Scholar] [CrossRef] [PubMed]
- Cabrera, S.; El Haskouri, J.; Beltrán-Porter, A.; Beltrán-Porter, D.; Marcos, M.D.; Amorós, P. Enhanced surface area in thermally stable pure mesoporous TiO2. Solid State Sci. 2000, 2, 513–518. [Google Scholar] [CrossRef]
- Payormhorm, J.; Chuangchote, S.; Laosiripojana, N. CTAB-assisted sol-microwave method for fast synthesis of mesoporous TiO2 photocatalysts for photocatalytic conversion of glucose to value-added sugars. Mater. Res. Bull. 2017, 95, 546–555. [Google Scholar] [CrossRef]
- Casino, S.; Di Lupo, F.; Francia, C.; Tuel, A.; Bodoardo, S.; Gerbaldi, C. Surfactant-assisted sol gel preparation of high-surface area mesoporous TiO2 nanocrystalline Li-ion battery anodes. J. Alloys Compd. 2014, 594, 114–121. [Google Scholar] [CrossRef]
- Meynen, V.; Cool, P.; Vansant, E.F. Verified syntheses of mesoporous materials. Microporous Mesoporous Mater. 2009, 125, 170–223. [Google Scholar] [CrossRef]
- Beyers, E.; Cool, P.; Vansant, E.F. Stabilisation of mesoporous TiO2 by different bases influencing the photocatalytic activity. Microp. Mesop. Mater. 2007, 99, 112–117. [Google Scholar] [CrossRef]
- Song, K.C.; Pratsinis, S.E. Synthesis of bimodally porous titania powders by hydrolysis of titanium tetraisopropoxide. J. Mater. Res. 2000, 15, 2322–2329. [Google Scholar] [CrossRef][Green Version]
- Song, K.C.; Pratsinis, S.E. The effect of alcohol solvents on the porosity and phase composition of titania. J. Colloid Interface Sci. 2000, 231, 289–298. [Google Scholar] [CrossRef]
- Favier, L.; Ungureanu, C.V.; Simion, A.I.; Bahrim, G.; Vial, C. Enhancing the biodegradation efficiency of a emergent refractory water pollutant by a bacterial isolate through a statistical process optimization approach. Process. Saf. Environ. Prot. 2021, 148, 1133–1145. [Google Scholar] [CrossRef]
- Hemidouche, S.; Favier, L.; Amrane, A.; Dabert, P.; Le Roux, S.; Sadaoui, Z. Successful biodegradation of a refractory pharmaceutical compound by an indigenous phenol-tolerant Pseudomonas aeruginosa strain. Water Air Soil Pollut. 2018, 229, 103. [Google Scholar] [CrossRef]
- Ungureanu, C.V.; Favier, L.; Bahrim, G.E. Improving Biodegradation of Clofibric Acid by Trametes pubescens through the Design of Experimental Tools. Microorganisms 2020, 8, 1243. [Google Scholar] [CrossRef]
- Kadmi, Y.; Favier, L.; Simion, A.-I.; Rusu, L.; Pacala, M.L.; Wolbert, D. Measurement of pollution levels of N-nitroso compounds of health concern in water using ultra-performance liquid chromatography–tandem mass spectrometry. Process Saf. Environ. Prot. 2017, 108, 7–17. [Google Scholar] [CrossRef]
- Spurr, R.A.; Myers, H. Quantitative analysis of anatase-rutile mixtures with an X-ray diffractometer. Anal. Chem. 1957, 29, 760–762. [Google Scholar] [CrossRef]
- Dumitriu, E.; Lutic, D.; Hulea, V.; Dorohoi, D.; Azzouz, A.; Colnay, E.; Kappenstein, C. Synthesis optimization of chabasite-like SAPO-47 in the presence of sec-butylamine. Microp. Mesop. Mater. 1999, 31, 187–193. [Google Scholar] [CrossRef]
- Wetchakun, N.; Phanichphant, S. Effect of temperature on the degree of anatase–rutile transformation in titanium dioxide nanoparticles synthesized by the modified sol–gel method. Curr. Appl. Phys. 2008, 8, 8343–8346. [Google Scholar] [CrossRef]
- Thommes, M.; Kaneko, K.; Neimark, A.V.; Olivier, J.P.; Rodriguez-Reinoso, F.; Rouquerol, J.; Sing, K.S. Physisorption of gases, with special reference to the evaluation of surface area and pore size distribution (IUPAC Technical Report). Pure Appl. Chem. 2015, 87, 1051–106931. [Google Scholar] [CrossRef]
- Peng, T.; Zhao, D.; Dai, K.; Shi, W.; Hirao, K. Synthesis of titanium dioxide nanoparticles with mesoporous anatase wall and high photocatalytic activity. J. Phys. Chem. B 2005, 109, 4947–4952. [Google Scholar] [CrossRef] [PubMed]
- Wang, T.; Li, W.; Xu, D.; Wu, X.; Cao, L.; Meng, J. A novel and facile synthesis of black TiO2 with improved visible-light photocatalytic H2 generation: Impact of surface modification with CTAB on morphology, structure and property. Appl. Surf. Sci. 2017, 426, 325–332. [Google Scholar] [CrossRef]
- Mahu, E.; Coromelci, C.G.; Lutic, D.; Asaftei, I.V.; Sacarescu, L.; Harabagiu, V.; Ignat, M. Tailoring mesoporous titania features by ultrasound-assisted sol-gel technique: Effect of surfactant/titania precursor weight ratio. Nanomaterials 2021, 11, 1263. [Google Scholar] [CrossRef]
- Yao, P.; Zhong, S.; Shen, Z. TiO2/halloysite composites codoped with carbon and nitrogen from melamine and their enhanced solar-light-driven photocatalytic performance. Int. J. Photoenergy 2015, 2015, 605690. [Google Scholar] [CrossRef]
- Zouzelka, R.; Remzova, M.; Brabec, L.; Rathousky, J. Photocatalytic performance of porous TiO2 layers prepared by quantitative electrophoretic deposition from organic solvents. Appl. Catal. B 2018, 227, 70–78. [Google Scholar] [CrossRef]
- Paumo, H.K.; Dalhatou, S.; Katata-Seru, L.M.; Kamdem, B.P.; Tijani, J.O.; Vishwanathan, V.; Kane, A.; Bahadur, I. TiO2 assisted photocatalysts for degradation of emerging organic pollutants in water and wastewater. J. Mol. Liq. 2021, 331, 115458. [Google Scholar] [CrossRef]
- Harja, M.; Sescu, A.-M.; Favier, L.; Lutic, D. Doping titanium dioxide with palladiun for enhancing the photocatalytic decontamination and mineralization of a refractory water pollutant. Rev. Chim. 2020, 71, 145–152. [Google Scholar] [CrossRef]
- Sescu, A.M.; Harja, M.; Favier, L.; Berthou, L.O.; Gomez de Castro, C.; Pui, A.; Lutic, D. Zn/La mixed oxides prepared by coprecipitation: Synthesis, characterization and photocatalytic studies. Materials 2020, 13, 4916. [Google Scholar] [CrossRef] [PubMed]
- Vrinceanu, N.; Hlihor, R.M.; Simion, A.I.; Rusu, L.; Fekete-Kertész, I.; Barka, N.; Favier, L. New Evidence of the Enhanced Elimination of a Persistent Drug Used as a Lipid Absorption Inhibitor by Advanced Oxidation with UV-A and Nanosized Catalysts. Catalysts 2019, 9, 761. [Google Scholar] [CrossRef]
- Burlacu, I.F.; Favier, L.; Matei, E.; Predescu, C.; Deak, G. Successful elimination of a refractory emergent organic compound from aqueous system using different catalytic materials. UPB Sci. Bull. 2019, 81, 217–225. [Google Scholar]
- Lin, H.; Tang, X.; Wang, J.; Zeng, Q.; Chen, H.; Ren, W.; Sun, J.; Zhang, H. Enhanced visible-light photocatalysis of clofibric acid using graphitic carbon nitride modified by cerium oxide nanoparticles. J. Hazard. Mater. 2021, 405, 124204. [Google Scholar] [CrossRef]
- Popa, C.; Balaes, T.; Favier, L.; Tanase, C.; Bahrim, G. White-rot fungus implications in clofibric acid biodegradation. Rom. Biotechnol. Lett. 2015, 20, 10388. [Google Scholar]
- Favier, L.; Rusu, L.; Simion, A.I.; Hlihor, R.M.; Pacal, M.L.; Augustyniak, A. Efficient degradation of clofibric acid by heterogeneous photocatalytic oxidation process. Environ. Eng. Manag. J. 2019, 18, 1683–1692. [Google Scholar] [CrossRef]
- Yu, J.G.; Xiong, J.F.; Cheng, B.; Liu, S.W. Fabrication and characterization of Ag–TiO2 multiphase nanocomposite thin films with enhanced photocatalytic activity. Appl. Catal. B 2005, 60, 211–221. [Google Scholar] [CrossRef]
- Wang, H.; Zhang, L.; Chen, Z.; Hu, J.; Li, S.; Wang, Z.; Liu, J.; Wang, X. Semiconductor heterojunction photocatalysts: Design, construction, and photocatalytic performances. Chem. Soc. Rev. 2014, 43, 5234–5244. [Google Scholar] [CrossRef]
- Henderson, M.A. A surface science perspective on TiO2photocatalysis. Surf. Sci. Rep. 2011, 66, 185–297. [Google Scholar] [CrossRef]
- Habisreutinger, S.N.; Schmidt-Mende, L.; Stolarczyk, J.K. Photocatalytic reduction of CO2 on TiO2 and other semiconductors. Angew. Chem. Int. Ed. 2013, 52, 7372–7408. [Google Scholar] [CrossRef] [PubMed]
- Favier, L.; Simion, A.I.; Matei, E.; Grigoras, C.-G.; Kadmi, Y.; Bouzaza, A. Photocatalytic oxidation of a hazardous phenolic compound over TiO2 in a batch system. Environ. Eng. Manag. J. 2016, 15, 1059–1067. [Google Scholar] [CrossRef]
- Khenniche, L.; Favier, L.; Bouzaza, A.; Fourcade, F.; Aissani, F.; Amrane, A. Photocatalytic degradation of bezacryl yellow in batch reactors—Feasibility of the combination of photocatalysis and a biological treatment. Environ. Technol. 2015, 36, 1–10. [Google Scholar] [CrossRef] [PubMed]
- Apopei, P.; Catrinescu, C.; Teodosiu, C.; Royer, S. Mixed-phase TiO2 photocatalysts: Crystalline phase isolation and reconstruction, characterization and photocatalytic activity in the oxidation of 4-chlorophenol from aqueous effluents. Appl. Catal. B 2014, 160, 374–382. [Google Scholar] [CrossRef]
- Zhang, X.; Zhang, Y.; Yu, Z.; Wei, X.; Wu, W.D.; Wang, X.; Wu, Z. Facile synthesis of meso-porous anatase/rutile/hematite triple heterojunctions for superior heterogeneous photo-Fenton catalysis. Appl. Catal. B 2020, 263, 118335. [Google Scholar] [CrossRef]
- Zhou, M.; Yu, J.; Cheng, B. Effects of Fe-doping on the photocatalytic activity of mesoporous TiO2 powders prepared by an ultrasonic method. J. Hazard. Mater. 2006, 137, 1838–1847. [Google Scholar] [CrossRef]


| Samples’ Maxima 2 Theta, Degree | Anatase Plane Index | Rutile Plane Index |
|---|---|---|
| 25.40 | (101) | |
| 27.54 | (110) | |
| 36.22 | (101) | |
| 37.06 | (102) | |
| 37.88 | (004) | |
| 38.70 | (112) | |
| 41.40 | (111) | |
| 48.14 | (200) | |
| 54.06 | (105) | |
| 54.48 | (211) | |
| 55.20 | (211) | |
| 62.84 | (204) | |
| 68.84 | (301) |
| Sample | Anatase Ratio, % | Crystallinity, % |
|---|---|---|
| E-550 | 90.79 | 88.59 |
| E-650 | 93.29 | 98.16 |
| E-750 | 88.31 | 98.50 |
| P-550 | 99.10 | 92.57 |
| P-650 | 99.43 | 95.93 |
| P-750 | 95.22 | 100.00 |
| Sample | 2 Theta, Degree | Size, nm |
|---|---|---|
| E-550 | 25.40 | 26.98 |
| E-650 | 25.38 | 26.44 |
| E-750 | 25.40 | 25.29 |
| P-550 | 25.36 | 12.65 |
| P-650 | 25.34 | 23.13 |
| P-750 | 25.44 | 31.13 |
| Samples | SBET, m2/g | Pore Volume, cm3/g | Smicropores, m2/g |
|---|---|---|---|
| E-550 | 38.08 | 0.048 | 0 |
| E-650 | 17.74 | 0.028 | 2.614 |
| E-750 | 11.61 | - | 1.106 |
| P-550 | 43.63 | 0.076 | 0 |
| P-650 | 11.41 | 0.023 | 2.392 |
| P-750 | 9.04 | - | 2.063 |
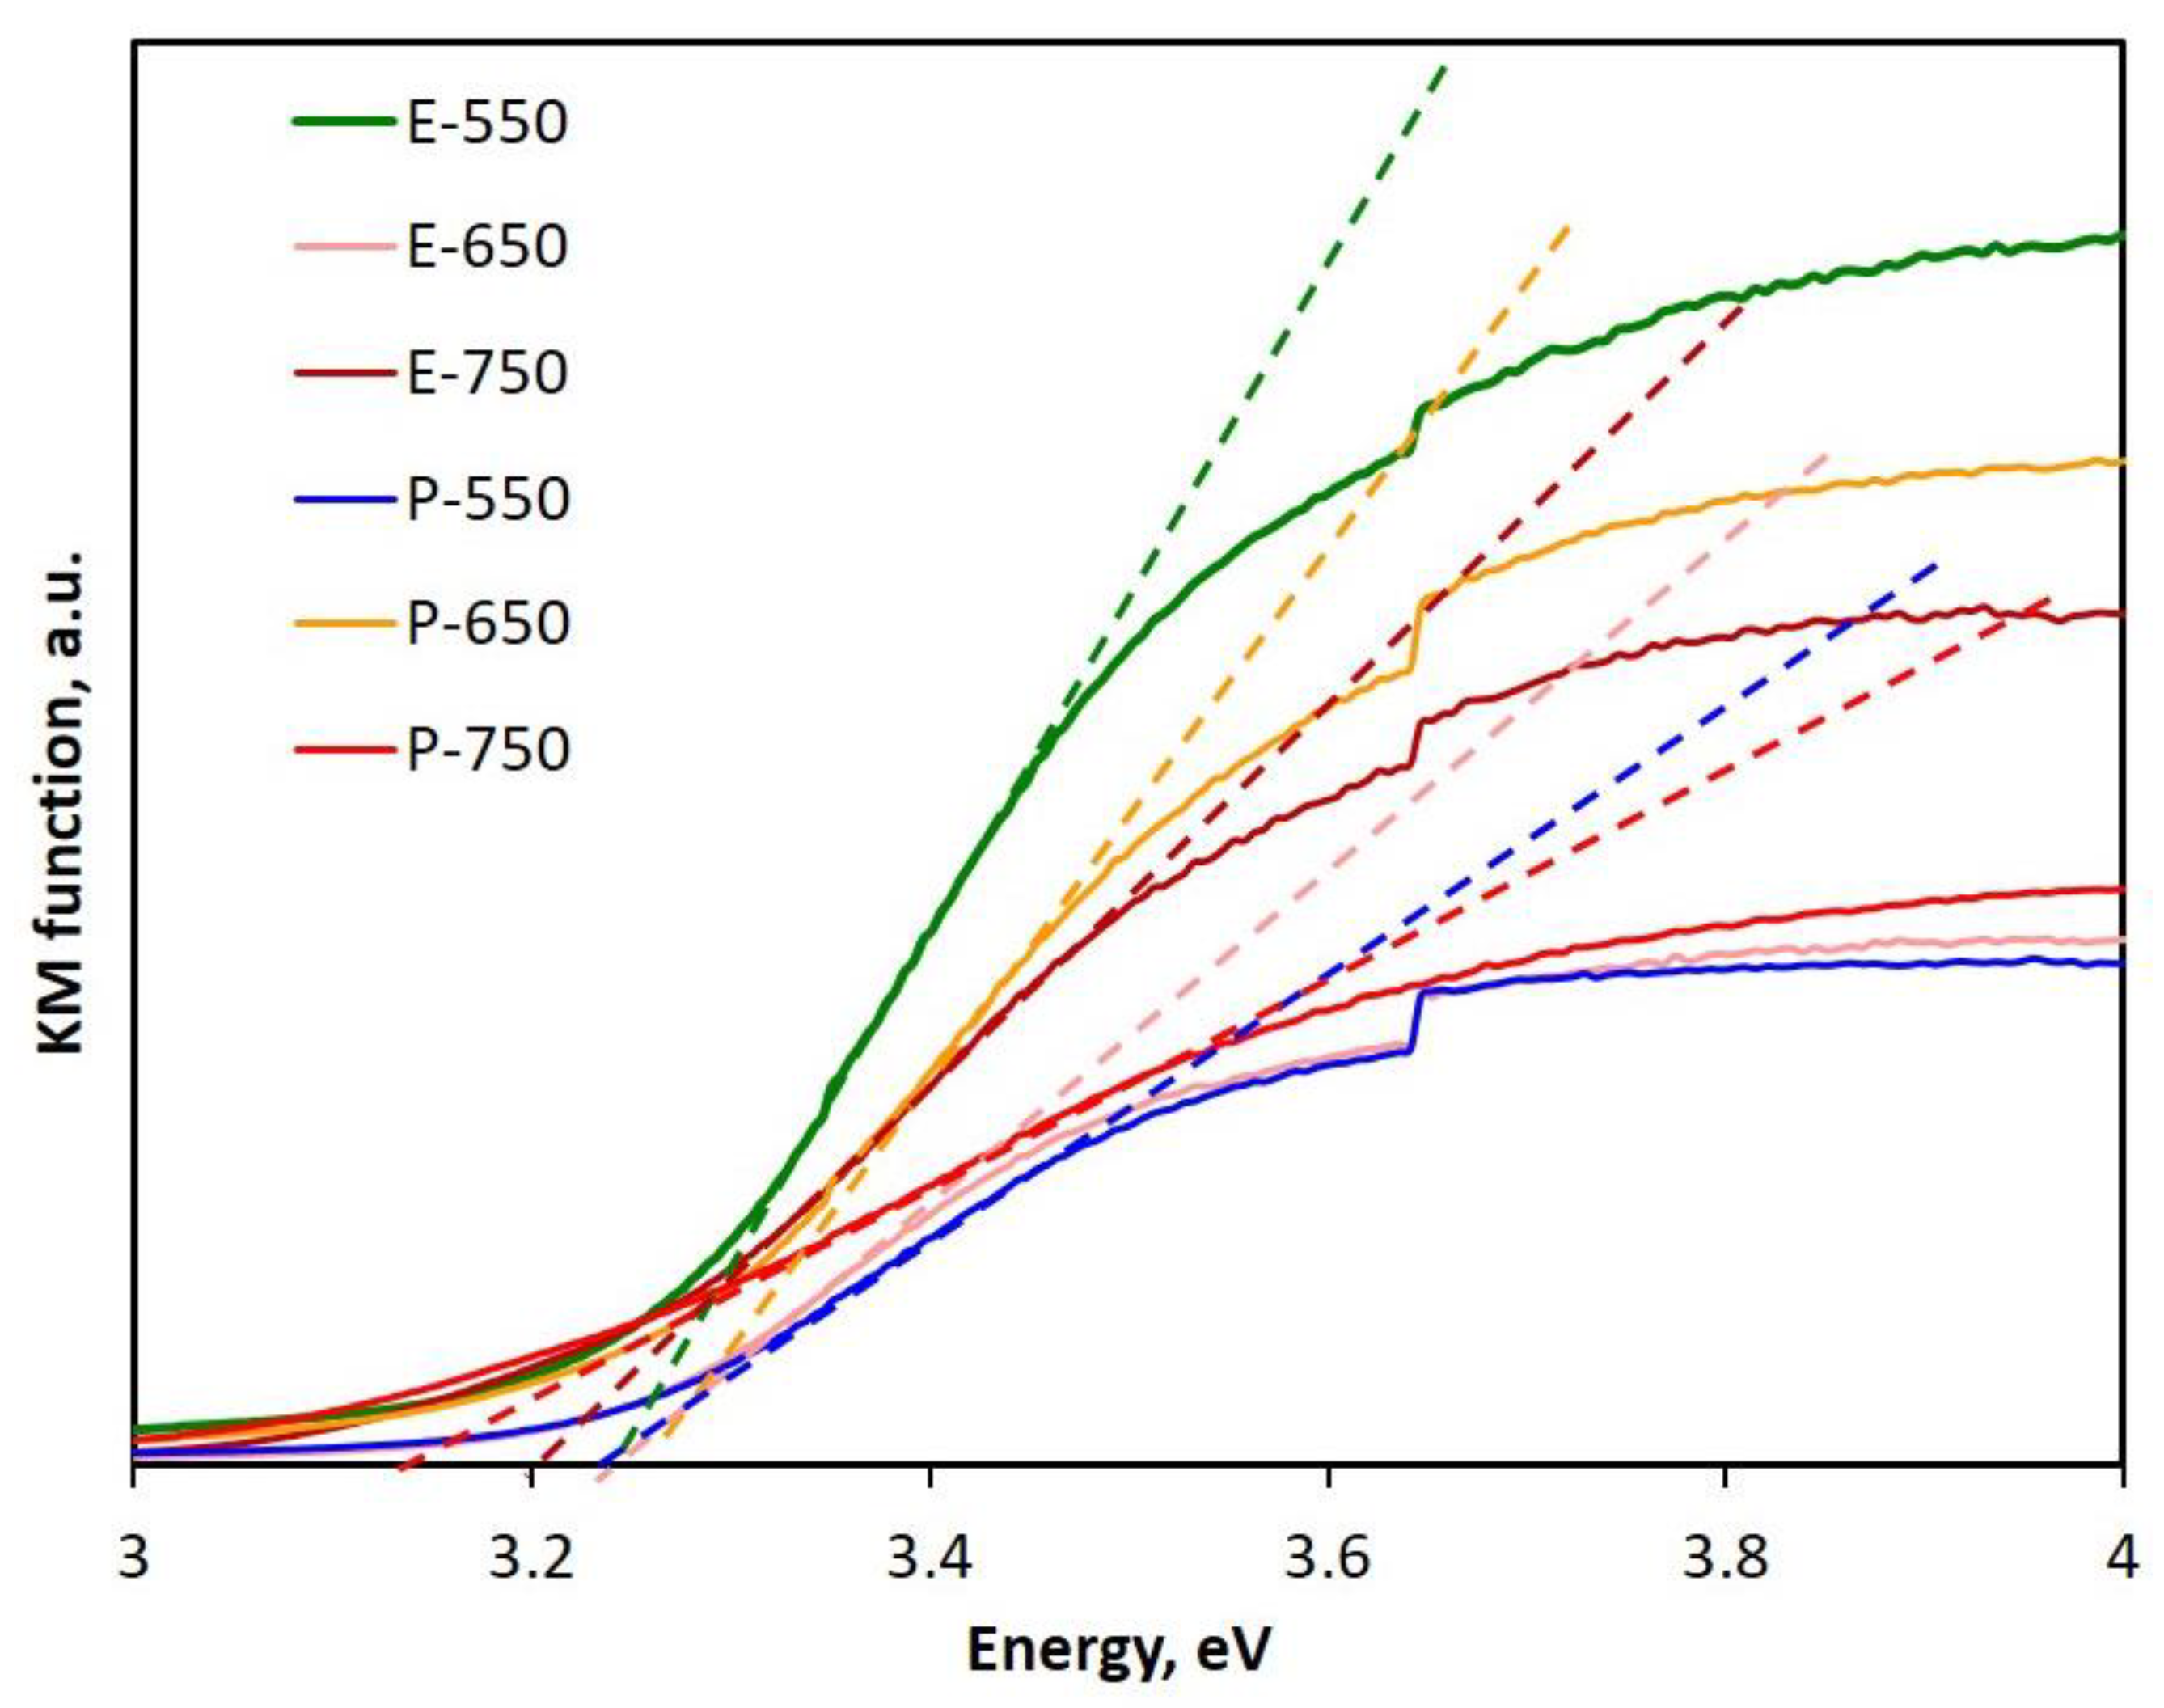
| Sample | Band Gap Value, eV |
|---|---|
| E-550 | 3.22 |
| E-650 | 3.24 |
| E-750 | 3.12 |
| P-550 | 3.18 |
| P-650 | 3.22 |
| P-750 | 3.20 |
Publisher’s Note: MDPI stays neutral with regard to jurisdictional claims in published maps and institutional affiliations. |
© 2021 by the authors. Licensee MDPI, Basel, Switzerland. This article is an open access article distributed under the terms and conditions of the Creative Commons Attribution (CC BY) license (https://creativecommons.org/licenses/by/4.0/).
Share and Cite
Favier, L.; Sescu, A.M.; Abdelkader, E.; Oughebbi Berthou, L.; Lutic, D. Urea-Assisted Synthesis of Mesoporous TiO2 Photocatalysts for the Efficient Removal of Clofibric Acid from Water. Materials 2021, 14, 6035. https://doi.org/10.3390/ma14206035
Favier L, Sescu AM, Abdelkader E, Oughebbi Berthou L, Lutic D. Urea-Assisted Synthesis of Mesoporous TiO2 Photocatalysts for the Efficient Removal of Clofibric Acid from Water. Materials. 2021; 14(20):6035. https://doi.org/10.3390/ma14206035
Chicago/Turabian StyleFavier, Lidia, Amalia Maria Sescu, Elaziouti Abdelkader, Laurence Oughebbi Berthou, and Doina Lutic. 2021. "Urea-Assisted Synthesis of Mesoporous TiO2 Photocatalysts for the Efficient Removal of Clofibric Acid from Water" Materials 14, no. 20: 6035. https://doi.org/10.3390/ma14206035
APA StyleFavier, L., Sescu, A. M., Abdelkader, E., Oughebbi Berthou, L., & Lutic, D. (2021). Urea-Assisted Synthesis of Mesoporous TiO2 Photocatalysts for the Efficient Removal of Clofibric Acid from Water. Materials, 14(20), 6035. https://doi.org/10.3390/ma14206035