
Effect of Cyclical Bending and Rubbing on the Characteristic Impedance of Textile Signal Lines

Abstract
:1. Introduction
2. Materials and Methods
2.1. Bending Stand
2.2. Rubbing Fastness Stand
2.3. Measured Parameters
2.3.1. Bending
- fivefold measurement of the impedance profile of each of the tested lines;
- making 5000 bends of each of the tested lines;
- fivefold measurement of the impedance profile of each of the tested lines.
2.3.2. Rubbing
3. Results and Discussion
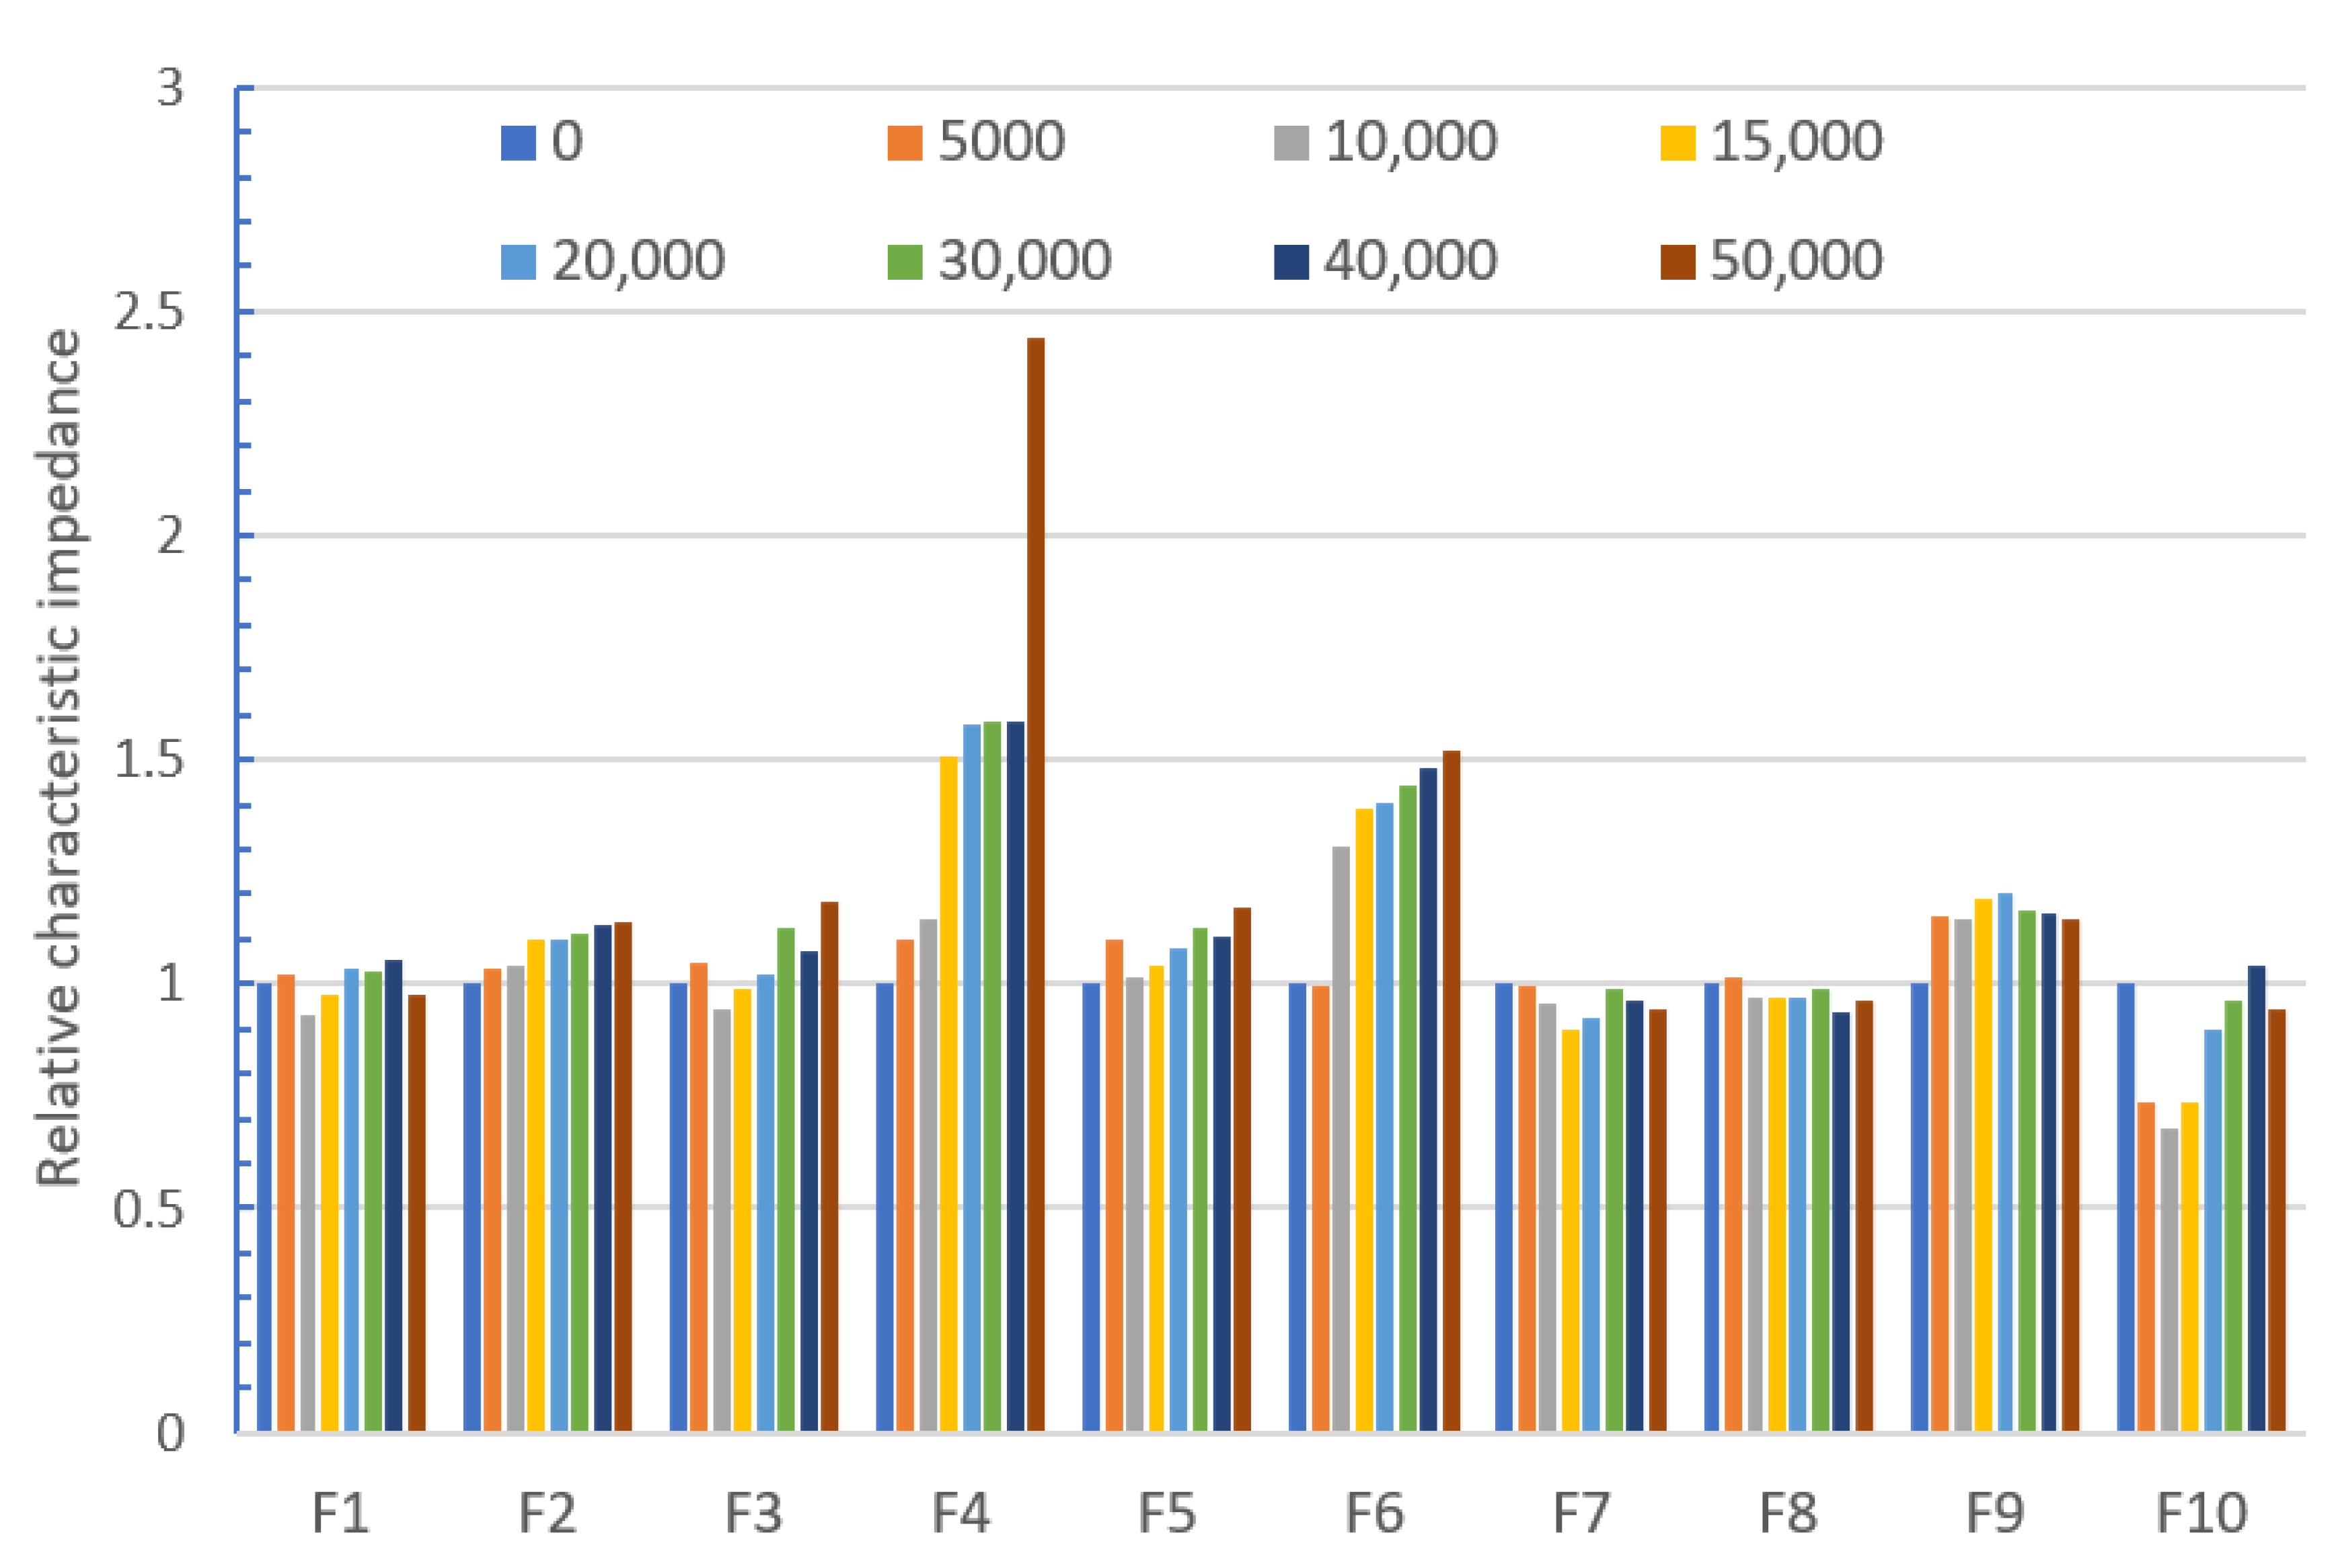
3.1. Bending
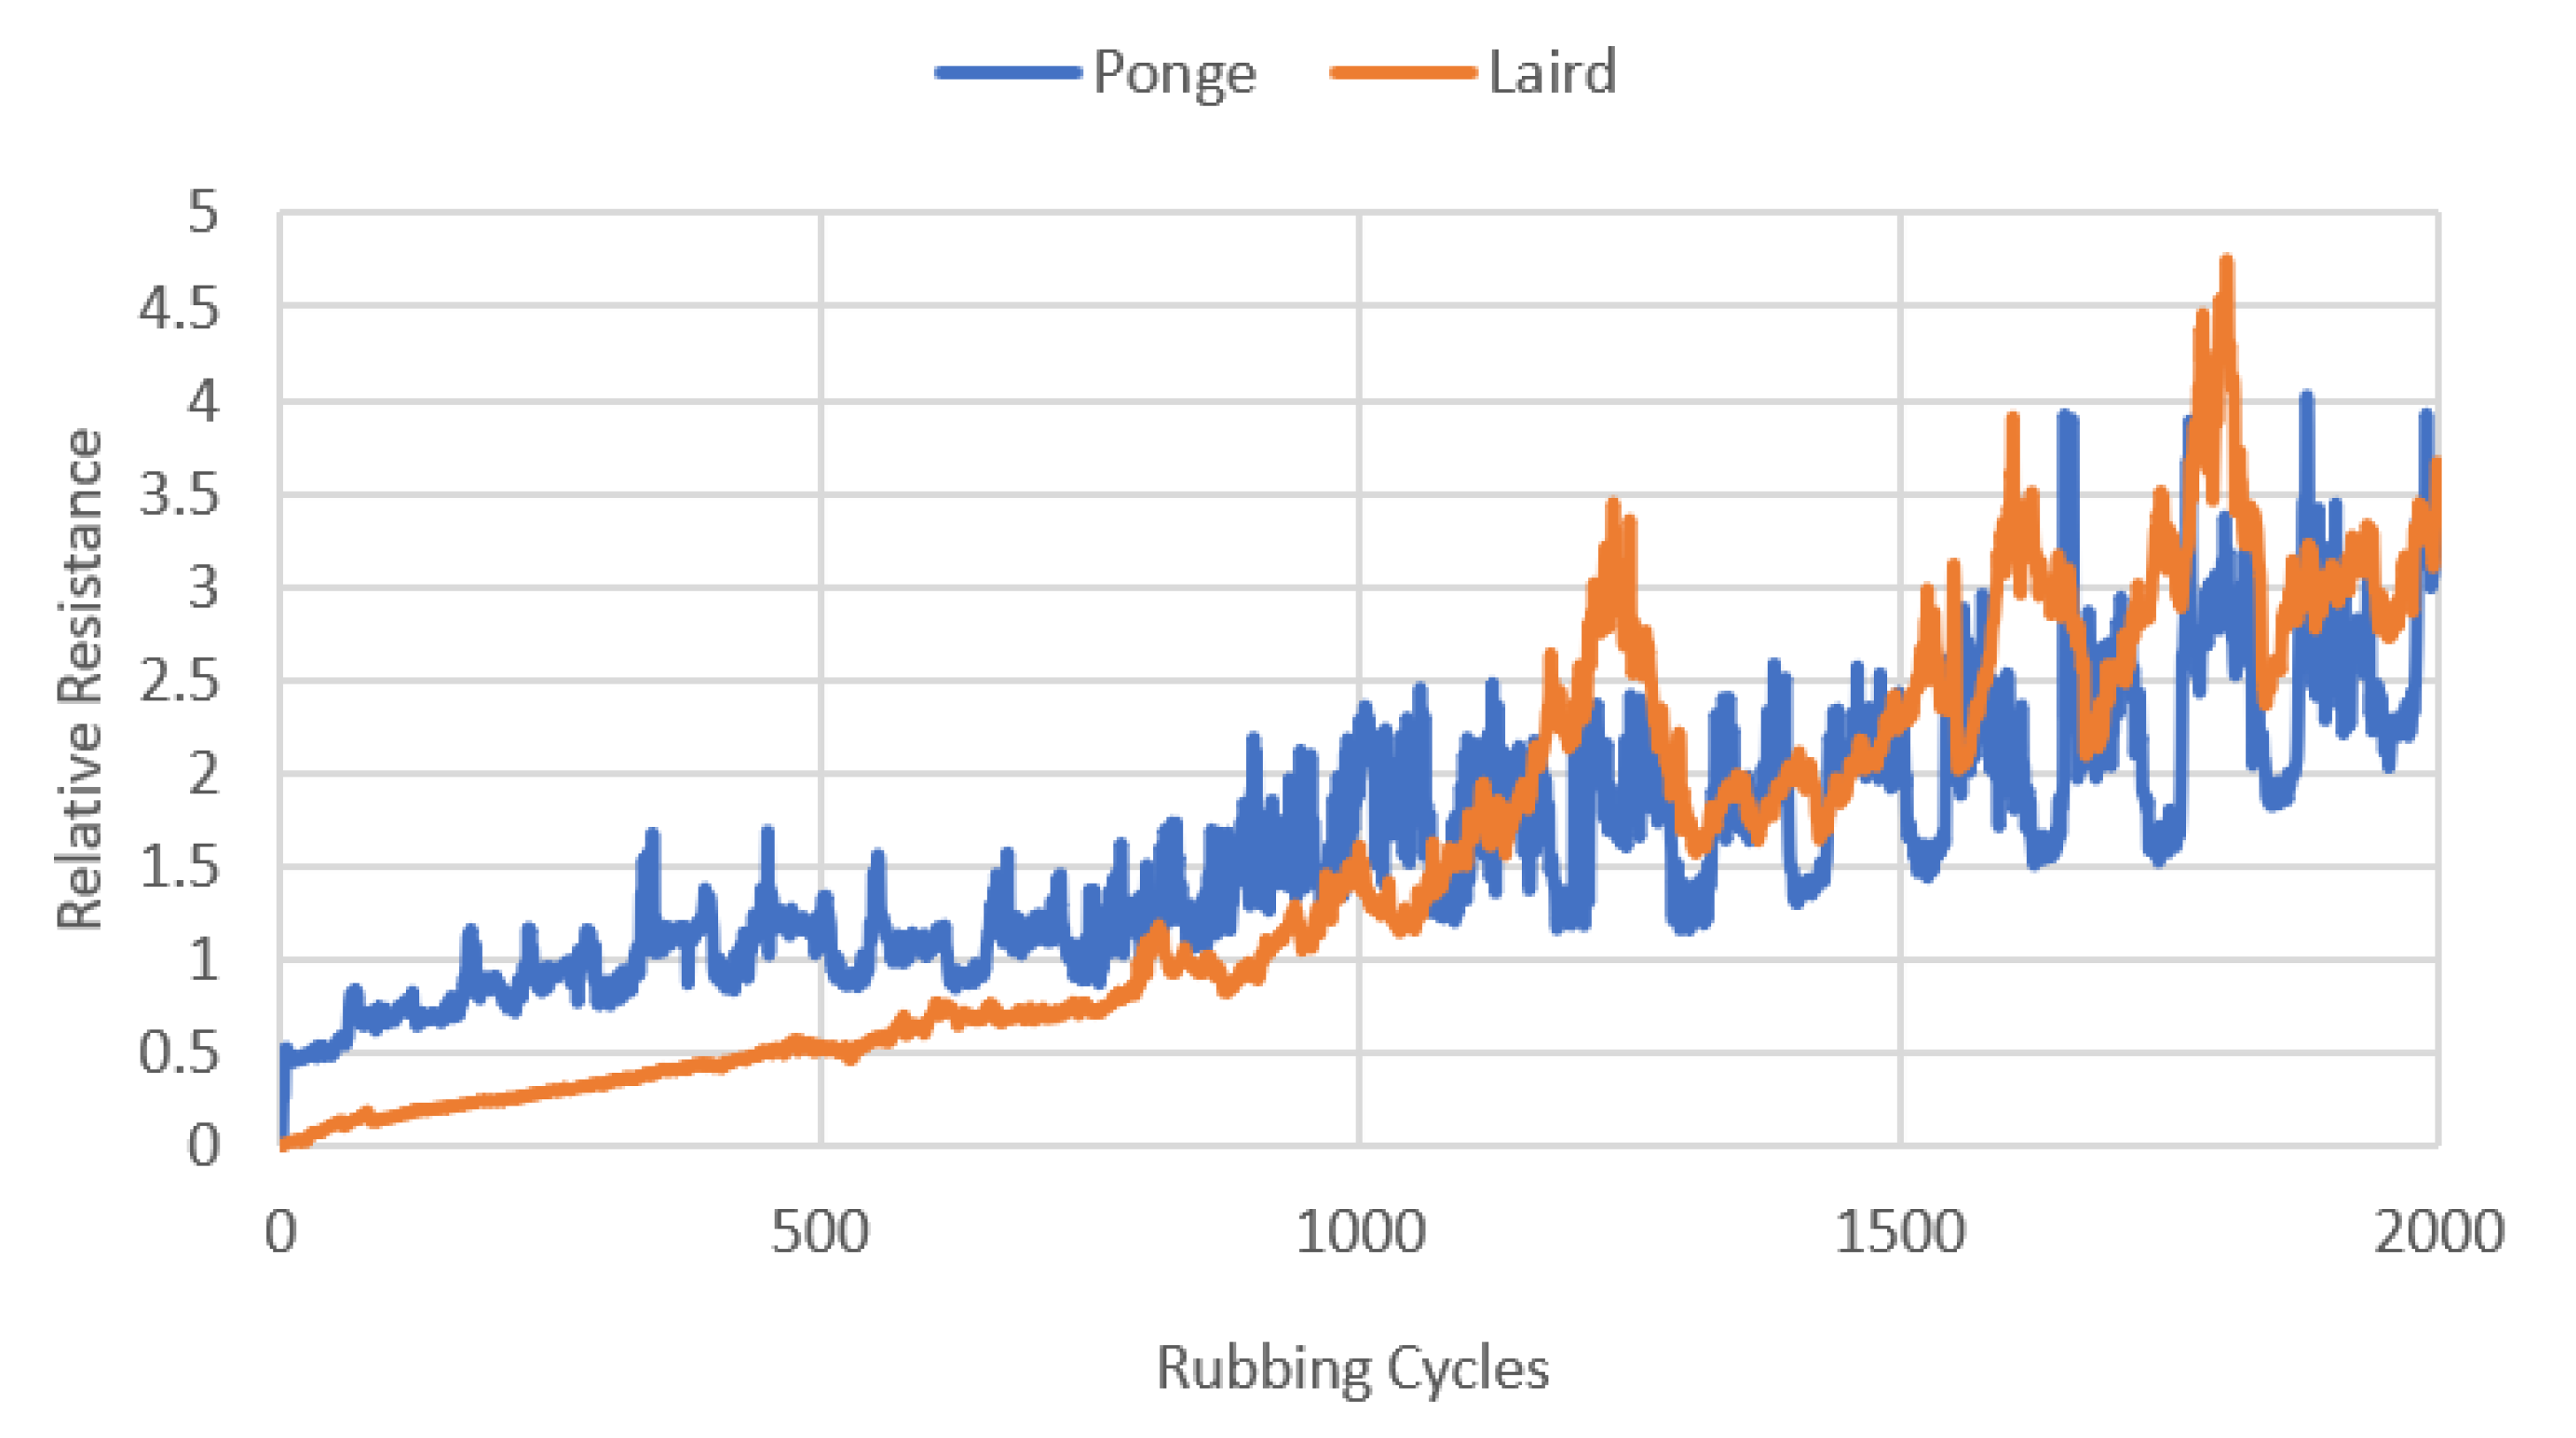
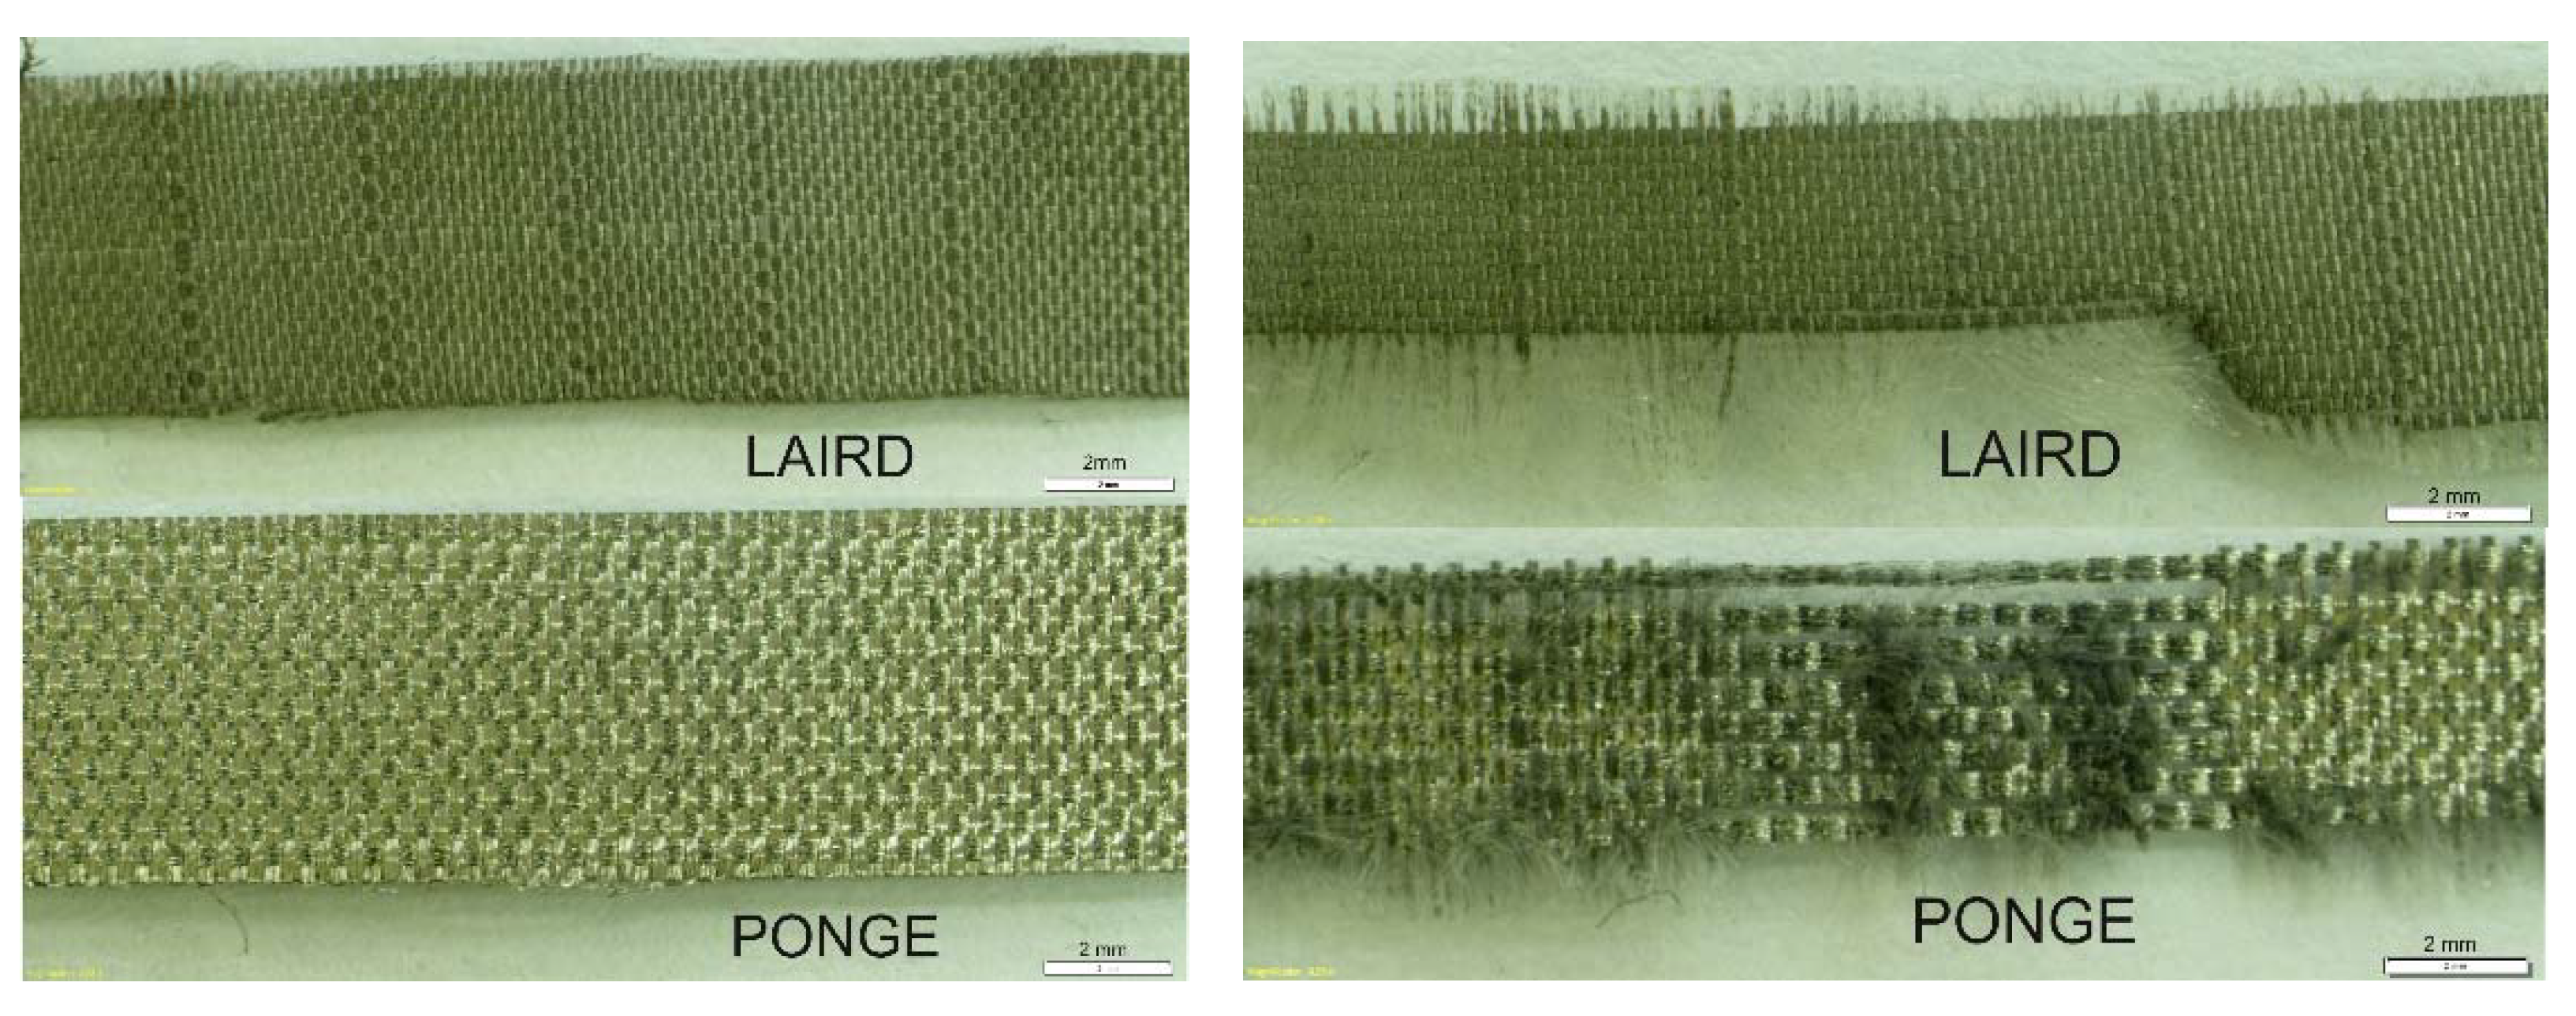
3.2. Rubbing
4. Statistical Analysis of the Measurement Results
5. Conclusions
Funding
Institutional Review Board Statement
Informed Consent Statement
Data Availability Statement
Conflicts of Interest
References
- Angelucci, A.; Cavicchioli, M.; Cintorrino, I.A.; Lauricella, G.; Rossi, C.; Strati, S.; Aliverti, A. Smart Textiles and Sensorized Garments for Physiological Monitoring: A Review of Available Solutions and Techniques. Sensors 2021, 21, 814. [Google Scholar] [CrossRef]
- Zhang, K.; Ling, W. Health Monitoring of Human Multiple Physiological Parameters Based on Wireless Remote Medical System. IEEE Access 2020, 8, 71146–71159. [Google Scholar] [CrossRef]
- Lin, C.-C.; Yang, C.-Y.; Zhou, Z.; Wu, S. Intelligent Health Monitoring System Based on Smart Clothing. Int. J. Distrib. Sens. Netw. 2018, 14, 1550147718794318. [Google Scholar] [CrossRef] [Green Version]
- Ahmed, A.; Lukman, A.; Agajo, J.; Olayemi Mikail, O.; Umar, B.; Samuel, E. Human Vital Physiological Parameters Monitoring: A Wireless Body Area Technology Based Internet of Things. J. Teknol. Dan Sist. Komput. 2018, 6, 115. [Google Scholar] [CrossRef] [Green Version]
- Yang, K.; Isaia, B.; Brown, L.; Beeby, S. E-Textiles for Healthy Ageing. Sensors 2019, 19, 4463. [Google Scholar] [CrossRef] [Green Version]
- Soukup, R.; Blecha, T.; Hamacek, A.; Reboun, J. Smart Textile-Based Protective System for Firefighters. In Proceedings of the 5th Electronics System-Integration Technology Conference, ESTC 2014, Helsinki, Finland, 16–18 September 2014; pp. 1–5. [Google Scholar]
- Onose, G.; Chendreanu, C.; Neacşu, A.; Grigorean, V.; Strâmbu, V.; Toader, C.; Spânu, A.; Ioana, A.; Anghelescu, A.; Onose, L.; et al. Smart Textiles for Noninvasive Monitoring of Physiological Signals. Ind. Text. 2009, 60, 124–133. [Google Scholar]
- Özyazgan, V.; Abdulova, V. Utilization of Smart Textiles in Healthcare. Int. J. Electron. Mech. Mechatron. Eng. 2015, 5, 1025–1033. [Google Scholar] [CrossRef]
- McCann, J. 9—Smart protective textiles for older people. In Smart Textiles for Protection; Chapman, R.A., Ed.; Woodhead Publishing Series in Textiles; Woodhead Publishing: Sawston, Great Britain, 2013; pp. 244–275. ISBN 978-0-85709-056-0. [Google Scholar]
- Chika, Y.-B.; Adekunle, S.A. SMART FABRICS-WEARABLE TECHNOLOGY. Int. J. Eng. Technol. Manag. Res. 2017, 4, 78–98. [Google Scholar]
- Ramaiah, G.B. Theoretical Analysis on Applications Aspects of Smart Materials and Internet of Things (IoT) in Textile Technology. Mater. Today Proc. 2021, 45, 4633–4638. [Google Scholar] [CrossRef]
- Bahadir, S.K.; Kalaoğlu, F.; Jevšnik, S. The Use of Hot Air Welding Technologies for Manufacturing E-Textile Transmission Lines. Fibers Polym 2015, 16, 1384–1394. [Google Scholar] [CrossRef] [Green Version]
- Choi, M.; Kim, J. Electrical Characteristics and Signal Transmission Characteristics of Hybrid Structure Yarns for Smart Wearable Devices. Fibers Polym. 2016, 17, 2055–2061. [Google Scholar] [CrossRef]
- Cottet, D.; Grzyb, J.; Kirstein, T.; Troster, G. Electrical Characterization of Textile Transmission Lines. IEEE Trans. Adv. Packag. 2003, 26, 182–190. [Google Scholar] [CrossRef]
- Daniel, I.H.; Flint, J.A.; Seager, R. Stitched Transmission Lines for Wearable RF Devices. Microw. Opt. Technol. Lett. 2017, 59, 1048–1052. [Google Scholar] [CrossRef] [Green Version]
- Daniel, I.H.; Kure, N.; Kassim, A.A. Two-Way Comparison between Stitched Transmission Lines with Copper Wires and Conductive Threads, and with Conductive Threads Only. J. Electr. Electron. Eng. Res. 2017, 9, 1–7. [Google Scholar]
- Leśnikowski, J. Textile Transmission Lines in the Modern Textronic Clothes. Fibres Text. East. Eur. 2011, 19, 89. [Google Scholar]
- Moradi, B.; Fernández-García, R.; Gil, I. E-Textile Embroidered Metamaterial Transmission Line for Signal Propagation Control. Materials 2018, 11, 955. [Google Scholar] [CrossRef] [Green Version]
- Lim, E.G.; Wang, Z.; Wang, J.C.; Leach, M.; Zhou, R.; Lei, C.-U.; Man, K.L. Wearable Textile Substrate Patch Antennas. Eng. Lett. 2014, 22, 1–8. [Google Scholar]
- Wagih, M.; Hilton, G.S.; Weddell, A.S.; Beeby, S. Dual-Band Dual-Mode Textile Antenna/Rectenna for Simultaneous Wireless Information and Power Transfer (SWIPT). IEEE Trans. Antennas Propag. 2021, 69, 1. [Google Scholar] [CrossRef]
- A Review on Wearable Textile Antenna. Available online: https://www.researchgate.net/publication/286931282_A_Review_on_Wearable_Textile_Antenna (accessed on 21 January 2019).
- Caspers, F. RF Engineering Basic Concepts: S-Parameters. CERN Yellow Rep. 2011, CERN-2011-007, 67–93. [Google Scholar]
- Creech, J. S-Parameters Allow High-Frequency Verification of RF Switch Models. Analog Dialogue 2011, 45, 1–4. [Google Scholar]
- Lesnikowski, J.; Kubiak, P. Changes in the Characteristic Impedance of Textile Signal Lines While Mechanically Loaded. Autex Res. J. 2019, 19, 375–380. [Google Scholar] [CrossRef] [Green Version]
- Leśnikowski, J. New Kind of Textile Transmission Line with an Impedance of 50 Ohms. Fibres Text. East. Eur. 2015, 2, 51–54. [Google Scholar]
- Elliott, C.; Vijayakumar, V.; Zink, W.; Hansen, R. National Instruments LabVIEW: A Programming Environment for Laboratory Automation and Measurement. JALA J. Assoc. Lab. Autom. 2007, 12, 17–24. [Google Scholar] [CrossRef] [Green Version]
- Cataldo, A.; De Benedetto, E.; Cannazza, G. Broadband Reflectometry for Enhanced Diagnostics and Monitoring Applications, 1st ed.; Springer: Berlin, Germany, 2011; Volume 1, ISBN 978-3-642-20232-2. [Google Scholar]
- Leśnikowski, J. Terminal for connecting textile signal lines to the devices for measuring electrical parameters. Patent PL 222920 B1, 30 September 2016. [Google Scholar]
- Lesnikowski, J. Research into the Textile-Based Signal Lines Made Using Ultrasonic Welding Technology. Autex Res. J. 2020. Available online: https://sciendo.com/pdf/10.2478/aut-2020-0025 (accessed on 18 August 2021). [CrossRef]
- Pereira, D.; Afonso, A.; Medeiros, F. Overview of Friedman’s Test and Post-Hoc Analysis. Commun. Stat.-Simul. Comput. 2015, 44, 2636–2653. [Google Scholar] [CrossRef]
- Cleophas, T.J.; Zwinderman, A.H. Non-parametric Tests for Three or More Samples (Friedman and Kruskal-Wallis). In Clinical Data Analysis on a Pocket Calculator: Understanding the Scientific Methods of Statistical Reasoning and Hypothesis Testing; Cleophas, T.J., Zwinderman, A.H., Eds.; Springer International Publishing: Cham, Switzerland, 2016; pp. 193–197. ISBN 978-3-319-27104-0. [Google Scholar]


| Material | Trade Name/Producer | Thickness (mm) | Surface Resistivity (Ohm/sq) | Metal Amount (g/m2) | Total Weight (g/m2) | Weave | Warp Density (Yarns/cm) | Weft Density (Yarns/cm) |
|---|---|---|---|---|---|---|---|---|
| Nickel metallised polyester | Ponge/Soliani | 0.15 | Max. average 0.4 | 16 | 45–75 | Plain | 26 | 18 |
| Ni/Cu Nylon Ripstop | 3050-525/Laird | 0.127 | 0.07 | 27–39 | 71–92 | Twill | 55 | 40 |
| Fabric No. | Raw Material | Weave | Dielectric Constant (1 GHz) | Tangent Loss (1 GHz) | Thickness (mm) | Surface Weight (g/m2) | Warp Density (threads/cm) | Weft Density (threads/cm) |
|---|---|---|---|---|---|---|---|---|
| F1 | cotton | twill | 1.825 | 0.049 | 0.62 | 287 | 30 | 19 |
| F2 | polyester | plain | 1.351 | 0.005 | 0.36 | 158 | 56 | 28 |
| F3 | cotton | plain | 1.688 | 0.040 | 0.29 | 114 | 29 | 23 |
| F4 | cotton | twill | 1.847 | 0.044 | 0.31 | 201 | 36 | 12 |
| F5 | cotton | plain | 1.631 | 0.032 | 0.38 | 89 | 25 | 21 |
| F6 | cotton | plain | 1.551 | 0.011 | 0.30 | 85 | 26 | 14 |
| F7 | cotton | plain | 1.857 | 0.045 | 0.40 | 102 | 24 | 32 |
| F8 | polyester | plain | 1.361 | 0.007 | 0.25 | 150 | 36 | 22 |
| F9 | polyester | plain | 1.924 | 0.006 | 0.53 | 275 | 24 | 21 |
| F10 | polyester | plain | 1.477 | 0.005 | 0.34 | 145 | 64 | 33 |
| Fabric | Obtained p-Value for Bending | H0 Hypothesis | Obtained p-Value for Rubbing | H0 Hypothesis |
|---|---|---|---|---|
| F1 | 0.0012 | Rejected | 0.00285 | Rejected |
| F2 | 0.0005 | Rejected | 0.00375 | Rejected |
| F3 | 0.0002 | Rejected | 0.00285 | Rejected |
| F4 | 0.0002 | Rejected | 0.00182 | Rejected |
| F5 | 0.0003 | Rejected | 0.00698 | Rejected |
| F6 | 0.0005 | Rejected | 0.00285 | Rejected |
| F7 | 0.0009 | Rejected | 0.02627 | Rejected |
| F8 | 0.16702 | Accepted | 0.00285 | Rejected |
| F9 | 0.0034 | Rejected | 0.00285 | Rejected |
| F10 | 0.0100 | Rejected | 0.16045 | Accepted |
| Fabric | Obtained p-Value for Bending | H0 Hypothesis | Obtained p-Value for Rubbing | H0 Hypothesis |
|---|---|---|---|---|
| F1 | 0.00007 | Rejected | 0.00182 | Rejected |
| F2 | 0.00085 | Rejected | 0.00182 | Rejected |
| F3 | 0.00702 | Rejected | 0.00182 | Rejected |
| F4 | 0.00002 | Rejected | 0.00182 | Rejected |
| F5 | 0.00006 | Rejected | 0.00698 | Rejected |
| F6 | 0.00046 | Rejected | 0.00357 | Rejected |
| F7 | 0.00066 | Rejected | 0.00500 | Rejected |
| F8 | 0.00046 | Rejected | 0.00182 | Rejected |
| F9 | 0.00331 | Rejected | 0.00285 | Rejected |
| F10 | 0.02974 | Rejected | 0.06237 | Accepted |
| Fabric | Characteristic Impedance (Bending Cycles) | Characteristic Impedance (Rubbing Cycles) | The Standard Deviation of the Characteristic Impedance (Bending Cycles) | The Standard Deviation of the Characteristic Impedance (Rubbing Cycles) |
|---|---|---|---|---|
| Number of rubbing cycles | ||||
| F1 | 5000 | 1000 | 20,000 | 1000 |
| F2 | 5000 | 2000 | 5000 | 1000 |
| F3 | 5000 | 1000 | 20,000 | 1000 |
| F4 | 5000 | 1000 | 10,000 | 1000 |
| F5 | 5000 | 1000 | 5000 | 2000 |
| F6 | 10,000 | 1000 | 40,000 | 1000 |
| F7 | 10,000 | 1000 | 5000 | 1000 |
| F8 | 50,000 | 2000 | 5000 | 1000 |
| F9 | 5000 | 1000 | 30,000 | 1000 |
| F10 | 10,000 | 2000 | 15,000 | 3000 |
Publisher’s Note: MDPI stays neutral with regard to jurisdictional claims in published maps and institutional affiliations. |
© 2021 by the author. Licensee MDPI, Basel, Switzerland. This article is an open access article distributed under the terms and conditions of the Creative Commons Attribution (CC BY) license (https://creativecommons.org/licenses/by/4.0/).
Share and Cite
Leśnikowski, J. Effect of Cyclical Bending and Rubbing on the Characteristic Impedance of Textile Signal Lines. Materials 2021, 14, 6013. https://doi.org/10.3390/ma14206013
Leśnikowski J. Effect of Cyclical Bending and Rubbing on the Characteristic Impedance of Textile Signal Lines. Materials. 2021; 14(20):6013. https://doi.org/10.3390/ma14206013
Chicago/Turabian StyleLeśnikowski, Jacek. 2021. "Effect of Cyclical Bending and Rubbing on the Characteristic Impedance of Textile Signal Lines" Materials 14, no. 20: 6013. https://doi.org/10.3390/ma14206013
APA StyleLeśnikowski, J. (2021). Effect of Cyclical Bending and Rubbing on the Characteristic Impedance of Textile Signal Lines. Materials, 14(20), 6013. https://doi.org/10.3390/ma14206013