
Research of a Novel Ag Temperature Sensor Based on Fabric Substrate Fabricated by Magnetron Sputtering

Abstract
:1. Introduction
2. Materials and Methods
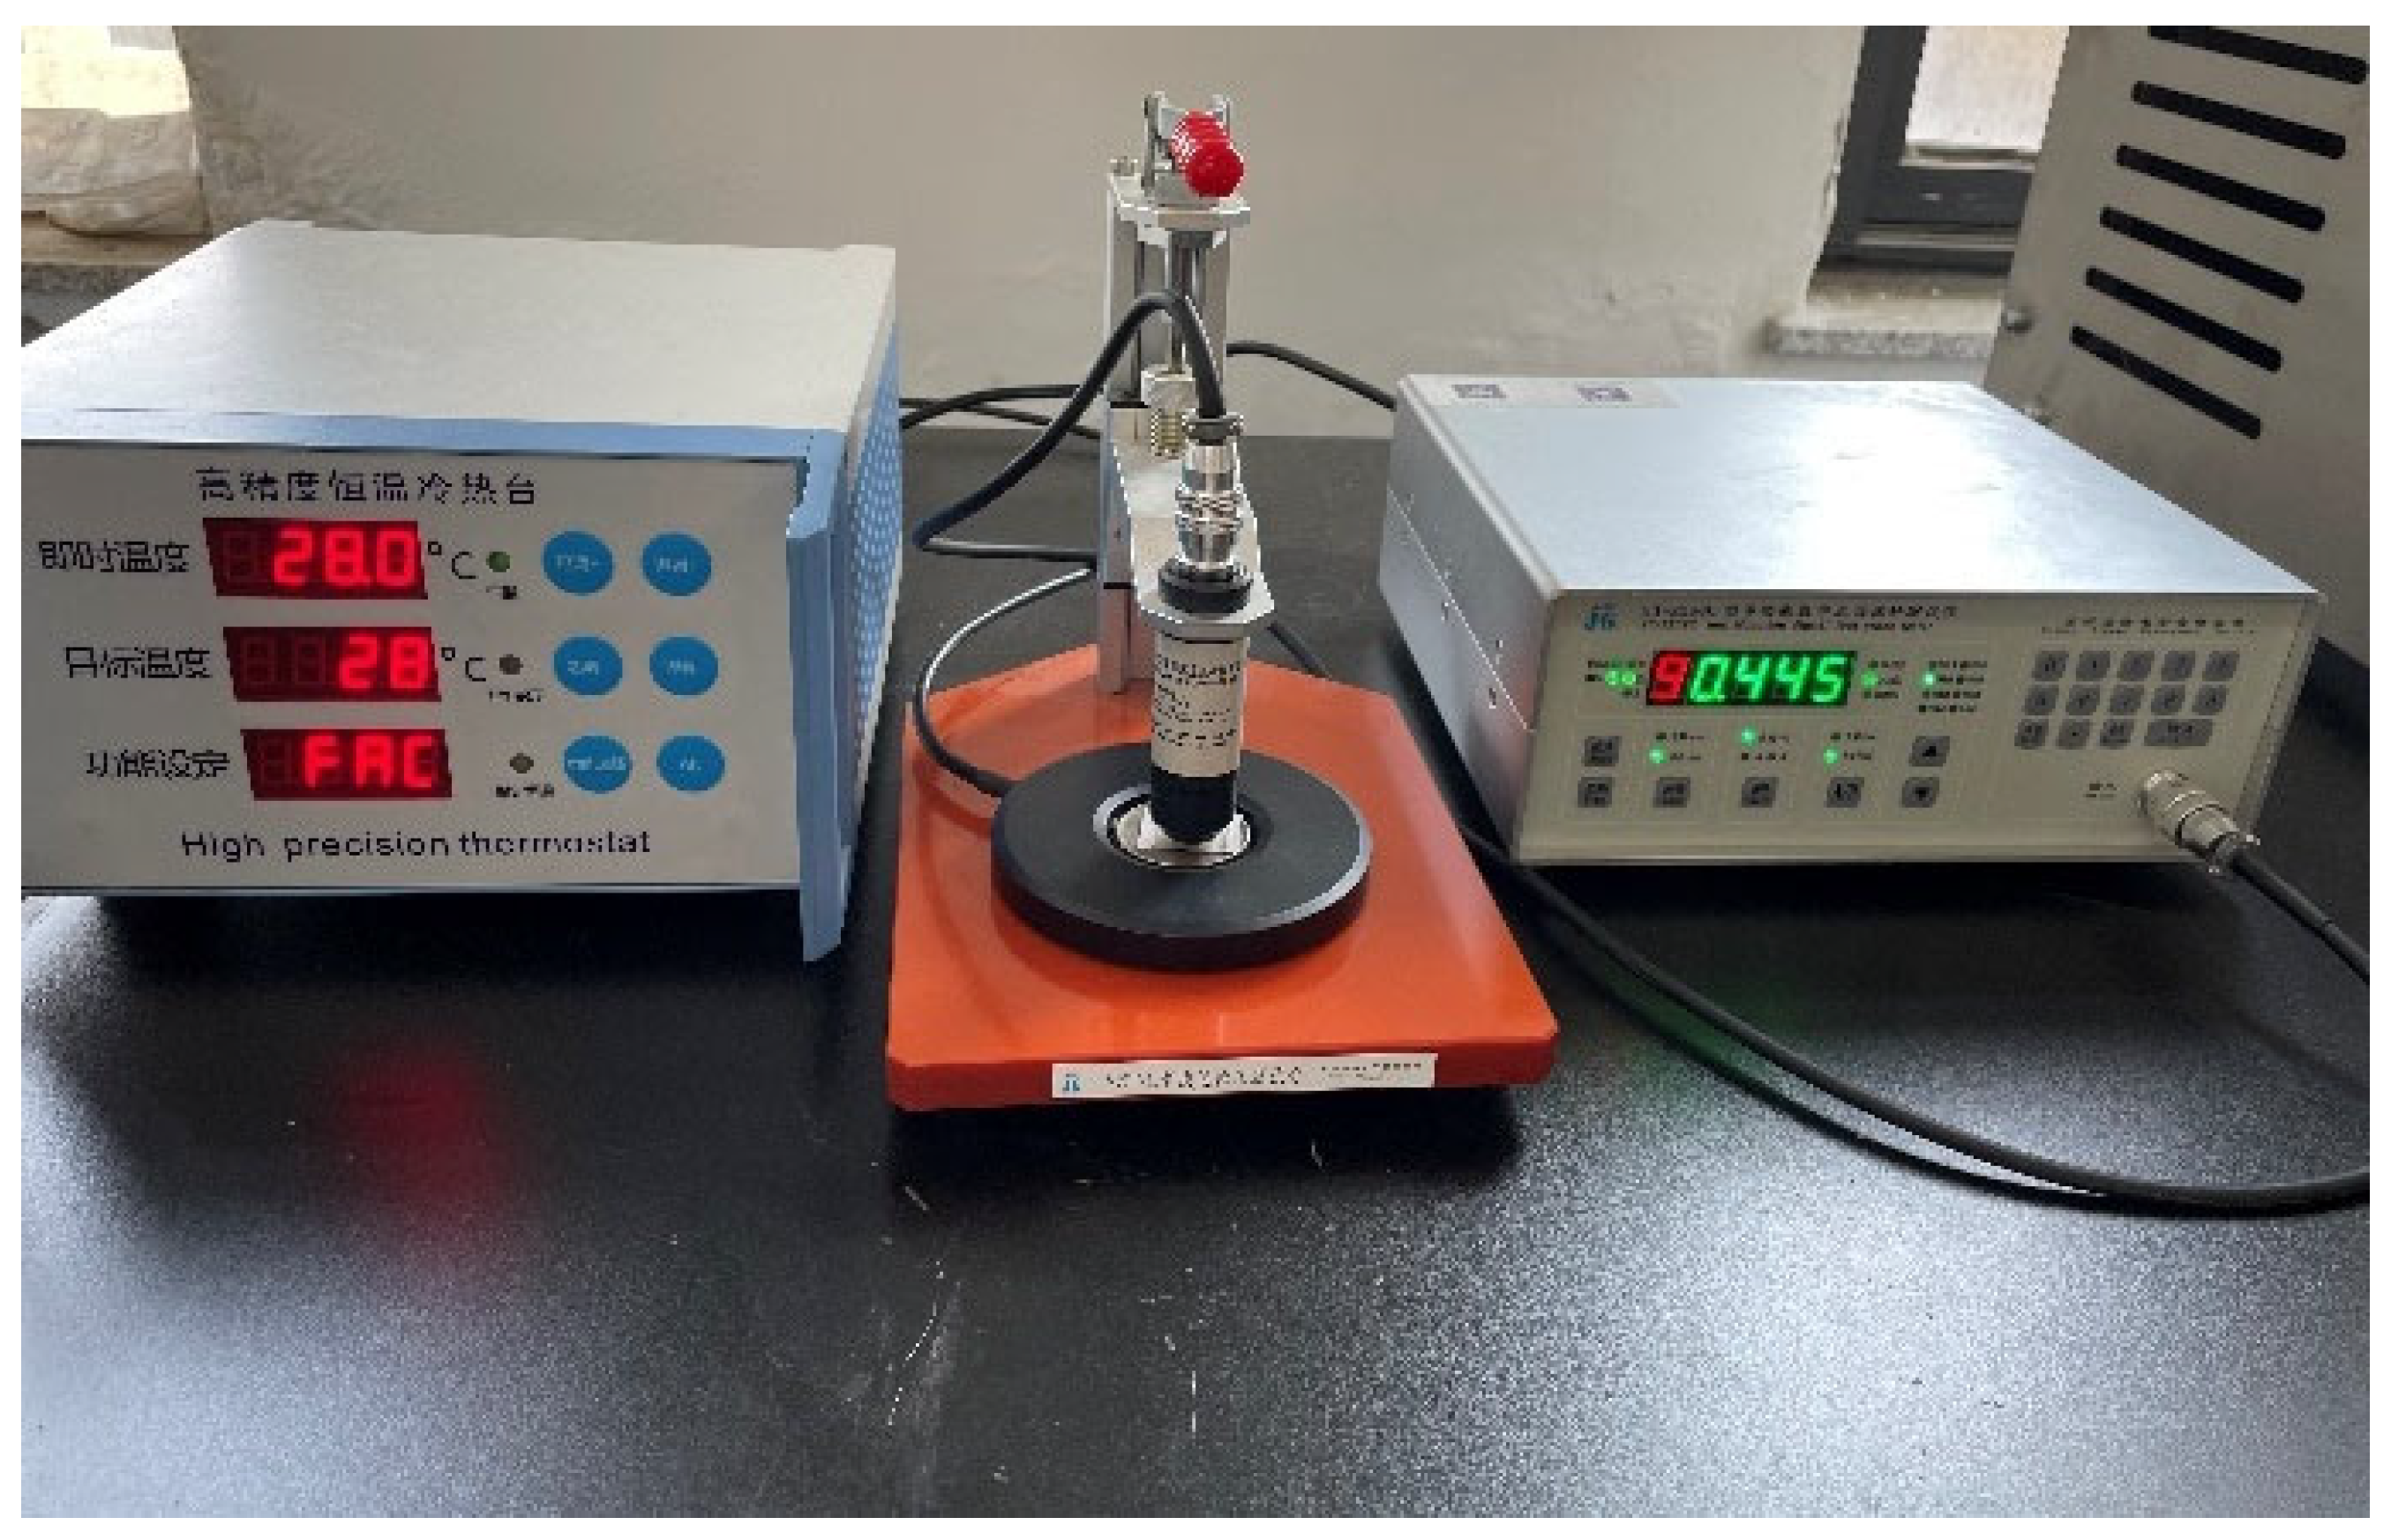
2.1. Materials and Test Instruments
2.2. Fabrication of Flexible Ag Temperature Sensors
3. Results and Discussion
3.1. Static Characteristic Analysis
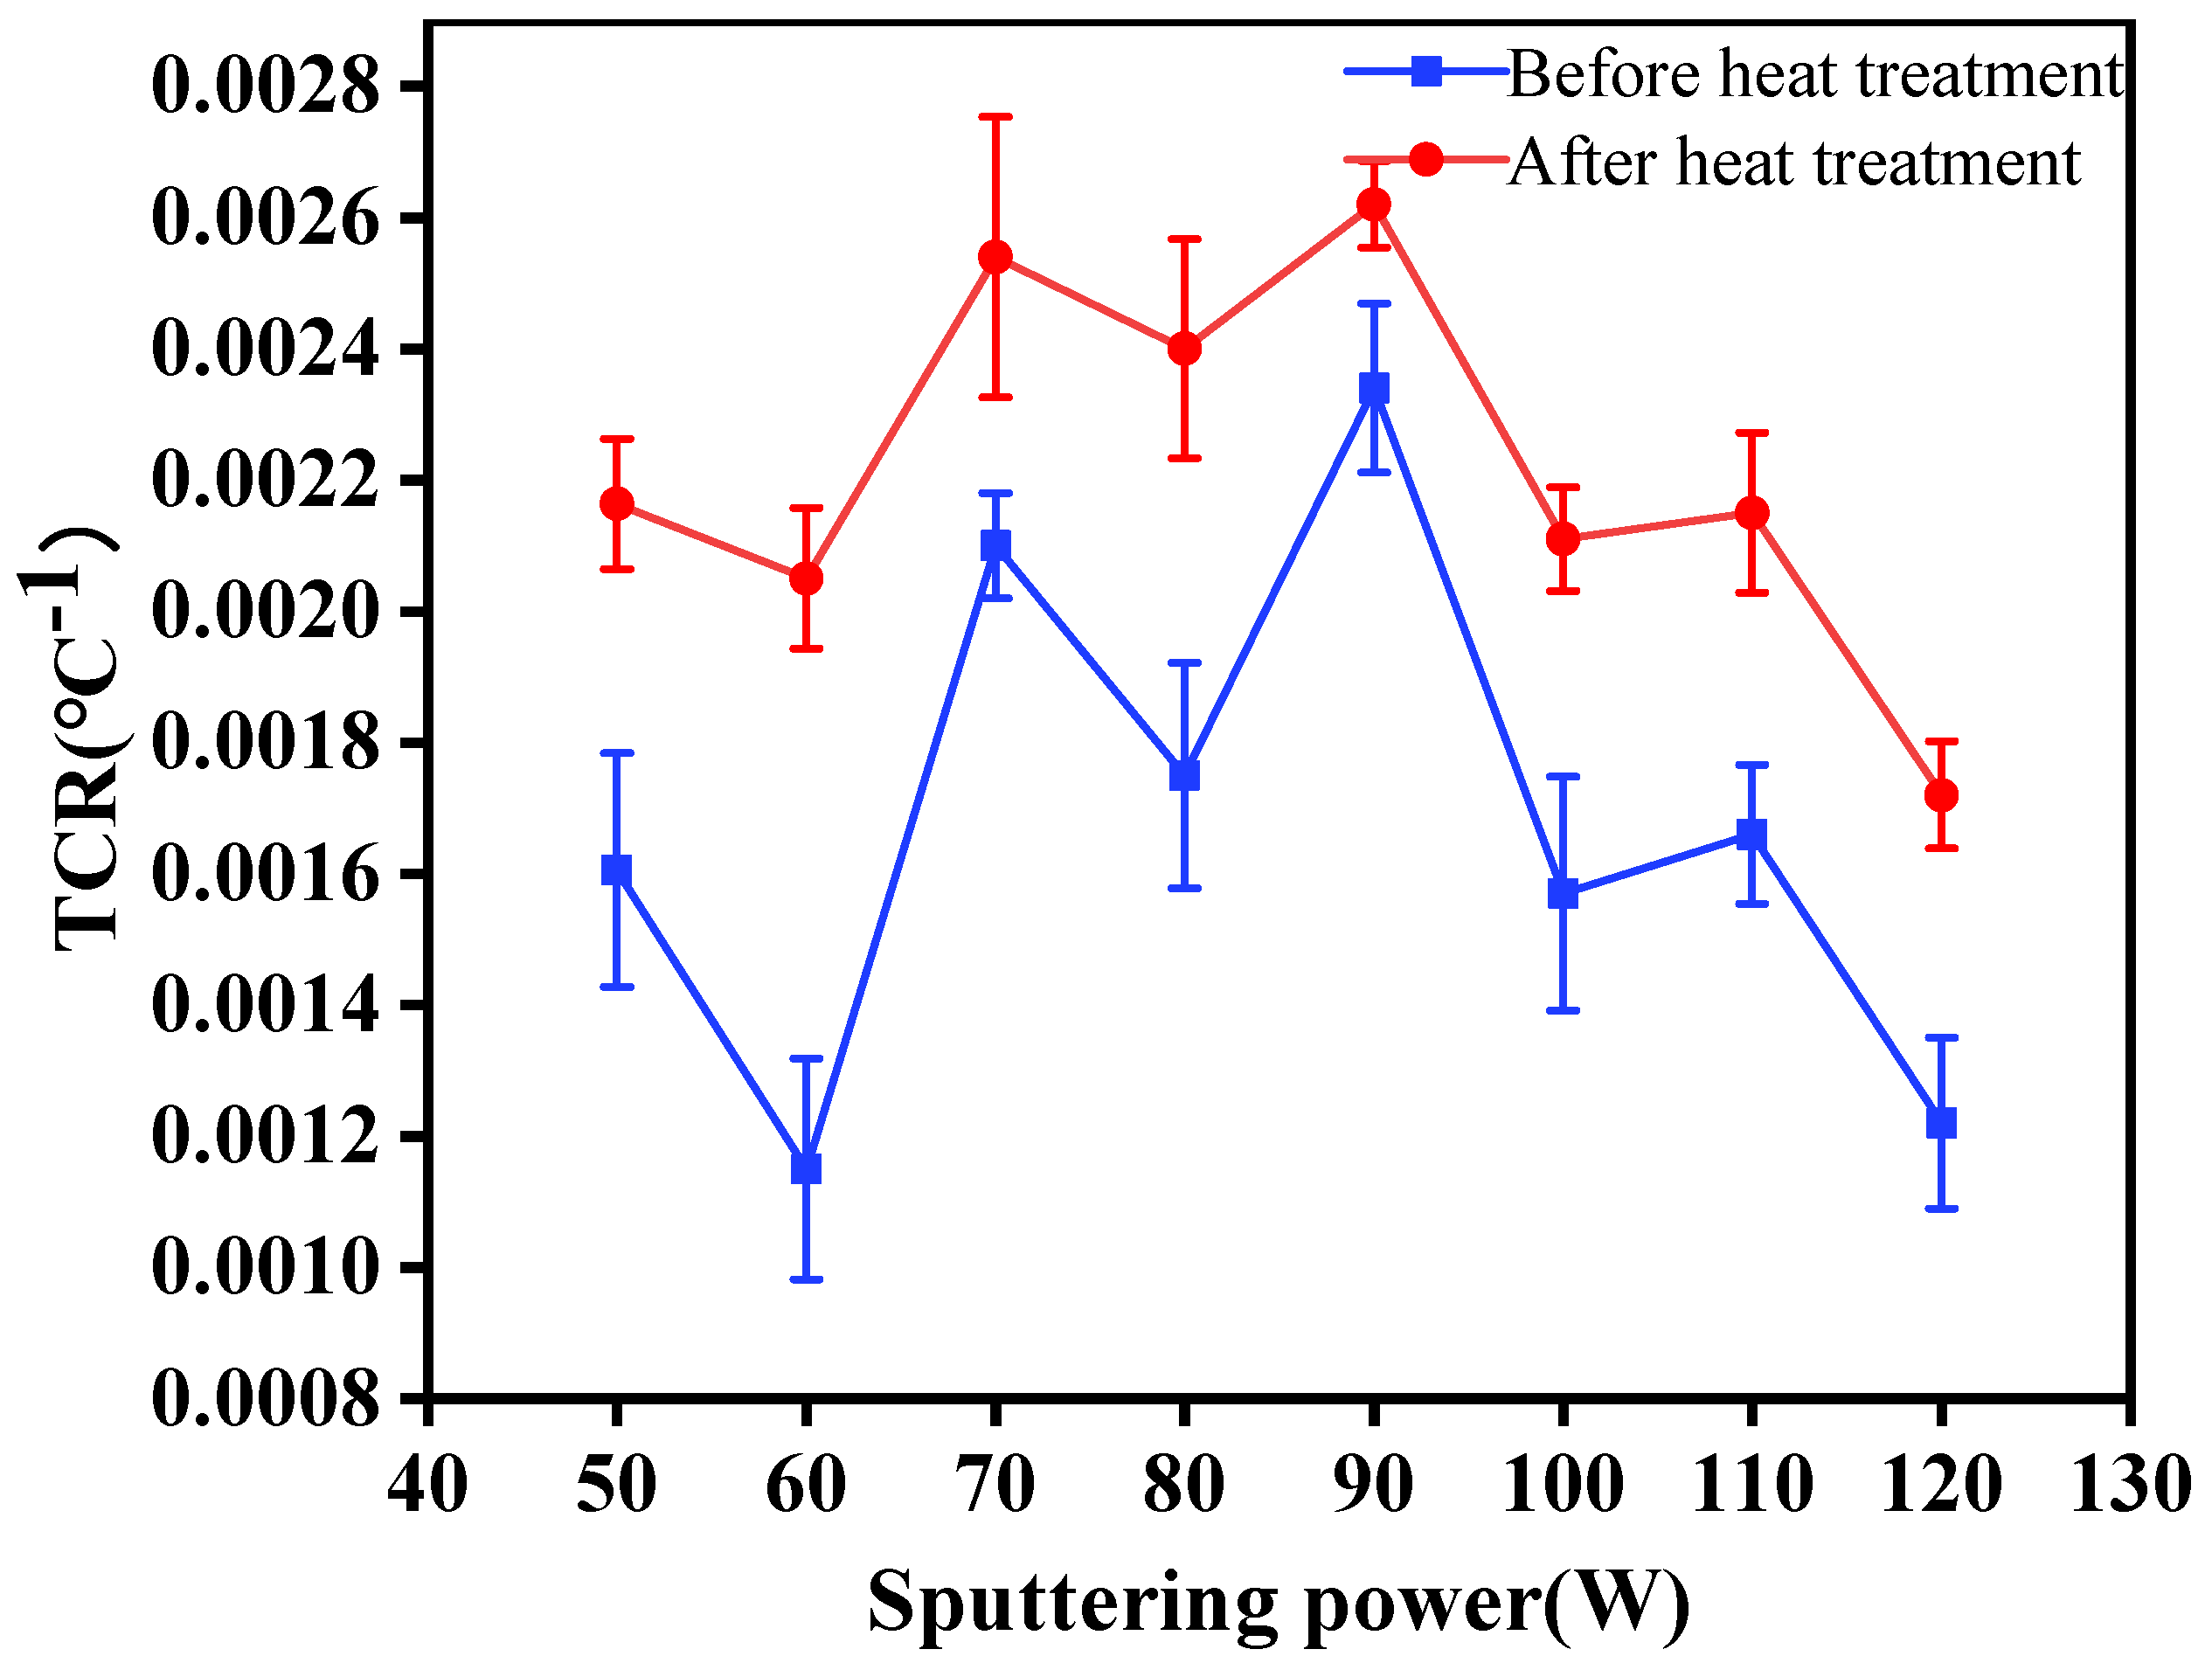
3.1.1. Temperature Coefficient of Resistance
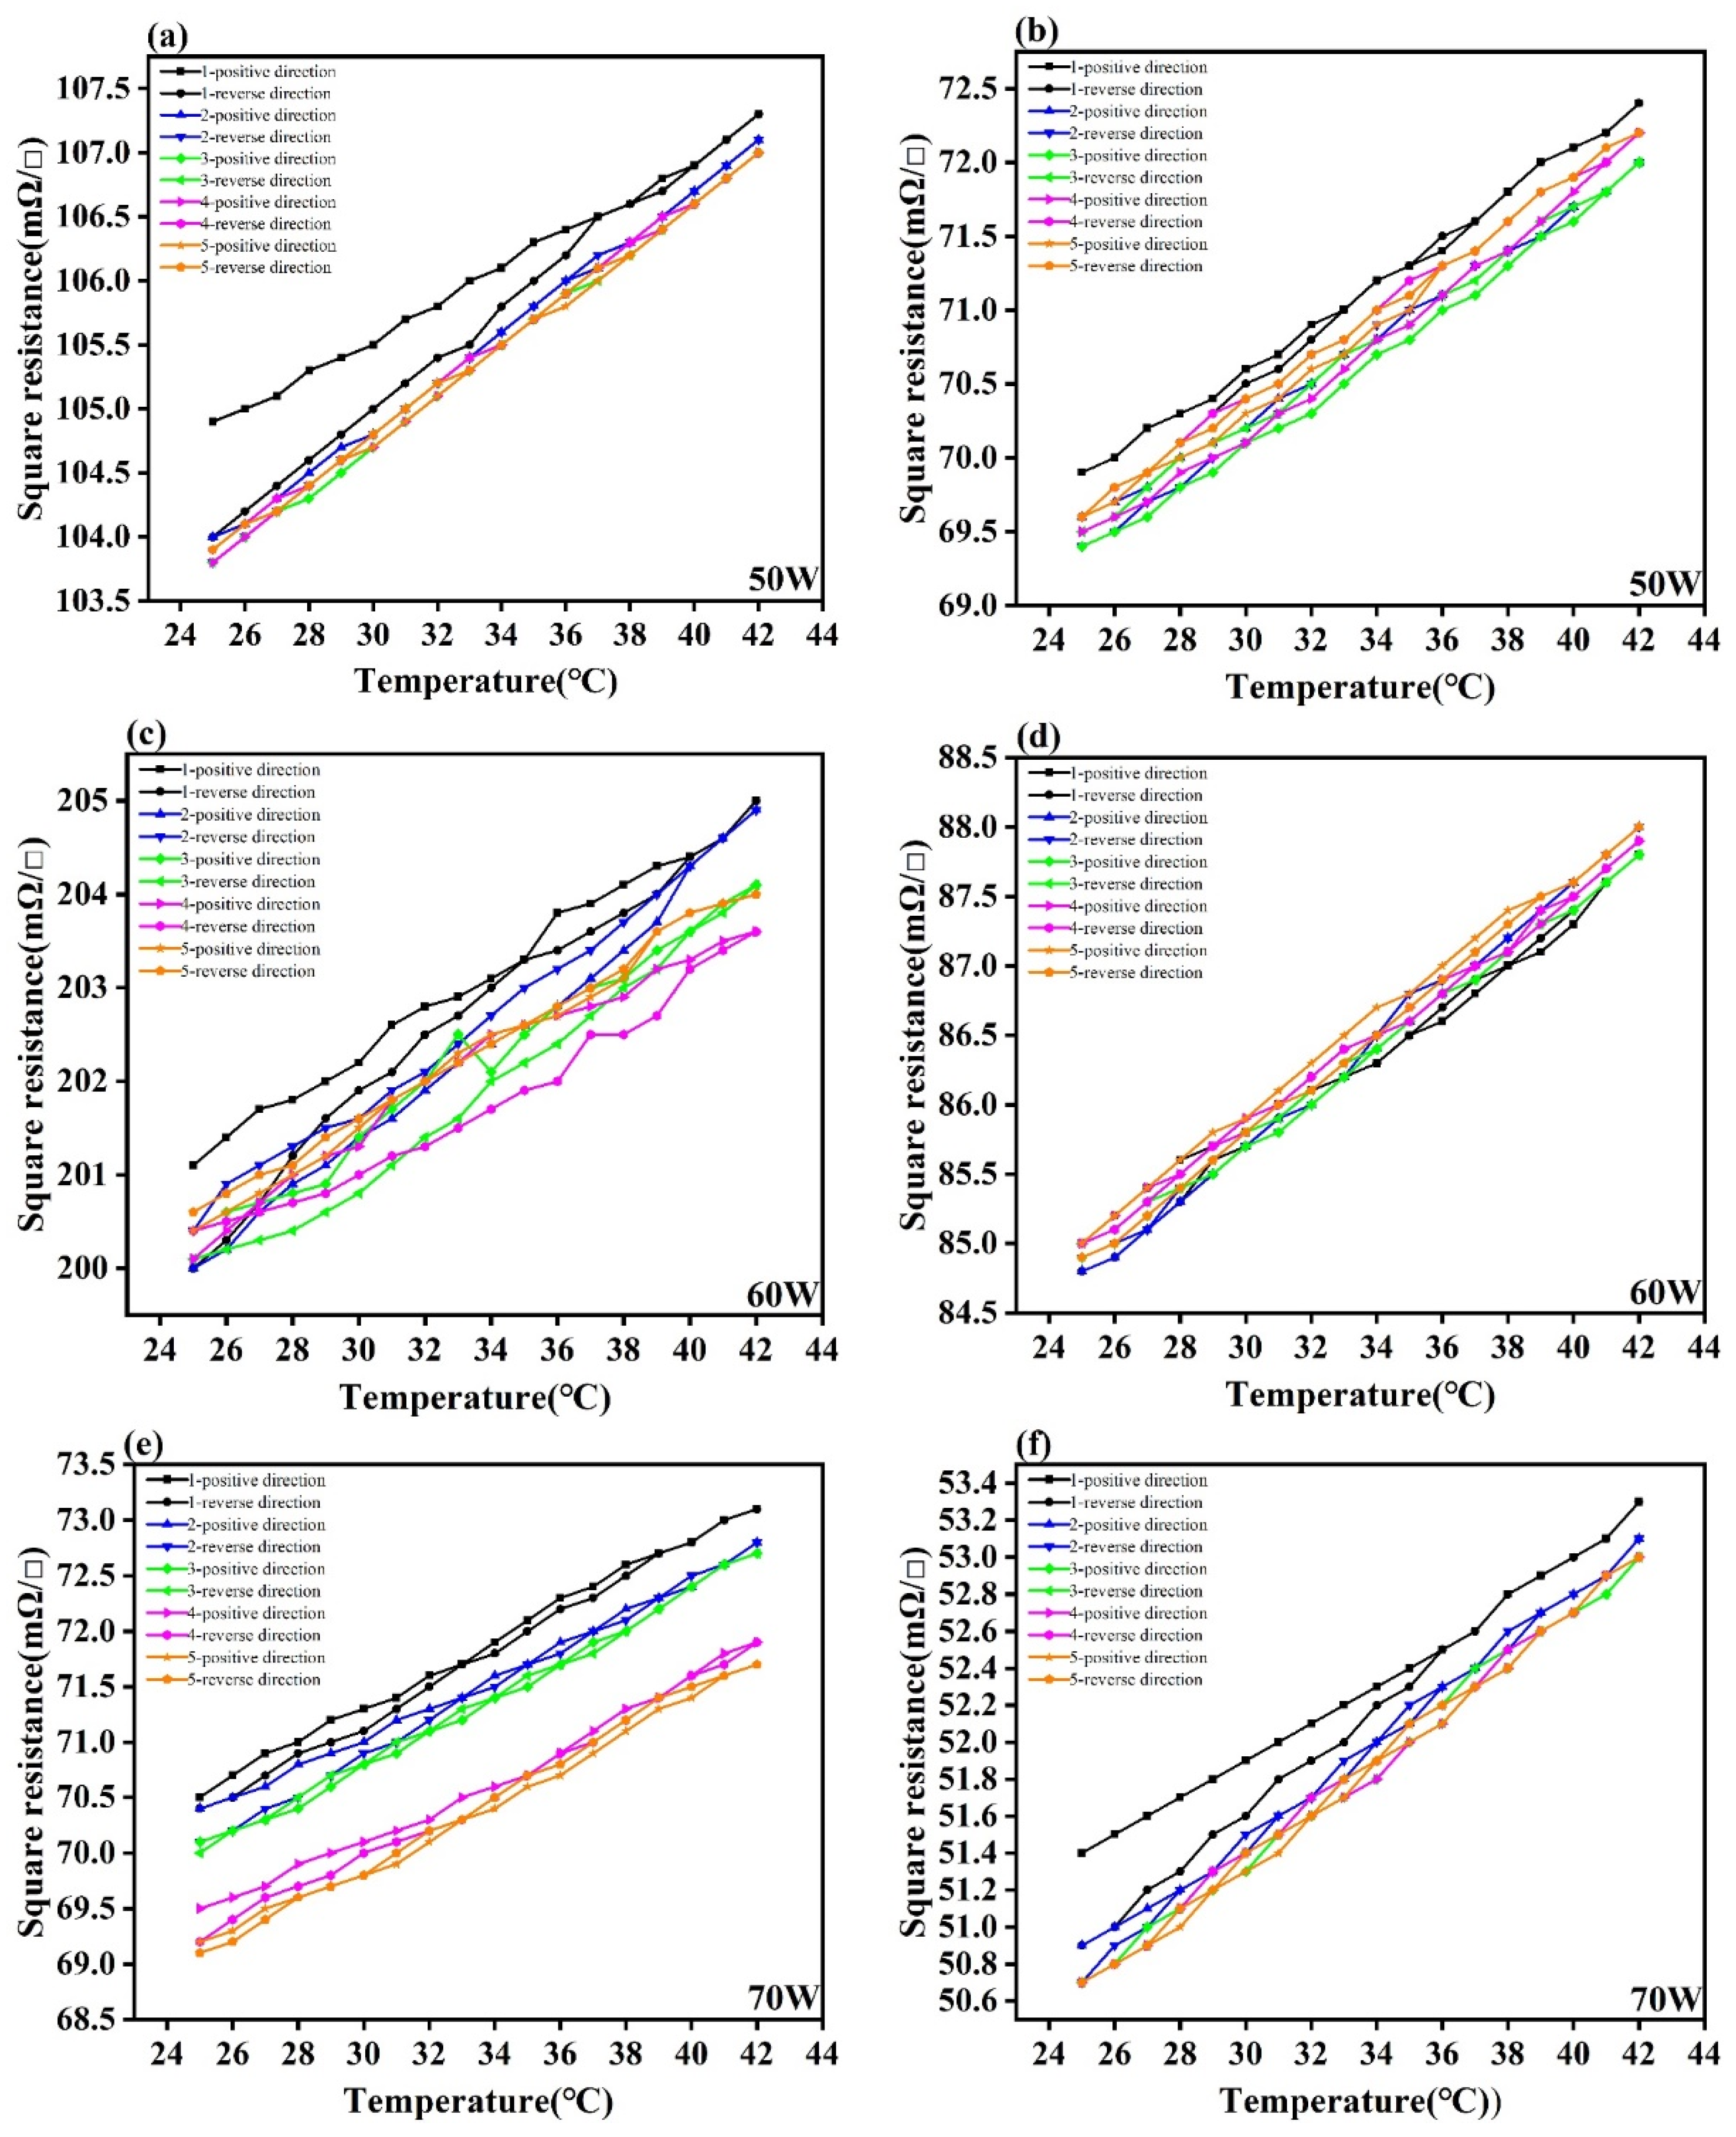
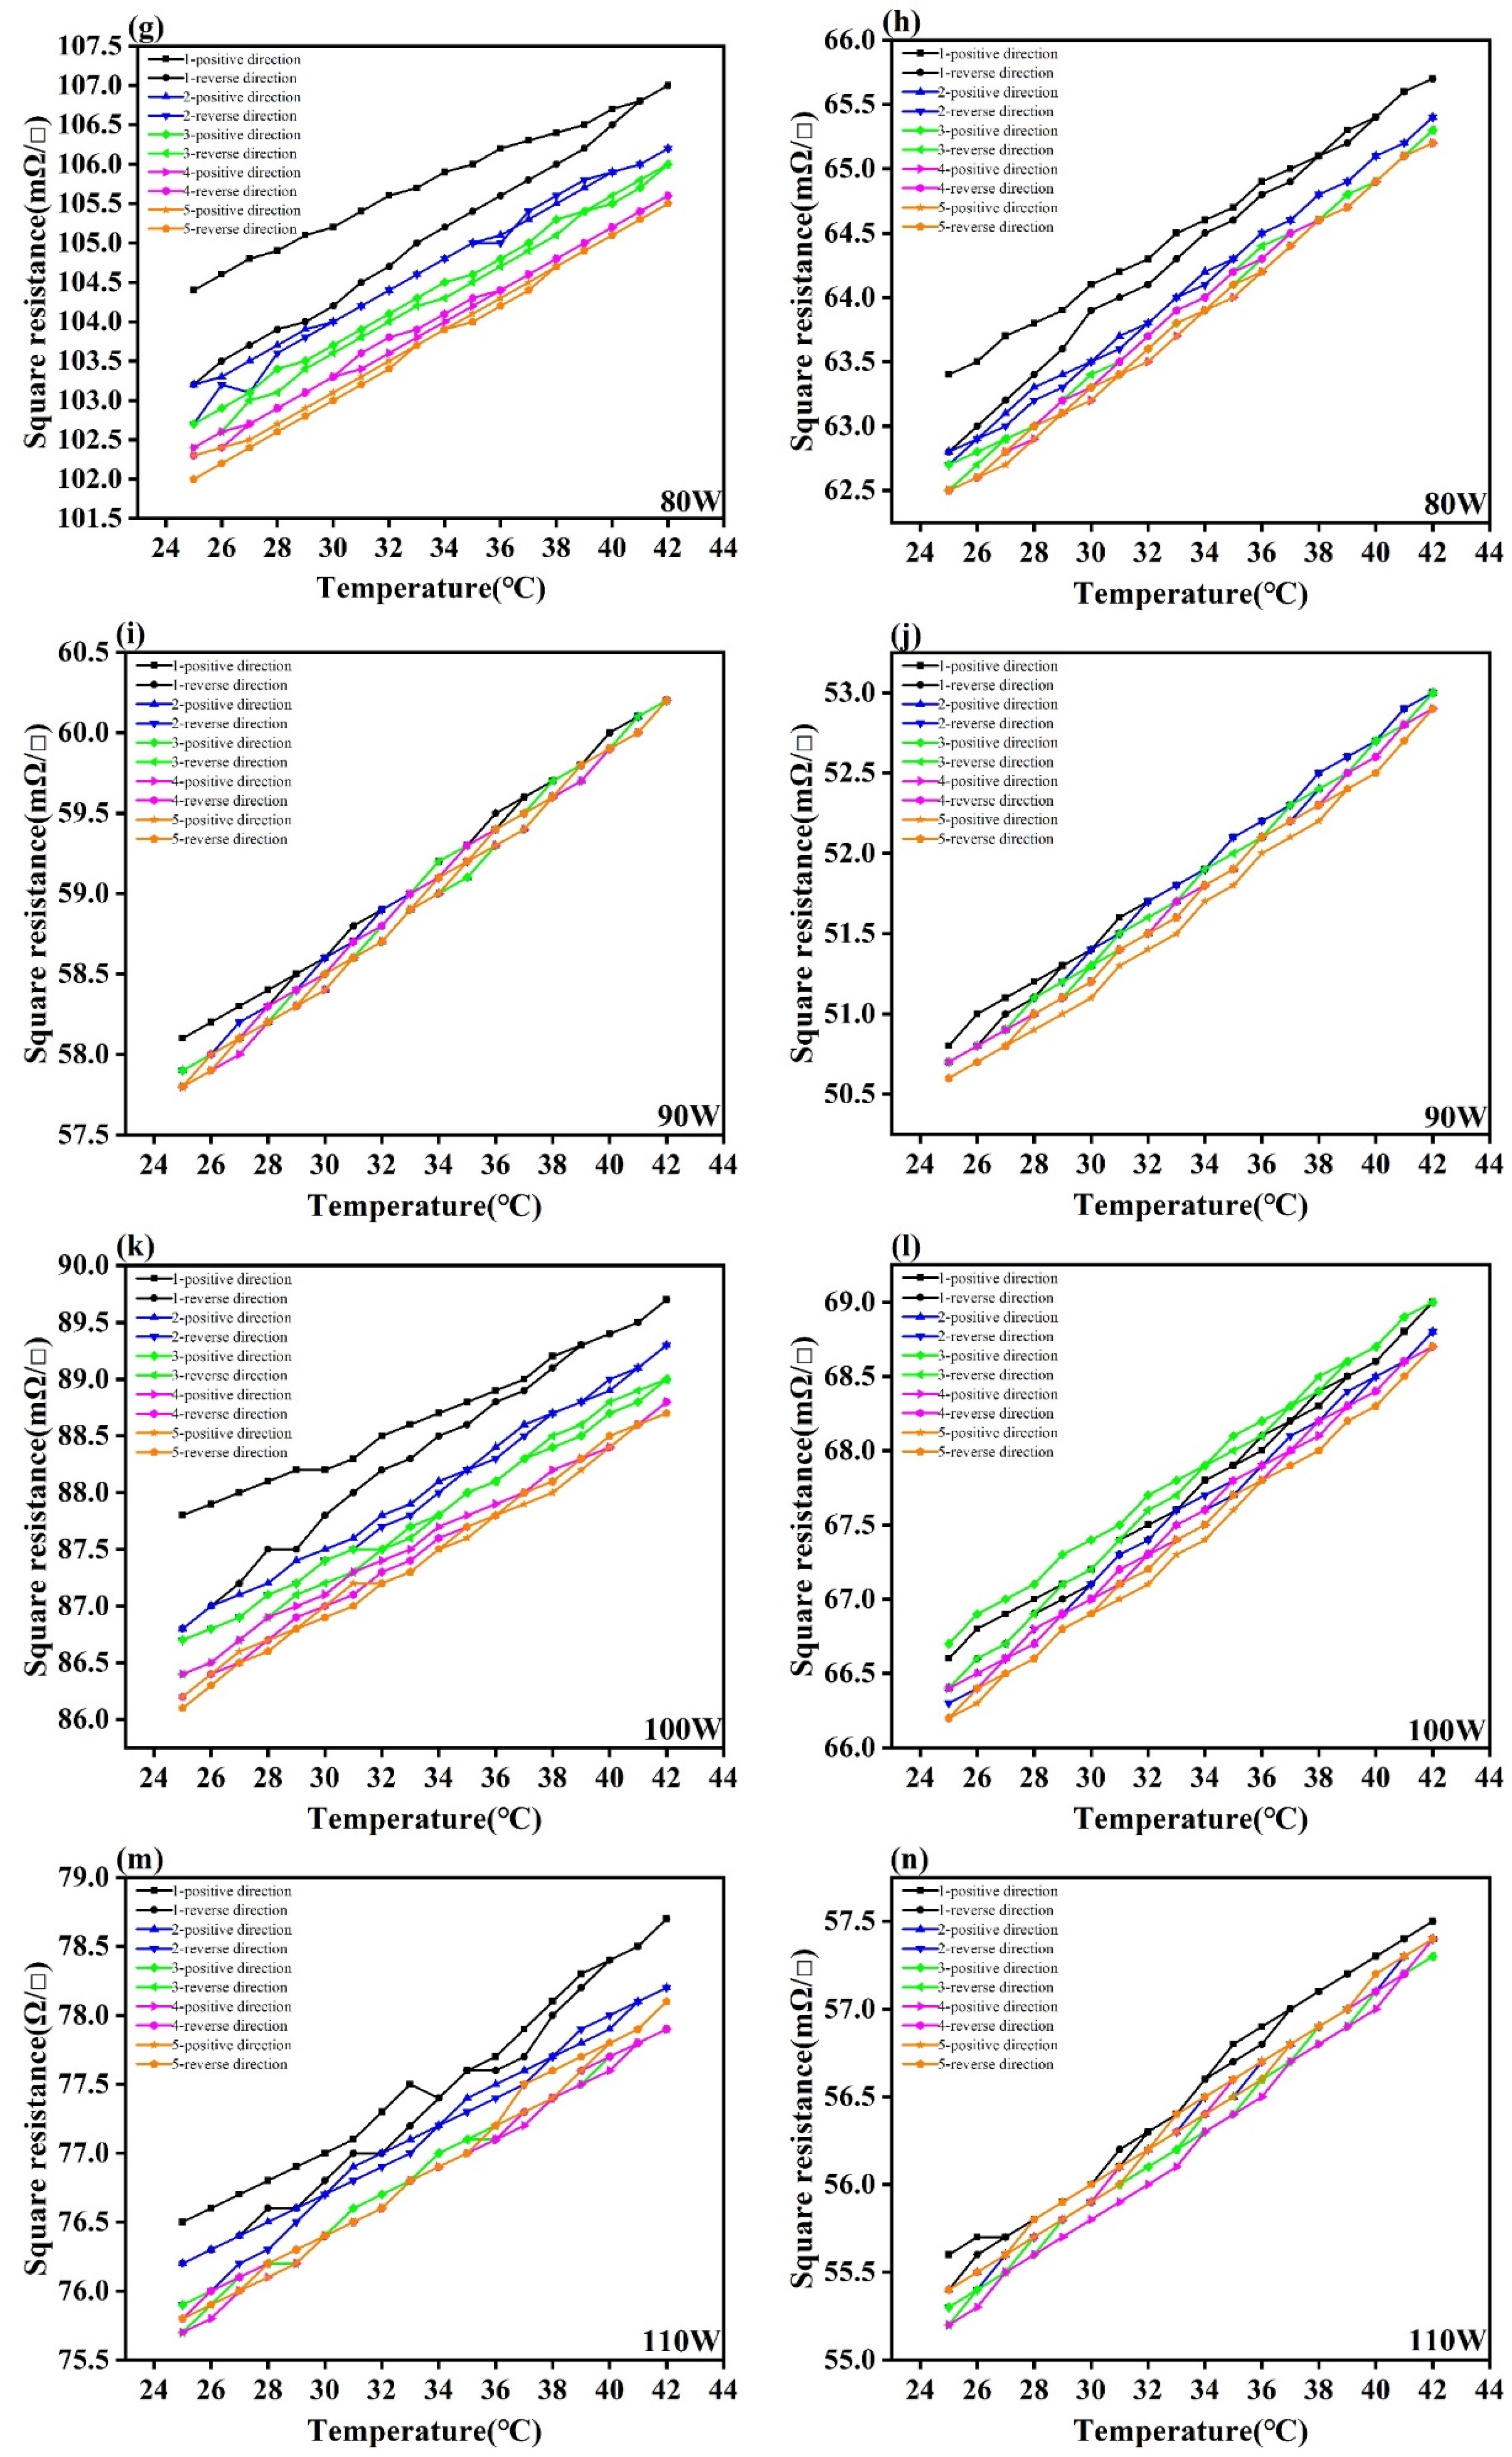
3.1.2. Linearity Analysis
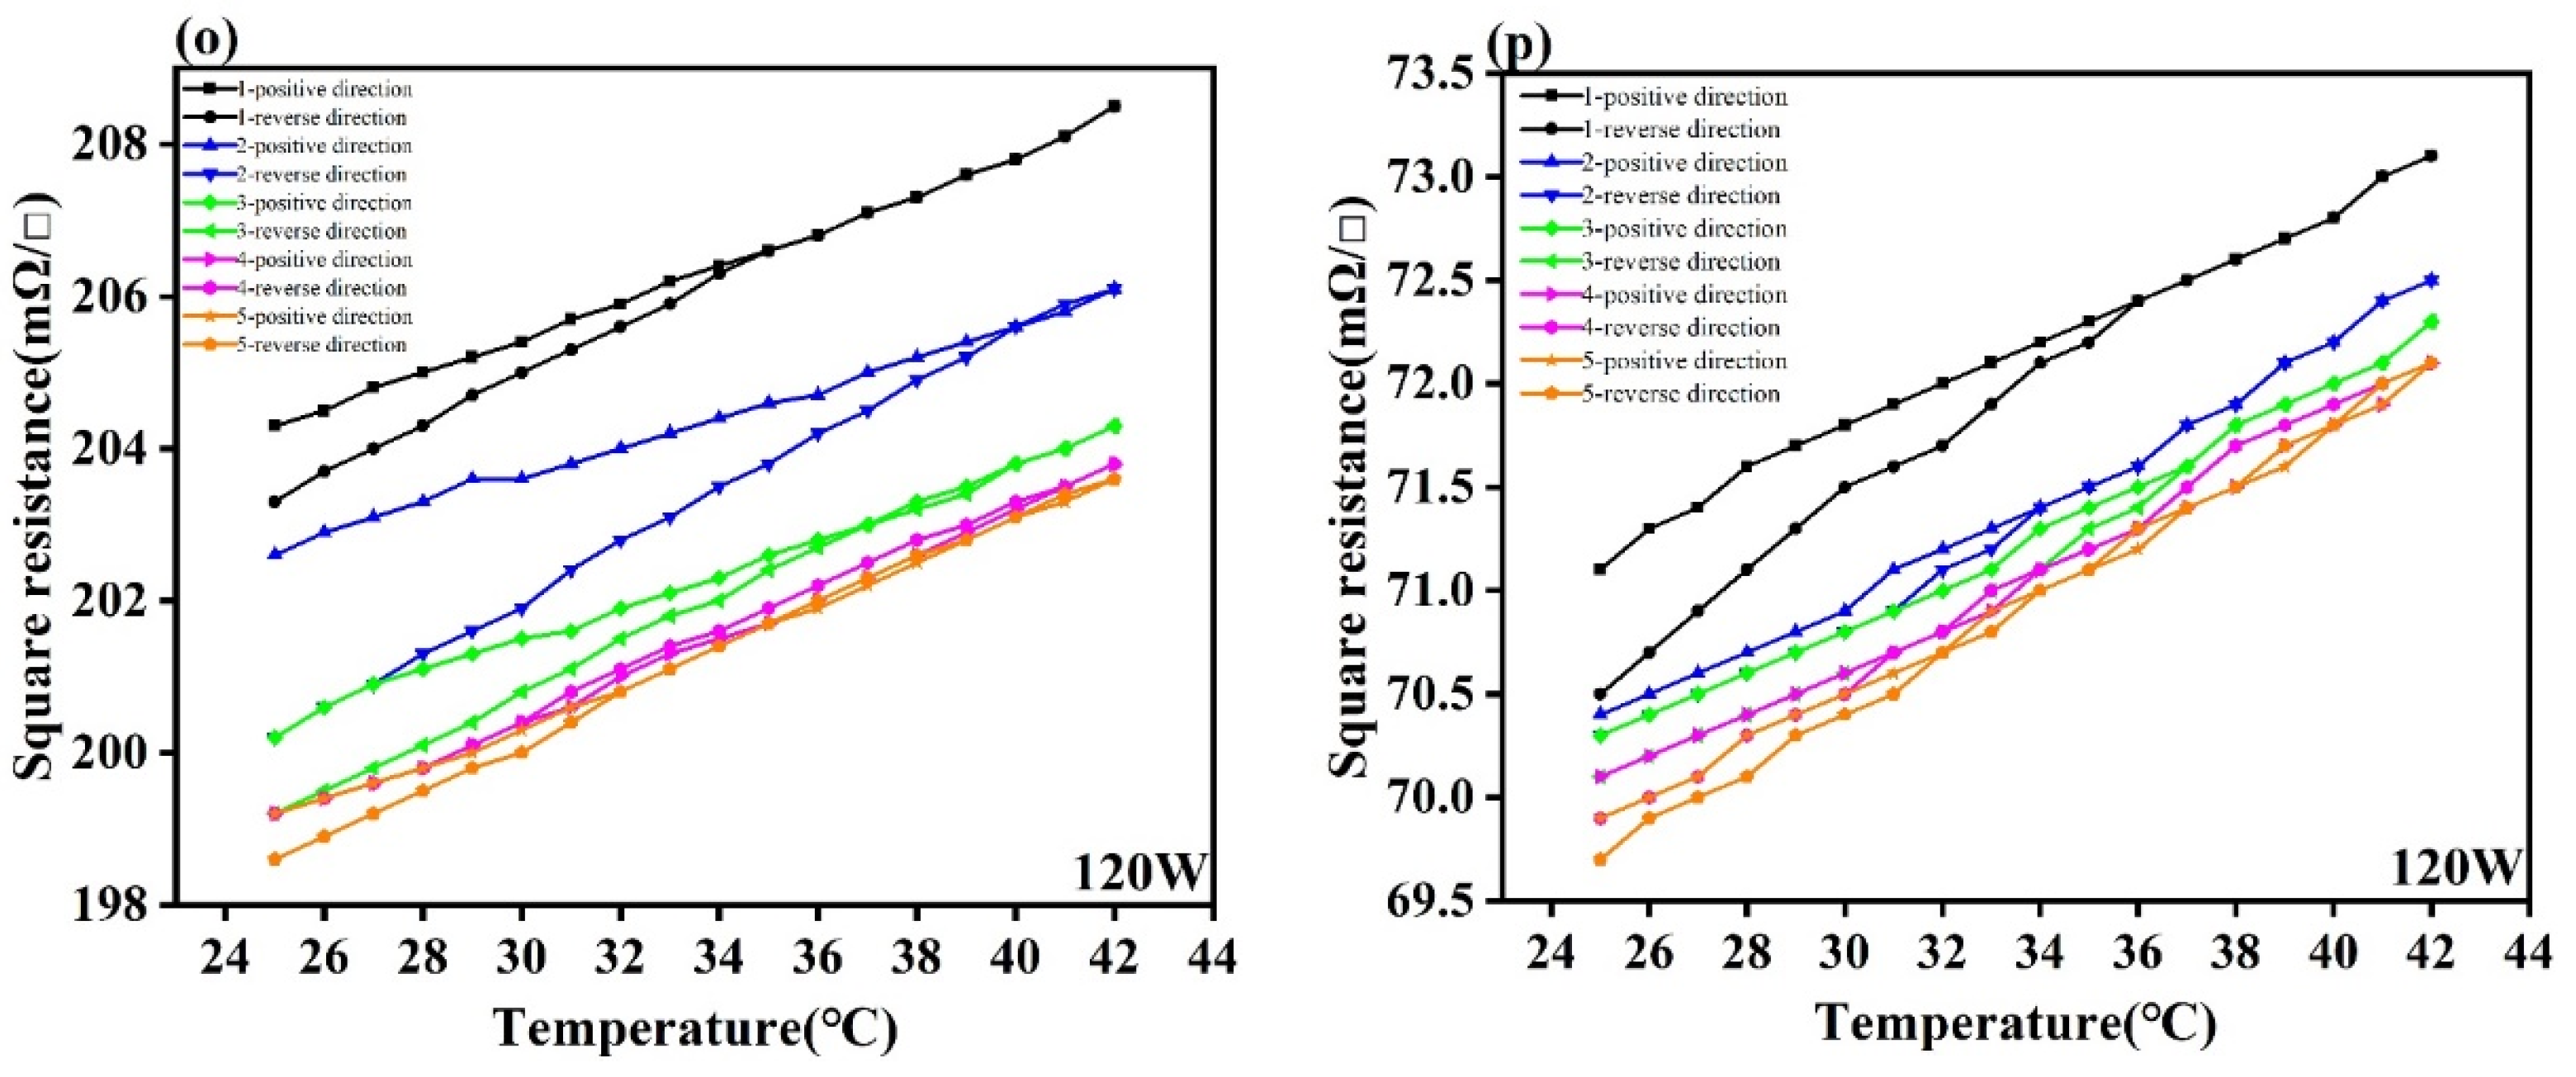
3.1.3. Hysteresis Analysis
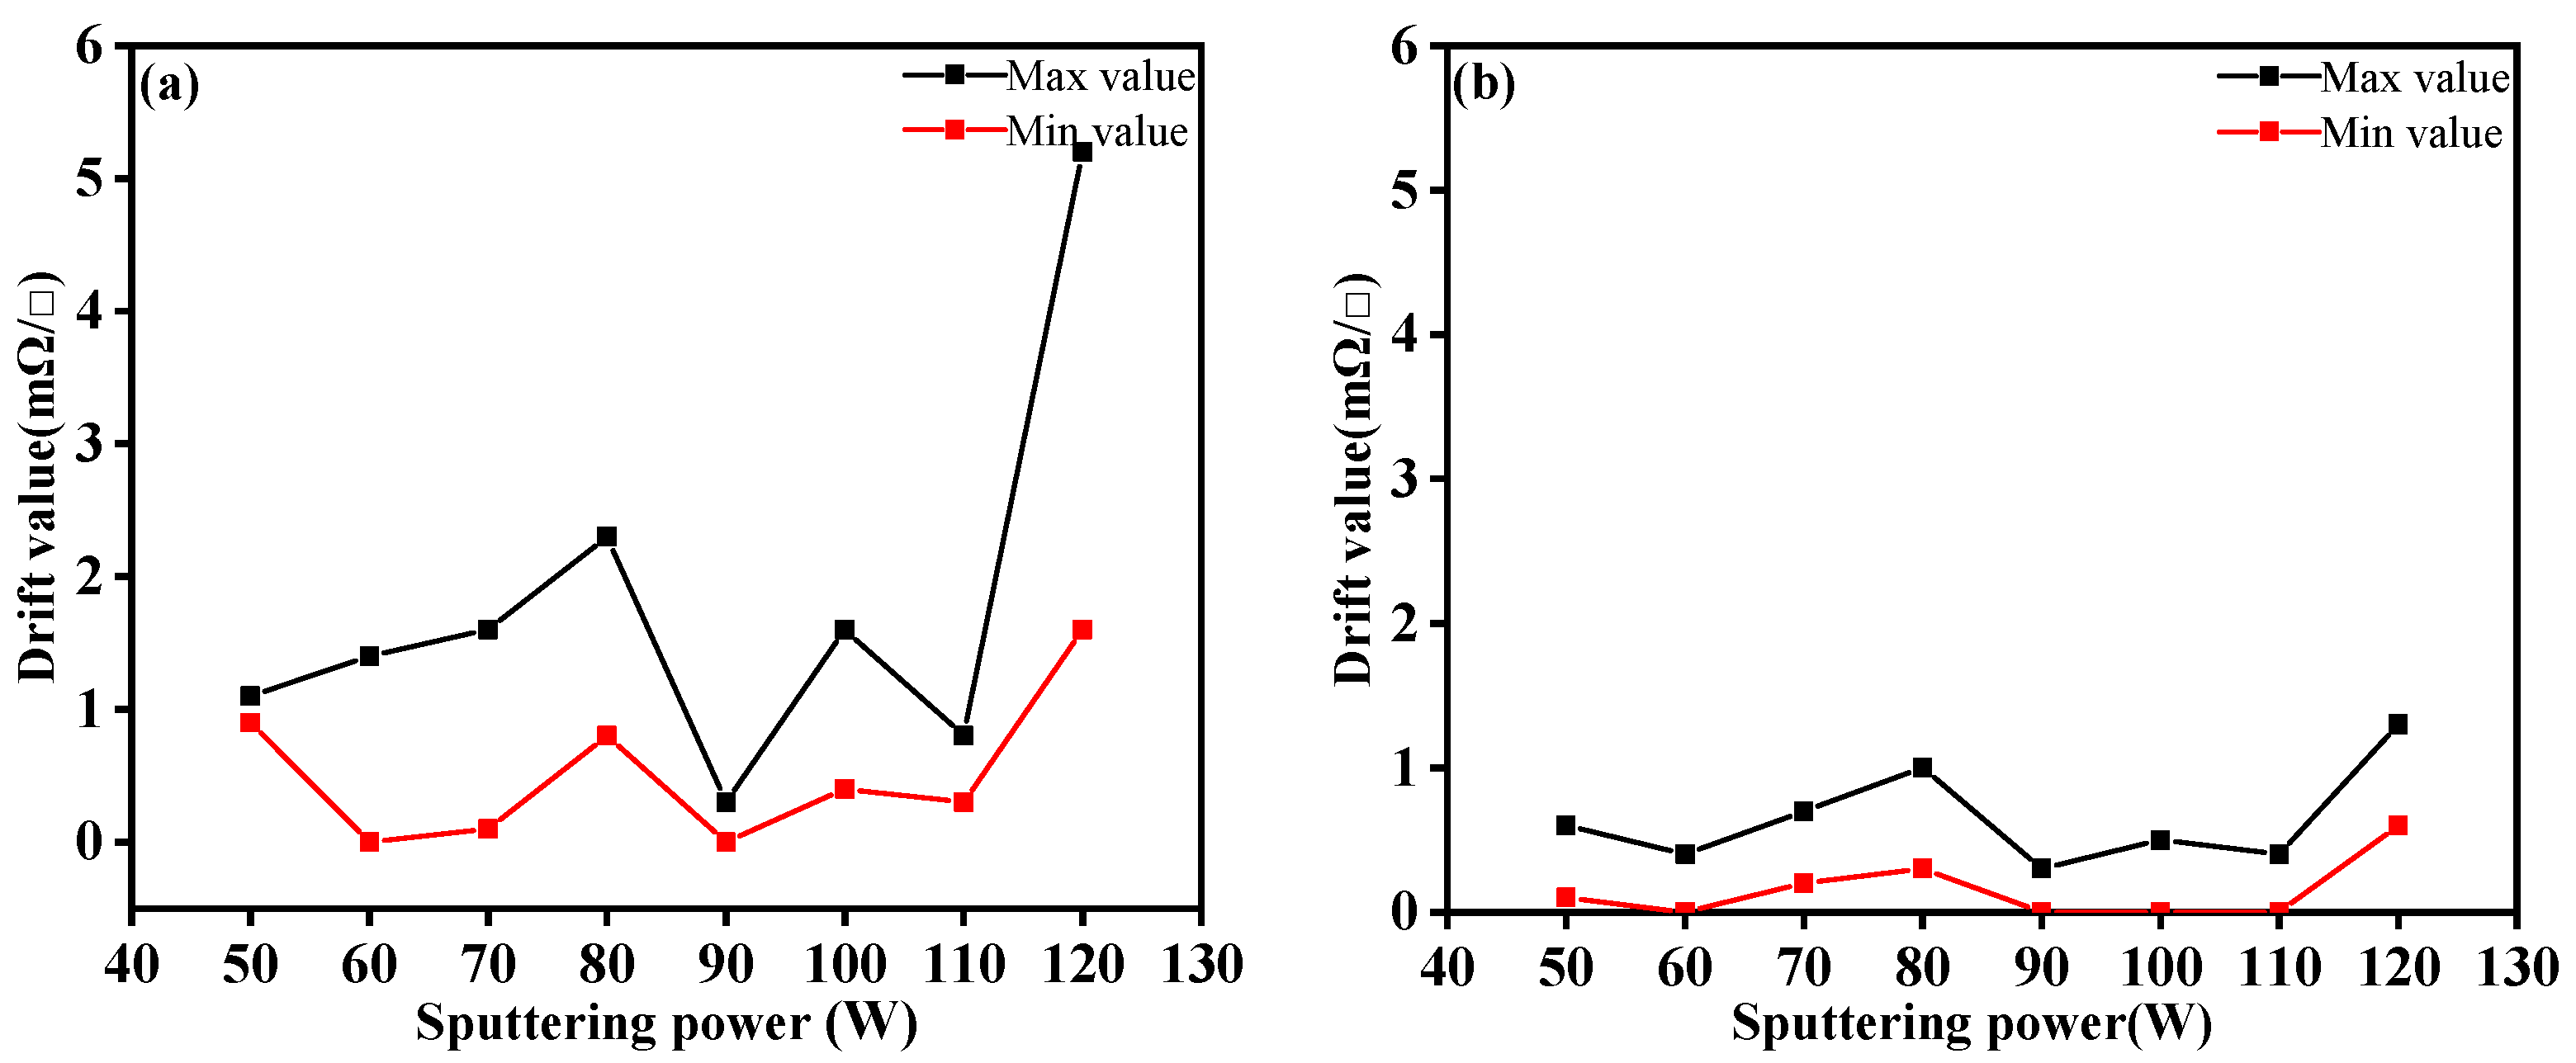
3.1.4. Drift
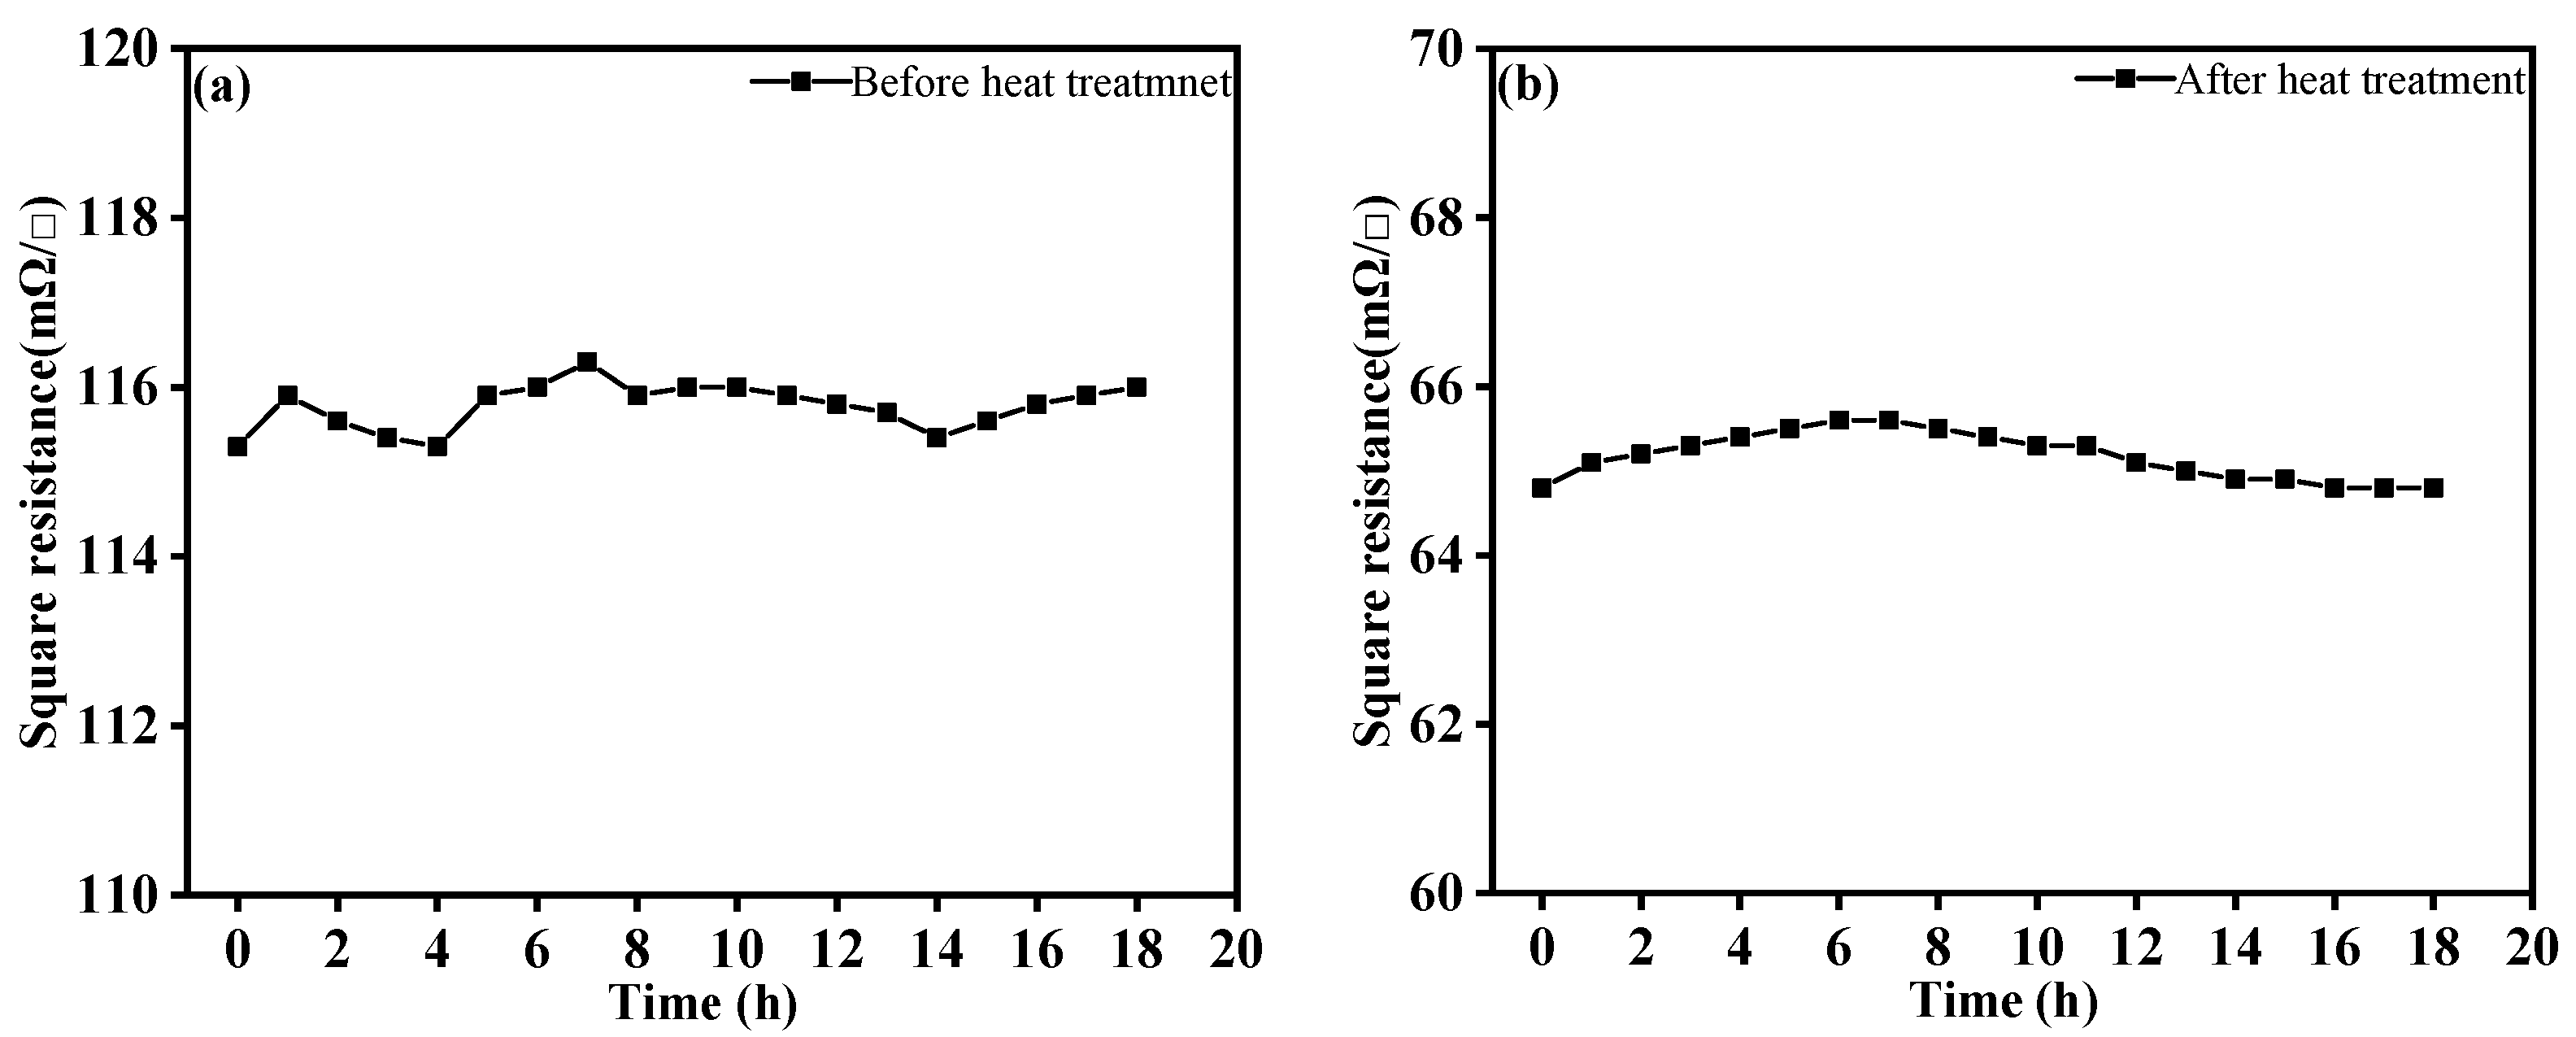
3.1.5. Reliability
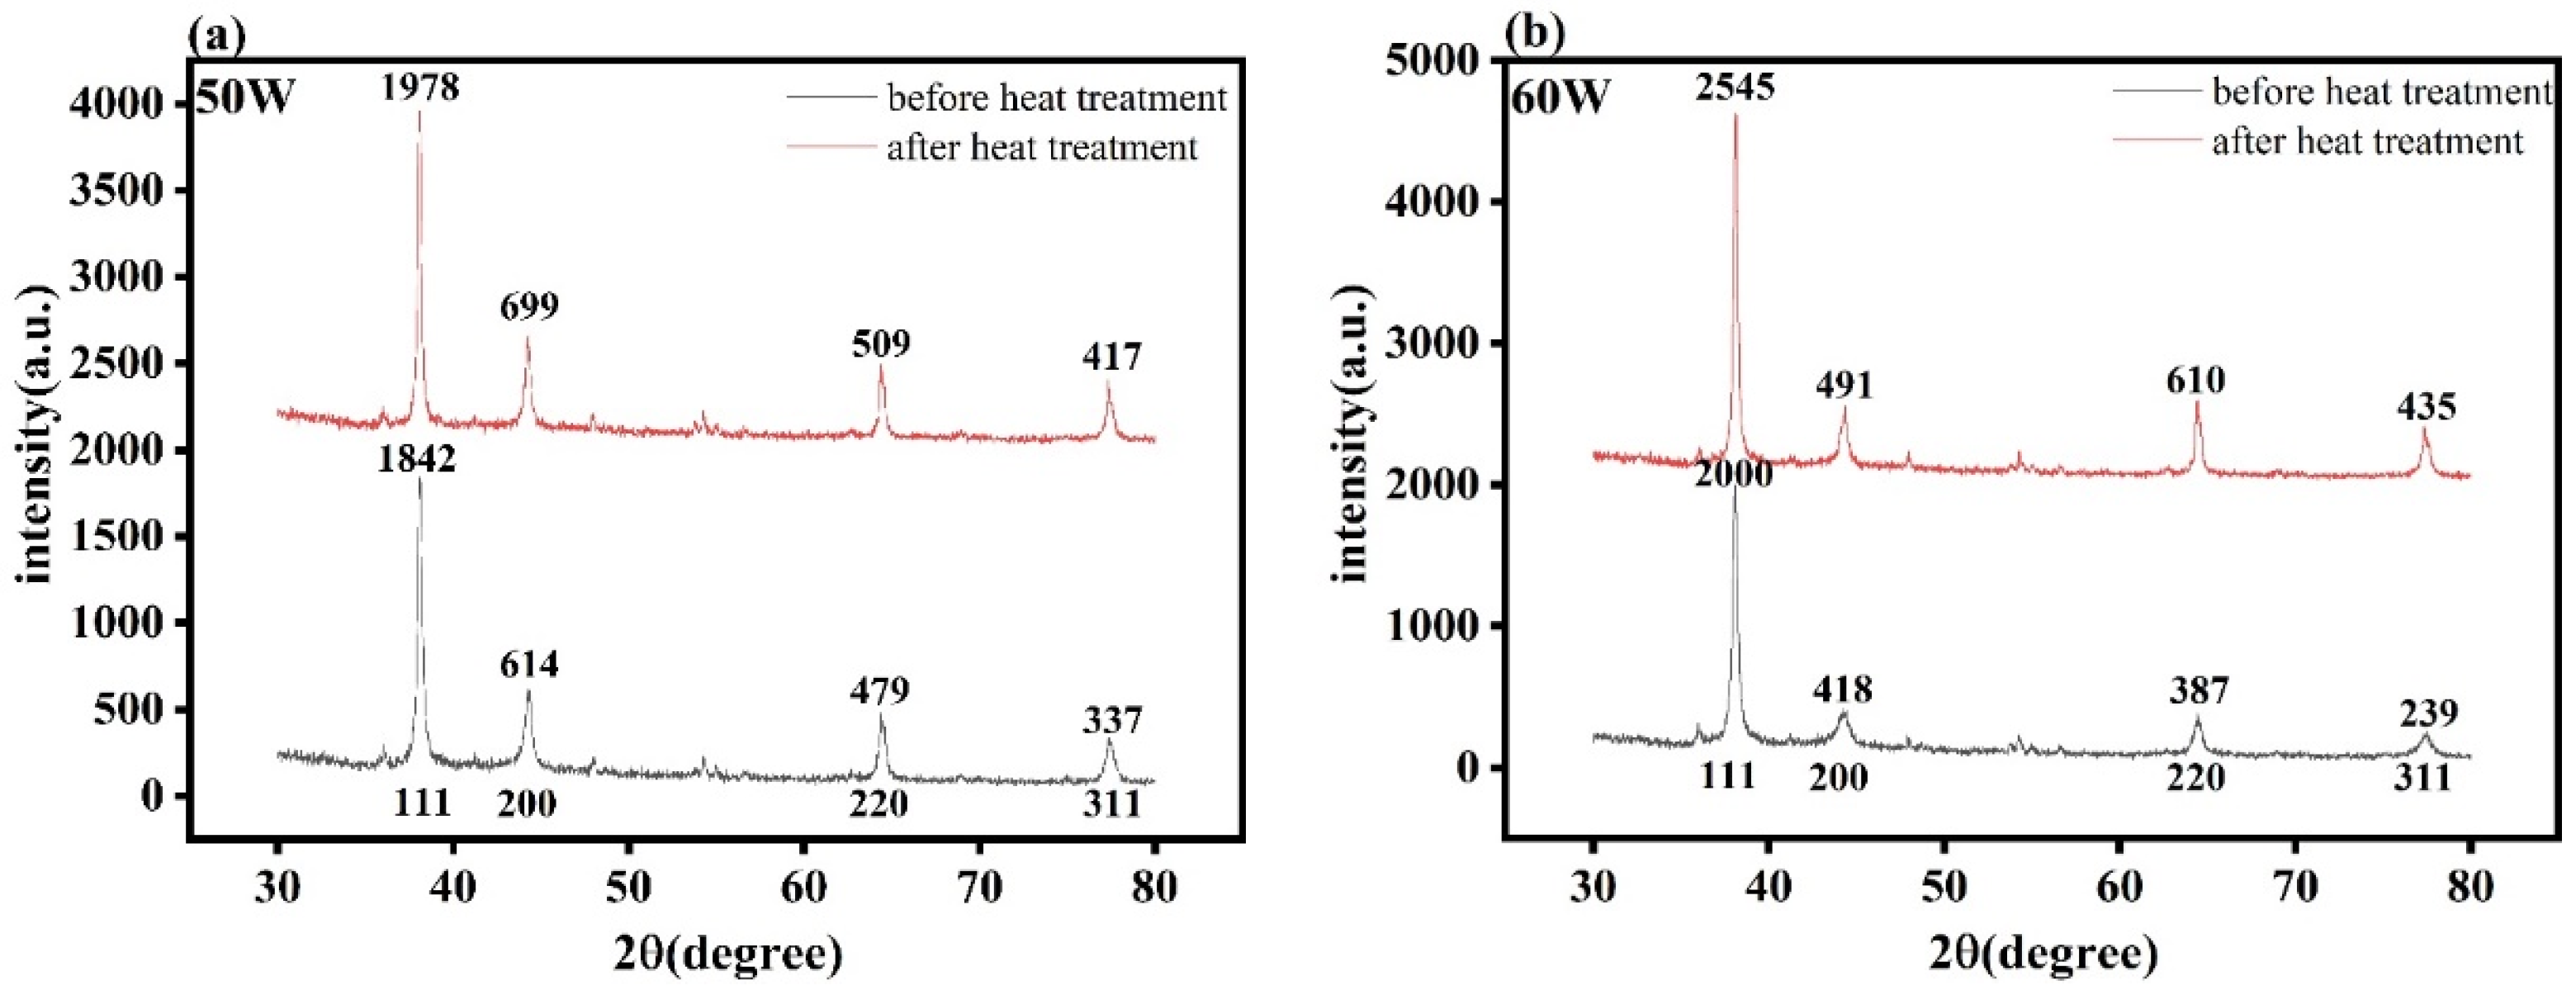
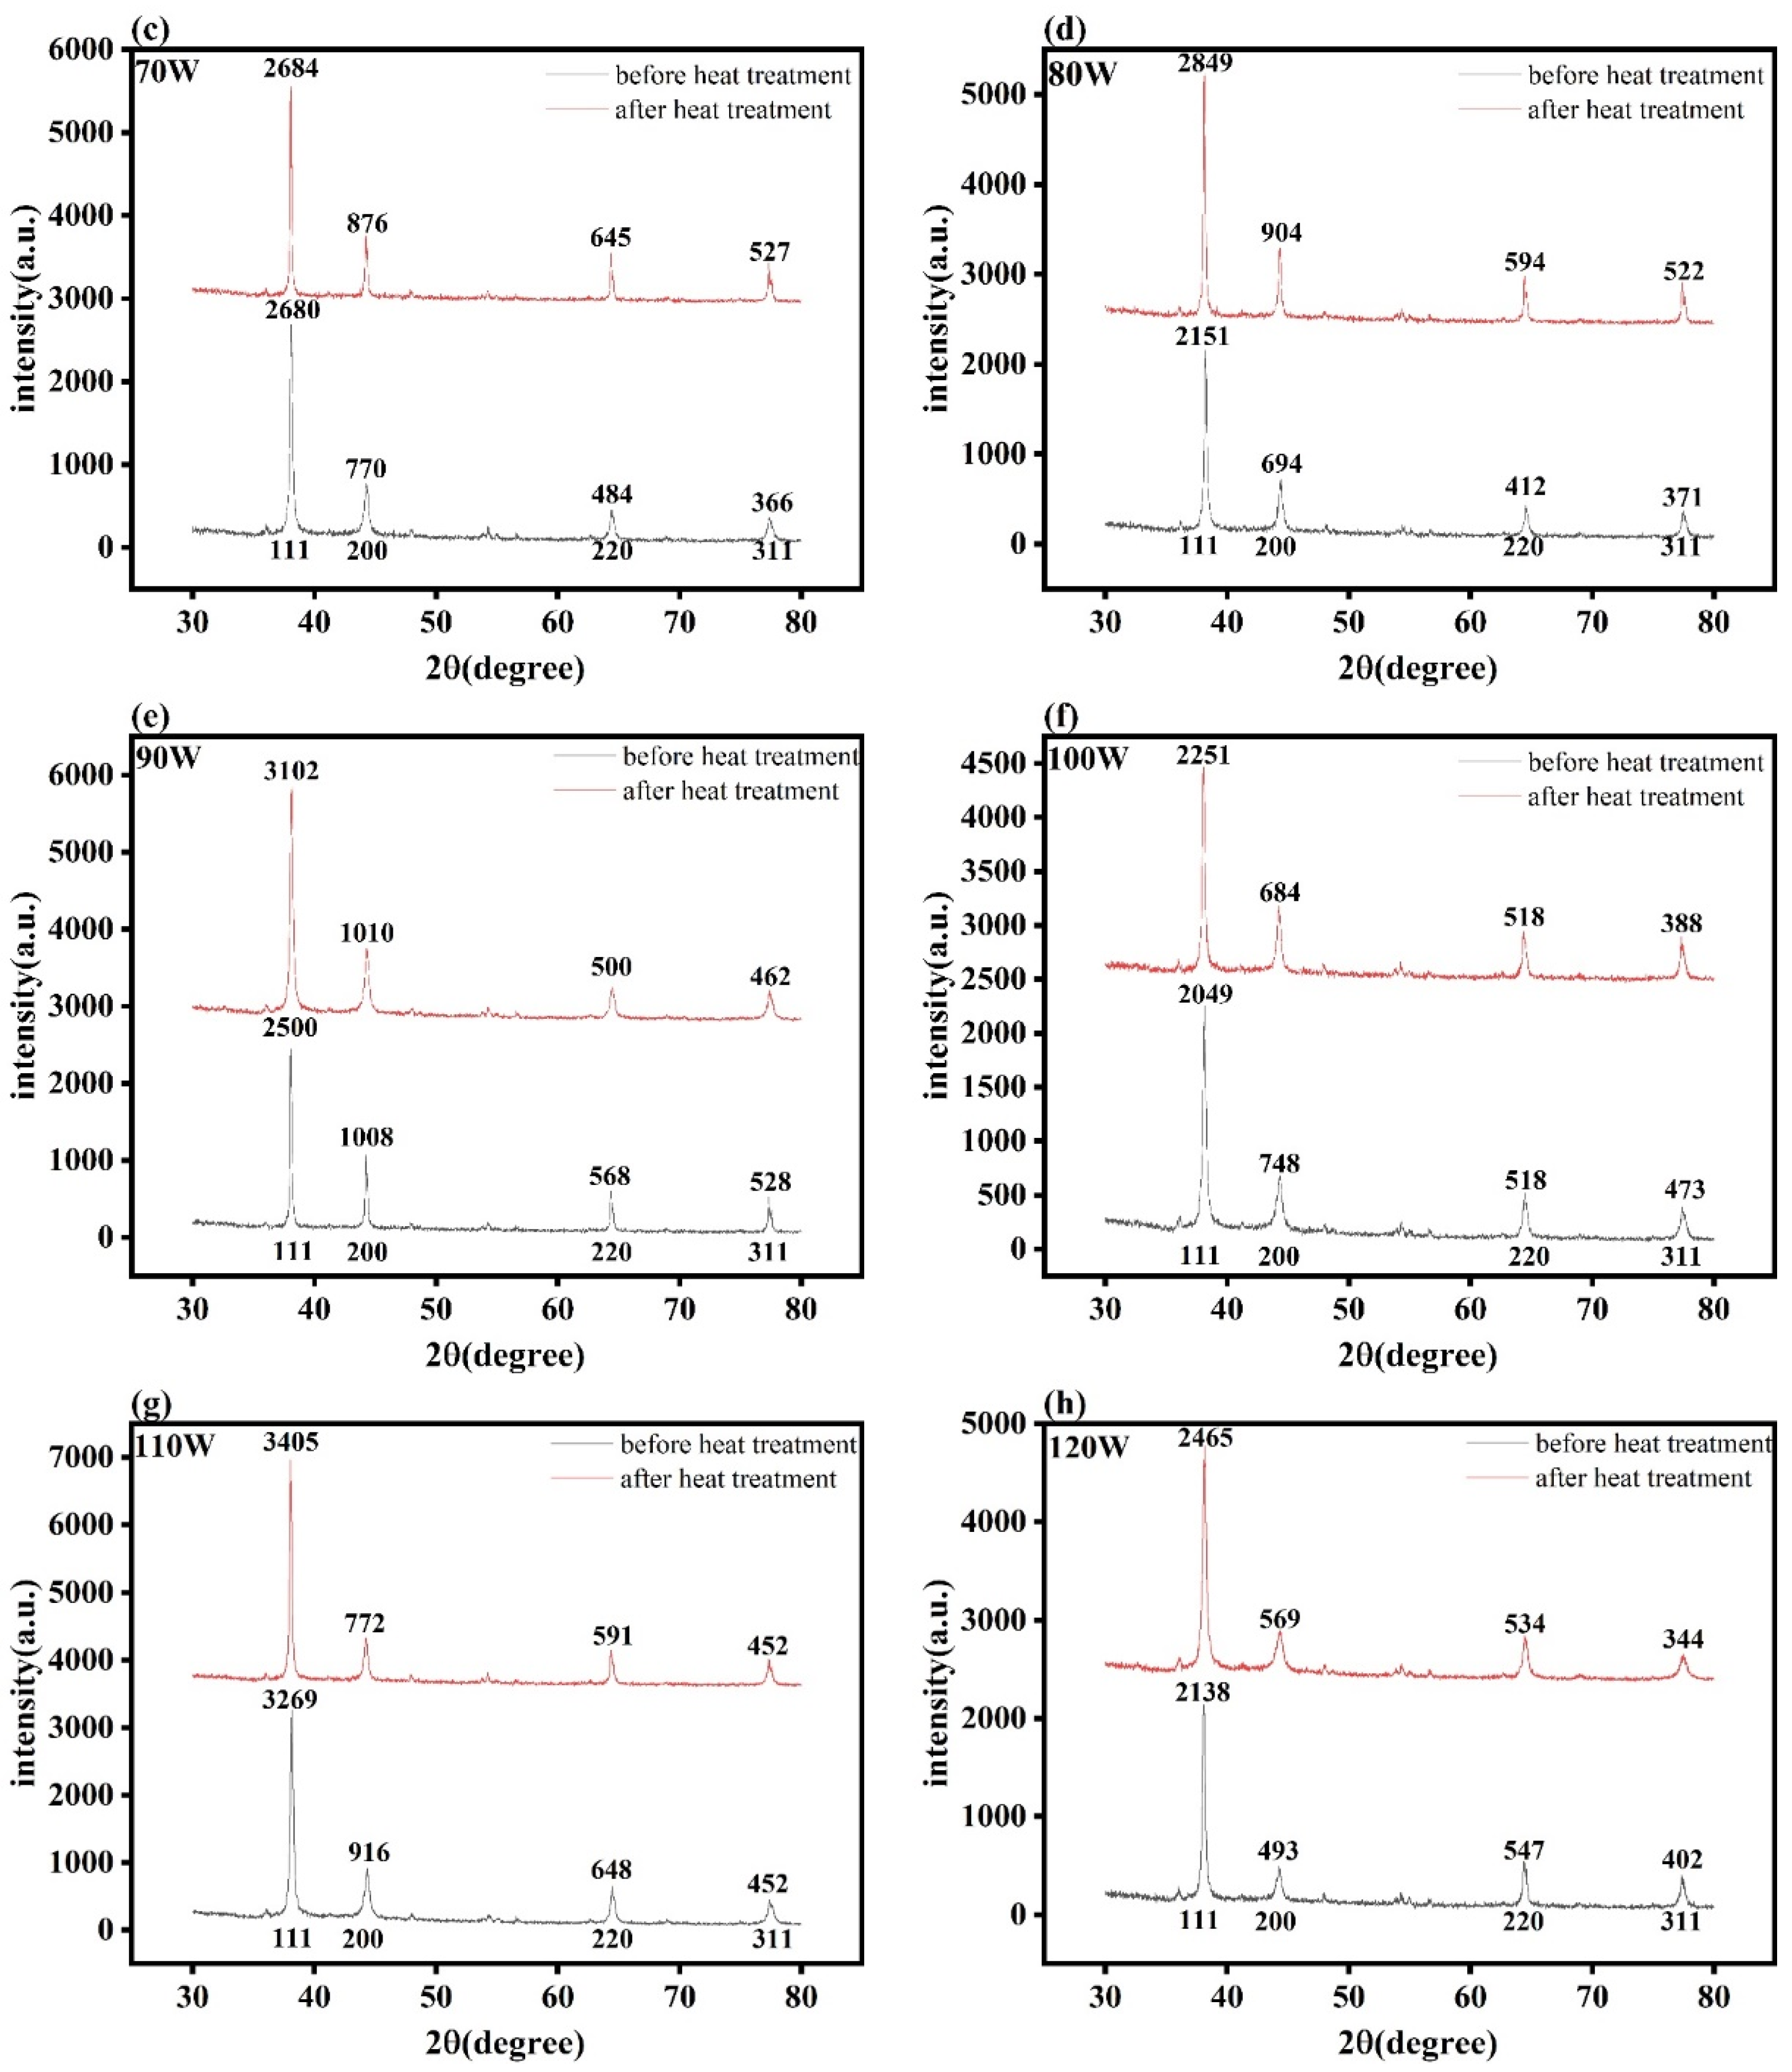
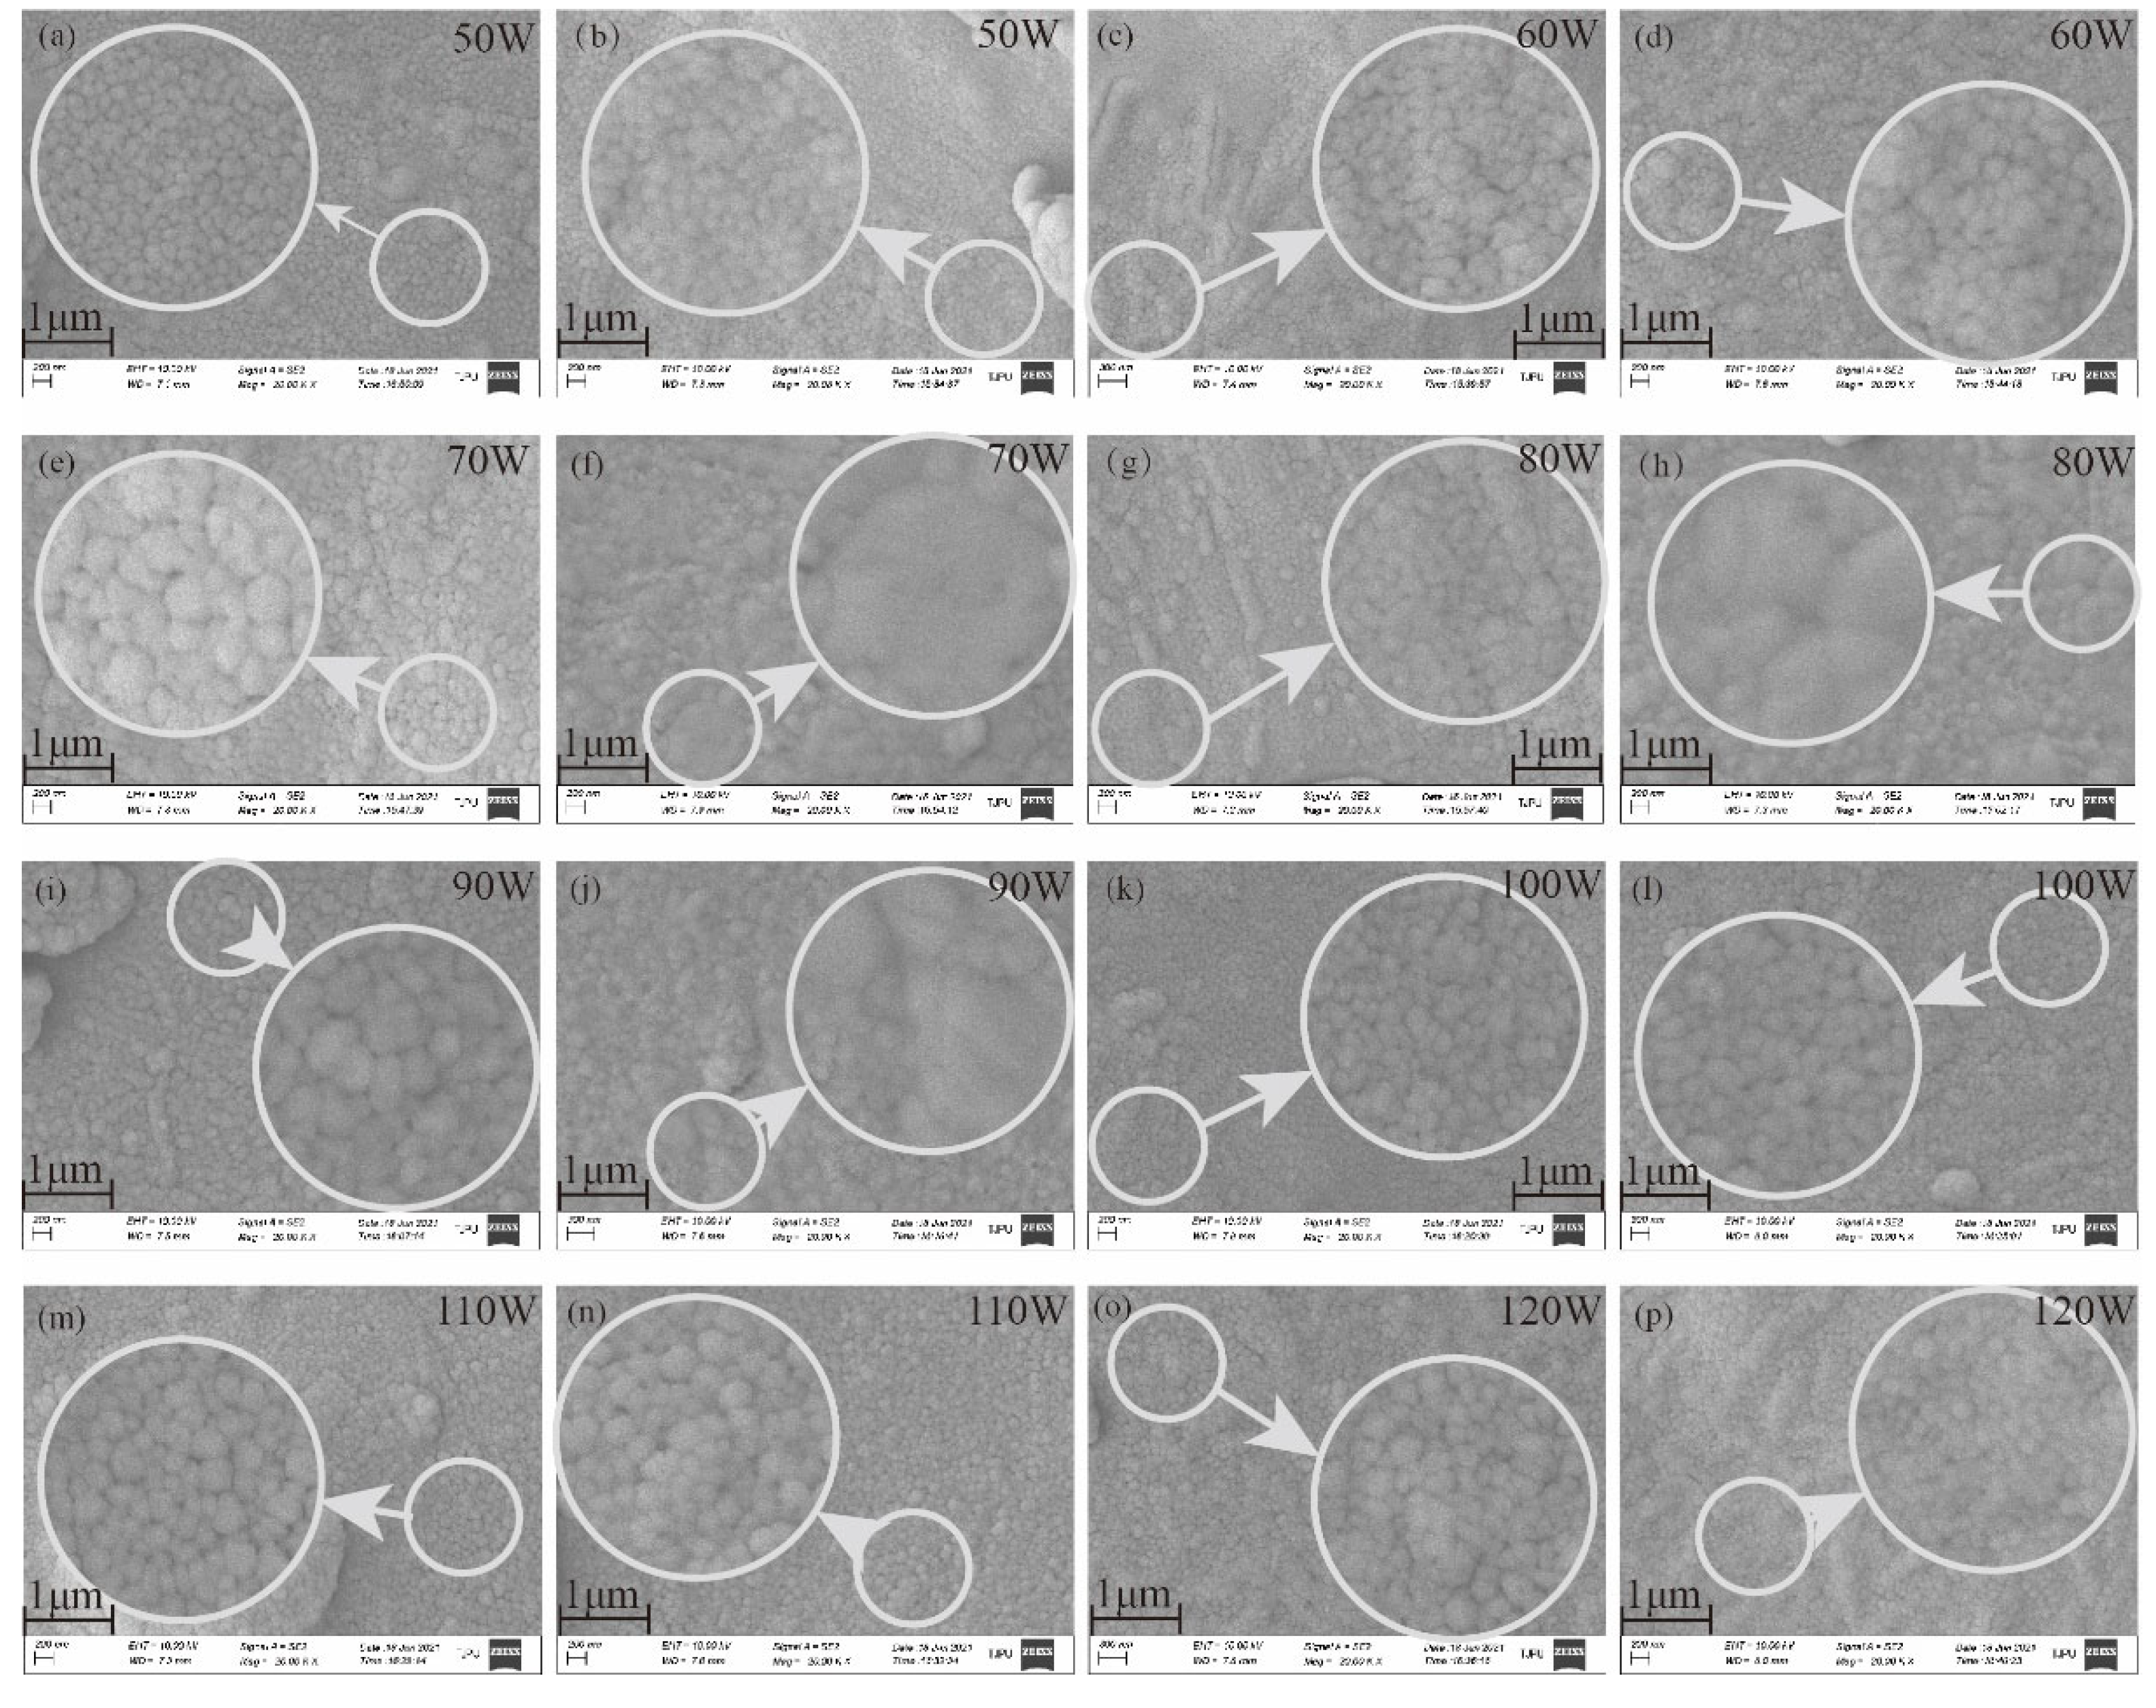
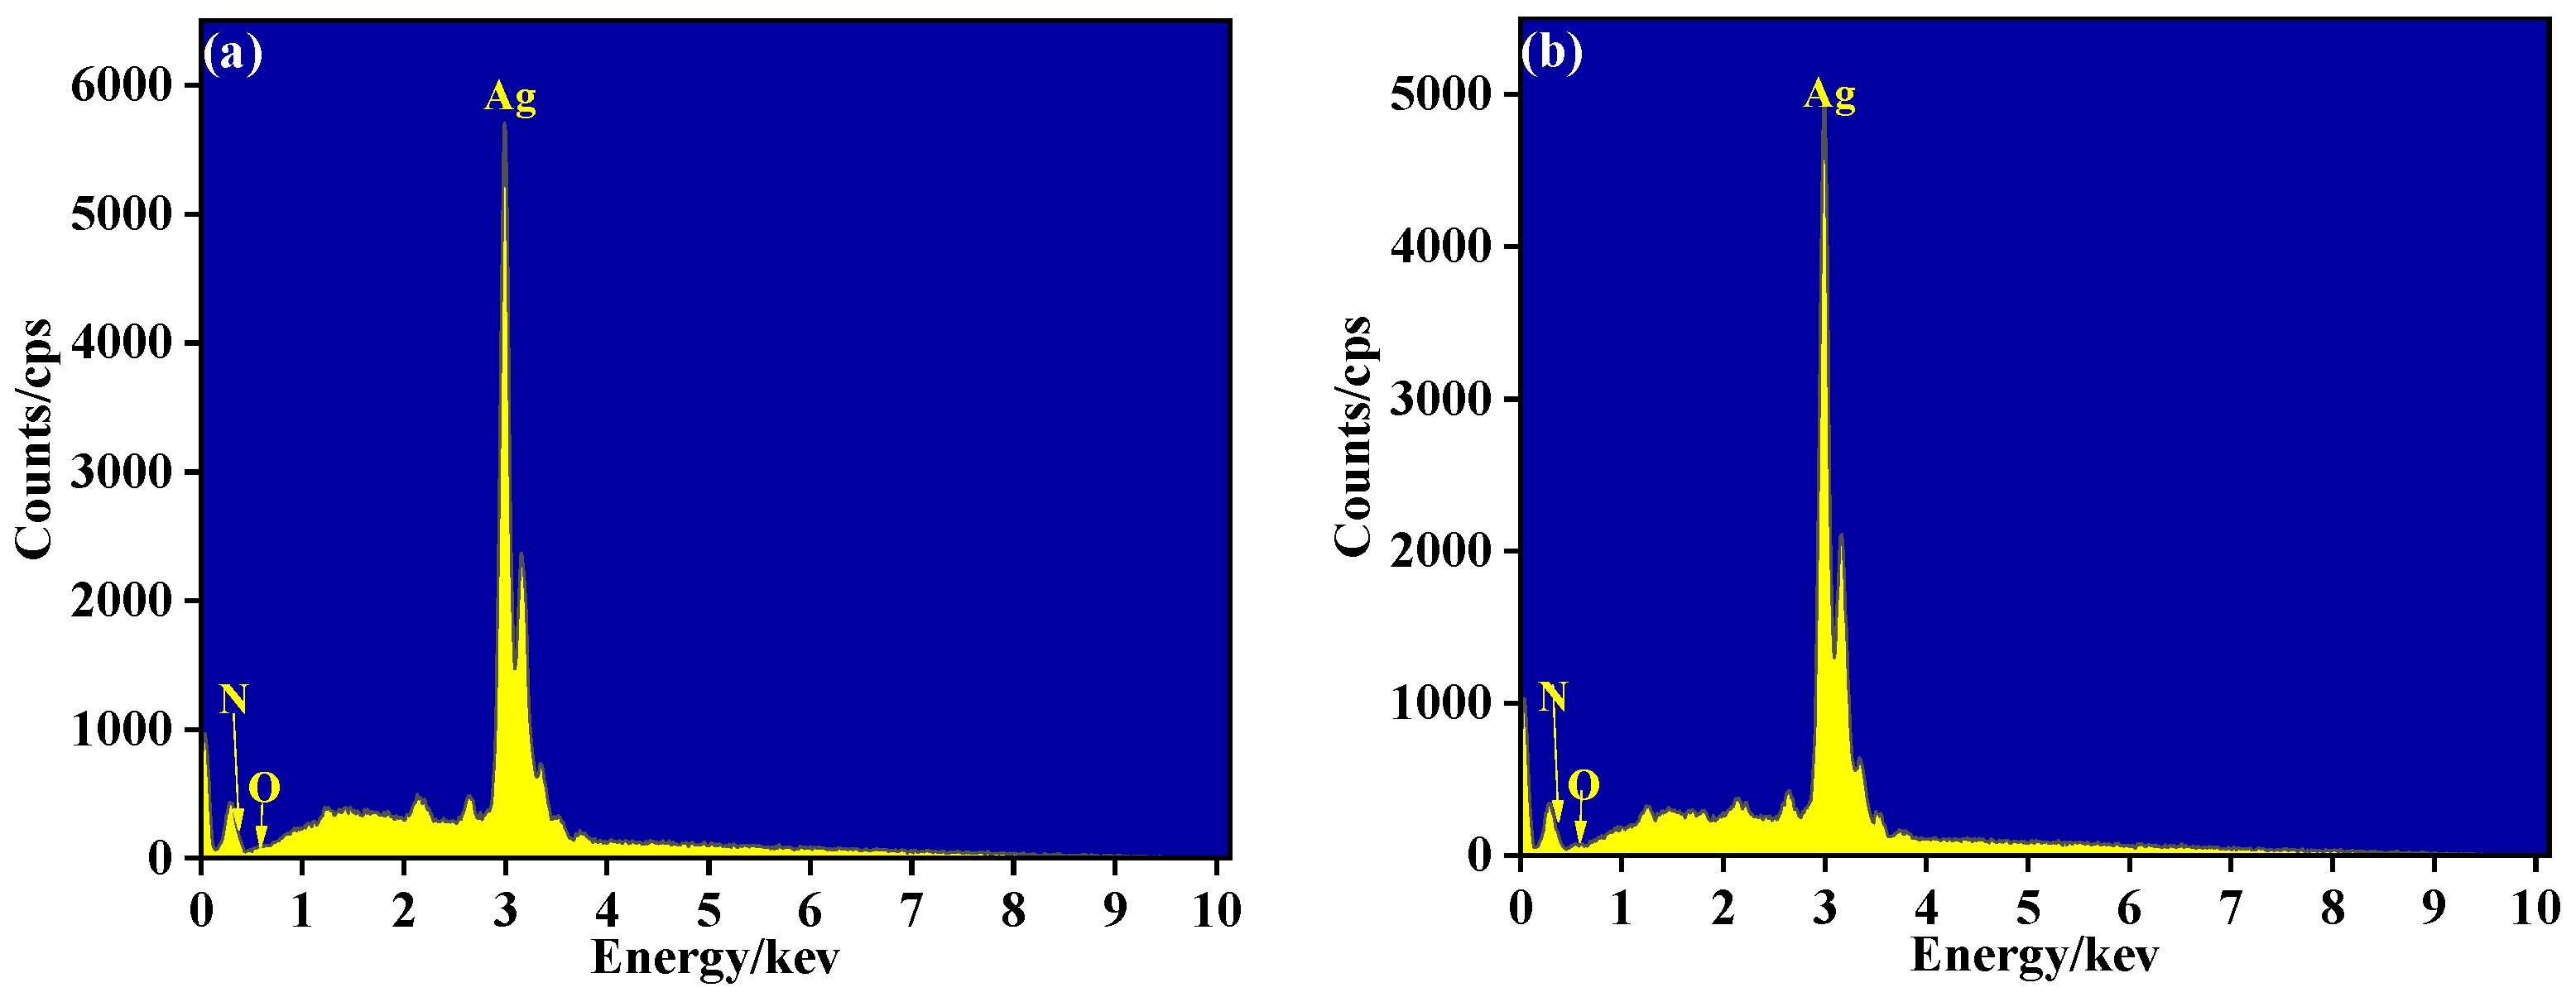
3.2. Structure Analysis
3.3. Comparison of Sensing Properties
4. Conclusions
Author Contributions
Funding
Institutional Review Board Statement
Informed Consent Statement
Data Availability Statement
Conflicts of Interest
References
- Appiagyei, A.B.; Han, J.I. Potentiometric Performance of a Highly Flexible-Shaped Trifunctional Sensor Based on ZnO/V2O5 Microrods. Sensors 2021, 21, 2559. [Google Scholar] [CrossRef] [PubMed]
- Rodes, C.A.; Torregrosa, V.; Guill, I.A.; Tormos, F.A.; Juan, B.M.; Ferriols, A.C. Flexible Hybrid Electrodes for Continuous Measurement of the Local Temperature in Long-Term Wounds. Sensors 2021, 21, 2741. [Google Scholar] [CrossRef] [PubMed]
- Lin, J.; Cai, X.F.; Liu, Z.L.; Liu, N.; Xie, M.; Zhou, B.P.; Wang, H.Q.; Guo, Z.H. Anti-liquid-Interfering and Bacterially Antiadhesive Strategy for Highly Stretchable and Ultrasensitive Strain Sensors Based on Cassie-Baxter Wetting State. Adv. Funct. Mater. 2020, 30, 2000398. [Google Scholar] [CrossRef]
- Zhao, S.; Zhu, R. Electronic skin with multifunction sensors based on thermosensation. Adv. Mater. 2017, 29, 1606151. [Google Scholar] [CrossRef] [PubMed]
- Liu, H.; Li, Q.M.; Bu, Y.B.; Zhang, N.; Wang, C.F.; Pan, F.; Mi, L.W.; Guo, Z.H.; Liu, C.T.; Shen, C.Y. Stretchable conductive nonwoven fabrics with self-cleaning capability for tunable wearable strain sensor. Nano Energy. 2019, 66, 104143. [Google Scholar] [CrossRef]
- Lee, K.; Jang, S.; Kim, K.L.; Koo, M.; Park, C.; Lee, S.; Lee, J.; Wang, G.; Park, C. Artificially Intelligent Tactile Ferroelectric Skin. Advabced Sci. 2020, 7, 2001662. [Google Scholar] [CrossRef] [PubMed]
- Evangeline, C.S.; Lenin, A. Human health monitoring using wearable sensor. Sens. Rev. 2019, 39, 364–376. [Google Scholar] [CrossRef]
- Nasiri, S.; Khosravani, M.R. Progress and challenges in fabrication of wearable sensors for health monitoring. Sens. Actuator A-Phys. 2020, 312, 17. [Google Scholar] [CrossRef]
- Ha, S.; Park, S.; Lim, H.; Baek, S.H.; Kim, D.K.; Yoon, S.H. The placement position optimization of a biosensor array for wearable healthcare systems. J. Mech. Sci. Technol. 2019, 33, 3237–3244. [Google Scholar] [CrossRef]
- Cai, T.; Yan, Y.Z.; Park, Y.; Lee, T.; Peng, D.; Liu, Y.Z.; Ha, C.S.; Kim, K.C. Phosphorescence-Based Flexible and Transparent Optical Temperature-Sensing Skin Capable of Operating in Extreme Environments. ACS Appl. Polym. Mater. 2021, 3, 2461–2469. [Google Scholar] [CrossRef]
- Shukla, B.K.; Tyagi, H.; Bhandari, H.; Garg, S. Nanotechnology-Based Approach to Combat Pandemic COVID 19: A Review. Macromol. Symposia. 2021, 397. [Google Scholar] [CrossRef]
- Leea, J.H.; Chenab, H.; Kima, E.; Zhanga, H.; Wua, K.; Zhanga, H.M.; Shen, X.; Zheng, Q.B.; Yang, J.L. Flexible temperature sensors made of aligned electrospun carbon nanofiber films with outstanding sensitivity and selectivity towards temperature. Mater. Horiz. 2021, 8, 1488–1498. [Google Scholar] [CrossRef]
- Su, Y.; Ma, C.S.; Chen, J.; Wu, H.P.; Luo, W.X.; Peng, Y.M.; Luo, Z.B.; Li, L.; Tan, Y.S.; Olatunji, M.O.; et al. Highly Sensitive Flexible Temperature Sensors for Human Body Temperature Monitoring: A Review. Nanoscale Res. Lett. 2020, 15, 200. [Google Scholar] [CrossRef]
- Wu, P.Q.; He, Z.M.; Yang, M.; Xu, J.H.; Li, N.; Wang, Z.M.; Li, J.; Ma, T.; Lu, X.; Zhang, H.; et al. A Review on Flexible Thermoelectric Technology: Material, Device, and Applications. Int. J. Thermophys. 2021, 42. [Google Scholar] [CrossRef]
- Hashimi, H.A.; Chaalal, O. Flexible temperature sensor fabrication using photolithography technique. Therm. Sci. Eng. Prog. 2021, 22, 100857. [Google Scholar] [CrossRef]
- Liu, Z.J.; Tian, N.; Zhang, B.F.; Liu, J.J.; Zhang, Z.K.; Wang, S.; Luo, Y.Y.; Zhao, Y.L.; Shi, P.; Lin, Q.J.; et al. A thin-film temperature sensor based on a flexible electrode and substrate. Microsyst. Nanoeng. 2021, 7, 42. [Google Scholar] [CrossRef] [PubMed]
- Shi, Y.; Huang, S.L.; Sun, Z.C.; Wang, W.; Liu, E.P. Performance study of flexible temperature sensor based on carbon sensitive material. Lect. Notes Electr. Eng. 2020, 600, 695–701. [Google Scholar]
- Mu, Y.F.; Feng, R.; Gong, Q.B.; Liu, Y.X.; Jiang, X.J.; Hu, Y.F. A Flexible Two-Sensor System for Temperature and Bending Angle Monitoring. Materials 2021, 14, 2962. [Google Scholar] [CrossRef]
- Justus, L.; Waleri, R.; Noemí, A.A.; Heinz, D.; Thomas, B.; Tung, P. Multi-Point Flexible Temperature Sensor Array and Thermoelectric Generator Made from Copper-Coated Textiles. Sensors 2021, 21, 3742. [Google Scholar]
- Wang, Y.F.; Sekine, T.; Takeda, Y.; Yokosawa, K.; Matsui, H.; Kumaki, D.; Shiba, T.; Nishikawa, T.; Tokito, S. Fully Printed PEDOT: PSS-based Temperature Sensor with High Humidity Stability for Wireless Healthcare Monitoring. Sci. Rep. 2020, 10, 2467. [Google Scholar] [CrossRef] [Green Version]
- Gandla, S.; Naqi, Q.; Lee, M.; Lee, J.J.; Won, Y.; Pujar, P.; Kim, J.; Lee, S.; Kim, S. Highly Linear and Stable Flexible Temperature Sensors Based on Laser-Induced Carbonization of Polyimide Substrates for Personal Mobile Monitoring. Adv. Mater. Technol. 2020, 5, 2000014. [Google Scholar] [CrossRef]
- Pan, J.; Liu, S.Y.; Zhang, H.Z.; Lu, J.A. A Flexible Temperature Sensor Array with Polyaniline/Graphene–Polyvinyl Butyral Thin Film. Sensors 2019, 19, 4105. [Google Scholar] [CrossRef] [PubMed] [Green Version]
- Kim, S.W.; Rehman, M.M.; Sajid, M.; Rehman, M.M.; Gul, J.; Jo, J.D.; Choi, K.H. Encapsulation of polyvinyl alcohol based flexible temperature sensor through spatial atmospheric atomic layer deposition system to enhance its lifetime. Thin Solid Films. 2019, 673, 44–51. [Google Scholar] [CrossRef]
- Park, J.S. Flexible Platinum Temperature sensor embedded in polyimide (PI) films for curved surface temperature monitoring applications: Skin temperature of human body. Sens. Mater. 2017, 29, 1275–1283. [Google Scholar]
- Shao, L.; Zhao, X.H.; Gu, S.P.; Ma, Y.P.; Liu, Y.; Deng, X.W.; Jiang, H.C.; Zhang, W.L. Pt thin-film resistance temperature detector on flexible Hastelloy tapes. Vacuum 2021, 184, 109966. [Google Scholar] [CrossRef]
- Tiggelaar, R.M.; Sanders, R.G.R.; Groenland, A.W.; Gardeniers, J.G.E. Stability of thin platinum films implemented in high-temperature microdevices. Sens. Actuator A-Phys. 2009, 152, 39–47. [Google Scholar] [CrossRef]
- Hegemann, D.; Amberg, M.; Ritter, A.; Heuberger, M. Recent developments in Ag metallised textiles using plasma sputtering. Mater. Technol. 2009, 24, 41–45. [Google Scholar] [CrossRef]
- Peucket, M.; Bonzel, H.P. Characterization of oxidized platinum surfaces by X-ray photoelectron spectroscopy. Surf. Sci. 1984, 145, 239–259. [Google Scholar] [CrossRef]
- Tan, X.Q.; Liu, J.Y.; Niu, J.R.; Liu, J.Y.; Tian, J.Y. Recent Progress in Magnetron Sputtering Technology Used on Fabrics. Materials 2018, 11, 15. [Google Scholar] [CrossRef] [Green Version]
- Zeng, W.; Shu, L.; Li, Q.; Chen, S.; Wang, F.; Tao, X.M. Fiber-Based Wearable Electronics: A Review of Materials, Fabrication, Devices, and Applications. Adv. Mater. 2014, 26, 5310–5336. [Google Scholar] [CrossRef]
- Lee, S.; Shin, S.; Lee, S.; Seo, J.; Lee, J.; Son, S.; Cho, H.J.; Algadi, H.; Al-Sayari, S.; Kim, D.E.; et al. Ag nanowire reinforced highly stretchable conductive fibers for wearable electronics. Adv. Funct. Mater. 2015, 25, 3114–3121. [Google Scholar] [CrossRef]
- Lugoda, P.; Costa, J.C.; Oliveira, C.; Garcia-Garcia, L.A.; Wickramasinghe, S.D.; Pouryazdan, A.; Roggen, D.; Dias, T.; Munzenrieder, N. Flexible Temperature Sensor Integration into E-Textiles Using Different Industrial Yarn Fabrication Processes. Sensors 2020, 20, 14. [Google Scholar] [CrossRef] [PubMed] [Green Version]
- NeeIla, N.; Gaddam, V.; Nayak, M.M.; Dinesh, N.S.; Rajanna, K. Scalable fabrication of highly sensitive flexible temperature sensors based on silver nanoparticles coated reduced graphene oxide nanocomposite thin films. Sens. Actuator A-Phys. 2017, 268, 173–182. [Google Scholar] [CrossRef]
- Ling, Y.Z.; An, T.C.; Yap, L.W.; Zhu, B.W.; Gong, S.; Cheng, W.L. Disruptive, Soft, Wearable Sensors. Adv. Mater. 2020, 32, 13. [Google Scholar] [CrossRef] [PubMed]
- Youn, D.Y.; Jung, U.; Naqi, M.; Choi, S.J.; Lee, M.G.; Lee, S.; Park, H.J.; Kim, I.D.; Kim, S. Wireless Real-Time Temperature Monitoring of Blood Packages: Silver Nanowire-Embedded Flexible Temperature Sensors. ACS Appl. Mater. Interfaces. 2018, 10, 44678–44685. [Google Scholar] [CrossRef] [PubMed]


| Power (W) | 50 | 60 | 70 | 80 | 90 | 100 | 110 | 120 |
|---|---|---|---|---|---|---|---|---|
| before heat treatment | ||||||||
| average of R2 | 0.9985 | 0.9874 | 0.9950 | 0.9977 | 0.9959 | 0.9950 | 0.9945 | 0.9971 |
| after heat treatment | ||||||||
| average of R2 | 0.9964 | 0.9965 | 0.9962 | 0.9973 | 0.9955 | 0.9966 | 0.9948 | 0.9951 |
Publisher’s Note: MDPI stays neutral with regard to jurisdictional claims in published maps and institutional affiliations. |
© 2021 by the authors. Licensee MDPI, Basel, Switzerland. This article is an open access article distributed under the terms and conditions of the Creative Commons Attribution (CC BY) license (https://creativecommons.org/licenses/by/4.0/).
Share and Cite
Yan, Z.-Y.; Liu, J.-Y.; Niu, J.-R. Research of a Novel Ag Temperature Sensor Based on Fabric Substrate Fabricated by Magnetron Sputtering. Materials 2021, 14, 6014. https://doi.org/10.3390/ma14206014
Yan Z-Y, Liu J-Y, Niu J-R. Research of a Novel Ag Temperature Sensor Based on Fabric Substrate Fabricated by Magnetron Sputtering. Materials. 2021; 14(20):6014. https://doi.org/10.3390/ma14206014
Chicago/Turabian StyleYan, Zong-Yao, Jian-Yong Liu, and Jia-Rong Niu. 2021. "Research of a Novel Ag Temperature Sensor Based on Fabric Substrate Fabricated by Magnetron Sputtering" Materials 14, no. 20: 6014. https://doi.org/10.3390/ma14206014
APA StyleYan, Z.-Y., Liu, J.-Y., & Niu, J.-R. (2021). Research of a Novel Ag Temperature Sensor Based on Fabric Substrate Fabricated by Magnetron Sputtering. Materials, 14(20), 6014. https://doi.org/10.3390/ma14206014