
The Numerical Modelling Approach with a Random Distribution of Mechanical Properties for a Mismatched Weld


Abstract

1. Introduction
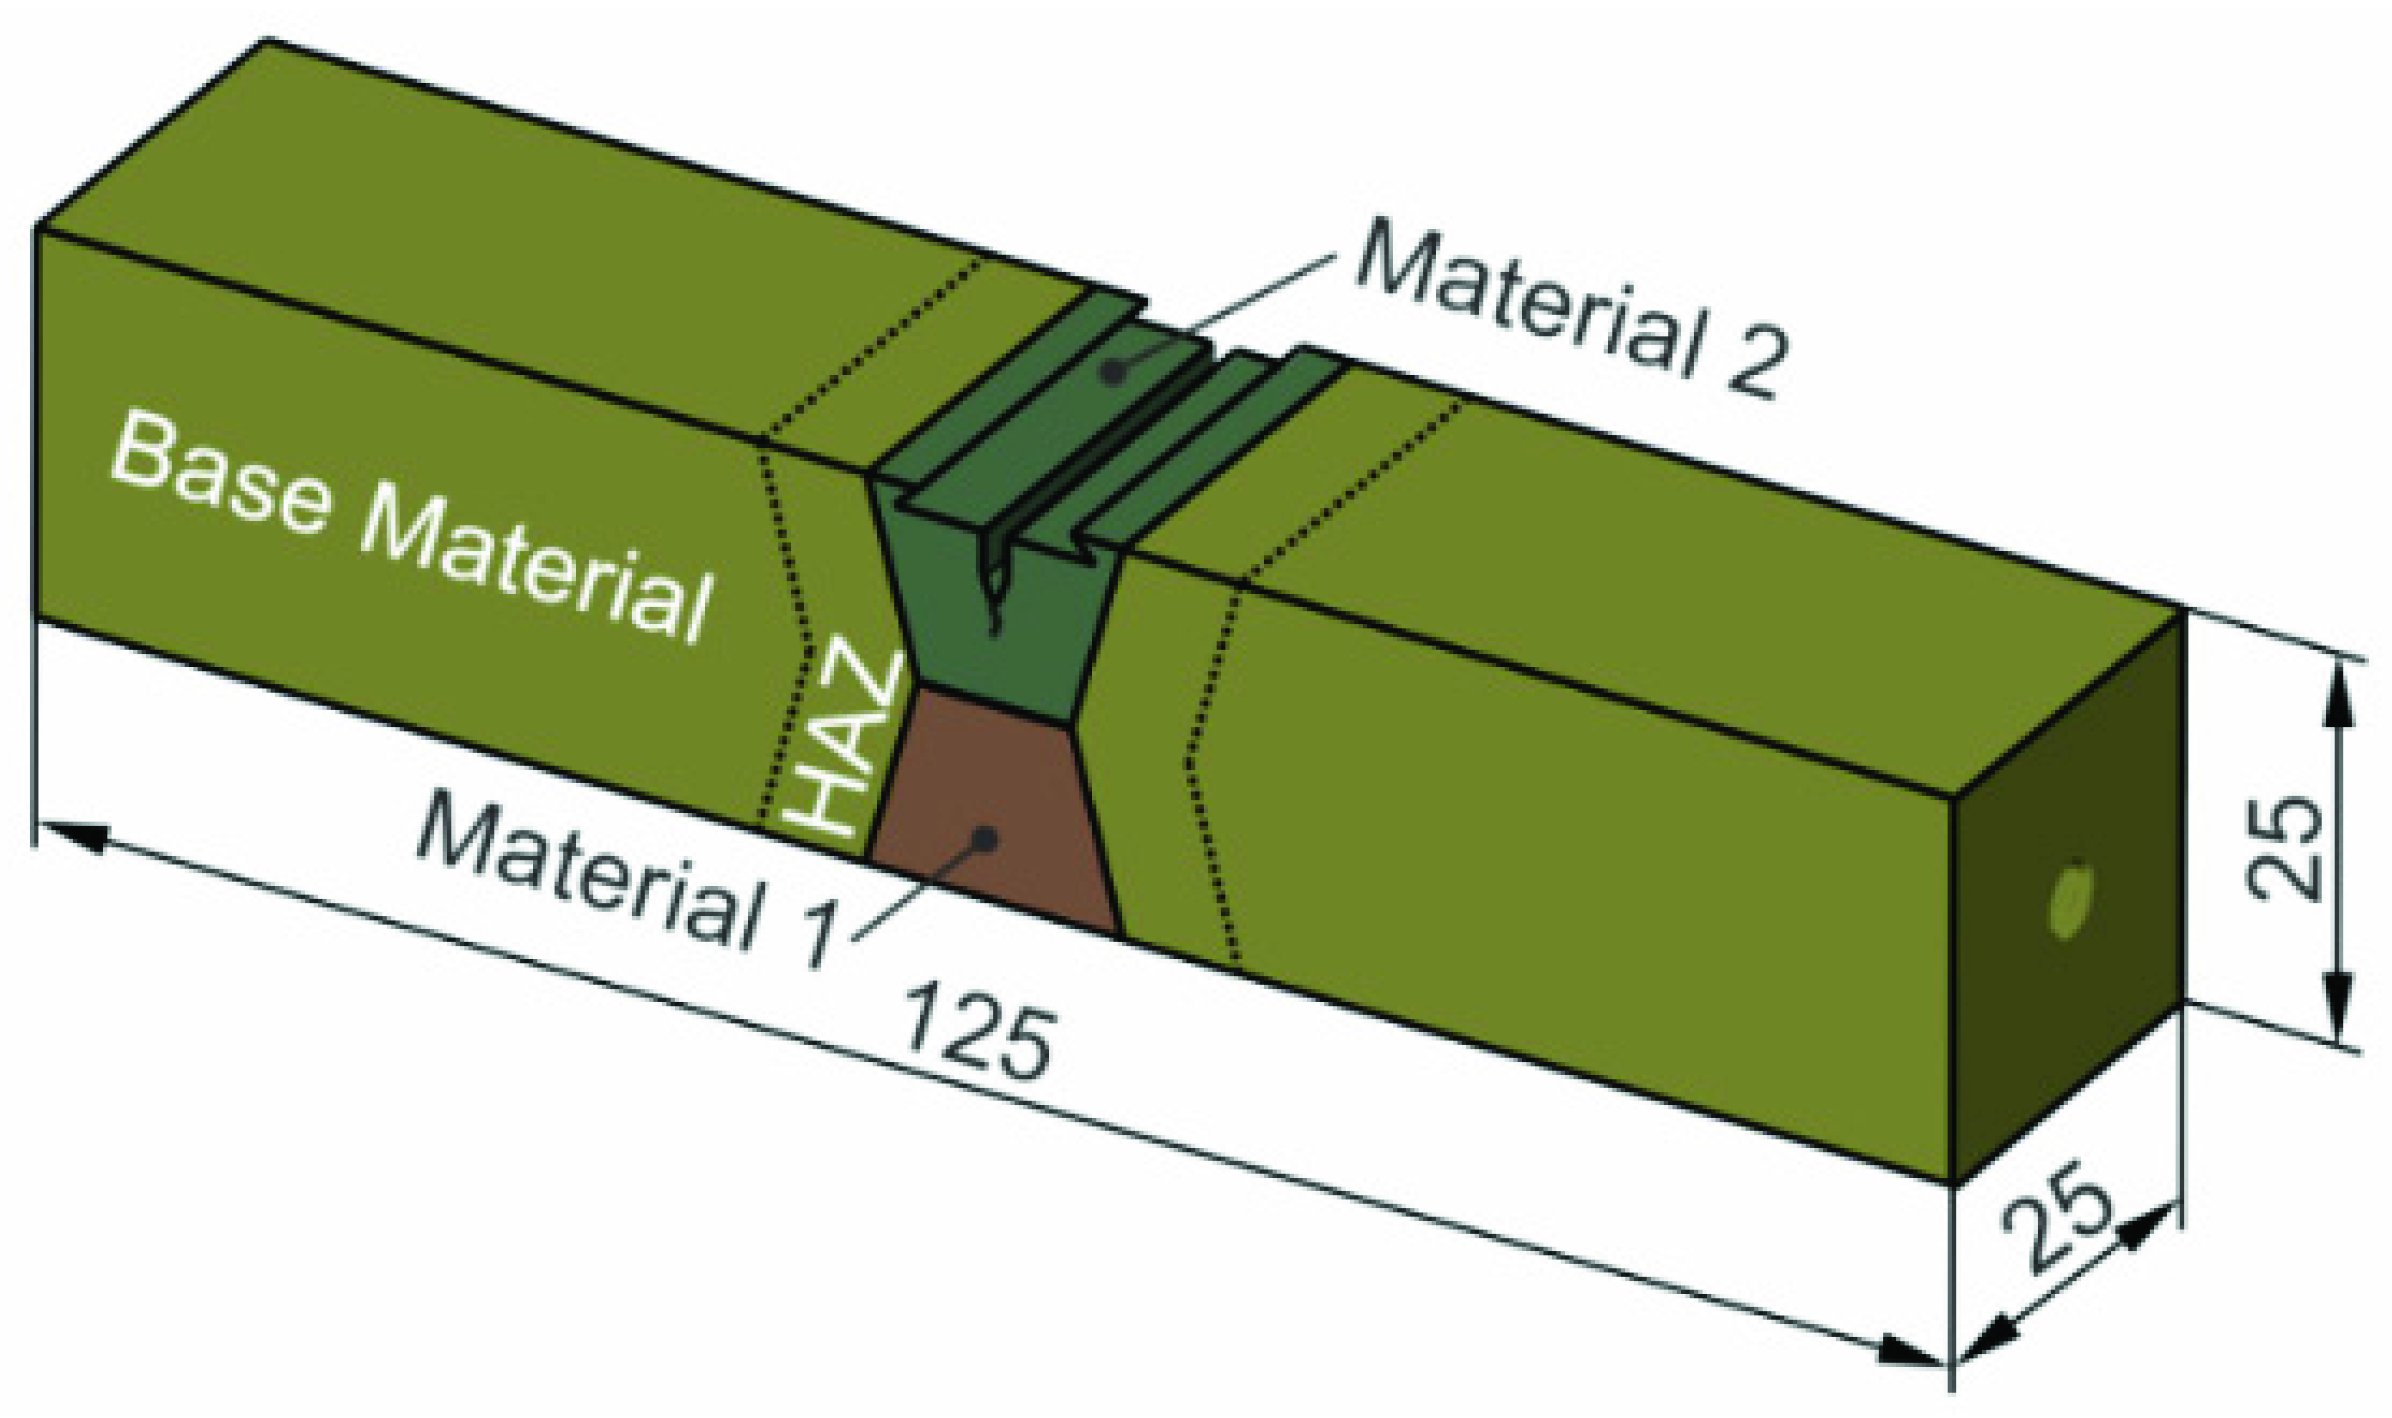
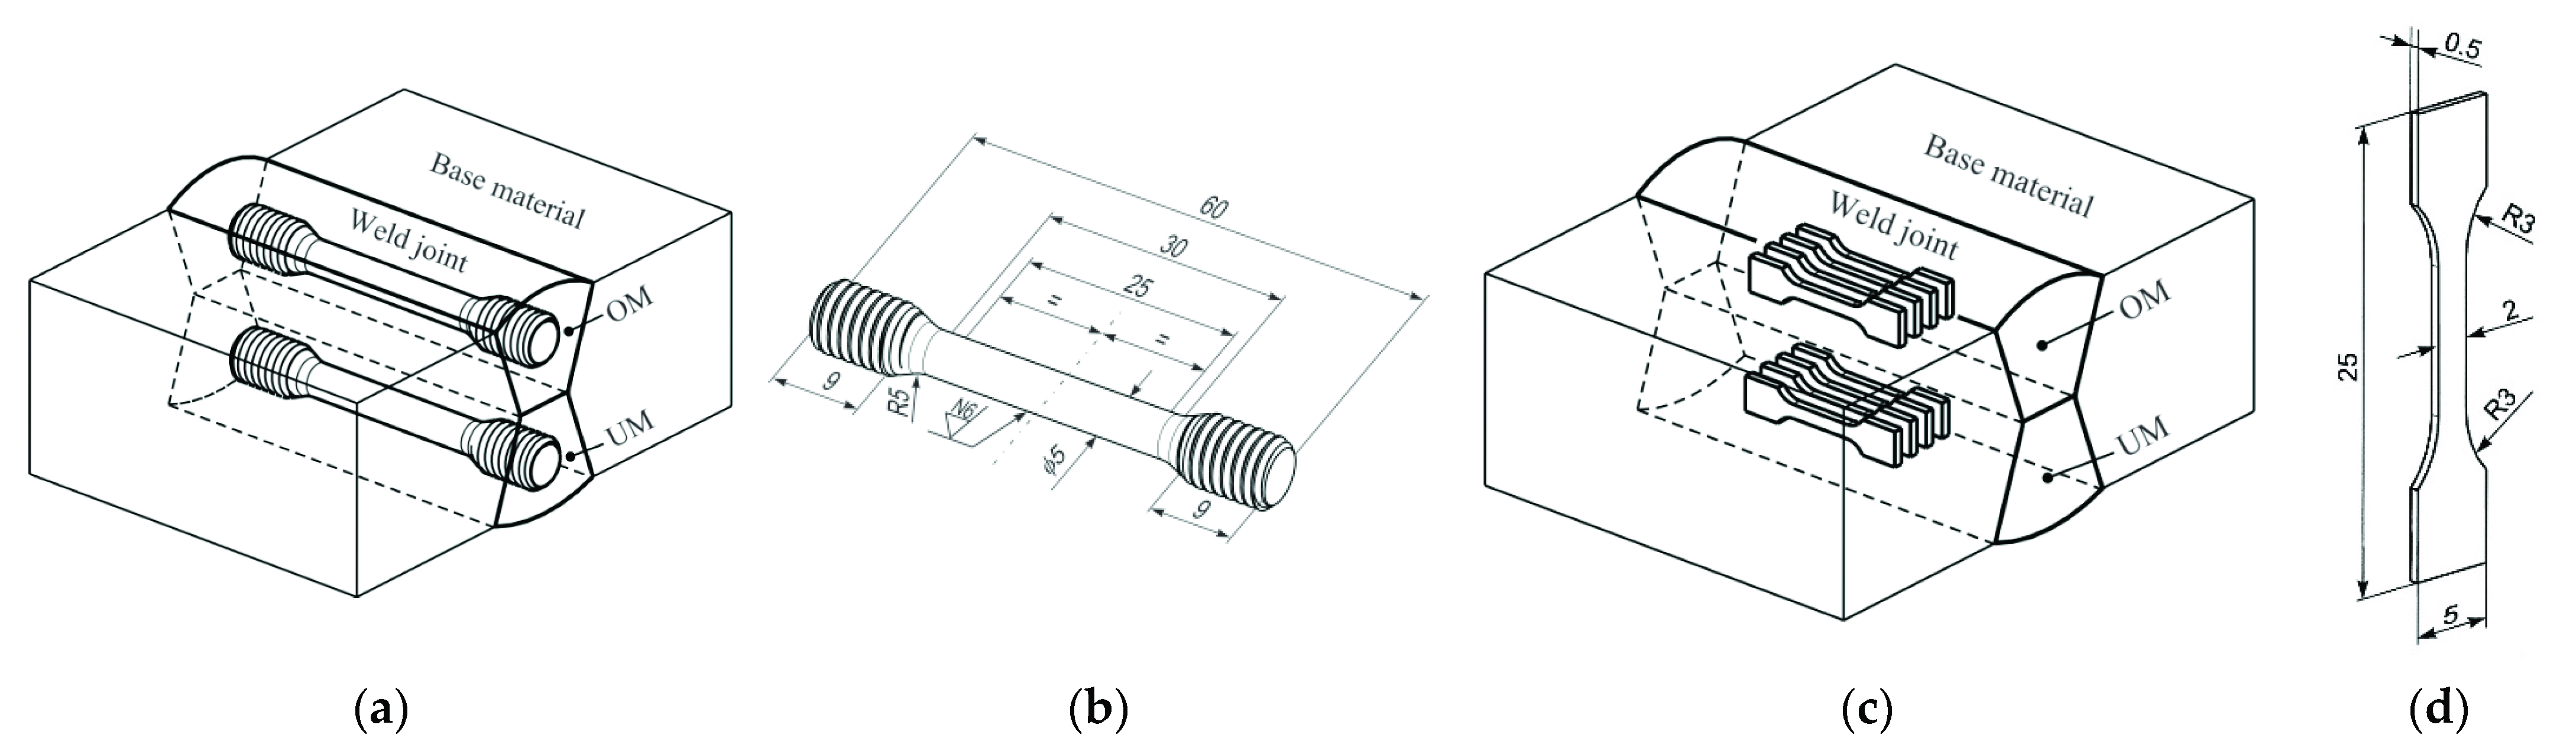
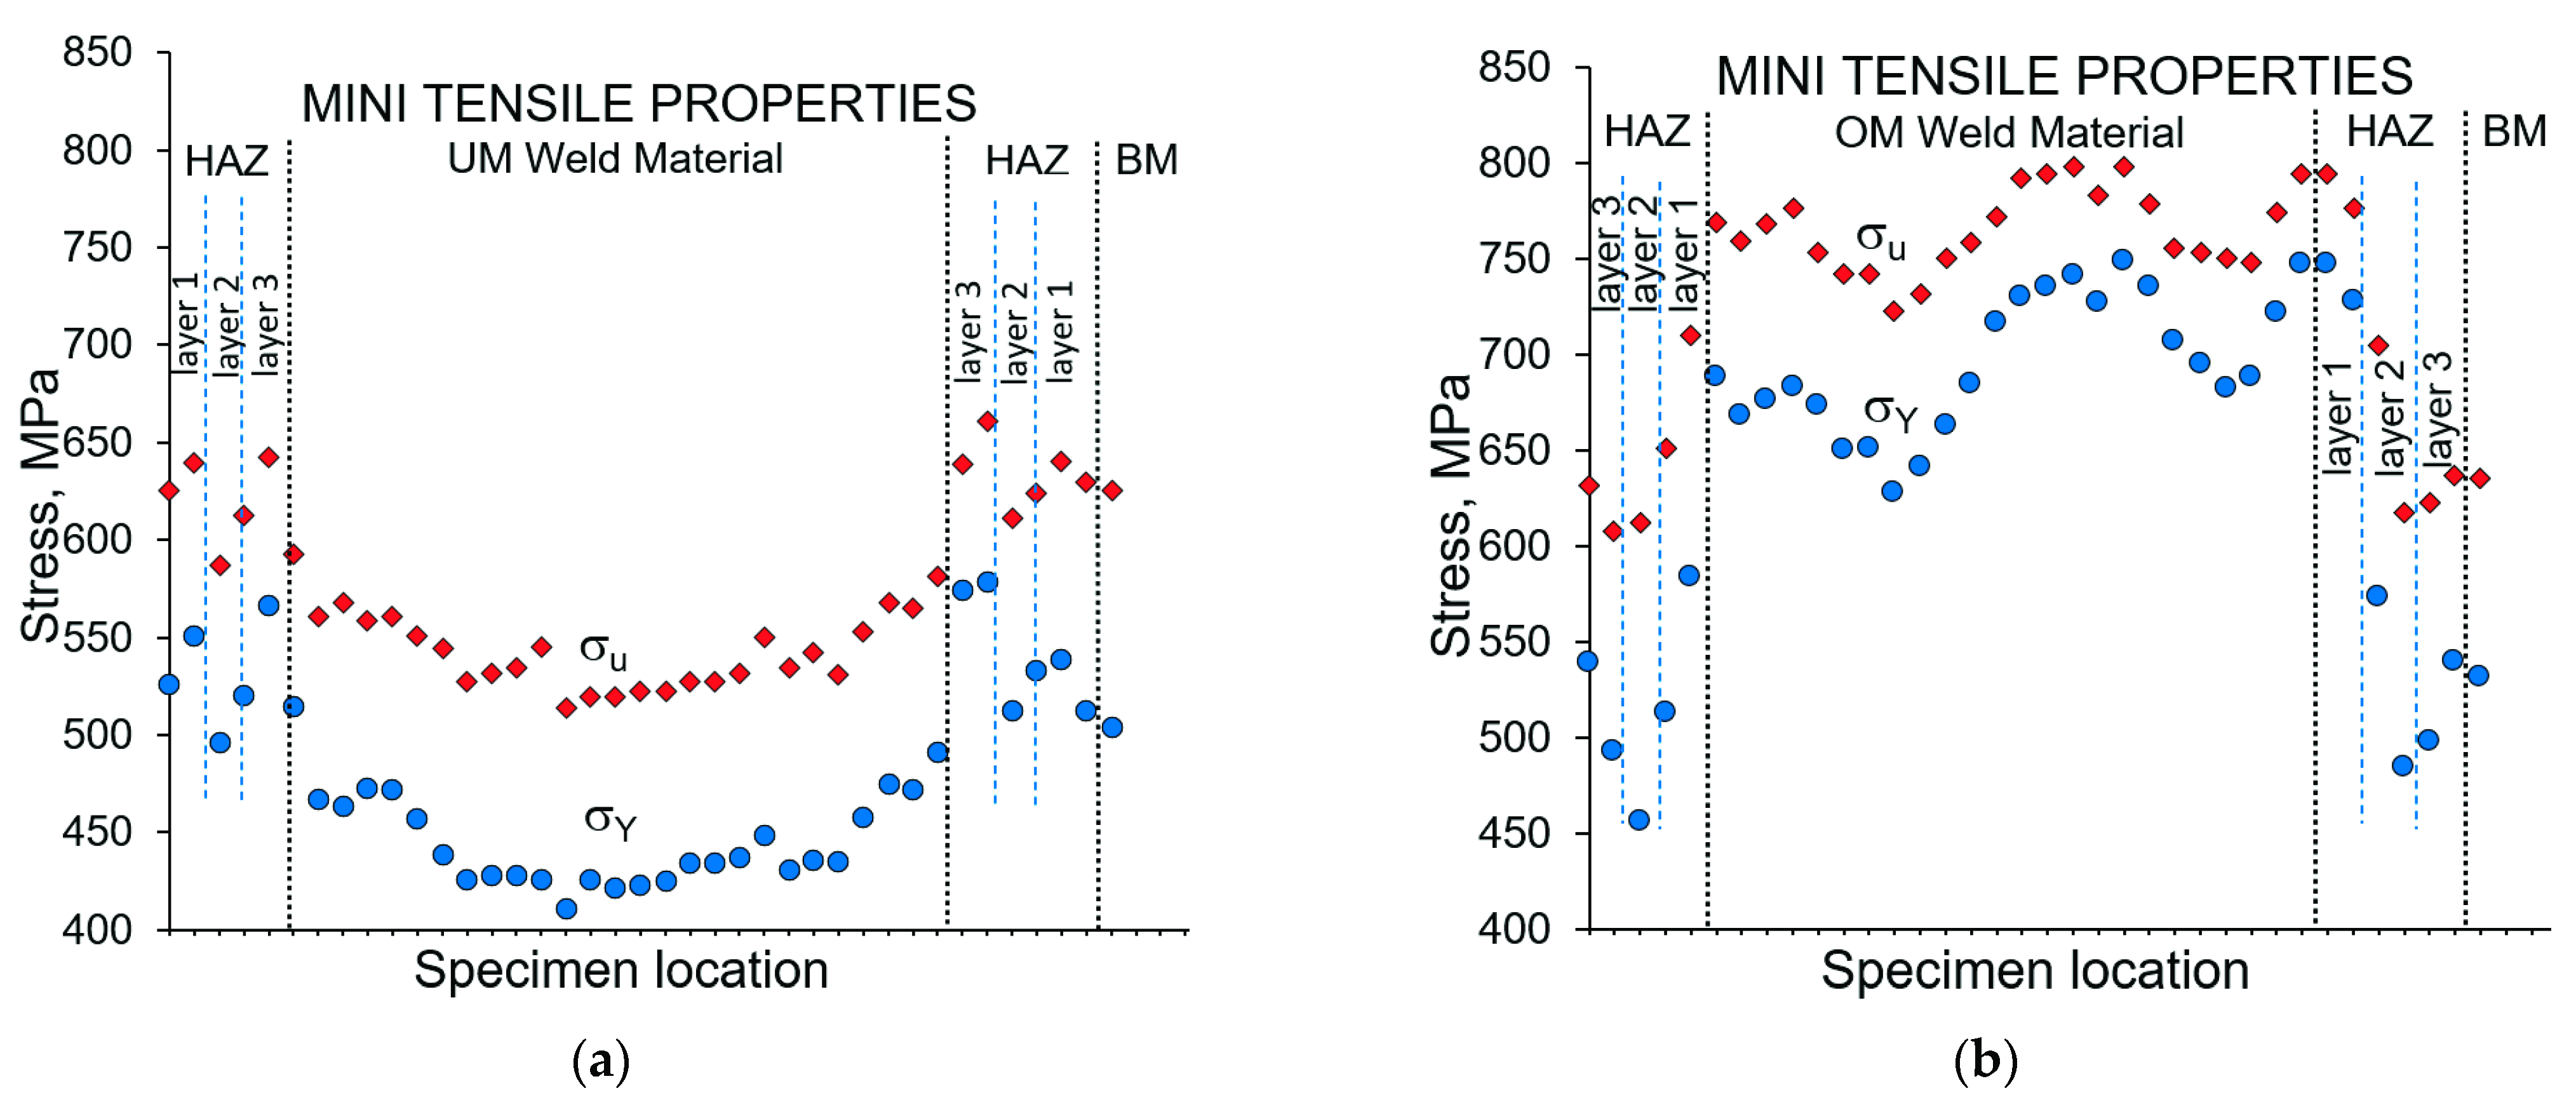
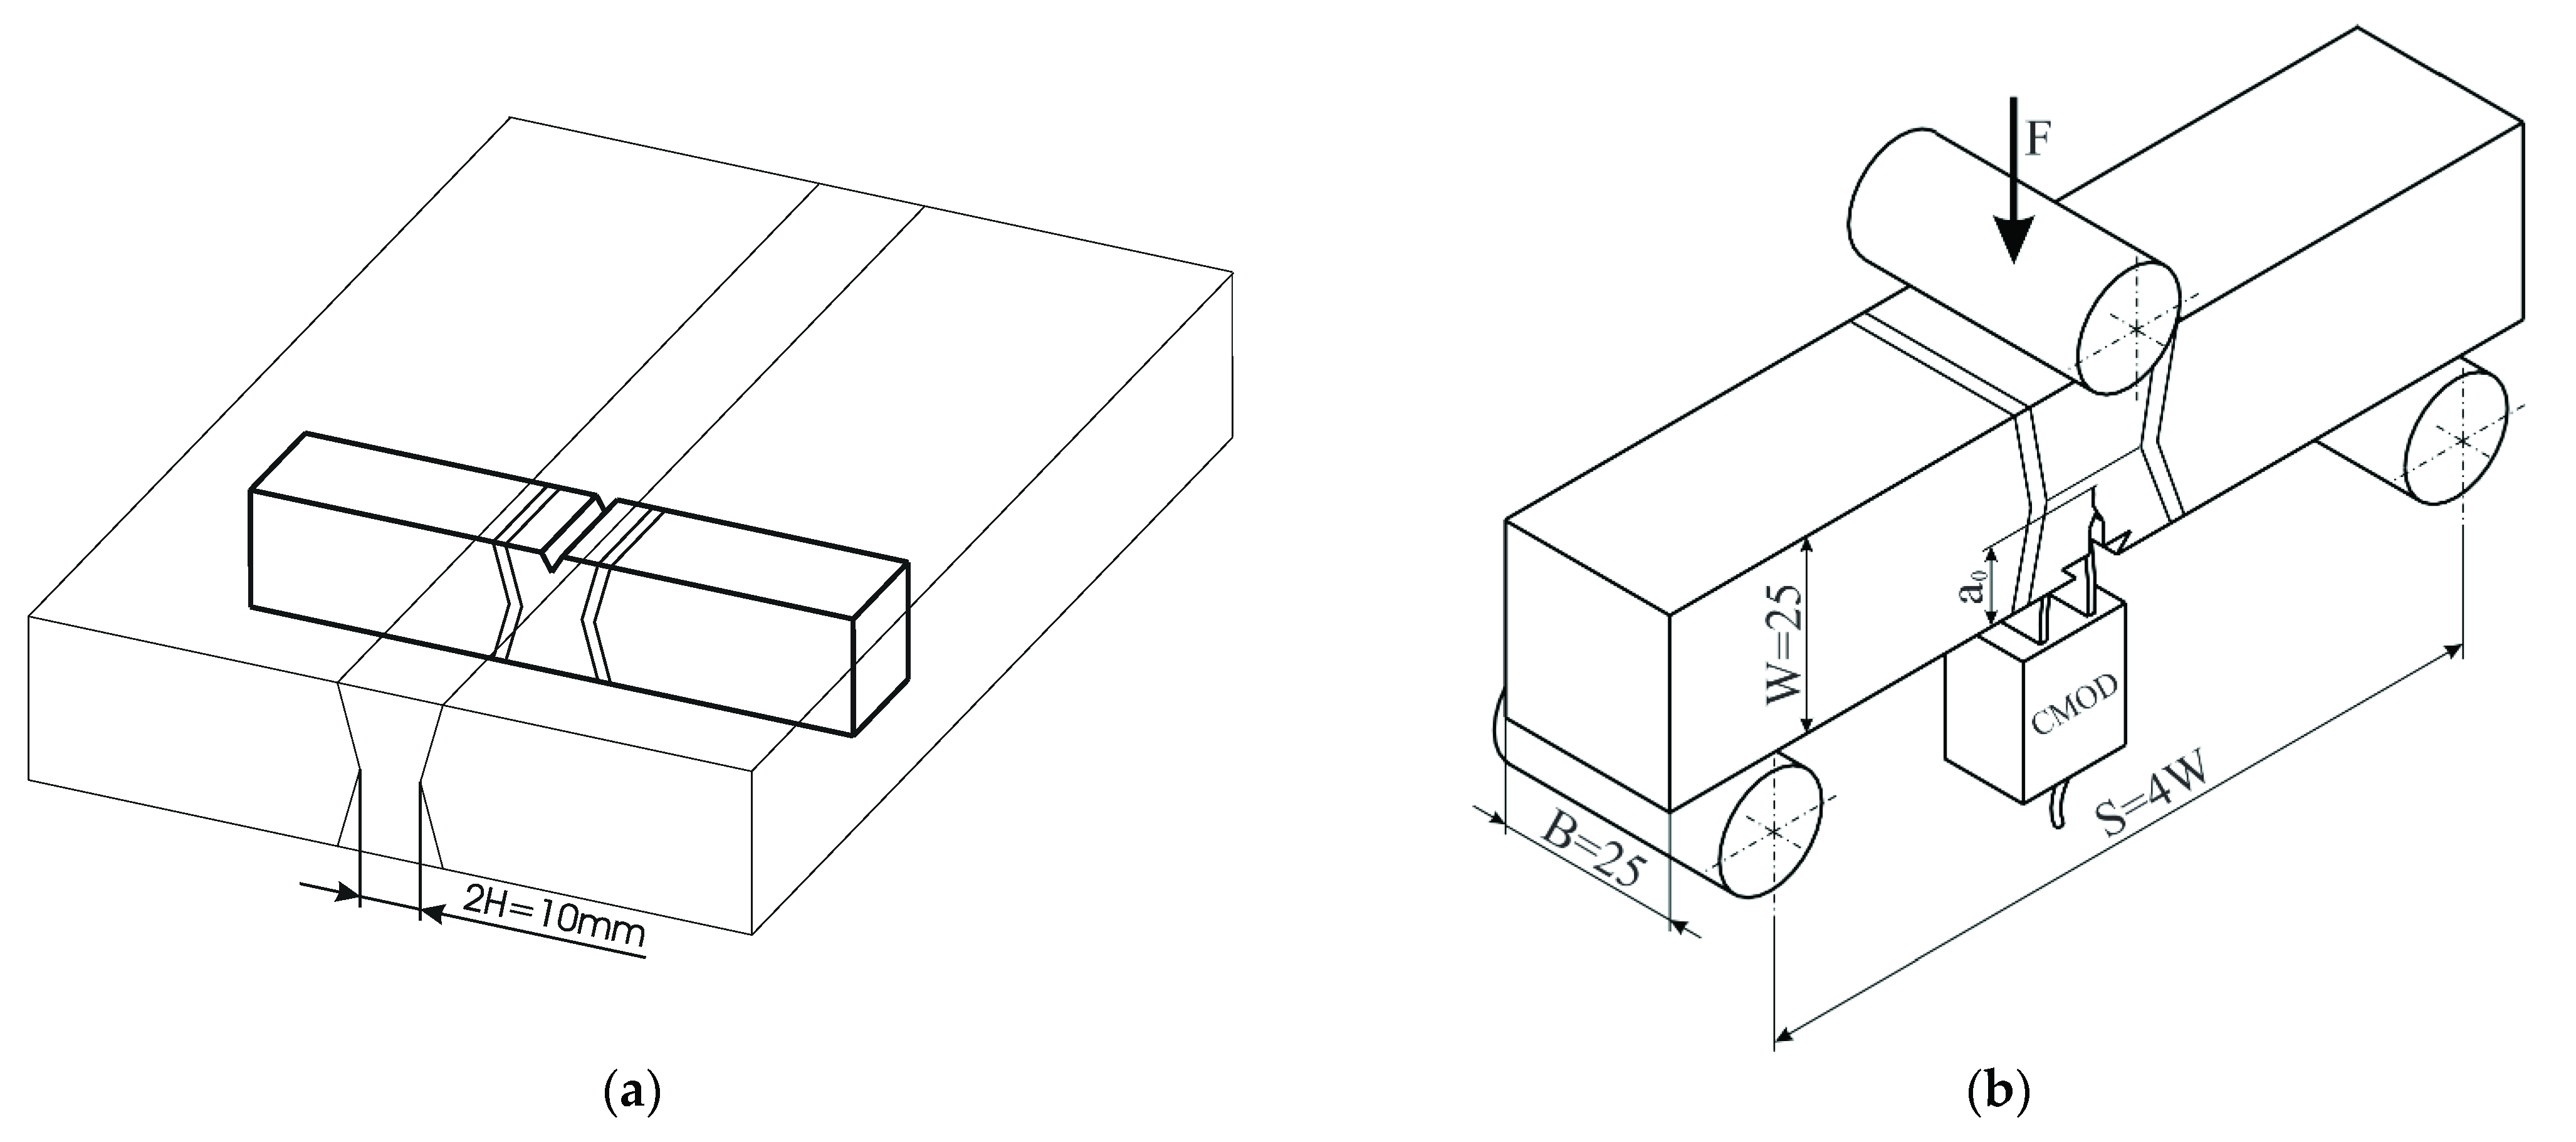
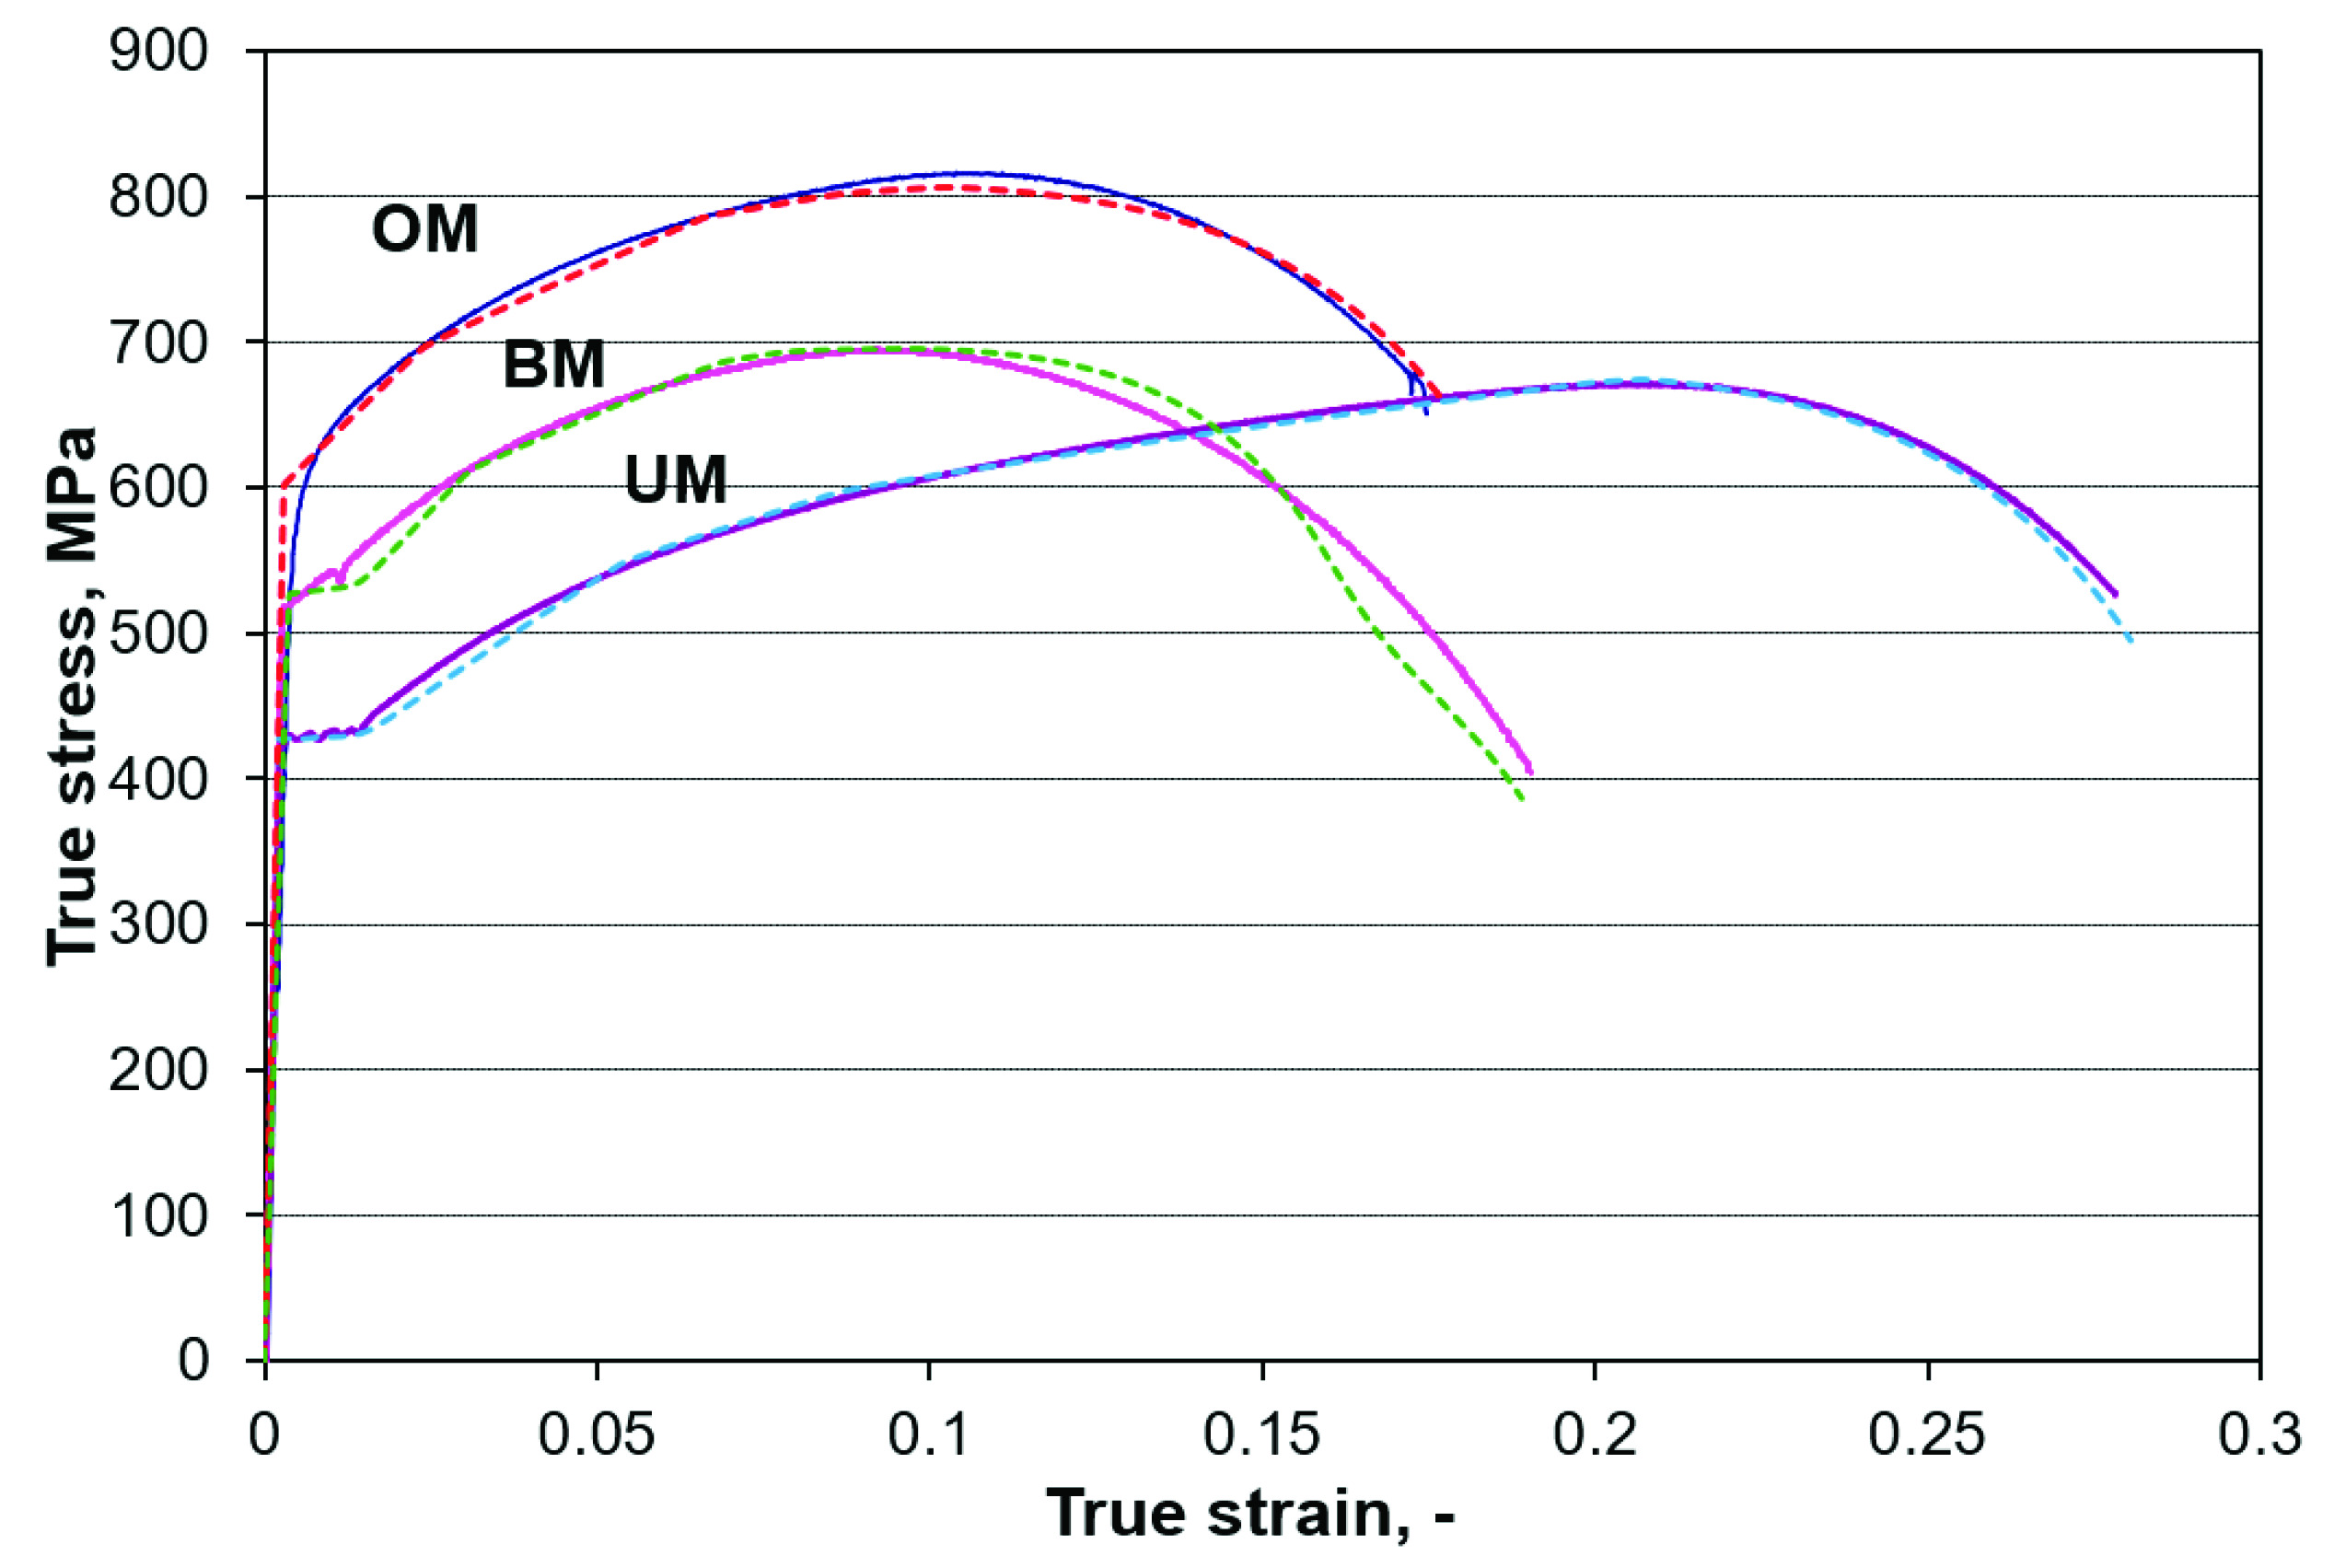
2. Materials and Experiments
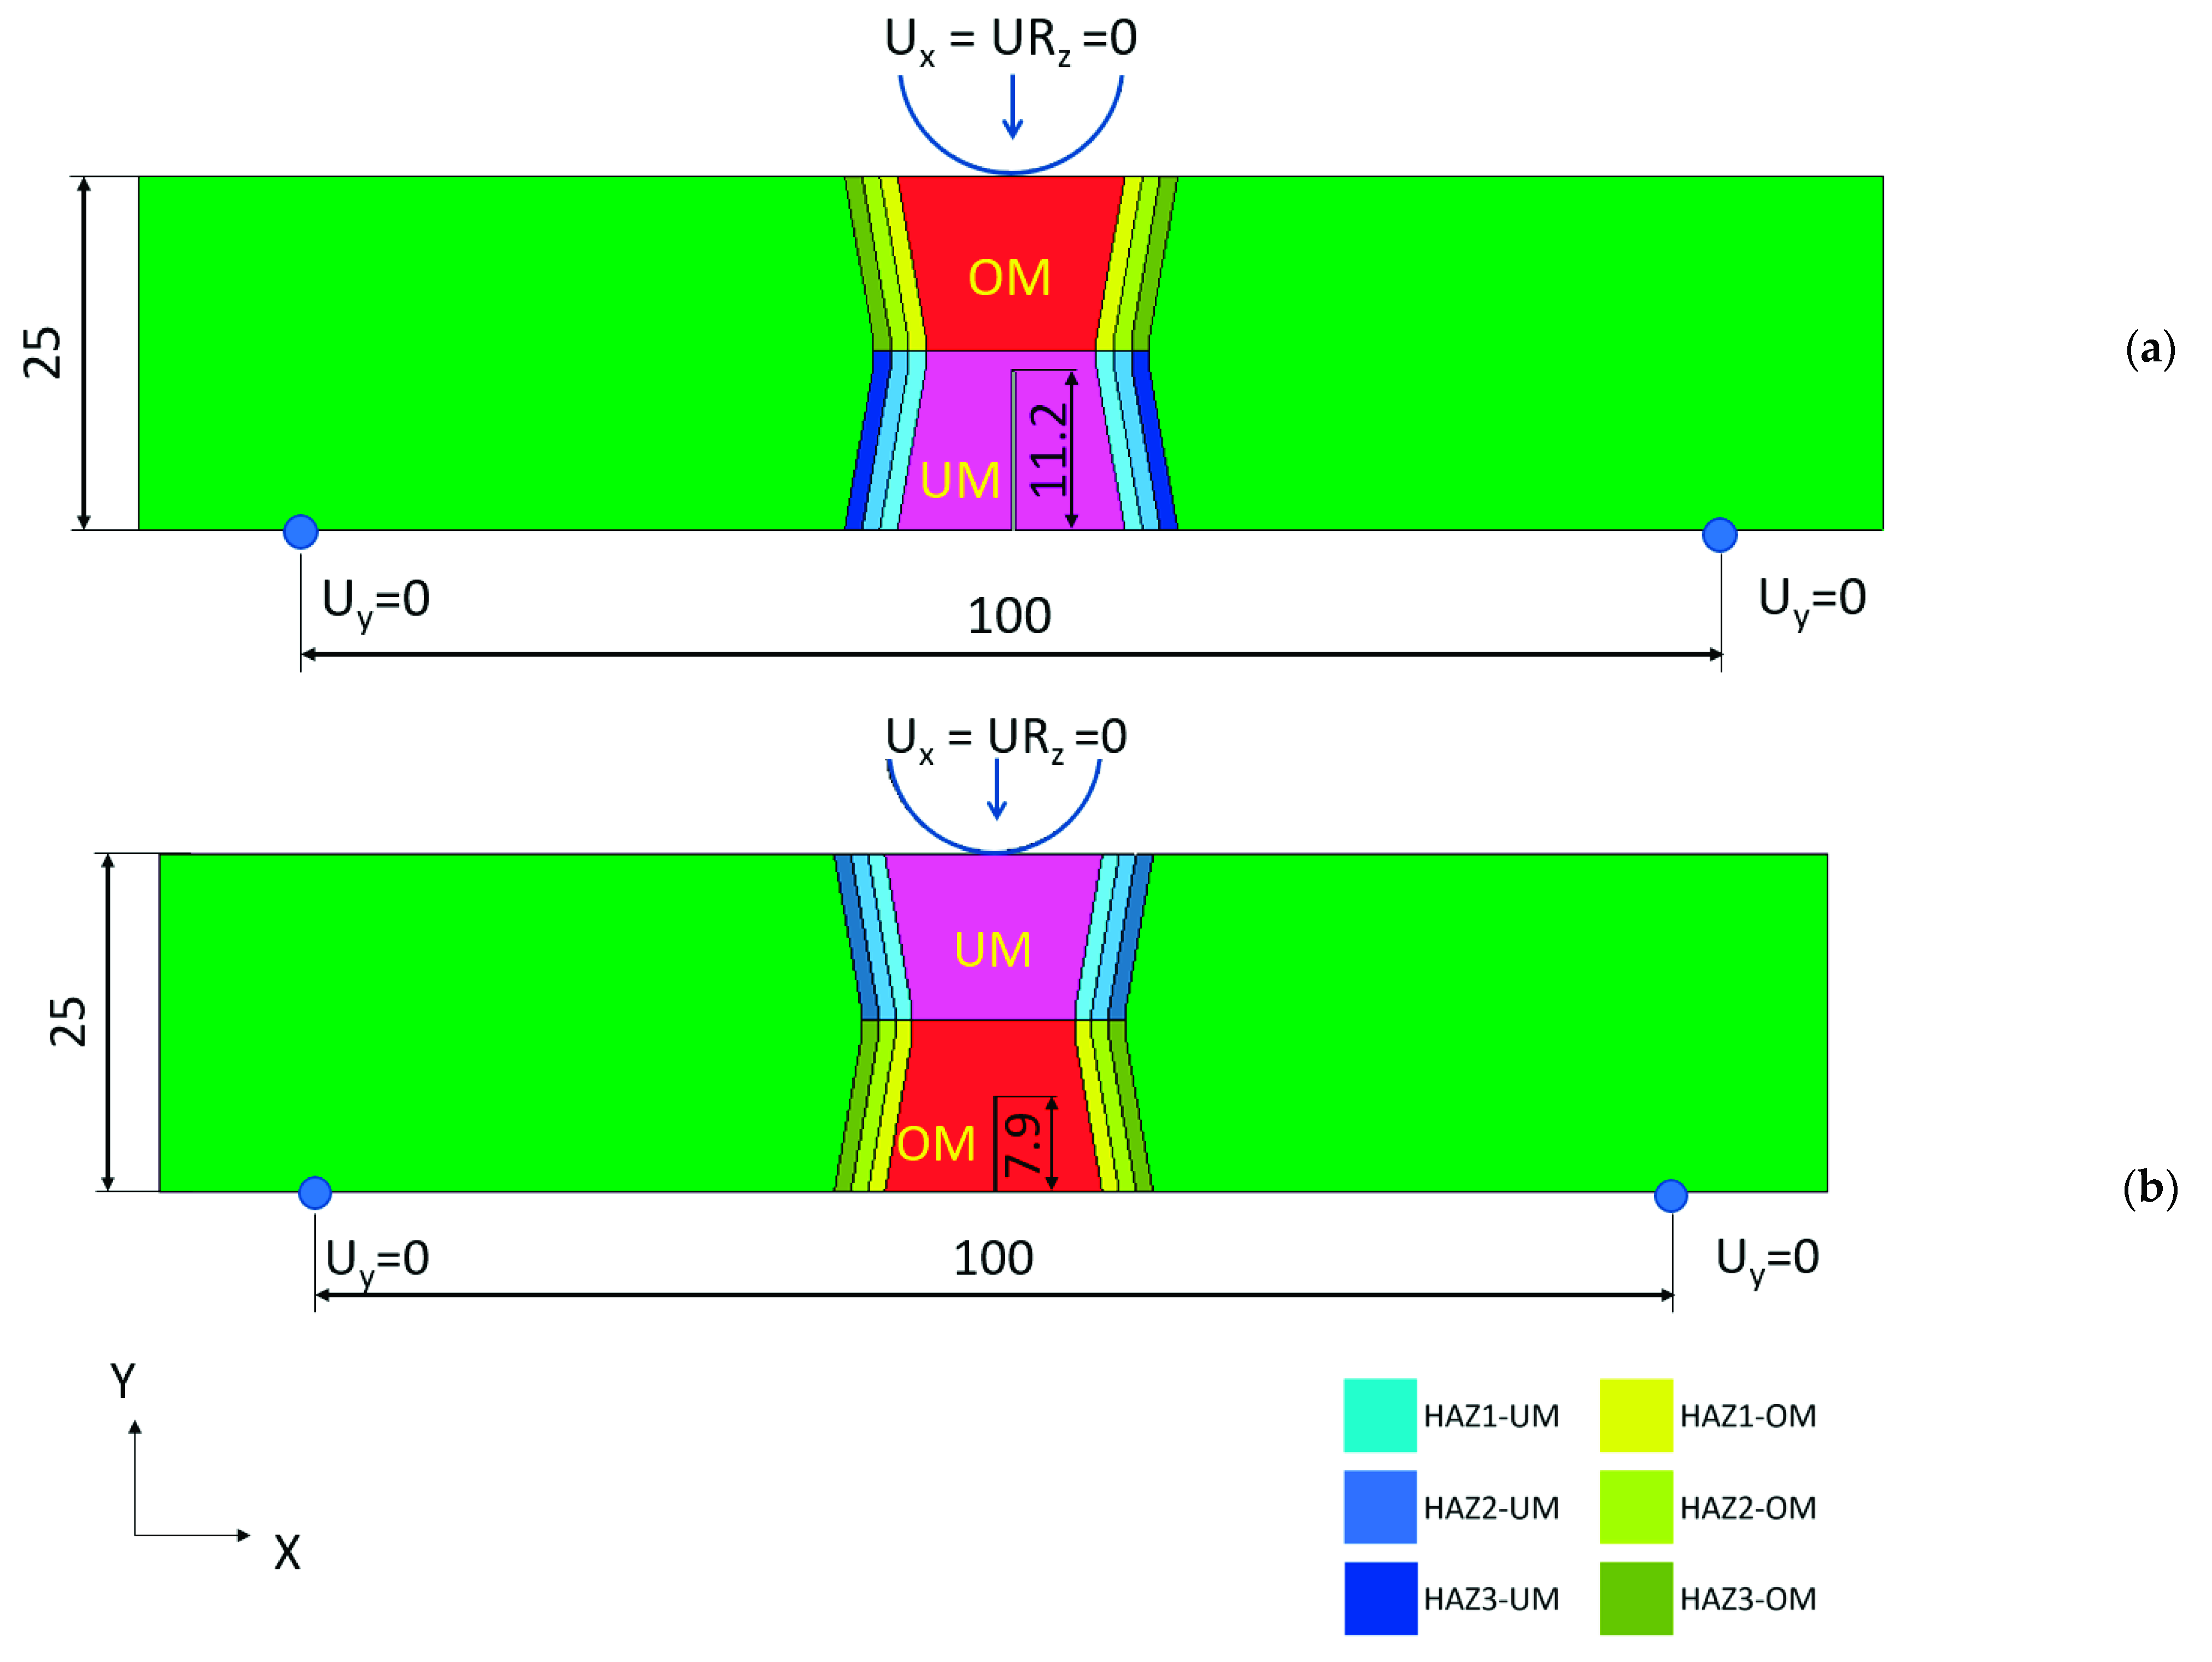
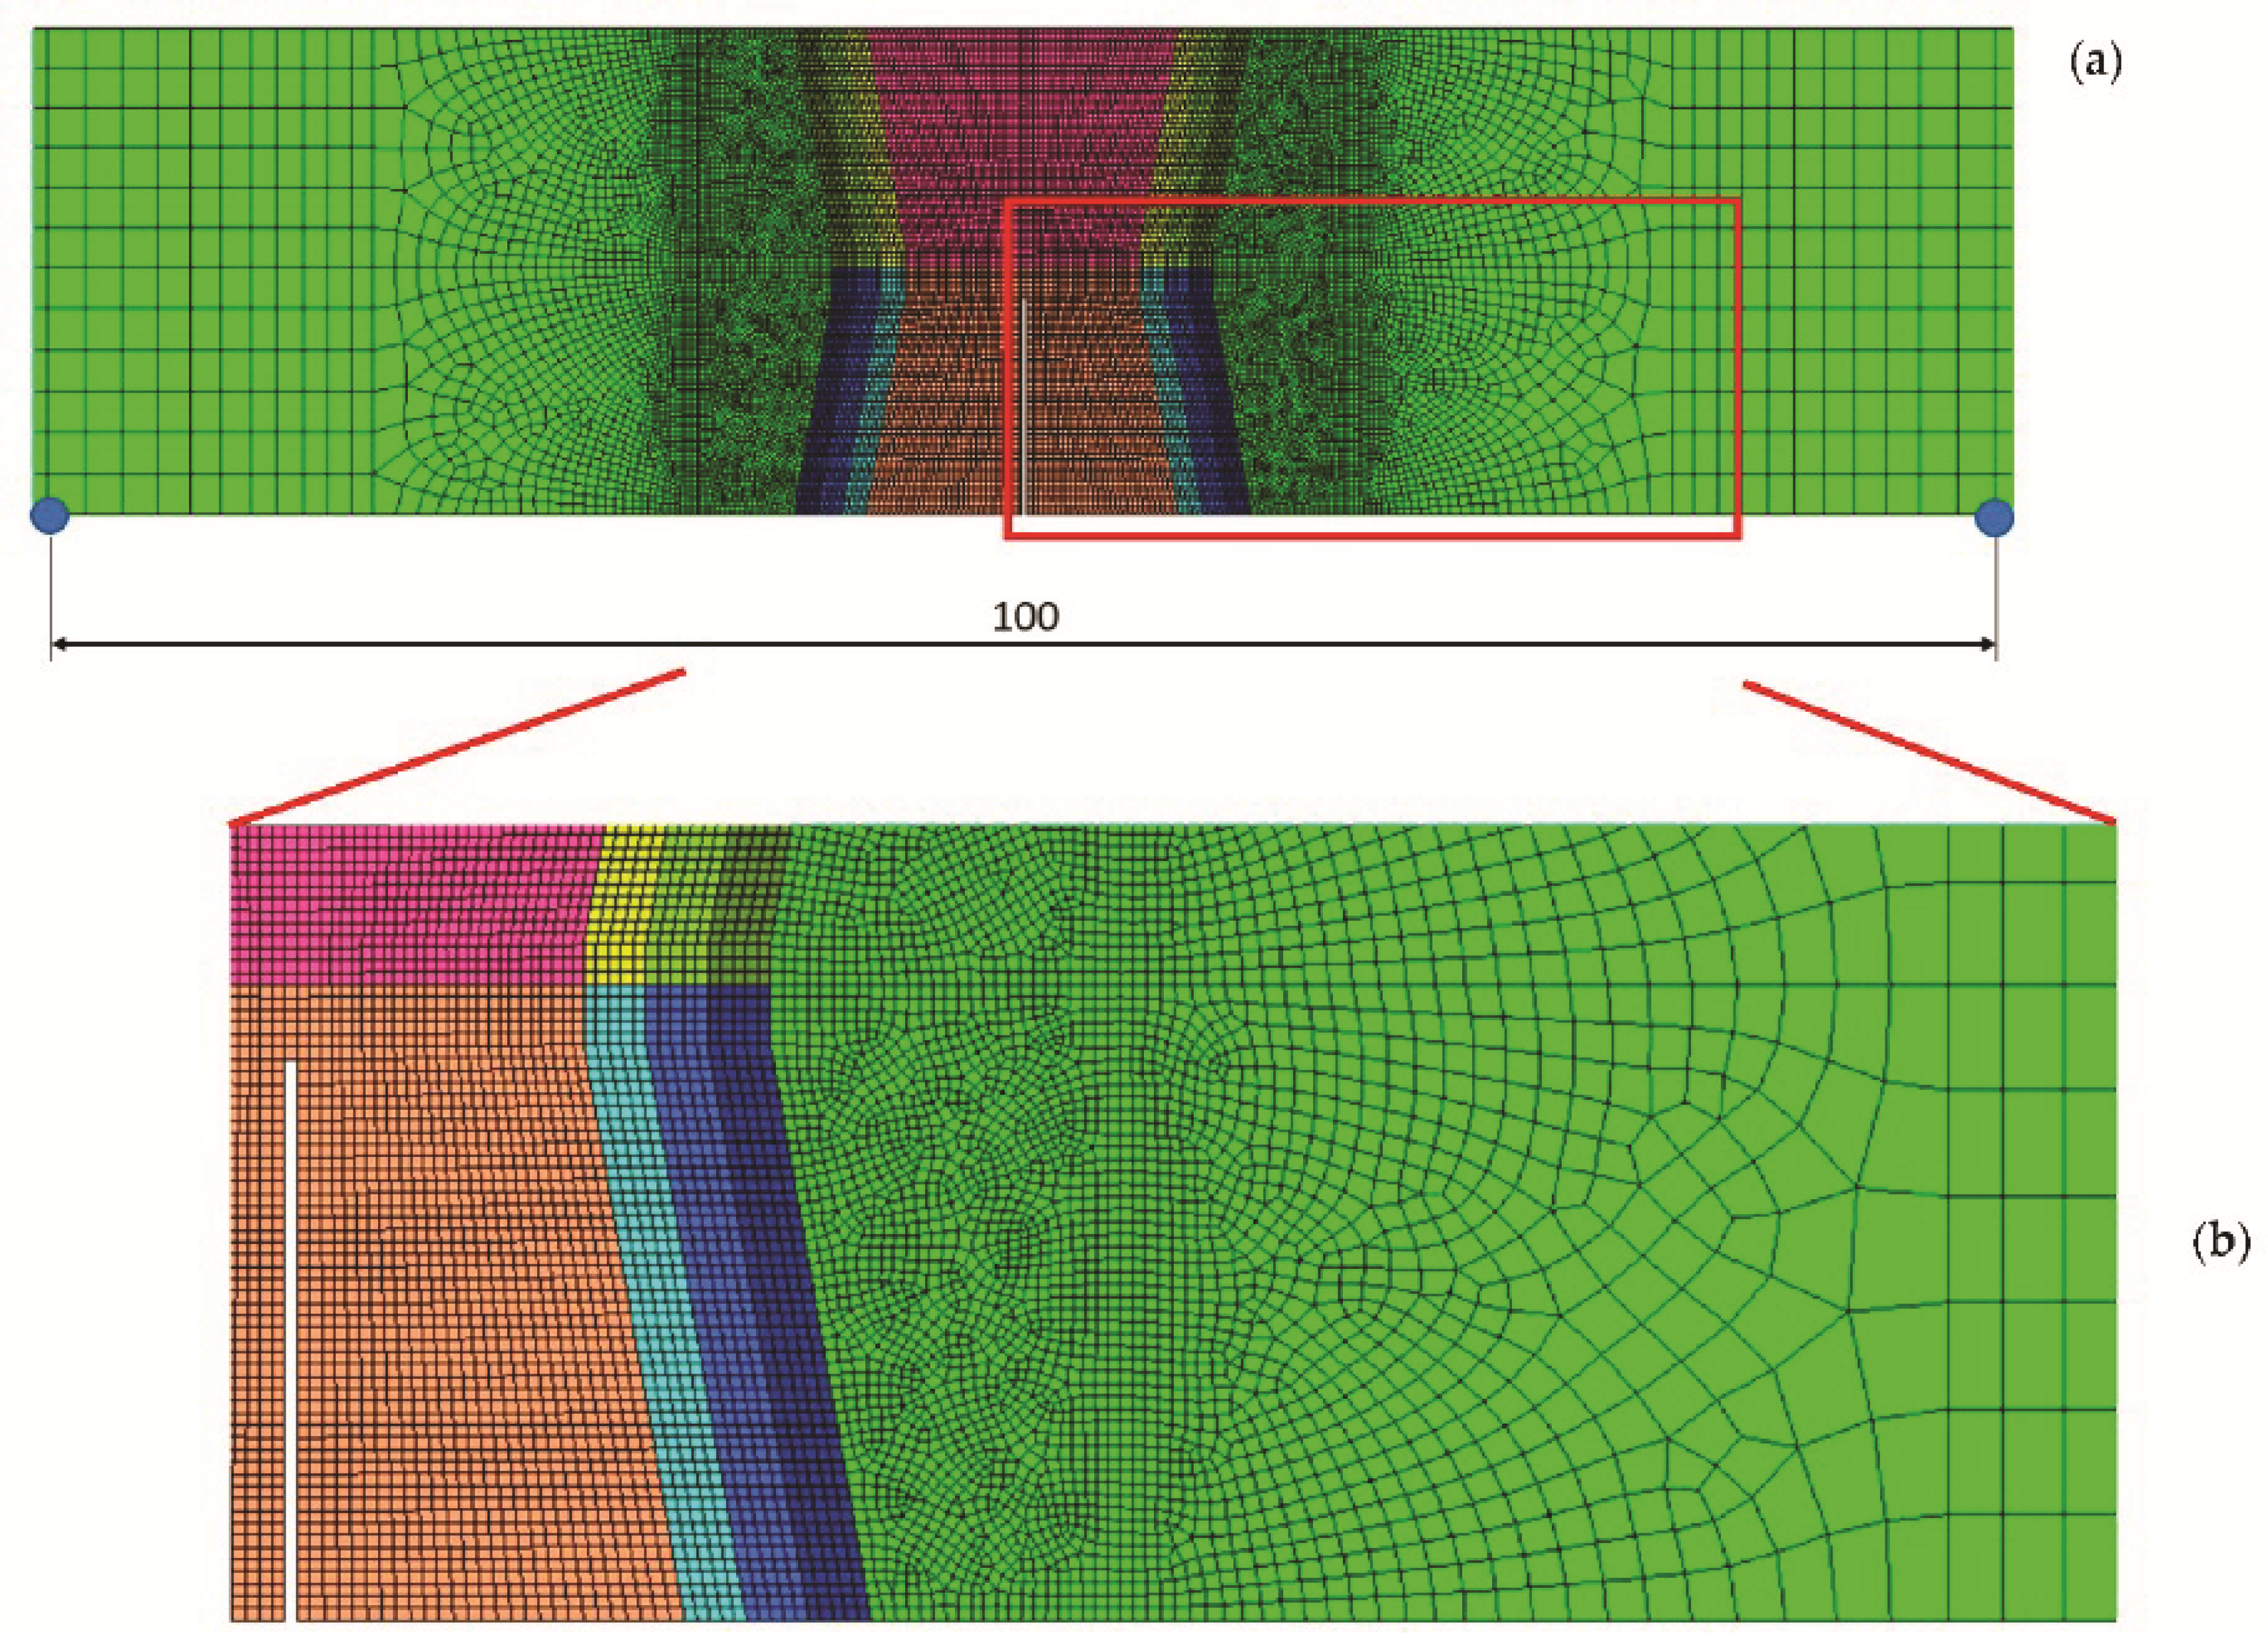
3. Finite Element Simulation
4. Results
5. Conclusions
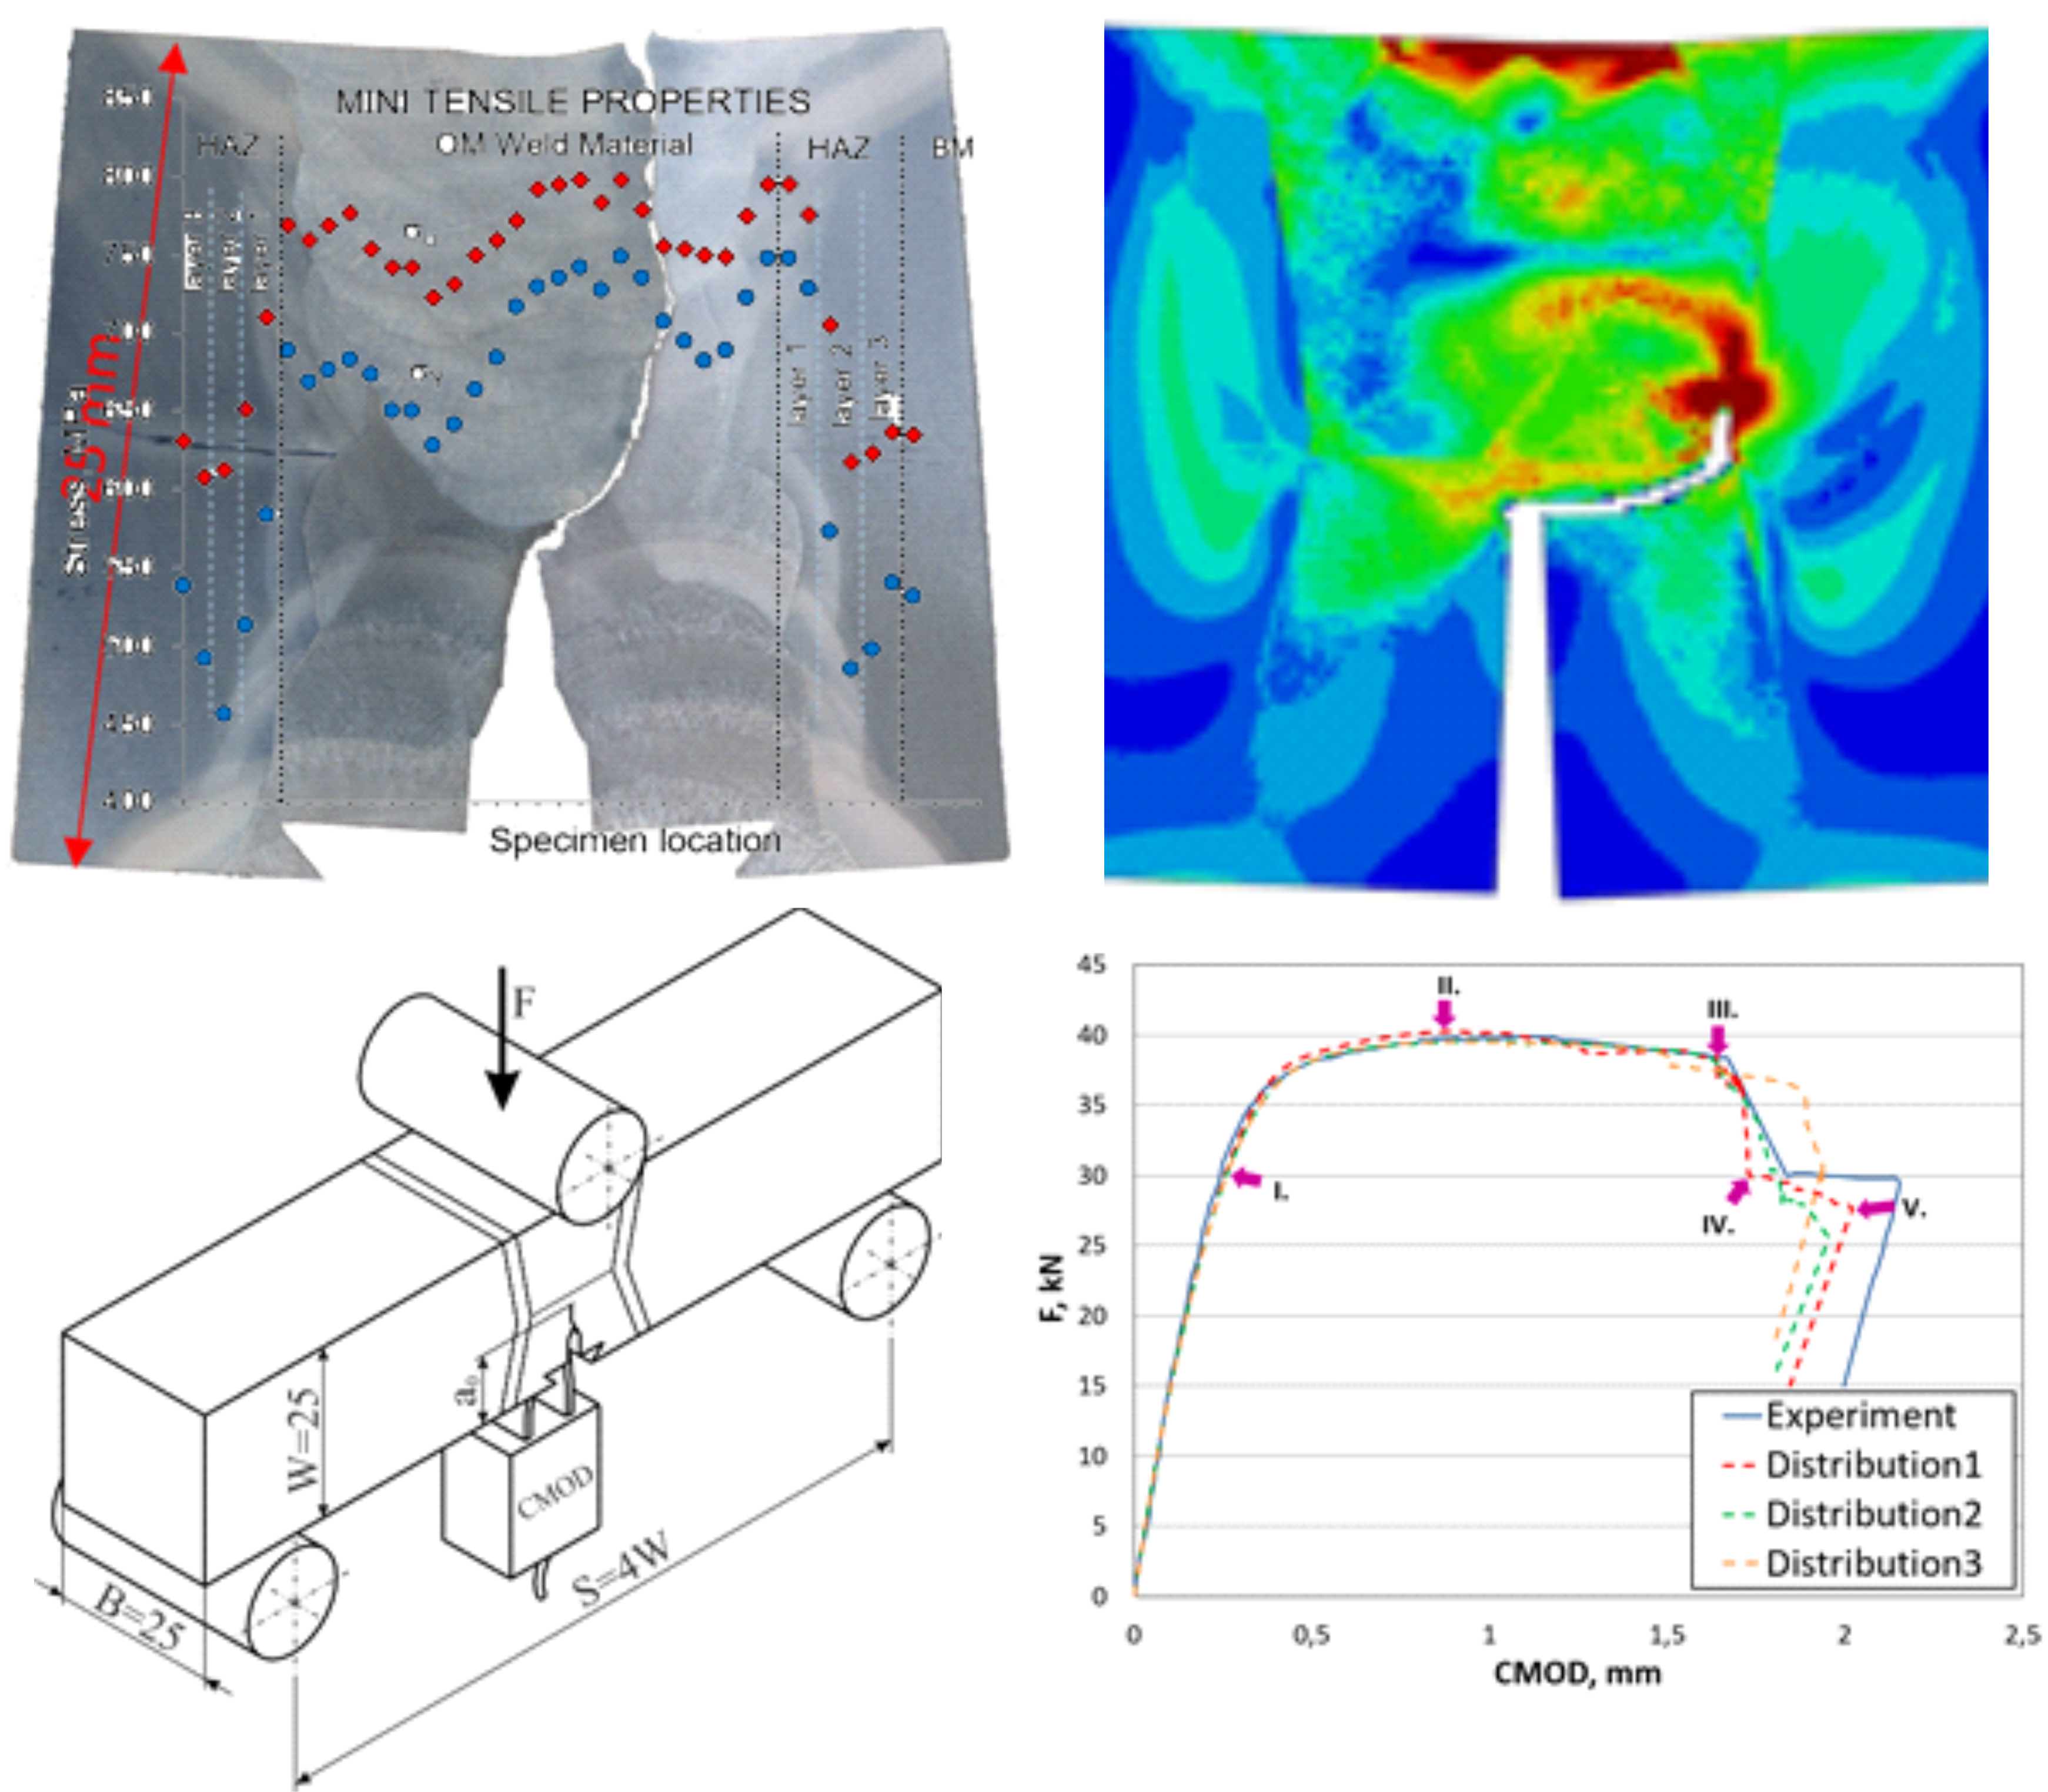
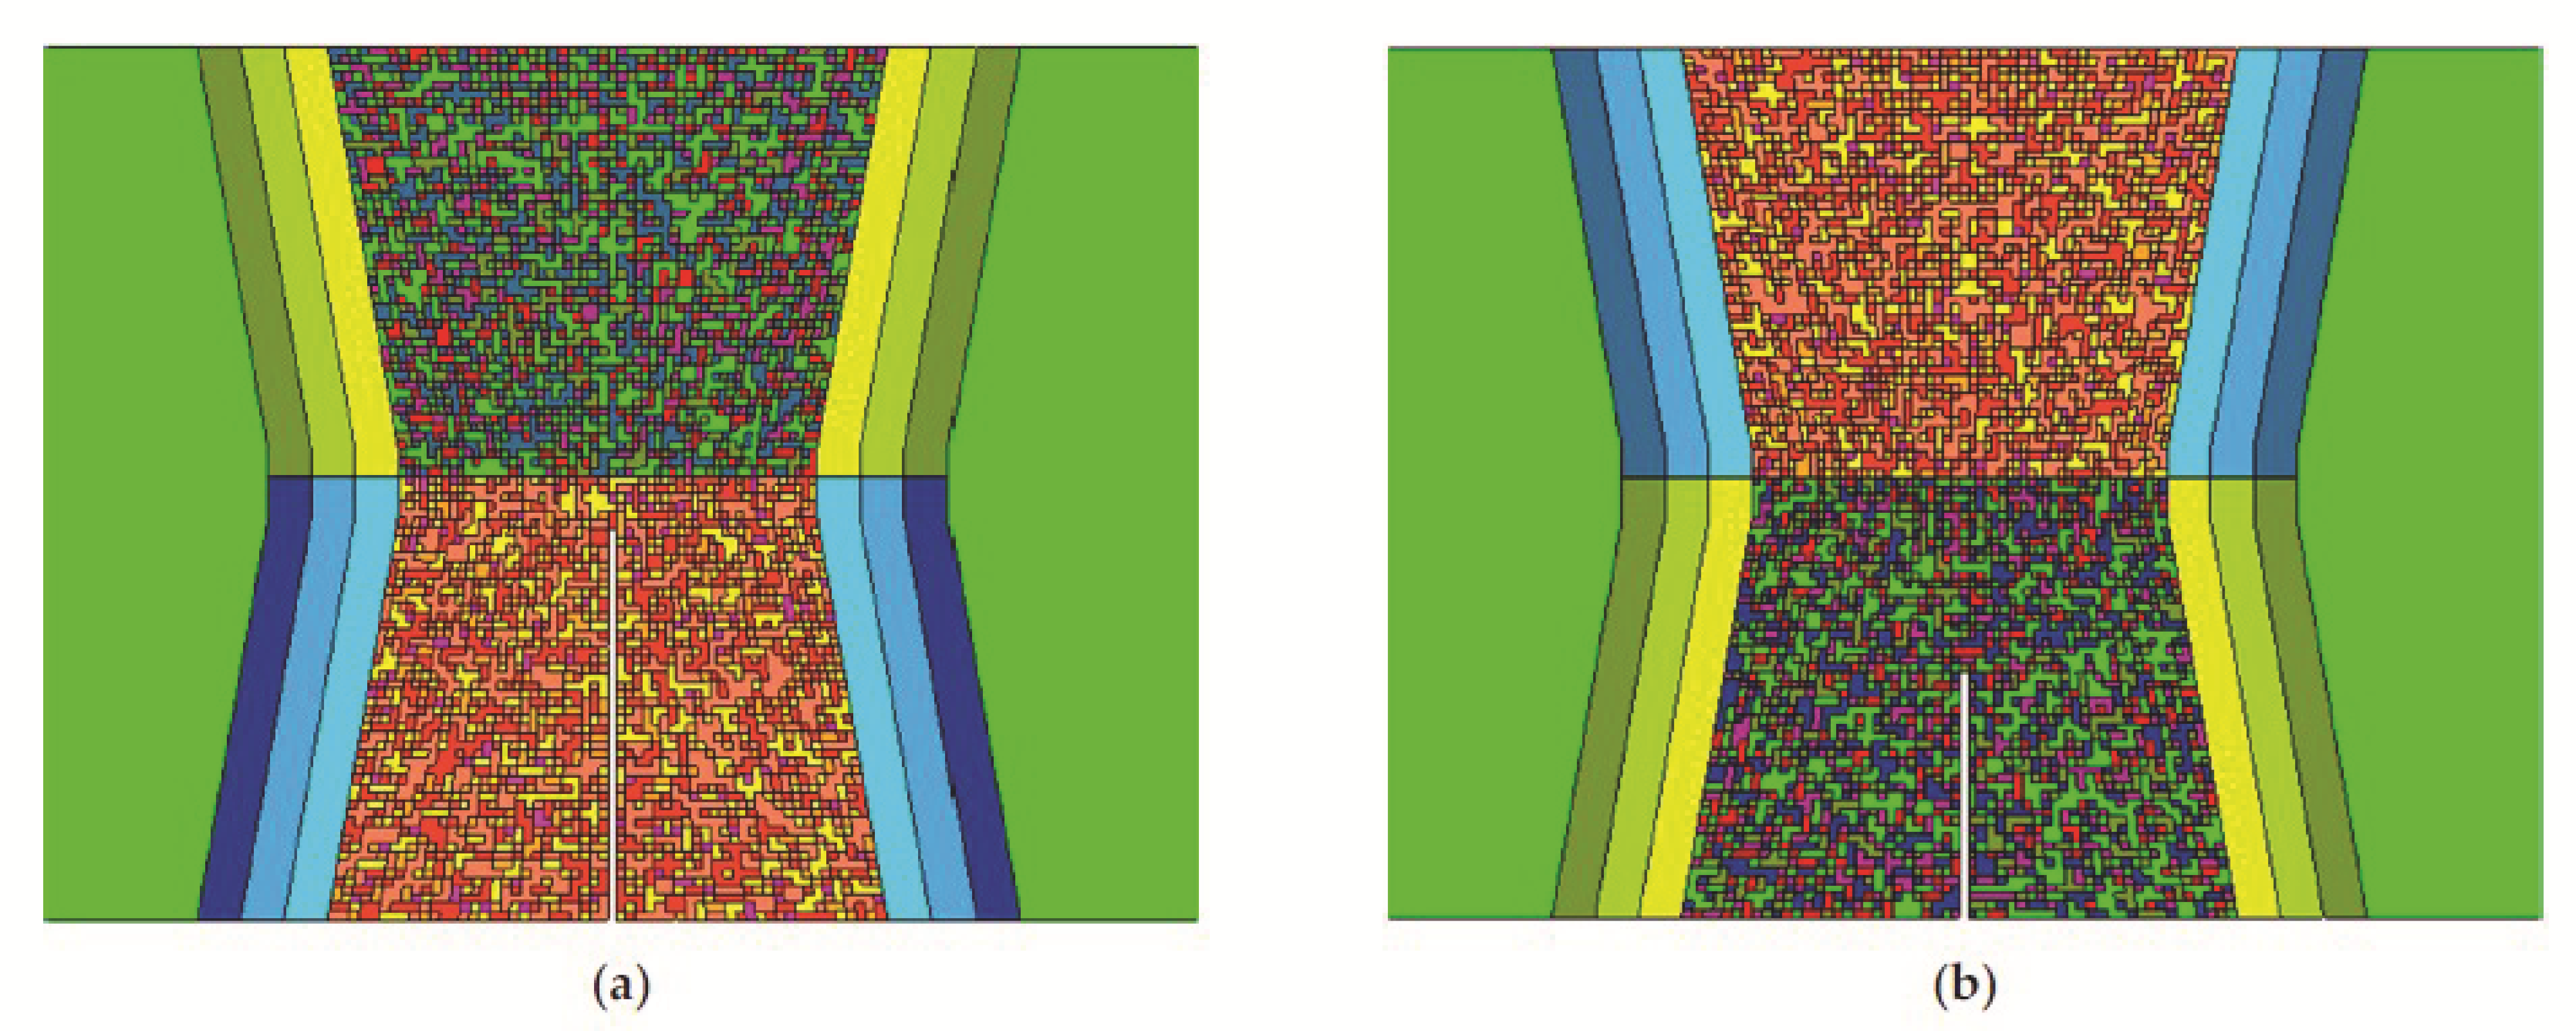
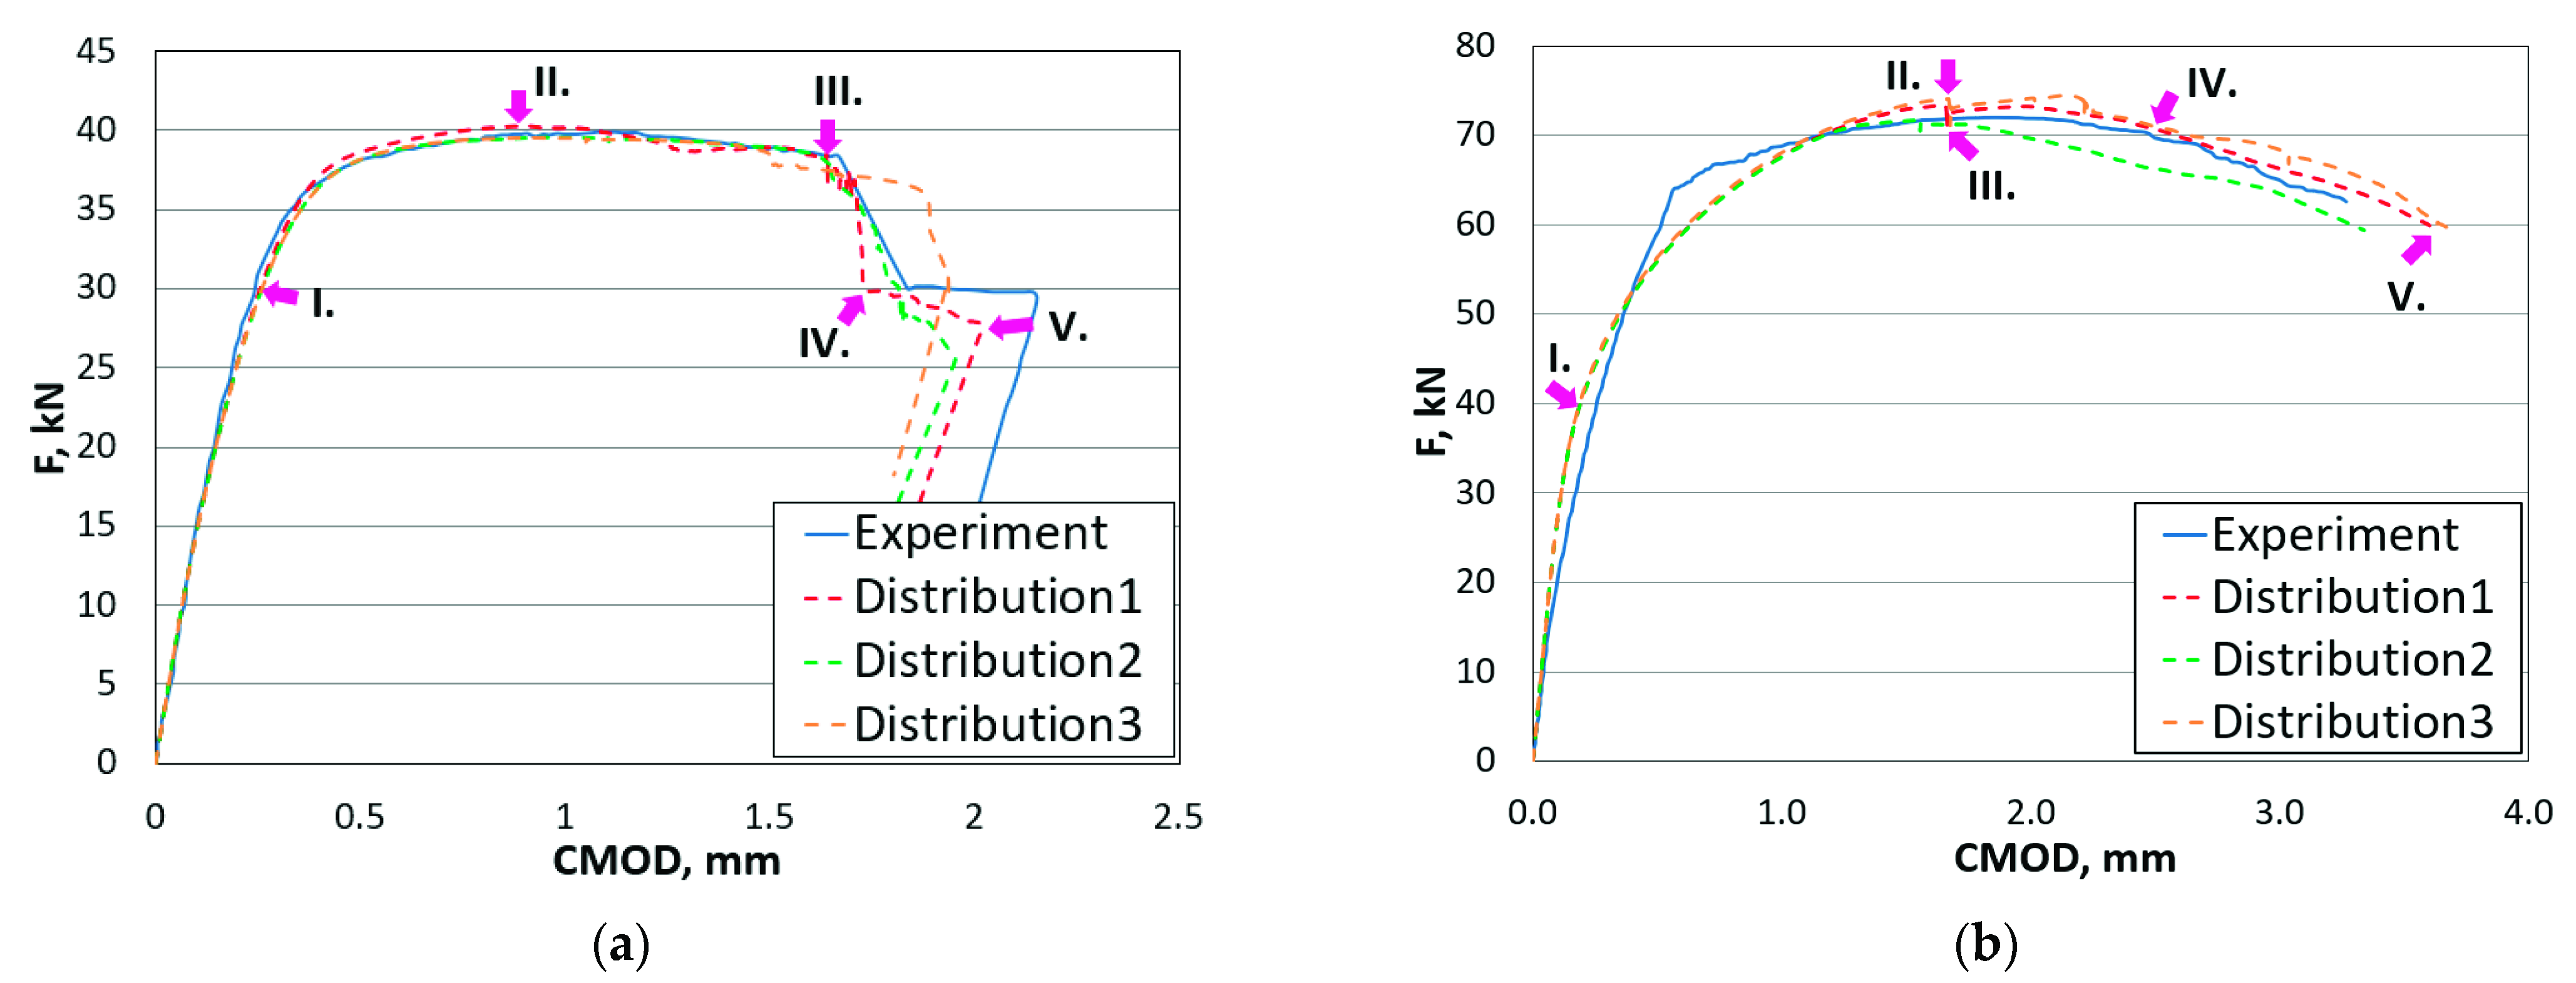
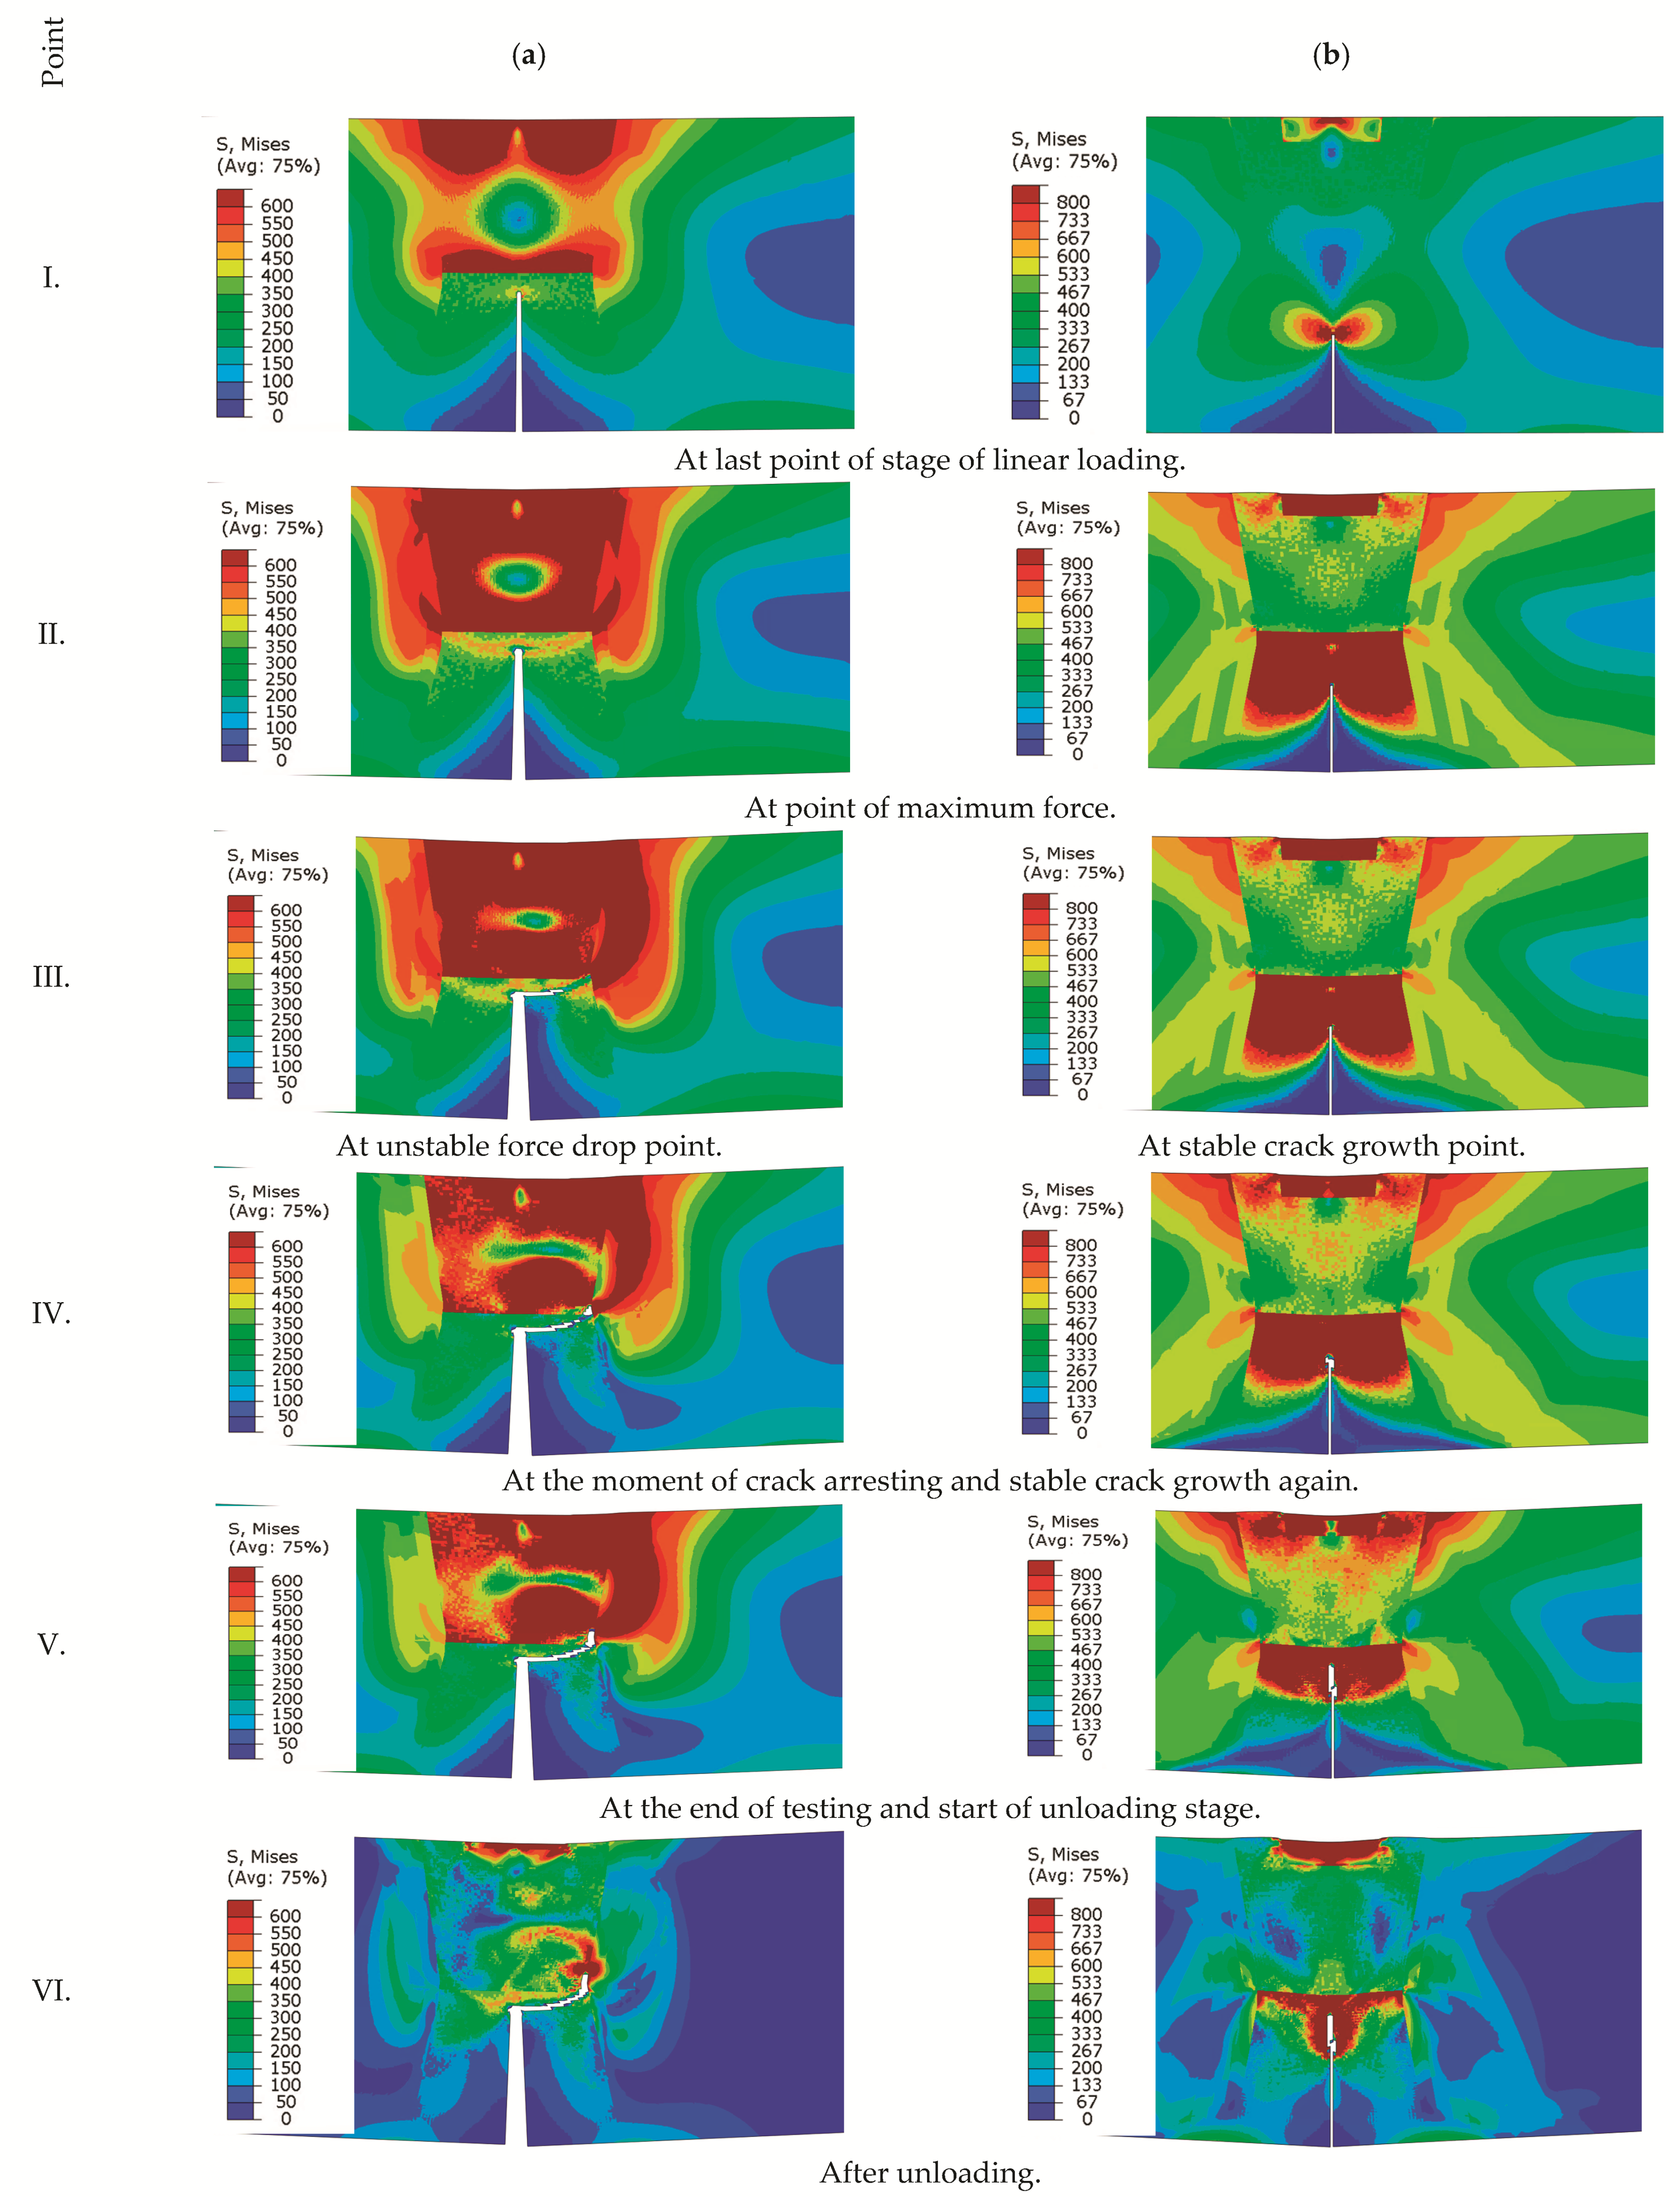
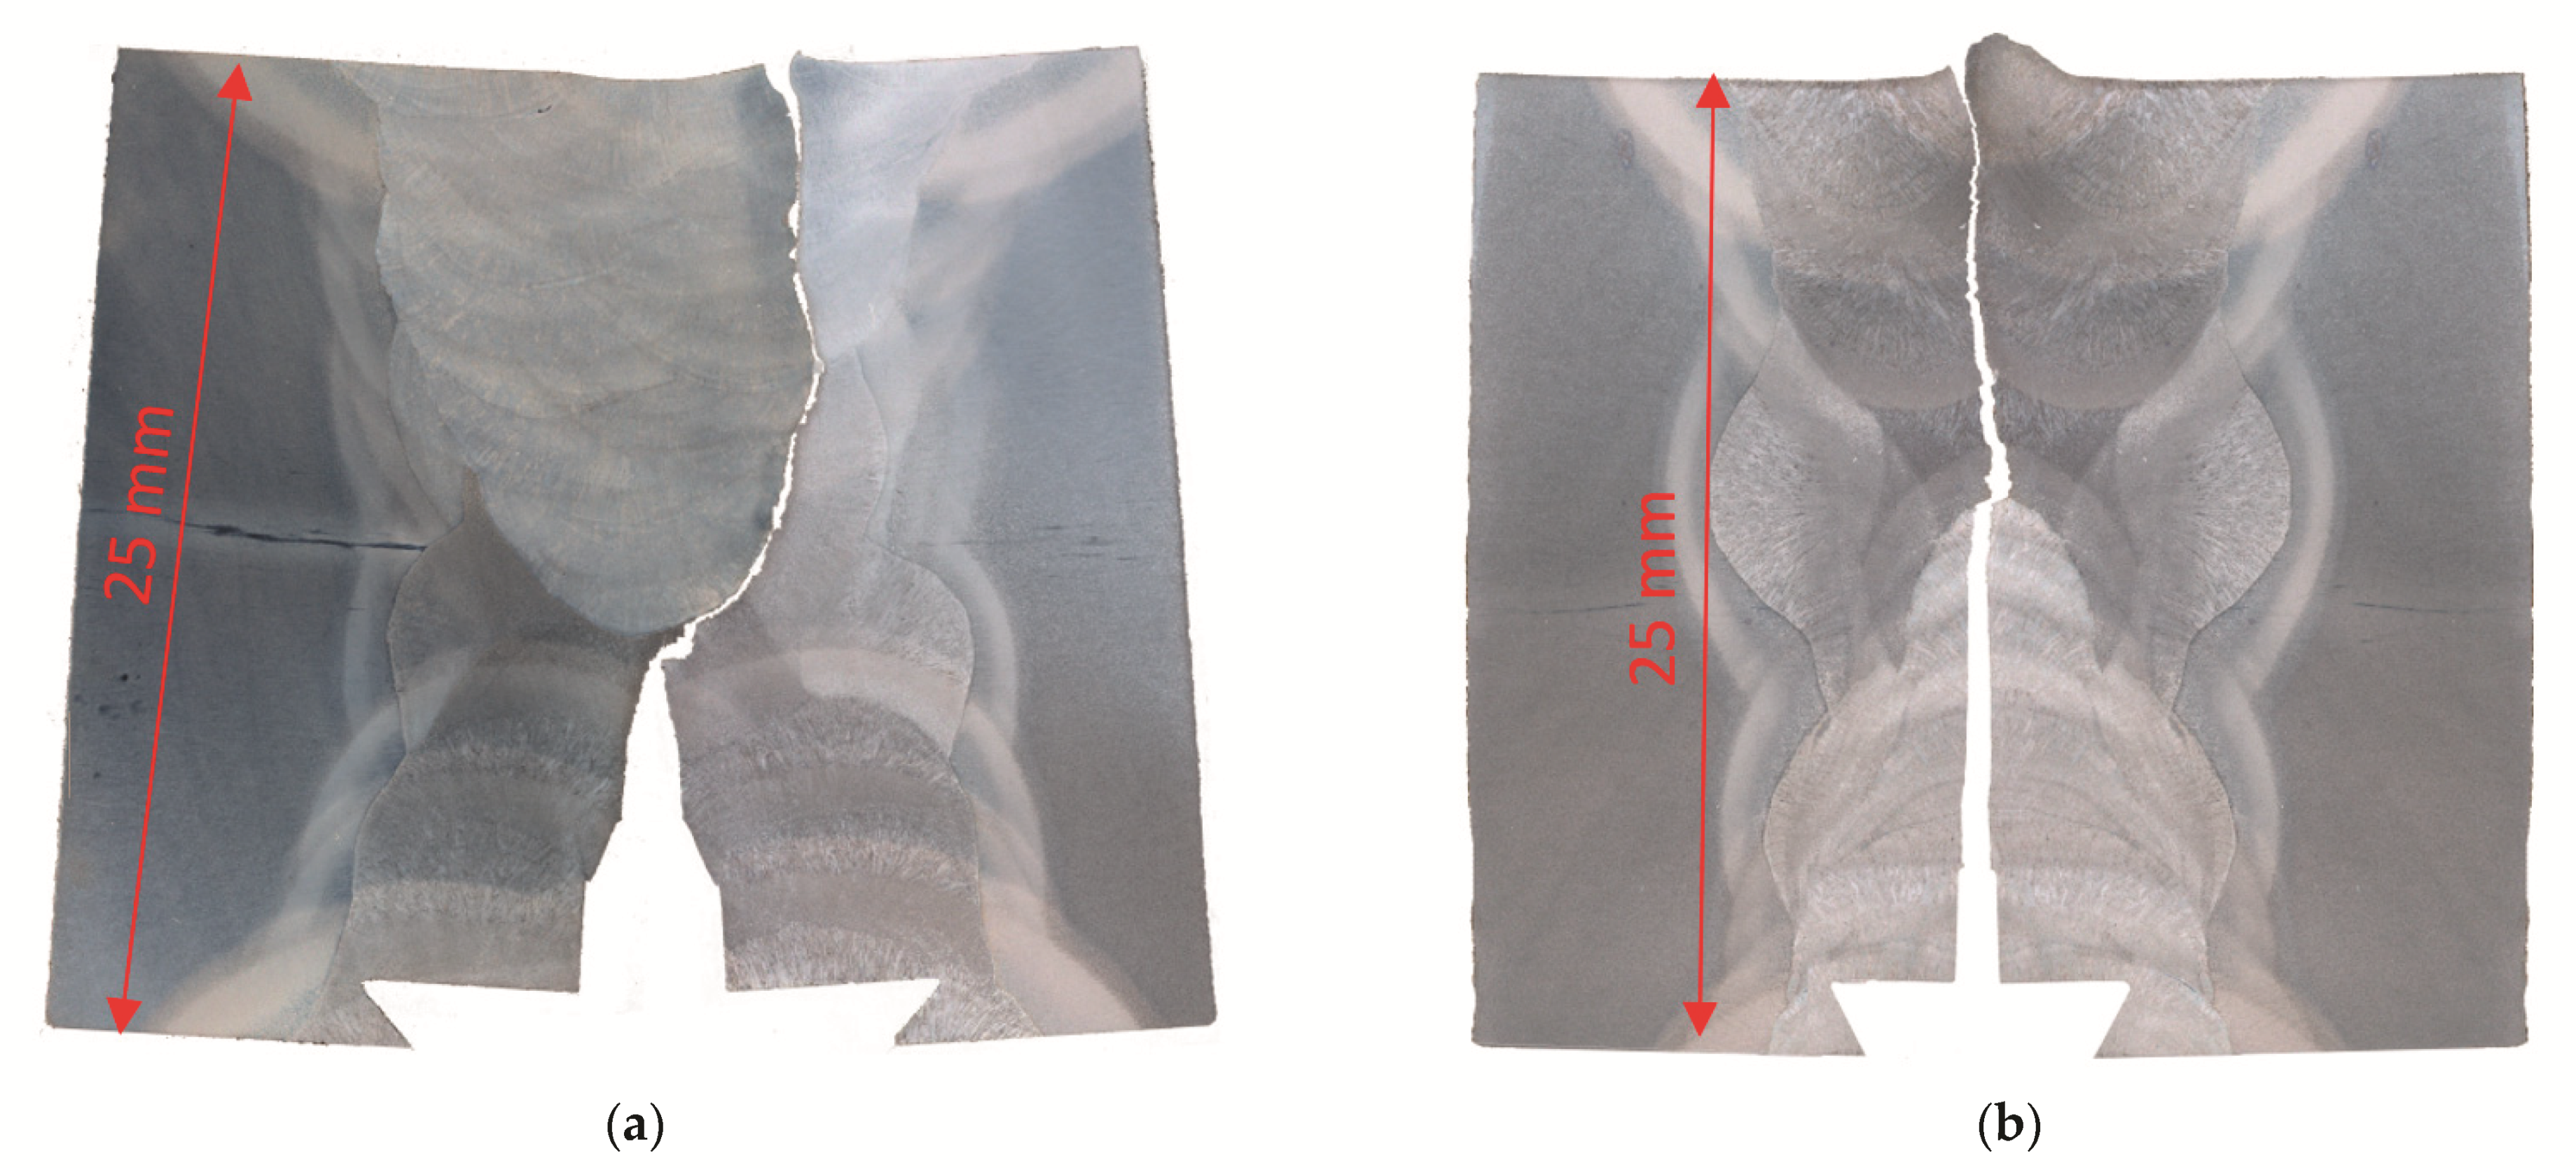
- The mechanical properties inside a multi pass weld region and HAZ are not constant, and this inhomogeneity should be included in FE simulation. An FE-modelling approach, where different properties inside a weld are distributed randomly, and where the inhomogeneity of the HAZ is included, shows sufficient correlation with the experimental results;
- Similar stiffness responses, reaction force versus CMOD between experimental and simulation were observed. Small changes in crack paths appeared due to the idealised weld geometries;
- FE-modelling with randomly distributed material properties should be considered further, together with simulation of similar welded structures, especially those weld connections that present a “weak-spot” for the entire structure.
Author Contributions
Funding
Institutional Review Board Statement
Informed Consent Statement
Data Availability Statement
Acknowledgments
Conflicts of Interest
References
- Qian, Y.; Zhao, J. Fracture Toughness Calculation Method Amendment of the Dissimilar Steel Welded Joint Based on 3D XFEM. Metals 2019, 9, 509. [Google Scholar] [CrossRef]
- Brocks, W.; Cornec, A.; Scheider, I. 3.03—Computational Aspects of Nonlinear Fracture Mechanics. In Comprehensive Structural Integrity Fracture of Materials from Nano to Macro; Milne, I., Ritchie, R.O., Karihaloo, B.B.T., Eds.; Pergamon: Oxford, UK, 2003; pp. 127–209. ISBN 978-0-08-043749-1. [Google Scholar]
- Kim, S.-H.; Han, J.-J.; Kim, Y.-J. Limit Load Solutions of V-groove Welded Pipes with a Circumferential Crack at the Centre of Weld. Procedia Mater. Sci. 2014, 3, 706–713. [Google Scholar] [CrossRef][Green Version]
- Kim, Y.-J.; Schwalbe, K.-H. Mismatch effect on plastic yield loads in idealised weldments: II. Heat affected zone cracks. Eng. Fract. Mech. 2001, 68, 183–199. [Google Scholar] [CrossRef]
- Zerbst, U. Application of fracture mechanics to welds with crack origin at the weld toe: A review Part 1: Consequences of inhomogeneous microstructure for materials testing and failure assessment. Weld. World 2019, 63, 1715–1732. [Google Scholar] [CrossRef]
- Wang, H.T.; Wang, G.Z.; Xuan, F.-Z.; Tu, S.-T. An experimental investigation of local fracture resistance and crack growth paths in a dissimilar metal welded joint. Mater. Des. 2013, 44, 179–189. [Google Scholar] [CrossRef]
- Schork, B.; Kucharczyk, P.; Madia, M.; Zerbst, U.; Hensel, J.; Bernhard, J.; Tchuindjang, D.; Kaffenberger, M.; Oechsner, M. The effect of the local and global weld geometry as well as material defects on crack initiation and fatigue strength. Eng. Fract. Mech. 2018, 198, 103–122. [Google Scholar] [CrossRef]
- Zerbst, U.; Madia, M.; Vormwald, M.; Beier, H.T. Fatigue strength and fracture mechanics—A general perspective. Eng. Fract. Mech. 2018, 198, 2–23. [Google Scholar] [CrossRef]
- Zerbst, U.; Ainsworth, R.A.; Beier, H.T.; Pisarski, H.; Zhang, Z.L.; Nikbin, K.; Nitschke-Pagel, T.; Münstermann, S.; Kucharczyk, P.; Klingbeil, D. Review on fracture and crack propagation in weldments—A fracture mechanics perspective. Eng. Fract. Mech. 2014, 132, 200–276. [Google Scholar] [CrossRef]
- Peng, Y.; Wu, C.; Gan, J.; Dong, J. Characterization of heterogeneous constitutive relationship of the welded joint based on the stress-hardness relationship using micro-hardness tests. Constr. Build. Mater. 2019, 202, 37–45. [Google Scholar] [CrossRef]
- Hemer, A.; Milovic, L.; Grbovic, A.; Aleksic, B.; Aleksic, V. Numerical determination and experimental validation of the fracture toughness of welded joints. Eng. Fail. Anal. 2020, 107, 104220. [Google Scholar] [CrossRef]
- Song, Y.; Hua, L. Influence of inhomogeneous constitutive properties of weld materials on formability of tailor welded blanks. Mater. Sci. Eng. A 2012, 552, 222–229. [Google Scholar] [CrossRef]
- Fan, K.; Wang, G.Z.; Tu, S.T.; Xuan, F.Z. Geometry and material constraint effects on fracture resistance behavior of bi-material interfaces. Int. J. Fract. 2016, 201, 143–155. [Google Scholar] [CrossRef]
- Gubeljak, N. Fracture behaviour of specimens with surface notch tip in the heat affected zone (HAZ) of strength mis-matched welded joints. Int. J. Fract. 1999, 100, 155–167. [Google Scholar] [CrossRef]
- Predan, J.; Gubeljak, N.; Kolednik, O.; Fischer, F.D. The change of the local crack driving force in an under-match welded joint. In Proceedings of the 15th European Conference of Fracture, Stockholm, Sweden, 11–13 August 2004; pp. 1–8. [Google Scholar]
- Gubeljak, N.; Kolednik, O.; Predan, J.; Oblak, M. Effect of strength of mismatch interface on crack driving force. In Proceedings of the Advanced Fracture damage Mechanics, 3rd International Conference of Fracture and Damage Mechanics—FDM 2003, Paderborn, Germany, 2–4 September 2003; Volume 251–252, pp. 235–244. [Google Scholar]
- Predan, J.; Gubeljak, N.; Kolednik, O. On the local variation of the crack driving force in a double mismatched weld. Eng. Fract. Mech. 2007, 74, 1739–1757. [Google Scholar] [CrossRef]
- Gubeljak, N. Determination of lower bound fracture toughness of a high strength low alloy steel welded joint. Sci. Technol. Weld. Join. 2005, 10, 252–258. [Google Scholar] [CrossRef]
- Gubeljak, N.; Legat, J.; Koçak, M. Effect of fracture path on the toughness of weld metal. Int. J. Fract. 2002, 115, 343–359. [Google Scholar] [CrossRef]
- Kozak, D.; Gubeljak, N.; Konjatić, P.; Sertić, J. Yield load solutions of heterogeneous welded joints. Int. J. Press. Vessel. Pip. 2009, 86, 807–812. [Google Scholar] [CrossRef][Green Version]
- Ran, M.-M.; Sun, F.-F.; Li, G.-Q.; Kanvinde, A.; Wang, Y.-B.; Xiao, R.Y. Experimental study on the behavior of mismatched butt welded joints of high strength steel. J. Constr. Steel Res. 2019, 153, 196–208. [Google Scholar] [CrossRef]
- Wang, W.-K.; Liu, Y.; Guo, Y.; Xu, Z.-Z.; Zhong, J.; Zhang, J.-X. High cycle fatigue and fracture behaviors of CrMoV/NiCrMoV dissimilar rotor welded joint at 280 °C. Mater. Sci. Eng. A 2020, 786, 139473. [Google Scholar] [CrossRef]
- Chen, C.; Chiew, S.-P.; Zhao, M.-S.; Lee, C.-K.; Fung, T.-C. Influence of cooling rate on tensile behaviour of S690Q high strength steel butt joint. J. Constr. Steel Res. 2020, 173, 106258. [Google Scholar] [CrossRef]
- Feng, J.C.; Rathod, D.W.; Roy, M.J.; Francis, J.A.; Guo, W.; Irvine, N.M.; Vasileiou, A.N.; Sun, Y.L.; Smith, M.C.; Li, L. An evaluation of multipass narrow gap laser welding as a candidate process for the manufacture of nuclear pressure vessels. Int. J. Press. Vessel. Pip. 2017, 157, 43–50. [Google Scholar] [CrossRef]
- Long, J.; Zhang, L.-J.; Zhang, Q.-B.; Wang, W.-K.; Zhong, J.; Zhang, J.-X. Microstructural characteristics and low cycle fatigue properties at 230 °C of different weld zone materials from a 100 mm thick dissimilar weld of ultra-supercritical rotor steel. Int. J. Fatigue 2020, 130, 105248. [Google Scholar] [CrossRef]
- Wu, X.; Shuai, J.; Xu, K.; Lv, Z.; Shan, K. Determination of local true stress-strain response of X80 and Q235 girth-welded joints based on digital image correlation and numerical simulation. Int. J. Press. Vessel. Pip. 2020, 188, 104232. [Google Scholar] [CrossRef]
- Ran, M.-M.; Sun, F.-F.; Li, G.-Q.; Wang, Y.-B. Mechanical behaviour of longitudinal lap-welded joints of high strength steel: Experimental and numerical analysis. Thin-Walled Struct. 2021, 159, 107286. [Google Scholar] [CrossRef]
- Ladislav, N.; Mitsuyoshi, T. Creation of Imperfections for Welding Simulations. Comput. Model. Eng. Sci. 2011, 82, 253–264. [Google Scholar]
- BS 7448-4, Fracture Mechanics Toughness Tests—Part 4: Fracture Mechanics Toughness Tests. Method for Determination of Fracture Resistance Curves and Initiation Values for Stable Crack Extension in Metallic Materials; British Standard Institution: London, UK, 1991.
- Abaqus Simulia. Available online: https://www.3ds.com/products-services/simulia/products/abaqus/ (accessed on 2 March 2021).
- Abaqus Ductile Damage Model. Available online: https://abaqus-docs.mit.edu/2017/English/SIMACAEMATRefMap/simamat-c-damageevolductile.htm (accessed on 12 March 2021).


| Configuration | Crack Growth Direction | Material 1 | Material 2 |
|---|---|---|---|
| I | UM → OM | OM (FILTUB 75) | UM (VAC 60) |
| II | OM → UM | UM (VAC 60) | OM (FILTUB 75) |
| Material | Lebel | Rp02 [MPa] | Rm [MPa] | M | Charpy, Kv |
|---|---|---|---|---|---|
| Base material | NIOMOL 490 | 510 | 650 | - | >60 J at −50 °C |
| Over matched | FILTUB 75 | 700 | 780 | 1.37 | >40 J at −50 °C |
| Under matched | VAC 60 | 437 | 556 | 0.86 | >80 J at −50 °C |
| Material | C | Si | Mn | P | S | Cr | Mo | Ni |
|---|---|---|---|---|---|---|---|---|
| Base material | 0.123 | 0.33 | 0.56 | 0.003 | 0.002 | 0.57 | 0.34 | 0.13 |
| Over matched | 0.040 | 0.16 | 0.95 | 0.011 | 0.021 | 0.49 | 0.42 | 2.06 |
| Under matched | 0.096 | 0.58 | 1.24 | 0.013 | 0.16 | 0.07 | 0.02 | 0.03 |
| Sample Configuration | Number of Elements | Number of Nodes |
|---|---|---|
| 1 (initial crack in UM) | 18,350 | 18,525 |
| 2 (initial crack in OM) | 18,364 | 18,525 |
| Material Model | E [GPa] | ν [-] | Rp02 [MPa] | ||
|---|---|---|---|---|---|
| Base material | 210.0 | 0.3 | 530 | 0.08 | 0.5 |
| Over matched | 210.0 | 0.3 | 605 | 0.08 | 0.3 |
| Under matched | 210.0 | 0.3 | 430 | 0.08 | 0.3 |
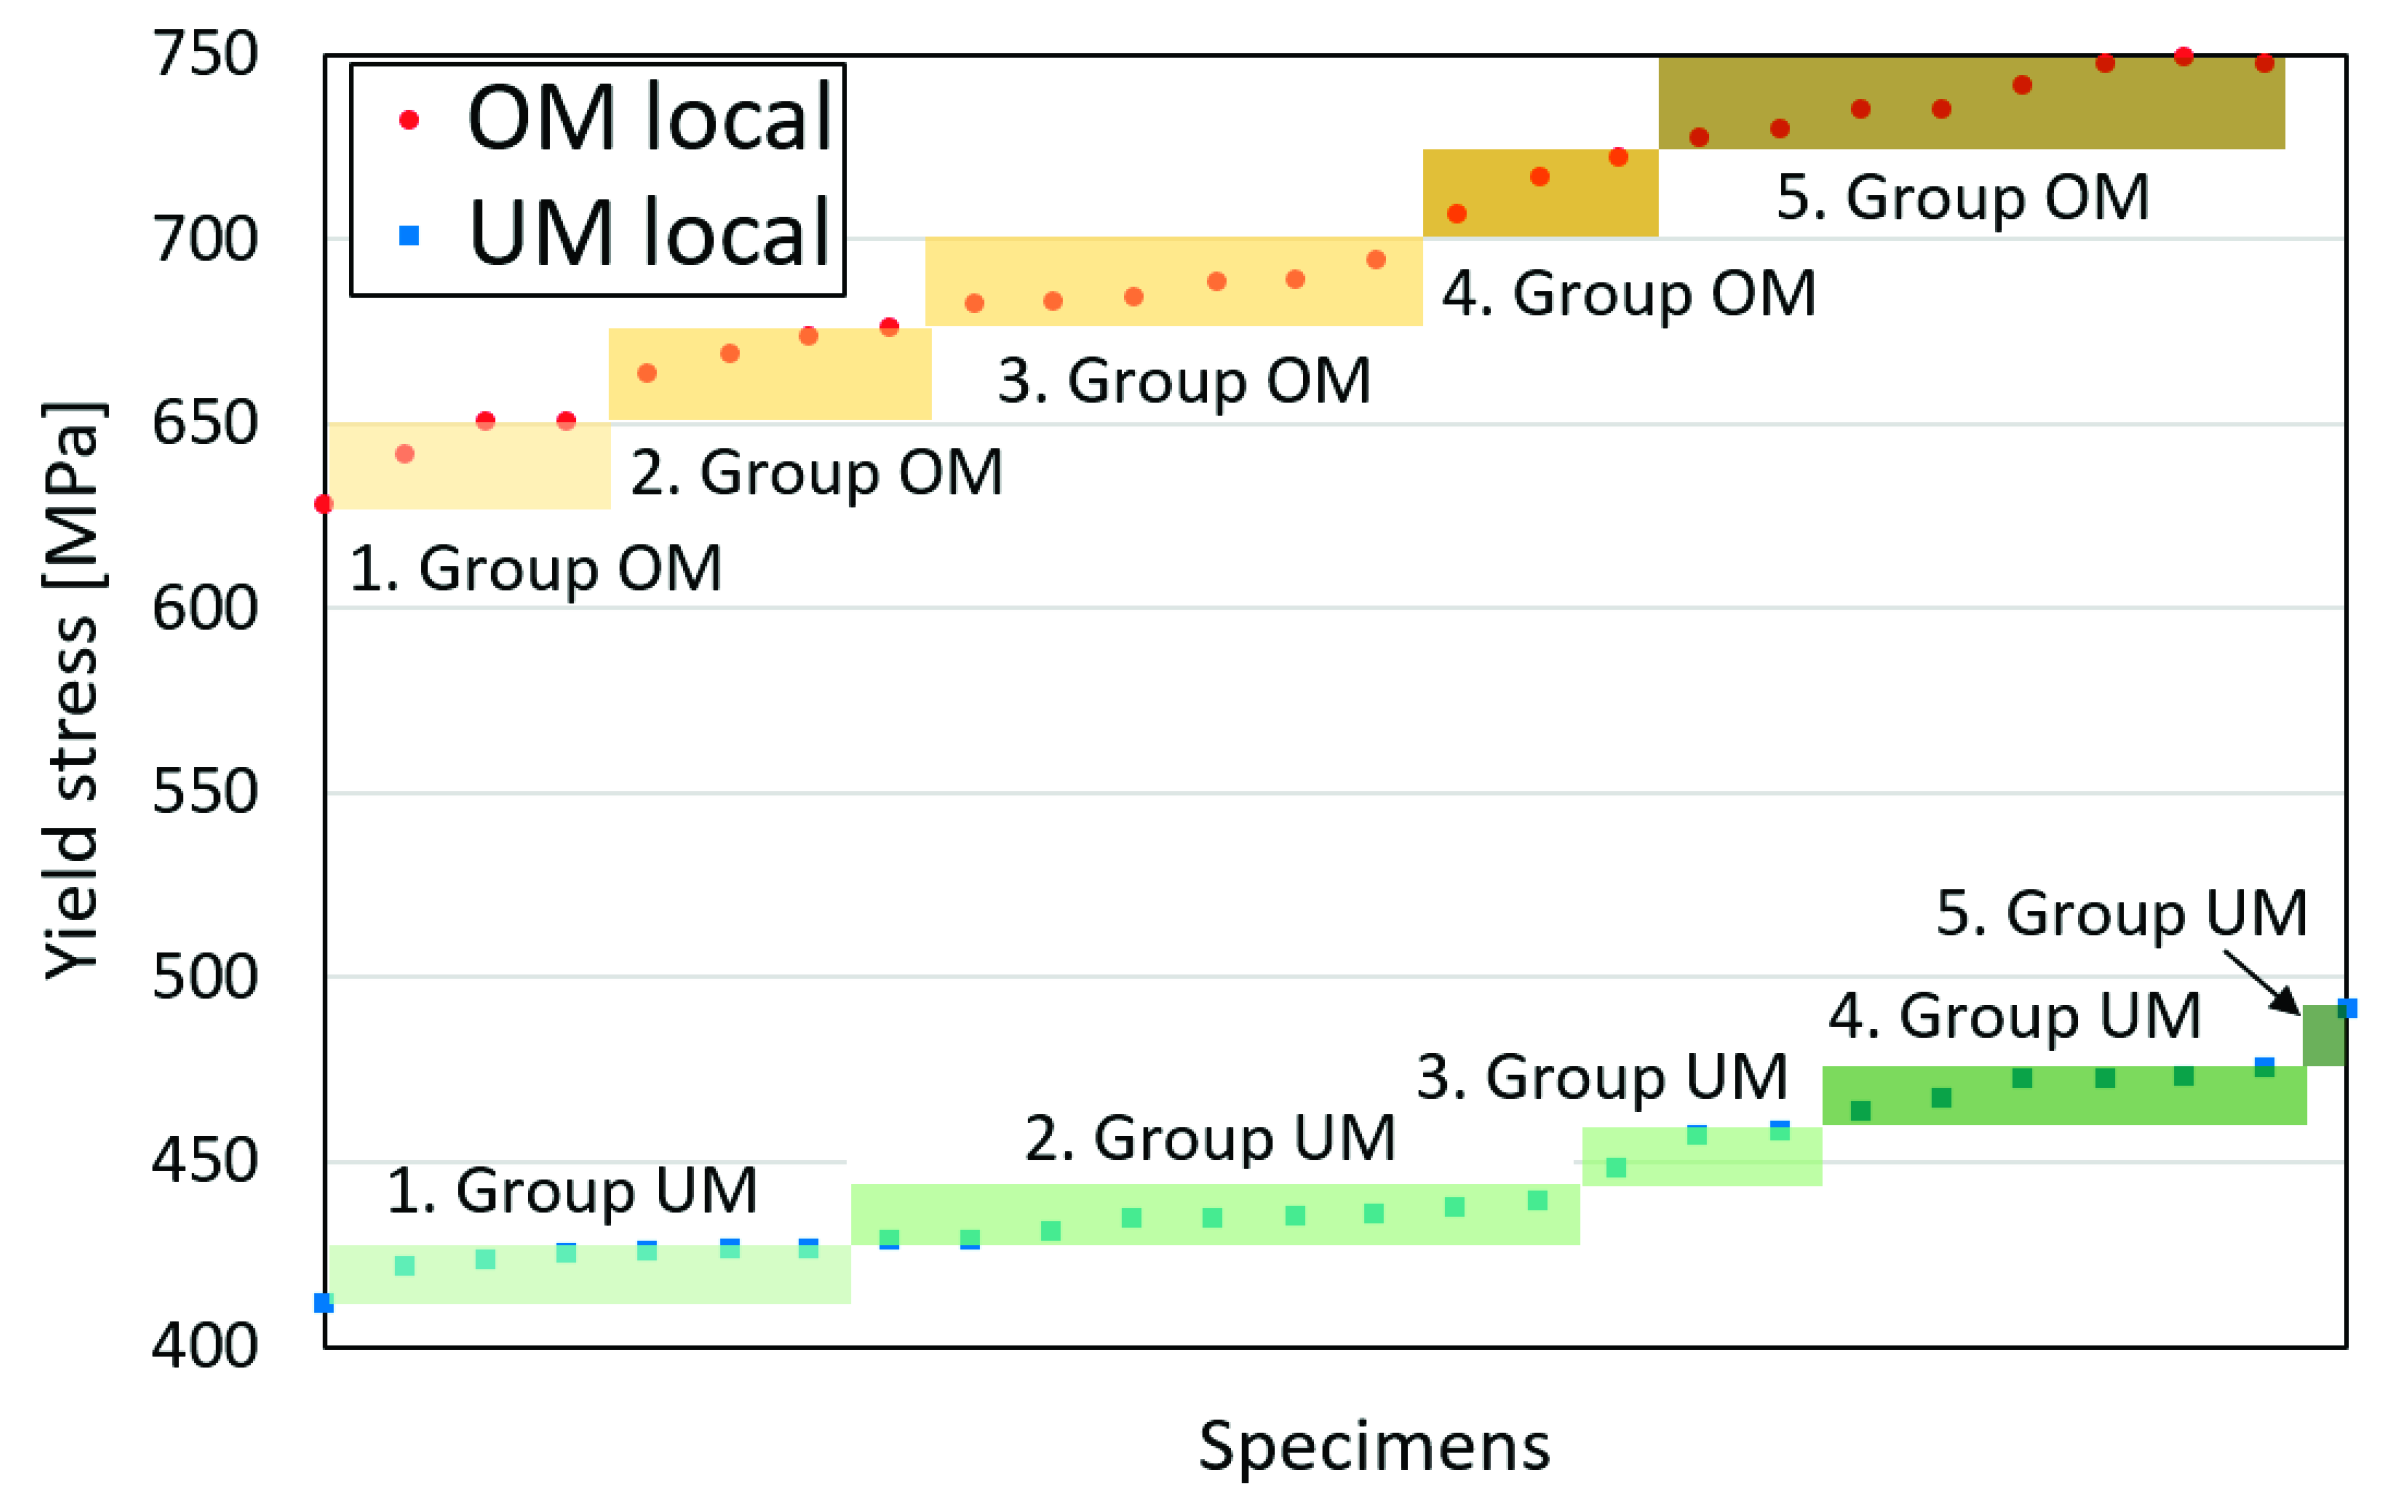
| Group | Rp02 [MPa] | Rm [MPa] | Share | |
|---|---|---|---|---|
| OM weld materials region | 1 | 640.4 | 730.1 | 16% |
| 2 | 664.6 | 745.2 | 16% | |
| 3 | 688.8 | 760.3 | 24% | |
| 4 | 712.9 | 775.4 | 12% | |
| 5 | 737.1 | 790.5 | 32% | |
| UM weld materials region | 1 | 419.5 | 520.2 | 27% |
| 2 | 435.4 | 533.7 | 35% | |
| 3 | 451.4 | 547.3 | 12% | |
| 4 | 467.3 | 560.9 | 23% | |
| 5 | 483.2 | 574.4 | 4% | |
| HAZ at OM side | HAZ1 | 578 | 707 | |
| HAZ2 | 471 | 614 | ||
| HAZ3 | 539 | 634 | ||
| HAZ at UM side | HAZ1 | 573 | 647 | |
| HAZ2 | 504 | 599 | ||
| HAZ3 | 545 | 640 |
Publisher’s Note: MDPI stays neutral with regard to jurisdictional claims in published maps and institutional affiliations. |
© 2021 by the authors. Licensee MDPI, Basel, Switzerland. This article is an open access article distributed under the terms and conditions of the Creative Commons Attribution (CC BY) license (https://creativecommons.org/licenses/by/4.0/).
Share and Cite
Starčevič, L.; Gubeljak, N.; Predan, J. The Numerical Modelling Approach with a Random Distribution of Mechanical Properties for a Mismatched Weld. Materials 2021, 14, 5896. https://doi.org/10.3390/ma14195896
Starčevič L, Gubeljak N, Predan J. The Numerical Modelling Approach with a Random Distribution of Mechanical Properties for a Mismatched Weld. Materials. 2021; 14(19):5896. https://doi.org/10.3390/ma14195896
Chicago/Turabian StyleStarčevič, Luka, Nenad Gubeljak, and Jožef Predan. 2021. "The Numerical Modelling Approach with a Random Distribution of Mechanical Properties for a Mismatched Weld" Materials 14, no. 19: 5896. https://doi.org/10.3390/ma14195896
APA StyleStarčevič, L., Gubeljak, N., & Predan, J. (2021). The Numerical Modelling Approach with a Random Distribution of Mechanical Properties for a Mismatched Weld. Materials, 14(19), 5896. https://doi.org/10.3390/ma14195896