Article

Phosphorus Substitution Preference in Ye’elimite: Experiments and Density Functional Theory Simulations

1
College of Transportation Engineering, Dalian Maritime University, Dalian 116026, China
2
Faculty of Infrastructure Engineering, Dalian University of Technology, Dalian 116024, China
*
Author to whom correspondence should be addressed.
Materials 2021, 14(19), 5874; https://doi.org/10.3390/ma14195874
Submission received: 8 September 2021 / Revised: 26 September 2021 / Accepted: 1 October 2021 / Published: 7 October 2021
(This article belongs to the Section Materials Physics)

Abstract

:
Density functional theory (DFT) simulation has been recently introduced to understand the doping behavior of impurities in clinker phases. P-doped ye’elimite, a typical doping clinker phase, tends to form when phosphogypsum is used to manufacture calcium sulfoaluminate cement (CSA) clinkers. However, the substitution mechanism of P has not been uncovered yet. In this study, the influence of different doping amounts of P on the crystalline and electronic structure of ye’elimite was investigated using backscattered scanning electron microscopy–energy X-ray dispersive spectroscopy, X-ray diffraction tests, Rietveld quantitative phase analysis, and DFT simulations. Furthermore, the substitution preference of P in ye’elimite was revealed. Our results showed that increasing the doping amount of P increased the impurity contents in CSA clinkers, transforming the ye’elimite crystal system from the orthorhombic to the cubic system and decreasing the interplanar spacing of ye’elimite. Based on the calculation results of the defect formation energies, additional energies were required for P atoms to substitute Ca/Al atoms compared with those required for P atoms to substitute S atoms in both orthorhombic and cubic systems of ye’elimite. Combined calculation results of the bond length–bond order and partial density of states showed that the doped P atoms preferably substituted S atoms; the second possible substituted atoms were Al atoms, while there was only a slight possibility for substitution of Ca atoms. The substitution of P atoms for S atoms can be verified based on the elemental distribution in P-doped ye’elimite and the increasing residual CaSO4 contents. The transition of the crystal system and a decrease in the interplanar spacing for ye’elimite can also prove that the substitution of P atoms for Al atoms occurred substantially.

Graphical Abstract

1. Introduction

Ye’elimite, also known as tetracalcium trialuminate sulfate, is the dominant mineral in calcium sulfoaluminate (CSA) cement and exhibits high tailored dimensional expansion and early strength [1,2,3]. Since the 1970s, CSA cement has been widely used as a rapid repairing material and has recently been promoted for use in numerous domains, including soft soil stabilization and three-dimensional printing [4,5,6]. Moreover, CSA cement has been considered a promising alternative binder owing to its lower CO2 emissions and energy consumption compared with Portland cement, in which ye’elimite plays an essential role [7,8,9]. The forming conditions of ye’elimite determine the sintering temperatures and prolong time of CSA clinkers, while the main hydration products of CSA cement are produced by reactions between ye’elimite and gypsum [10,11].
The chemical formula of stoichiometric ye’elimite is Ca4Al6SO16 which has been identified as an orthorhombic system with a Pcc2 space group at room temperature using diffraction tests and Rietveld method [12]. However, since ye’elimite is a sodalite with a general composition of M4(T6O12)X, certain types of dopants can enter its lattice during the practical manufacturing process of CSA clinkers, forming solid solutions of ye’elimite [13,14]. The solid solutions of ye’elimite would form easily when solid waste was used as raw materials for manufacturing CSA clinkers [15]. Cuesta et al. investigated the crystalline properties and hydration process of a typical solid solution of ye’elimite with the chemical formula of Ca3.8Na0.2Al5.6Fe0.2Si0.2SO16, which is a cubic system with an I43m space group at room temperature [16,17]. Chang and Zhao et al. investigated the formation kinetics, crystalline transition, and hydration properties of a series of solid solutions of ye’elimite with chemical formulas of Ca4−x(Sr/Ba)xAl6SO16 (x represents the doping amount) to use strontic/baric slags as raw materials for synthesizing CSA clinkers [18,19,20]. Bullerjahn et al. found that compared with stoichiometric ye’elimite, the formation of Ca4Al6−xFexSO16 was accelerated by the fluxing and mineralizing effect of iron ions. However, the thermal stability of Ca4Al6−xFexSO16 was reduced [13].
On the other hand, it can be noticed that density functional theory (DFT) simulations have been recently introduced to understand the doping behavior of impurities in clinker phases [21,22]. Meanwhile, the structural stability and hydration mechanism of clinker phases can be also revealed through DFT [23,24]. As for CSA clinker phases, substitution preference of impurities, including Cu, Pb, and Ba in ye’elimite, belite, and ferrite was investigated by comparing formation energies [25,26,27]. Generally, the results of DFT simulations can adequately accord with experimental phenomena, which can also explain the mechanism of phase transitions and hydration for clinker phases based on the first principles [21,22,23,24,25,26,27].
Alternatively, some studies have sought solutions for recycle of phosphogypsum which is a type of solid waste discharged at more than 150 million tons per year globally [28,29]. Since the composition of phosphogypsum is similar to that of natural gypsum, its use in synthesizing CSA clinkers has been considered a viable option [30]. Compared with natural gypsum, phosphogypsum contains slight amounts (around 1.0wt.%) of phosphorous impurities that enter ye’elimite and affect the synthesized CSA clinkers [31,32]. Previous studies have focused on the composition, formation process, hydration characteristics, and performance of CSA clinkers prepared using phosphogypsum [29,31,33]. However, the substitution preference of P in ye’elimite and the doping mechanism have not been investigated. Additionally, it should be noted that the doping behaviors of impurities in ye’elimite with different crystal systems have not been compared yet, which might lead to neglecting potential phase transitions caused by the doping effect.
In this study, the influence of different doping amounts of P on the crystalline and electronic structure of ye’elimite was investigated and the doping mechanism was revealed by combining experiments with DFT simulations. Backscattered scanning electron microscopy–energy X-ray dispersive spectroscopy (BSEM–EDS) was used to determine the elemental distribution in P-doped ye’elimite, while X-ray diffraction tests and Rietveld method were performed for crystalline analysis. The defect formation energy (Ef) of P-doped ye’elimite with different configurations was calculated and compared using DFT simulations. Moreover, intrinsic factors influencing the doping preference were determined using the partial density of states (PDOSs) and bond length–bond order (BL–BO).

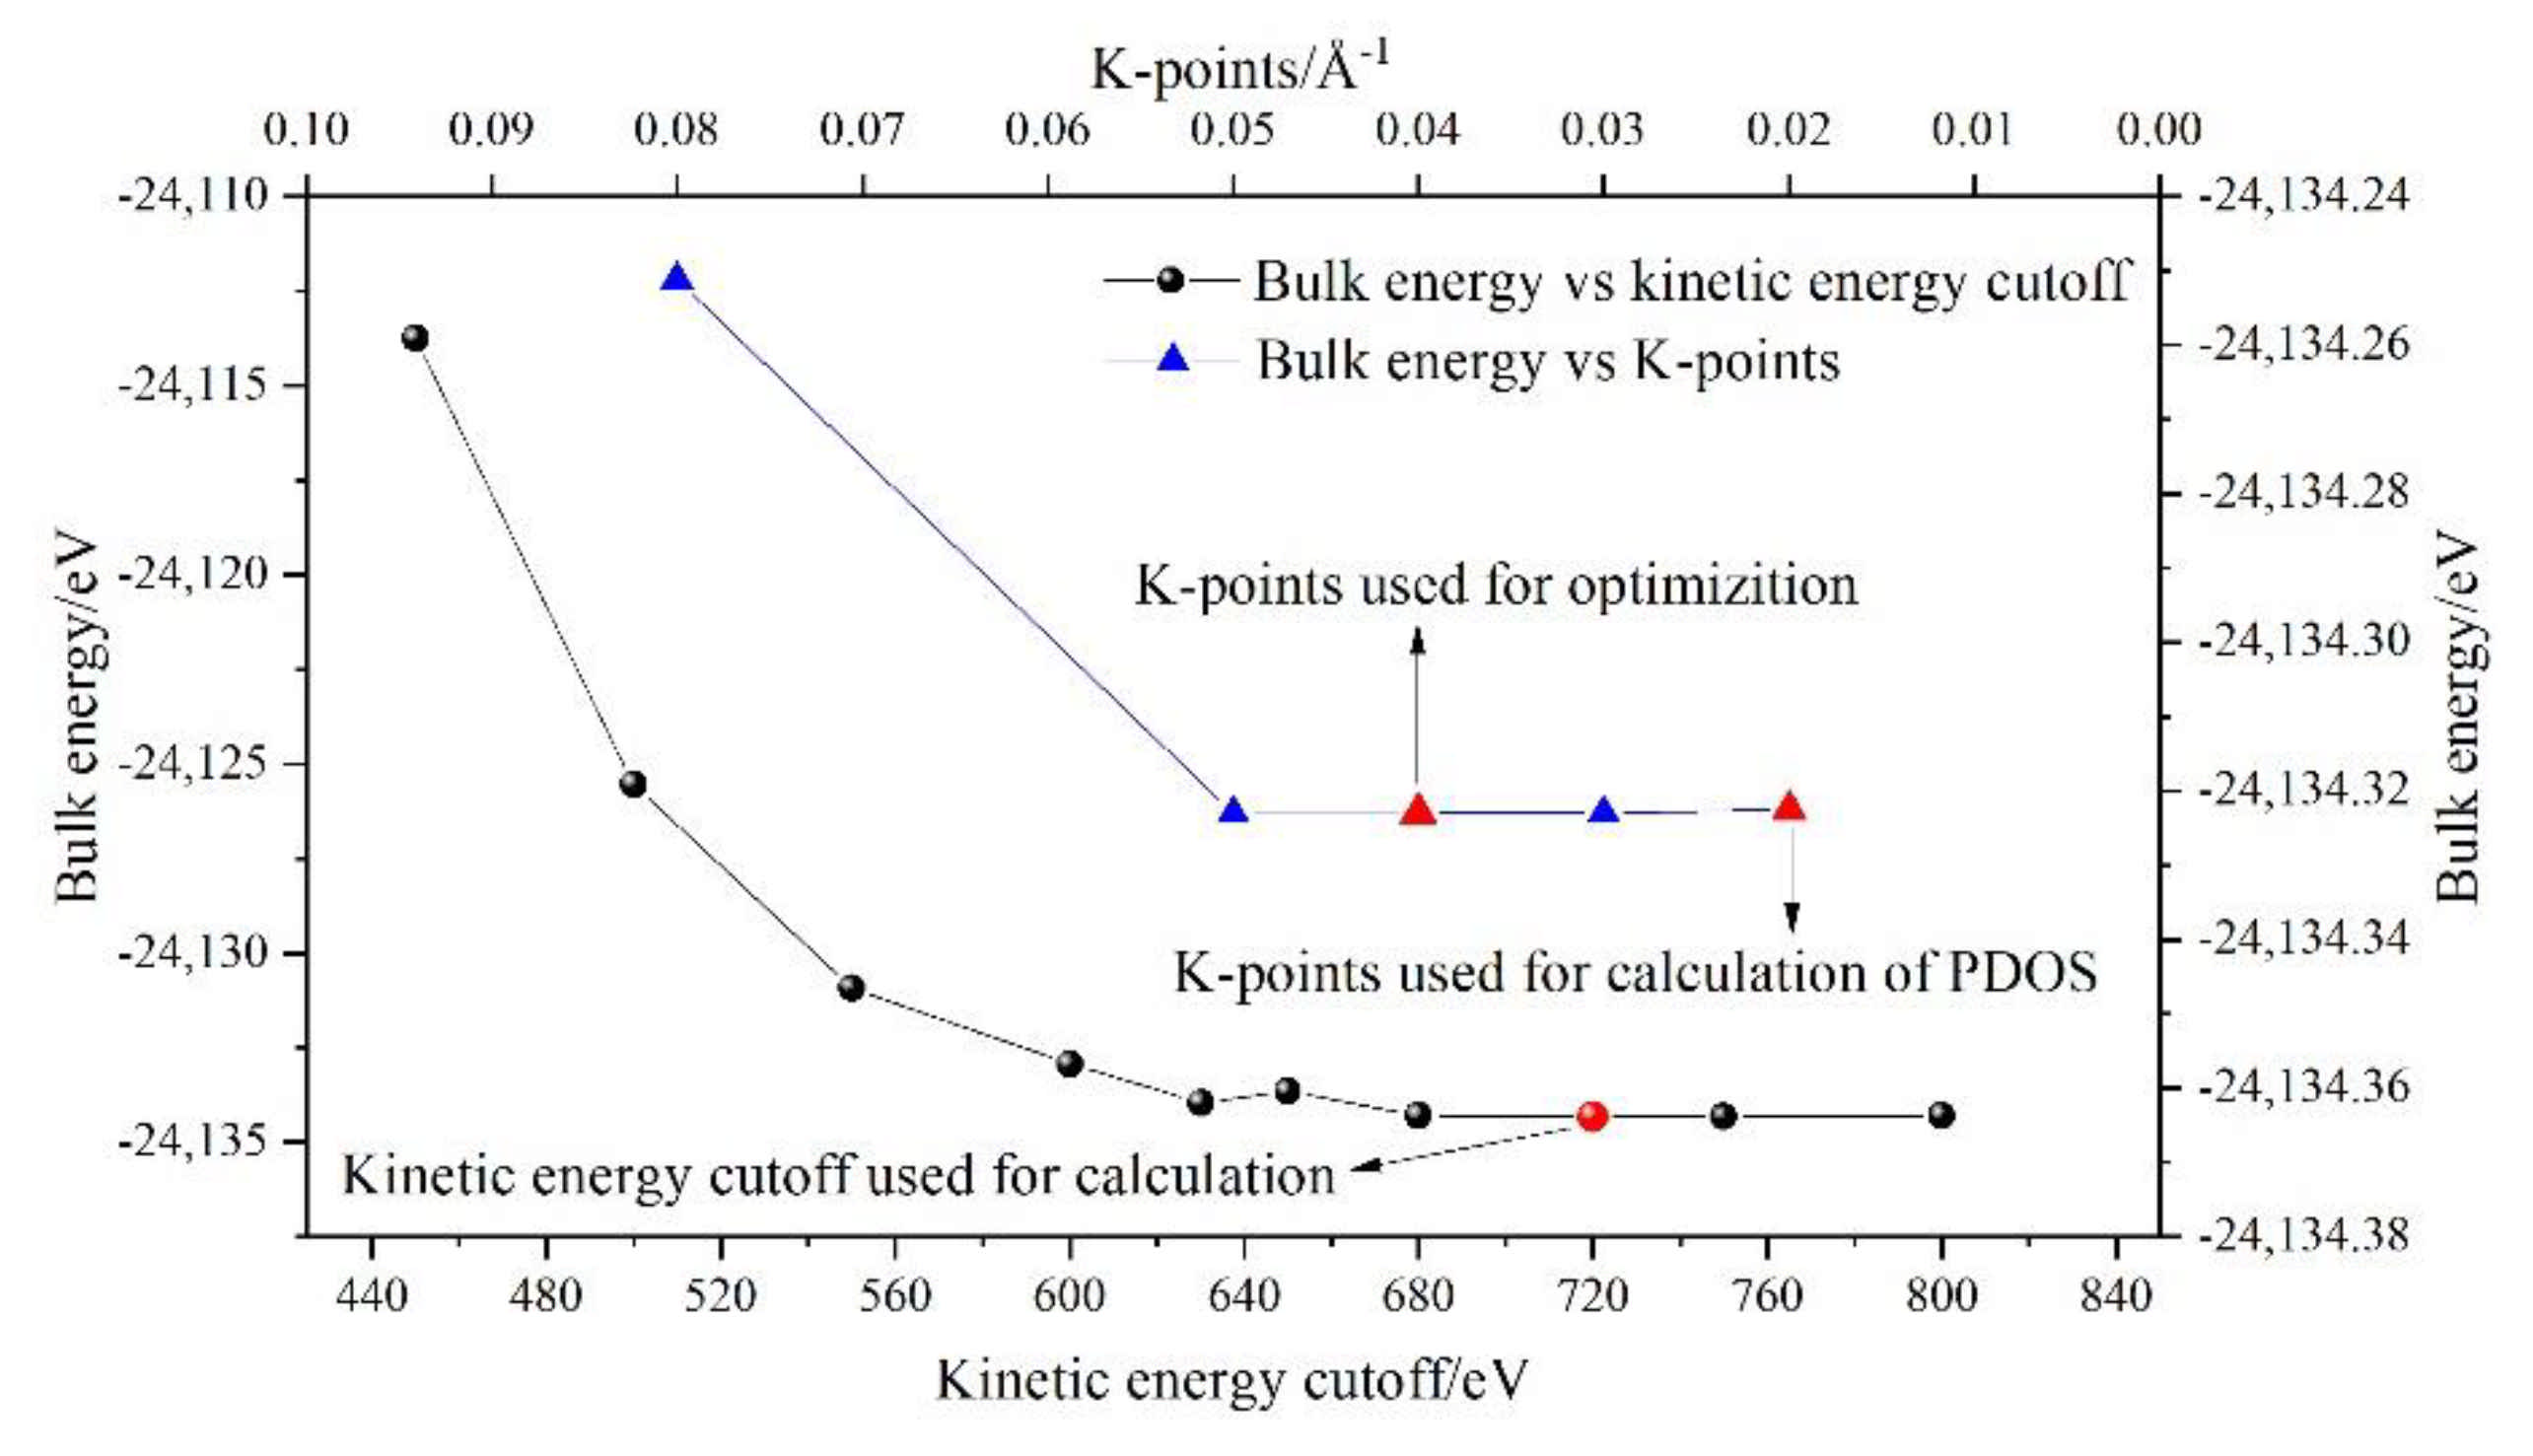
2. Experiments and DFT Simulations

2.1. Experiments

Analytical reagents, namely, CaCO3, CaSO4, Fe2O3, SiO2, Al2O3, Na2CO3, and Ca3(PO4)2, were used as raw materials for synthesizing different types of ye’elimite, including stoichiometric ye’elimite (Ca4Al6SO16, orthorhombic system), a typical solid solution ye’elimite (Ca3.8Na0.2Al5.6Fe0.2Si0.2SO16, cubic system), and P-doped ye’elimite. A planetary ball mill was used to homogenize a mixture of raw materials before it was placed in a high-temperature furnace in the form of compressed cylindroid samples (Φ5.0 cm × H1.0 cm) for sintering. Table 1 lists the nomenclatures, molar ratios of raw materials, and sintering conditions of different types of ye’elimite.
P-doped ye’elimite clinkers were polished and sprayed with gold for BSEM–EDS analysis. A scanning electron microscope (FEI Quanta 450, FEI, Hillsboro, OR, USA) was used with an acceleration voltage of 20 kV. All synthesized clinkers were ground to pass via 80-μm sieves for XRD tests using an X-ray diffractometer (Bruker D8 advance Davinci design) with Cu Kα1,2 radiation (λ1 = 1.5406 Å and λ2 = 1.5444 Å). Diffraction data were collected at 5°–80° (2θ) in the step-scan mode with an operating power of 1600 W (operating voltage was 40 kV, and current was 40 mA). The step size was 0.02°, and the step duration was set to 0.5 s. To determine the phases in tested clinkers using the crystallography open database (COD) 2013, the Bruker evaluation software was used to analyze the obtained XRD patterns. Thereafter, the Rietveld method was conducted using TOPAS4.2, where the parameters were set according to our previous studies [18,19,20]. Table 2 presents information on all the phases of Rietveld method.

2.2. DFT Simulations

The Cambridge sequential total energy package (CASTEP) [41] was used to optimize the geometry of the model and calculate the total energy (Et), BL–BO distributions and PDOSs of P-doped ye’elimite based on DFT simulations. The generalized functional gradient approximation was combined with the Perdew–Burke–Ernzerhof (PBE) method to calculate the electron exchange correlation [42]. The projection-augmented wave was used for all simulations, and the kinetic energy cutoff of the plane wave base was set to 720 eV [43] (the results of the kinetic energy cutoff test and K-points can be seen in Figure A1). Considering the calculation accuracy, the convergence energy, force, stress and displacement were determined using 10−6 eV/atom, 0.01 eV/Å, 0.02 GPa and 10−4 Å, respectively. The lattice relaxation and PDOS calculations were performed on k-point grids with densities of 0.04 and 0.02 (1/Å), respectively. The detailed grids of the two ye’elimite phases are presented in Table A1.
Since dopants can cause transformation of the crystal system of ye’elimite, both orthorhombic and cubic systems were considered and investigated for comparison in this study. The orthorhombic system of ye’elimite exhibits the Pcc2 space group and contains 64 O, 4 S, 24 Al (according to the symmetry, 12 Al in special positions and labeled Al1, while the remaining 12 Al in general positions and labeled Al2 [44]), and 16 Ca atoms in the unit lattice [12]. In the case of the cubic system of ye’elimite, the space group is I43m and the unit lattice comprises 32 O, 2 S, 12 Al, and 8 Ca atoms [16]. Figure 1 shows the crystalline structures of orthorhombic and cubic systems of ye’elimite, and Table A2 presents the lattice parameters.
Note that the doping mechanism can be classified into two types: interstitial and substitutional. Previous studies have shown that the substitutional type can occur more readily than the interstitial type [45,46,47]. Thus, only P doping substitution has been considered in this study. To ensure an equal number of atoms and the same substitutional ratios are involved in calculations, the cells/supercells with sizes of 1 × 1 × 1 and 2 × 1 × 1 were constructed for the orthorhombic and cubic systems, respectively. It can be noticed that, as all cell/supercell parameters of a, b and c were larger than 9Å (see Table A3), the established cell/supercell totally fulfilled the periodic boundary condition. The crystal structures of pure orthorhombic and cubic ye’elimite used in this paper were obtained through optimizing the crystal structures in Ref. [12] and Ref. [16], respectively. To establish a P-doped model with a cubic system, one P atom was introduced in the crystalline structure of cubic ye’elimite (labeled as P@SS) at the Ca, Al, and S positions (labeled as P@Ca, P@S, and P@Al, respectively). Furthermore, two P atoms were introduced in the crystalline structure of orthorhombic ye’elimite (labeled as P@ST) at the Ca, S, Al1, and Al2 positions (labeled as P@Ca, P@S, P@Al1, and P@Al2, respectively). All established models for P-doped ye’elimite can be seen in Section 3.3 and Section 4.
In this study, the possibility of P doping behavior in ye’elimite was evaluated using Ef, which can be calculated using Equation (1) [48,49,50,51].
E f = 1 n E p E 0 n μ P + n μ 0 + q ( E F + E VBM )
where E0 is the bonding energy of pure ye’elimite, and EP is the bonding energy of P-doped ye’elimite (bonding energy refers to the energy required to separate each pseudopotential atom to infinity, and details of the relationship between bonding energy and total energy can be seen in Table A4). n is the number of P atoms introduced in ye’elimite, and q denotes the net electron number of P-doped ye’elimite (as the raw material used for impurity was Ca3(PO4)2 and the conditions of synthesis were high temperatures, P5+ preferred to be the most stable charge state of P in this paper). EF represents the Fermi energy relative to EVBM, where EVBM is the energy of the maximum valence band of pure ye’elimite. Furthermore, since the doping rates of P in the orthorhombic and cubic systems of ye’elimite were kept constant in all calculations, normalization was not needed in this study. μP represents the chemical potentials of impurities (P atoms), and μ0 represents the chemical potentials of substituted atoms (Ca, Al or S atoms). The terms nμ0-nμP in Equation (1) for different configurations were calculated according to Equations (2)–(4) as below, and details on Gibbs free energies involved in calculations for μP and μ0 are presented in Table A2.
n μ S n μ P = n G SO 3 n 2 G P 2 O 5 n 2 μ O
n μ Ca n μ P = n G C aO n 2 G P 2 O 5 3 n 2 μ O
n μ Al n μ P = n 2 G Al 2 O 3 n 2 G P 2 O 5 n μ O
As for Equations (2)–(4), μO was set as the Gibbs free energy of oxygen in the stable pure bulk single-crystal phase, which can be described by Equation (5).
G O 2 = 2 μ O 2 μ O 0

3. Results

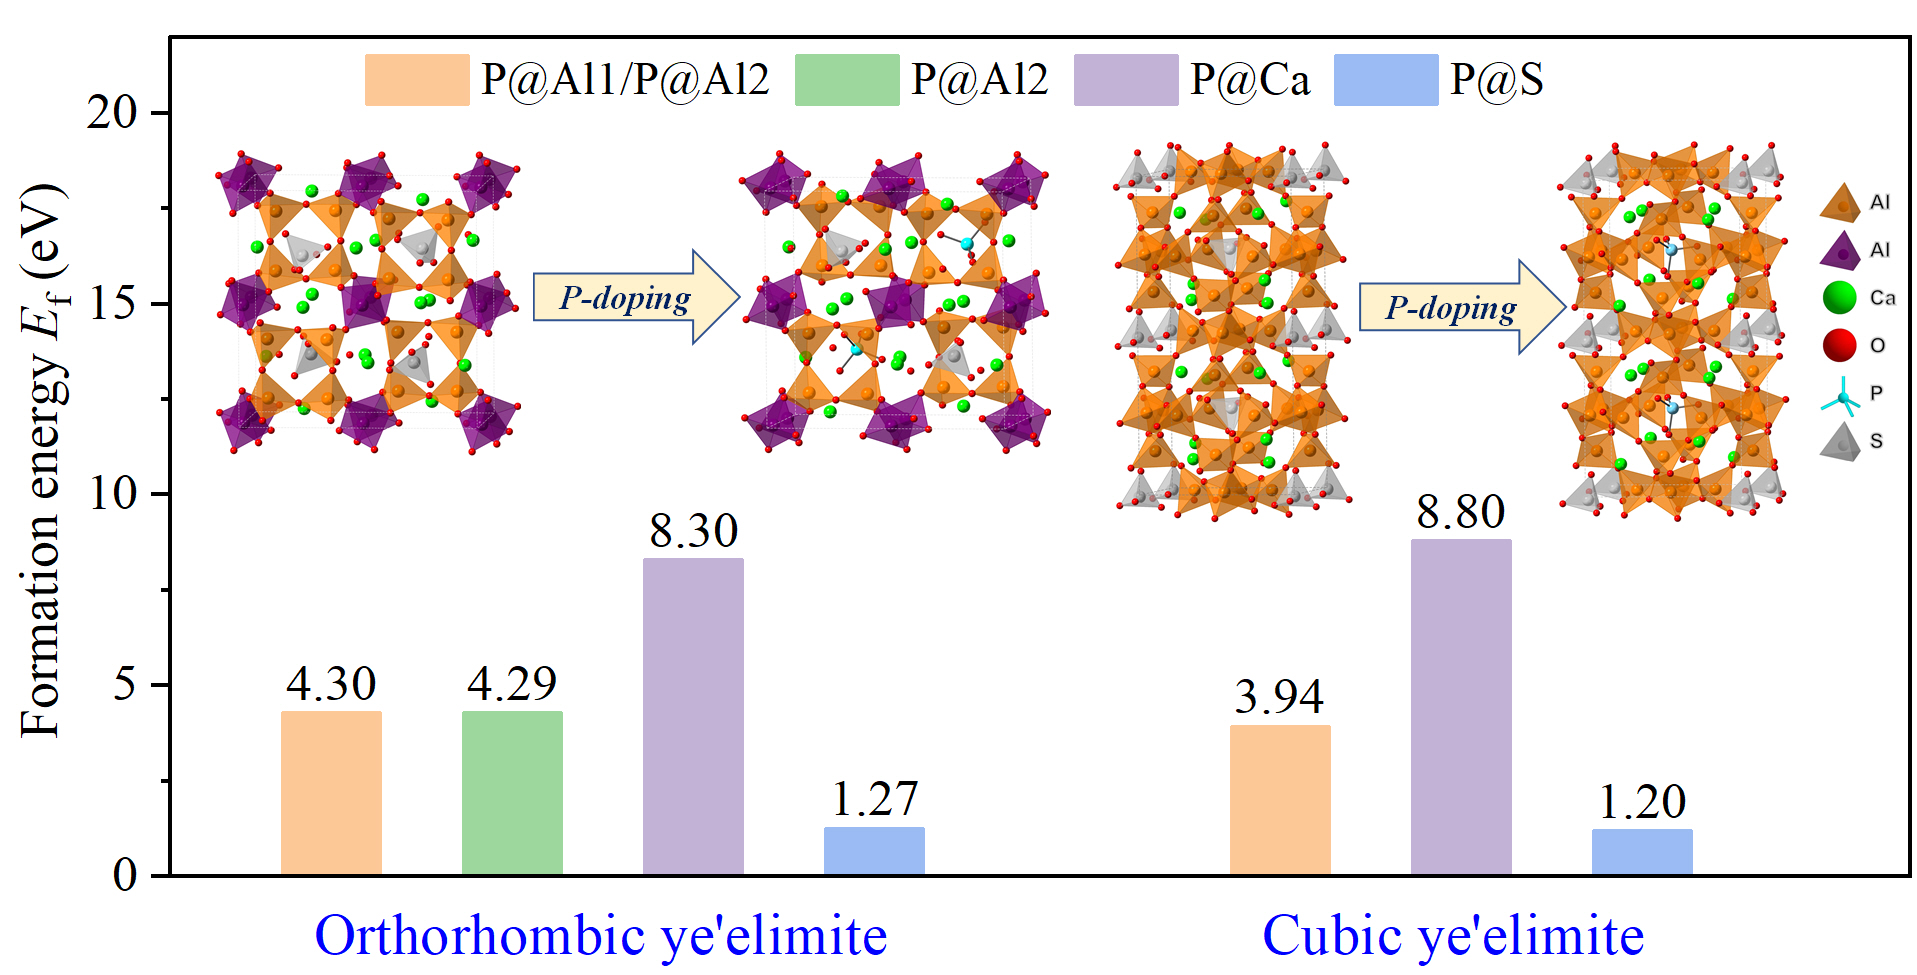
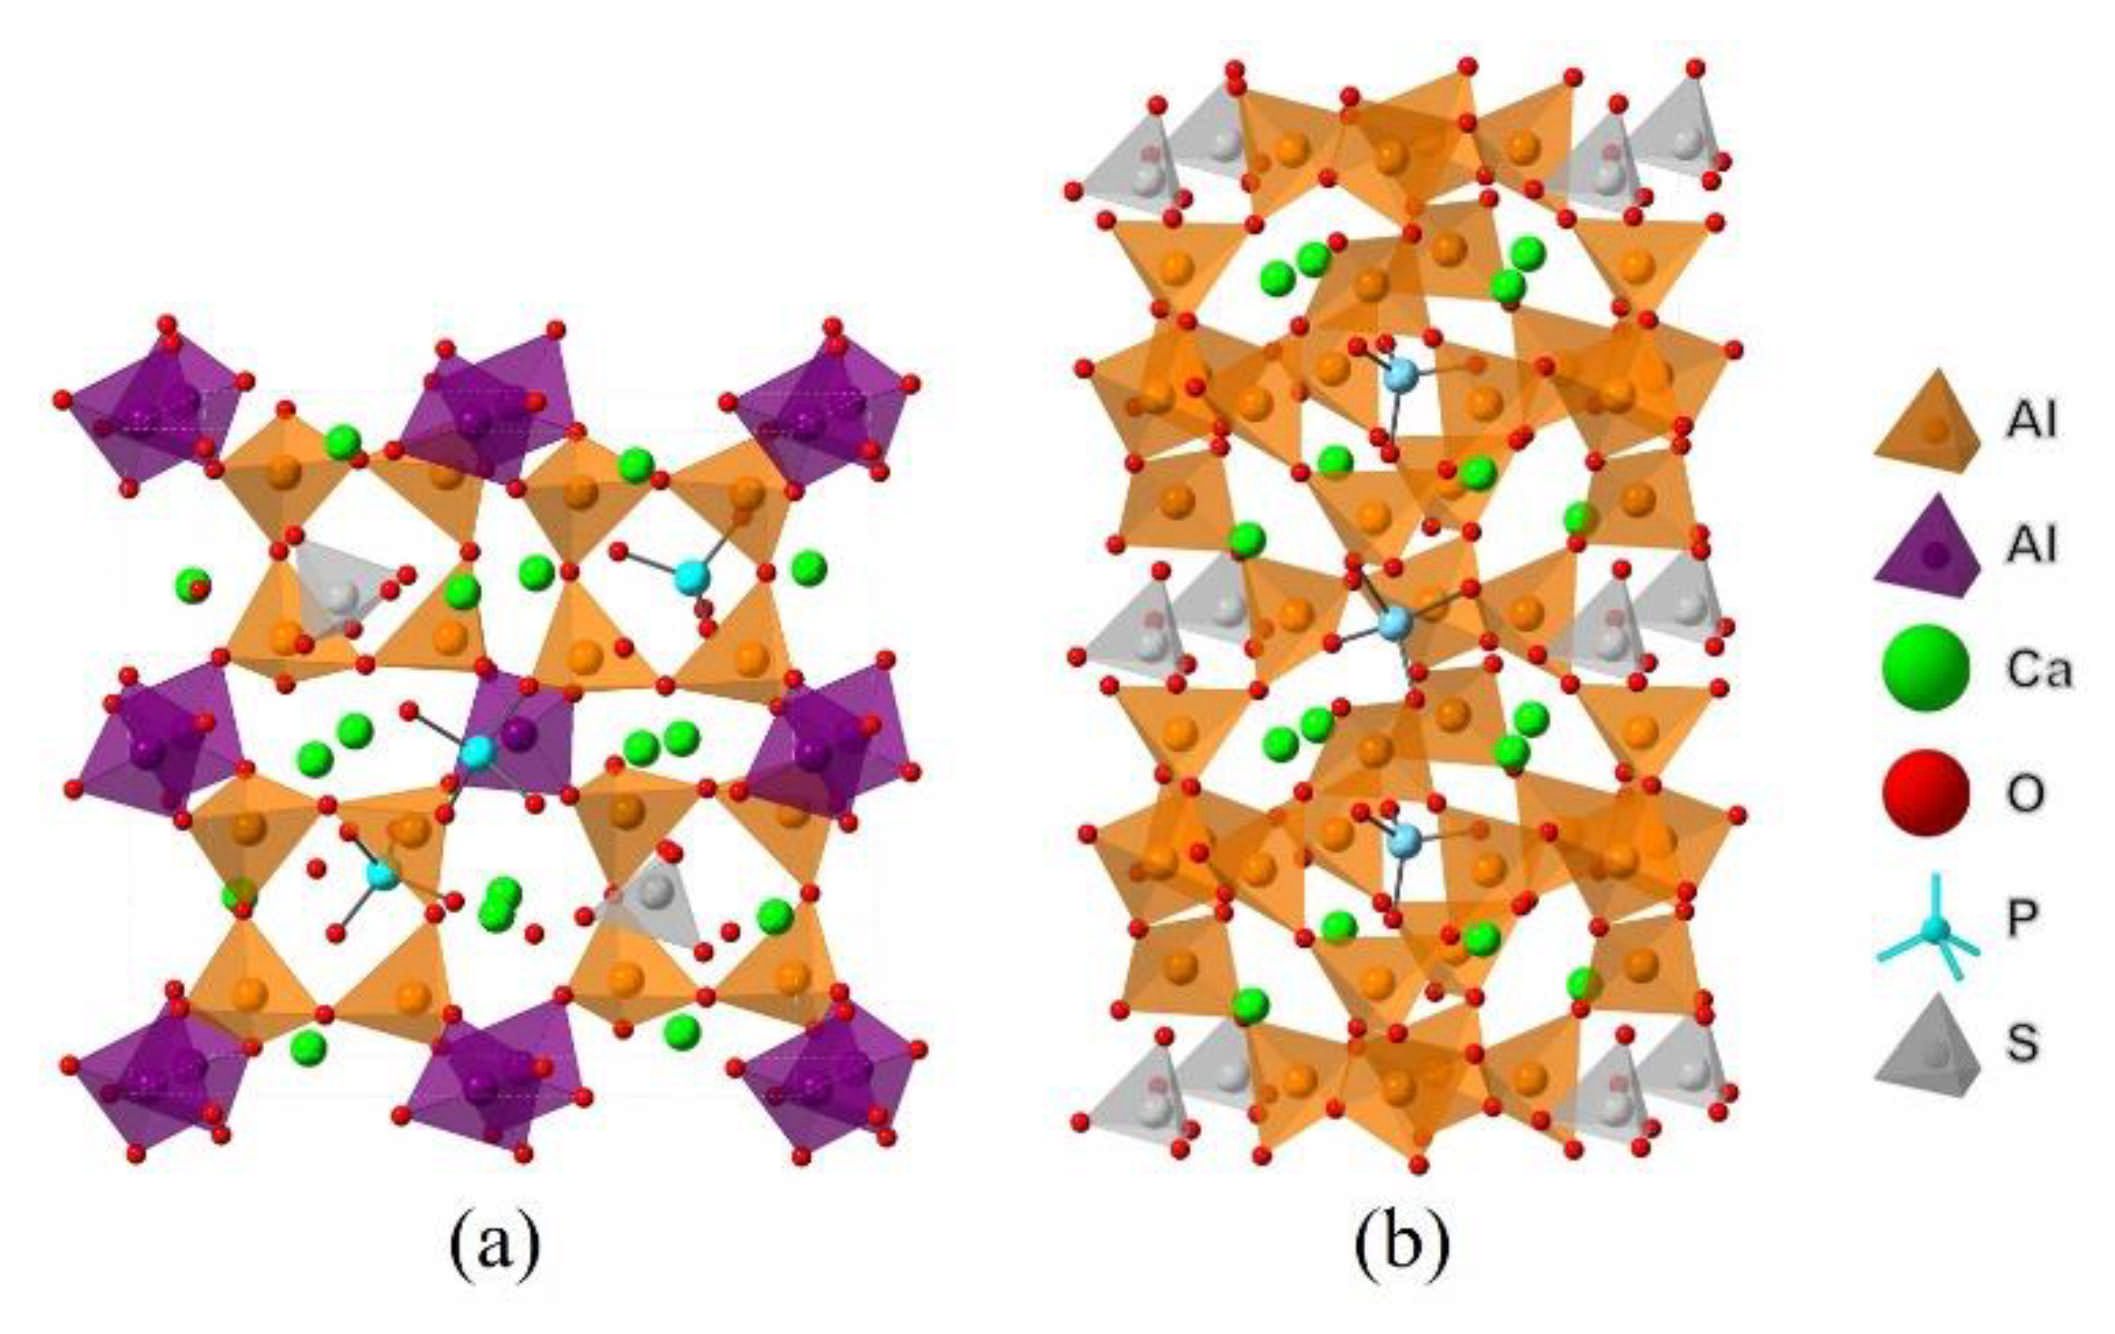
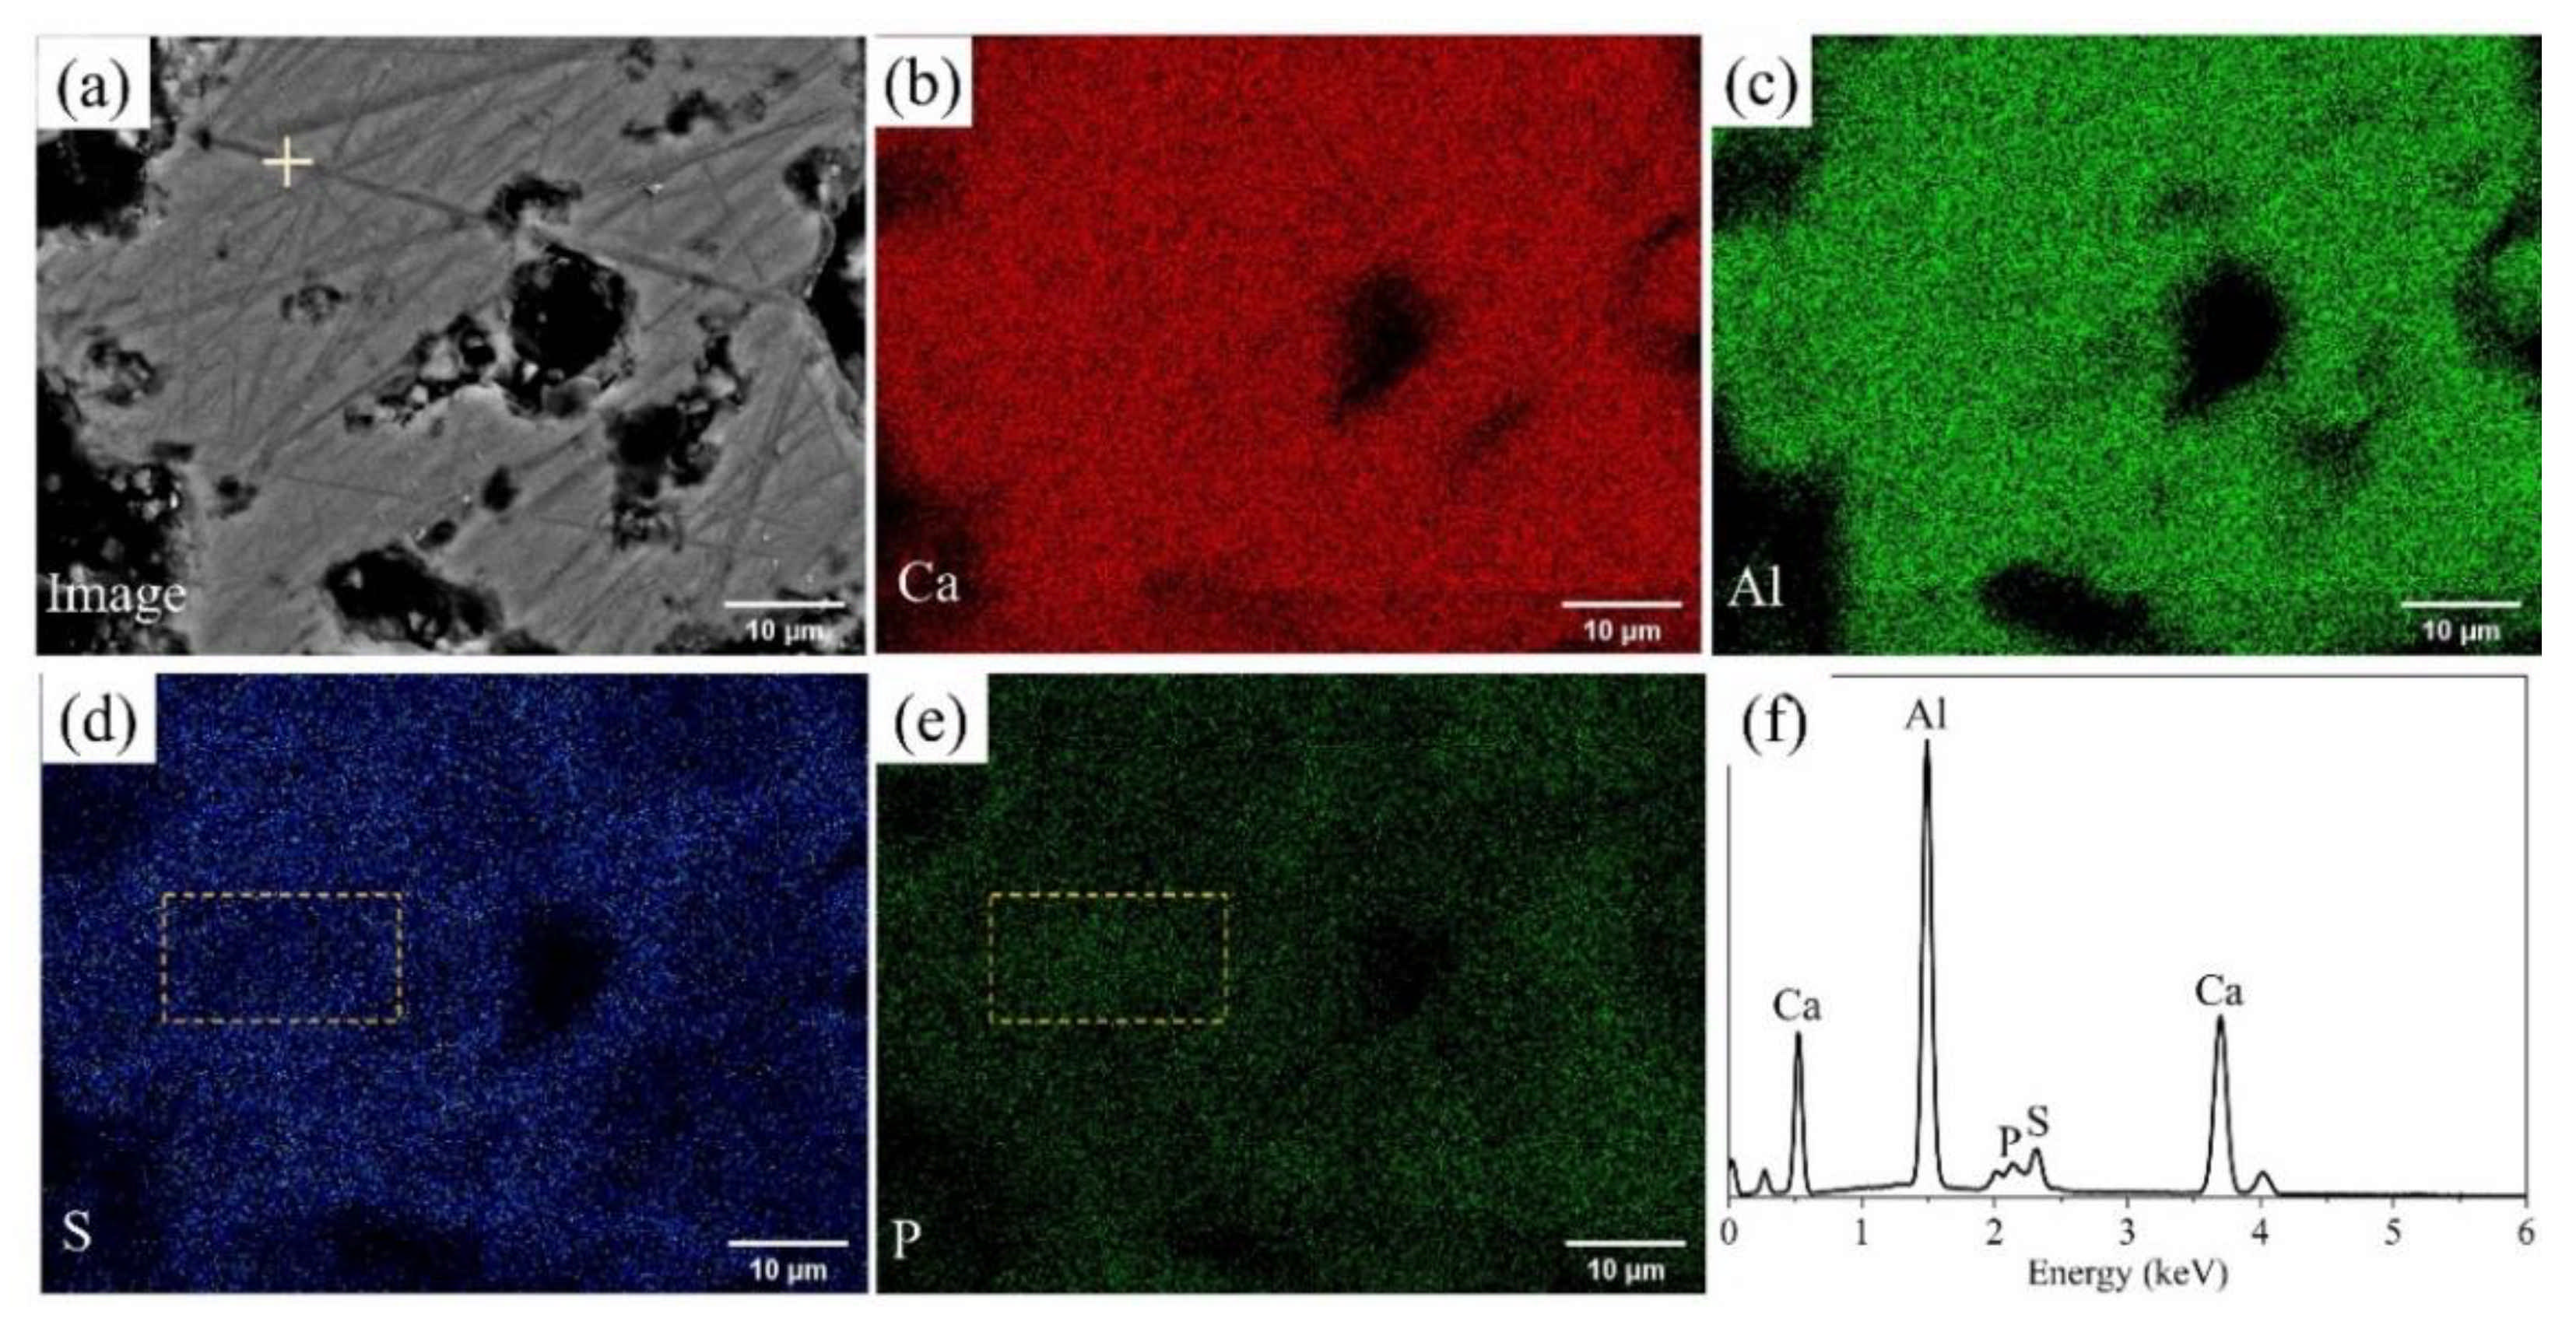
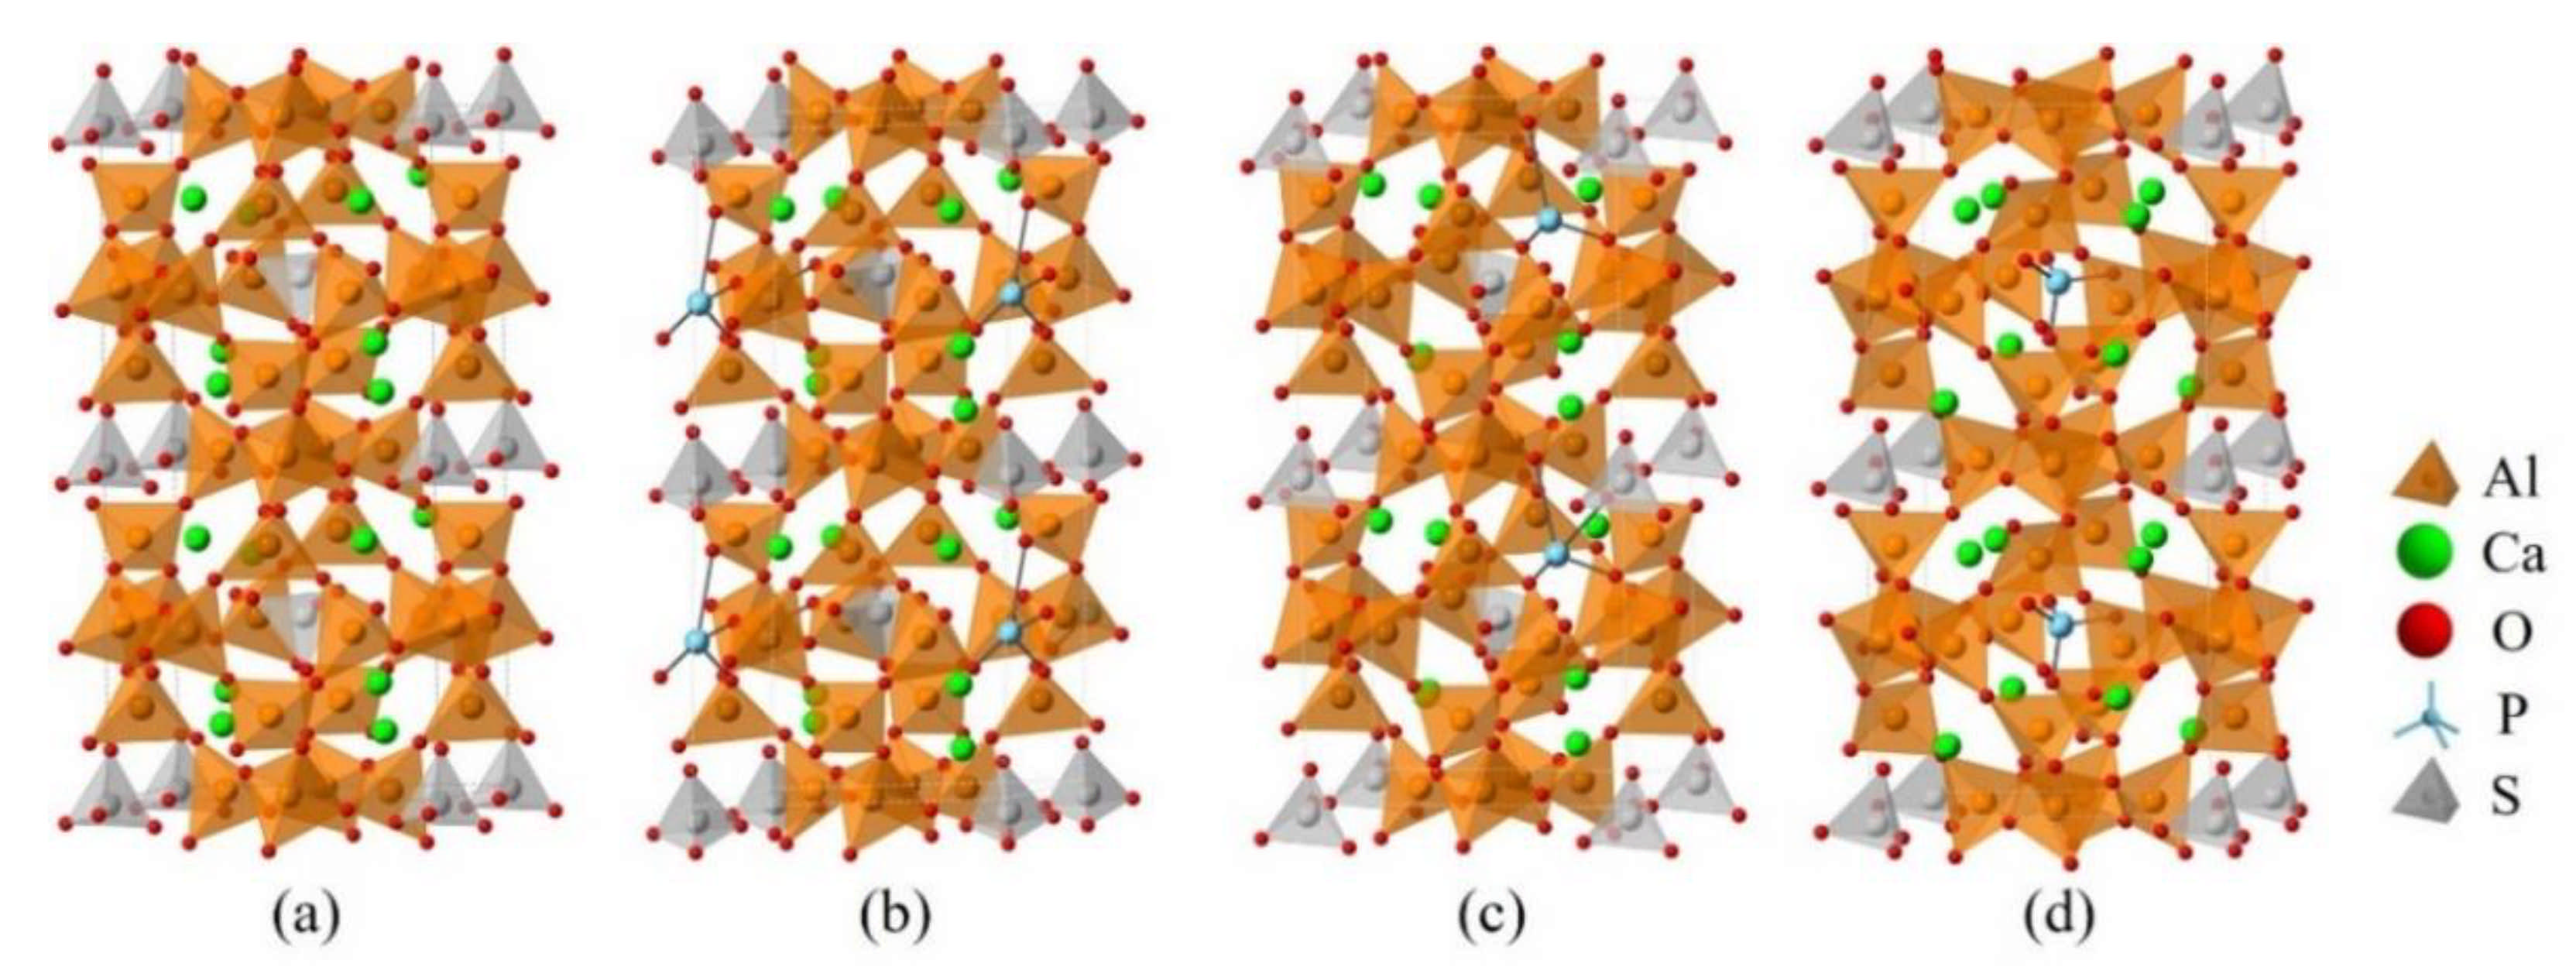
3.1. Elemental Distribution in P-Doped Ye’elimite

BSEM–EDS was performed to determine the elemental distribution in P-doped ye’elimite, and the results of P0.10 are shown in Figure 2. Based on the contrasts observed in Figure 2a and the elemental distribution in Figure 2b–e, P-doped ye’elimite accounted for the vast majority of the observed region. In particular, Ca, Al, S, and P were almost evenly distributed in P-doped ye’elimite, indicating that P entered the lattices of ye’elimite. Further, the densities of S in certain areas were slightly attenuated (such as in the area indicated by the dotted line in Figure 2d), while the densities of P slightly increased in the corresponding areas (such as the area indicated by the dotted line in Figure 2e). This phenomenon suggests that P and S exhibit a potential substitutional relationship in P-doped ye’elimite.

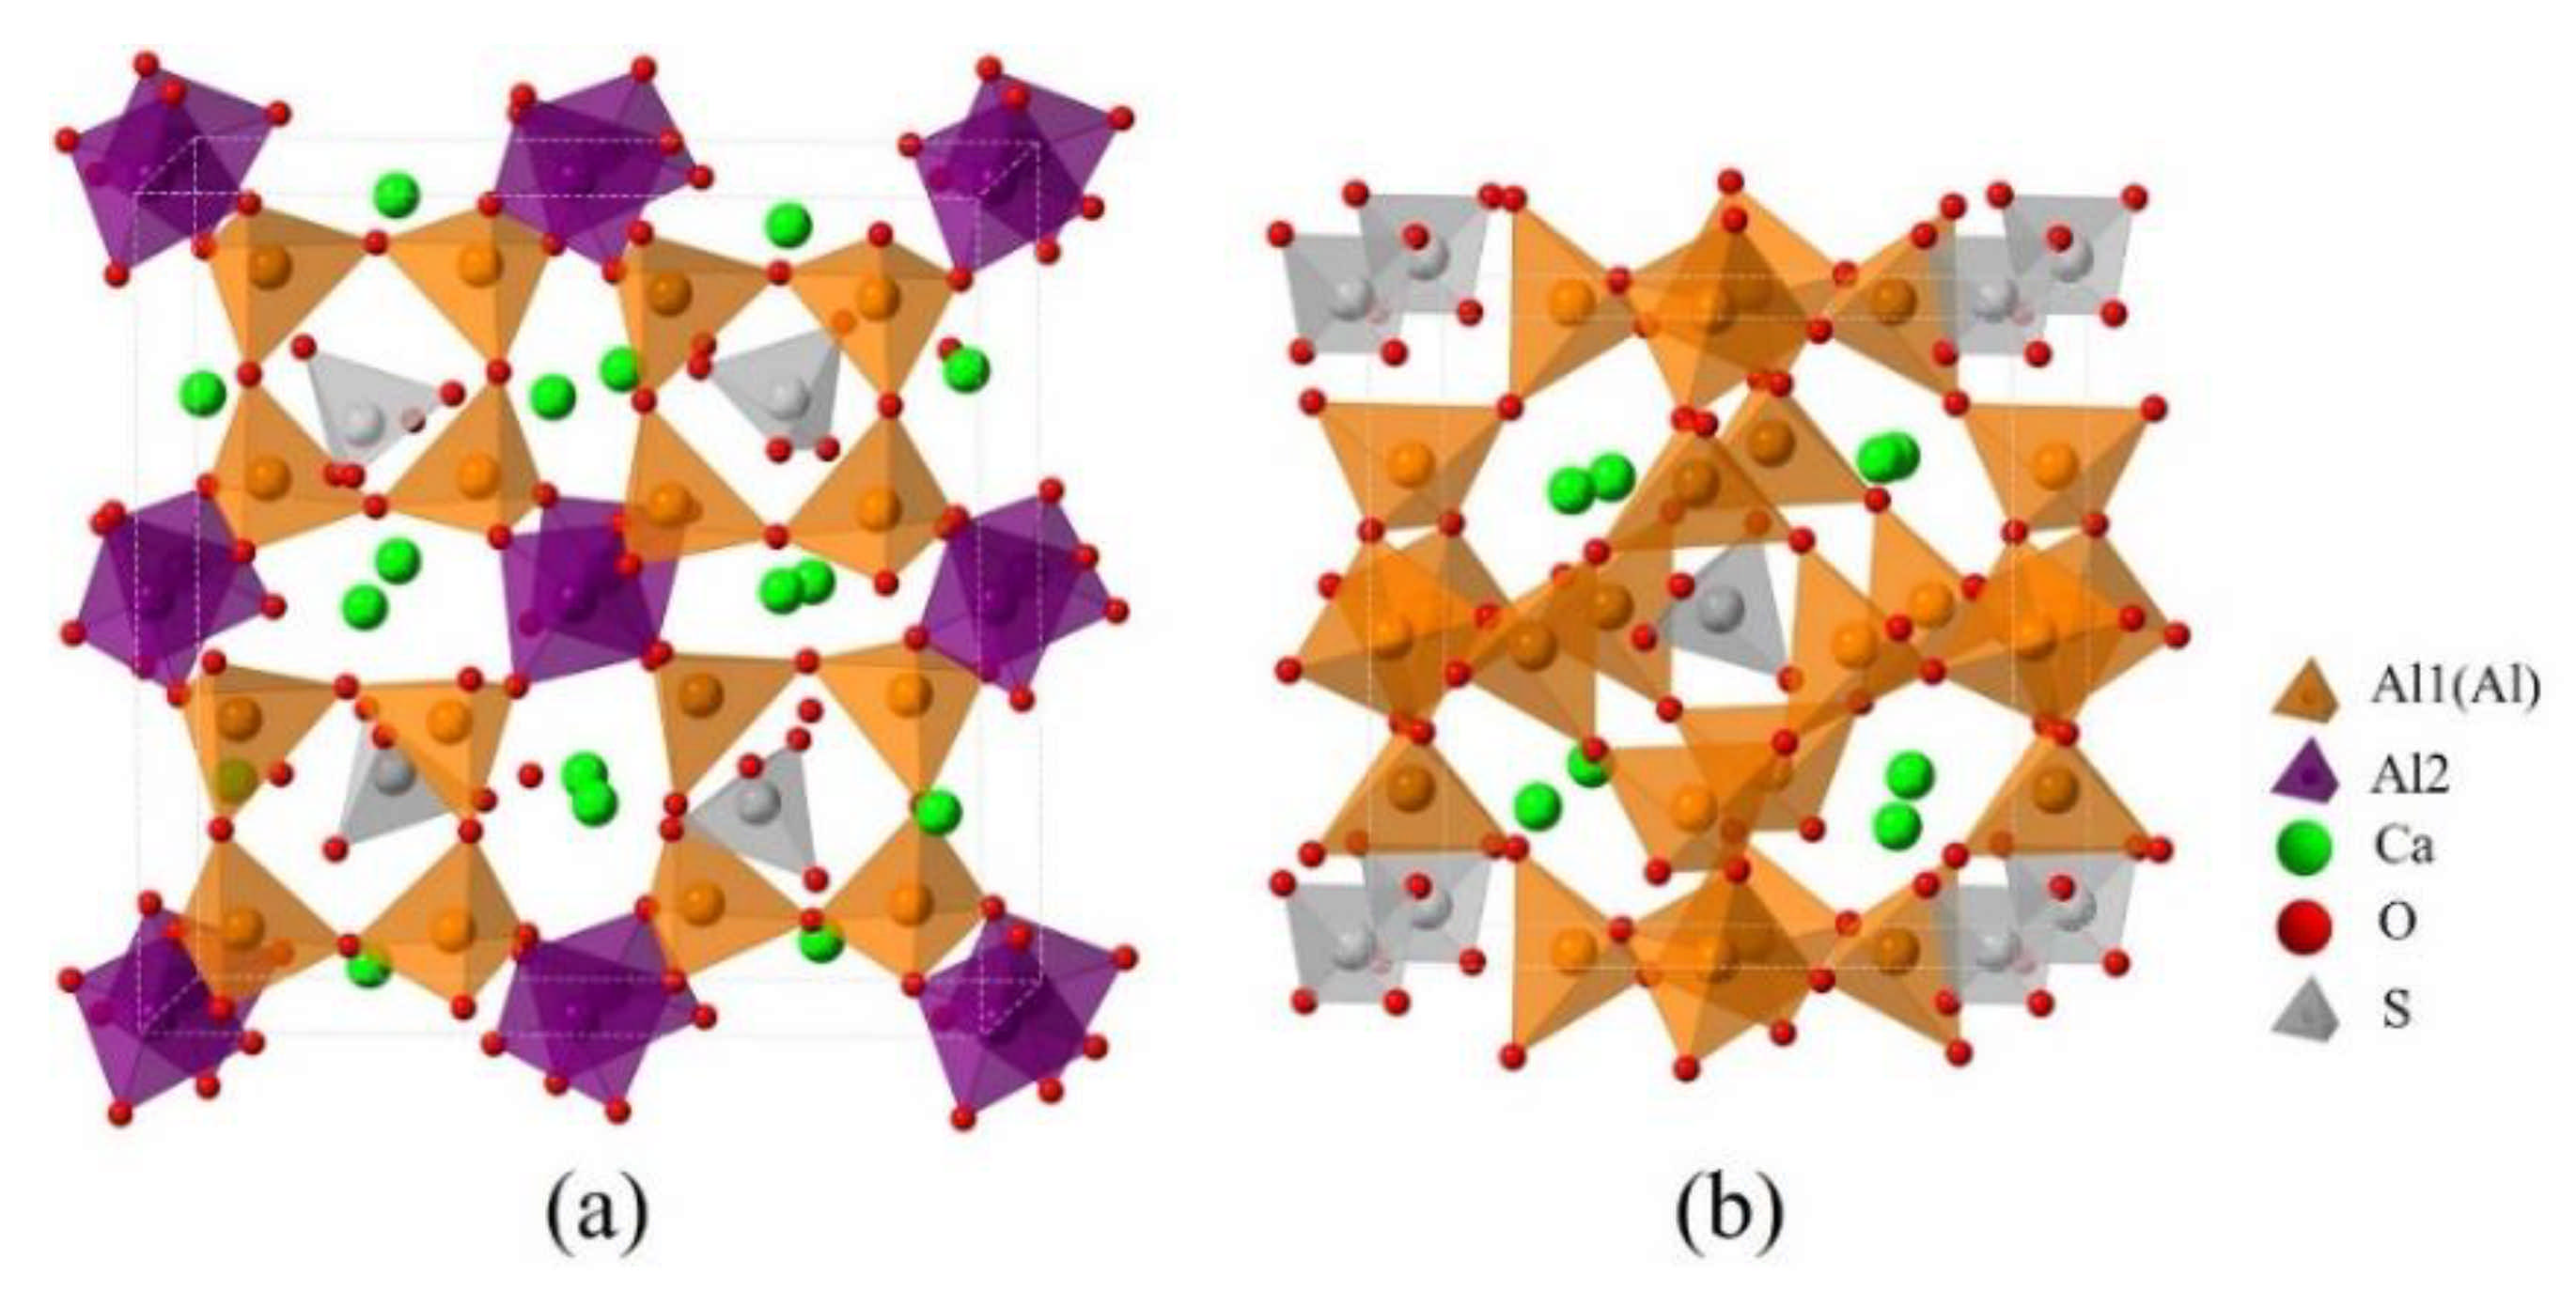
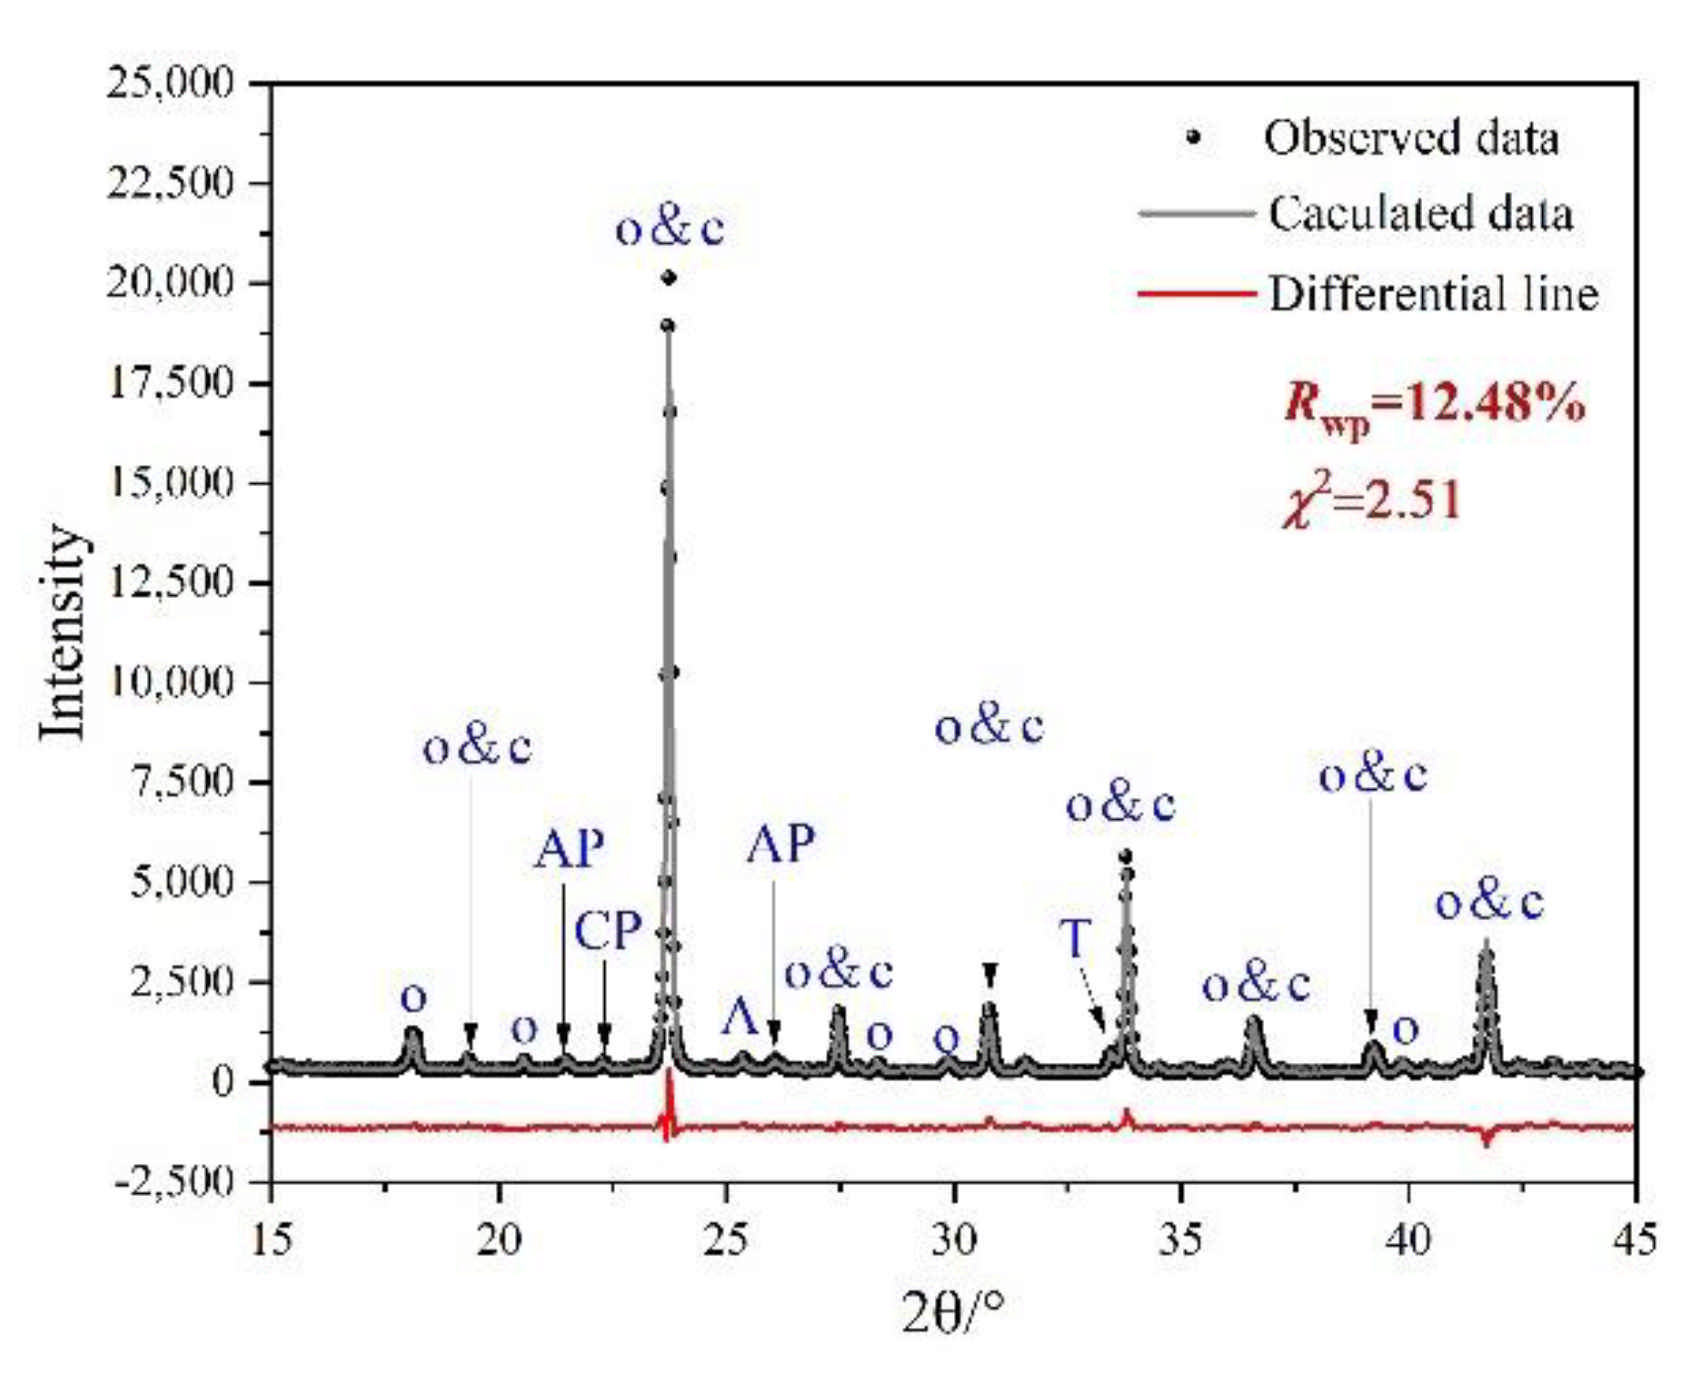
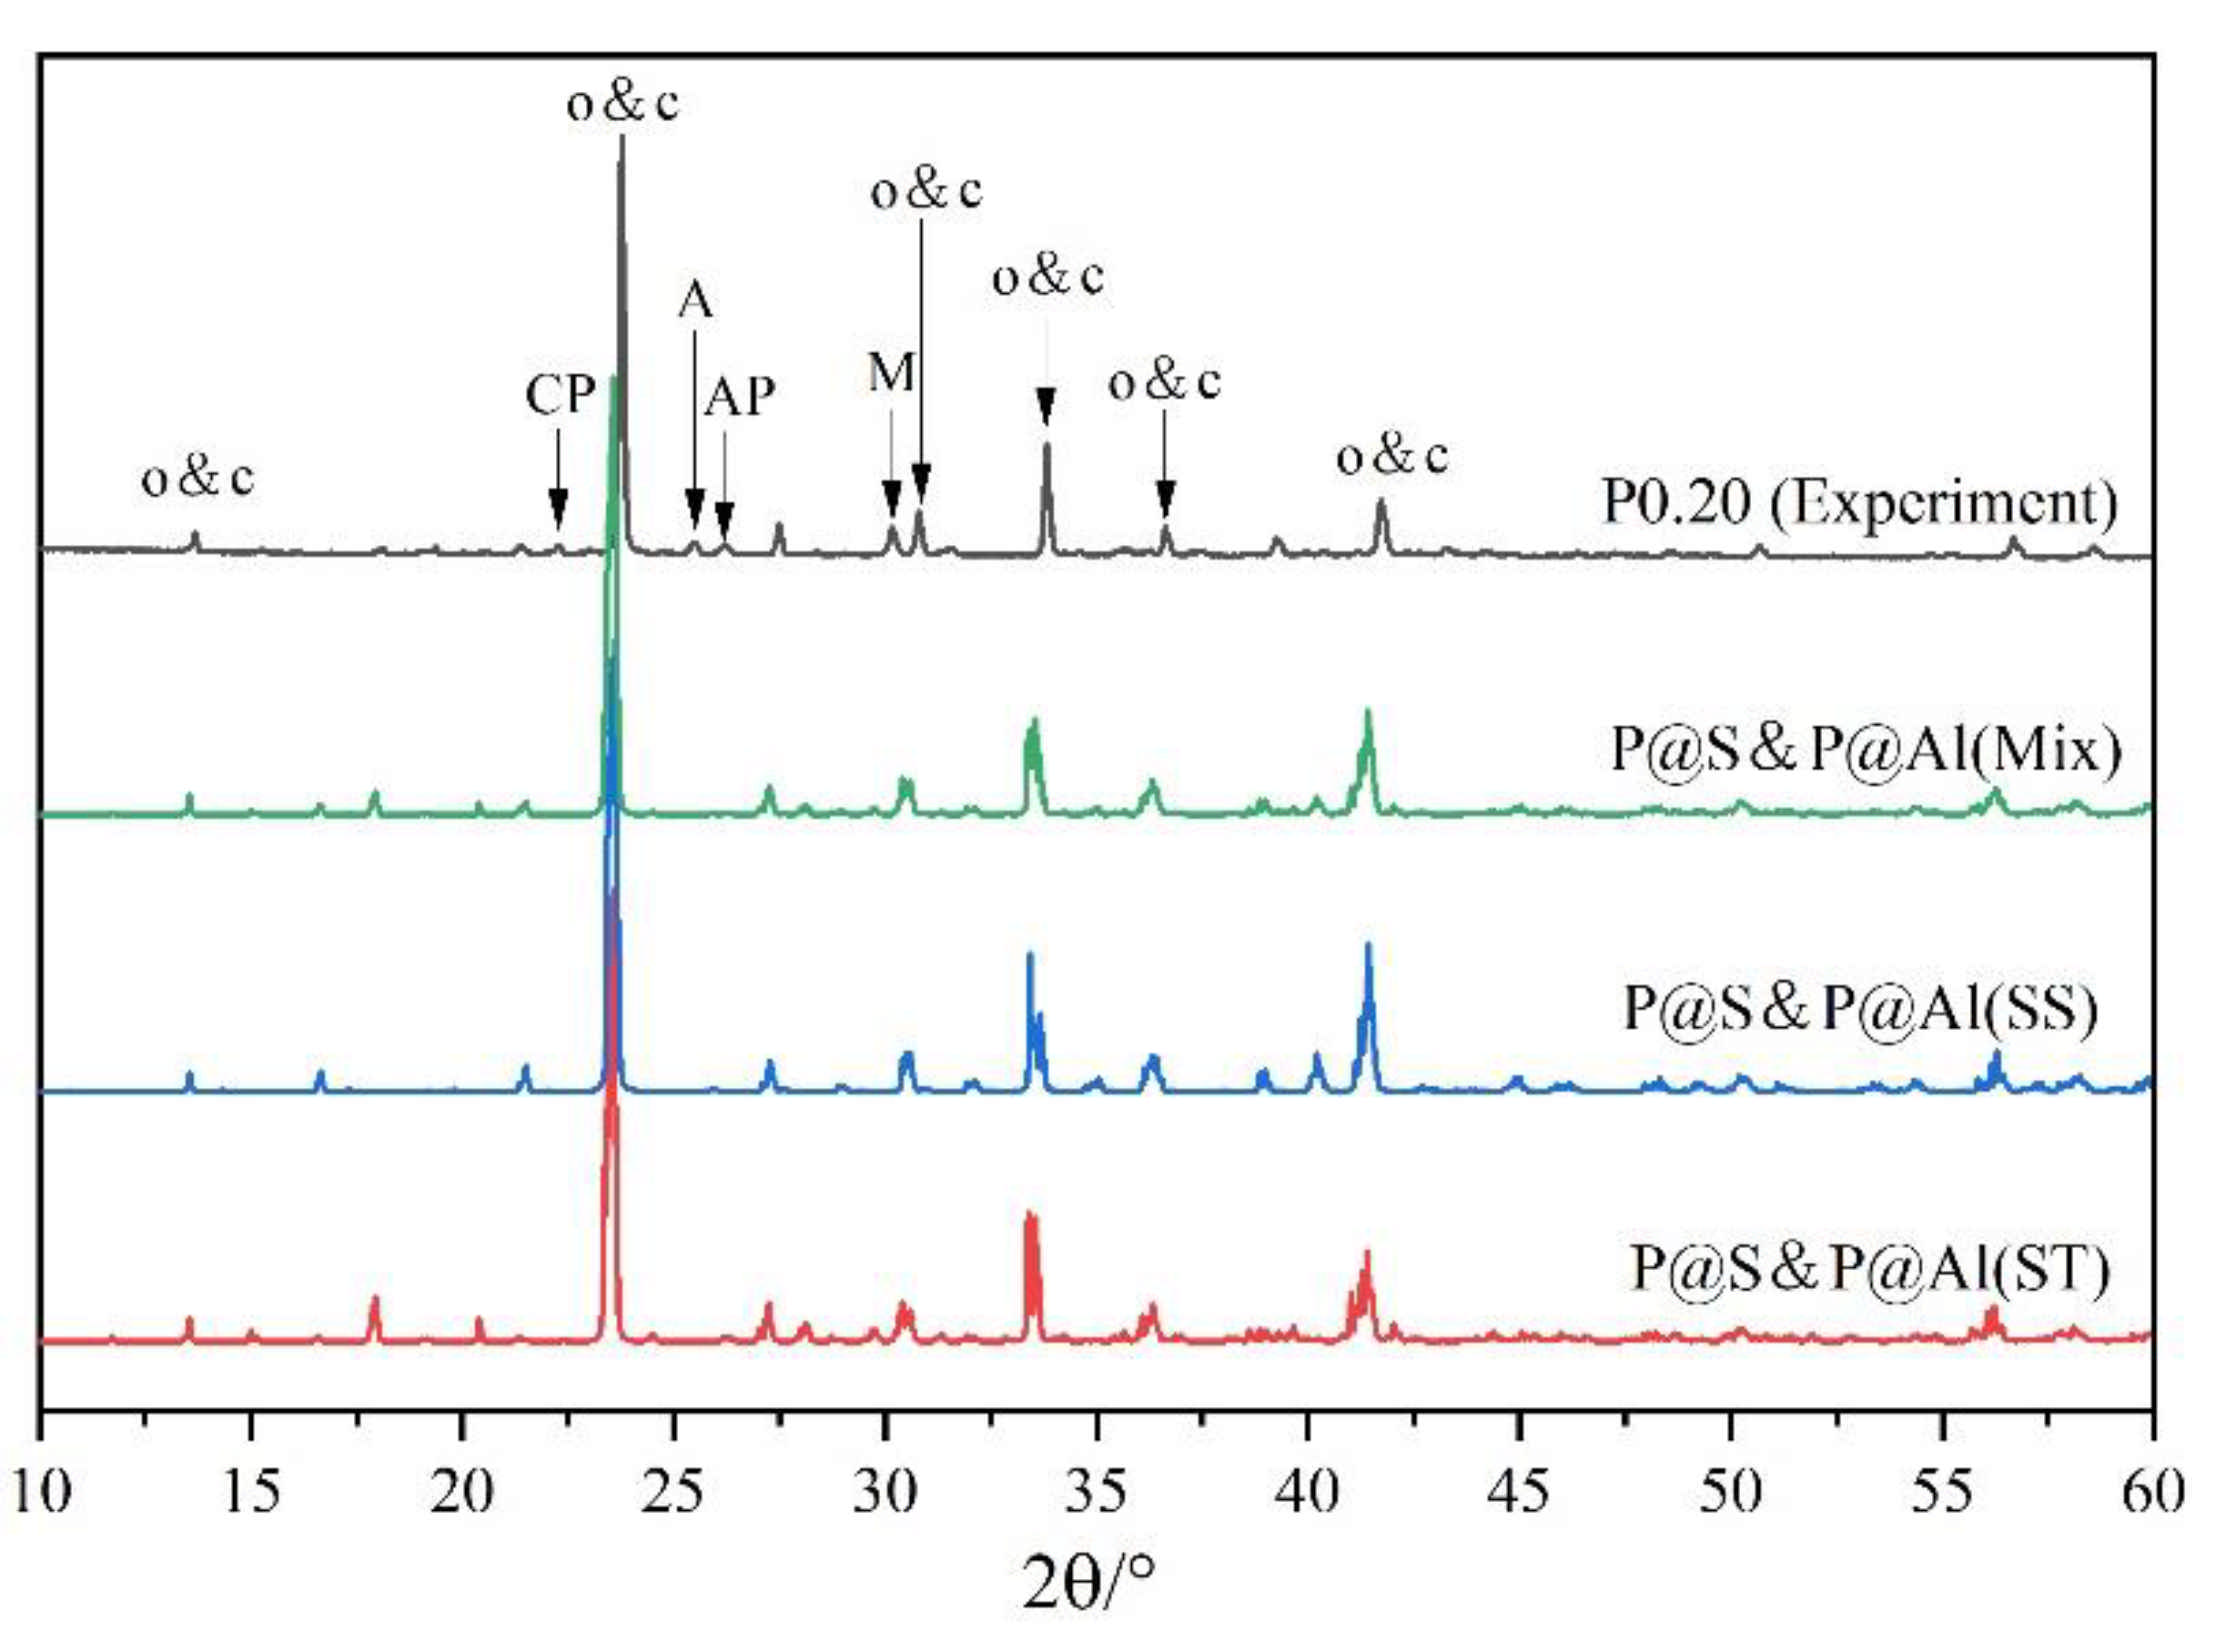
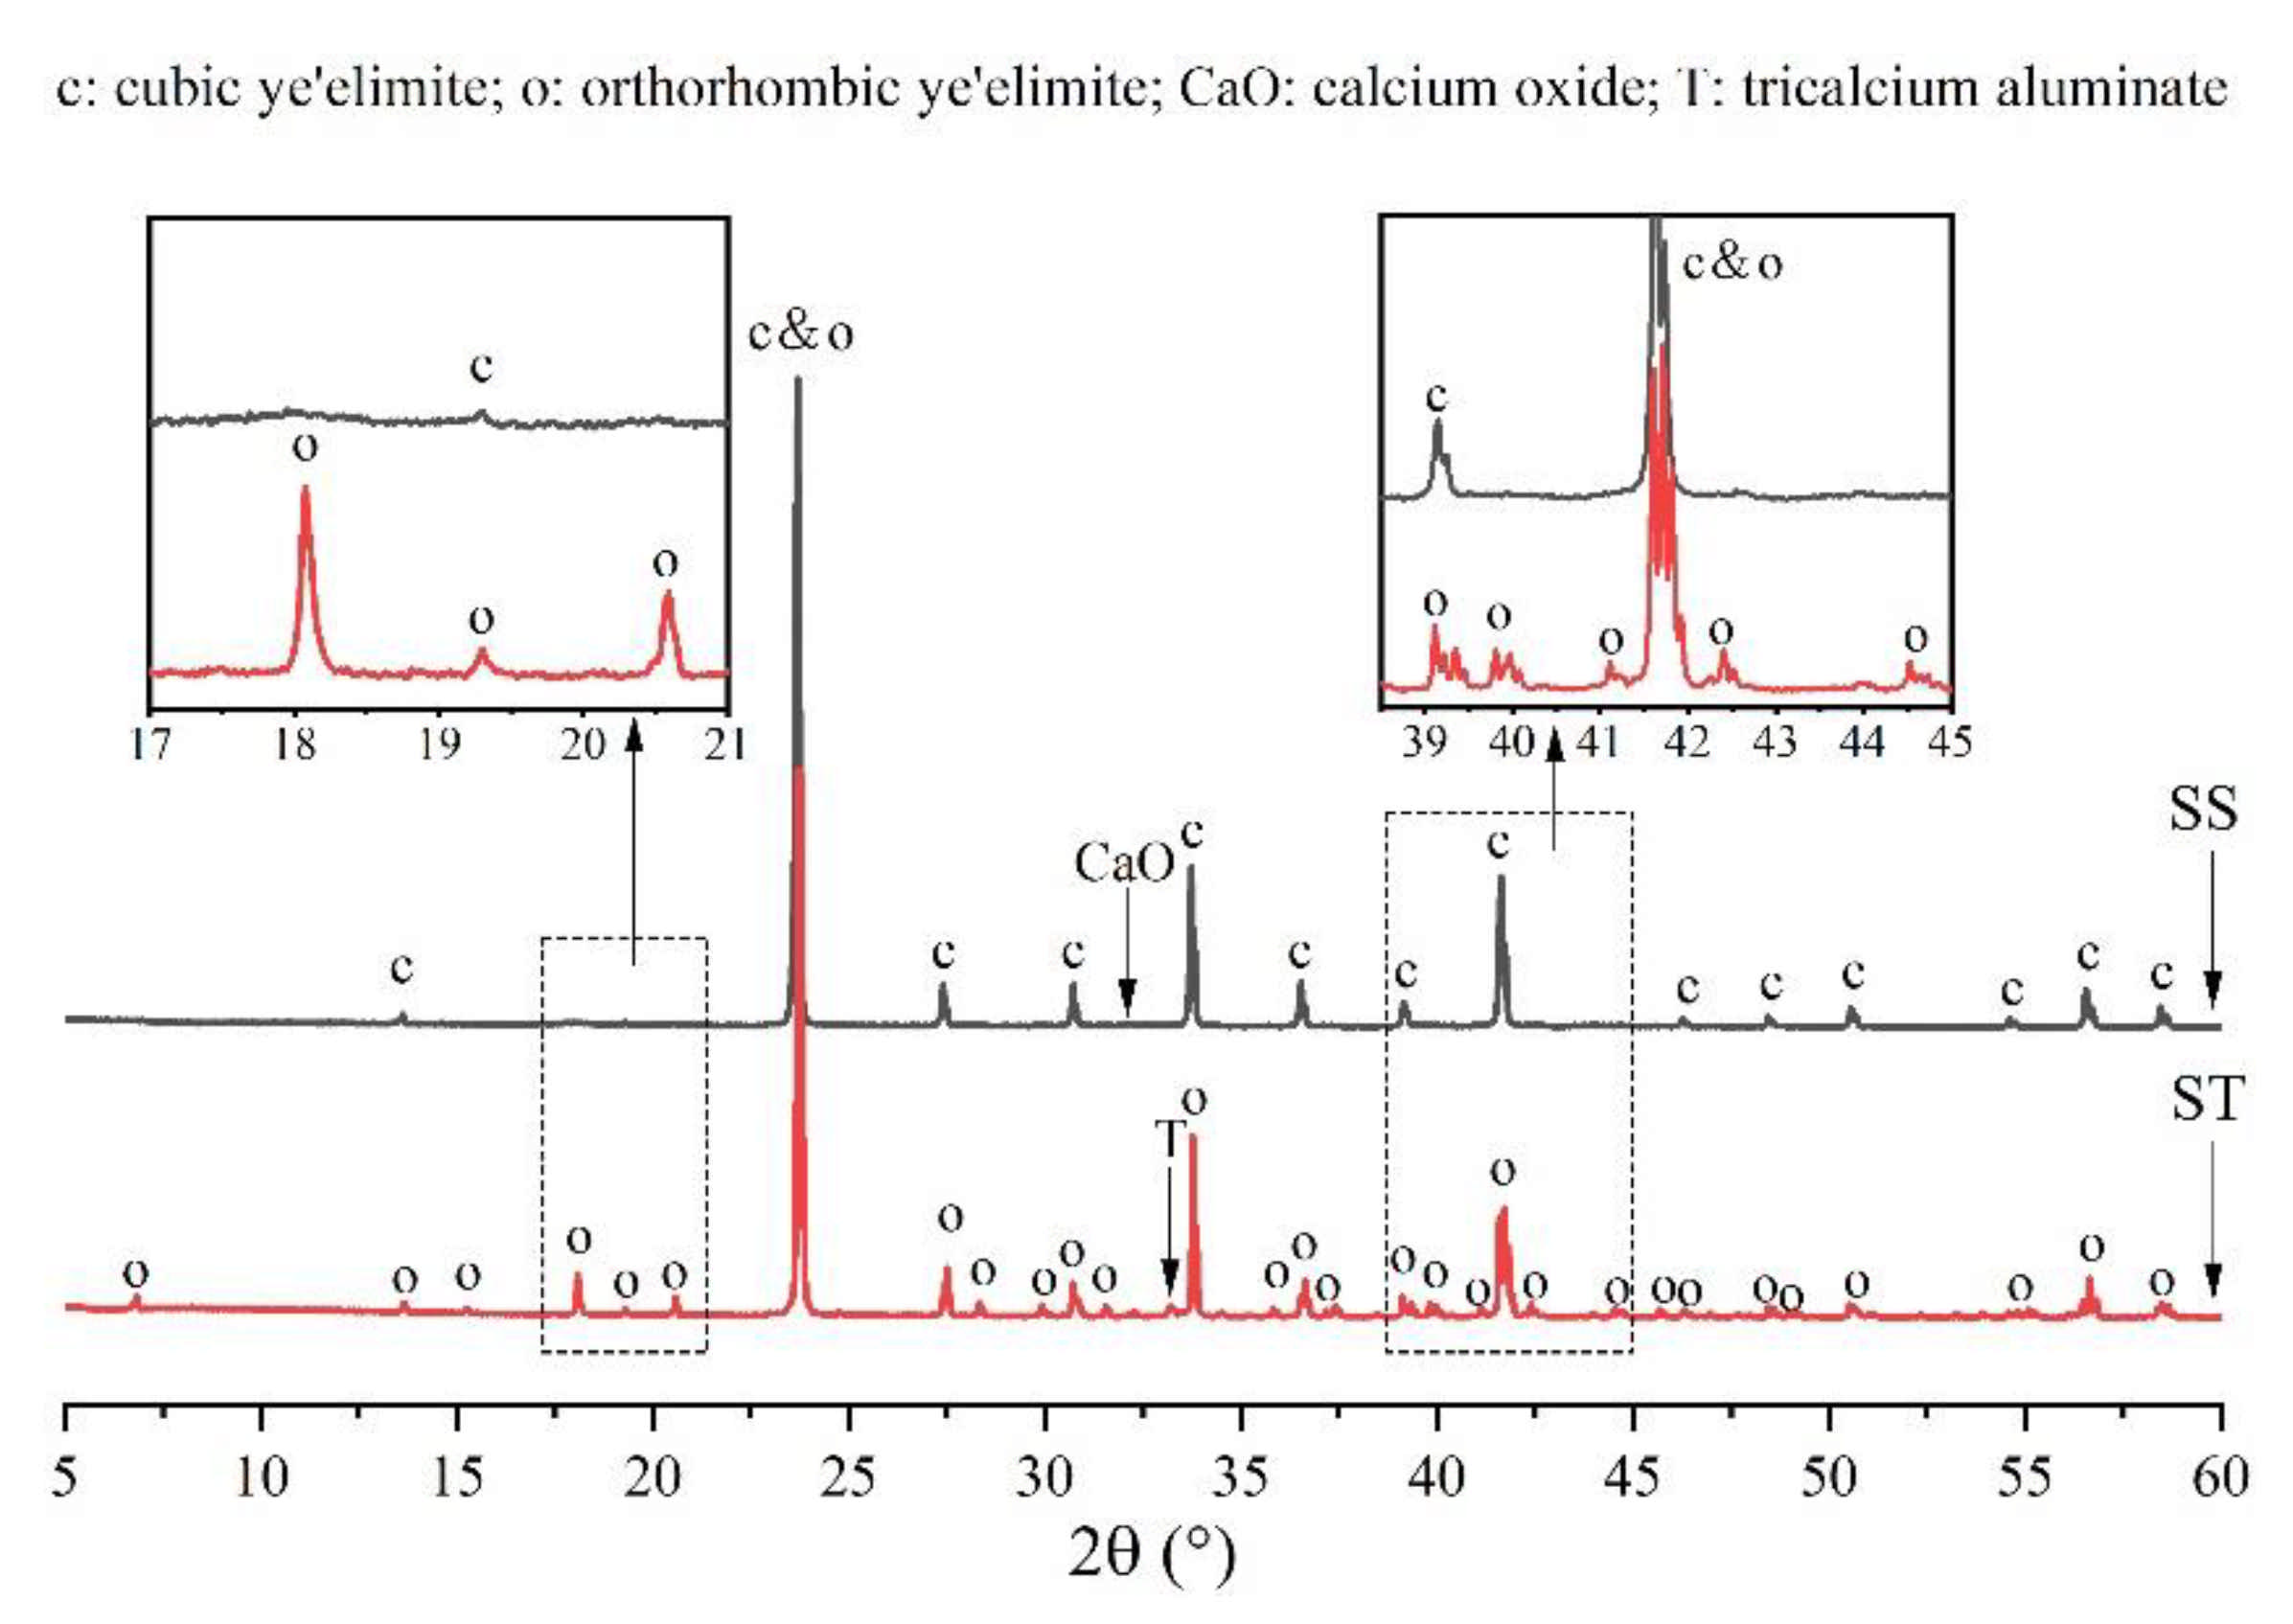
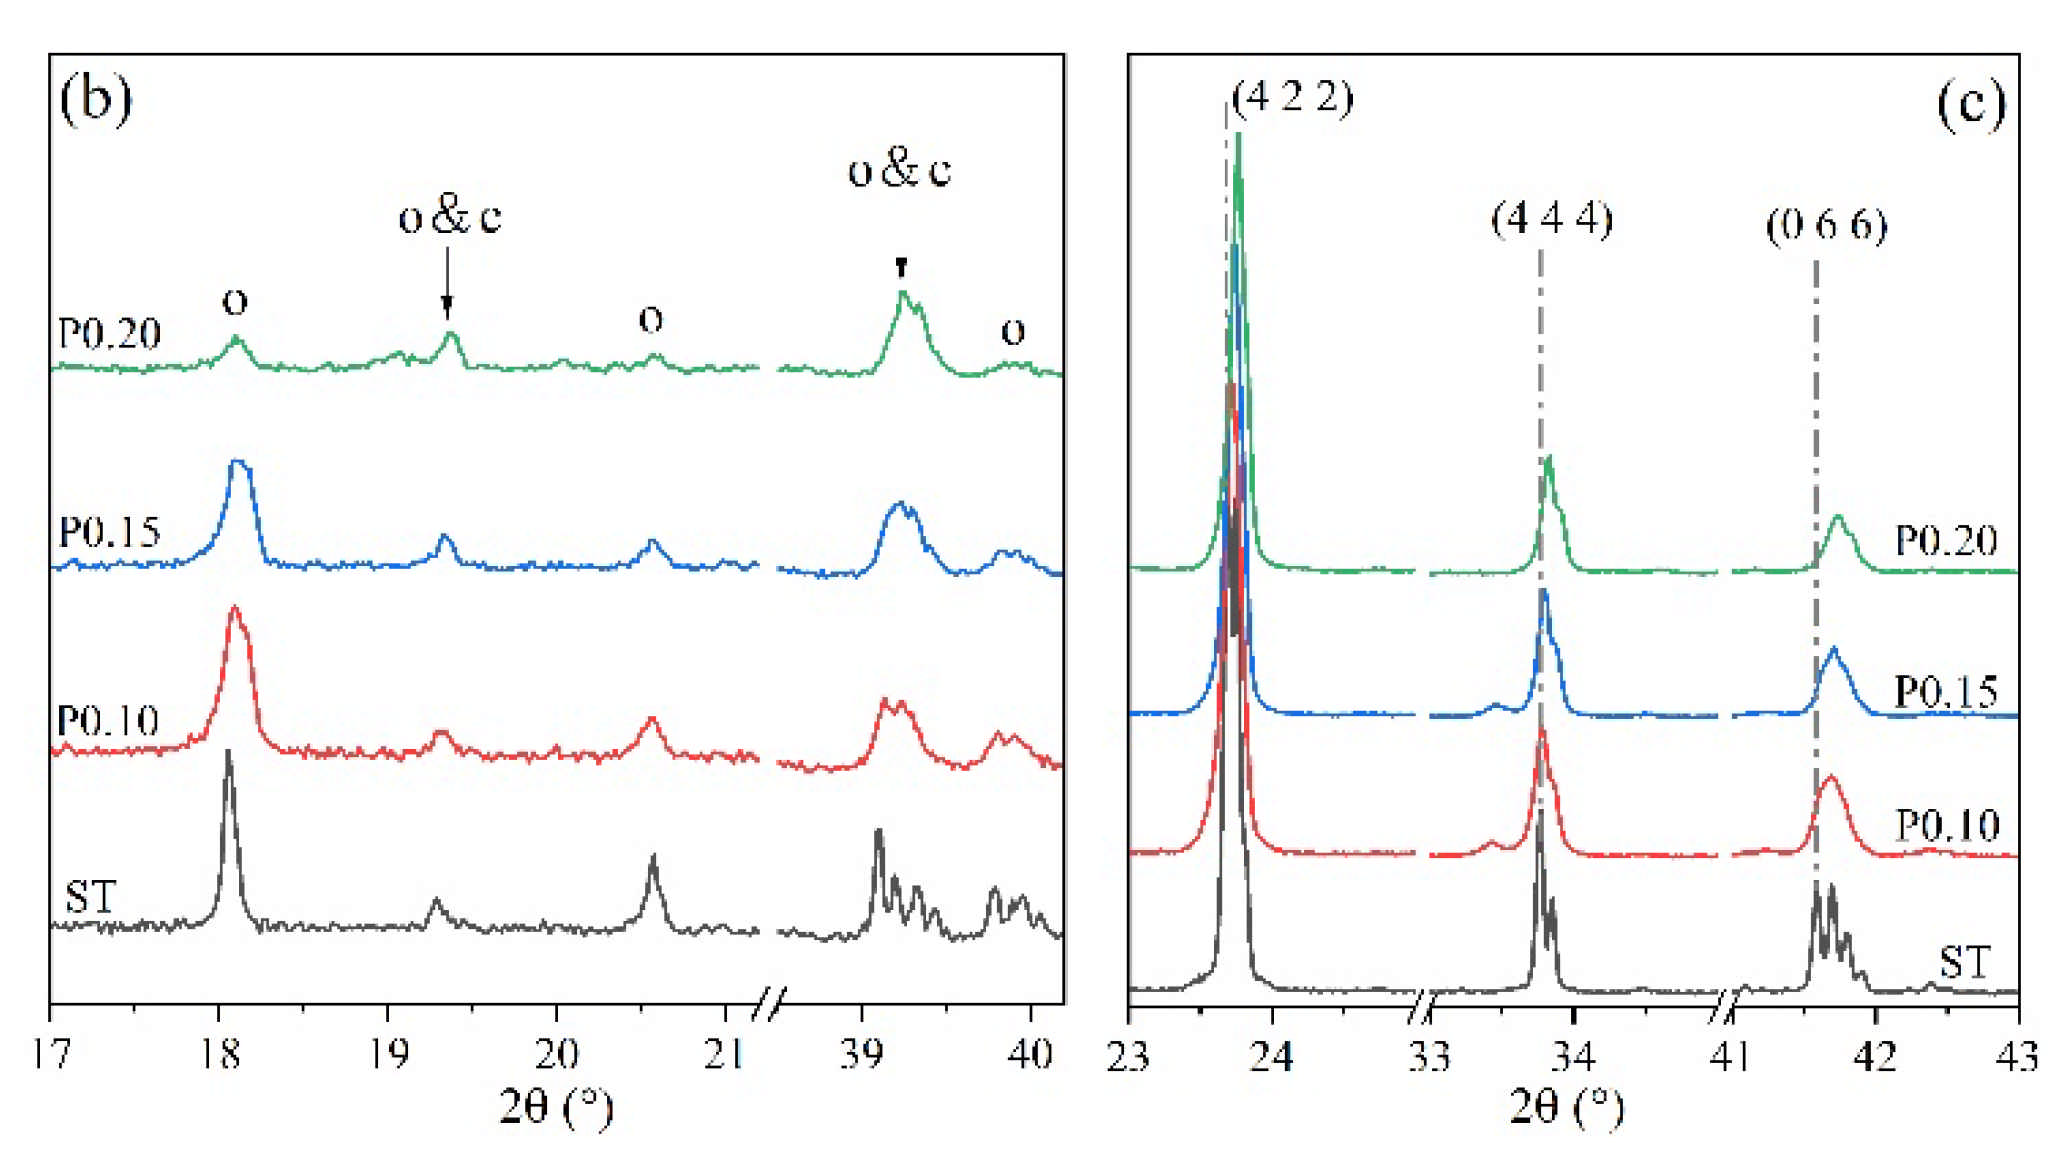
3.2. Rietveld Quantitative Phases Analysis of Synthesized Clinkers

Figure 3 shows a comparison of the XRD patterns of orthorhombic and cubic systems of ye’elimite to determine differences in their crystalline structures. Except for some low-intensity peaks of tricalcium aluminate (Ca3Al2O4) and calcium oxide (CaO), all peaks belonged to the orthorhombic and cubic systems of ye’elimite. Furthermore, the orthorhombic and cubic system patterns were generally similar as the major peaks of both the patterns overlapped at a high intensity (such as the peaks at 23.7°, 33.7°, and 41.6°). However, compared with the cubic system pattern, the orthorhombic system pattern exhibited some additional characteristic peaks (such as those appearing at approximately 18.1°, 20.6°, 35.8°, and 37.3°), which can be observed in the magnified image of Figure 1. Thus, the additional characteristic peaks can be used to distinguish the orthorhombic and cubic systems.
Figure 4 shows the XRD patterns of P-doped ye’elimite in comparison with the orthorhombic system. All diffraction peaks were assigned according to the standard diffraction patterns of ye’elimite (COD#4001772 and COD#4511960), anhydrite (COD#5000040), mayenite (COD#2102955), calcium phosphate (COD#1517238), aluminum phosphate (COD#9006404), monocalcium aluminate (COD#4308075), CaO (COD#7200686), and tricalcium aluminate (COD#9015966).
As shown in Figure 4a, more peaks for impurities, such as Ca3(PO4)2, AlPO4, CaAl2O4, and CaSO4, can be clearly detected in samples of P0.15 and P0.20, compared with ST and P0.10 samples. The peak intensities for Ca3(PO4)2, AlPO4, and CaSO4 in particular gradually increased as the P doping amount increased. Moreover, according to Figure 4b, higher phosphorus doping amounts yielded lower intensities of characteristic peaks for orthorhombic ye’elimite, indicating that ye’elimite gradually transformed from the orthorhombic to the cubic system. Furthermore, based on the comparison of three major peaks of ye’elimite in Figure 4c, the 2θ values for the corresponding peaks increased as the P doping amounts increased. When combined with the equation of Bragg diffraction (Equation (6)), it can be deduced that higher P doping amounts decrease the ye’elimite interplanar spacing.
2dsinθ = nλ
Rietveld quantitative phase analysis (RQPA) was performed to further determine the compositions of clinkers containing P-doped ye’elimite. Figure 5 shows a selected range (15–45°/2θ) of the Rietveld plots for P0.15, and the results are presented in Table 3. According to the RQPA results, as the P doping amounts increased from 0 mol to 0.20 mol, the total ye’elimite content decreased from 96.4 to 84.6 wt.%, while the impurity contents of calcium aluminate phases and calcium/aluminum phosphate increased from 2.8 and 0 wt.% to 11.6 and 2.7 wt.%, respectively. Note that the CaSO4 residues accounted for 0.6 and 1.2 wt.% in P0.15 and P0.20 clinkers, respectively. Additionally, based on the RQPA results, the transformation of the crystal system caused by large P doping amounts can be reflected by the ratio of cubic ye’elimite to orthorhombic ye’elimite.

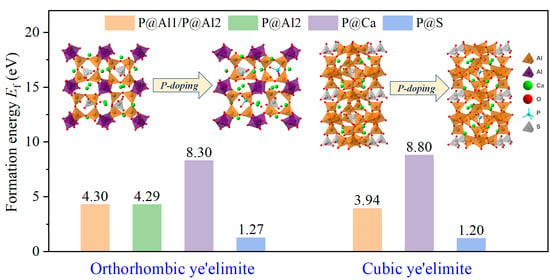
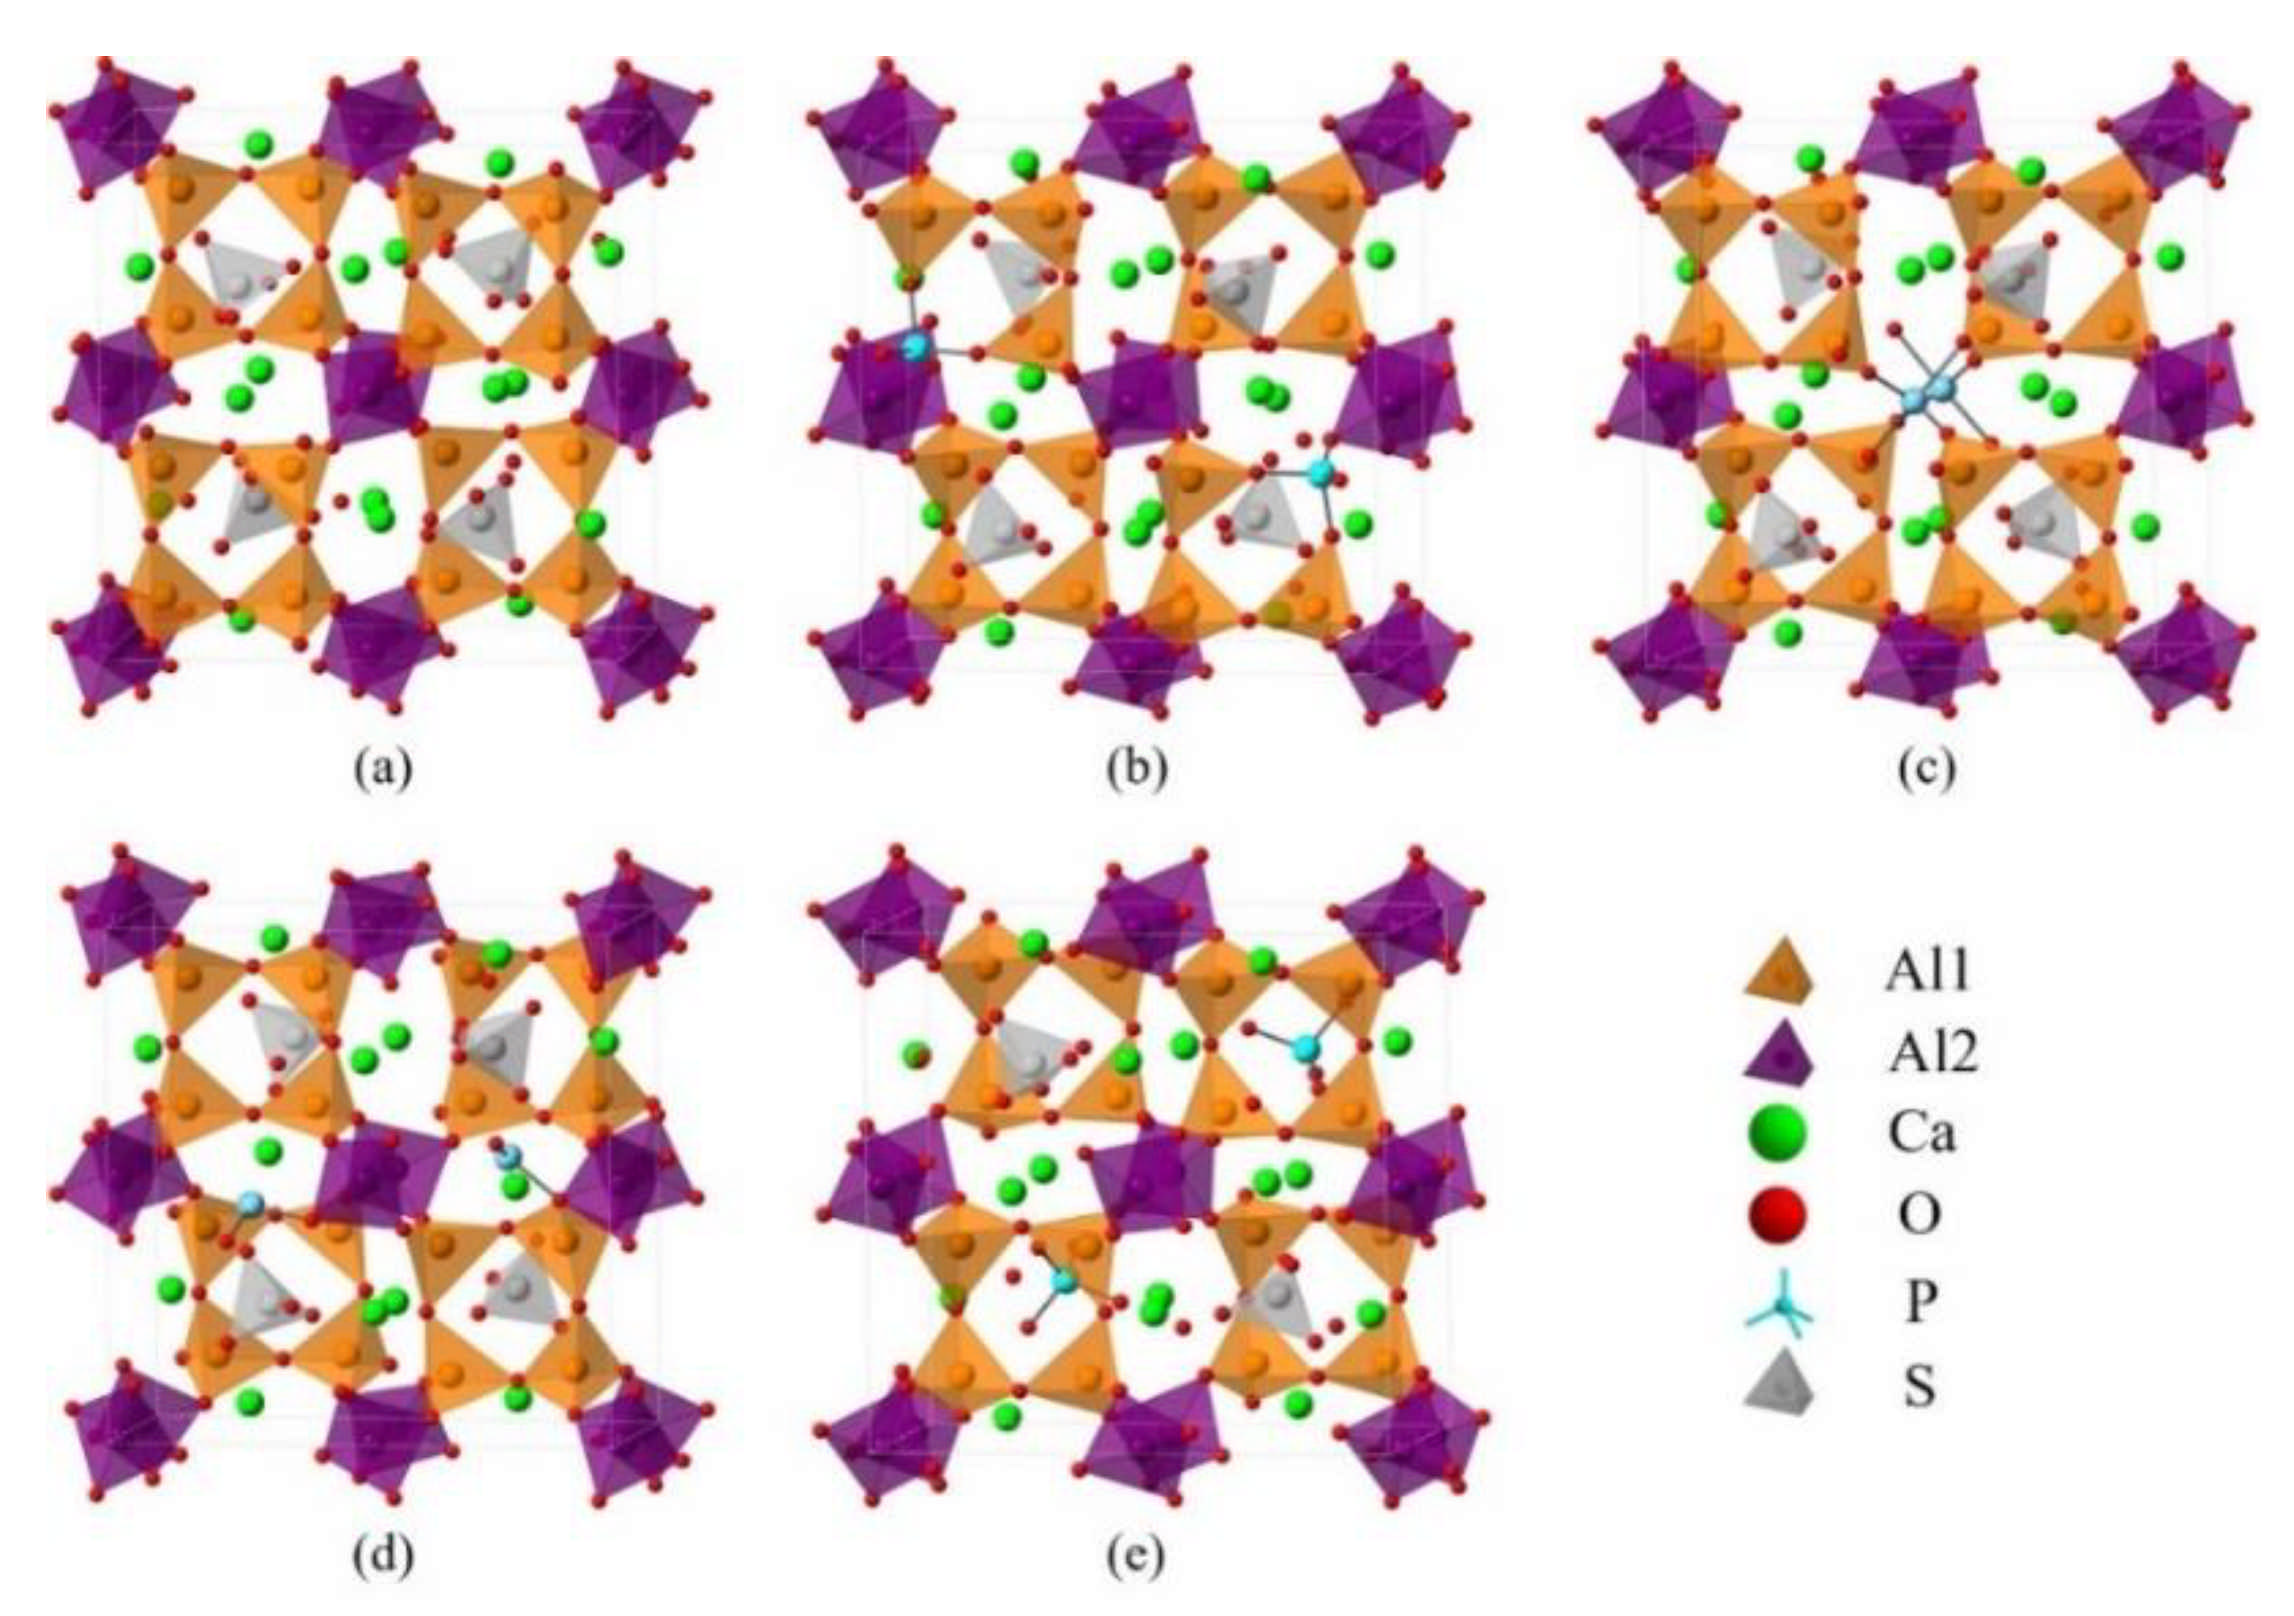
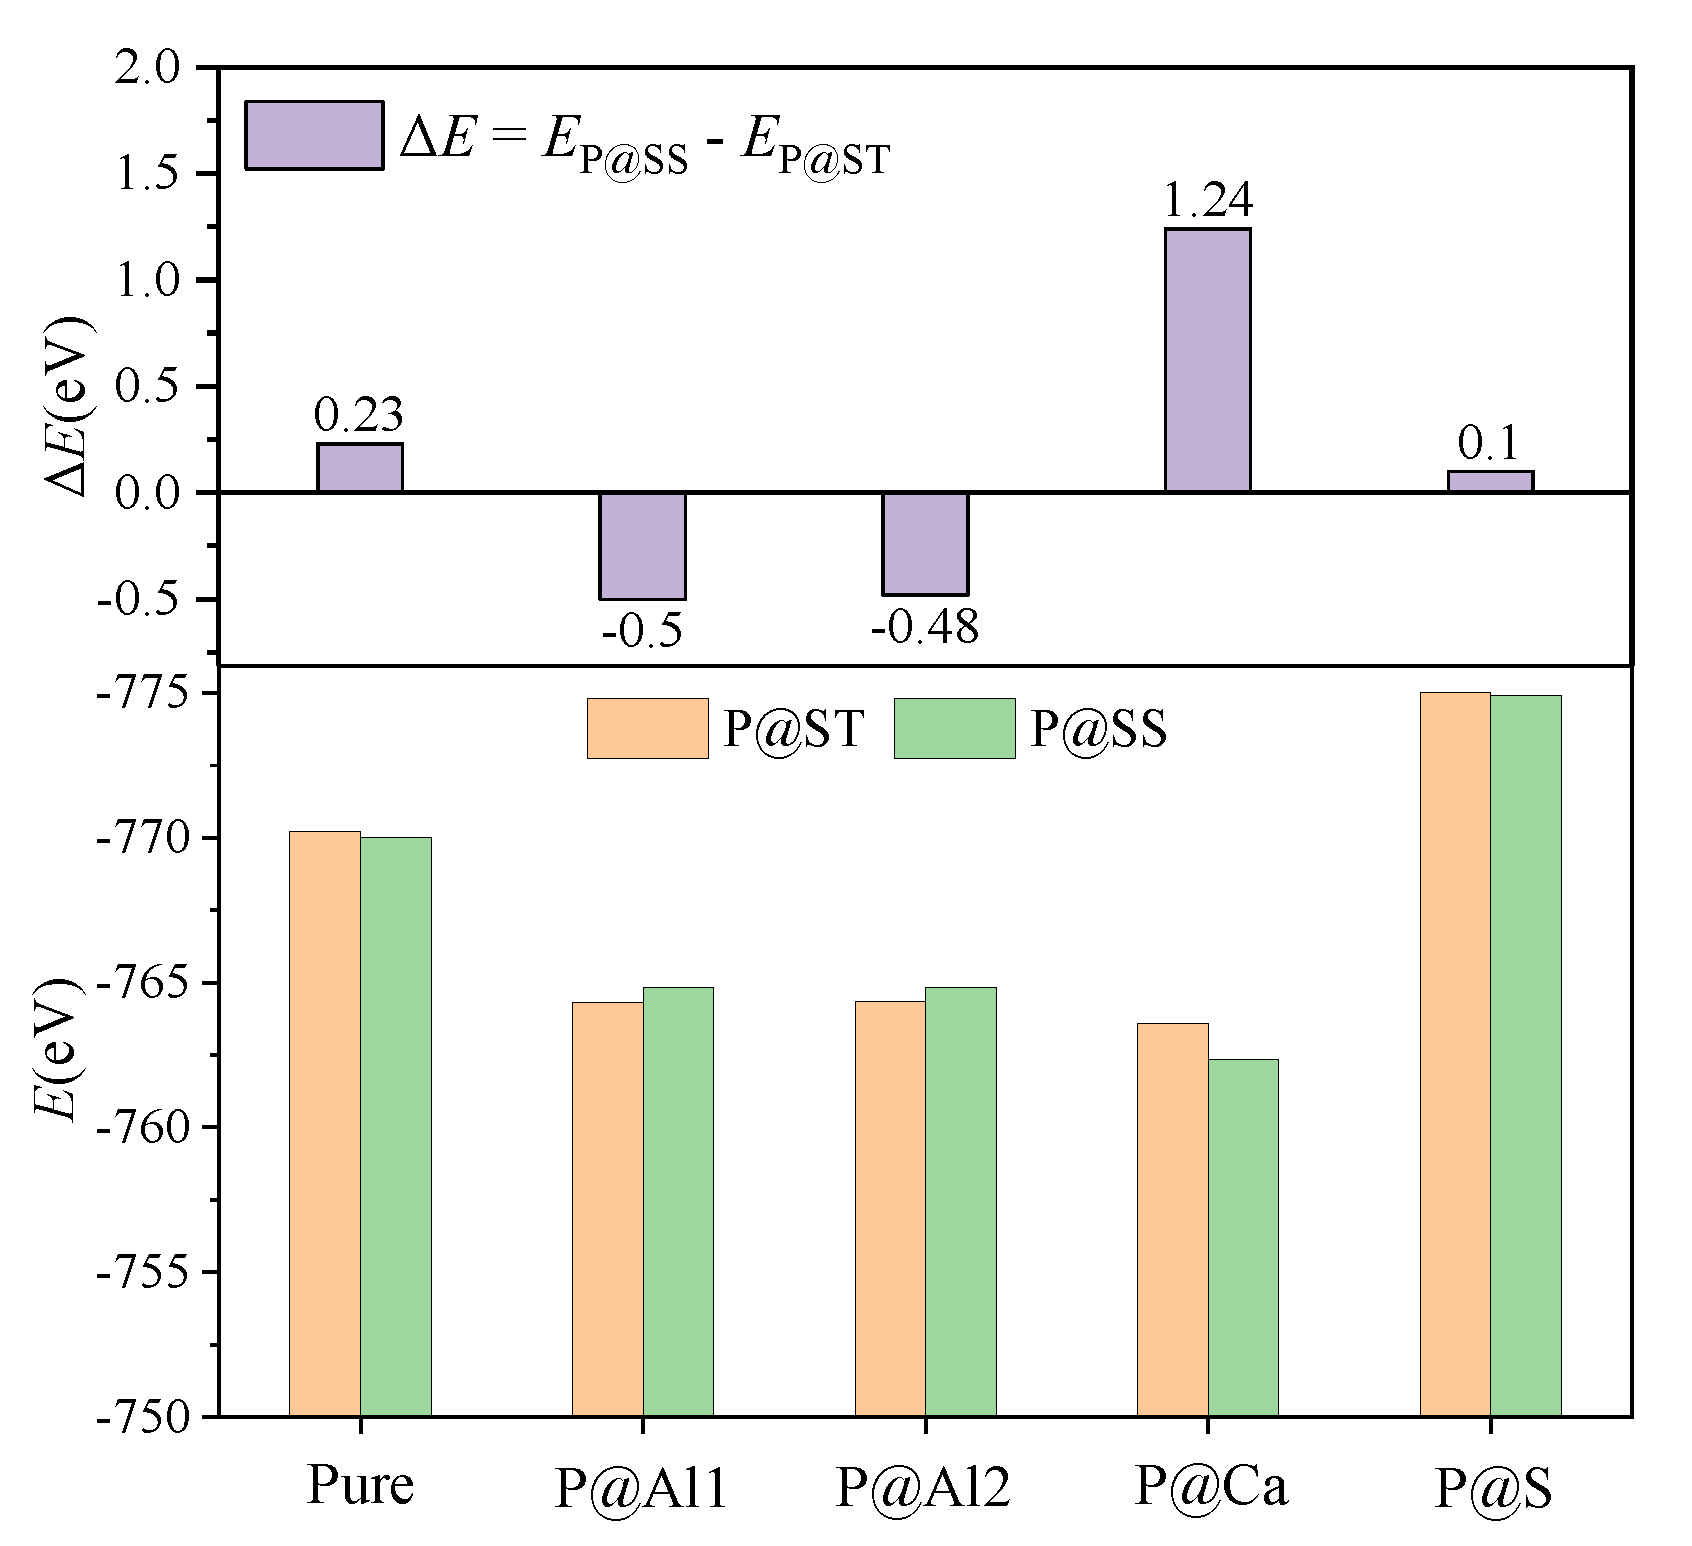
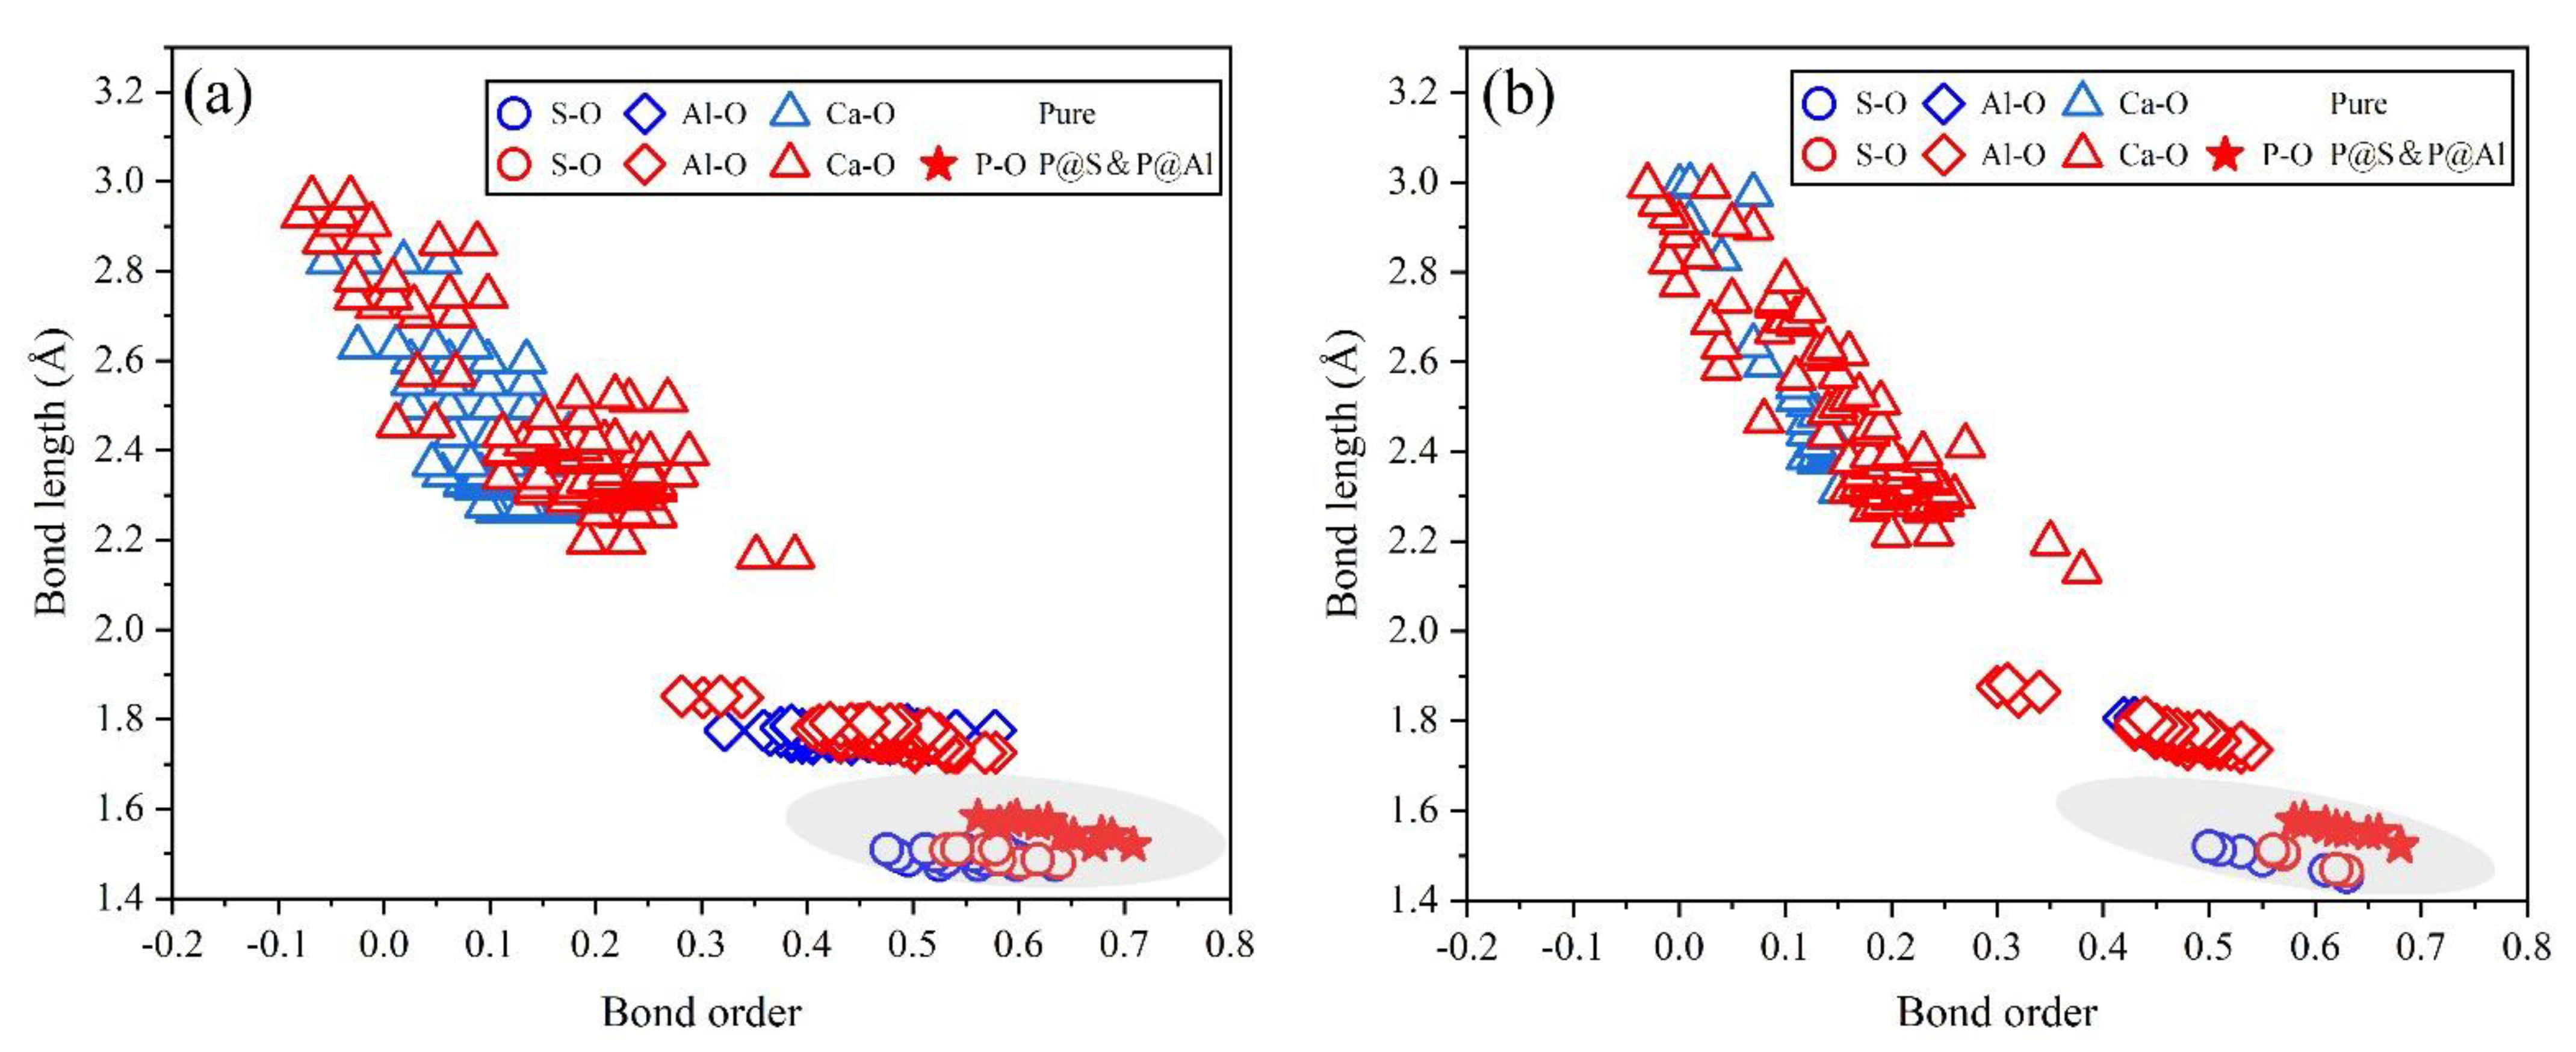
3.3. Defect Formation Energies of P-Doped Ye’elimite

The Ef of P-doped ye’elimite with orthorhombic and cubic systems was calculated by considering different configurations to determine the substitution preference of P doping in ye’elimite. The doped models used for calculations are shown in Figure 6 and Figure 7, and the lattice parameters of the doped models are presented in Table A3. The calculations Ef results are shown in Figure 8 (refer to Table A4 for details). The relative stabilities of defects and possibilities of reaction can be reflected by the values of formation energies (Ef), in which lower Ef represents more stable configuration and the easier reaction [45,47]. Thus, the Ef values can be used to estimate the possibility and stability of doping behavior. According to the results presented in Figure 8, P atoms most preferentially tended to substitute S atoms since the Ef values of P@S configurations remained to be minimum (1.27 and 1.20 eV for orthorhombic and cubic systems, respectively). The elemental distribution of P and S obtained using BSEM–EDS can be used to identify the substitution of P atoms for S atoms. Additionally, the increasing CaSO4 residue in the clinkers with P-doped ye’elimite can confirm the substitutional relationship between P and S since CaSO4 generally cannot be detected in clinkers of pure ye’elimite owing to the inevitable decomposition of CaSO4 during the temperature-rise period [52,53].
Alternatively, when P atoms substituted Ca/Al atoms, the Ef values remained positive and followed the alignment of P@Al (P@SS) < P@Al1 (P@ST) ≈ P@Al2 (P@ST) < P@Ca (P@ST) < P@Ca (P@SS). The alignment indicates that further additional energies were required for P atoms to substitute Ca atoms than for P atoms to substitute Al atoms. However, since P-doped ye’elimite was synthesized at a high temperature (1300 °C in this study), the required additional energies could be easily obtained to overcome the barrier for P atoms to substitute Ca/Al atoms.

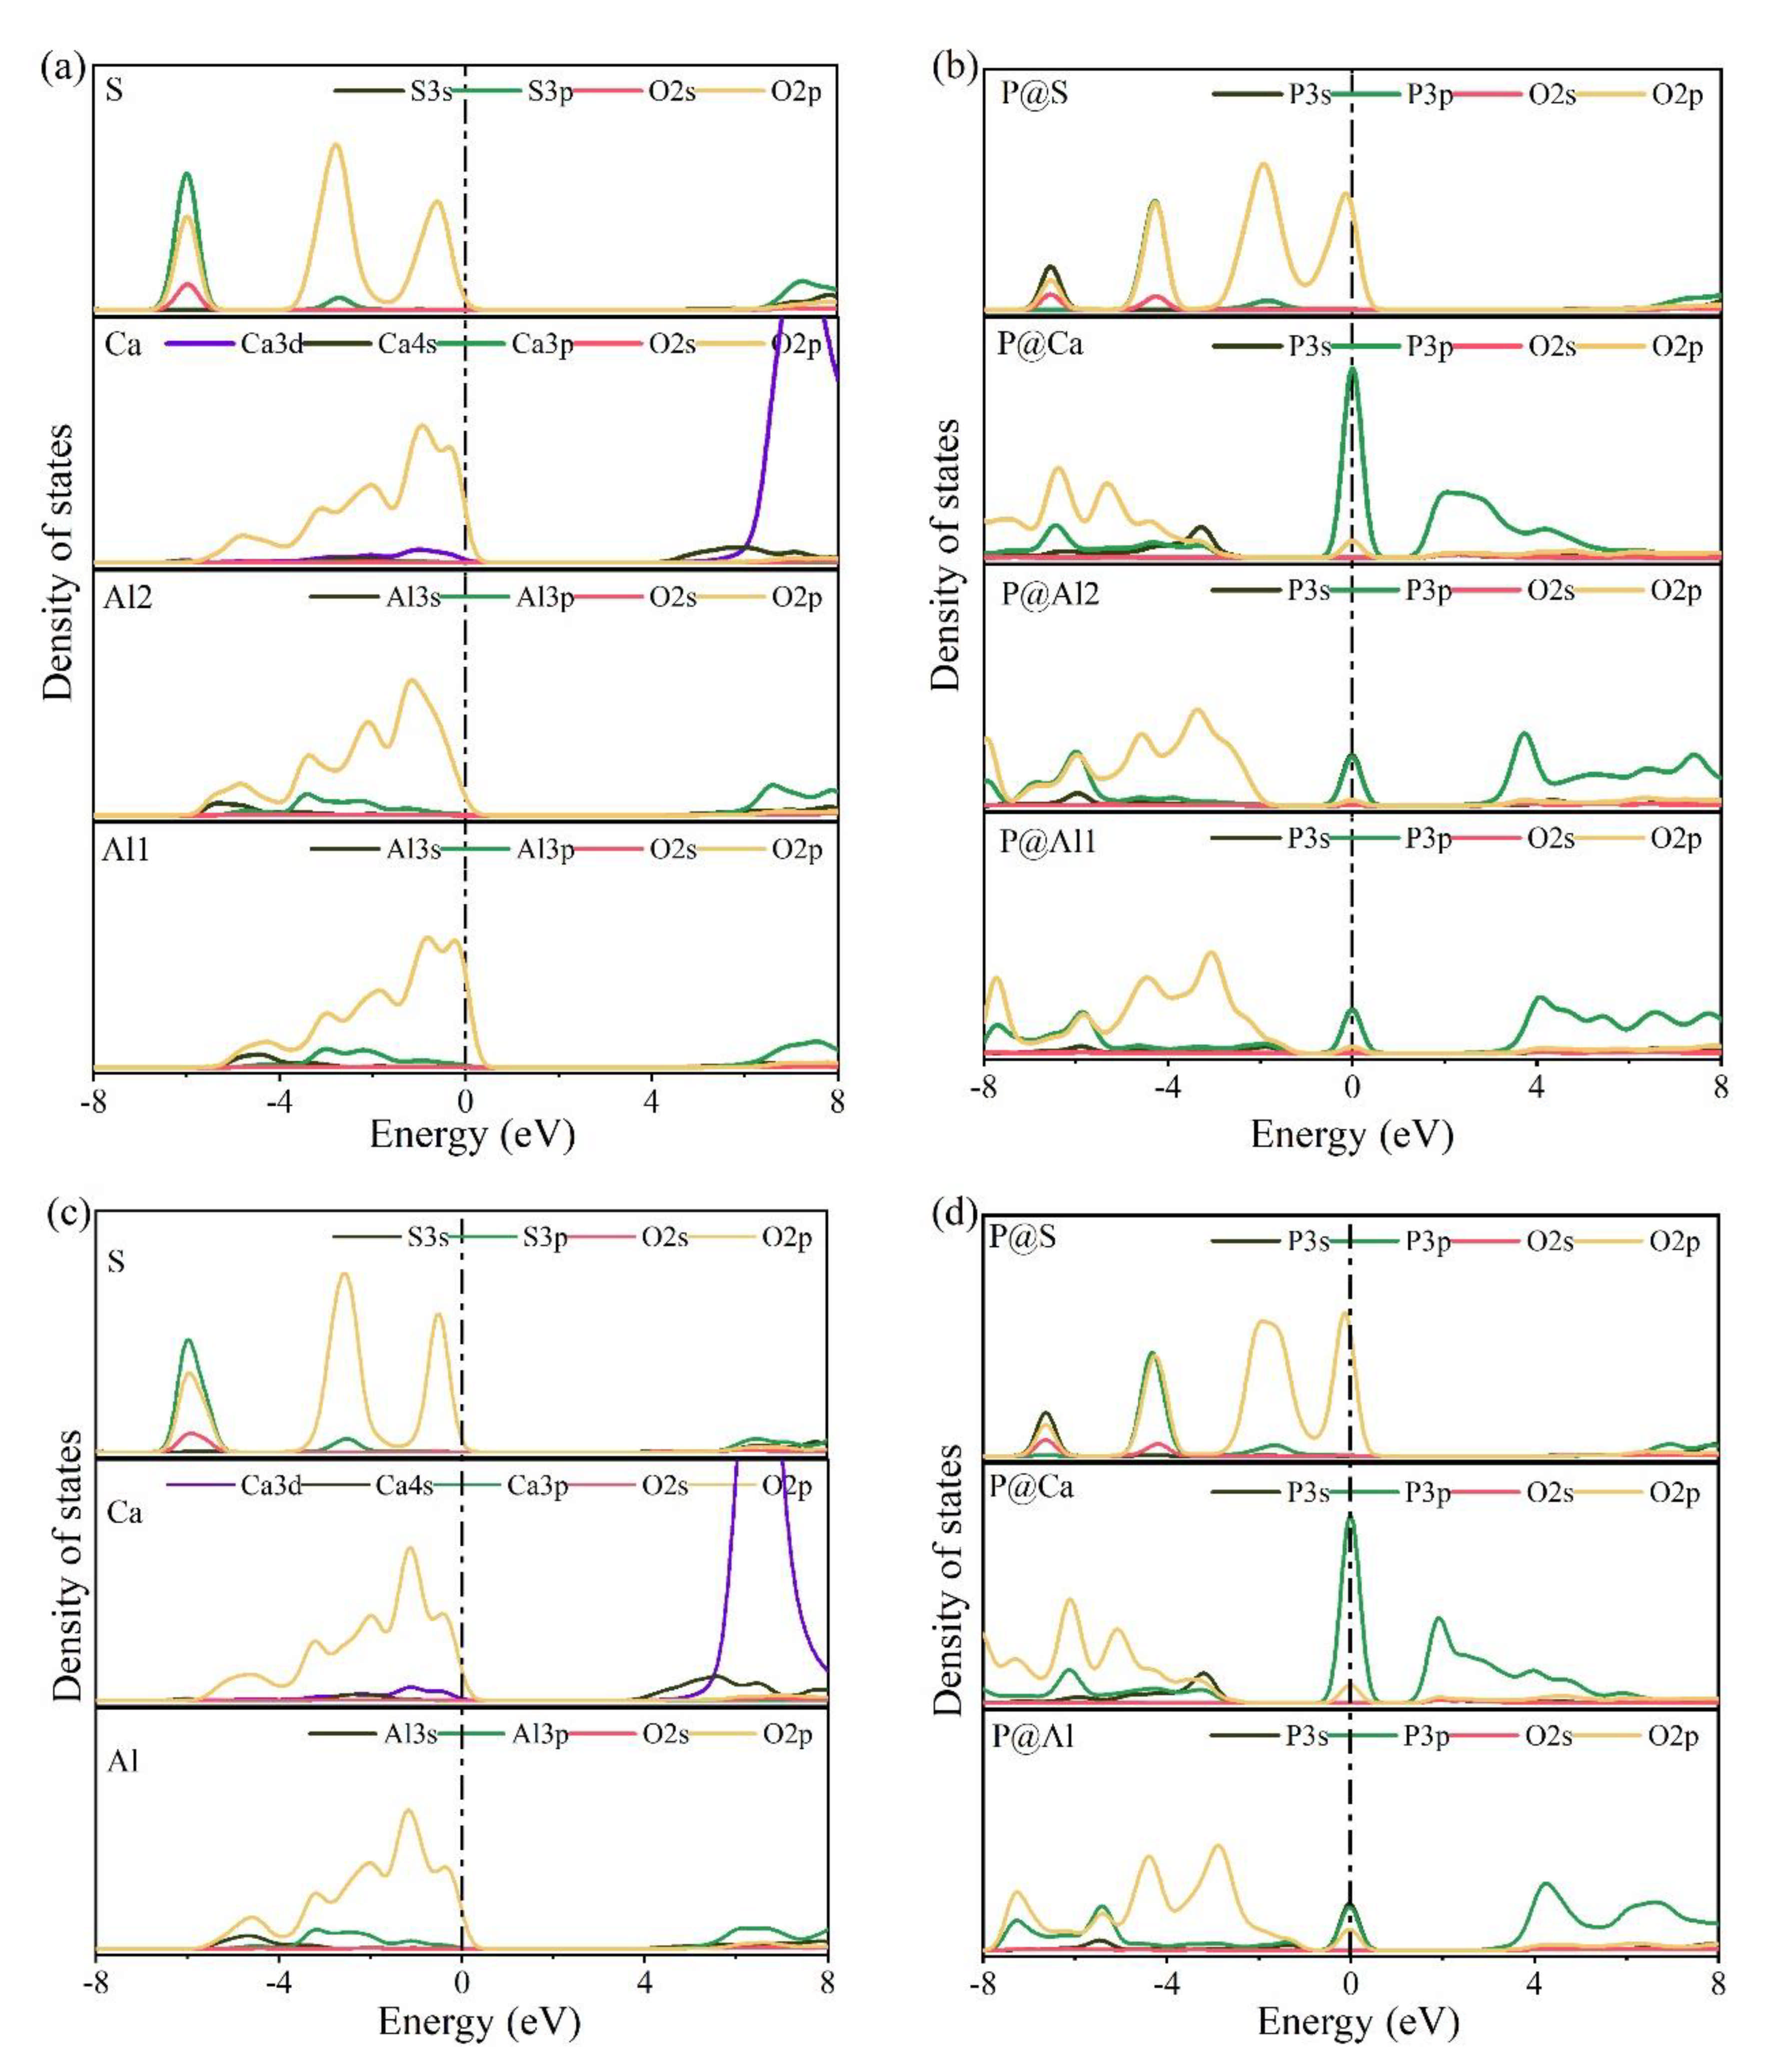
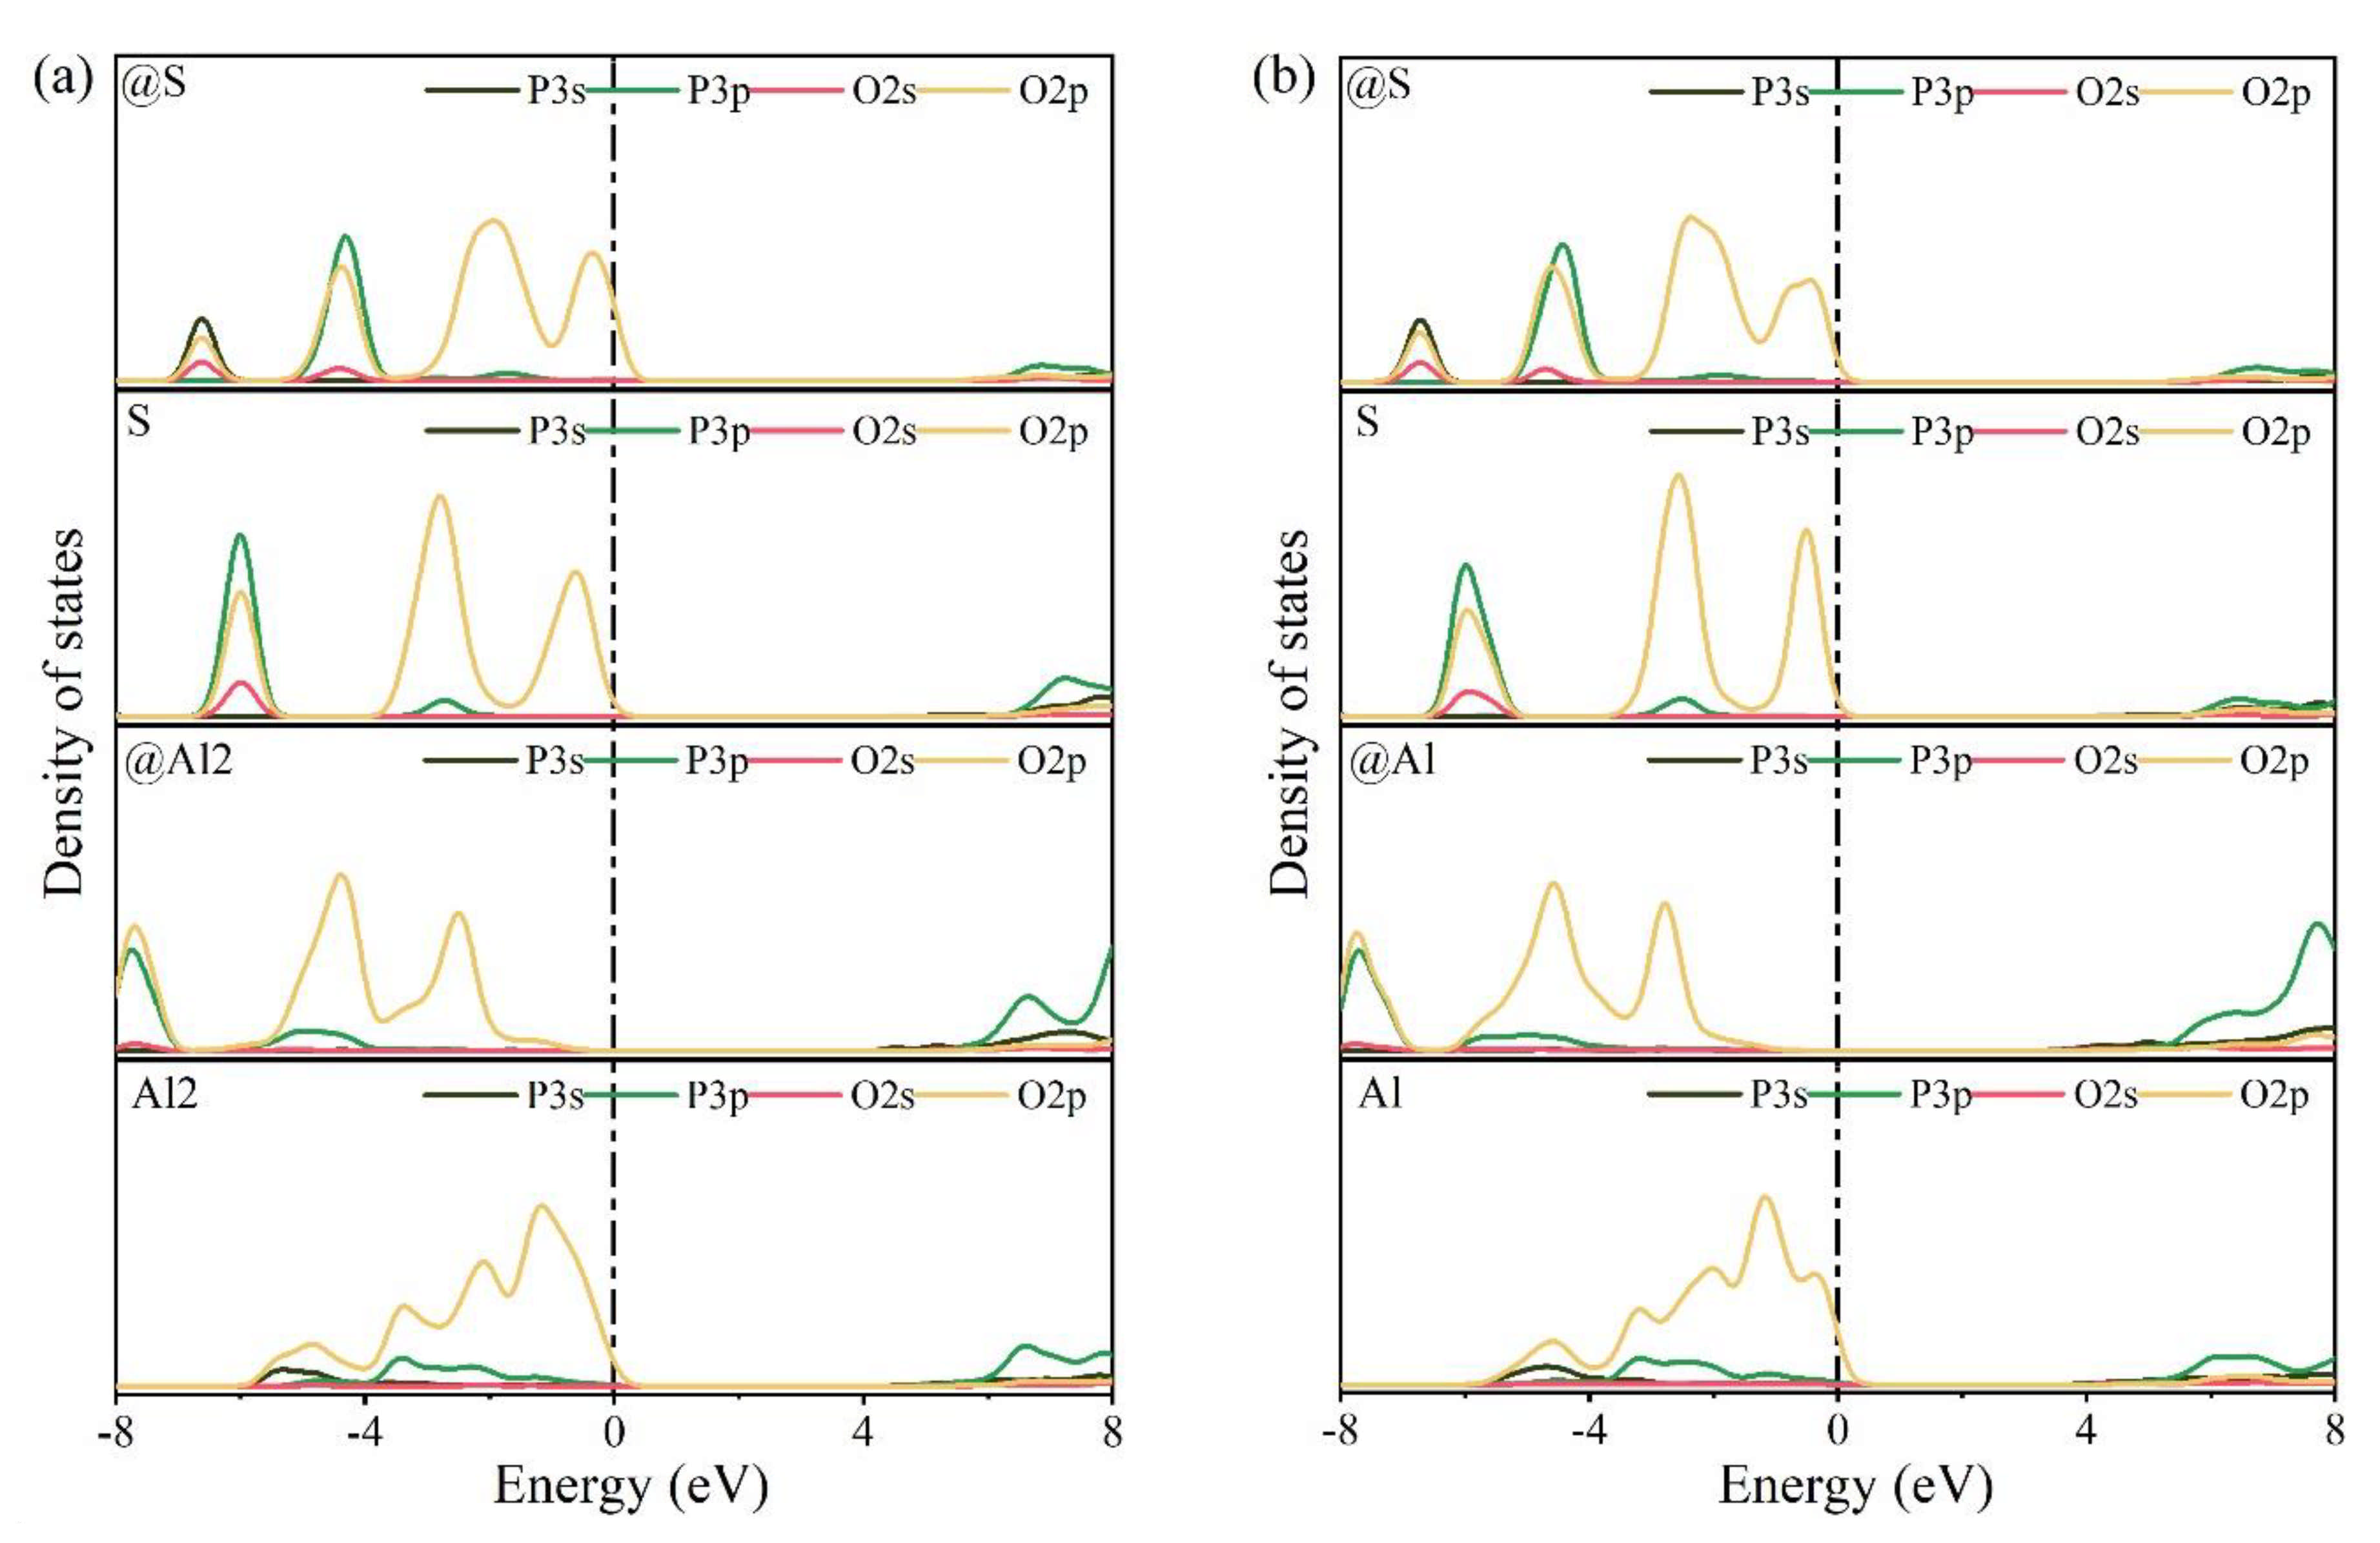
3.4. Electronic Structural Matching

To further estimate the possibility of different P-doped configurations, the BO–BL distributions in P-doped ye’elimite were calculated according to the Mulliken population rule [54]. Generally, covalent bonds exhibit BO values close to 1, whereas ionic bonds show BO values close to 0. Further, greater overlaps in BO–BL distributions between substituted atoms and dopants indicate a greater possibility for doping behavior to form solid solutions.
Figure 9 shows the BL–BO distributions in pure and P-doped ye’elimite with different configurations. For both orthorhombic and cubic ye’elimite, S–O bonds were observed with relatively high BO bonds, Ca–O bonds showed BO values of close to 0, and Al–O bonds were located in the regions between S–O and Ca–O bonds. Furthermore, when P atoms were introduced to substitute S atoms in P-doped ye’elimite, P–O bond regions overlapped well with S–O bond regions. In the configurations where P atoms substituted Al atoms, partial P–O bonds approached closely to the regions of Al–O bonds in both orthorhombic and cubic systems (refer to the marked regions in Figure 9a,b). However, when P atoms substituted Ca atoms, most of the P–O bonds remained away from the regions of Ca–O bonds.
The electronic structures of bonds formed between O and substituted/doped atoms can be further investigated using PDOS. Figure 10 shows the PDOS calculation results for various elements in pure and P-doped ye’elimite. According to Figure 10a,c, for pure ye’elimite with both orthorhombic and cubic systems, the O 2p orbitals hybridized with Al 3p and S 3p orbitals to form Al–O and S–O bonds, respectively, while the O 2p orbitals hybridized with Ca 3d orbitals to form Ca–O bonds. To form P–O bonds in P-doped ye’elimite (Figure 10b,d), the O 2p orbitals hybridized with P 3s and P 3p orbitals. Compared with pure ye’elimite, the PDOS of P@S (in both P@ST and P@SS) exhibited the most similar distribution for all P-doped ye’elimite configurations, whereas partial overlapping (between −4 and −2 eV) could be observed for the PDOS of P@Al, including P@Al in P@SS and P@Al1/P@Al2 in P@ST. Additionally, similar electronic contributions between P–O and Ca–O bonds are seldomly observed in both orthorhombic and cubic structures of ye’elimite.
Combining the BL–BO and PDOS calculation results, for P-doped ye’elimite with both orthorhombic and cubic systems, the P atoms preferably substituted S atoms; the second possible substituted atoms were Al, while the substitution for Ca atoms exhibited only a slight possibility.

4. Discussion

According to the Ef, BL–BO, and PDOS calculation results, P atoms were more likely to substitute S atoms, which is a spontaneous process, rather than Al/Ca atoms. In addition, the substitution of P atoms for S atoms can be verified using the elemental distribution in P-doped ye’elimite (Figure 2) and the increasing residual CaSO4 contents (Table 1).
According to the XRD patterns demonstrated in Figure 4 and the RQPA results presented in Table 1, increasing the P doping amount caused the transformation of the crystal system from the orthorhombic to the cubic system. Previous studies have shown that the freezing of anionic groups caused by dopants prompted the transformation of the crystal system of ye’elimite during cooling [16]. The freezing effect can also be reflected by the E values of ye’elimite, where a lower E value generally represents a more stable structure that tends to be retained during the crystalline transformation process [12]. To confirm the stability of the P-doped ye’elimite structure, the E values for P substituting different atoms in orthorhombic and cubic structures of ye’elimite are compared in Figure 11.
According to the results depicted in Figure 11, for pure ye’elimite, the orthorhombic system demonstrated more stability at the room temperature than the cubic system, which agrees with the experimental results presented in Figure 3. Similarly, for configurations with P atoms substituting Ca/S atoms, the orthorhombic system of P-doped ye’elimite exhibited lower E values than the cubic system of P-doped ye’elimite. However, when P atoms were introduced to substitute Al atoms, the E value for the cubic system was lower than that for the orthorhombic system. When all configurations with P substituting different atoms in P@ST and P@SS were combined, only the substitution of P atoms for Al atoms would result in the transformation of the crystal system of P-doped ye’elimite.
Additionally, based on the XRD patterns shown in Figure 4, increasing the P doping amount resulted in a gradual decrease in the ye’elimite interplanar spacing, which is generally explained by smaller ionic radii of dopants compared with substituted atoms [14,18,20]. According to the radii of the ions involved in P-doped ye’elimite (Table 4), all the radii of phosphonium ions with different coordination numbers are larger than that of sulphion, implying that the decrease in the ye’elimite interplanar spacing cannot be attributed to the substitution of P atoms for S atoms. Considering the slight possibility of substitution for Ca atoms revealed by BL–BO and PDOS results, the substitution of P atoms for Al atoms was the most likely driving force for the decreasing ye’elimite interplanar spacing.
Combining the above analysis with the consideration of charge equilibrium in the lattices, the co-substituting P-doped ye’elimite were proposed to be the most probably models (see Figure 12), in which P atoms substituted two S atoms and one Al atom in cell/supercell of orthorhombic and cubic ye’elimite, respectively (P@S&P@Al(ST) refers to the co-substituting P-doped ye’elimite with orthorhombic system, P@S&P@Al(SS) refers to the co-substituting P-doped ye’elimite with cubic system). It should be noted that the Ef of the co-substituting P-doped ye’elimite was, respectively, equaled to −0.22 and −0.18 eV for orthorhombic and cubic system (the comparison of Ef in this paper and references can be seen in Table A5), which illustrates the co-substituting models were more rational than the above single substituting models.
To further examine the rationality of the co-substituting P-doped ye’elimite, experimental and simulated XRD patterns were compare d in Figure 13. P@S&P@Al(Mix) refers to the mixture of P@S&P@Al(ST) and P@S&P@Al(SS), and the ratio of SS/ST was set as 0.89 which is the same as P0.20. It can be noticed that major peaks of ye’elmite for the experiment and simulation were almost coincident. Additionally, the distributions of BL–BO and PDOS were also calculated and shown in Figure A2 and Figure A3, which can also verify the rationality of the model of co-substituting P-doped ye’elimite from the aspect of electronic structure.

5. Conclusions

The effect of different doping amounts of P on the crystalline structures of ye’elimite was investigated, and the doping mechanism was revealed using BSEM–EDS, XRD tests, the Rietveld method, and DFT simulations. The following conclusions were obtained:
  • Experiments and Rietveld analysis confirmed that doped P entered ye’elimite to form P-doped solid solutions, resulting in increased impurity contents in clinkers, a crystal system transformation from the orthorhombic to the cubic system, and a decrease in the ye’elimite interplanar spacing.
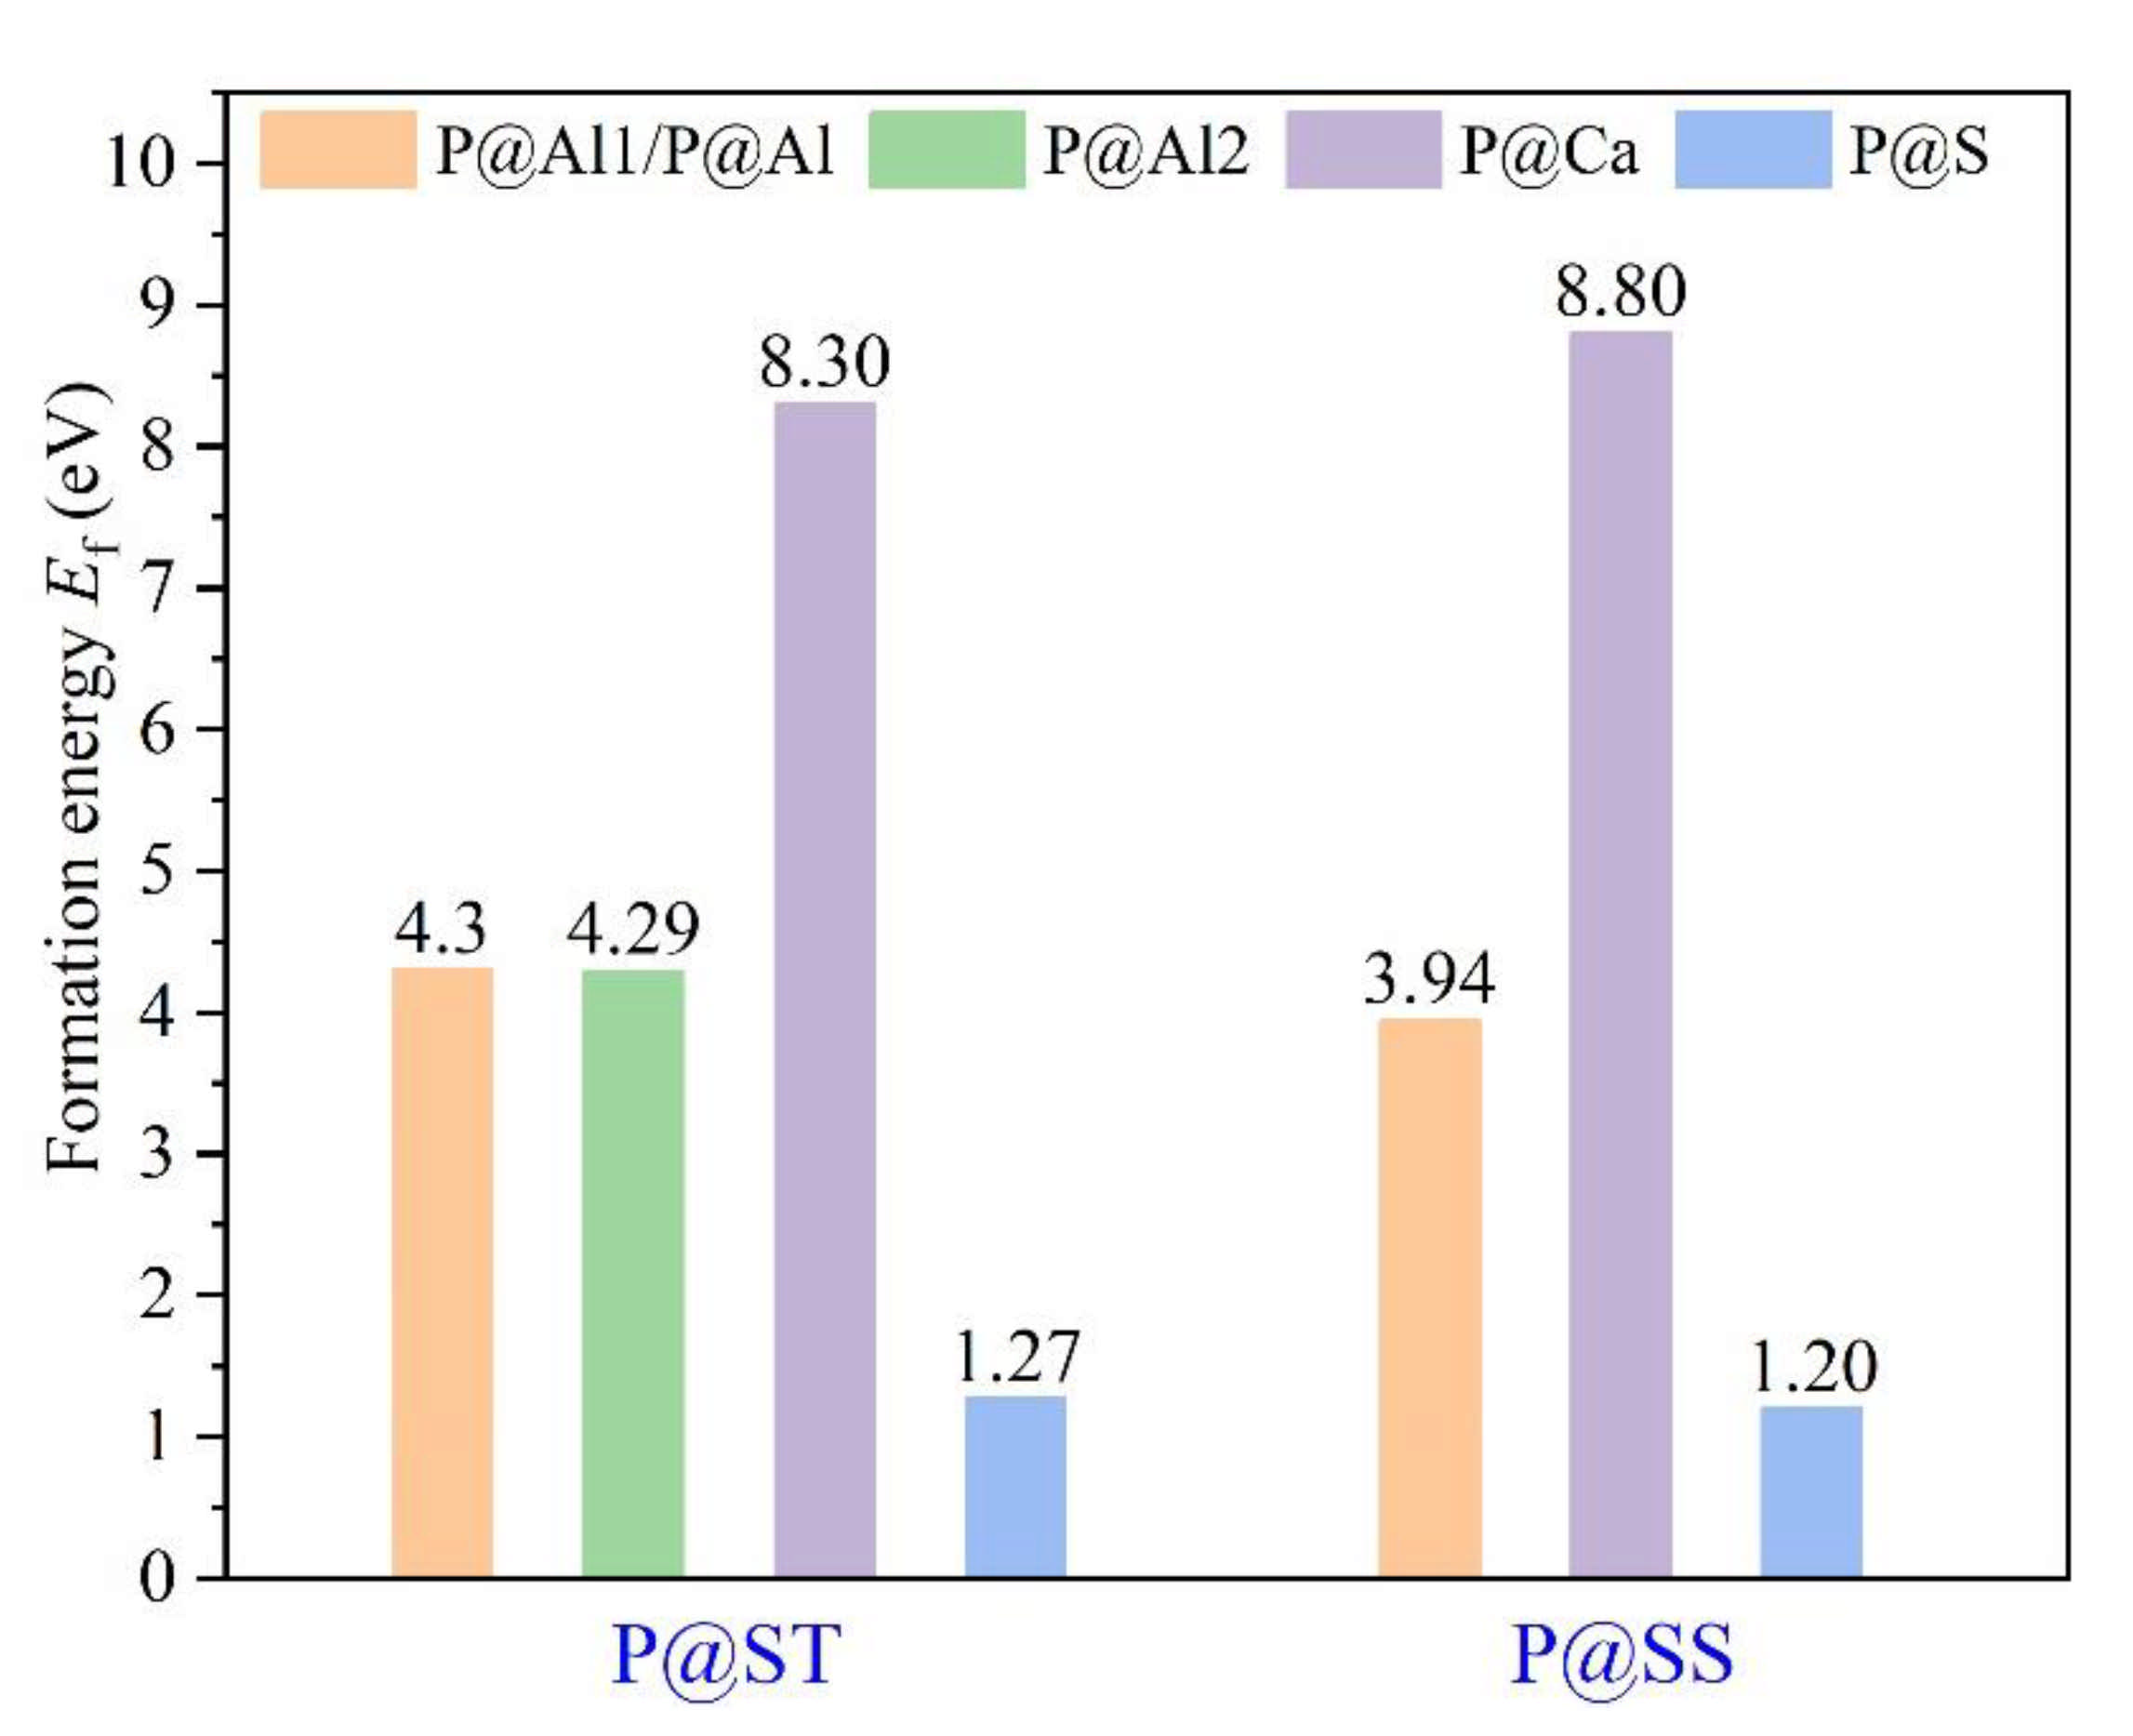
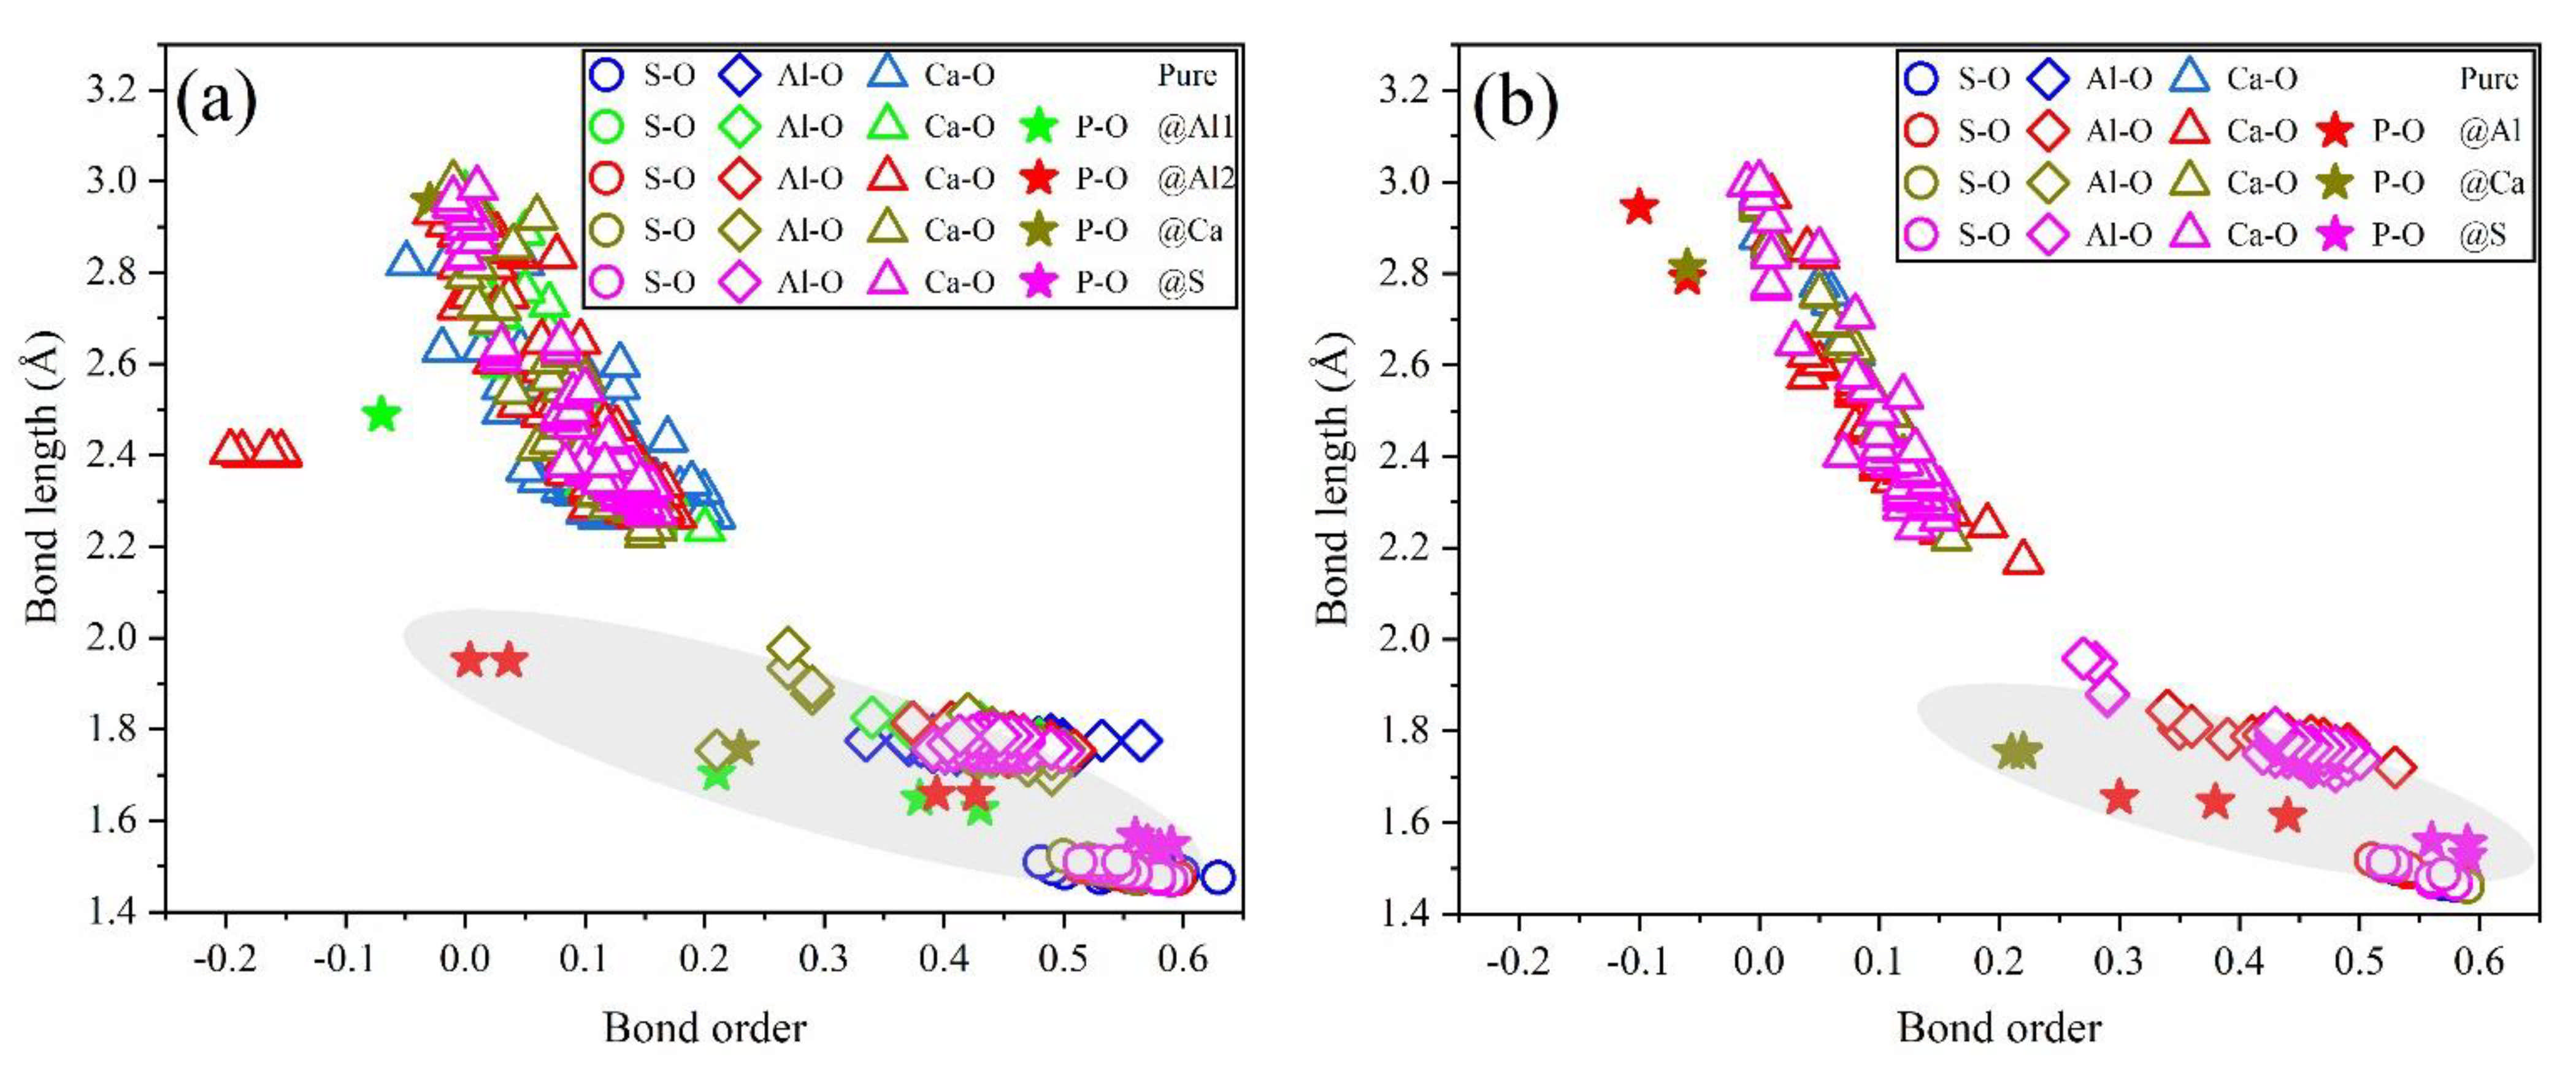
  • Based on calculation results of Ef, additional energies were required for P atoms to substitute Ca/Al atoms compared with those for substituting S atoms for both orthorhombic and cubic structures of ye’elimite. By combining the BL–BO and PDOS calculation results, the doped P atoms preferably substituted S atoms; the second possible substituted atoms were Al atoms, while there was only a slight possibility for substitution of Ca atoms.
  • The substitution of P atoms for S atoms can be verified using the elemental distribution in P-doped ye’elimite and the increasing residual CaSO4 contents. The crystal system transformation and a decrease in the ye’elimite interplanar spacing can also imply that the substitution of P atoms for Al atoms occurred substantially.
  • Based on analysis of phosphorus substitution preference in ye’elimite, the co-substituting P-doped ye’elimite were proposed to be the most probably models. Through values of Ef, comparison of XRD patterns and electronic structural matching, the rationality of the model for co-substituting P-doped ye’elimite can be verified.

Author Contributions

J.Z., conceptualization, funding acquisition, writing—original draft; J.H., data curation, investigation, visualization; C.Y., data curation, investigation; C.C., project administration; J.C., data curation, supervision. All authors have read and agreed to the published version of the manuscript.

Funding

This study was financially supported by the Fundamental Research Funds for the Central Universities (No. 3132020167).

Institutional Review Board Statement

Not applicable.

Informed Consent Statement

Not applicable.

Data Availability Statement

Not applicable.

Acknowledgments

Thanks for the support of the Supercomputing Center of Dalian University of Technology.

Conflicts of Interest

The authors declare no conflict of interest.

Appendix A

Figure A1. Results of kinetic energy cutoff test and K-points (SS). Structure of SS was selected to conduct the kinetic energy cutoff test and K-points test, as the structure contains all pseudopotentials.
Materials 14 05874 g0a1
Table A1. K-point grids for simulation models.
PhasesSupercellsRelaxPDOS
Orthorhombic ye’elimite1 × 1 × 12 × 2 × 34 × 4 × 5
Cubic ye’elimite2 × 1 × 11 × 3 × 33 × 5 × 5
Table A2. Details on Gibbs free energies involved in calculations for μP and μ0.
OxidesP2O5Al2O3CaOSO3O2
Identification of Materials Projectmp-2452mp-1143mp-2605mp-561397mp-1009490
Space groupFDD2R-3CFm-3mP21/cC2/M
Cells1 × 1 × 11 × 1 × 11 × 1 × 11 × 1 × 11 × 1 × 1
Number of atoms22141
a/Å16.594.814.8413.434.72
b/Å8.174.814.844.184.73
c/Å5.5513.124.849.754.96
α/°90.0090.0090.0090.0090.00
β/°90.0090.0090.00153.05123.11
γ/°90.00120.0090.0090.0090.00
V/Å3751.81262.26113.33247.9893.14
GBulk (eV)−98.40−74.83−12.81−92.84−9.08
G (eV)−49.20−37.42−12.81−23.21−9.08
Table A3. Relaxed lattice parameters of the stable configurations including pure and P-doped clinker phases.
ConfigurationsLattice Parameters
a/Åb/Åc/Åα/°β/°γ/°volume/Å3
P@ST
(1 × 1 × 1)
Ref. [12]13.0413.049.1790.0090.0090.001557.78
Pure 113.0913.269.2590.0090.0090.001606.36
@Al112.9713.049.5290.0090.0090.061609.79
@Al213.1713.339.0290.0490.0090.001584.44
@Ca13.0413.229.3389.5589.4089.501606.85
@S13.0413.229.3289.5989.4589.571607.25
P@SS
(2 × 1 × 1)
Ref [16]18.429.219.2190.0090.0090.00779.96
Pure 118.559.279.2390.0289.9889.371586.91
@Al19.049.309.0491.3492.0186.711595.49
@Ca18.759.309.1489.3490.3589.341593.46
@S18.539.269.2389.8790.1389.491584.47
1 Lattice parameters of pure orthorhombic and cubic ye’elimite used in this paper were obtained through optimizing the crystal structures in Ref. [12] and Ref. [16], respectively.
Table A4. Total energy (Et), Bonding energy (Eb) and defect formation energy (Ef) of substituted elements X (X = Ca, Al, and S).
SampleConfigurationsEt/eVEb 1/eVEf/eV
P@STPure−48,268.83−770.23-
@Al1−48,477.11−764.334.30
@Al2−48,477.13−764.354.29
@Ca−46,685.89−763.608.30
@S−48,103.16−775.021.27
P@SSPure−48,268.60−770.00-
@Al−48,477.61−764.833.94
@Ca−46,684.65−762.368.80
@S−48,103.06−774.921.20
1 The formula for calculating the binding energy is: Eb = EtNAlEAlNOEONCaECaNSESNPEP. where Eb is the bonding energy, Et is the total energy of unit cell, and EAl, EO, ECa, ES and EP are the energies of pseudo atomic Al, O, Ca, S and P respectively. NAl, NO, NCa, NS and NP are the numbers of Al, O, Ca, S and P atoms in the unit cell, respectively.
Figure A2. Distributions of BL–BO in pure and the most probably P-doped ye’elimite: (a) P@S&P@Al(ST) and (b) P@S&P@Al(SS).
Materials 14 05874 g0a2
Figure A3. Calculation results of PDOS for pure and the most probably P-doped ye’elimite (position of the Fermi energy level (0 eV) is indicated by a dotted line), (a) P@S&P@Al(ST) and (b) P@S&P@Al(SS).
Materials 14 05874 g0a3
Table A5. Comparison of Ef in this paper and references.
Crystal SystemConfigurationsValue of Ef/eVSources
Orthorhombic systemP@S&P@Al−0.22This paper
Cubic systemP@S&P@Al−0.18This paper
Cubic systemBa@Ca−1.34Ref. [26]
Cubic systemPb@Ca−0.18Ref. [27]

References

  1. Bizzozero, J.; Gosselin, C.; Scrivener, K.L. Expansion Mechanisms in Calcium Aluminate and Sulfoaluminate Systems with Calcium Sulfate. Cem. Concr. Res. 2014, 56, 190–202. [Google Scholar] [CrossRef]
  2. Glasser, F.P.; Zhang, L. High-Performance Cement Matrices Based on Calcium Sulfoaluminate-Belite Compositions. Cem. Concr. Res. 2001, 31, 1881–1886. [Google Scholar] [CrossRef]
  3. Quillin, K. Performance of Belite-Sulfoaluminate Cements. Cem. Concr. Res. 2001, 31, 1341–1349. [Google Scholar] [CrossRef]
  4. Cui, C.; Meng, K.; Xu, C.; Liang, Z.; Li, H.; Pei, H. Analytical Solution for Longitudinal Vibration of a Floating Pile in Saturated Porous Media Based on a Fictitious Saturated Soil Pile Model. Comput. Geotech. 2021, 131, 2411–2502. [Google Scholar] [CrossRef]
  5. Khalil, N.; Aouad, G.; El Cheikh, K.; Remond, S. Use of Calcium Sulfoaluminate Cements for Setting Control of 3D-Printing Mortars. Constr. Build. Mater. 2017, 157, 382–391. [Google Scholar] [CrossRef]
  6. Liu, H.; Zhao, J.; Wang, Y.; Yi, N.; Cui, C. Strength Performance and Microstructure of Calcium Sulfoaluminate Cement-Stabilized Soft Soil. Sustainability 2021, 13, 2295. [Google Scholar] [CrossRef]
  7. Juenger, M.C.G.; Winnefeld, F.; Provis, J.L.; Ideker, J.H. Advances in Alternative Cementitious Binders. Cem. Concr. Res. 2011, 41, 1232–1243. [Google Scholar] [CrossRef]
  8. Shi, C.; Jiménez, A.F.; Palomo, A. New Cements for the 21St Century: The Pursuit of an Alternative to Portland Cement. Cem. Concr. Res. 2011, 41, 750–763. [Google Scholar] [CrossRef]
  9. Shi, C.; Qu, B.; Provis, J.L. Recent Progress in Low-Carbon Binders. Cem. Concr. Res. 2019, 122, 227–250. [Google Scholar] [CrossRef]
  10. Bullerjahn, F.; Boehm-Courjault, E.; Zajac, M.; Ben Haha, M.; Scrivener, K. Hydration Reactions and Stages of Clinker Composed Mainly of Stoichiometric Ye’elimite. Cem. Concr. Res. 2019, 116, 120–133. [Google Scholar] [CrossRef]
  11. El Khessaimi, Y.; El Hafiane, Y.; Smith, A. Examination of Ye’elimite Formation Mechanisms. J. Eur. Ceram. Soc. 2019, 39, 5086–5095. [Google Scholar] [CrossRef]
  12. Cuesta, A.; de la Torre, A.G.; Losilla, E.R.; Peterson, V.K.; Rejmak, P.; Ayuela, A.; Frontera, C.; Aranda, M.A.G. Structure, Atomistic Simulations, and Phase Transition of Stoichiometric Yeelimite. Chem. Mater. 2013, 25, 1680–1687. [Google Scholar] [CrossRef] [Green Version]
  13. Bullerjahn, F.; Scholten, T.; Scrivener, K.L.; Ben Haha, M.; Wolter, A. Formation, Composition and Stability of Ye’elimite and Iron-Bearing Solid Solutions. Cem. Concr. Res. 2020, 131, 106009. [Google Scholar] [CrossRef]
  14. Zhao, P.; Bao, X.; Chen, H.; Wang, S.; Lu, L.; De La Torre, A.G.; Cheng, X. Hydration Mechanisms of Ba-Doped Ye’elimite: Effect of Ba/Ca Ratio on Hydration Behavior. Constr. Build. Mater. 2020, 264, 120258. [Google Scholar] [CrossRef]
  15. Zea-Garcia, J.D.; Santacruz, I.; Aranda, M.A.G.; De la Torre, A.G. Alite-Belite-Ye’elimite Cements: Effect of Dopants on the Clinker Phase Composition and Properties. Cem. Concr. Res. 2019, 115, 192–202. [Google Scholar] [CrossRef]
  16. Cuesta, A.; De la Torre, Á.G.; Losilla, E.R.; Santacruz, I.; Aranda, M.A.G. Pseudocubic Crystal Structure and Phase Transition in Doped Ye’elimite. Cryst. Growth Des. 2014, 14, 5158–5163. [Google Scholar] [CrossRef] [Green Version]
  17. Cuesta, A.; Álvarez-Pinazo, G.; Sanfélix, S.G.; Peral, I.; Aranda, M.A.G.; De, L.T.A.G. Hydration Mechanisms of Two Polymorphs of Synthetic Ye’elimite. Cem. Concr. Res. 2014, 63, 127–136. [Google Scholar] [CrossRef] [Green Version]
  18. Chang, J.; Zhao, J.; Shang, X.; Yu, X.; Zhang, Y.; Zhang, T. Rietveld Refinement for Sr(Ba)-Bearing Ye’elimite. Adv. Cem. Res. 2016, 28, 583–593. [Google Scholar] [CrossRef]
  19. Zhao, J.; Chang, J. Crystallographic Analysis of Sr-Bearing Ye’elimite. J. Inorg. Organometall. Polym. Mater. 2017, 27, 1694–1702. [Google Scholar] [CrossRef]
  20. Zhao, J.; Chang, J. Kinetic Analysis for Formation Process of Sr-Bearing Ye’elimite. J. Inorg. Organometall. Polym. Mater. 2017, 27, 1861–1869. [Google Scholar] [CrossRef]
  21. Tao, Y.; Li, N.; Zhang, W.; Wang, F.; Hu, S. Understanding the Zinc Incorporation into Silicate Clinker During Waste Co-Disposal of Cement Kiln: A Density Functional Theory Study. J. Clean. Prod. 2019, 232, 329–336. [Google Scholar] [CrossRef]
  22. Zhao, R.; Zhang, L.; Fan, G.; Chen, Y.; Huang, G.; Zhang, H.; Zhu, J.; Guan, X. Probing the Exact Form and Doping Preference of Magnesium in Ordinary Portland Cement Clinker Phases: A Study from Experiments and DFT Simulations. Cem. Concr. Res. 2021, 144, 106420. [Google Scholar] [CrossRef]
  23. Laanaiya, M.; Bouibes, A.; Zaoui, A. Structural Stability of Belite Sulfoaluminate Clinkering Polymorphs. Solid State Ion. 2021, 365, 115641. [Google Scholar] [CrossRef]
  24. Wang, Q.; Gu, X.; Zhou, H.; Chen, X.; Shen, X. Cation Substitution Induced Reactivity Variation on the Tricalcium Silicate Polymorphs Determined from First-Principles Calculations. Constr. Build. Mater. 2019, 216, 239–248. [Google Scholar] [CrossRef]
  25. Tao, Y.; Zhang, W.; Li, N.; Shang, D.; Xia, Z.; Wang, F. Fundamental Principles that Govern the Copper Doping Behavior in Complex Clinker System. J. Am. Ceram. Soc. 2018, 101, 2527–2536. [Google Scholar] [CrossRef]
  26. Zhu, J.; Chen, Y.; Zhang, L.; Guo, B.; Fan, G.; Guan, X.; Zhao, R. Revealing the Doping Mechanism of Barium in Sulfoaluminate Cement Clinker Phases. J. Clean. Prod. 2021, 295, 126405. [Google Scholar] [CrossRef]
  27. Zhu, J.; Chen, Y.; Zhang, L.; Yang, K.; Guan, X.; Zhao, R. Insights on Substitution Preference of Pb Ions in Sulfoaluminate Cement Clinker Phases. Materials 2021, 14, 44. [Google Scholar] [CrossRef] [PubMed]
  28. Cai, Q.; Jiang, J.; Ma, B.; Shao, Z.; Hu, Y.; Qian, B.; Wang, L. Efficient Removal of Phosphate Impurities in Waste Phosphogypsum for the Production of Cement. Sci. Total Environ. 2021, 780, 146600. [Google Scholar] [CrossRef] [PubMed]
  29. Wu, S.; Yao, X.; Ren, C.; Yao, Y.; Wang, W. Recycling Phosphogypsum as a Sole Calcium Oxide Source in Calcium Sulfoaluminate Cement and its Environmental Effects. J. Environ. Manag. 2020, 271, 110986. [Google Scholar] [CrossRef] [PubMed]
  30. Shen, Y.; Qian, J. Utilisation of Phosphogypsum for Sulfate-Rich Belite Sulfoaluminate Cement Production. Adv. Cem. Res. 2015, 27, 515–525. [Google Scholar] [CrossRef]
  31. Huang, Y.; Qian, J.; Kang, X.; Yu, J.; Fan, Y.; Dang, Y.; Zhang, W.; Wang, S. Belite-Calcium Sulfoaluminate Cement Prepared with Phosphogypsum: Influence of P2O5 and F on the Clinker Formation and Cement Performances. Constr. Build. Mater. 2019, 203, 432–442. [Google Scholar] [CrossRef]
  32. Shen, Y.; Qian, J.; Huang, Y.; Yang, D. Synthesis of Belite Sulfoaluminate-Ternesite Cements with Phosphogypsum. Cem. Concr. Compos. 2015, 63, 67–75. [Google Scholar] [CrossRef]
  33. Huang, Y.; Qian, J.; Lu, L.; Zhang, W.; Wang, S.; Wang, W.; Cheng, X. Phosphogypsum as a Component of Calcium Sulfoaluminate Cement: Hazardous Elements Immobilization, Radioactivity and Performances. J. Clean Prod. 2020, 248, 119287. [Google Scholar] [CrossRef]
  34. Lazic, B.; Krüger, H.; Kahlenberg, V.; Konzett, J.; Kaindl, R. Incommensurate Structure of Ca2Al2O5 at High Temperatures--Structure Investigation and Raman Spectroscopy. Acta Crystallogr. 2010, 64, 417–425. [Google Scholar] [CrossRef]
  35. Cheng, G.C.H.; Zussman, J. The Crystal Structure of Anhydrite (CaSO4). Acta Crystallogr. 1963, 16, 767–769. [Google Scholar] [CrossRef] [Green Version]
  36. Boysen, H.; Lerch, M.; Stys, A.; Senyshyn, A. Structure and Oxygen Mobility in Mayenite (Ca12Al14O33): A High-Temperature Neutron Powder Diffraction Study. Acta Crystallogr. 2007, 63, 675–682. [Google Scholar] [CrossRef]
  37. Mondal, P.; Jeffery, J.W. The Crystal Structure of Tricalcium Aluminate, Ca3Al2O6. Acta Crystallogr. 2010, 31, 689–697. [Google Scholar] [CrossRef]
  38. Yashima, M.; Sakai, A.; Kamiyama, T.; Hoshikawa, A. Crystal Structure Analysis of Beta-Tricalcium Phosphate Ca3(PO4)2 by Neutron Powder Diffraction. J. Solid State Chem. 2003, 175, 272–277. [Google Scholar] [CrossRef]
  39. Verbraeken, M.C.; Suard, E.; Irvine, J.T.S. Structural and Electrical Properties of Calcium and Strontium Hydrides. J. Mater. Chem. 2009, 19, 2766–2770. [Google Scholar] [CrossRef]
  40. Muraoka, Y.; Kihara, K. The Temperature Dependence of the Crystal Structure of Berlinite, a Quartz-Type Form of Alpo 4. Phys. Chem. Miner. 1997, 24, 243–253. [Google Scholar] [CrossRef]
  41. Clark, S.J.; Segallii, M.D.; Pickardii, C.J.; Hasnipiii, P.J.; Probertiv, M. First Principles Methods Using Castep. Z. Krist. Cryst. Mater. 2005, 220, 567–570. [Google Scholar] [CrossRef] [Green Version]
  42. Perdew, J.P.; Yue, W. Accurate and Simple Analytic Representation of the Electron-Gas Correlation Energy. Phys. Rev. B 1992, 45, 13244–13249. [Google Scholar] [CrossRef]
  43. Chl, P. Projector Augmented-Wave Method. Phys. Rev. B 1994, 50, 17953–17979. [Google Scholar] [CrossRef] [Green Version]
  44. Calos, N.J.; Kennard, C.; Whittaker, A.K.; Davis, R.L. Structure of Calcium Aluminate Sulfate Ca4Al6O16S. J. Solid State Chem. 1995, 119, 1–7. [Google Scholar] [CrossRef]
  45. Tao, Y.; Zhang, W.; Shang, D.; Xia, Z.; Li, N.; Ching, W.; Wang, F.; Hu, S. Comprehending the Occupying Preference of Manganese Substitution in Crystalline Cement Clinker Phases: A Theoretical Study. Cem. Concr. Res. 2018, 109, 19–29. [Google Scholar] [CrossRef]
  46. Zhou, H.; Gu, X.; Sun, J.; Yu, Z.; Huang, H.; Wang, Q.; Shen, X. Research on the Formation of M1-Type Alite Doped with Mgo and so3—a Route to Improve the Quality of Cement Clinker with a High Content of Mgo. Constr. Build. Mater. 2018, 182, 156–166. [Google Scholar] [CrossRef]
  47. Zhu, J.; Yang, K.; Chen, Y.; Fan, G.; Zhang, L.; Guo, B.; Guan, X.; Zhao, R. Revealing the Substitution Preference of Zinc in Ordinary Portland Cement Clinker Phases: A Study from Experiments and Dft Calculations. J. Hazard. Mater. 2020, 409, 124504. [Google Scholar] [CrossRef] [PubMed]
  48. Kohan, A.F.; Ceder, G.; Morgan, D.; Van de Walle, C.G. First-Principles Study of Native Point Defects in Zno. Phys. Rev. B 2000, 61. [Google Scholar] [CrossRef] [Green Version]
  49. Li, J.; Wei, S.; Li, S.; Xia, J. Design of Shallow Acceptors in Zno: First-Principles Band-Structure Calculations. Cem. Concr. Res. 2006, 74. [Google Scholar] [CrossRef]
  50. West, D.; Sun, Y.Y.; Zhang, S.B. Importance of the Correct Fermi Energy on the Calculation of Defect Formation Energies in Semiconductors. Appl. Phys. Lett. 2012, 101, 082105. [Google Scholar] [CrossRef]
  51. Freysoldt, C.; Grabowski, B.; Hickel, T.; Neugebauer, J.; Walle, C. First-Principles Calculations for Point Defects in Solids. Rev. Mod. Phys. 2014, 86, 253. [Google Scholar] [CrossRef]
  52. Li, X.; Zhang, Y.; Shen, X.; Wang, Q.; Pan, Z. Kinetics of Calcium Sulfoaluminate Formation from Tricalcium Aluminate, Calcium Sulfate and Calcium Oxide. Cem. Concr. Res. 2014, 55, 79–87. [Google Scholar] [CrossRef]
  53. Puertas, F.; Varela, M.T.B.; Molina, S.G. Kinetics of the Thermal Decomposition of C4A3S in Air. Cem. Concr. Res. 1995, 25, 572–580. [Google Scholar] [CrossRef]
  54. Guerra, C.F.; Handgraaf, J.W.; Baerends, E.J.; Bickelhaupt, F.M. Voronoi Deformation Density (Vdd) Charges: Assessment of the Mulliken, Bader, Hirshfeld, Weinhold, and Vdd Methods for Charge Analysis. J. Comput. Chem. 2004, 25, 189–210. [Google Scholar] [CrossRef]
  55. Shannon, R.D. Revised Effective Ionic Radii and Systematic Studies of Interatomic Distances in Halides and Chalcogenides. Acta Crystallogr. 1976, 32, 751–767. [Google Scholar] [CrossRef]
Figure 1. Crystalline structures of ye’elimite: (a) orthorhombic (1 × 1 × 1) and (b) cubic (1 × 1 × 1) systems.
Materials 14 05874 g001
Figure 2. BSEM–EDS results for P0.10: (a) Image of polished sample, distributions of (b) Ca, (c) Al, (d) S, and (e) P, and (f) EDS result for the crossed point in Figure 2a.
Materials 14 05874 g002
Figure 3. Comparison of XRD patterns of orthorhombic and cubic systems of ye’elimite.
Materials 14 05874 g003
Figure 4. XRD patterns of P-doped ye’elimite, (a) identification of phases (o, orthorhombic ye’elimite; c, cubic ye’elimite; A, anhydrite; AP, aluminum phosphate; CP, calcium phosphate; M, monocalcium aluminate; T, tricalcium aluminate), (b) comparison of characteristic peaks of orthorhombic ye’elimite, and (c) comparison of three major peaks of ye’elimite.
Materials 14 05874 g004aMaterials 14 05874 g004b
Figure 5. Selected range (15–45°/2θ) of the Rietveld plots for P0.15. Observed data resulted from XRD test, calculated line resulted from Rietveld refinement, and the differential line resulted from the difference between observed data and calculated line.
Materials 14 05874 g005
Figure 6. Crystalline structures of orthorhombic ye’elimite (ST) and the doped models (1 × 1 × 1), (a) pure, (b) P2@Al1, (c) P2@Al2, (d) P2@Ca, and (e) P2@S.
Materials 14 05874 g006
Figure 7. Crystalline structures of cubic ye’elimite and the doped models (2 × 1 × 1), (a) pure, (b) P@S, (c) P@Ca, and (d) P@Al.
Materials 14 05874 g007
Figure 8. Defect formation energies (Ef, eV) of P-doped ye’elimite with different configurations.
Materials 14 05874 g008
Figure 9. Distributions of BL–BO in pure and P-doped ye’elimite with different configurations: (a) P@ST and (b) P@SS.
Materials 14 05874 g009
Figure 10. Calculation results of PDOS for different elements in the configurations of pure and P-doped ye’elimite (position of the Fermi energy level (0 eV) is indicated by a dotted line), (a) pure orthorhombic system (ST), (b) P@ST, (c) pure cubic system (SS), and (d) P@SS.
Materials 14 05874 g010
Figure 11. Static energies (E, eV) of configurations with P substituting different atoms in P@ST and P@SS.
Materials 14 05874 g011
Figure 12. Models of co-substituting P-doped ye’elimite. (a) P@S&P@Al(ST), (b) P@S&P@Al(SS).
Materials 14 05874 g012
Figure 13. Comparison of experimental and simulated XRD patterns.
Materials 14 05874 g013
Table 1. Molar ratios of raw materials and sintering conditions for different types of ye’elimite.
NomenclatureMolar Ratios of Raw MaterialsSintering Conditions
STCaCO3: Al2O3: CaSO4 = 3:3:11300 °C for 4 h
SSCaCO3: Na2CO3: Al2O3: Fe2O3: SiO2: CaSO4
= 2.8:0.1:2.8:0.1:0.2:1
1250 °C for 4 h
Px 1CaCO3: Ca3(PO4)2: Al2O3:CaSO4
= (3–3x): x: 3:1
1300 °C for 4 h
1 x Corresponds to the amounts of doped phosphoric anhydride and is equal to 0.10, 0.15, and 0.20 mol in this study.
Table 2. COD codes and references of phases involved in Rietveld method.
PhasesFormulaCOD CodeReference
Ye’elimite (orthorhombic)Ca4Al6SO164001772[12]
Ye’elimite (cubic)Ca3.8Na0.2Al5.6Fe0.2Si0.2SO164511960[16]
Monocalcium aluminateCaAl2O44308075[34]
AnhydriteCaSO45000040[35]
MayeniteCa12Al14O332102955[36]
Tricalcium aluminateCa3Al2O69015966[37]
Calcium phosphateCa3(PO4)21517238[38]
Calcium oxideCaO7200686[39]
Aluminum phosphateAlPO49006404[40]
Table 3. RQPA results (wt.%) for clinkers containing P-doped ye’elimite.
PhasesSamples
STP0.10P0.15P0.20
Orthorhombic ye’elimite96.475.861.544.7
Cubic ye’elimite-18.530.239.8
Calcium aluminate phases 12.85.76.411.6
Anhydrite--0.61.2
Calcium oxide0.8---
Calcium/aluminum phosphate 2--1.32.7
Ratio of cubic ye’elimite
to orthorhombic ye’elimite
00.240.490.89
Total contents of ye’elimite96.494.391.784.6
1 Calcium aluminate phases included Ca12Al14O33, CaAl2O4, CaAl4O7, and Ca3Al2O4. 2 Calcium/aluminum phosphate referred to Ca3(PO4)2/AlPO4, respectively.
Table 4. Radii of ions involved in P-doped ye’elimite [55].
IonsCoordination NumbersRadius (pm)
P5+417
529
638
Ca2+6100
7106
8112
S6+412
Al3+439
Publisher’s Note: MDPI stays neutral with regard to jurisdictional claims in published maps and institutional affiliations.

