
Synthesis of Dimethyl Carbonate by Transesterification of Propylene Carbonate with Methanol on CeO2-La2O3 Oxides Prepared by the Soft Template Method

 ,
, 
 ,
, 

Abstract
:
1. Introduction
2. Materials and Methods
2.1. Materials
2.2. Synthesis of Catalysts
2.3. Characterization of Catalysts
2.4. Catalytic Runs
3. Results and Discussion
3.1. Characterization
3.2. Catalytic Runs
4. Conclusions
Supplementary Materials
Author Contributions
Funding
Institutional Review Board Statement
Informed Consent Statement
Data Availability Statement
Acknowledgments
Conflicts of Interest
References
- Keller, N.; Rebmann, G.; Keller, V. Catalysts, mechanisms, and industrial processes for the dimethylcarbonate synthesis. J. Mol. Catal. A-Chem. 2010, 317, 1–18. [Google Scholar] [CrossRef]
- Delledonne, D.; Rivetti, F.; Romano, U. Developments in the production and application of dimethylcarbonate. Appl. Catal. A Gen. 2001, 221, 241–251. [Google Scholar] [CrossRef]
- Fiorani, G.; Perosa, A.; Selva, M. Dimethyl carbonate: A versatile reagent for a sustainable valorization of renewables. Green Chem. 2018, 20, 288–322. [Google Scholar] [CrossRef]
- Lu, P.; Wang, H.; Hu, K. Synthesis of glycerol carbonate from glycerol and dimethyl carbonate over the extruded CaO-based catalyst. Chem. Eng. J. 2013, 228, 147–154. [Google Scholar] [CrossRef]
- De Caro, P.; Bandres, M.; Urrutigoïty, M.; Cecutti, C.; Thiebaud-Roux, S. Recent Progress in Synthesis of Glycerol Carbonate and Evaluation of Its Plasticizing Properties. Front. Chem. 2019, 7, 308. [Google Scholar] [CrossRef] [PubMed] [Green Version]
- Li, Z.; Cheng, B.; Su, K.; Gu, Y.; Xi, P.; Guo, M. The synthesis of diphenyl carbonate from dimethyl carbonate and phenol over mesoporous MoO3/SiMCM-41. J. Mol. Catal. A-Chem. 2008, 289, 100–105. [Google Scholar] [CrossRef]
- He, X.; Li, Z.; Su, K.; Cheng, B.; Ming, J. Study on the reaction between bisphenol A and dimethyl carbonate over organotin oxide. Catal. Commun. 2013, 33, 20–23. [Google Scholar] [CrossRef]
- Xia, R.; Li, Z.; Cheng, B.; Su, K. The structure of organotin oxides playing a key role on the transesterification of dimethyl carbonate with hydrogenated bisphenol A. Korean J. Chem. Eng. 2014, 31, 427–430. [Google Scholar] [CrossRef]
- Deng, W.; Shi, L.; Yao, J.; Zhang, Z. A review on transesterification of propylene carbonate and methanol for dimethyl carbonate synthesis. Carbon Resour. Convers. 2019, 2, 198–212. [Google Scholar] [CrossRef]
- Bhanage, B.M.; Fujita, S.-I.; He, Y.; Ikushima, Y.; Shirai, M.; Torii, K.; Arai, M. Concurrent synthesis of dimethyl carbonate and ethylene glycol via transesterification of ethylene carbonate and methanol using smectite catalysts containing Mg and/or Ni. Catal. Lett. 2002, 83, 137–141. [Google Scholar] [CrossRef]
- Dai, W.-L.; Luo, S.-L.; Yin, S.-F.; Au, C.-T. The direct transformation of carbon dioxide to organic carbonates over heterogeneous catalysts. Appl. Catal. A Gen. 2009, 366, 2–12. [Google Scholar] [CrossRef]
- Bhanage, B.M.; Fujita, S.-I.; Ikushima, Y.; Arai, M. Synthesis of dimethyl carbonate and glycols from carbon dioxide, epoxides, and methanol using heterogeneous basic metal oxide catalysts with high activity and selectivity. Appl. Catal. A Gen. 2001, 219, 259–266. [Google Scholar] [CrossRef]
- Juárez, R.; Corma, A.; García, H. Gold nanoparticles promote the catalytic activity of ceria for the transalkylation of propylene carbonate to dimethyl carbonate. Green Chem. 2009, 11, 949–952. [Google Scholar] [CrossRef]
- Kumar, P.; Srivastava, V.C.; Mishra, I.M. Synthesis and characterization of Ce-La oxides for the formation of dimethyl carbonate by transesterification of propylene carbonate. Catal. Commun. 2015, 60, 27–31. [Google Scholar] [CrossRef]
- Song, J.H.; Jun, J.O.; Kang, K.H.; Han, S.J.; Yoo, J.; Park, S.; Kim, D.H.; Song, I.K. Synthesis of Dimethyl Carbonate from Propylene Carbonate and Methanol Over Y2O3/CeO2–La2O3 Catalysts. J. Nanosci. Nanotechnol. 2016, 16, 10810–10815. [Google Scholar] [CrossRef]
- Wang, Y.-J.; Ma, J.-M.; Luo, M.-F.; Fang, P.; He, M. Preparation of High Surface Area Nano-CeO2 by Template-Assisted Precipitation Method. J. Rare Earths 2007, 25, 58–62. [Google Scholar]
- Xie, Y.; Kocaefe, D.; Chen, C.; Kocaefe, Y. Review of Research on Template Methods in Preparation of Nanomaterials. J. Nanomater. 2016, 2016, 2302595. [Google Scholar] [CrossRef] [Green Version]
- Shah, A.T.; Mujahid, A.; Farooq, M.U.; Ahmad, W.; Li, B.; Irfan, M.; Qadir, M.A. Micelle directed synthesis of (C19H42N)4H3(PW11O39) nanoparticles and their catalytic efficiency for oxidative degradation of azo dye. J. Sol-Gel Sci. Technol. 2012, 63, 194–199. [Google Scholar] [CrossRef]
- Xu, J.; Long, K.-Z.; Wu, F.; Xue, B.; Li, Y.-X.; Cao, Y. Efficient synthesis of dimethyl carbonate via transesterification of ethylene carbonate over a new mesoporous ceria catalyst. Appl. Catal. A General 2014, 484, 1–7. [Google Scholar] [CrossRef]
- Klug, H.P.; Alexander, L.E. X-Ray Diffraction Procedures: For Polycrystalline and Amorphous Materials, 2nd ed.; Wiley & Sons Inc.: New York, NY, USA, 1974; pp. 687–703. [Google Scholar]
- Colón, G.; Navío, J.A.; Monaci, R.; Ferino, I. CeO2-La2O3 catalytic system Part I. Preparation and characterisation of catalysts. Phys. Chem. Chem. Phys. 2000, 2, 4453–4459. [Google Scholar] [CrossRef]
- Rouquerol, F.; Rouquerol, J.; Sing, K.S.W.; Llewellyn, P.; Maurin, G. Adsorption by Powders and Porous Solids: Principles, Methodology and Applications, 2nd ed.; Academic Press-Elsevier: Amsterdam, The Netherlands, 2014; pp. 12–13. [Google Scholar]
- Weber, W.H.; Bass, K.C.; McBride, J.R. Raman study of CeO2: Second-order scattering, lattice dynamics, and particle-size effects. Phys. Rev. B 1993, 48, 178–185. [Google Scholar] [CrossRef]
- Spanier, J.E.; Robinson, R.D.; Zheng, F.; Chan, S.W.; Herman, I.P. Size-dependent properties of CeO2-y nanoparticles as studied by Raman scattering. Phys. Rev. B 2001, 64, 245407–245414. [Google Scholar] [CrossRef] [Green Version]
- Taniguchi, T.; Watanabe, T.; Sugiyama, N.; Subramani, A.K.; Wagata, H.; Matsushita, N.; Yoshimura, M. Identifying Defects in Ceria-Based Nanocrystals by UV Resonance Raman Spectroscopy. J. Phys. Chem. C 2009, 113, 19789–19793. [Google Scholar] [CrossRef]
- Kosacki, I.; Suzuki, T.; Anderson, H.U.; Colomban, P. Raman scattering and lattice defects in nanocrystalline CeO2 thin films. Solid State Ion. 2002, 149, 99–105. [Google Scholar] [CrossRef]
- Askrabic, S.; Dohcevic-Mitrovic, Z.; Kremenovic, A.; Lazarevic, N.; Kahlenberg, V.; Popovic, Z.V. Oxygen vacancy-induced microstructural changes of annealed CeO2−x nanocrystals. J. Raman Spectrosc. 2012, 43, 76–81. [Google Scholar] [CrossRef]
- Mukherjee, D.; Rao, B.G.; Reddy, B.M. Characterization of Ceria-Based Nano-Oxide Catalysts by Raman Spectroscopy. Topics Catal. 2017, 60, 1673–1681. [Google Scholar] [CrossRef]
- Singh, K.; Kumar, R.; Chowdhury, A. Synthesis of La-doped ceria nanoparticles: Impact of lanthanum depletion. J. Mat. Sci. 2016, 51, 4134–4141. [Google Scholar] [CrossRef]
- Li, X.; Zhao, Z.-J.L.; Zeng, L.; Zhao, J.; Tian, H.; Chen, S.; Li, K.; Sang, S.; Gong, J. On the role of Ce in CO2 adsorption and activation over lanthanum species. Chem. Sci. 2018, 9, 3426–3437. [Google Scholar] [CrossRef] [Green Version]
- Boldish, S.I.; White, W.B. Vibrational spectra of crystals with the A-type rare earth oxide structure I. La2O3 and Nd2O3. Spectrochim. Acta A 1979, 35, 1235–1242. [Google Scholar] [CrossRef]
- Gopinatht, C.R.; Brown, I.D. Normal Coordinate Analysis of the Raman and Infrared Vibrations of the Alpha Phases of RE2O3, (RE = La, Pr, Nd) and RE2O2S (RE = La and Yb). J. Raman Spectr. 1982, 12, 278–280. [Google Scholar] [CrossRef]
- Weckhuysen, B.M.; Rosynek, M.P.; Lunsford, J.H. Destructive adsorption of carbon tetrachloride on lanthanum and cerium oxides. Phys. Chem. Chem. Phys. 1999, 1, 3157–3162. [Google Scholar] [CrossRef]
- Denning, J.H.; Ross, S.D. The vibrational spectra and structures of rare earth oxides in the A modification. J. Phys. C Solid State Phys. 1972, 5, 1123–1133. [Google Scholar] [CrossRef]
- Cui, J.; Hope, G.A. Raman and Fluorescence Spectroscopy of CeO2, Er2O3, Nd2O3, Tm2O3, Yb2O3, La2O3, and Tb4O7. J. Spectrosc. 2015, 2015, 940172. [Google Scholar] [CrossRef] [Green Version]
- Orera, A.; Larraz, G.; Sanjuán, M.L. Spectroscopic study of the competition between dehydration and carbonation effects in La2O3-based materials. J. Eur. Ceramic Soc. 2013, 33, 2103–2110. [Google Scholar] [CrossRef]
- Davydov, A.A.; Shepotko, M.L.; Budneva, A.A. Basic sites on the oxides surfaces: Their effect on the catalytic methane coupling. Catal. Today 1995, 24, 225–230. [Google Scholar] [CrossRef]
- Binet, C.; Daturi, M.; Lavalley, J.C. IR study of polycristalline ceria properties in oxidised and reduced states. Catal. Today 1999, 50, 207–225. [Google Scholar] [CrossRef]
- Daturi, M.; Binet, C.; Lavalley, J.C.; Blanchard, G. Surface FTIR investigations on CexZr1-xO2 system. Surf. Interface Anal. 2000, 30, 273–277. [Google Scholar] [CrossRef]
- Li, M.; Tumuluri, U.; Wu, Z.; Dai, S. Effect of Dopants on the Adsorption of Carbon Dioxide on Ceria Surfaces. ChemSusChem 2015, 8, 3651–3660. [Google Scholar] [CrossRef]
- Wu, Z.; Mann, A.K.P.; Li, M.; Overbury, S.H. Spectroscopic Investigation of Surface–Dependent Acid–Base Property of Ceria Nanoshapes. J. Phys. Chem. C 2015, 119, 7340–7350. [Google Scholar] [CrossRef]
- Füglein, E.; Walter, D. Thermal analysis of Lanthanum hydroxide. J. Therm. Anal. Calorim. 2012, 110, 199–202. [Google Scholar] [CrossRef]
- Haibel, E.; Berendts, S.; Walter, D. Thermogravimetric and X–ray diffraction investigation on carbonated lanthanum oxide and lanthanum hydroxide formed in humid CO2 atmosphere. J. Therm. Anal. Calorim. 2018, 134, 261–267. [Google Scholar] [CrossRef]
- Bernal, S.; Botana, F.J.; Garcia, R.; Rodriguez-Izquierdo, J.M. Thermal evolution of a sample of La2O3 exposed to the atmosphere. Thermochim. Acta 1983, 66, 139–145. [Google Scholar] [CrossRef]
- Meloni, D.; Sini, M.F.; Cutrufello, M.G.; Monaci, R.; Rombi, E.; Ferino, I. Characterization of the active sites in MgNiAl mixed oxides by microcalorimetry and test reaction. J. Therm. Anal. Calorim. 2012, 108, 783–791. [Google Scholar] [CrossRef]
- Meloni, D.; Sini, M.F.; Cutrufello, M.G.; Monaci, R.; Rombi, E.; Ferino, I. Acid–base features of ex-hydrotalcites Mg-containing and Mg-free mixed oxides. J. Therm. Anal. Calorim. 2013, 112, 489–498. [Google Scholar] [CrossRef]
- Murugan, C.; Bajaj, H.C.; Jasra, R.V. Transesterification of Propylene Carbonate by Methanol Using KF/Al2O3 as an Efficient Base Catalyst. Catal. Lett. 2010, 137, 224–231. [Google Scholar] [CrossRef]
- Murugan, C.; Bajaj, H.C. Transesterification of propylene carbonate with methanol using Mg-Al-CO3 hydrotalcite as solid base catalyst. Indian J. Chem. 2010, 49A, 1182–1188. [Google Scholar]
- Guidi, S.; Calmanti, R.; Noè, M.; Perosa, A.; Selva, M. Thermal (Catalyst-Free) Transesterification of Diols and Glycerol with Dimethyl Carbonate: A Flexible Reaction for Batch and Continuous-Flow Applications. ACS Sustainable Chem. Eng. 2016, 4, 6144–6151. [Google Scholar] [CrossRef]
- Wei, T.; Wang, M.; Wei, W.; Sun, Y.; Zhong, B. Effect of base strength and basicity on catalytic behavior of solid bases for synthesis of dimethyl carbonate from propylene carbonate and methanol. Fuel Process Technol. 2003, 83, 175–182. [Google Scholar] [CrossRef]
- Kumar, P.; Srivastava, V.C.; Mishra, I.M. Dimethyl Carbonate Synthesis from Propylene Carbonate with Methanol Using Cu−Zn−Al Catalyst. Energy Fuels 2015, 29, 2664–2675. [Google Scholar] [CrossRef]
- Liao, Y.; Li, F.; Pu, Y.; Wang, F.; Dai, X.; Zhao, N.; Xiao, F. Solid base catalysts derived from Ca–Al–X (X = F−, Cl− and Br−) layered double hydroxides for methanolysis of propylene carbonate. RSC Adv. 2018, 8, 785–791. [Google Scholar] [CrossRef] [Green Version]
- Kumar, P.; Srivastava, V.C.; Mishra, I.M. Dimethyl carbonate synthesis via transesterification of propylene carbonate with methanol by ceria-zinc catalysts: Role of catalyst support and reaction parameters. Korean J. Chem. Eng. 2015, 32, 1774–1783. [Google Scholar] [CrossRef] [Green Version]
- Kumar, P.; Srivastava, V.C.; Mishra, I.M. Dimethyl carbonate synthesis by transesterification of propylene carbonate with methanol: Comparative assessment of Ce-M (M = Co, Fe, Cu and Zn) catalysts. Renew Energy 2016, 88, 457–464. [Google Scholar] [CrossRef]
- Liu, S.; Huang, S.; Lianxiu Guan, L.; Li, J.; Zhao, N.; Wei, W.; Sun, Y. Preparation of a novel mesoporous solid base Na–ZrO2 with ultra high thermal stability. Micropor. Mesopor. Mat. 2007, 102, 304–309. [Google Scholar] [CrossRef]
- Fu, Y.; Zhu, H.; Shen, J. Thermal decomposition of dimethoxymethane and dimethyl carbonate catalyzed by solid acids and bases. Thermochim. Acta. 2005, 434, 88–92. [Google Scholar] [CrossRef]
- Tomishige, K.; Yasuda, H.; Yoshida, Y.; Nurunnabi, M.; Li, B.; Kunimori, K. Catalytic performance and properties of ceria based catalysts for cyclic carbonate synthesis from glycol and carbon dioxide. Green Chem. 2004, 6, 206–214. [Google Scholar] [CrossRef]
- Li, J.-Y.; Zhao, Q.-N.; Liu, P.; Zhang, D.-S.; Song, Q.-W.; Zhang, K. Incorporation of CO2 into carbonates through carboxylation/hydration reaction. Greenhouse Gas Sci Technol. 2018, 8, 803–838. [Google Scholar] [CrossRef]
- Sun, J.; Yang, G.; Yoneyama, Y.; Tsubaki, N. Catalysis Chemistry of Dimethyl Ether Synthesis. ACS Catal. 2014, 4, 3346–3356. [Google Scholar] [CrossRef]
- Courtney, T.D.; Nikolakis, V.; Mpourmpakis, G.; Chen, J.G.; Vlachos, D.G. Liquid-phase dehydration of propylene glycol using solid-acid catalysts. Appl. Catal. A-Gen. 2012, 449, 59–68. [Google Scholar] [CrossRef]
- Abimanyu, H.; Kim, C.S.; Ahn, B.S.; Yoo, K.S. Synthesis of dimethyl carbonate by transesterification with various MgO–CeO2 mixed oxide catalysts. Catal. Lett. 2007, 118, 30–35. [Google Scholar] [CrossRef]
- Zhang, W.; Wang, H.; Li, Q.; Dong, Q.; Zhao, N.; Wei, W.; Sun, Y. The mechanism for the synthesis of 1-methoxy-2-propanol from methanol and propylene oxide over magnesium oxide. Appl. Catal. A Gen. 2005, 294, 188–196. [Google Scholar] [CrossRef]


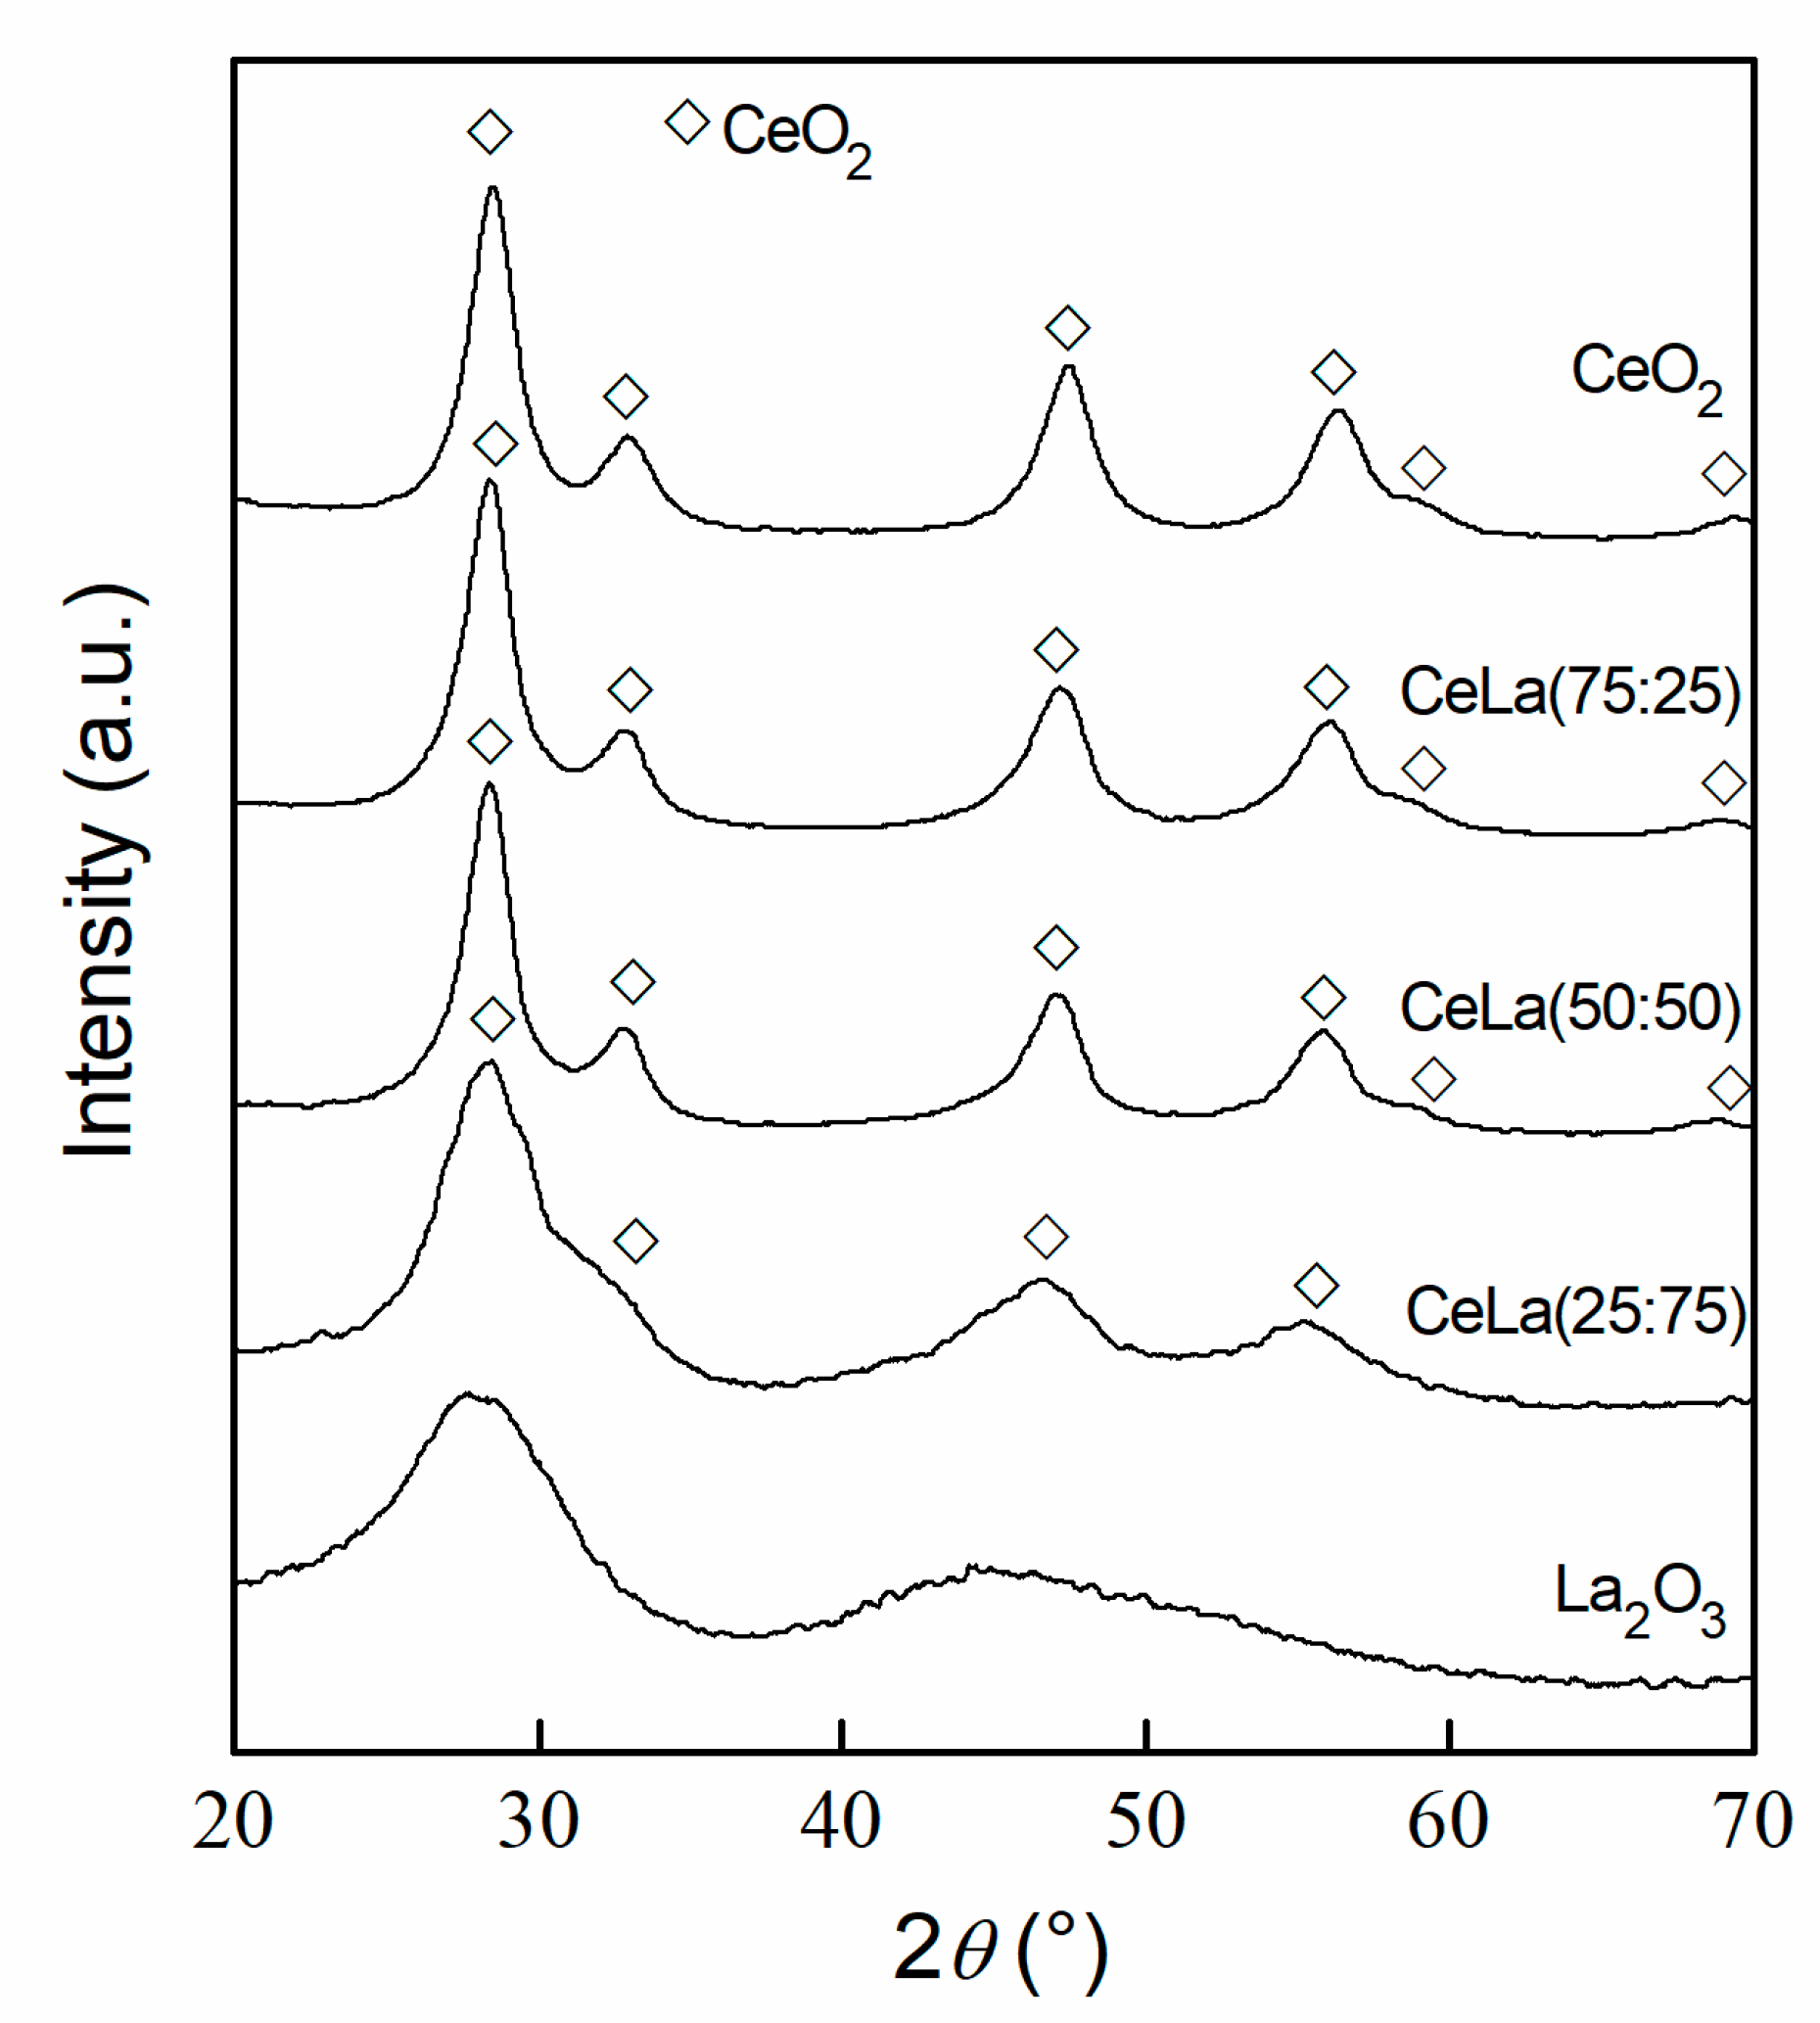
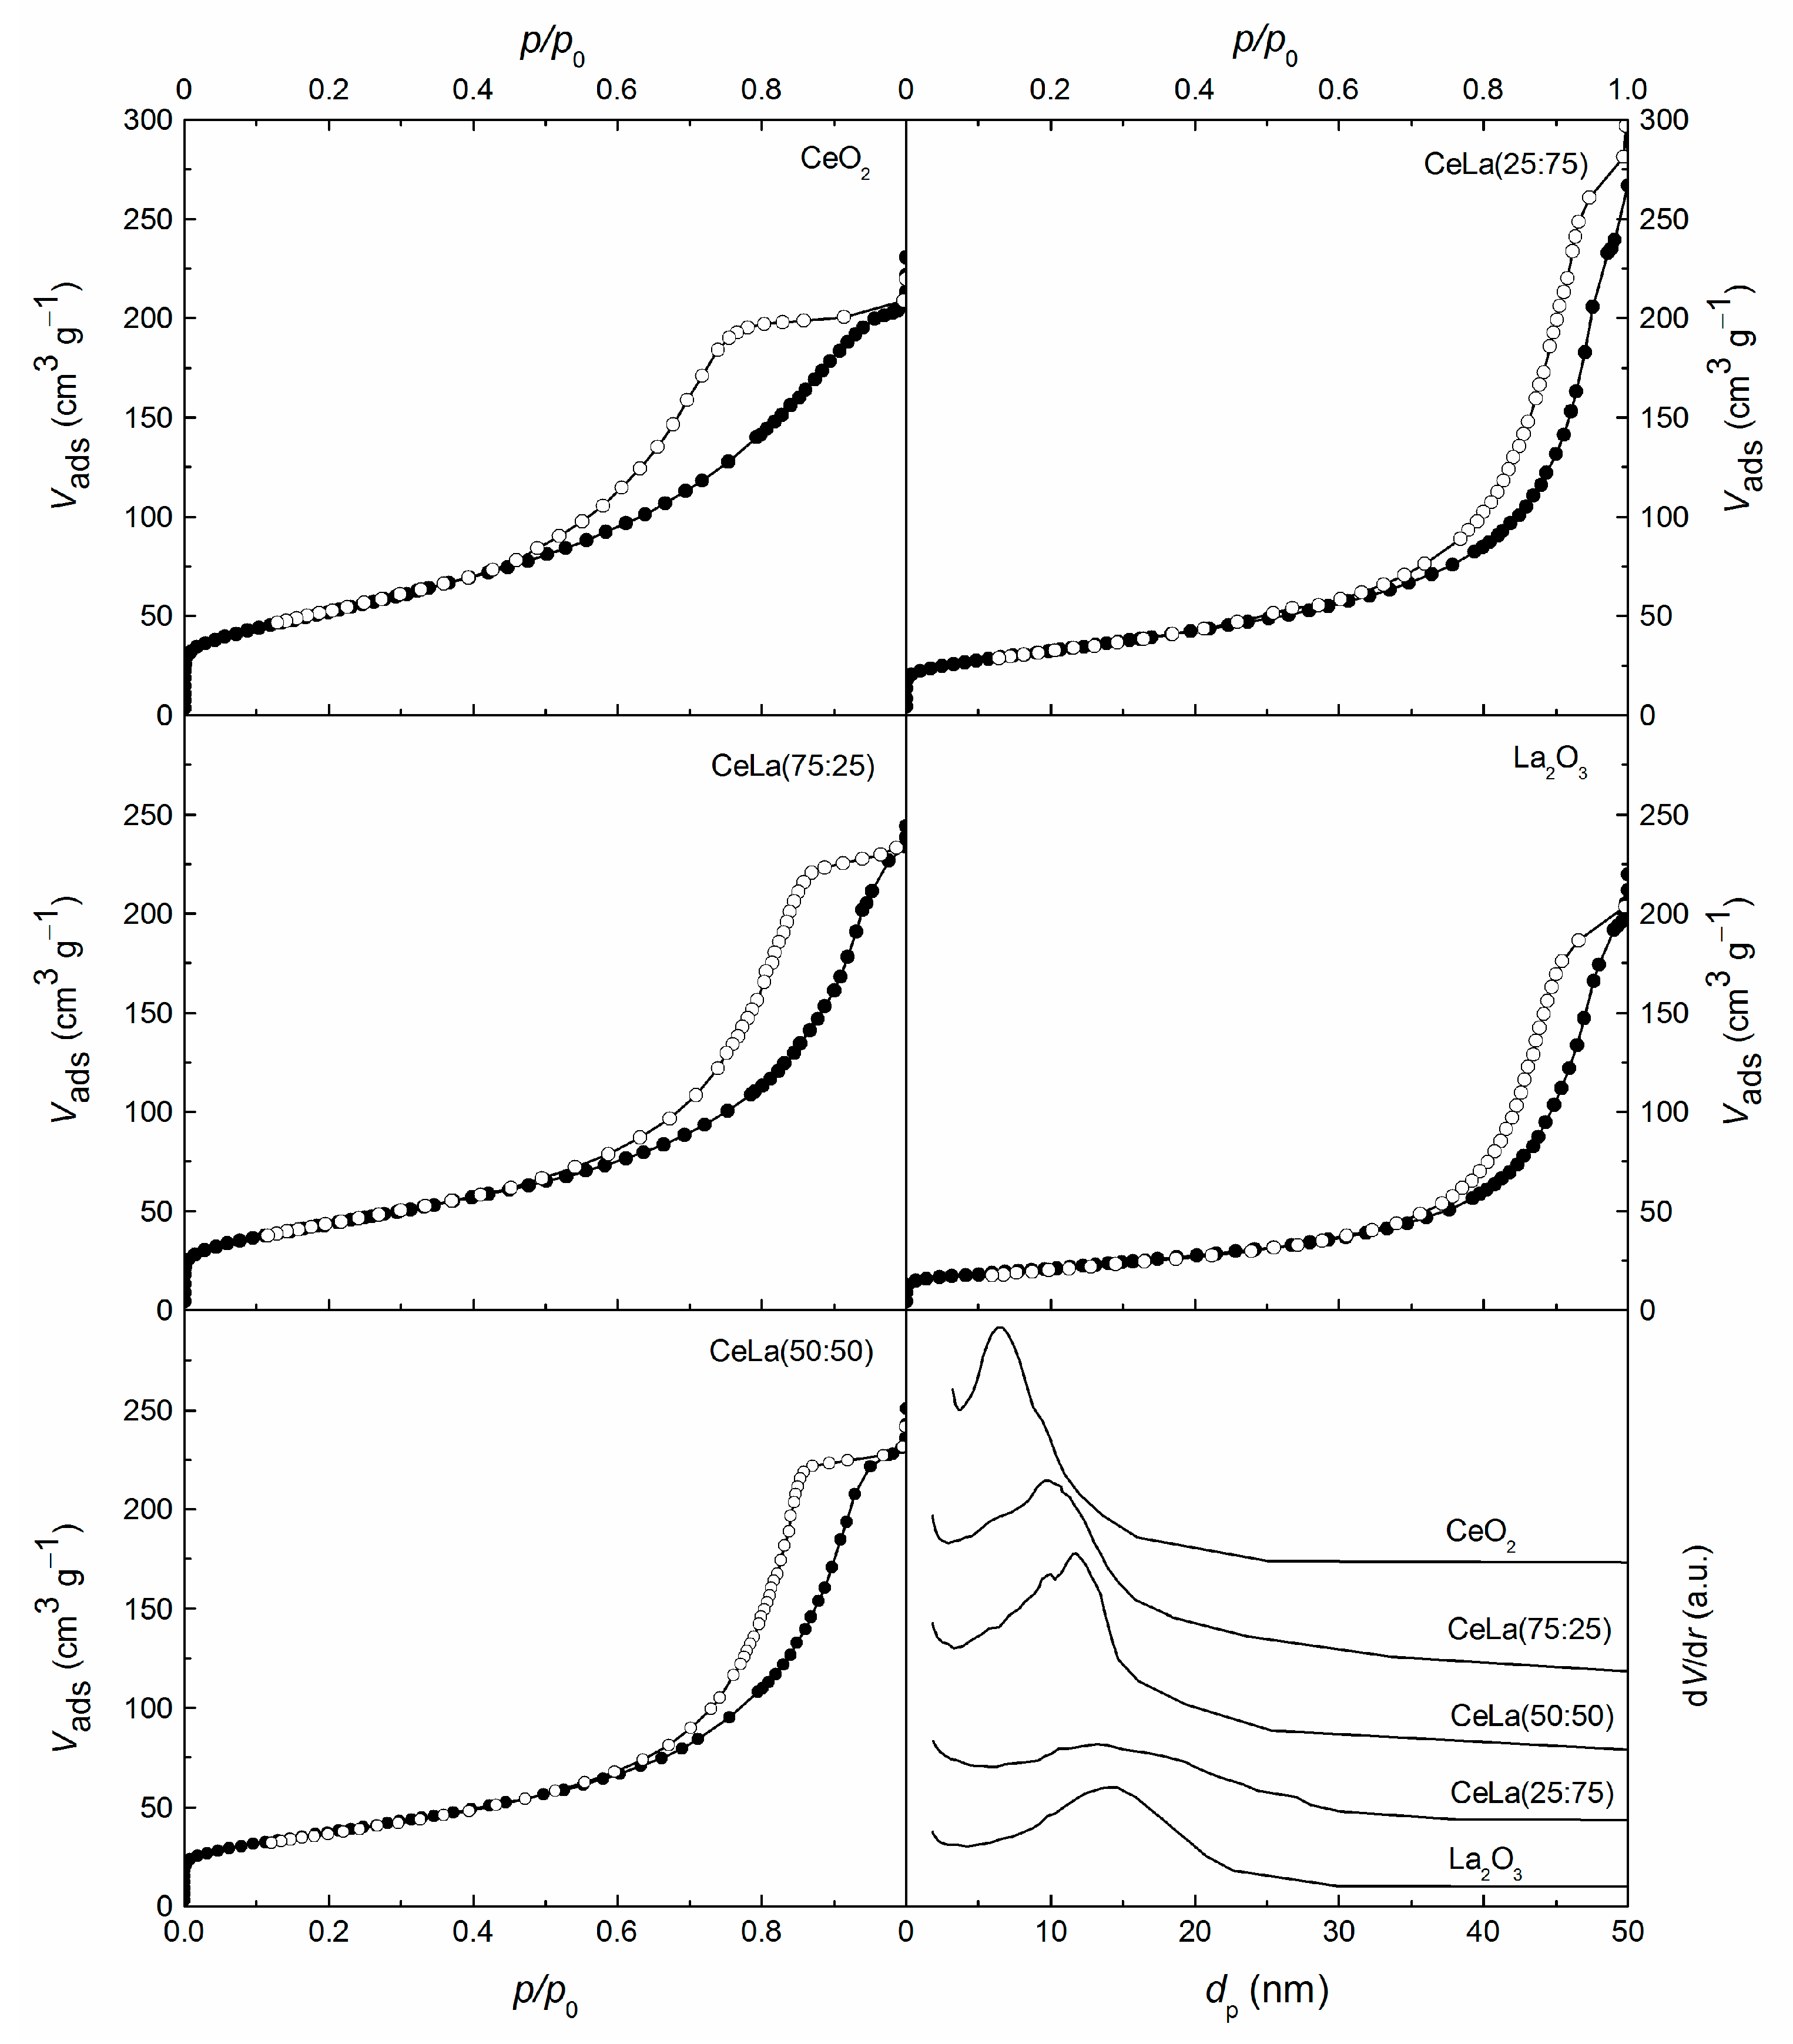
| Sample | Ce/La | CeO2 Crystallite Size | Textural Properties | ||
|---|---|---|---|---|---|
(mol/mol) | Dc (nm) | SBET (m2 g−1) | Vp (cm3 g−1) | dp,max (nm) | |
| CeO2 | - | 5 | 189 | 0.32 | 6.6 |
| CeLa(75:25) | 4.02 | 5 | 157 | 0.35 | 9.8 |
| CeLa(50:50) | 1.32 | 5 | 134 | 0.36 | 11.8 |
| CeLa(25:75) | 0.43 | n.d. 1 | 117 | 0.37 | 13.6 |
| La2O3 | - | - | 74 | 0.31 | 13.9 |
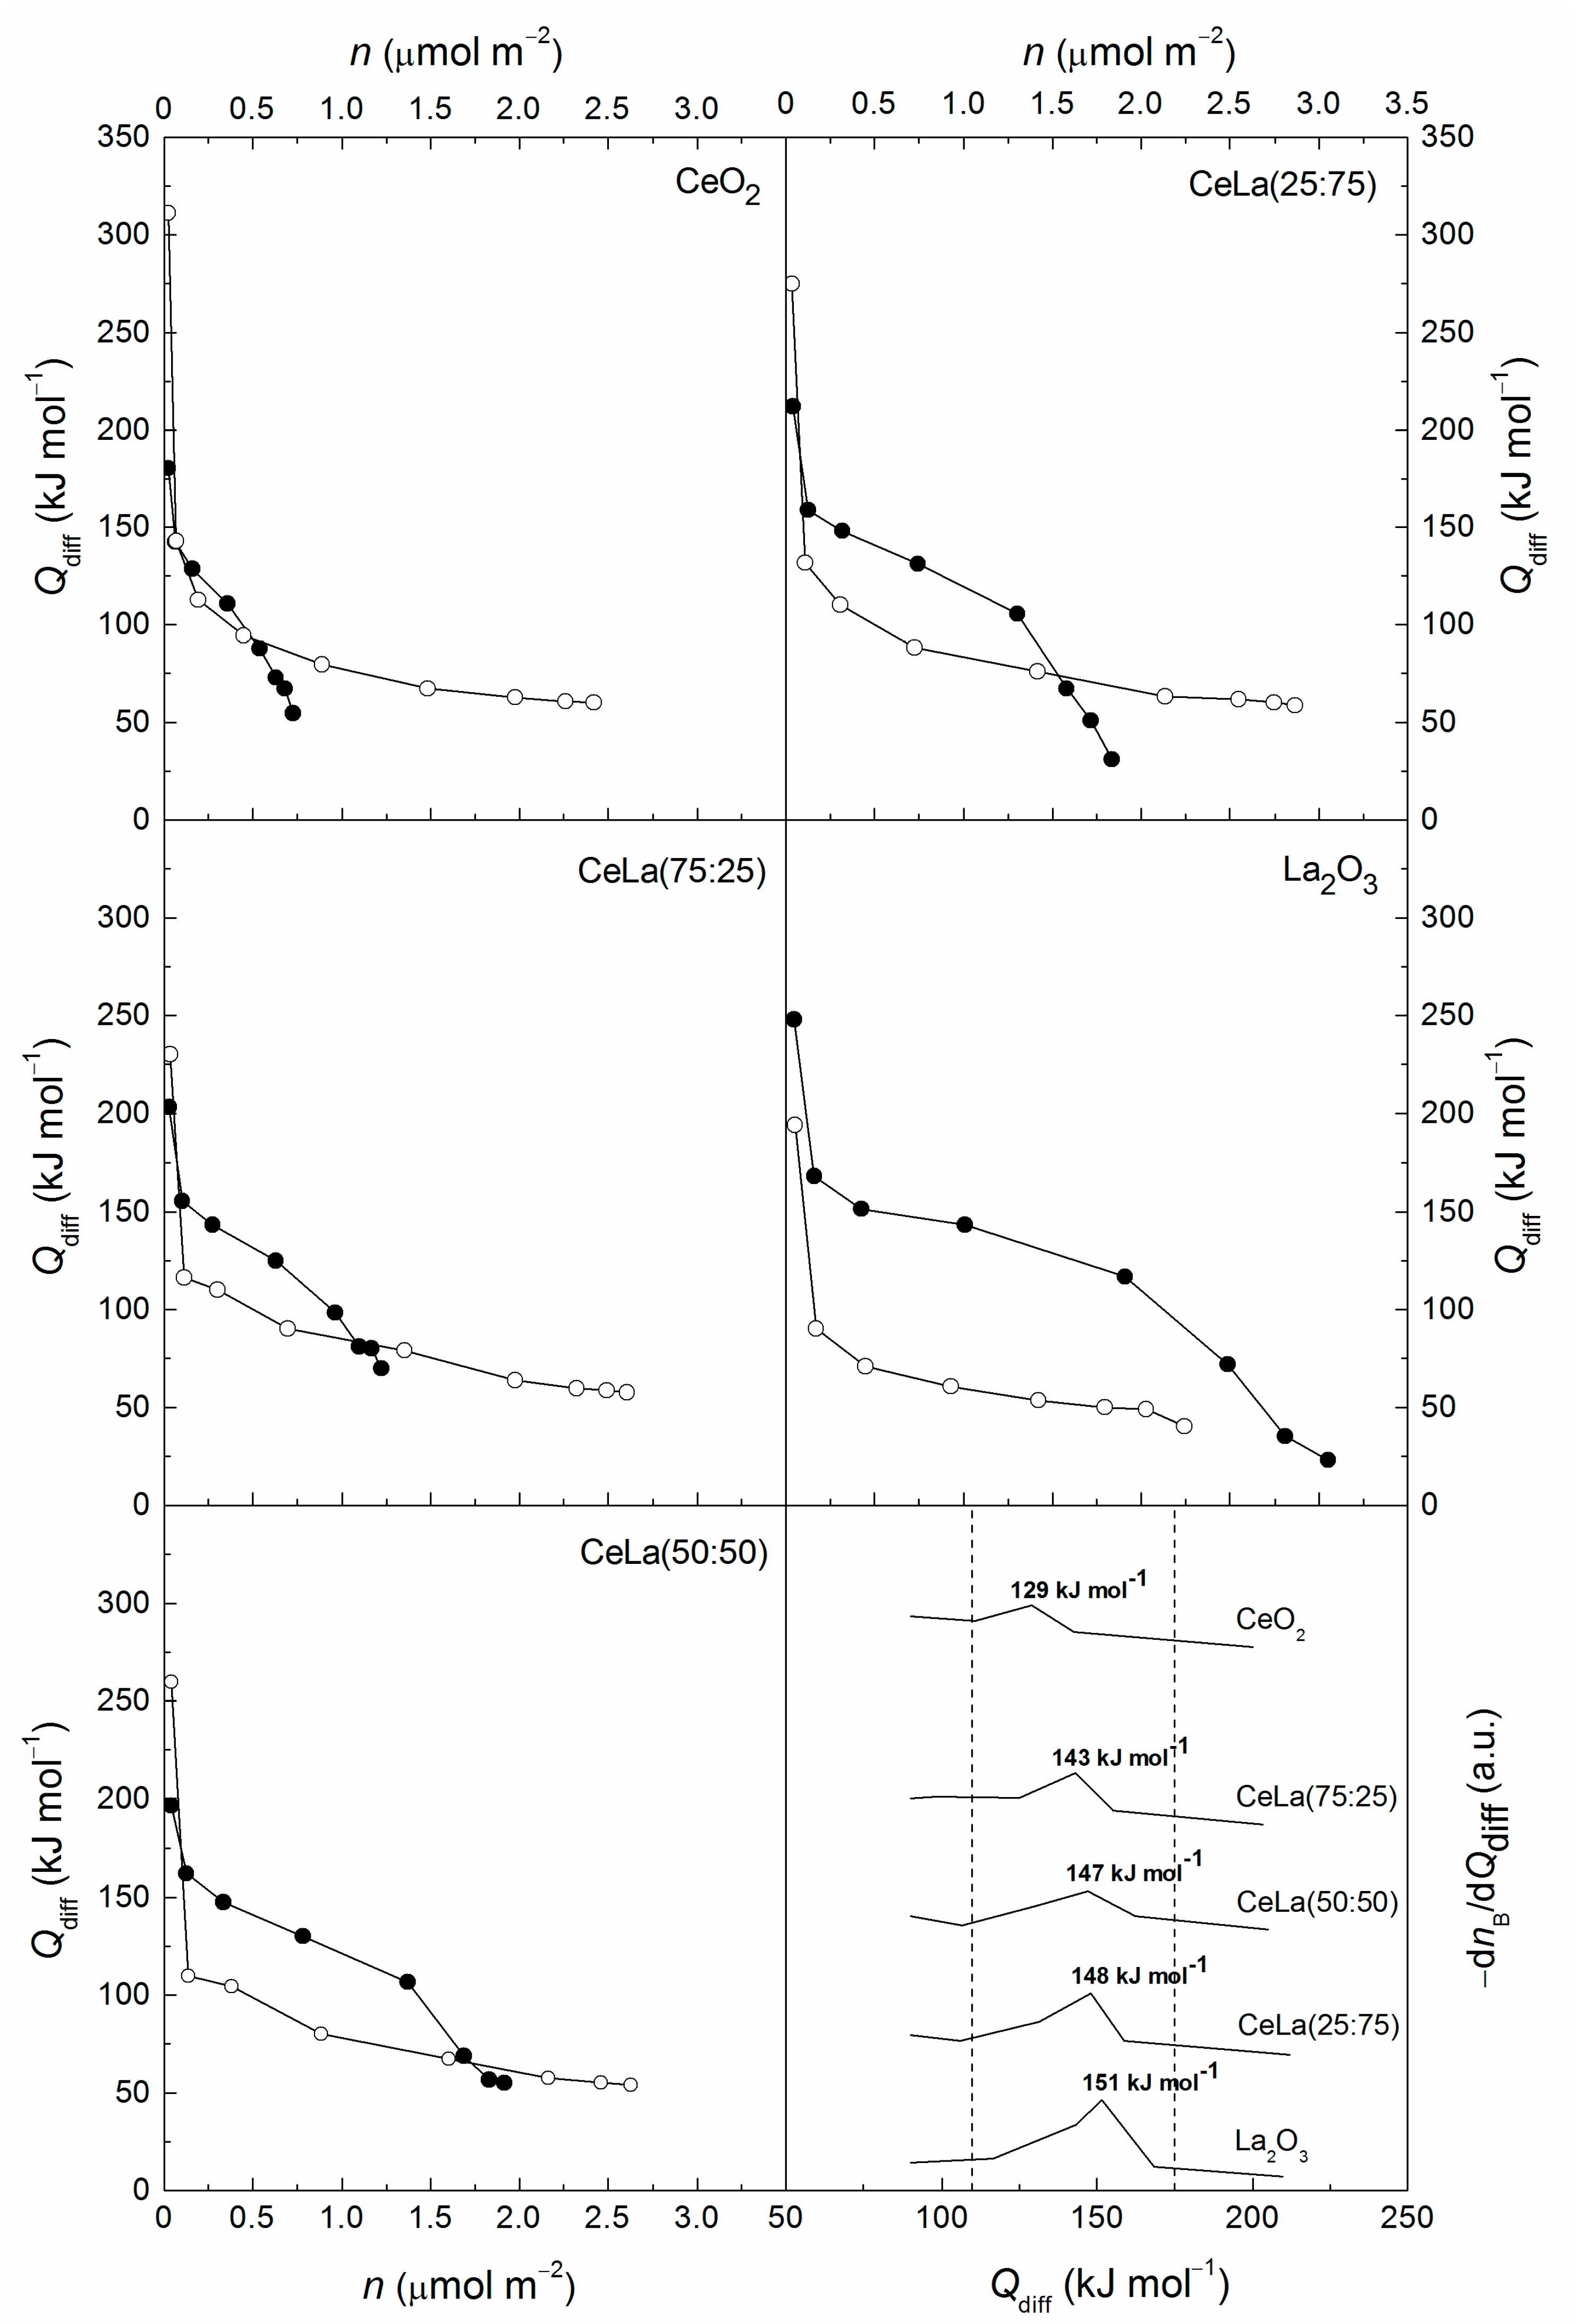
| Sample | nA,sa | nA,mb | nA,wc | nA,totd | nB,sa | nB,mb | nB,we | nB,totf |
|---|---|---|---|---|---|---|---|---|
| CeO2 | 0.07 | 0.16 | 2.03 | 2.26 | 0.05 | 0.30 | 0.37 | 0.72 |
| CeLa(75:25) | 0.09 | 0.21 | 2.02 | 2.32 | 0.18 | 0.64 | 0.41 | 1.22 |
| CeLa(50:50) | 0.11 | 0.13 | 1.78 | 2.01 | 0.29 | 0.99 | 0.64 | 1.92 |
| CeLa(25:75) | 0.10 | 0.21 | 2.44 | 2.75 | 0.28 | 0.93 | 0.57 | 1.79 |
| La2O3 | 0.09 | 0.05 | 0.82 | 0.97 | 0.53 | 1.47 | 0.77 | 2.77 |
| Catalyst | XPC | Ac | SDMC | SInterm | YDMC | DMC/PG |
|---|---|---|---|---|---|---|
| (mol%) | (mmol m−2 h−1) | (mol%) | (mol%) | (mol%) | (mol/mol) | |
| blank run | 15 | 11 | 46 | 2 | 0.46 | |
| CeO2 | 58 | 0.25 | 82 | 6 | 48 | 0.91 |
| CeLa(75:25) | 55 | 0.28 | 84 | 6 | 46 | 0.91 |
| CeLa(50:50) | 60 | 0.36 | 86 | 6 | 52 | 0.90 |
| CeLa(25:75) | 54 | 0.38 | 87 | 7 | 47 | 0.90 |
| La2O3 | 57 | 0.63 | 74 | 6 | 42 | 0.71 |
Publisher’s Note: MDPI stays neutral with regard to jurisdictional claims in published maps and institutional affiliations. |
© 2021 by the authors. Licensee MDPI, Basel, Switzerland. This article is an open access article distributed under the terms and conditions of the Creative Commons Attribution (CC BY) license (https://creativecommons.org/licenses/by/4.0/).
Share and Cite
Cutrufello, M.G.; Atzori, L.; Meloni, D.; Piras, A.; Gazzoli, D.; Rombi, E. Synthesis of Dimethyl Carbonate by Transesterification of Propylene Carbonate with Methanol on CeO2-La2O3 Oxides Prepared by the Soft Template Method. Materials 2021, 14, 4802. https://doi.org/10.3390/ma14174802
Cutrufello MG, Atzori L, Meloni D, Piras A, Gazzoli D, Rombi E. Synthesis of Dimethyl Carbonate by Transesterification of Propylene Carbonate with Methanol on CeO2-La2O3 Oxides Prepared by the Soft Template Method. Materials. 2021; 14(17):4802. https://doi.org/10.3390/ma14174802
Chicago/Turabian StyleCutrufello, Maria Giorgia, Luciano Atzori, Daniela Meloni, Alessandra Piras, Delia Gazzoli, and Elisabetta Rombi. 2021. "Synthesis of Dimethyl Carbonate by Transesterification of Propylene Carbonate with Methanol on CeO2-La2O3 Oxides Prepared by the Soft Template Method" Materials 14, no. 17: 4802. https://doi.org/10.3390/ma14174802
APA StyleCutrufello, M. G., Atzori, L., Meloni, D., Piras, A., Gazzoli, D., & Rombi, E. (2021). Synthesis of Dimethyl Carbonate by Transesterification of Propylene Carbonate with Methanol on CeO2-La2O3 Oxides Prepared by the Soft Template Method. Materials, 14(17), 4802. https://doi.org/10.3390/ma14174802