
Analysis of Compressive Fatigue Failure of Recycled Aggregate Concrete

Abstract
:1. Introduction
2. Experimental Design
2.1. Specimen Preparation
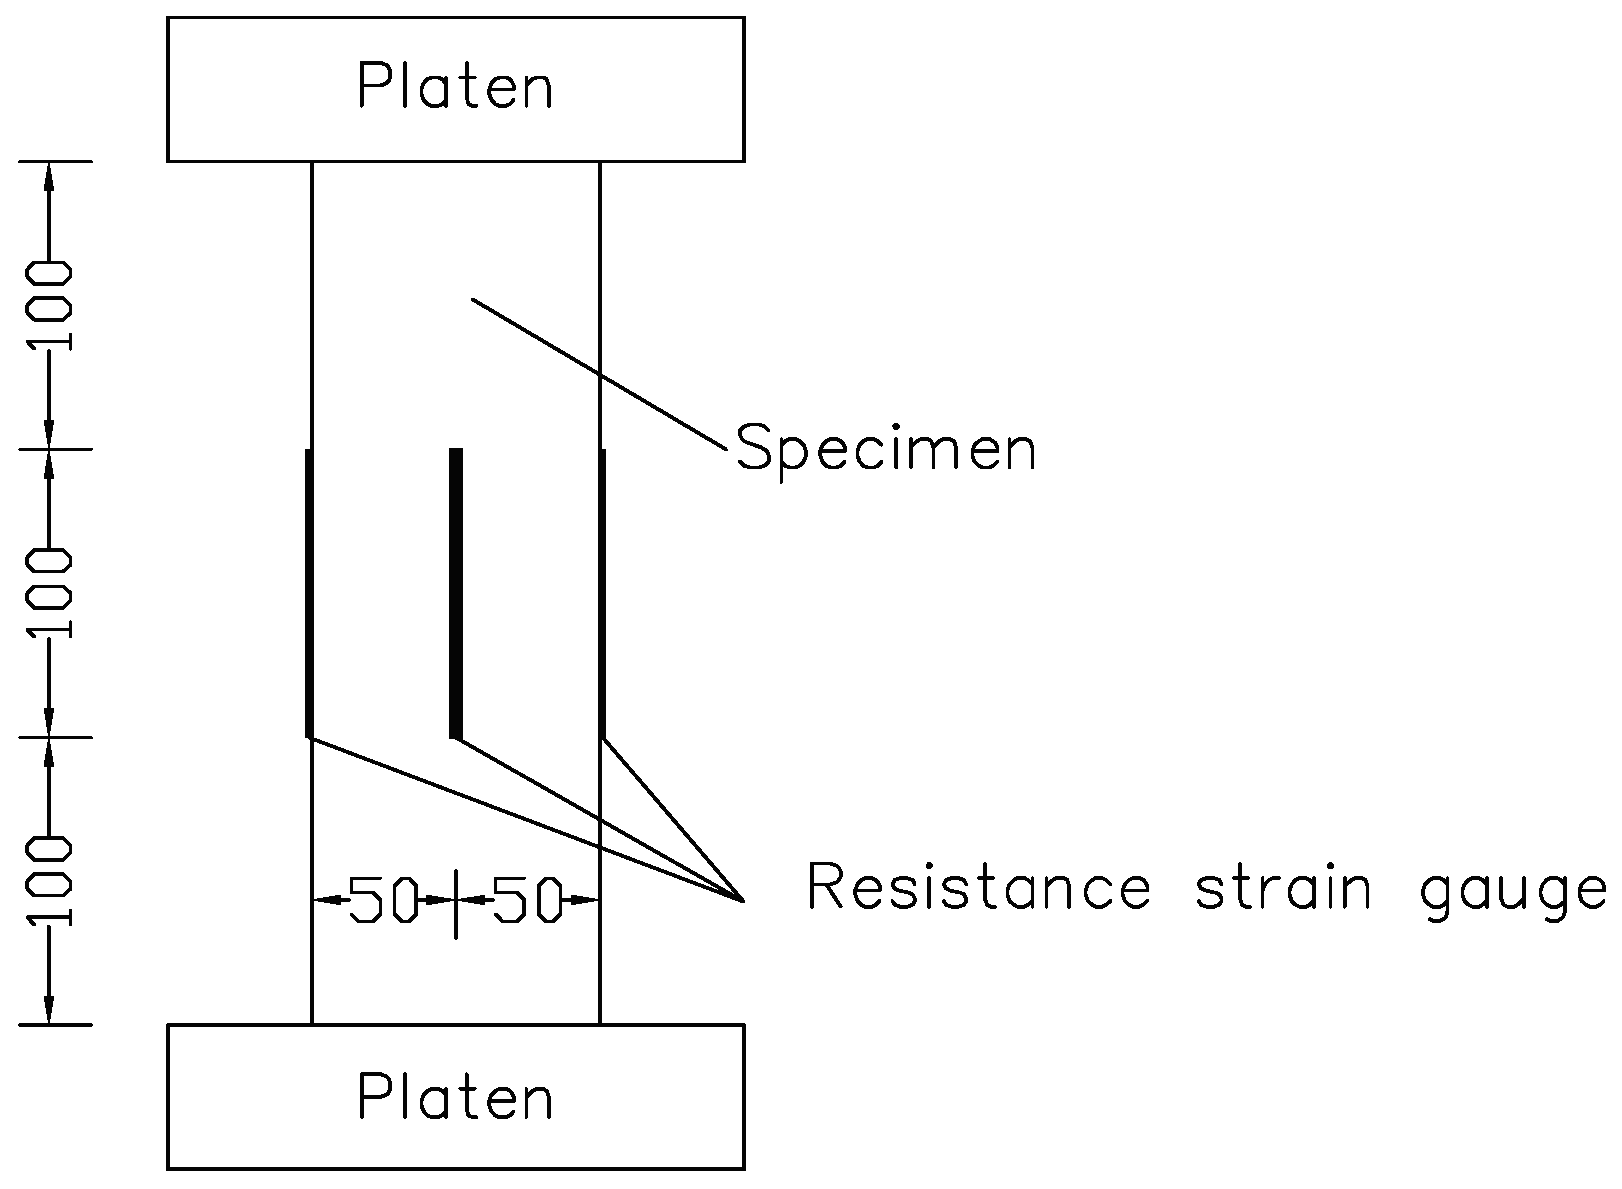
2.2. Test Method
3. Results and Analysis
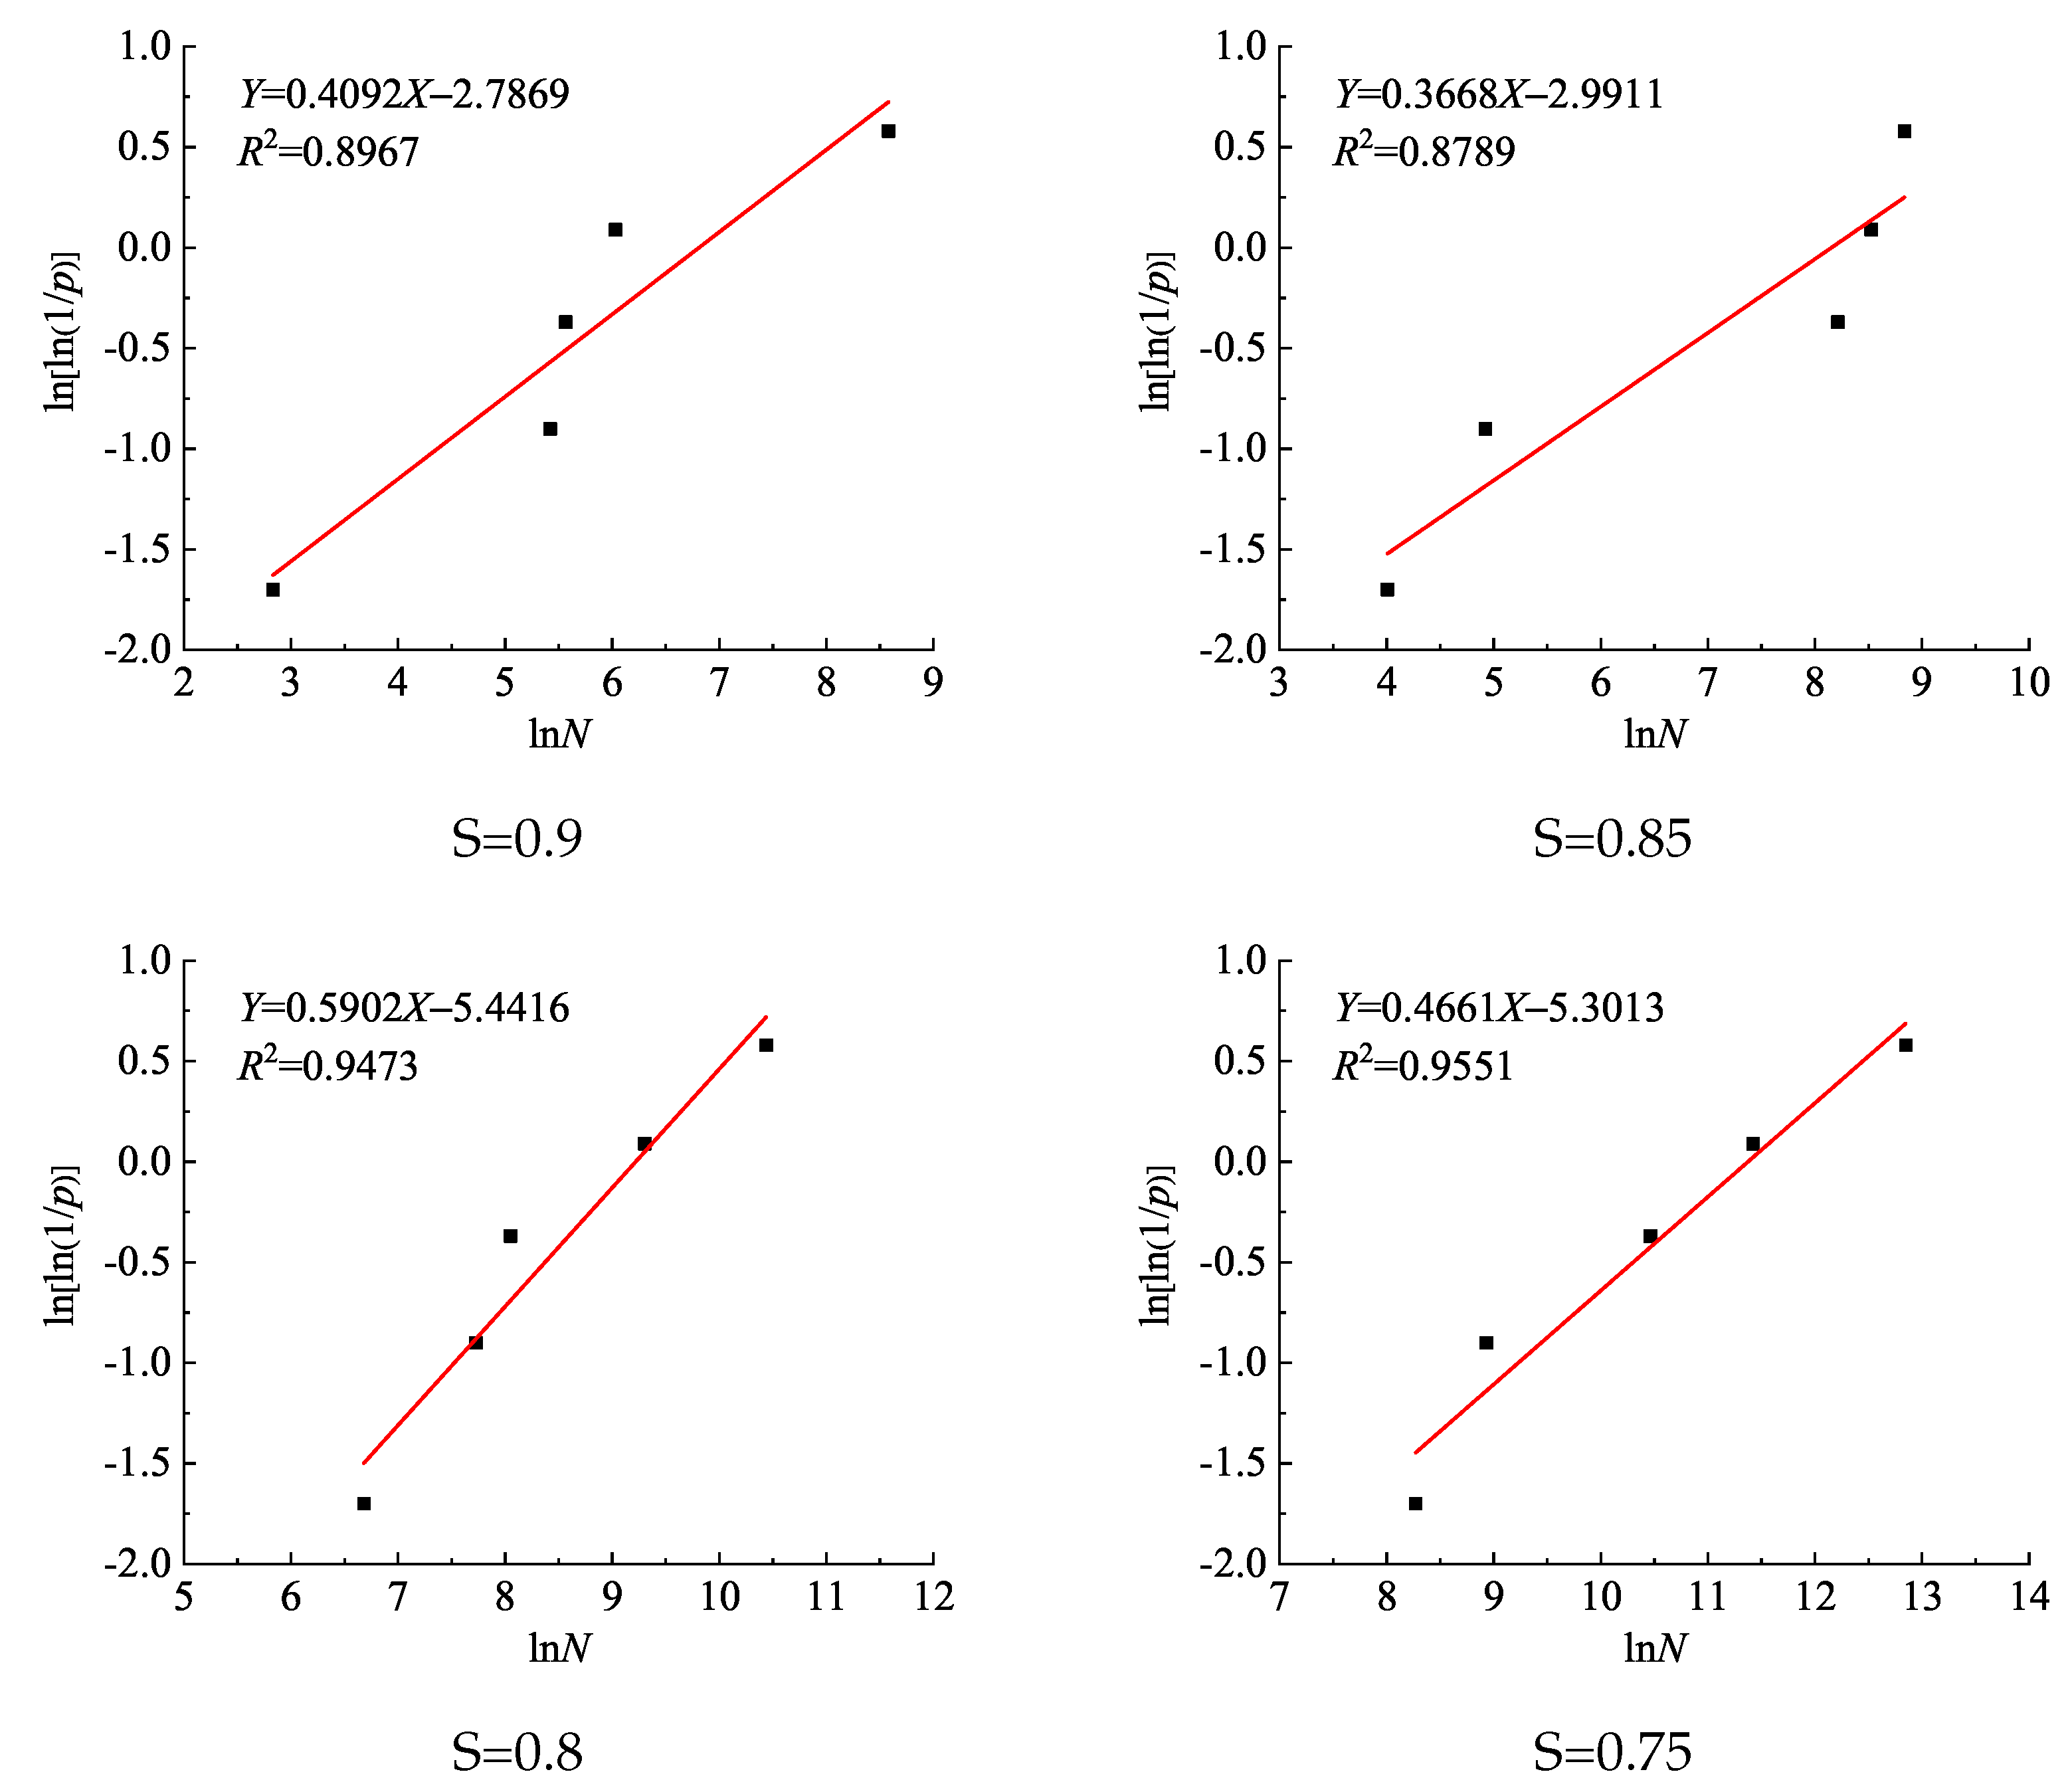
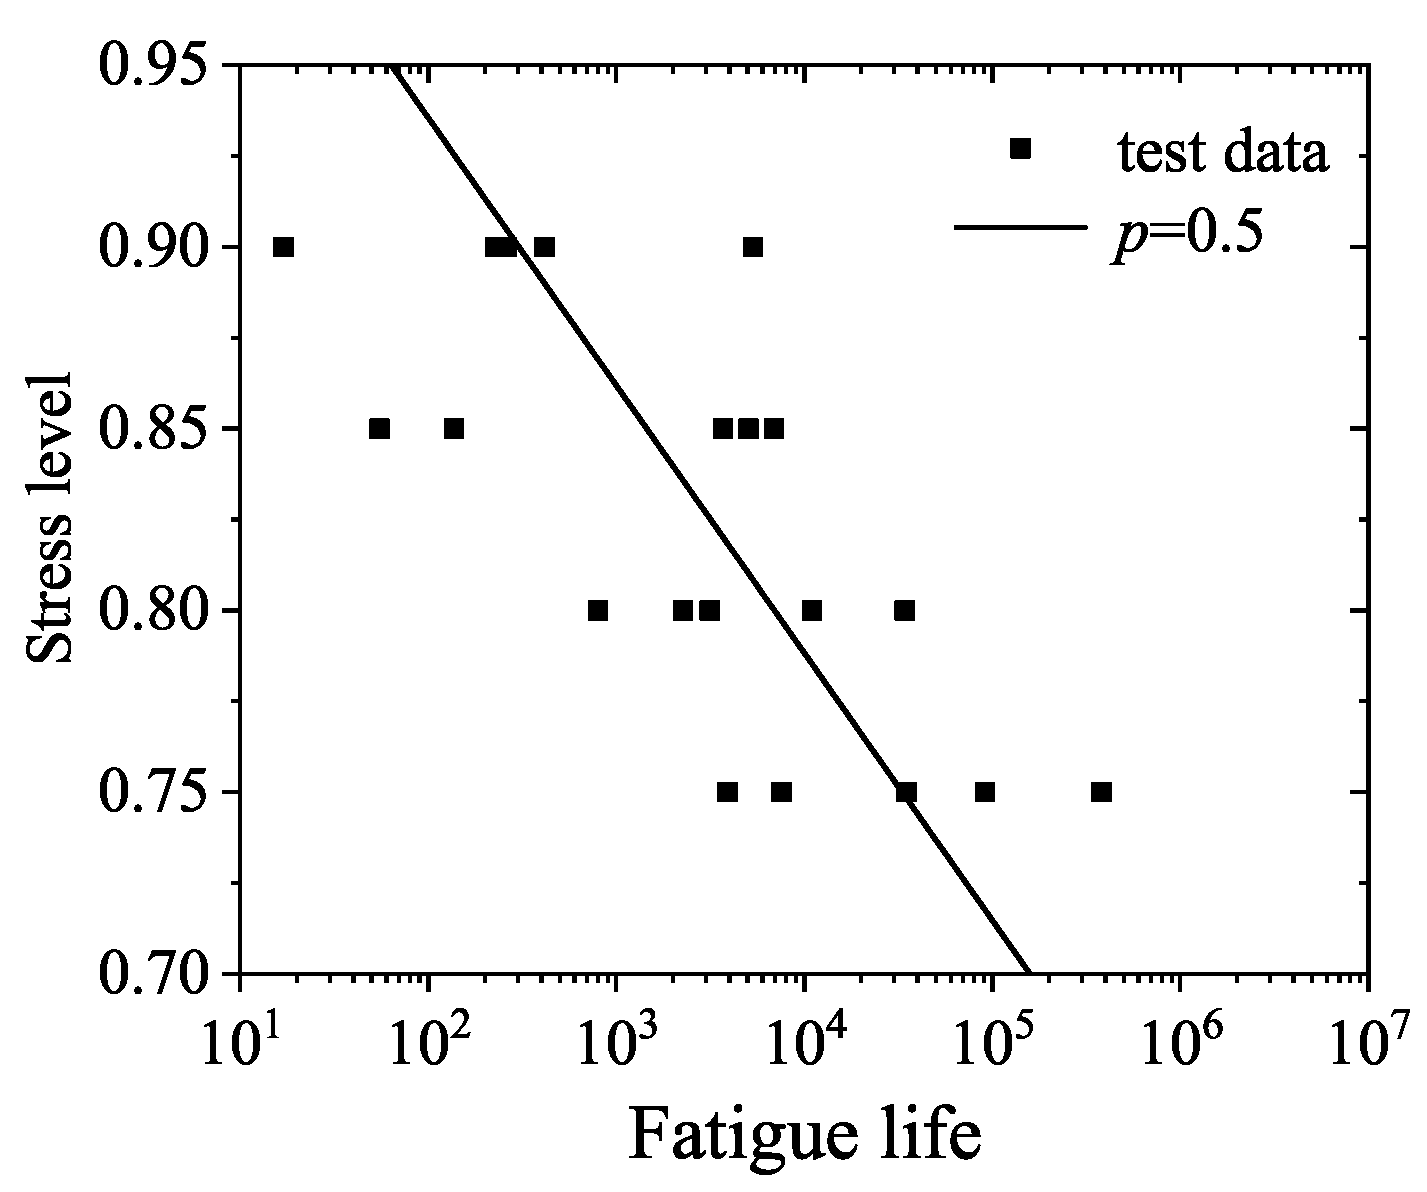
3.1. Fatigue Life and Distribution
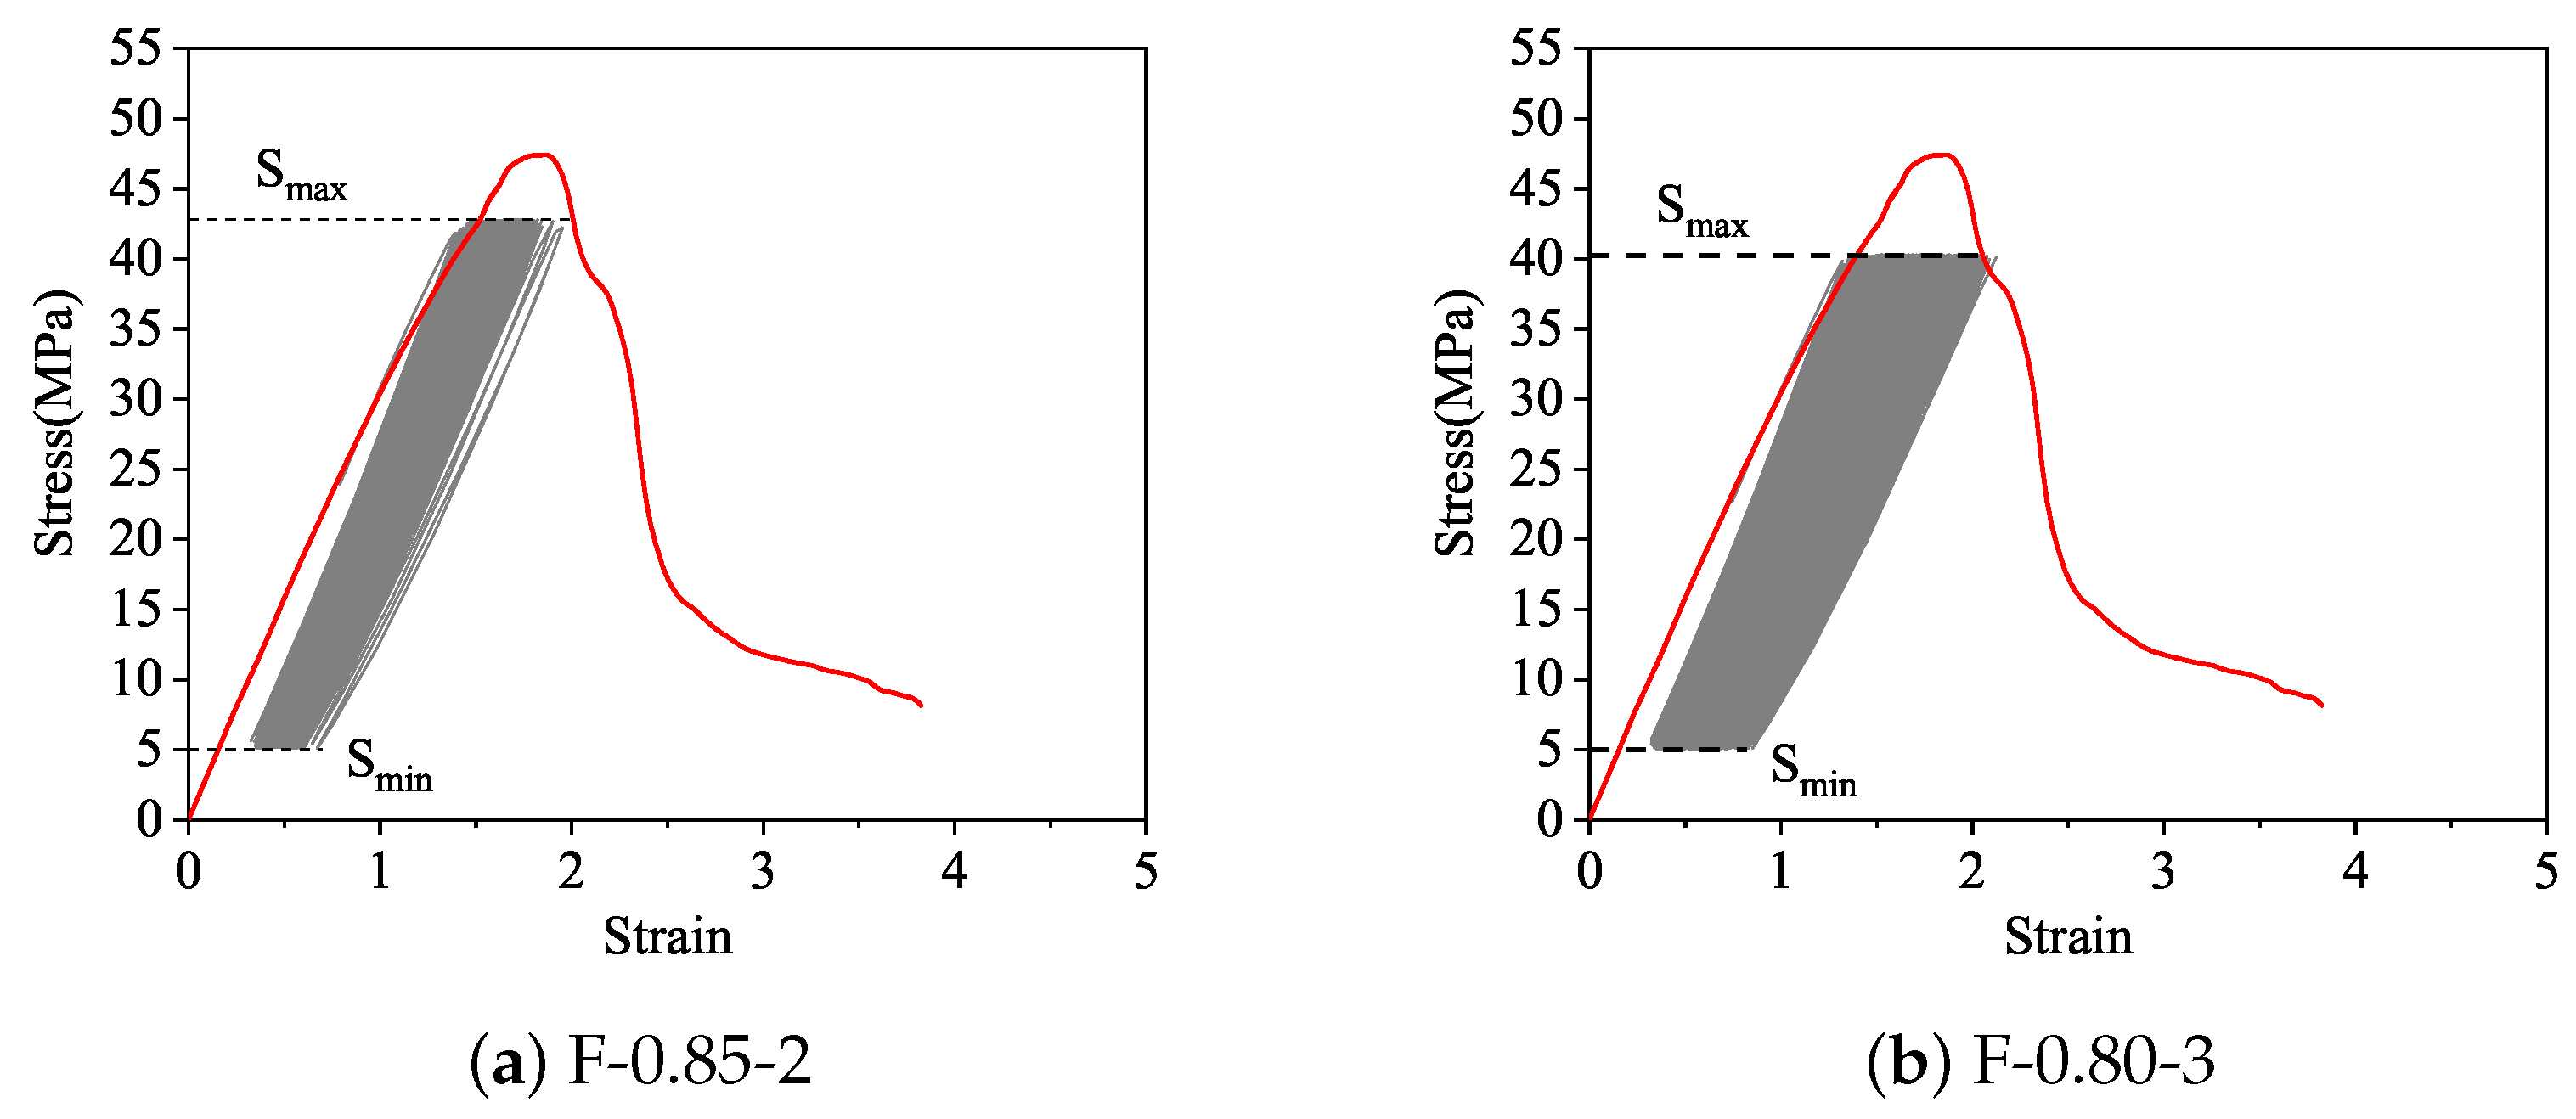
3.2. Fatigue Failure Deformations
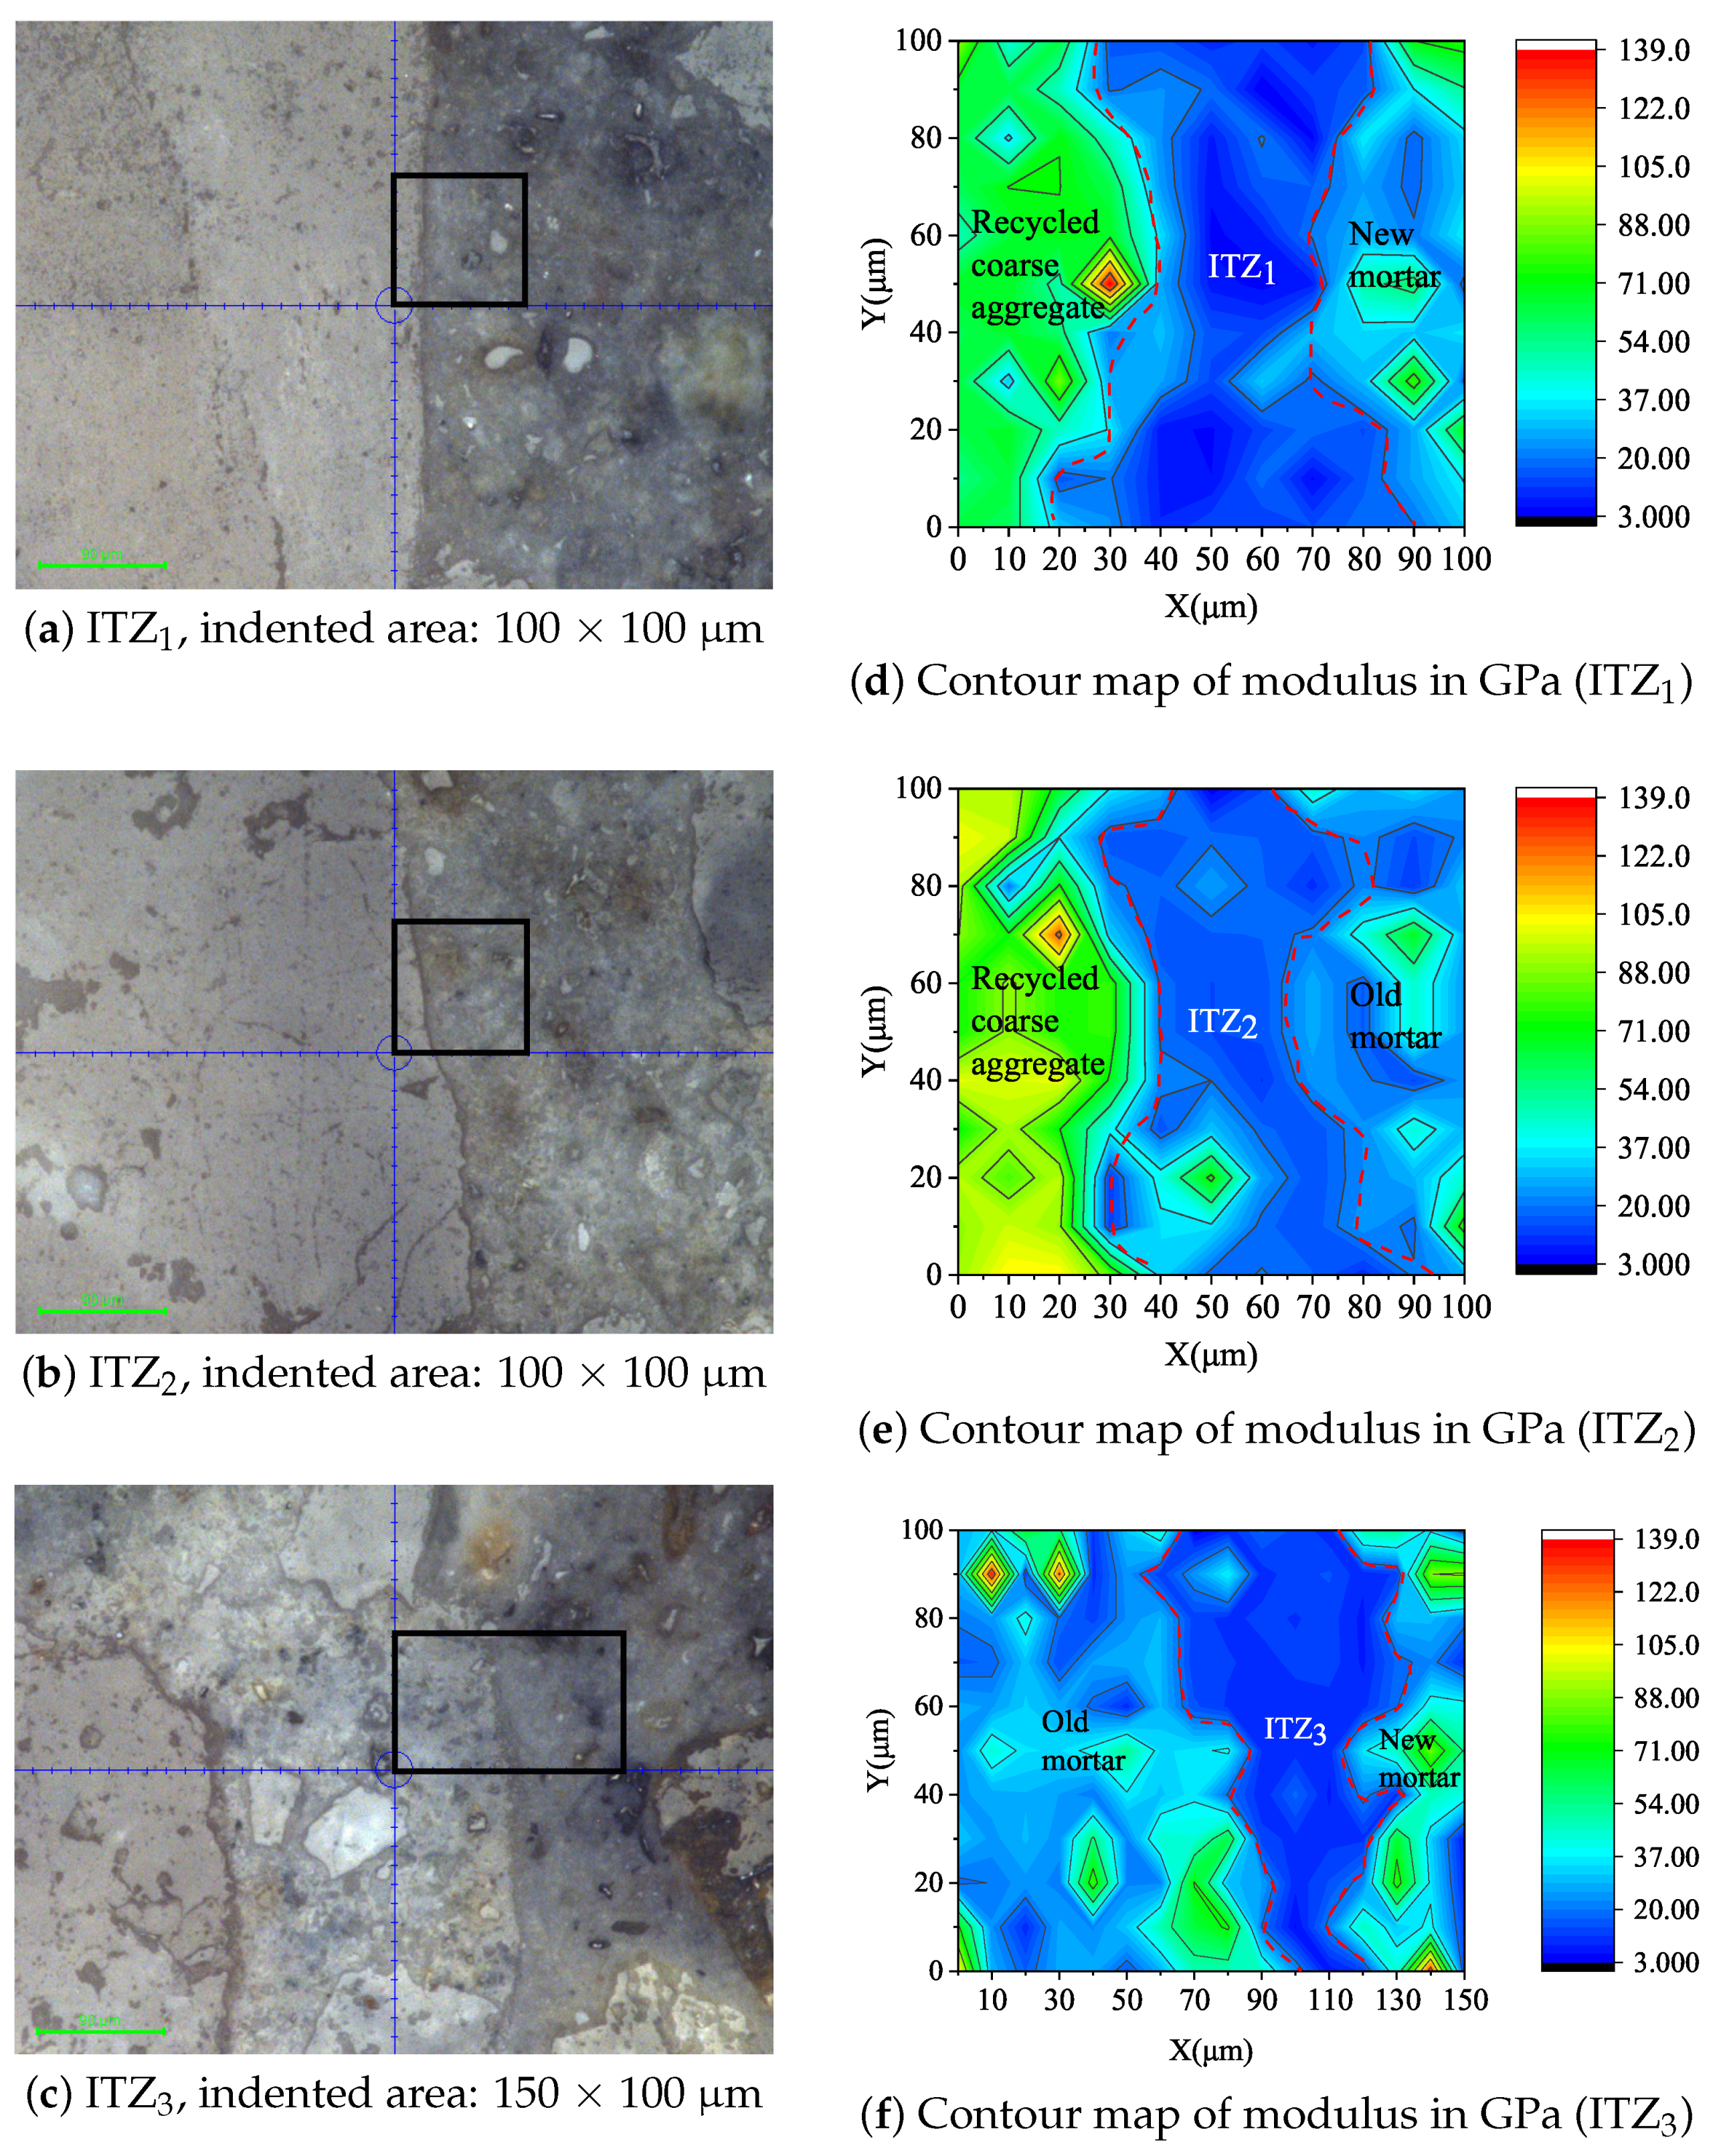
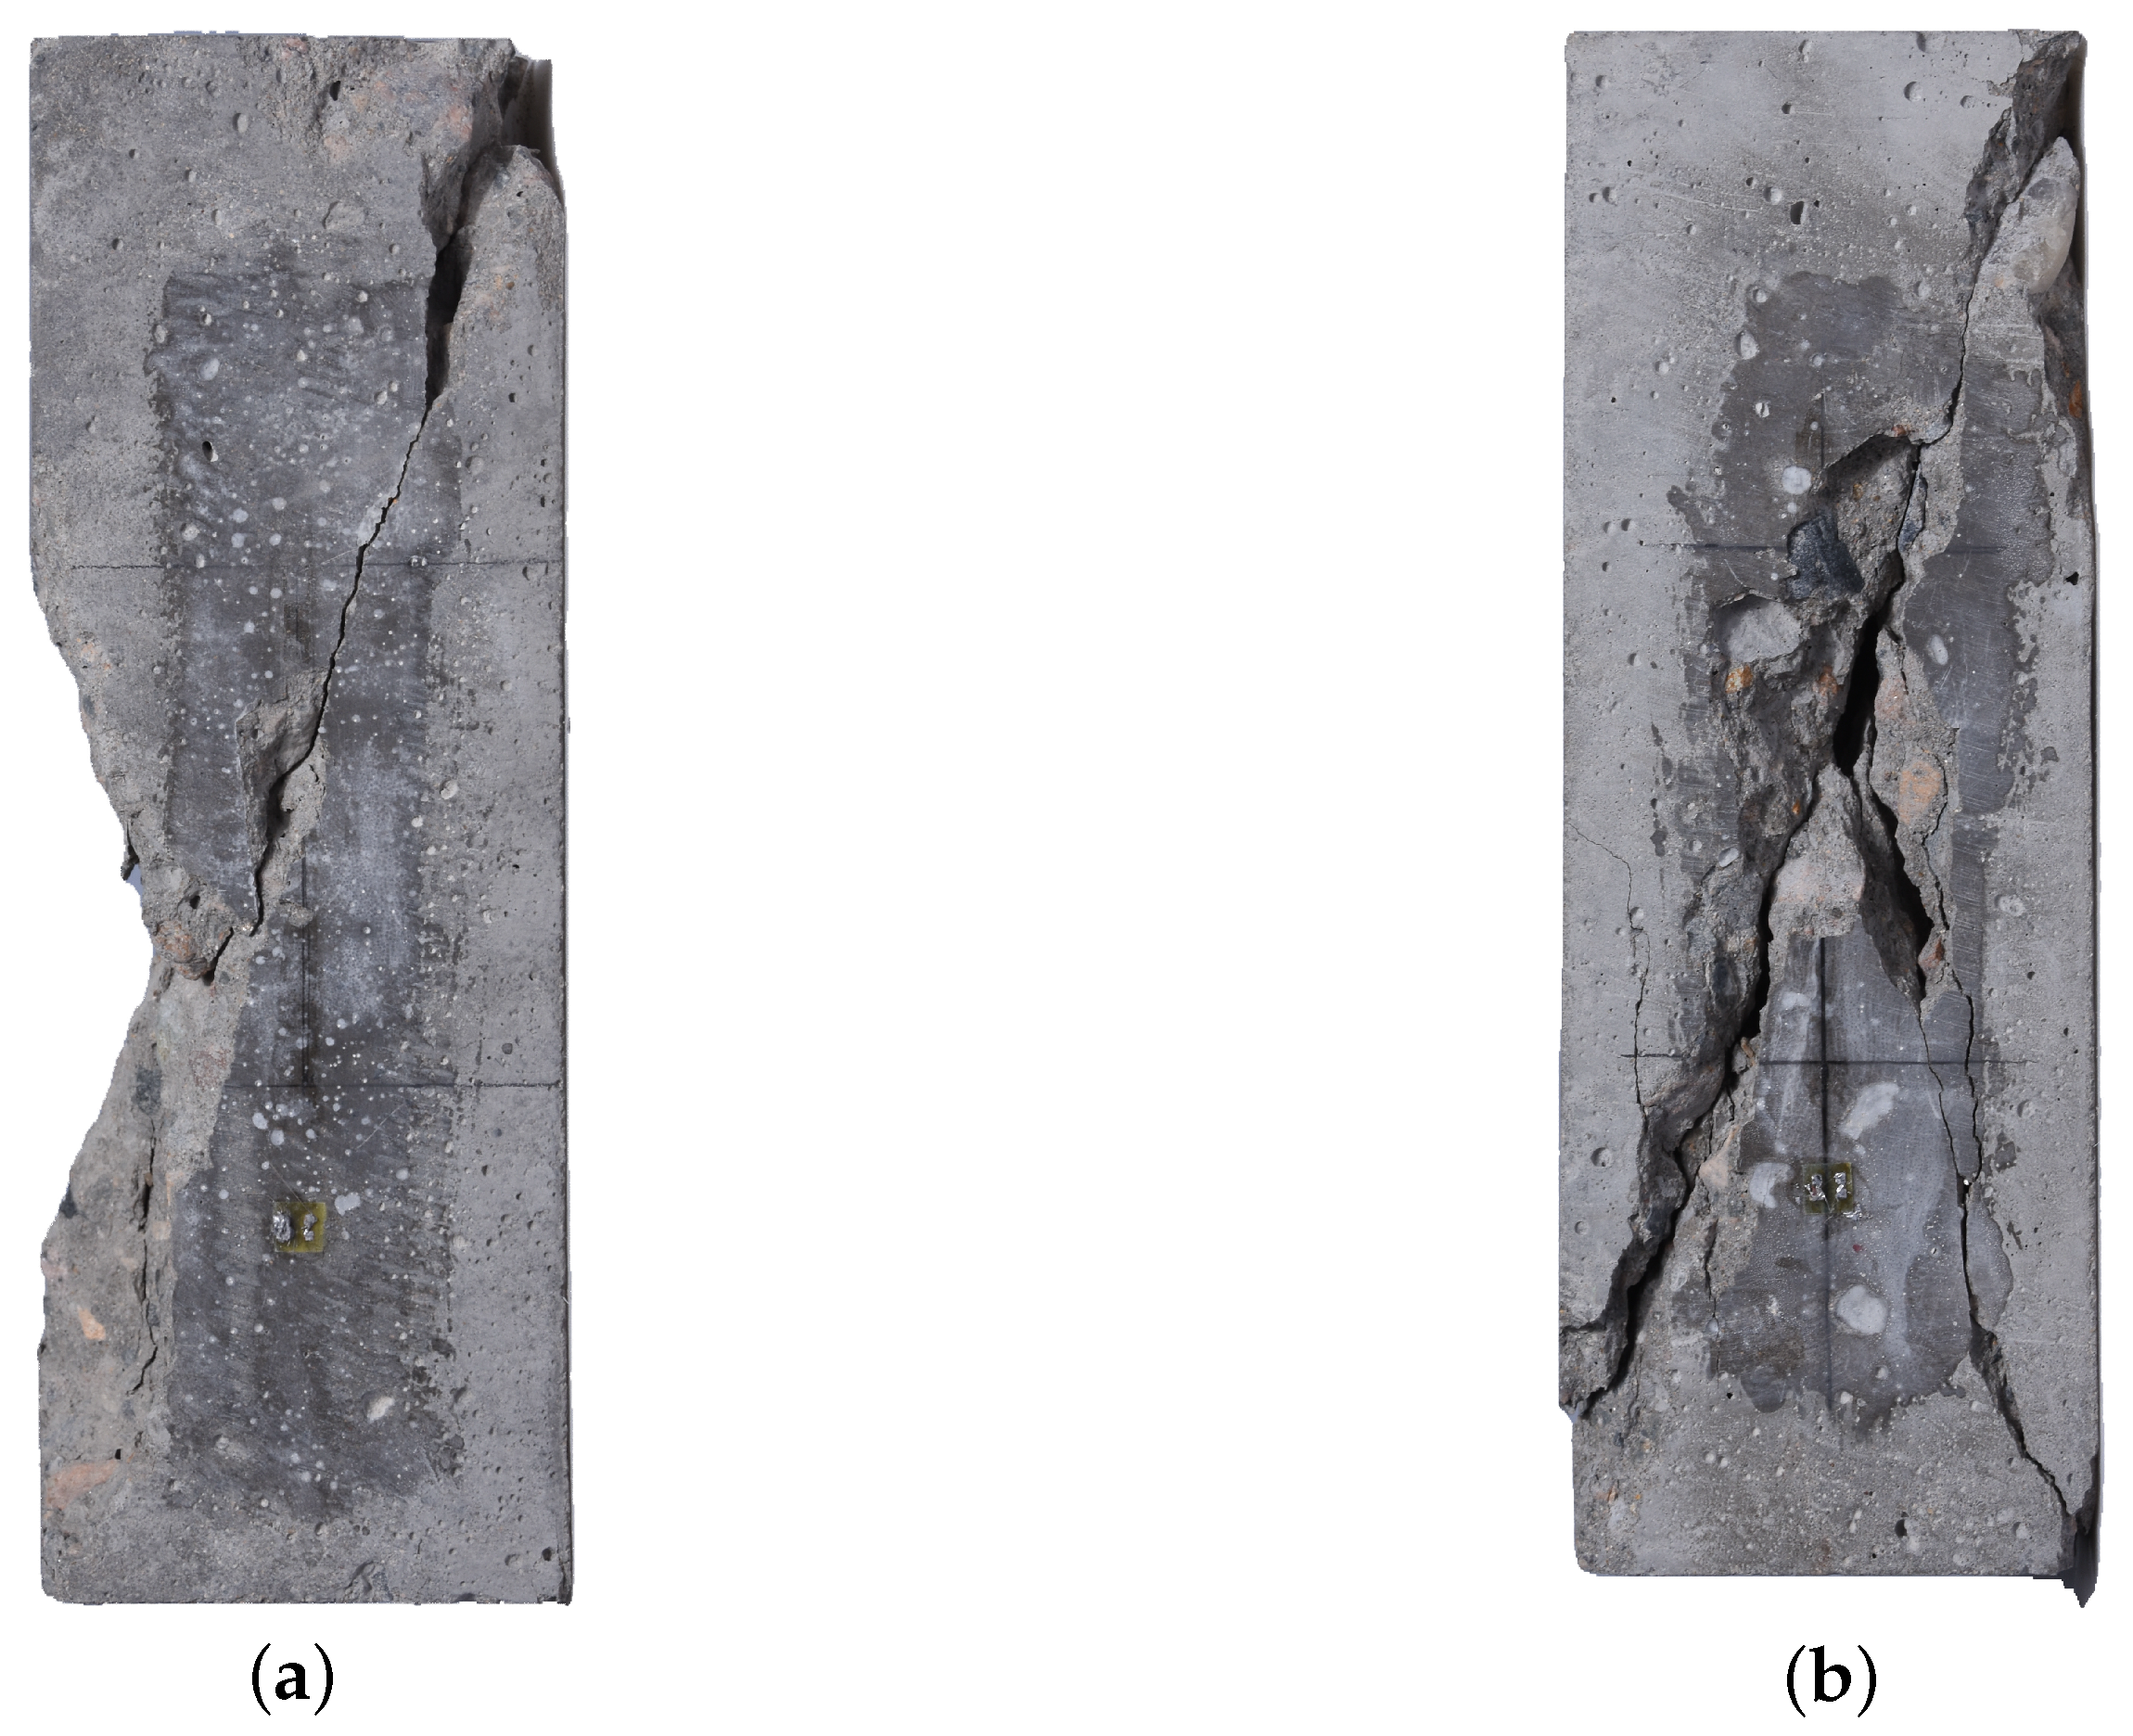
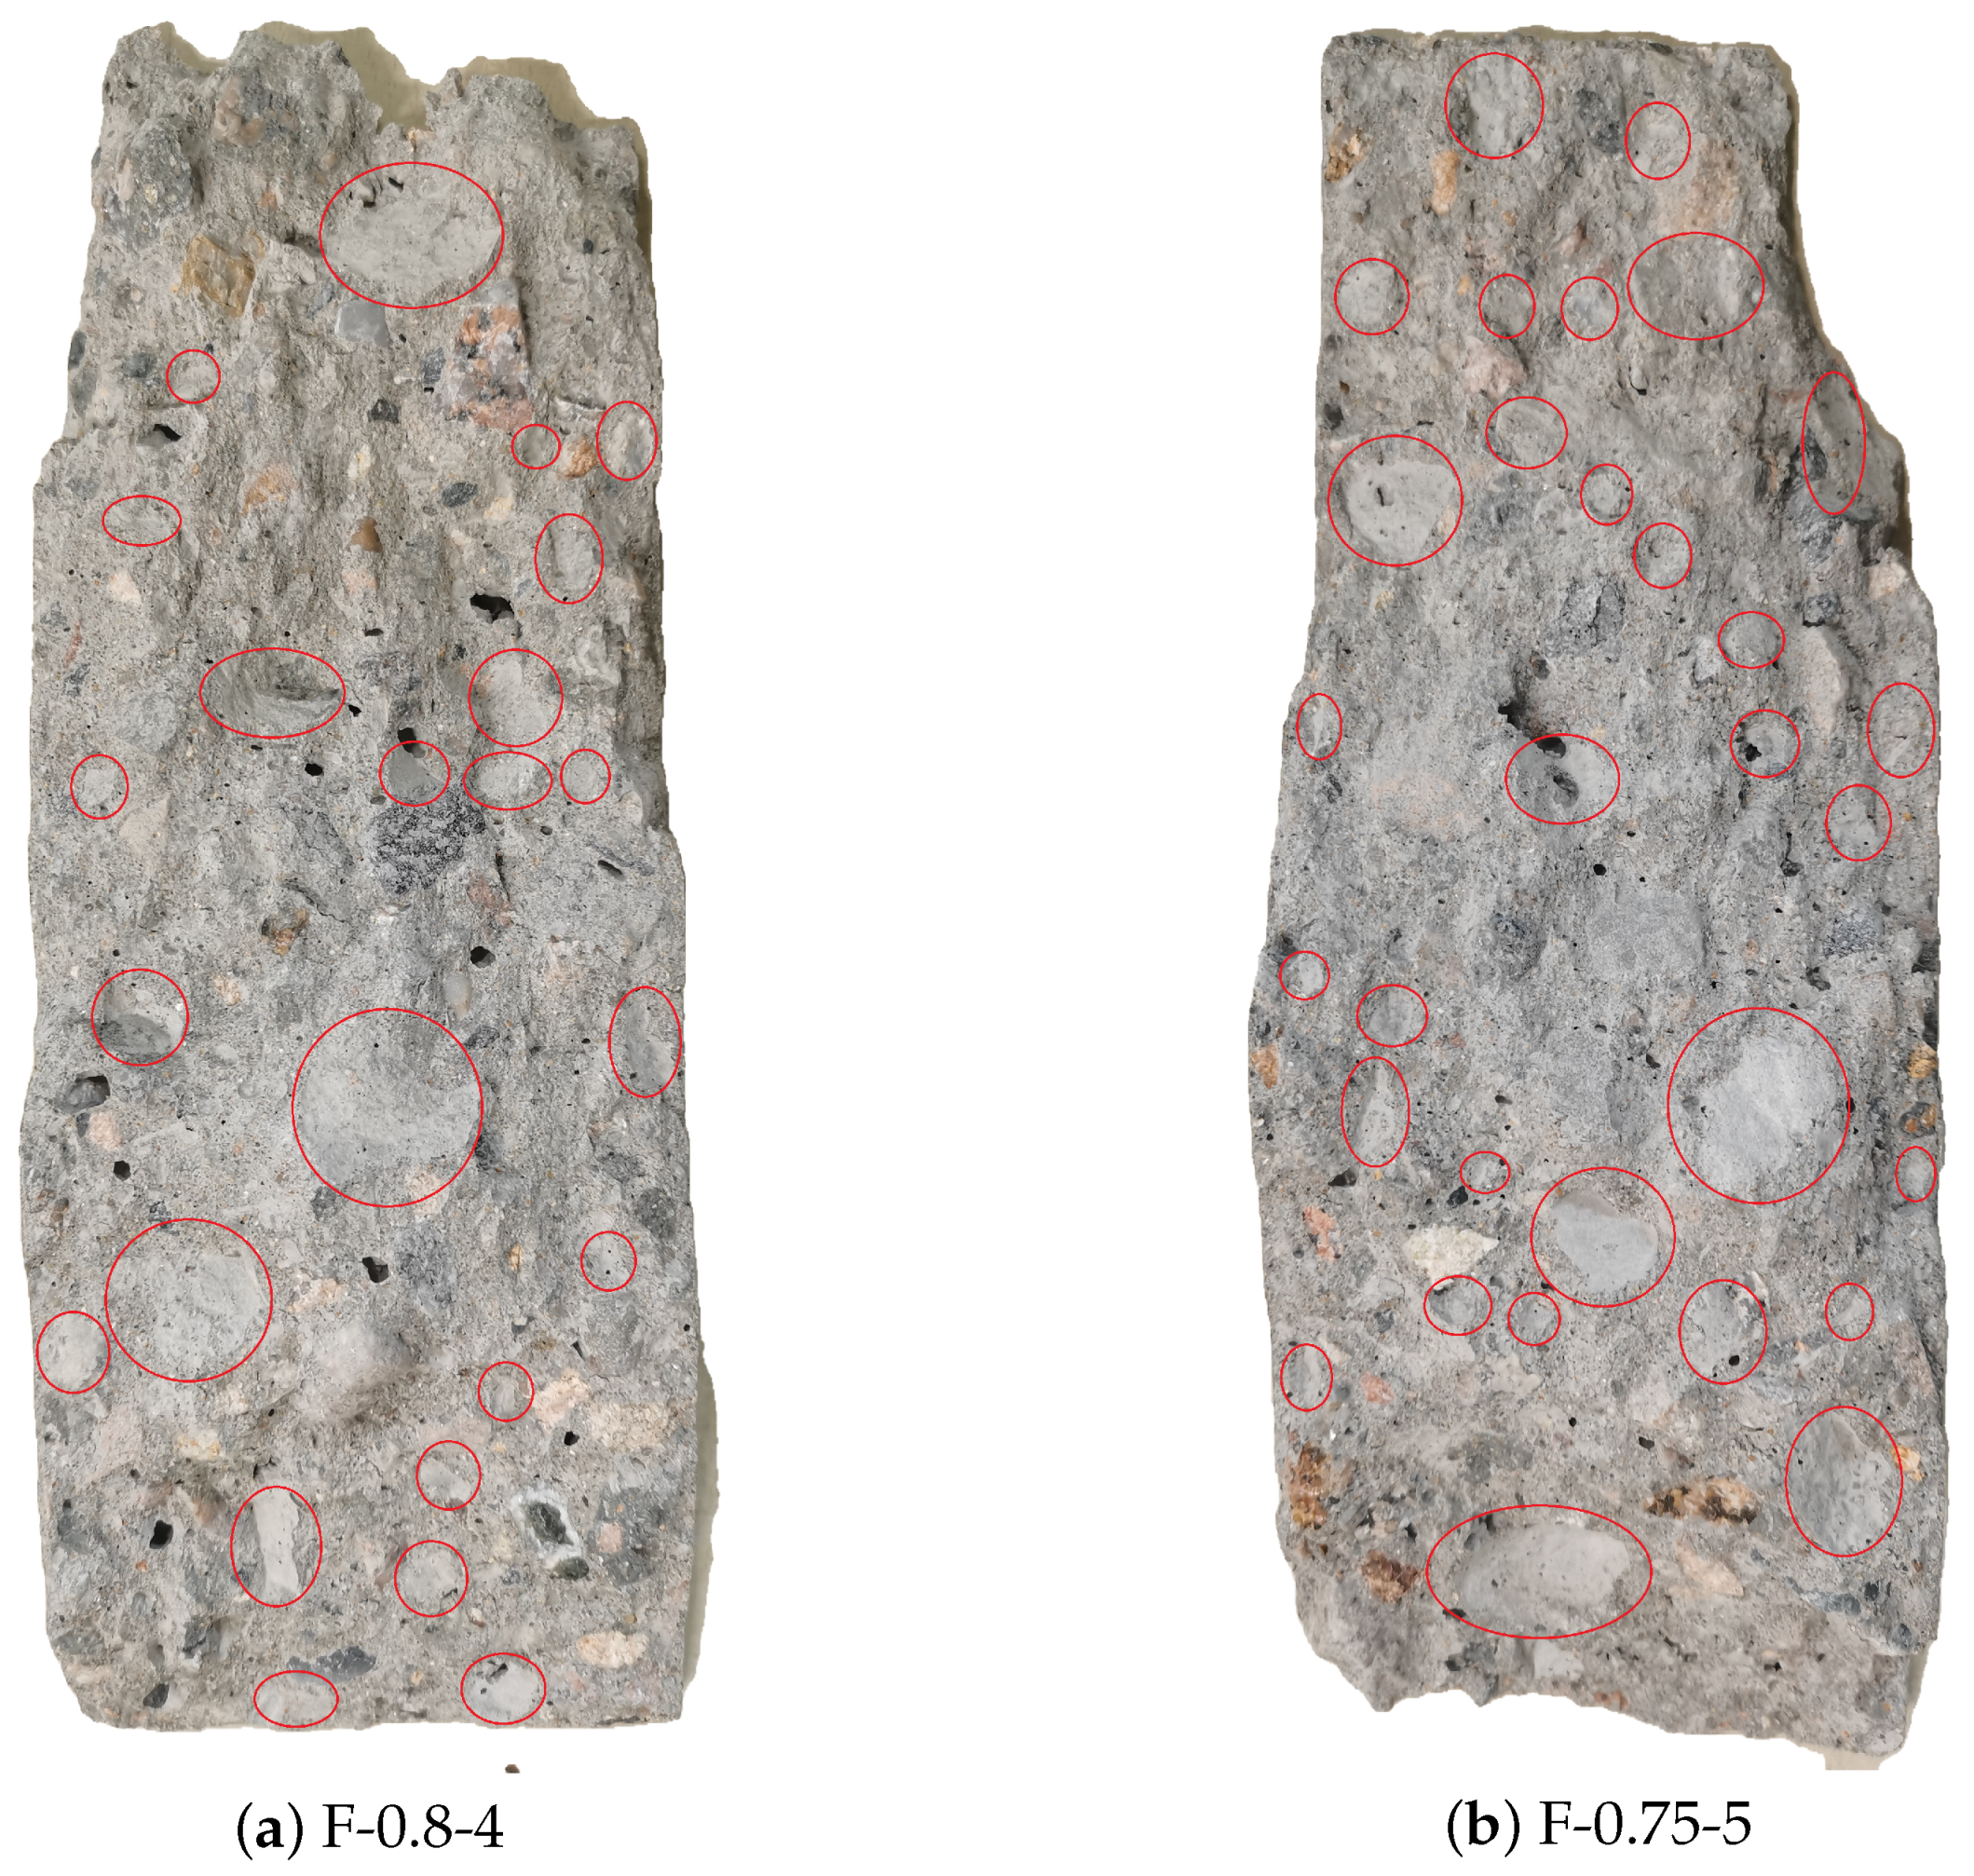
3.3. Fatigue Failure Characteristics
4. Conclusions
Author Contributions
Funding
Institutional Review Board Statement
Informed Consent Statement
Data Availability Statement
Conflicts of Interest
References
- Zhang, Y.; Luo, W.; Wang, J.; Wang, Y.; Xu, Y.; Xiao, J. A review of life cycle assessment of recycled aggregate concrete. Constr. Build. Mater. 2019, 209, 115–125. [Google Scholar] [CrossRef]
- Verian, K.P.; Ashraf, W.; Cao, Y. Properties of recycled concrete aggregate and their influence in new concrete production. Resour. Conserv. Recycl. 2018, 133, 30–49. [Google Scholar] [CrossRef]
- Akhtar, A.; Sarmah, A.K. Construction and demolition waste generation and properties of recycled aggregate concrete: A global perspective. J. Clean. Prod. 2018, 186, 262–281. [Google Scholar] [CrossRef]
- Konečný, P.; Ghosh, P.; Hrabová, K.; Lehner, P.; Teplý, B. Effective methodology of sustainability assessment of concrete mixtures. Mater. Struct. 2020, 53, 1–15. [Google Scholar] [CrossRef]
- Ossa, A.; García, J.; Botero, E. Use of recycled construction and demolition waste (CDW) aggregates: A sustainable alternative for the pavement construction industry. J. Clean. Prod. 2016, 135, 379–386. [Google Scholar] [CrossRef]
- Kisku, N.; Joshi, H.; Ansari, M.; Panda, S.; Nayak, S.; Dutta, S.C. A critical review and assessment for usage of recycled aggregate as sustainable construction material. Constr. Build. Mater. 2017, 131, 721–740. [Google Scholar] [CrossRef]
- Radević, A.; Isailović, I.; Wistuba, M.P.; Zakić, D.; Orešković, M.; Mladenović, G. The Impact of Recycled Concrete Aggregate on the Stiffness, Fatigue, and Low-Temperature Performance of Asphalt Mixtures for Road Construction. Sustainability 2020, 12, 3949. [Google Scholar] [CrossRef]
- Xiao, J.; Li, W.; Sun, Z.; Lange, D.A.; Shah, S.P. Properties of interfacial transition zones in recycled aggregate concrete tested by nanoindentation. Cem. Concr. Compos. 2013, 37, 276–292. [Google Scholar] [CrossRef]
- Butler, L.; West, J.; Tighe, S. The effect of recycled concrete aggregate properties on the bond strength between RCA concrete and steel reinforcement. Cem. Concr. Res. 2011, 41, 1037–1049. [Google Scholar] [CrossRef]
- Evangelista, L.; de Brito, J. Mechanical behaviour of concrete made with fine recycled concrete aggregates. Cem. Concr. Compos. 2007, 29, 397–401. [Google Scholar] [CrossRef]
- Scrivener, K.L. Backscattered electron imaging of cementitious microstructures: Understanding and quantification. Cem. Concr. Compos. 2004, 26, 935–945. [Google Scholar] [CrossRef]
- Lee, G.; Choi, H. Study on interfacial transition zone properties of recycled aggregate by micro-hardness test. Constr. Build. Mater. 2013, 40, 455–460. [Google Scholar] [CrossRef]
- Lyu, K.; Garboczi, E.; She, W.; Miao, C. The effect of rough vs. smooth aggregate surfaces on the characteristics of the interfacial transition zone. Cem. Concr. Compos. 2019, 99, 49–61. [Google Scholar] [CrossRef]
- Mao, Y.; Liu, J.; Shi, C. Autogenous shrinkage and drying shrinkage of recycled aggregate concrete: A review. J. Clean. Prod. 2021, 295, 126435. [Google Scholar] [CrossRef]
- Ragni, D.; Ferrotti, G.; Petit, C.; Canestrari, F. Analysis of shear-torque fatigue test for bituminous pavement interlayers. Constr. Build. Mater. 2020, 254, 119309. [Google Scholar] [CrossRef]
- Chen, H.; Bai, J. Seismic performance evaluation of buckling-restrained braced RC frames considering stiffness and strength requirements and low-cycle fatigue behaviors. Eng. Struct. 2021, 239, 112359. [Google Scholar] [CrossRef]
- Guo, T.; Weng, X.; Liu, C.; Yu, Q.; Zhang, C.; Li, Y. Evaluation of the bonding and fatigue properties of an innovative rapid repair structure for concrete pavement. Constr. Build. Mater. 2020, 235, 117484. [Google Scholar] [CrossRef]
- Sadeghi, K.; Nouban, F. Global and local cumulative damage models for RC structures subjected to monotonic, cyclic or fatigue loading. Int. J. Civ. Eng. 2017, 15, 1063–1075. [Google Scholar] [CrossRef]
- Shi, X.; Mukhopadhyay, A.; Zollinger, D.; Huang, K. Performance evaluation of jointed plain concrete pavement made with portland cement concrete containing reclaimed asphalt pavement. Road Mater. Pavement Des. 2021, 22, 59–81. [Google Scholar] [CrossRef]
- Xiao, J.; Li, H.; Yang, Z. Fatigue behavior of recycled aggregate concrete under compression and bending cyclic loadings. Constr. Build. Mater. 2013, 38, 681–688. [Google Scholar] [CrossRef]
- Thomas, C.; Sosa, I.; Setién, J.; Polanco, J.A.; Cimentada, A.I. Evaluation of the fatigue behavior of recycled aggregate concrete. J. Clean. Prod. 2014, 65, 397–405. [Google Scholar] [CrossRef]
- Thomas, C.; Setién, J.; Polanco, J.; Lombillo, I.; Cimentada, A. Fatigue limit of recycled aggregate concrete. Constr. Build. Mater. 2014, 52, 146–154. [Google Scholar] [CrossRef] [Green Version]
- Saucedo, L.; Yu, R.C.; Medeiros, A.; Zhang, X.; Ruiz, G. A probabilistic fatigue model based on the initial distribution to consider frequency effect in plain and fiber reinforced concrete. Int. J. Fatigue 2013, 48, 308–318. [Google Scholar] [CrossRef]
- Silva, R.; de Brito, J.; Dhir, R. Properties and composition of recycled aggregates from construction and demolition waste suitable for concrete production. Constr. Build. Mater. 2014, 65, 201–217. [Google Scholar] [CrossRef]
- Zhang, K.; Xiao, J. Time-dependent reliability analysis of recycled aggregate concrete beams. J. Build. Eng. 2021, 43, 102659. [Google Scholar] [CrossRef]
- Arora, S.; Singh, S. Analysis of flexural fatigue failure of concrete made with 100% Coarse Recycled Concrete Aggregates. Constr. Build. Mater. 2016, 102, 782–791. [Google Scholar] [CrossRef]
- Arora, S.; Singh, S.P. Fatigue strength and failure probability of concrete made with RCA. Mag. Concrete. Res. 2016, 69, 1–13. [Google Scholar] [CrossRef]
- Castillo, E.; Fernández-Canteli, A. A general regression model for lifetime evaluation and prediction. Int. J. Fract. 2001, 107, 117–137. [Google Scholar] [CrossRef]
- Goel, S.; Singh, S.P.; Singh, P. Fatigue analysis of plain and fiber-reinforced self-consolidating concrete. Mater. J. 2012, 109, 573–582. [Google Scholar] [CrossRef]
- Lio, Y.; Tsai, T.R.; Wu, S.J. Acceptance sampling plans from truncated life tests based on the birnbaum-saunders distribution for percentiles. Commun. Stat.-Simul. Comput. 2010, 39, 119–136. [Google Scholar] [CrossRef]
- Mohammadi, Y.; Kaushik, S. Flexural fatigue-life distributions of plain and fibrous concrete at various stress levels. J. Mater. Civ. Eng. 2005, 17, 650–658. [Google Scholar] [CrossRef]
- Oh, B. Fatigue-life distributions of concrete for various stress levels. Mater. J. 1991, 88, 122–128. [Google Scholar] [CrossRef]
- Singh, S.P.; Kaushik, S. Flexural fatigue life distributions and failure probability of steel fibrous concrete. Mater. J. 2000, 97, 658–667. [Google Scholar] [CrossRef]
- Li, L.; Zheng, Q.; Han, B.; Ou, J. Fatigue behaviors of graphene reinforcing concrete composites under compression. Int. J. Fatigue 2021, 151, 106354. [Google Scholar] [CrossRef]
- Wu, B.; Jin, H. Compressive fatigue behavior of compound concrete containing demolished concrete lumps. Constr. Build. Mater. 2019, 210, 140–156. [Google Scholar] [CrossRef]
- Fan, Z.; Sun, Y. Detecting and evaluation of fatigue damage in concrete with industrial computed tomography technology. Constr. Build. Mater. 2019, 223, 794–805. [Google Scholar] [CrossRef]
- Fan, Z.; Sun, Y. A Study on Fatigue Behaviors of Concrete under Uniaxial Compression: Testing, Analysis, and Simulation. J. Test. Eval. 2021, 49, 20190900. [Google Scholar] [CrossRef]
- Fan, Z. Study on Fatigue Damage of Concrete Based on ICT Technique. Master’s Thesis, Harbin Institute of Technology, Harbin, China, 2018. [Google Scholar]
- Lenschow, R. Long term random dynamic loading of concrete structures. Mater. Struct. 1980, 13, 274–278. [Google Scholar] [CrossRef]
- Hsu, T. Fatigue of Plain Concrete. J. Am. Concr. Inst. 1981, 78, 292–305. [Google Scholar] [CrossRef]
- Zheng, K.; Sun, W.; Zhao, Q.; Zhang, Y.; Zhou, W.; Guo, L. Fatigue equation based on properties of concrete matrix and interfacial transition zone. J. Chin. Ceram. Soc. 2007, 35, 236–241. [Google Scholar] [CrossRef]
- Mehta, P.; Monteiro, P. Concrete: Microstructure, Properties, and Material; McGraw-Hill Education: New York, NY, USA, 2014; pp. 236–241. [Google Scholar]
- Karsan, I.; Jirsa, J. Behavior of Concrete Under Compressive Loading. J. Struct. Div. 1969, 95, 2543–2564. [Google Scholar] [CrossRef]
- Cachim, P.; Figueiras, J.; Pereira, P. Fatigue behavior of fiber-reinforced concrete in compression. Cem. Concr. Compos. 2002, 24, 211–217. [Google Scholar] [CrossRef]


| Cement | Fly Ash | Sand | Recycled Coarse Aggregate | Water | Additional Water | Water Reducer |
|---|---|---|---|---|---|---|
| 288 | 72 | 622 | 1080 | 143 | 55 | 0.648 |
| Specimen Number | Stress Level | Fatigue Life/N | lnN | p | ln[ln(1/p)] |
|---|---|---|---|---|---|
| F-0.9-1 | 17 | 2.833 | 0.833 | −1.702 | |
| F-0.9-2 | 226 | 5.421 | 0.667 | −0.903 | |
| F-0.9-3 | 0.9 | 261 | 5.565 | 0.500 | −0.367 |
| F-0.9-4 | 416 | 6.031 | 0.333 | 0.094 | |
| F-0.9-5 | 5329 | 8.581 | 0.167 | 0.583 | |
| F-0.85-1 | 55 | 4.007 | 0.833 | −1.702 | |
| F-0.85-2 | 137 | 4.920 | 0.667 | −0.903 | |
| F-0.85-3 | 0.85 | 3690 | 8.213 | 0.500 | −0.367 |
| F-0.85-4 | 5038 | 8.525 | 0.333 | 0.094 | |
| F-0.85-5 | 6879 | 8.836 | 0.167 | 0.583 | |
| F-0.8-1 | 797 | 6.681 | 0.833 | −1.702 | |
| F-0.8-2 | 2268 | 7.727 | 0.667 | −0.903 | |
| F-0.8-3 | 0.8 | 3135 | 8.050 | 0.500 | −0.367 |
| F-0.8-4 | 10,982 | 9.304 | 0.333 | 0.094 | |
| F-0.8-5 | 34,139 | 10.438 | 0.167 | 0.583 | |
| F-0.75-1 | 3910 | 8.271 | 0.833 | −1.702 | |
| F-0.75-2 | 7574 | 8.932 | 0.667 | −0.903 | |
| F-0.75-3 | 0.75 | 34,987 | 10.463 | 0.500 | −0.367 |
| F-0.75-4 | 91,288 | 11.422 | 0.333 | 0.094 | |
| F-0.75-5 | 380,327 | 12.849 | 0.167 | 0.583 |
| Stress Level | b | c | R | Na |
|---|---|---|---|---|
| 0.9 | 0.4092 | 2.7869 | 0.8967 | 907 |
| 0.85 | 0.3668 | 2.9911 | 0.8789 | 3479 |
| 0.8 | 0.5902 | 5.4416 | 0.9473 | 10,096 |
| 0.75 | 0.4661 | 5.3013 | 0.9551 | 87,007 |
| Type of Concrete | Fatigue Equation | |
|---|---|---|
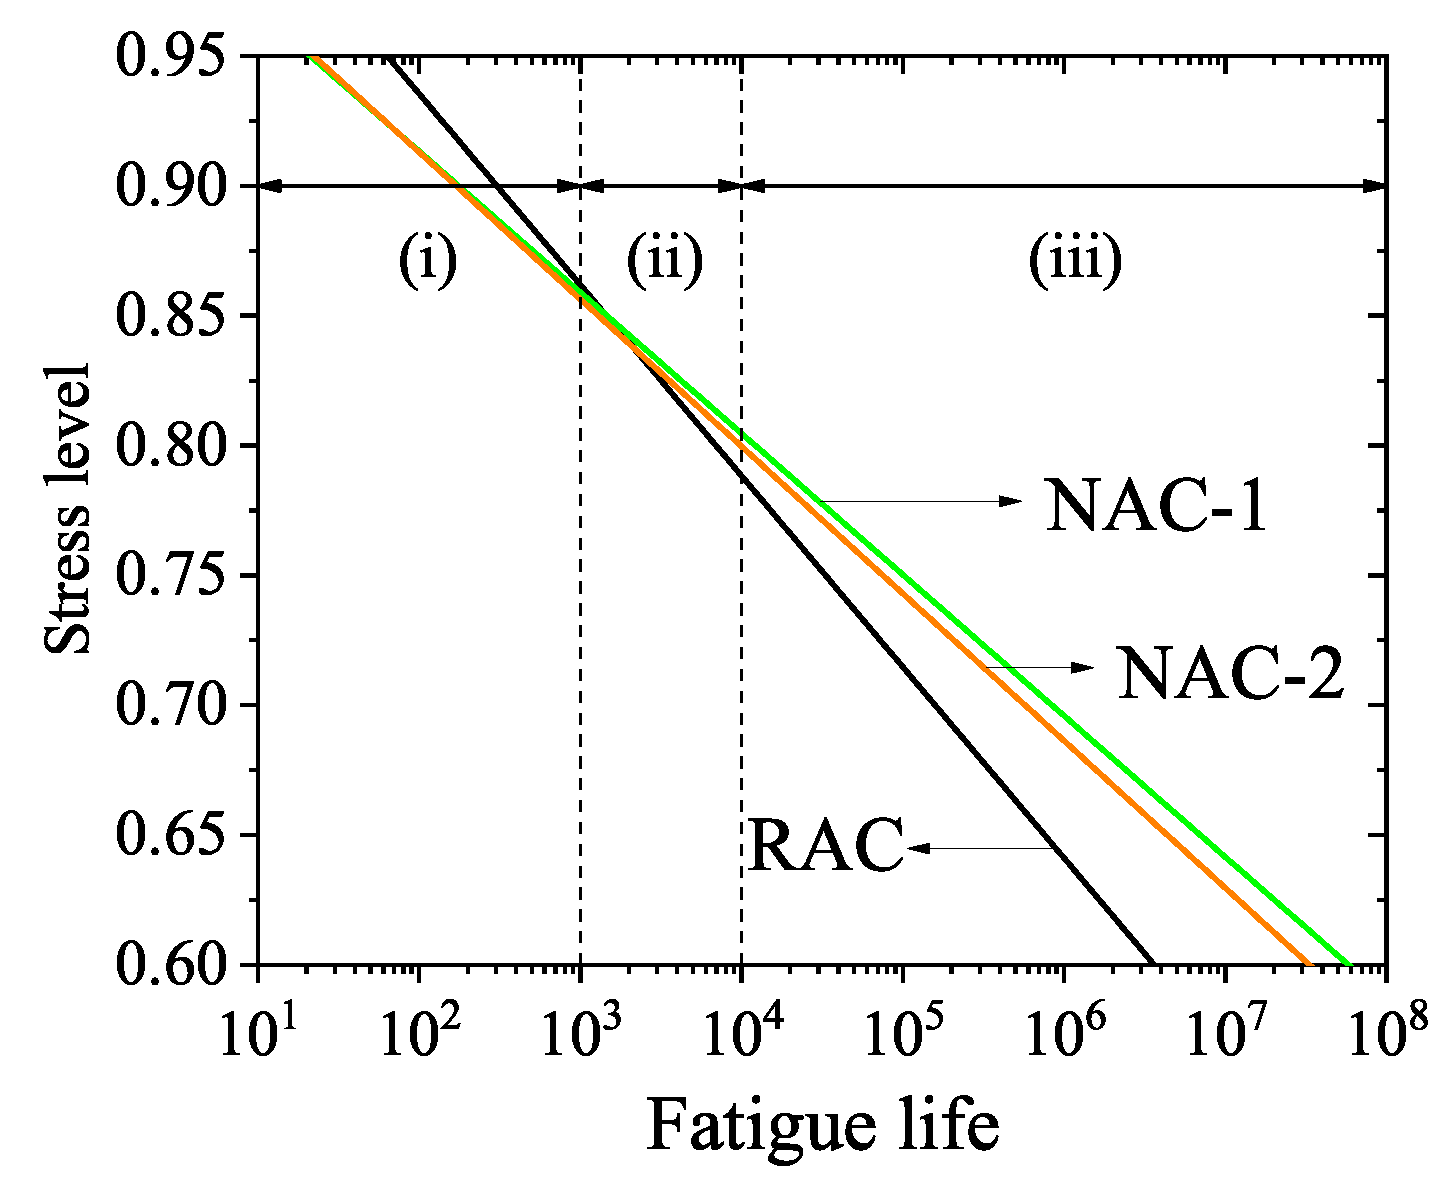
| RAC | ||
| NAC-1 | ||
| NAC-2 |
| Stress Level | RAC | NAC-1 | NAC-2 |
|---|---|---|---|
| 0.85 | 1281 | 1331 | 1274 |
| 0.8 | 5426 | 15,240 | 10,122 |
| 0.75 | 39,632 | 88,646 | 73,966 |
| Concrete Type | Cement | Water | Sand | Coarse Aggregate | Fly ash | Ground Slag |
|---|---|---|---|---|---|---|
| NAC-1 | 235 | 180 | 780 | 980 | 90 | 75 |
| NAC-2 | 330 | 175 | 985 | 720 | 60 | 75 |
Publisher’s Note: MDPI stays neutral with regard to jurisdictional claims in published maps and institutional affiliations. |
© 2021 by the authors. Licensee MDPI, Basel, Switzerland. This article is an open access article distributed under the terms and conditions of the Creative Commons Attribution (CC BY) license (https://creativecommons.org/licenses/by/4.0/).
Share and Cite
You, F.; Luo, S.; Zheng, J.; Lin, K. Analysis of Compressive Fatigue Failure of Recycled Aggregate Concrete. Materials 2021, 14, 4620. https://doi.org/10.3390/ma14164620
You F, Luo S, Zheng J, Lin K. Analysis of Compressive Fatigue Failure of Recycled Aggregate Concrete. Materials. 2021; 14(16):4620. https://doi.org/10.3390/ma14164620
Chicago/Turabian StyleYou, Fan, Surong Luo, Jianlan Zheng, and Kaibin Lin. 2021. "Analysis of Compressive Fatigue Failure of Recycled Aggregate Concrete" Materials 14, no. 16: 4620. https://doi.org/10.3390/ma14164620
APA StyleYou, F., Luo, S., Zheng, J., & Lin, K. (2021). Analysis of Compressive Fatigue Failure of Recycled Aggregate Concrete. Materials, 14(16), 4620. https://doi.org/10.3390/ma14164620