
Optimization of Process Parameters in CNC Turning of Aluminum 7075 Alloy Using L27 Array-Based Taguchi Method


 ,
,  ,
, 

Abstract
:1. Introduction and Background
2. Experimental Arrangement and Methodology
3. Assessment of Results Using Taguchi Analysis and RSM
4. Conclusions
Author Contributions
Funding
Institutional Review Board Statement
Informed Consent Statement
Data Availability Statement
Acknowledgments
Conflicts of Interest
References
- Rajmohan, T.; Palanikumar, K.; Prakash, S. Grey-fuzzy algorithm to optimise machining parameters in drilling of hybrid metal matrix composites. Compos. Part B Eng. 2013, 50, 297–308. [Google Scholar] [CrossRef]
- Kılıçkap, E.; Çakır, O.; Aksoy, M.; Inan, A. Study of tool wear and surface roughness in machining of homogenised SiC-p reinforced aluminium metal matrix composite. J. Mater. Process. Technol. 2005, 164-165, 862–867. [Google Scholar] [CrossRef]
- Grzesik, W. Influence of tool wear on surface roughness in hard turning using differently shaped ceramic tools. Wear 2008, 265, 327–335. [Google Scholar] [CrossRef]
- Aouici, H.; Yallese, M.A.; Chaoui, K.; Mabrouki, T.; Rigal, J.-F. Analysis of surface roughness and cutting force components in hard turning with CBN tool: Prediction model and cutting conditions optimization. Measurement 2012, 45, 344–353. [Google Scholar] [CrossRef]
- Kulandaivel, A.; Kumar, S. Effect of magneto rheological minimum quantity lubrication on machinability, wettability and tribological behavior in turning of Monel K500 alloy. Mach. Sci. Technol. 2020, 24, 810–836. [Google Scholar] [CrossRef]
- Sathish, T.; Sevvel, P.; Sudharsan, P.; Vijayan, V. Investigation and optimization of laser welding process parameters for AA7068 aluminium alloy butt joint. Mater. Today Proc. 2021, 37, 1672–1677. [Google Scholar] [CrossRef]
- Ross, P.J. Taguchi Techniques for Quality Engineering, 2nd ed.; McGraw-Hill Professional: New York, NY, USA, 1988. [Google Scholar]
- Elsayed, E.; Chen, A. Optimal levels of process parameters for products with multiple characteristics. Int. J. Prod. Res. 1993, 31, 1117–1132. [Google Scholar] [CrossRef]
- Sathish, T.; Karthick, S. Wear behaviour analysis on Aluminium Alloy 7050 with Reinforced SiC through Taguchi approach. J. Mater. Res. Technol. 2020, 9, 3481–3487. [Google Scholar] [CrossRef]
- Ranganath, M.S.; Vipin, H. Optimization of Process Parameters in Turning Operation Using Taguchi Method and Anova: A Review. Int. J. Emerg. Technol. Adv. Eng. 2013, 1, 31–45. [Google Scholar]
- Mandal, K.; Kuar, A.S.; Mitra, S. Experimental investigation on laser micro-machining of Al 7075 Alloy. Opt. Laser Technol. 2018, 107, 260–267. [Google Scholar] [CrossRef]
- Karabulut, S. Optimization of surface roughness and cutting force during AA7039/Al2O3 metal matrix composites milling using neural networks and Taguchi method. Measurement 2015, 66, 139–149. [Google Scholar] [CrossRef]
- Muñoz-Escalona, P.; Maropoulos, P.G. Artificial neural networks for surface roughness prediction when face milling Al 7075–T7351. J. Mater. Eng. Perform. 2010, 19, 185–193. [Google Scholar] [CrossRef]
- Ajithkumar, J.P.; Xavior, M.A. Cutting Force and Surface Roughness Analysis During Turning of Al 7075 Based Hybrid Composites. Procedia Eng. 2017, 174, 1110–1118. [Google Scholar] [CrossRef]
- Azizi, M.W.; Belhadi, S.; Yallese, M.A.; Mabrouki, T.; Rigal, J.-F. Surface roughness and cutting forces modeling for optimization of machining condition in finish hard turning of AISI 52100 steel. J. Mech. Sci. Technol. 2012, 26, 4105–4114. [Google Scholar] [CrossRef]
- Tzeng, C.-J.; Lin, Y.-H.; Yang, Y.-K.; Jeng, M.-C. Optimization of turning operations with multiple performance characteristics using the Taguchi method and Grey relational analysis. J. Mater. Process. Technol. 2009, 209, 2753–2759. [Google Scholar] [CrossRef]
- Sathish, T.; Sabarirajan, N.; Karthick, S. Machining parameters optimization of Aluminium Alloy 6063 with reinforcement of SiC composites. Mater. Today Proc. 2020, 33, 2559–2563. [Google Scholar] [CrossRef]
- Chen, D.-C.; Chen, C.-F. Use of Taguchi method to study a robust design for the sectioned beams curvature during rolling. J. Mater. Process. Technol. 2007, 190, 130–137. [Google Scholar] [CrossRef]
- Lin, C.L. Use of the Taguchi Method and Grey Relational Analysis to Optimize Turning Operations with Multiple Performance Characteristics. Mater. Manuf. Process. 2004, 19, 209–220. [Google Scholar] [CrossRef]
- Lavanya, K.M.; Suresh, R.K.; Priya, A.S.K.; Reddy, V.D. Optimization of process parameters in turning operation of AISI-1016 alloy steels with CBN using Taguchi method and ANOVA. IOSR J. Mech. Civ. Eng. 2013, 7, 24–27. [Google Scholar] [CrossRef]
- Sathish, T. Experimental investigation of machined hole and optimization of machining parameters using electrochemical machining. J. Mater. Res. Technol. 2019, 8, 4354–4363. [Google Scholar] [CrossRef]
- Verma, N.K.; Sikarwar, A.S. Optimizing Turning Process by Taguchi Method Under Various Machining Parameters. Int. J. Eng. Res. Technol. 2015, 2, 307–312. [Google Scholar]
- Jha, S.K. Parametric optimization of turning process using Taguchi method and ANOVA analysis. Int. J. Adv. Eng. Technol. 2016, 9, 289. [Google Scholar]
- Rudrapati, R.; Sahoo, P.; Bandyopadhyay, A. Optimization of process parameters in CNC turning of aluminium alloy using hybrid RSM cum TLBO approach. IOP Conf. Ser. Mater. Sci. Eng. 2016, 149, 012039. [Google Scholar] [CrossRef] [Green Version]
- Khorasani, A.M.; Yazdi, M.R.S.; Safizadeh, M.S. Tool Life Prediction in Face Milling Machining of 7075 Al by Using Artificial Neural Networks (ANN) and Taguchi Design of Experiment (DOE). Int. J. Eng. Technol. 2011, 3, 30–35. [Google Scholar] [CrossRef] [Green Version]
- Sathish, T. Optimization of Co 2 laser cutting parameters on Austenite stainless steel using Gray Relational Analysis. Int. J. Mech. Eng. Technol. 2019, 10, 984–992. [Google Scholar]


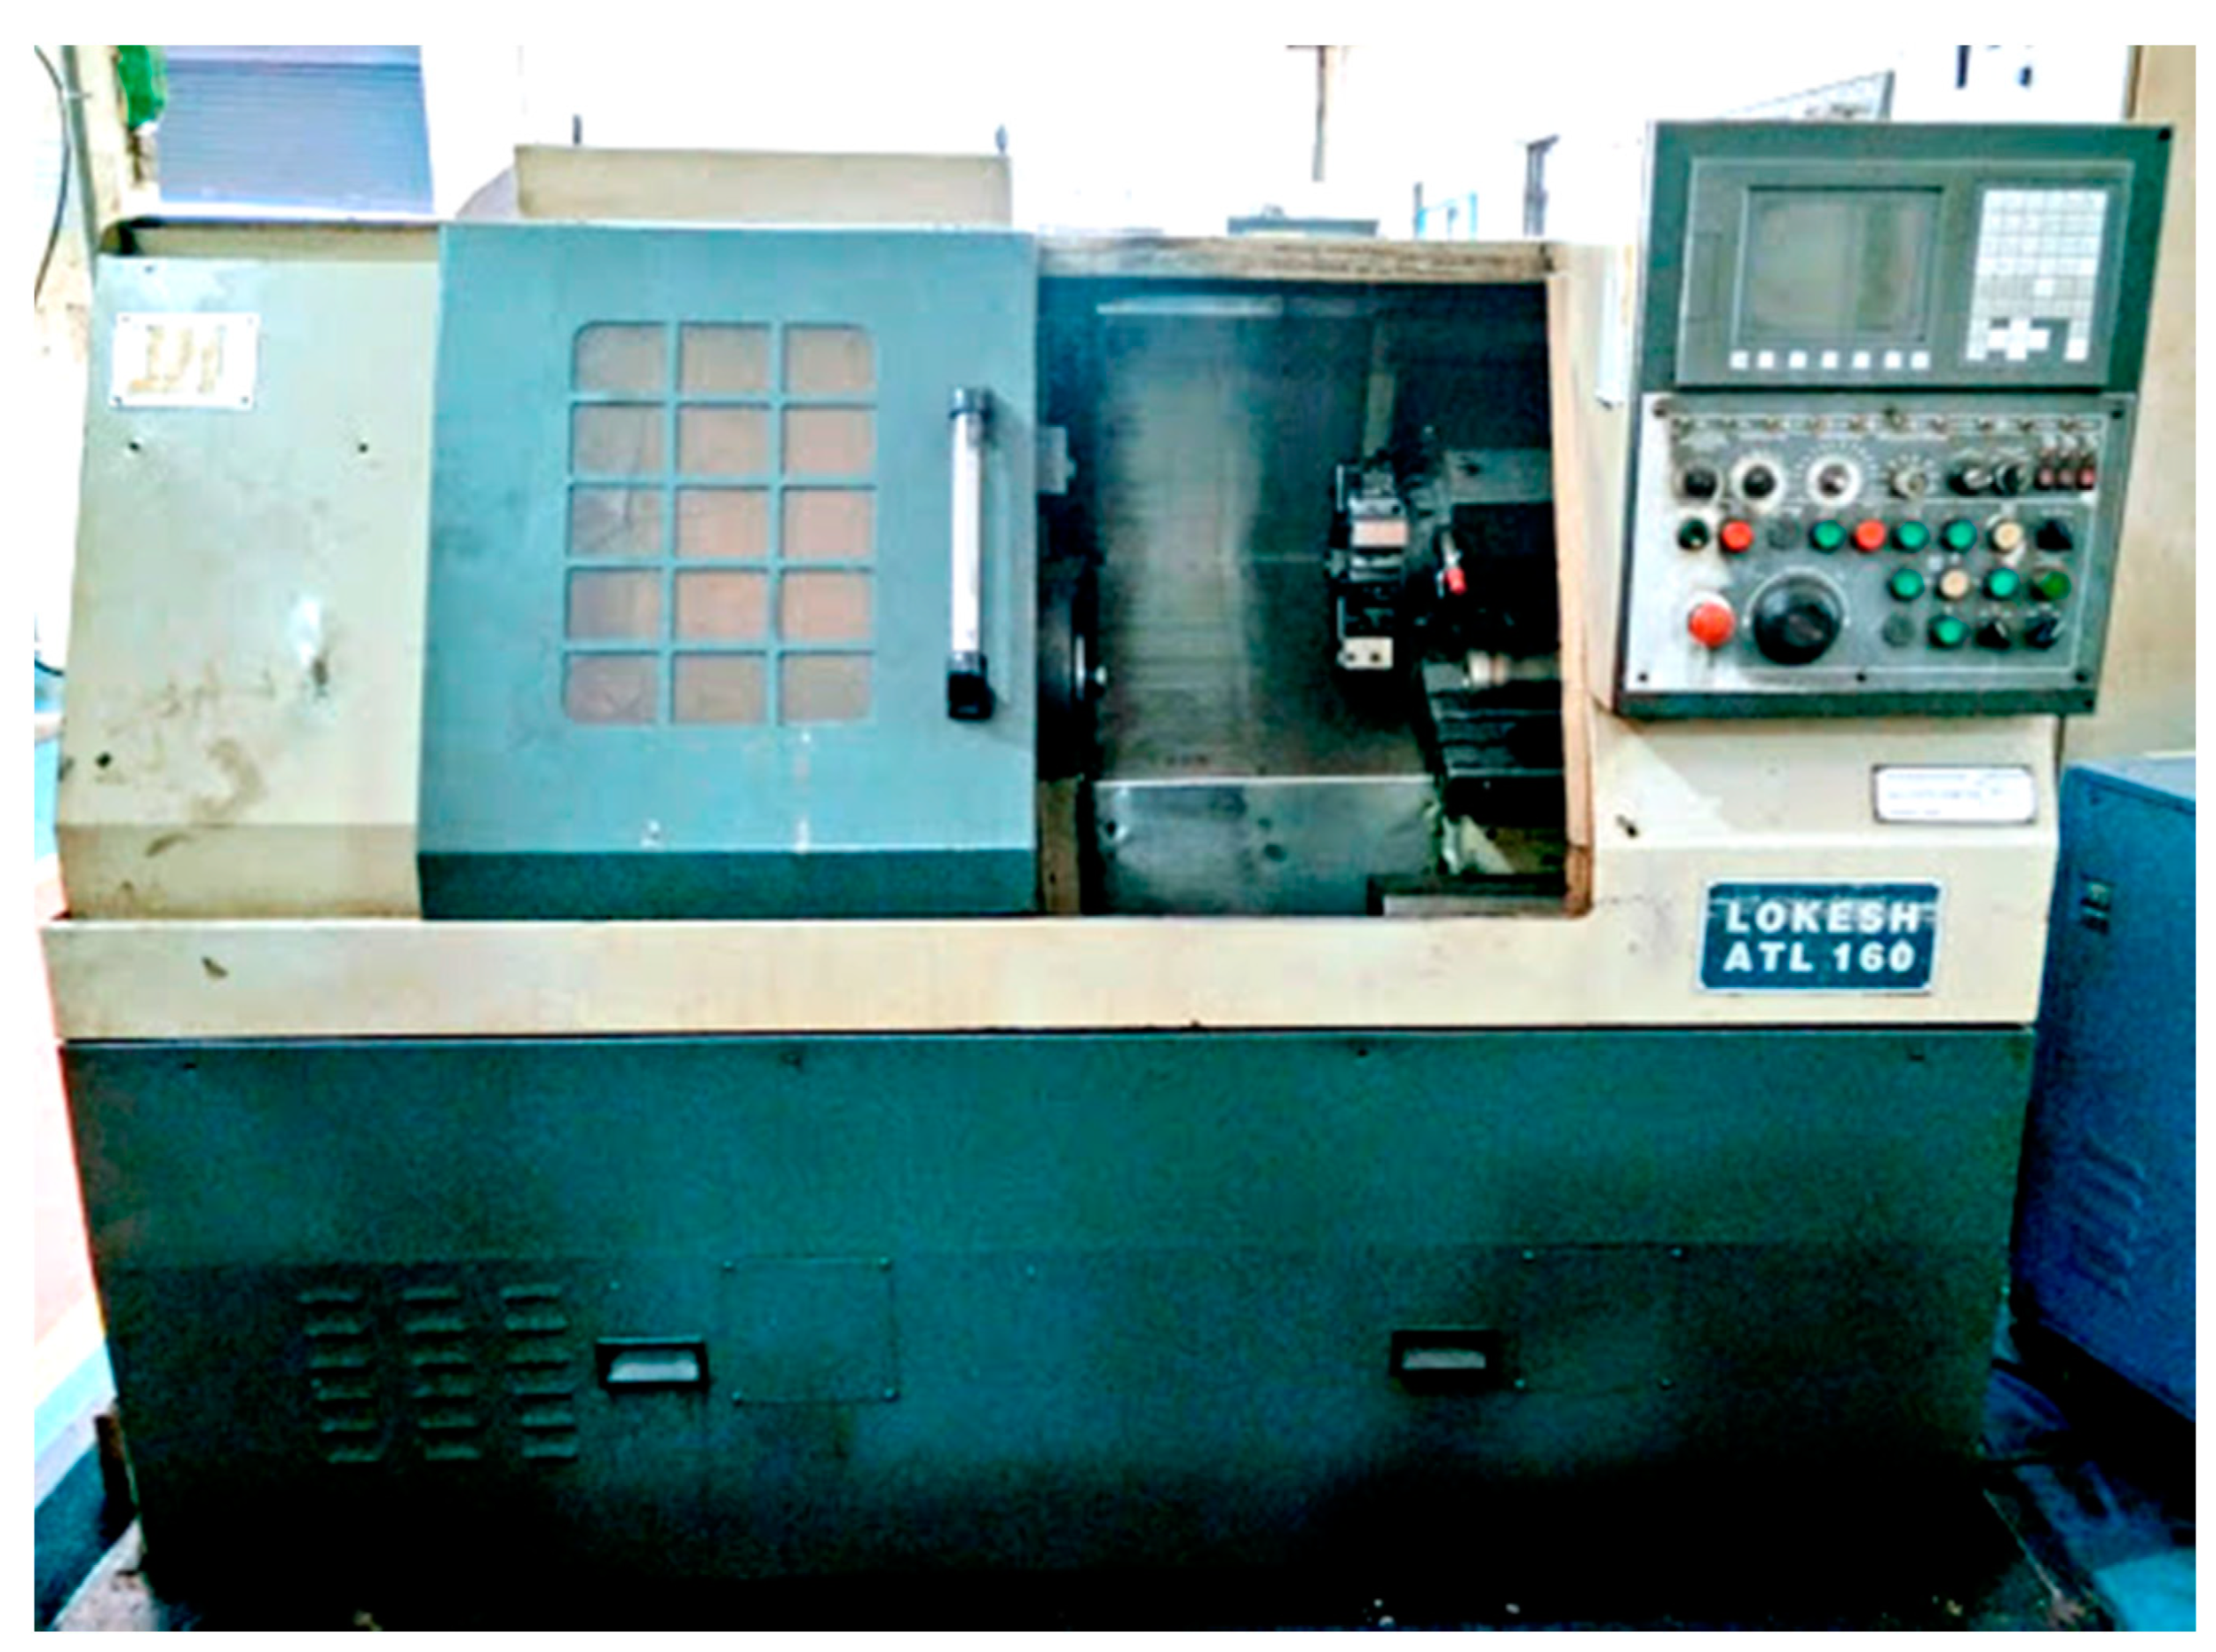
| CNC machine specifications (heavy-duty variant of std TL-160) | Model | ATL 160 | ||
| Chuck Size | 165 mm | |||
| Tail Stock | Hydraulic | |||
| Spindle Bore | 25.5 mm | |||
| Spindle Power | 3.5/5.5 KW | |||
| Control | FANUC Series 0i mate. | |||
| Turning Process Parameters | Speed (N) in rpm | 800 | 1200 | 1600 |
| Feed (F) in mm per rev | 0.150 | 0.200 | 0.250 | |
| Depth of cut (D) in mm | 1.00 | 1.50 | 2.00 | |
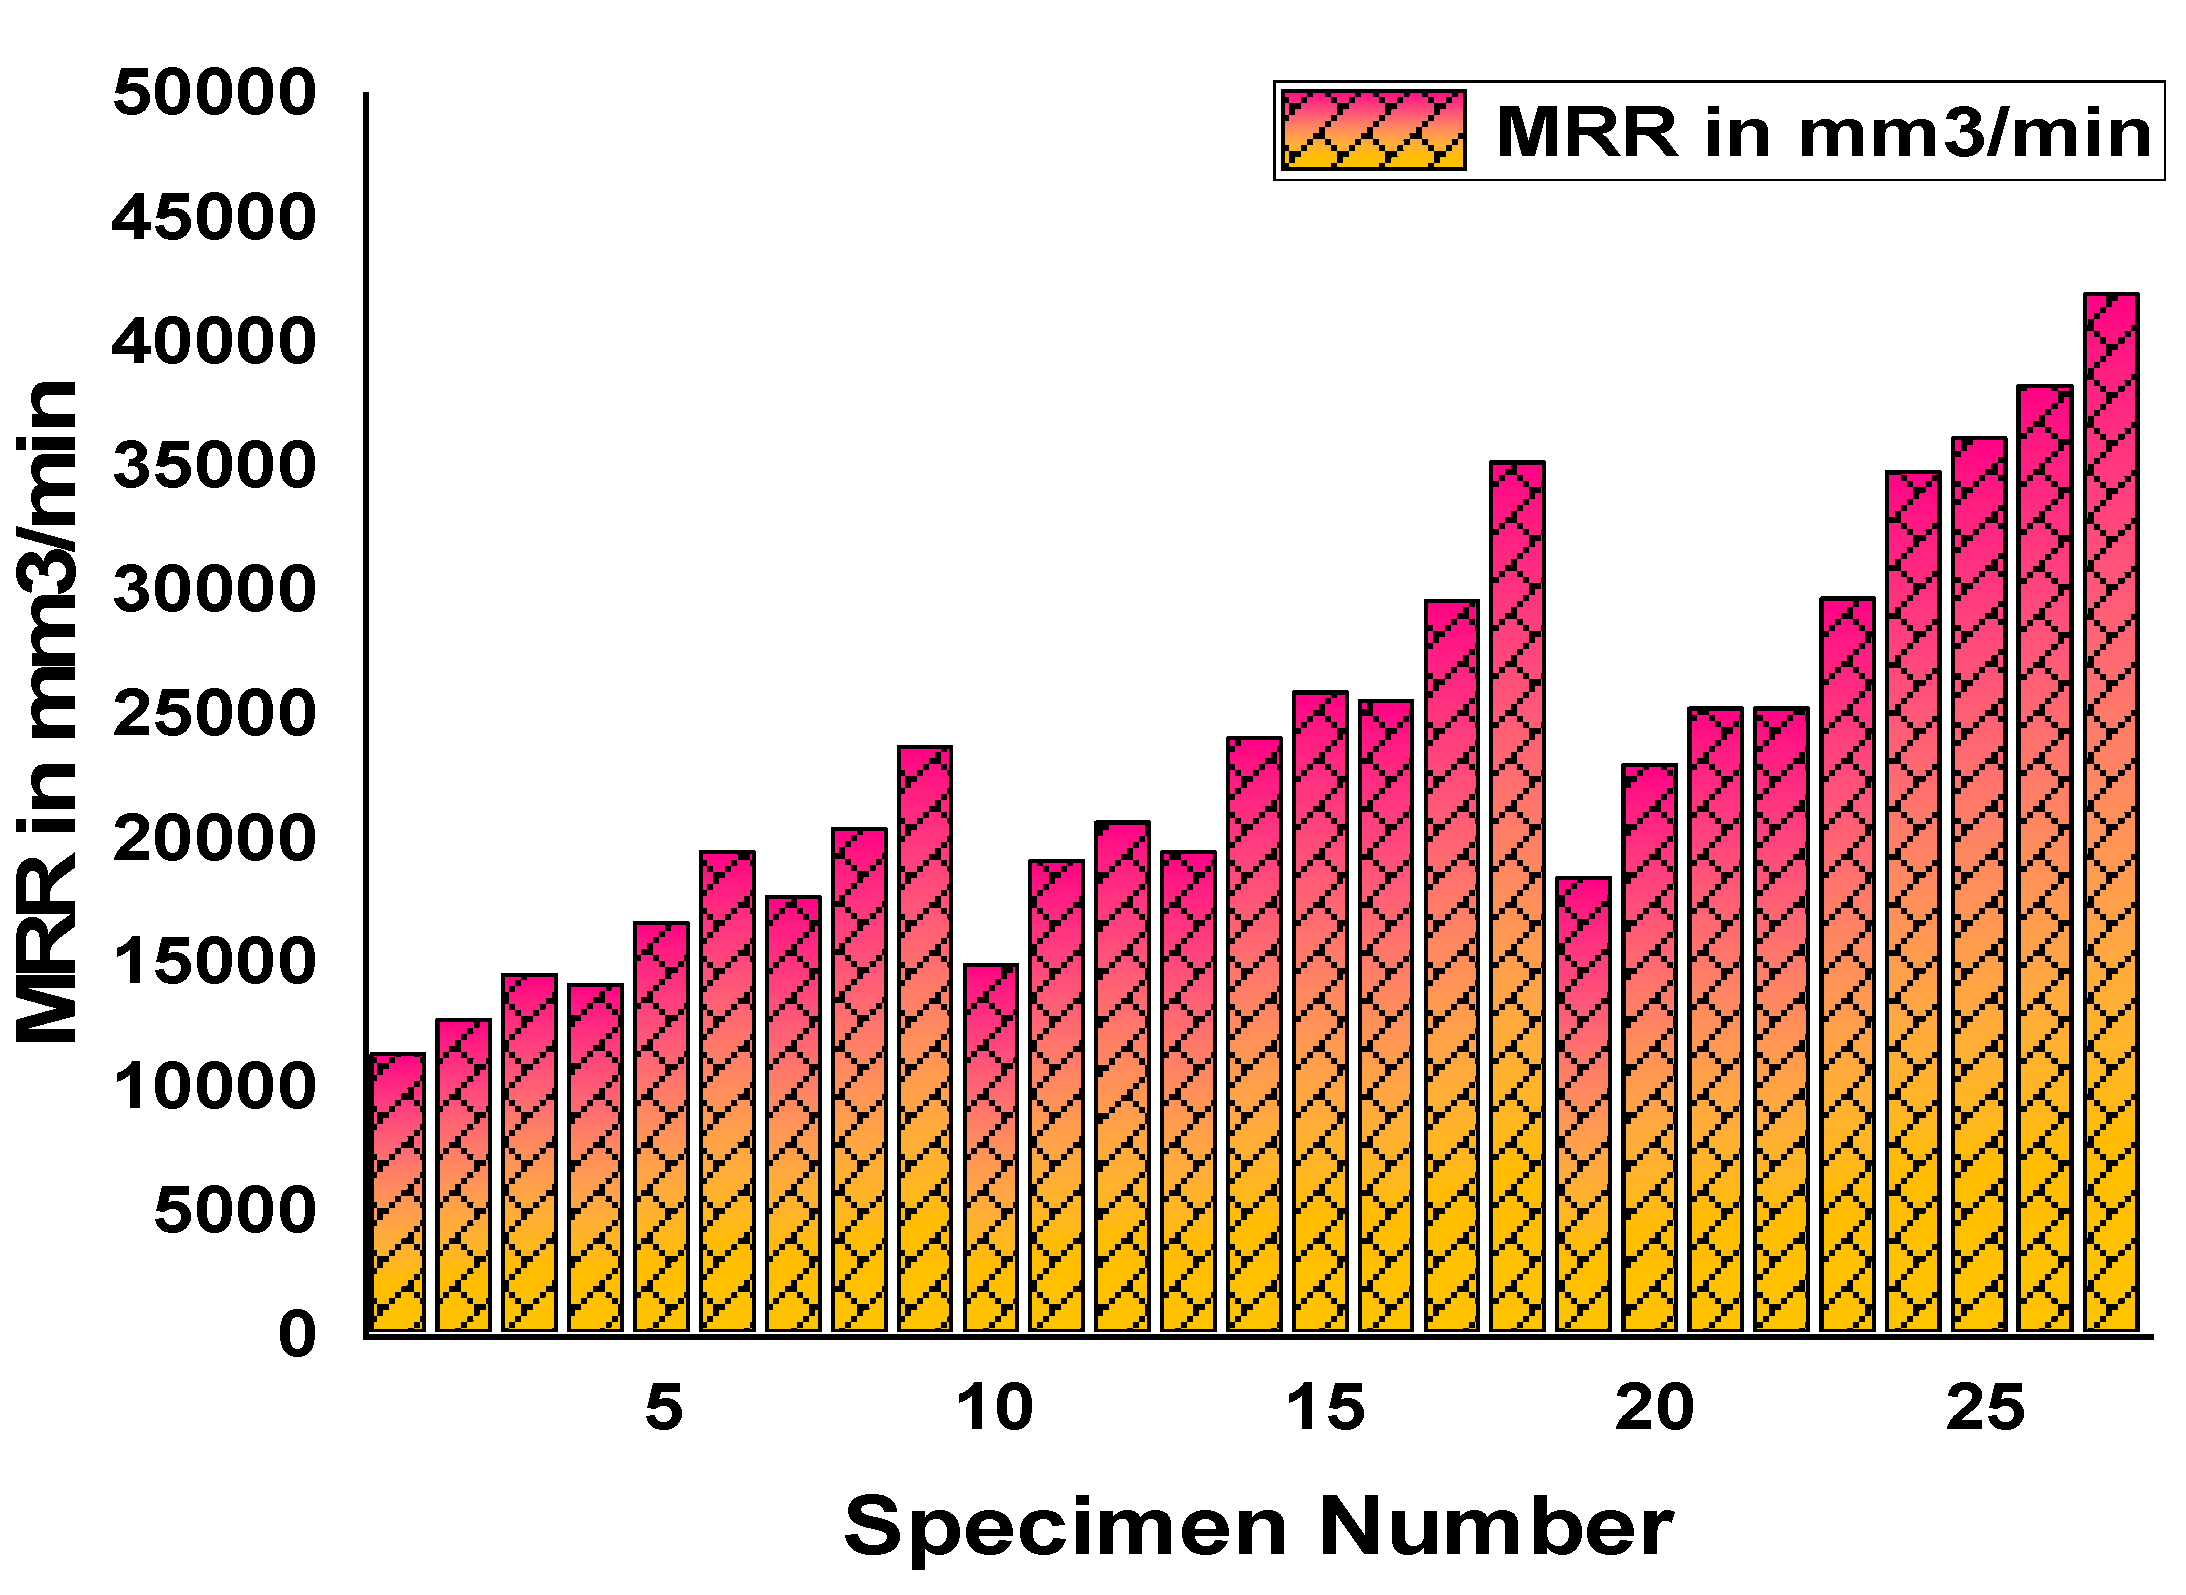
| Responses | MRR—Metal removal rate in mm3/min | |||
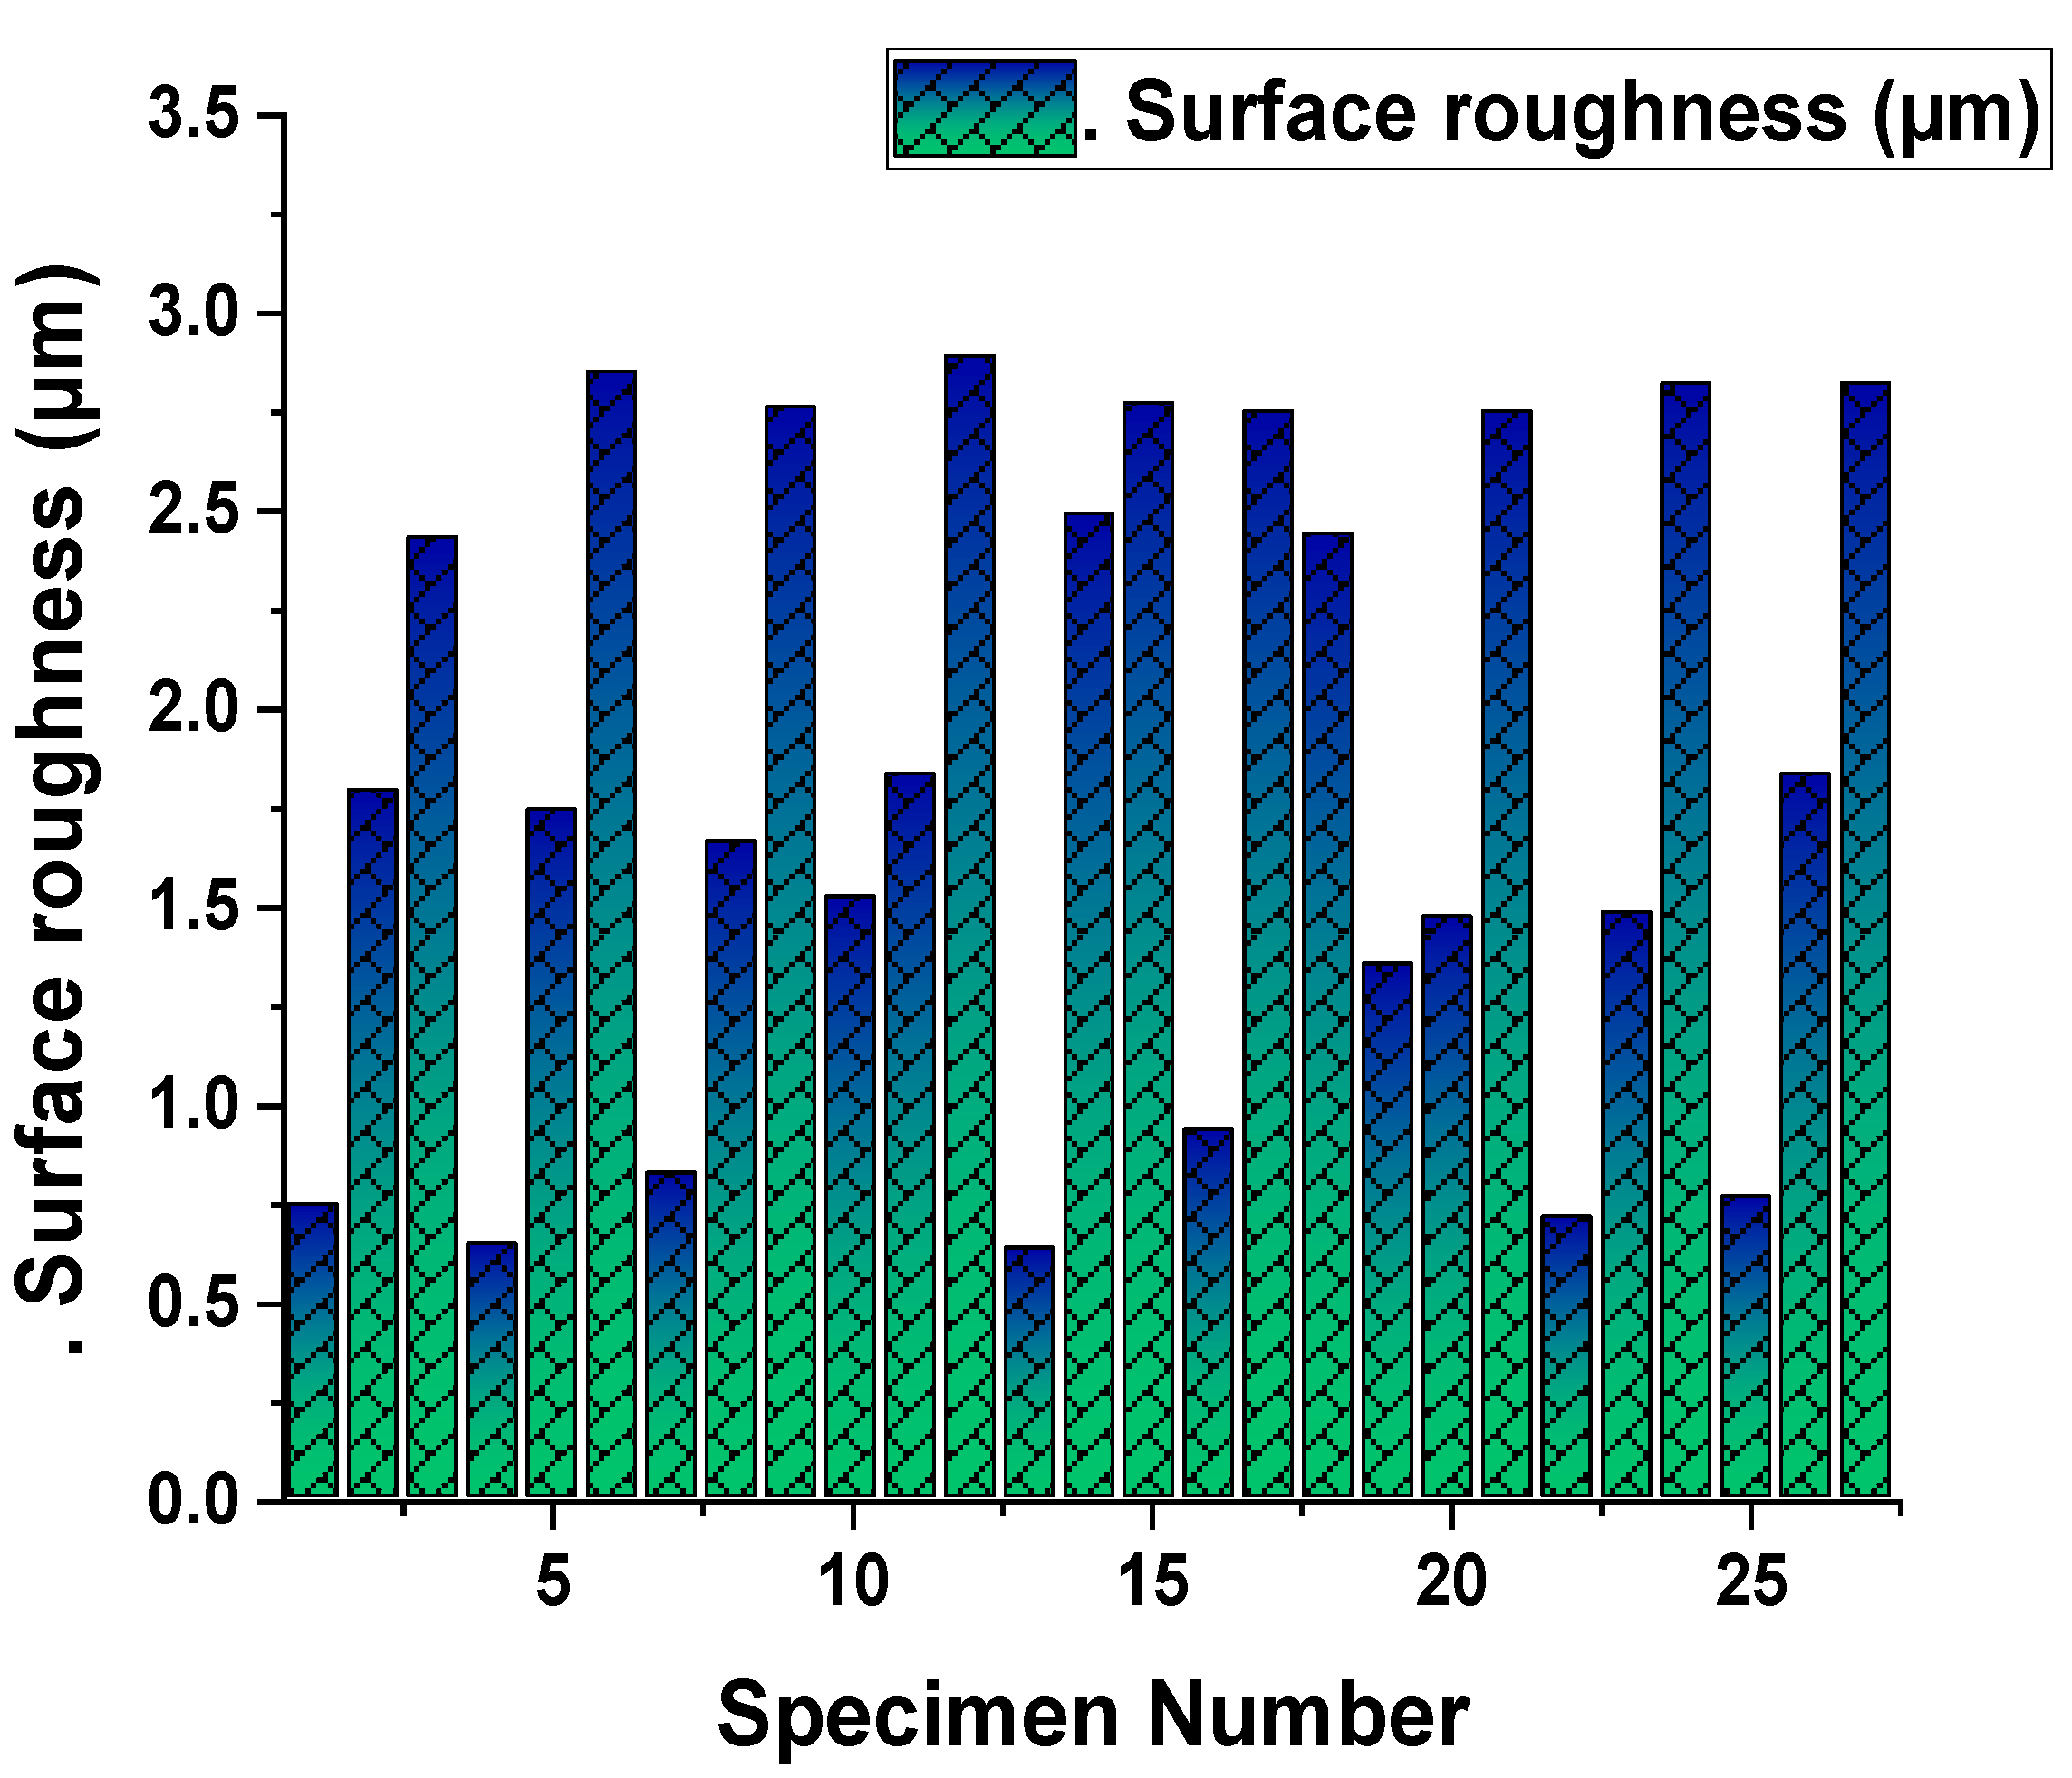
| SR—Roughness on machined surface in µm | ||||
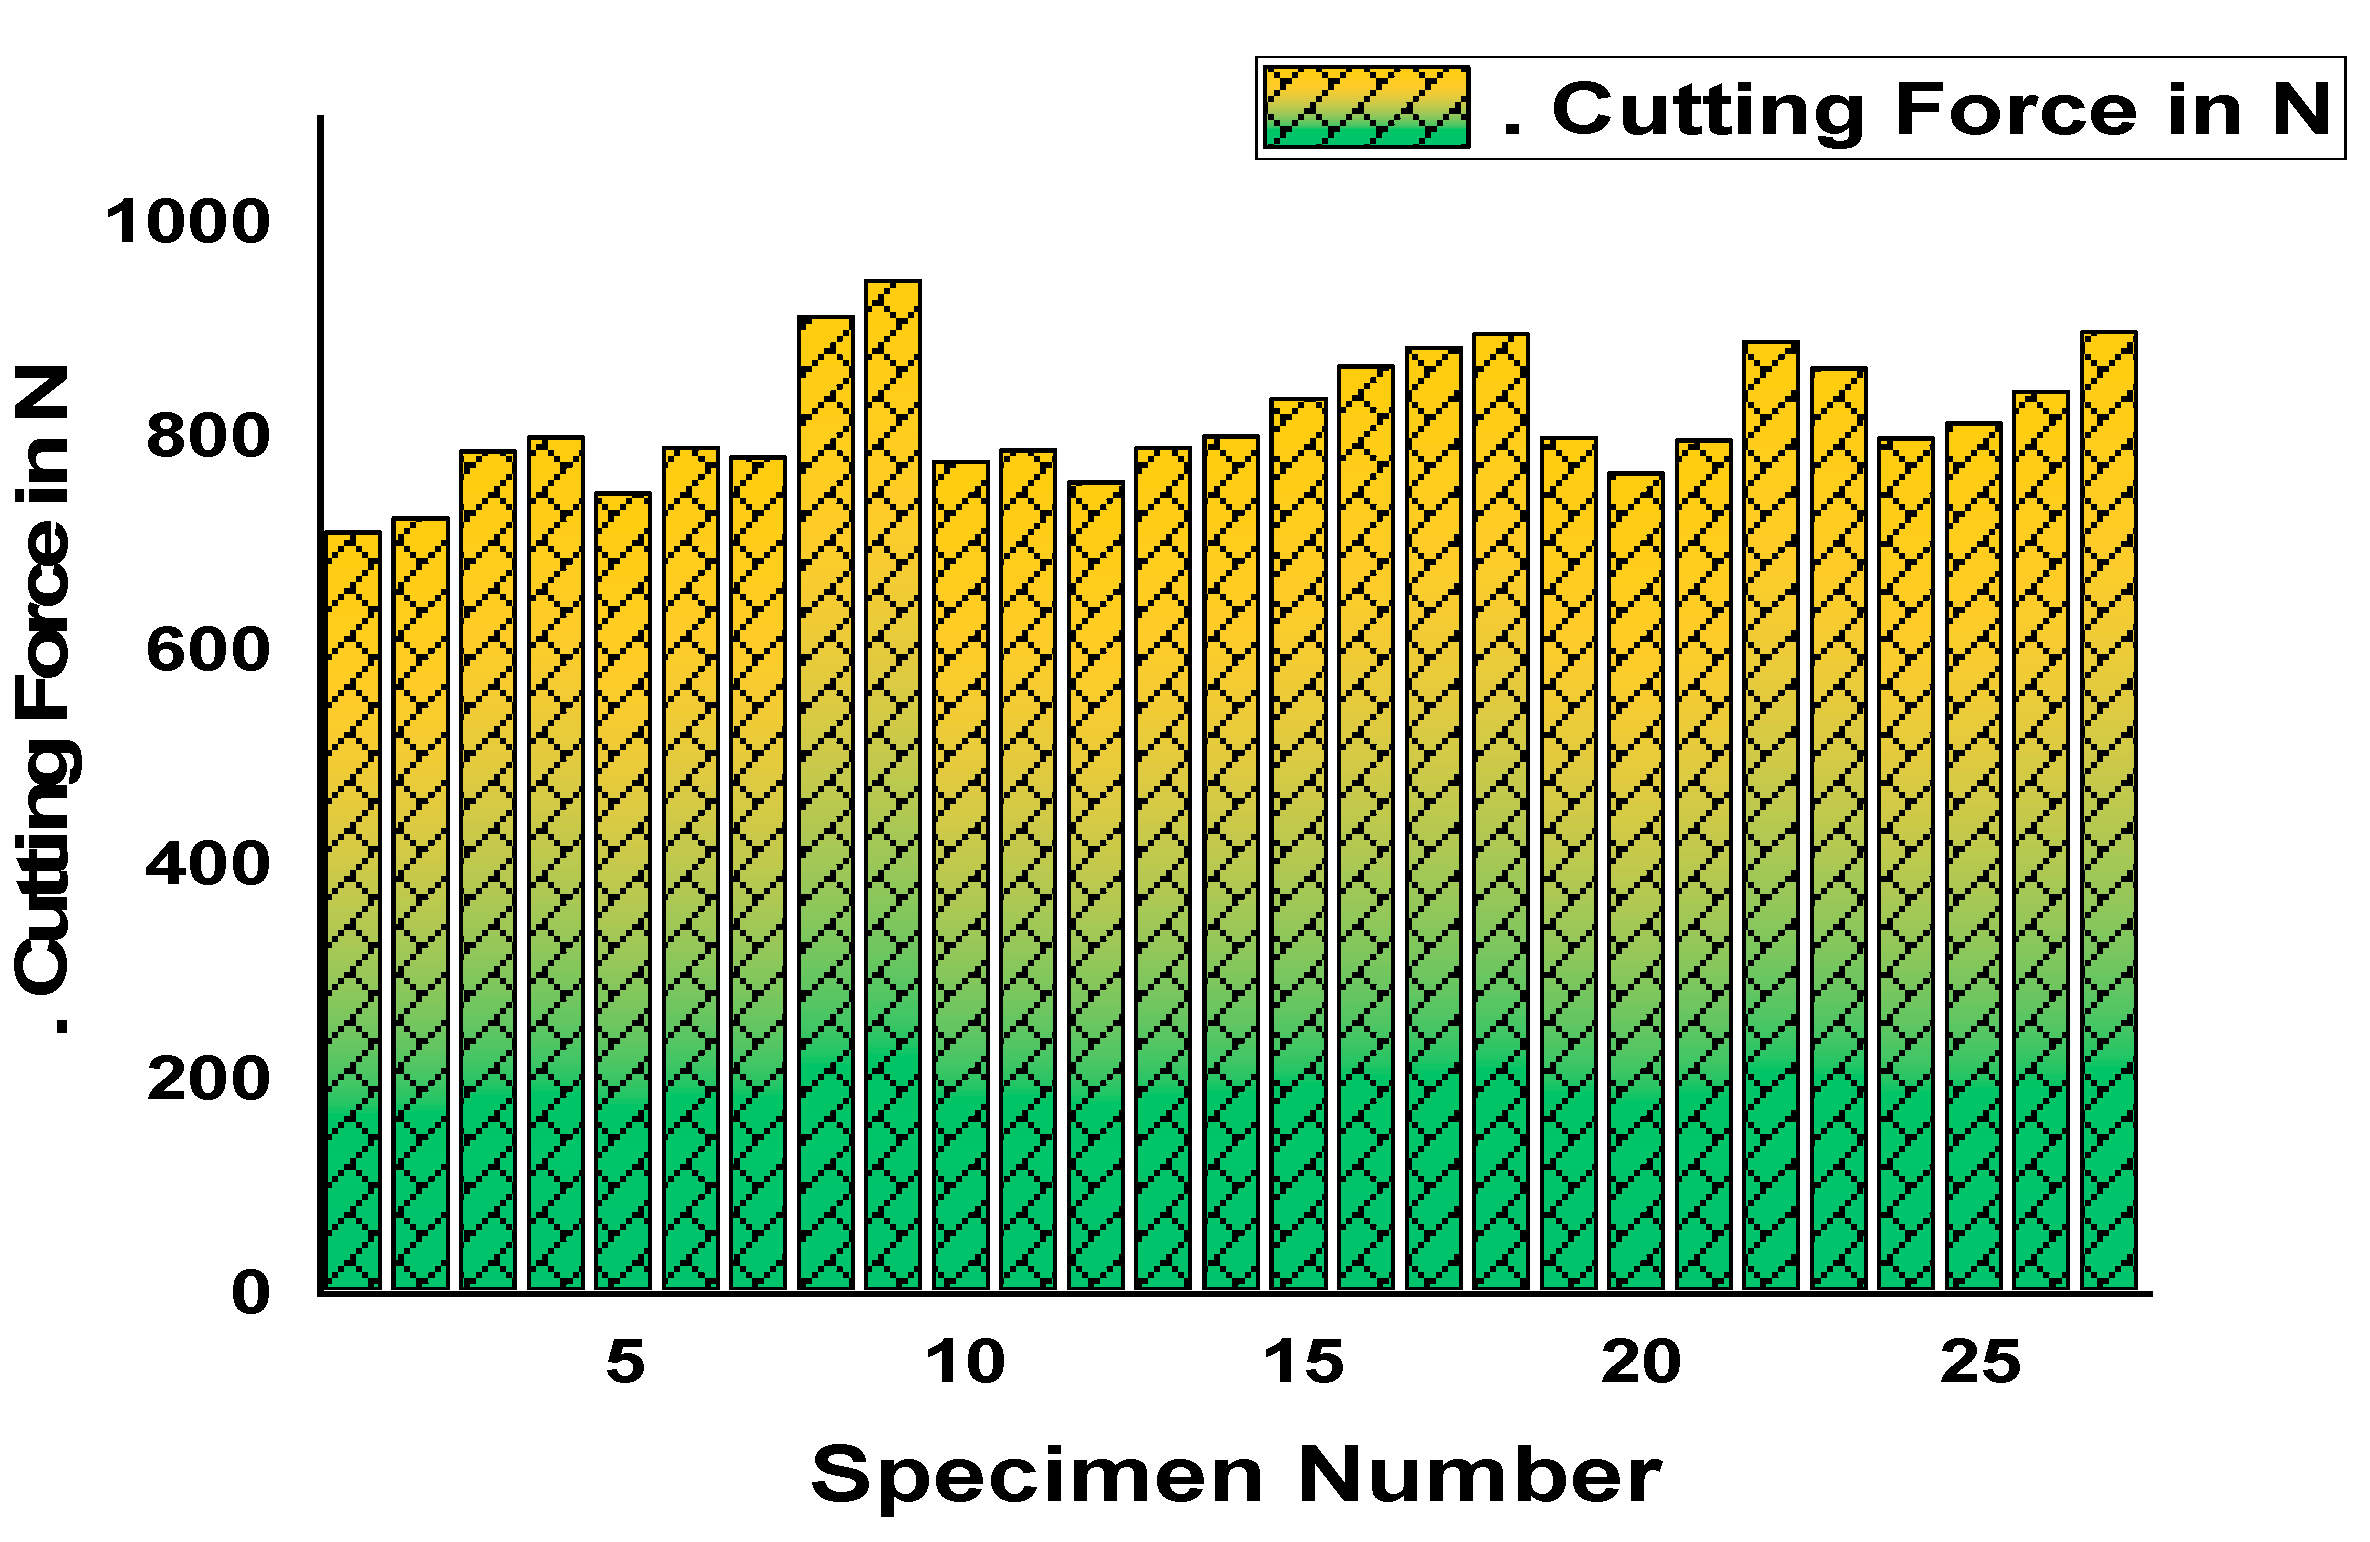
| CF—Force of cutting in N | ||||
| Comparison | Responses | Better/Best Conditions |
|---|---|---|
| 1 | Material Removal Rate (MRR) | Larger (High) |
| 2 | Surface Roughness (SR) | Smaller |
| 3 | Cutting Force (CF) | Smaller |
| 4 | Surface Roughness (SR) and Cutting Force (CF) | Smaller |
| 5 | Material Removal Rate (MRR), Surface Roughness (SR) and Cutting Force (CF) | Nominal is best |
| Specimen Number | Process Parameters | Responses | ||||
|---|---|---|---|---|---|---|
| N in Revolutions per Minute | F in mm per Revolution | D in mm | MRR in mm3 per Minute | SR in µm | CF in Newton | |
| 1 | 800 | 0.15 | 1 | 11,194.8 | 0.74 | 710.12 |
| 2 | 800 | 0.2 | 1 | 12,594.15 | 1.79 | 723.22 |
| 3 | 800 | 0.25 | 1 | 14,393.32 | 2.43 | 786.23 |
| 4 | 800 | 0.15 | 1.5 | 13,993.5 | 0.64 | 799.56 |
| 5 | 800 | 0.2 | 1.5 | 16,516.92 | 1.74 | 746.56 |
| 6 | 800 | 0.25 | 1.5 | 19,375.62 | 2.85 | 789.31 |
| 7 | 800 | 0.15 | 2 | 17,563.52 | 0.82 | 780.45 |
| 8 | 800 | 0.2 | 2 | 20,307.82 | 1.66 | 912.32 |
| 9 | 800 | 0.25 | 2 | 23,630.92 | 2.76 | 946.31 |
| 10 | 1200 | 0.15 | 1 | 14,816.65 | 1.52 | 776.32 |
| 11 | 1200 | 0.2 | 1 | 19,010.04 | 1.83 | 786.98 |
| 12 | 1200 | 0.25 | 1 | 20,561.88 | 2.89 | 756.84 |
| 13 | 1200 | 0.15 | 1.5 | 19,375.62 | 0.63 | 789.56 |
| 14 | 1200 | 0.2 | 1.5 | 23,988.86 | 2.49 | 800.12 |
| 15 | 1200 | 0.25 | 1.5 | 25,834.16 | 2.77 | 835.35 |
| 16 | 1200 | 0.15 | 2 | 25,484.32 | 0.93 | 865.66 |
| 17 | 1200 | 0.2 | 2 | 29,538.65 | 2.75 | 883.25 |
| 18 | 1200 | 0.25 | 2 | 35,127.04 | 2.44 | 896.21 |
| 19 | 1600 | 0.15 | 1 | 18,318.77 | 1.35 | 798.91 |
| 20 | 1600 | 0.2 | 1 | 22,898.46 | 1.47 | 765.54 |
| 21 | 1600 | 0.25 | 1 | 25,188.31 | 2.75 | 796.46 |
| 22 | 1600 | 0.15 | 1.5 | 25,188.31 | 0.71 | 888.65 |
| 23 | 1600 | 0.2 | 1.5 | 29,633.3 | 1.48 | 864.26 |
| 24 | 1600 | 0.25 | 1.5 | 34,742.49 | 2.82 | 798.65 |
| 25 | 1600 | 0.15 | 2 | 36,102.79 | 0.76 | 812.12 |
| 26 | 1600 | 0.2 | 2 | 38,226.48 | 1.83 | 841.73 |
| 27 | 1600 | 0.25 | 2 | 41,925.82 | 2.82 | 897.87 |
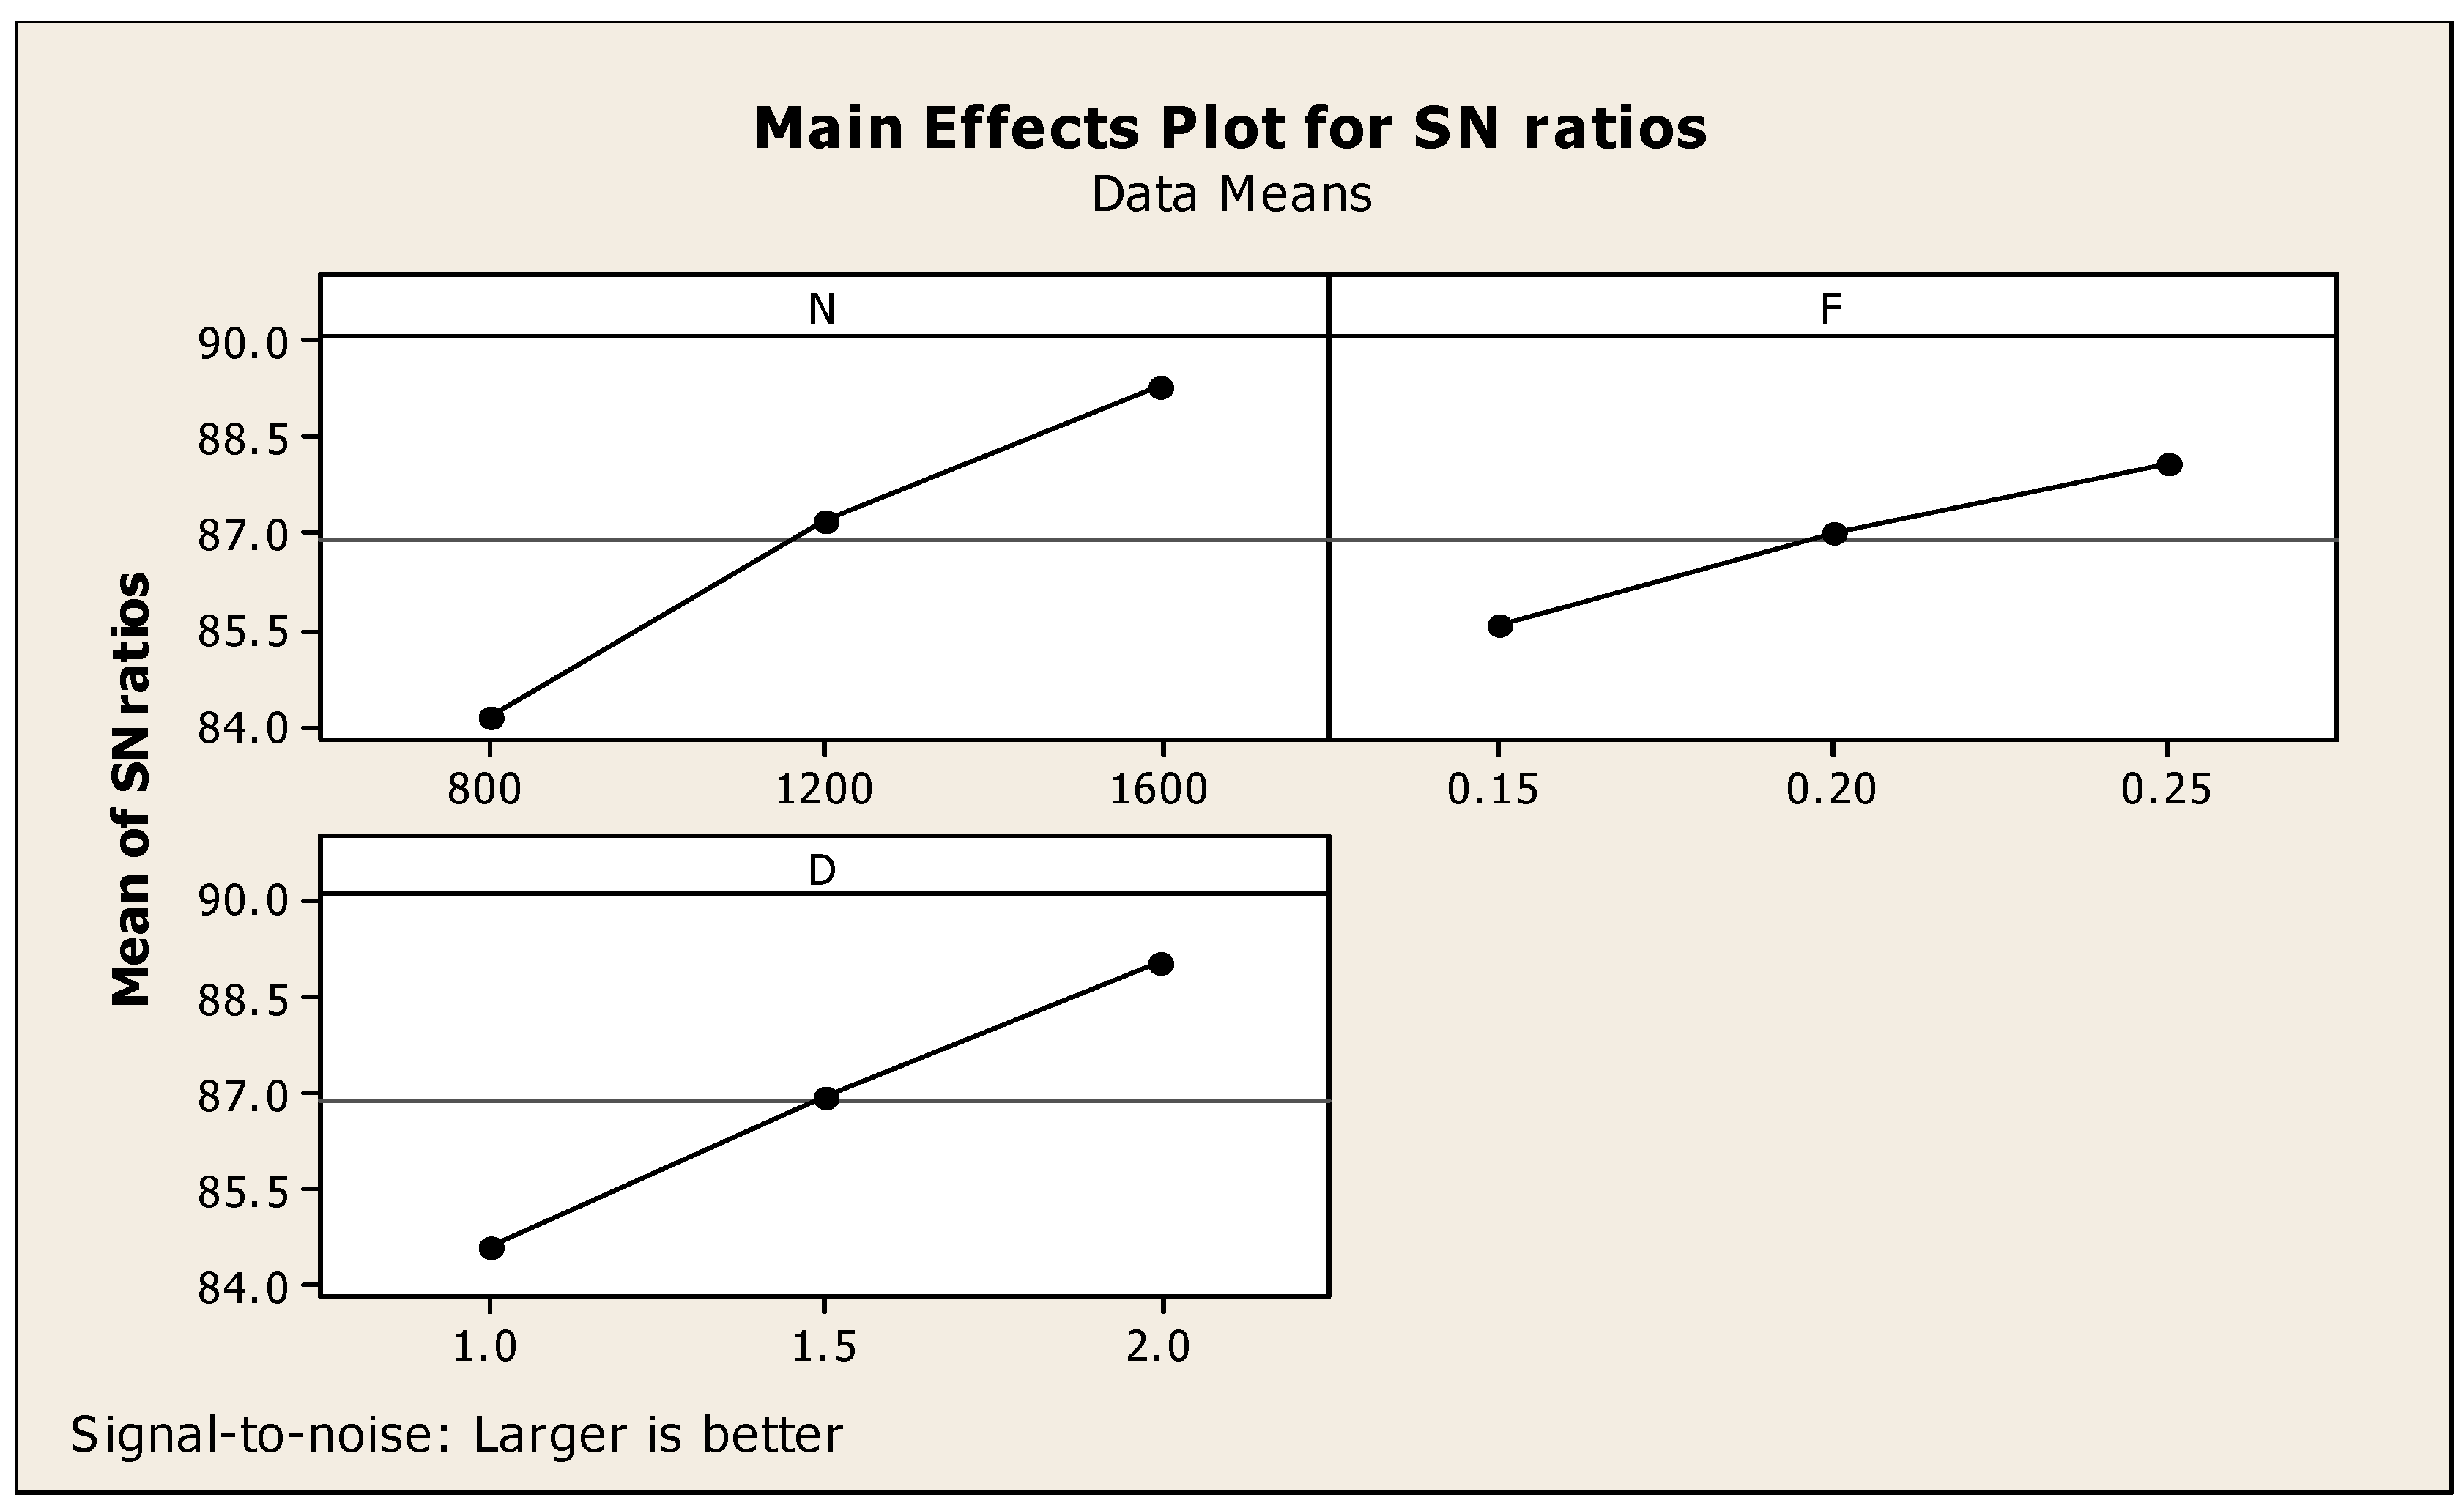
| SN Ratios Response Table | |||
|---|---|---|---|
| Levels | N | F | D |
| 1 | 84.13 | 85.56 | 84.60 |
| 2 | 87.22 | 87.00 | 86.95 |
| 3 | 89.30 | 88.08 | 89.10 |
| Delta | 5.17 | 2.52 | 4.50 |
| Rank | 1 | 3 | 2 |
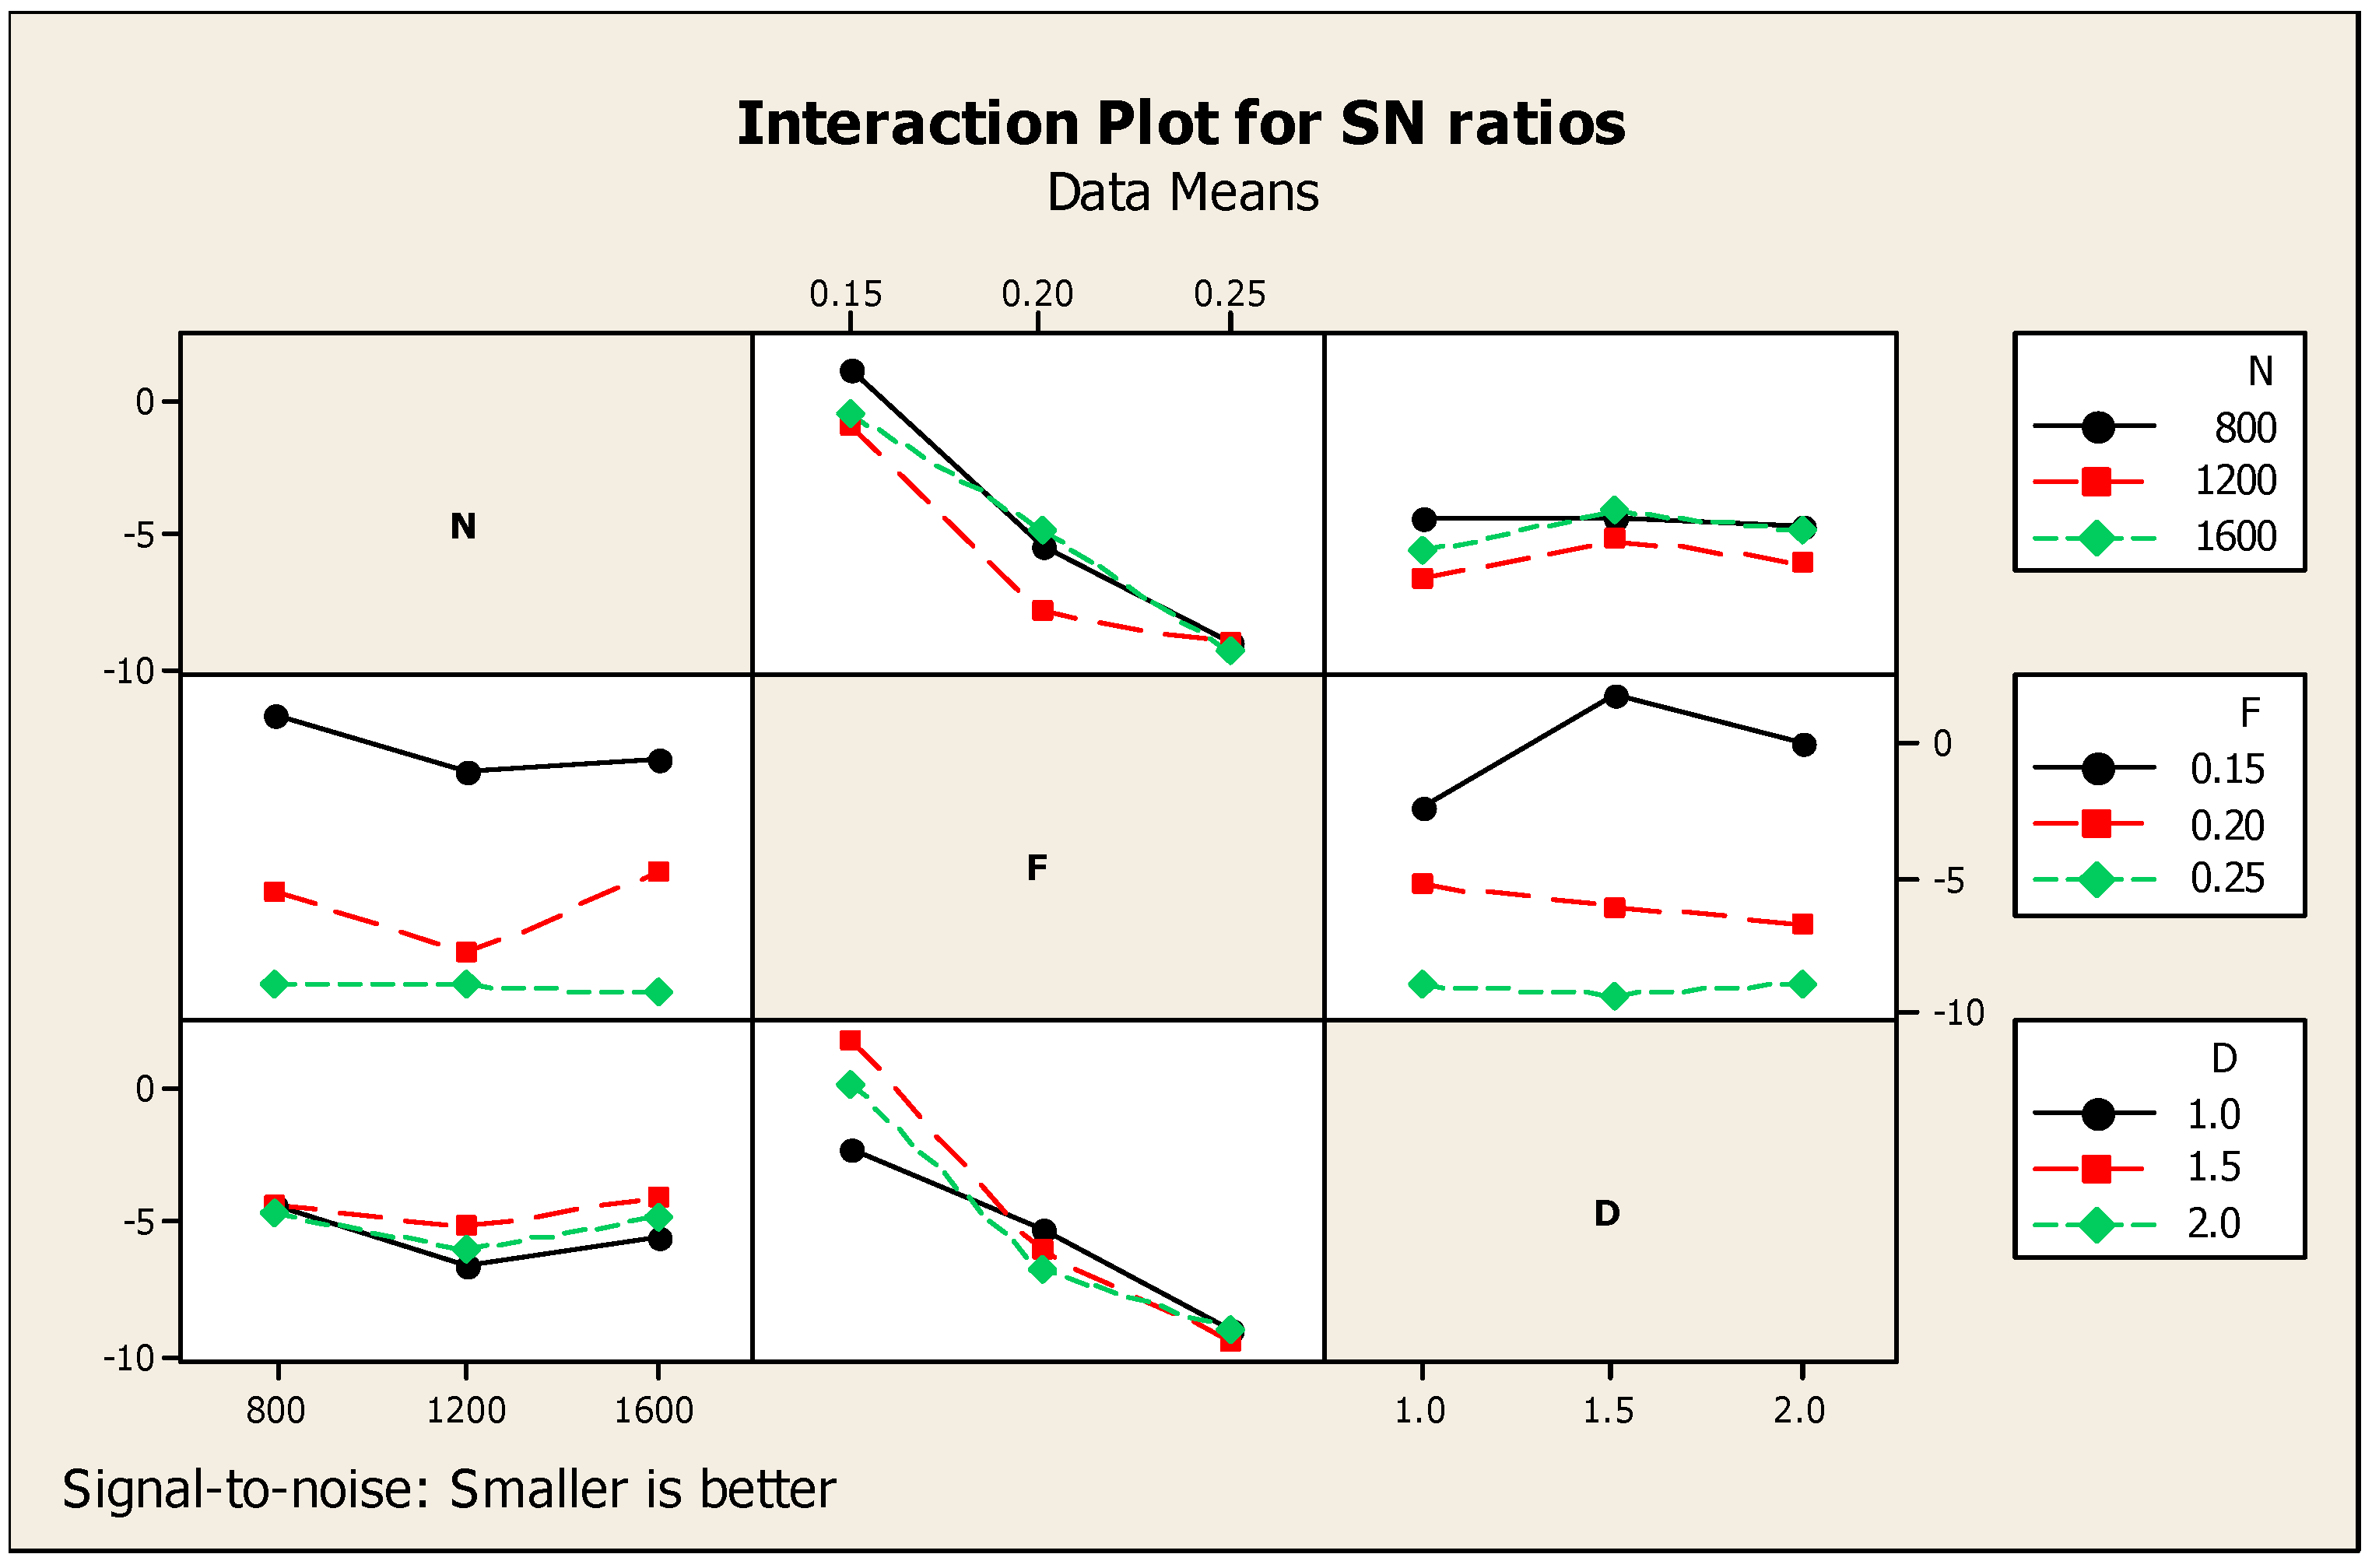
| SN Ratios Response Table | |||
|---|---|---|---|
| Levels | N | F | D |
| 1 | −4.4630 | −0.1148 | −5.5535 |
| 2 | −5.9788 | −6.0466 | −4.5550 |
| 3 | −4.8798 | −9.1602 | −5.2132 |
| Delta | 1.5158 | 9.0454 | 0.9985 |
| Rank | 2 | 1 | 3 |
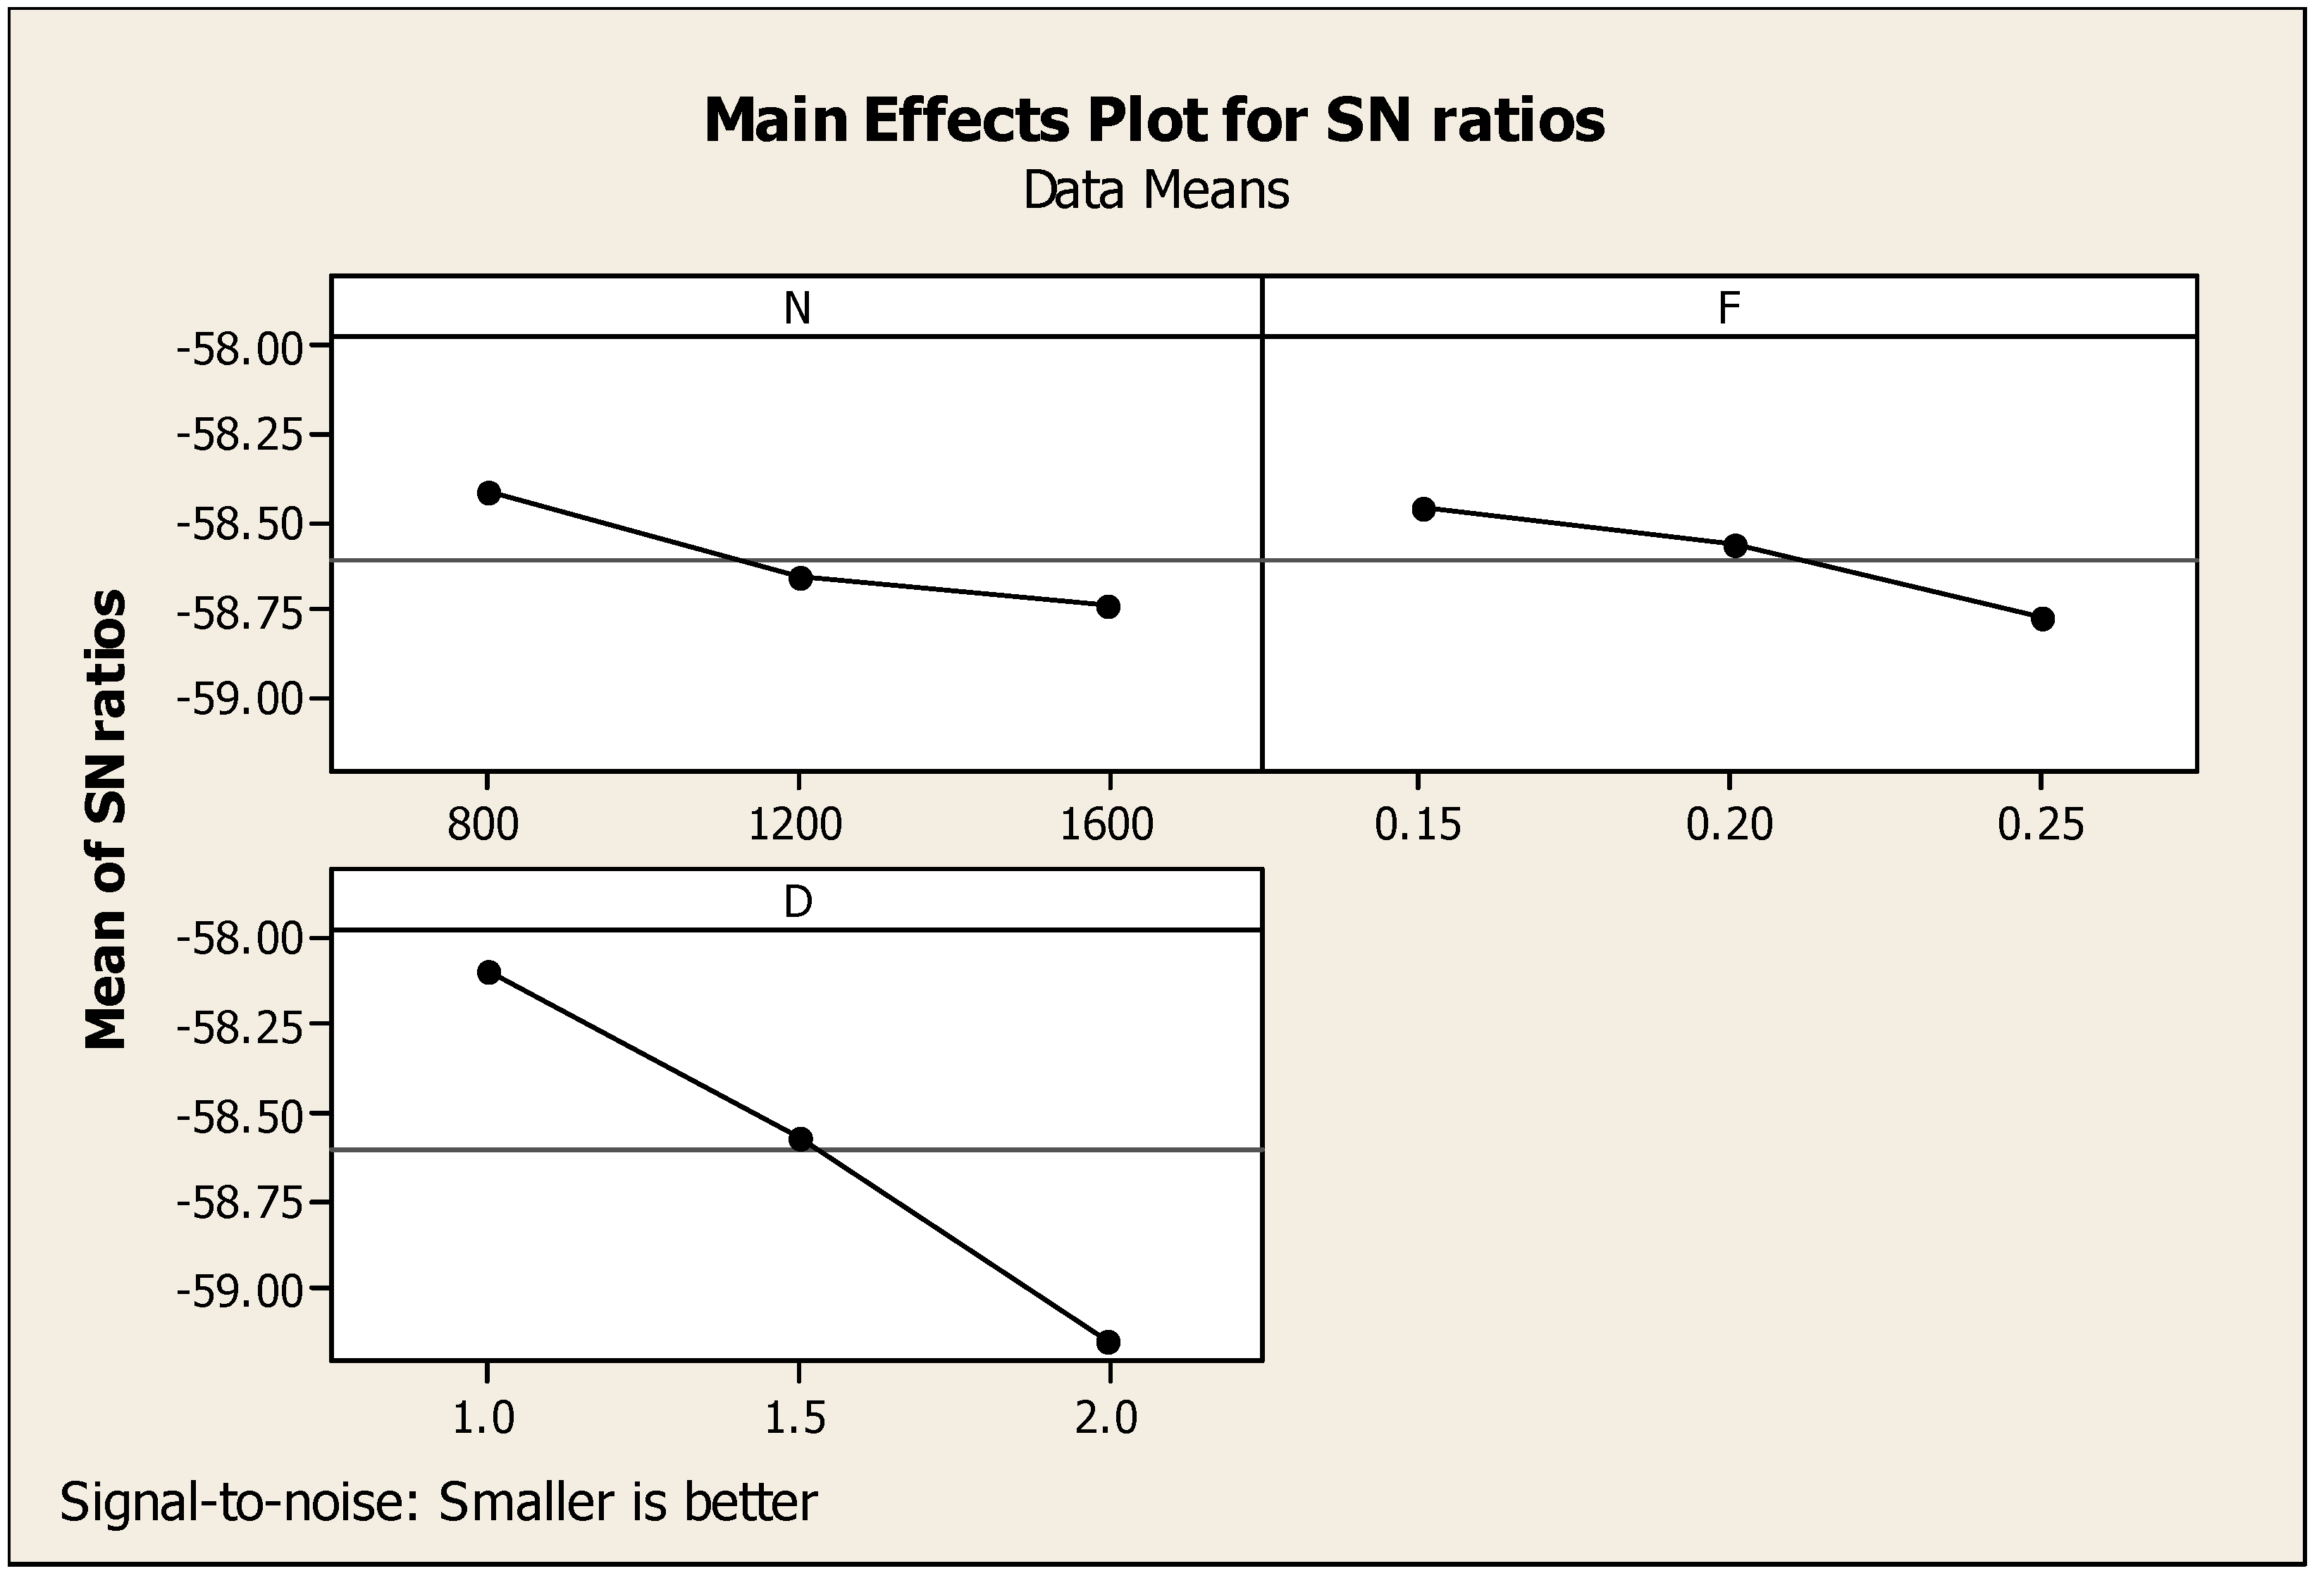
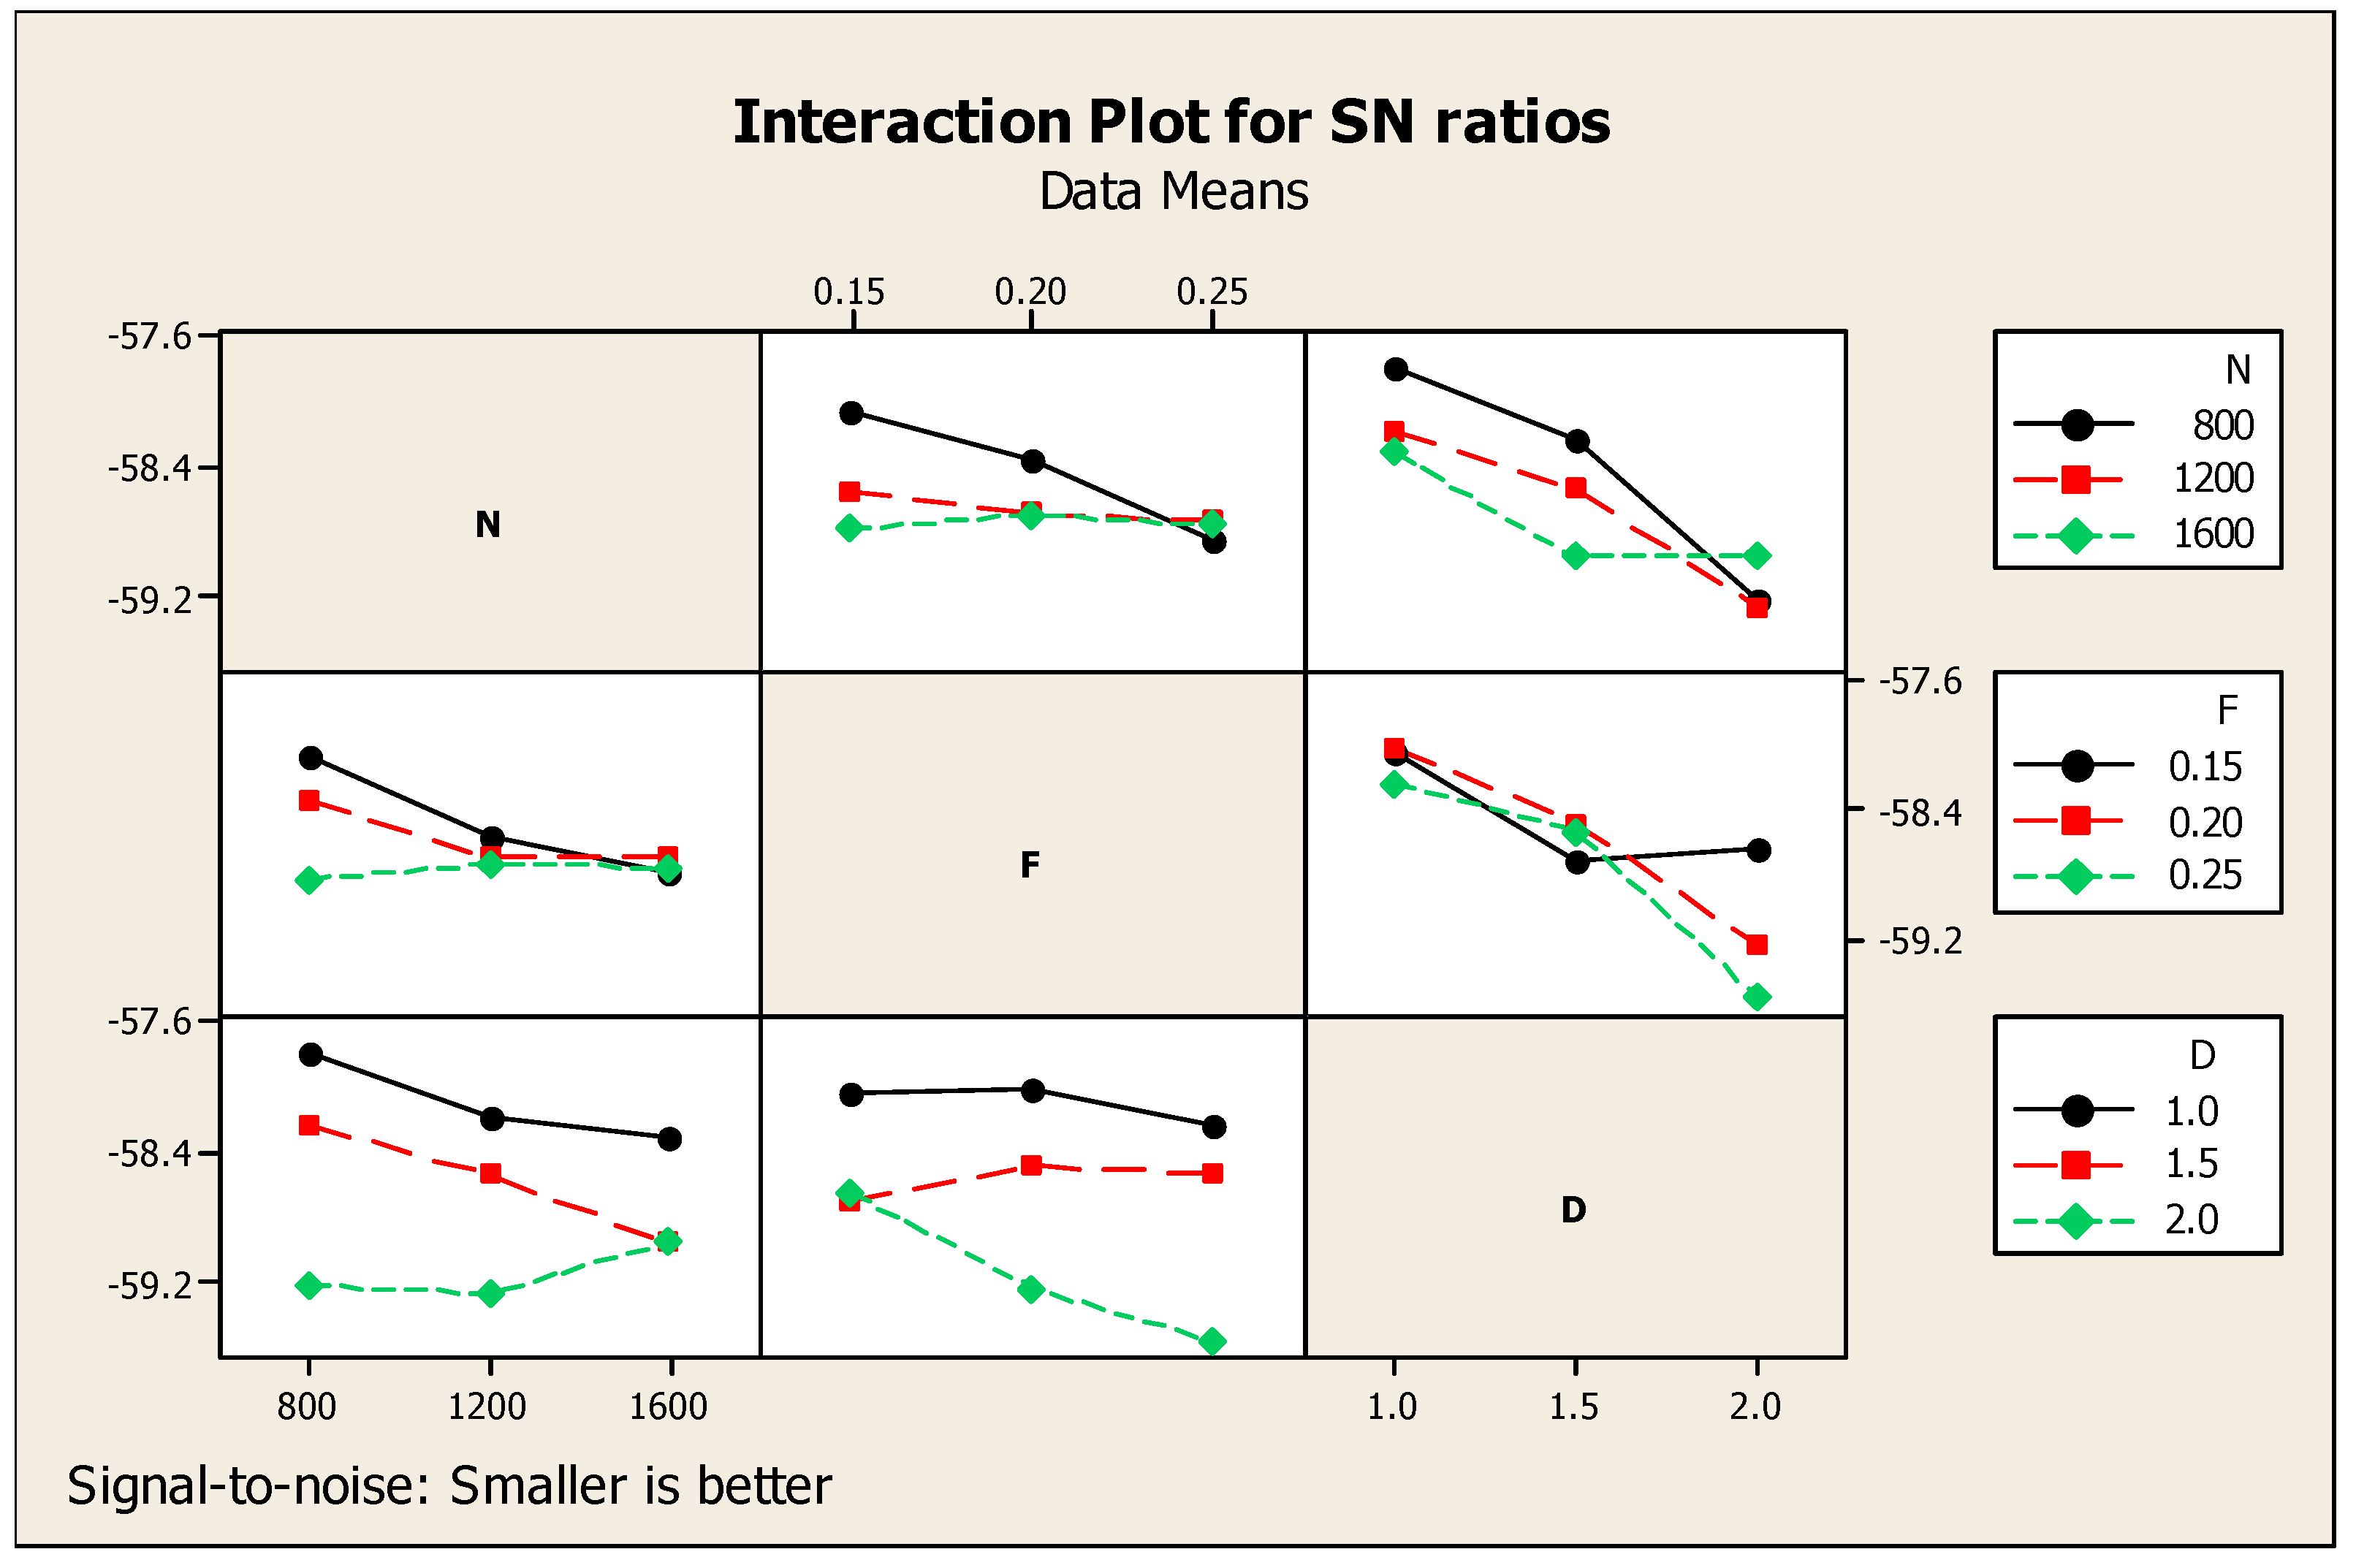
| SN Ratios-Based Response Table | |||
|---|---|---|---|
| Level | N | F | D |
| 1 | −58.41 | −58.46 | −58.10 |
| 2 | −58.66 | −58.57 | −58.57 |
| 3 | −58.74 | −58.78 | −59.15 |
| Delta | 0.33 | 0.31 | 1.05 |
| Rank | 2 | 3 | 1 |
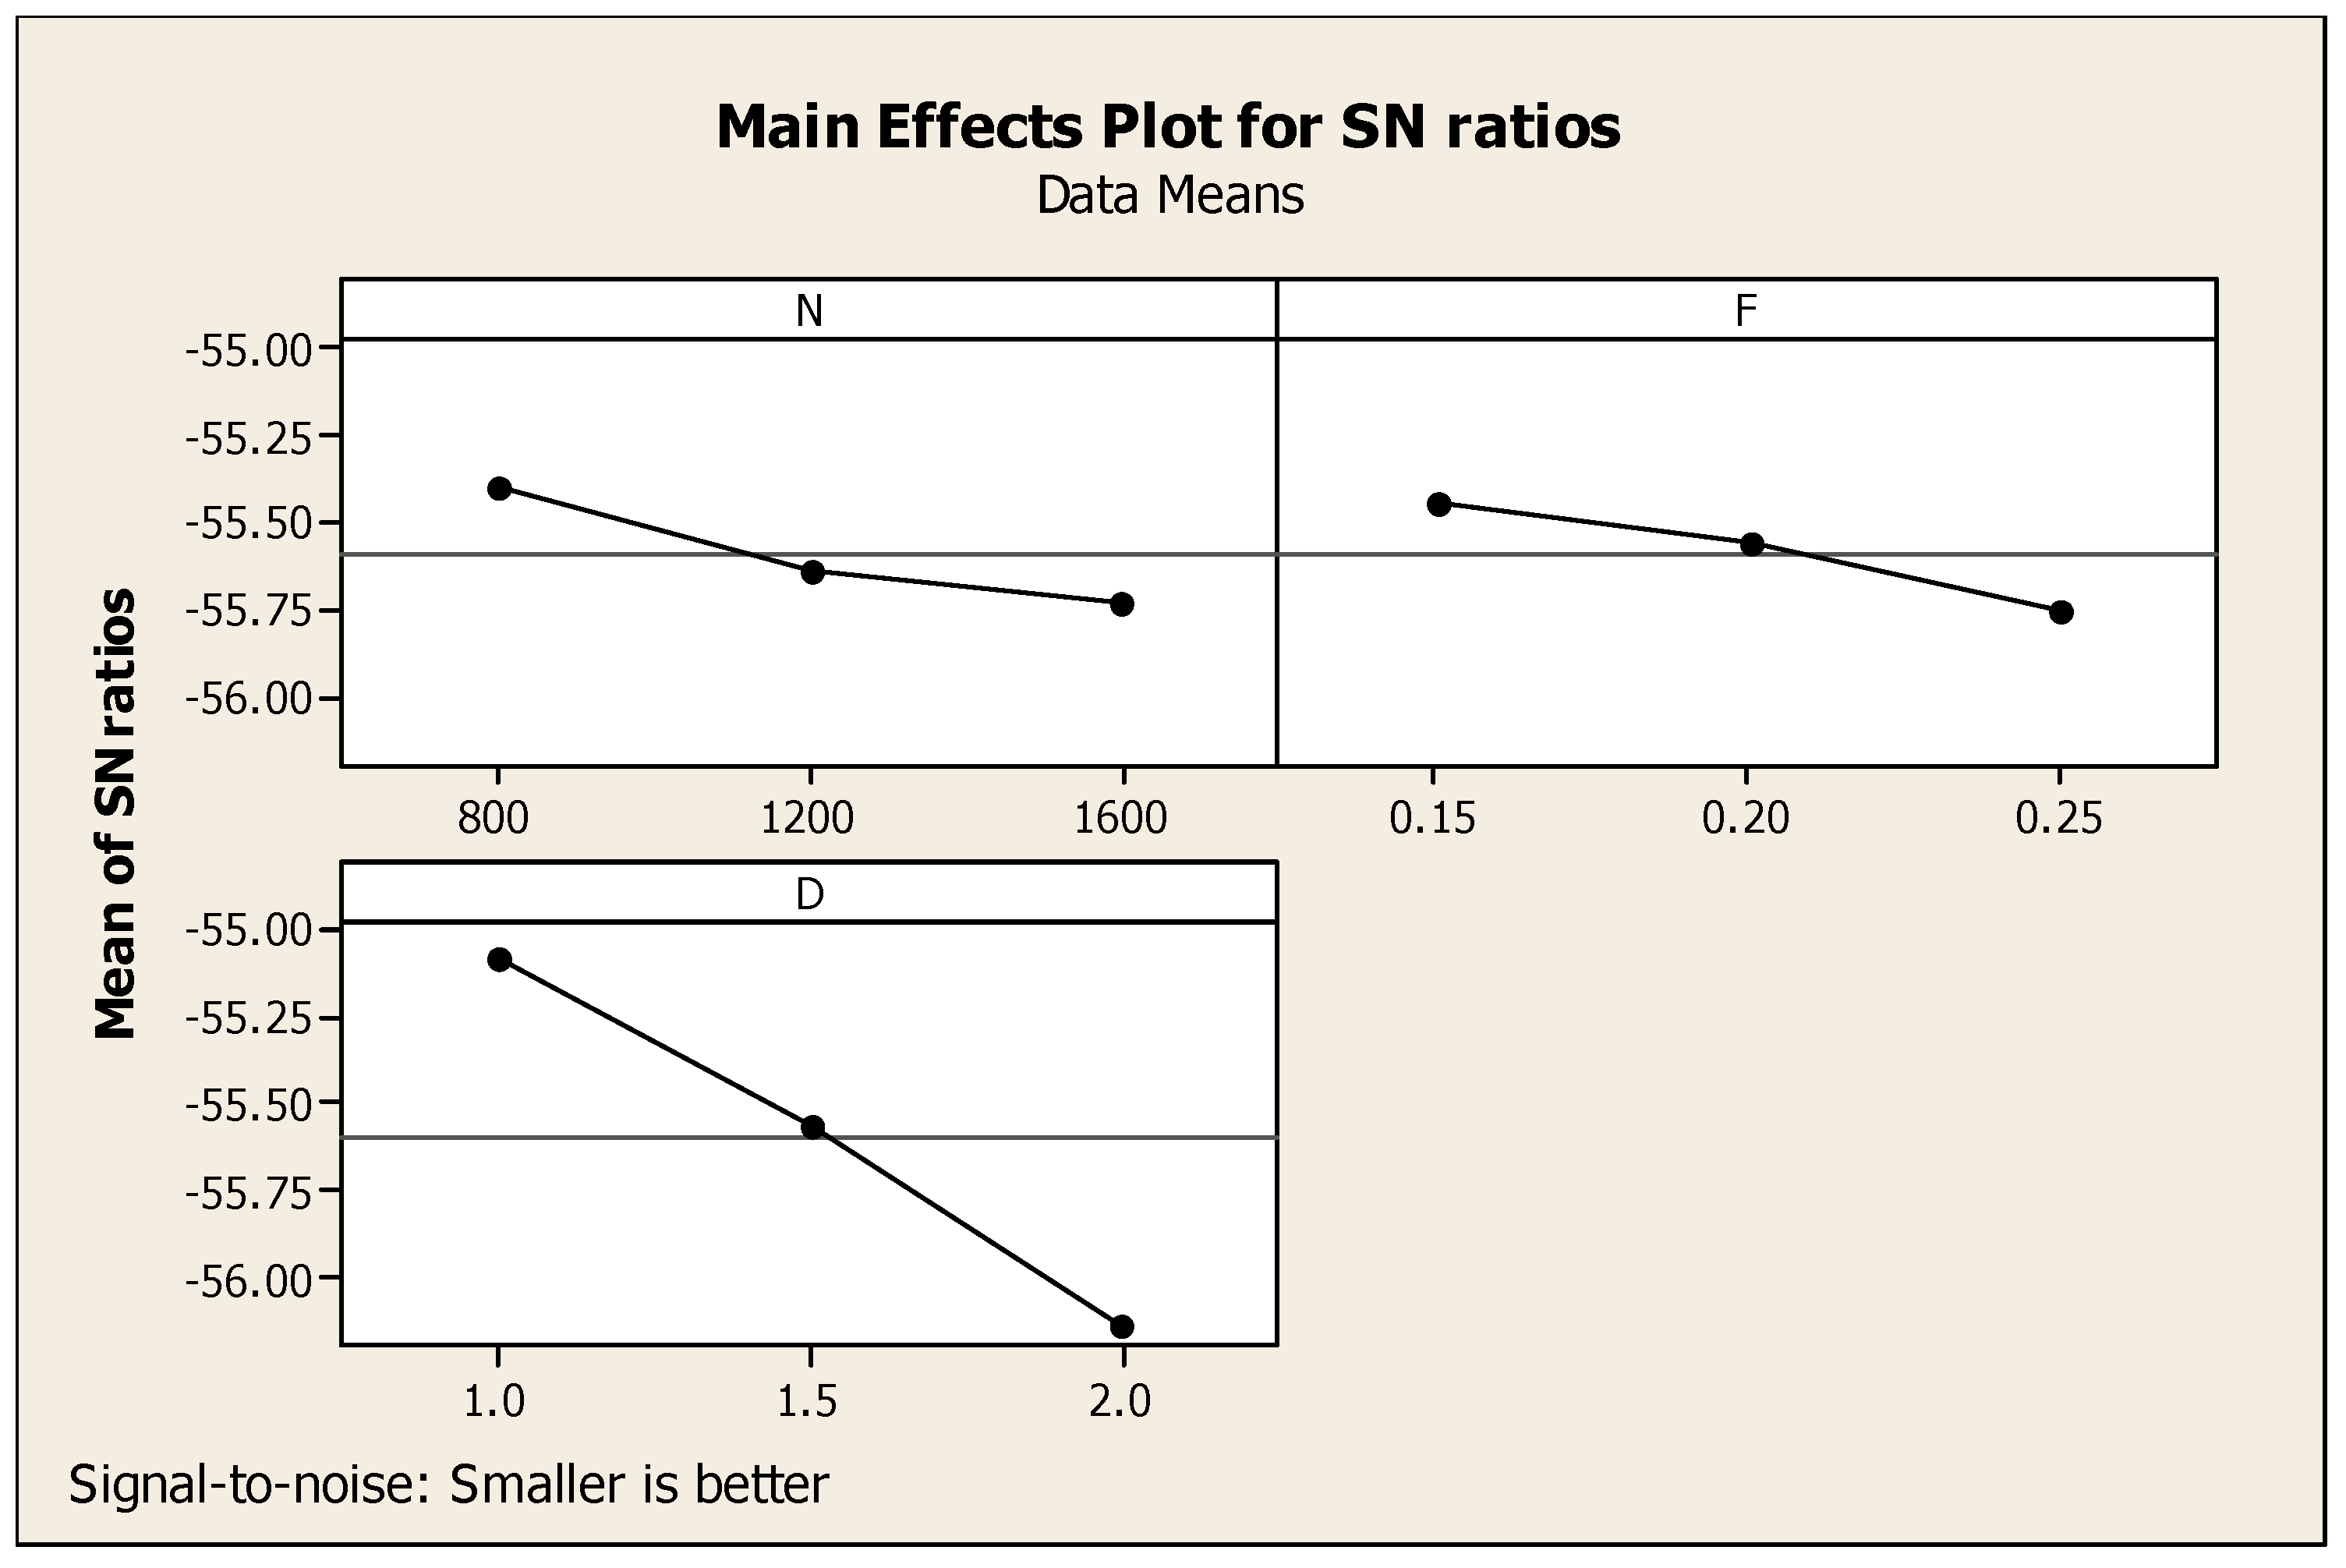
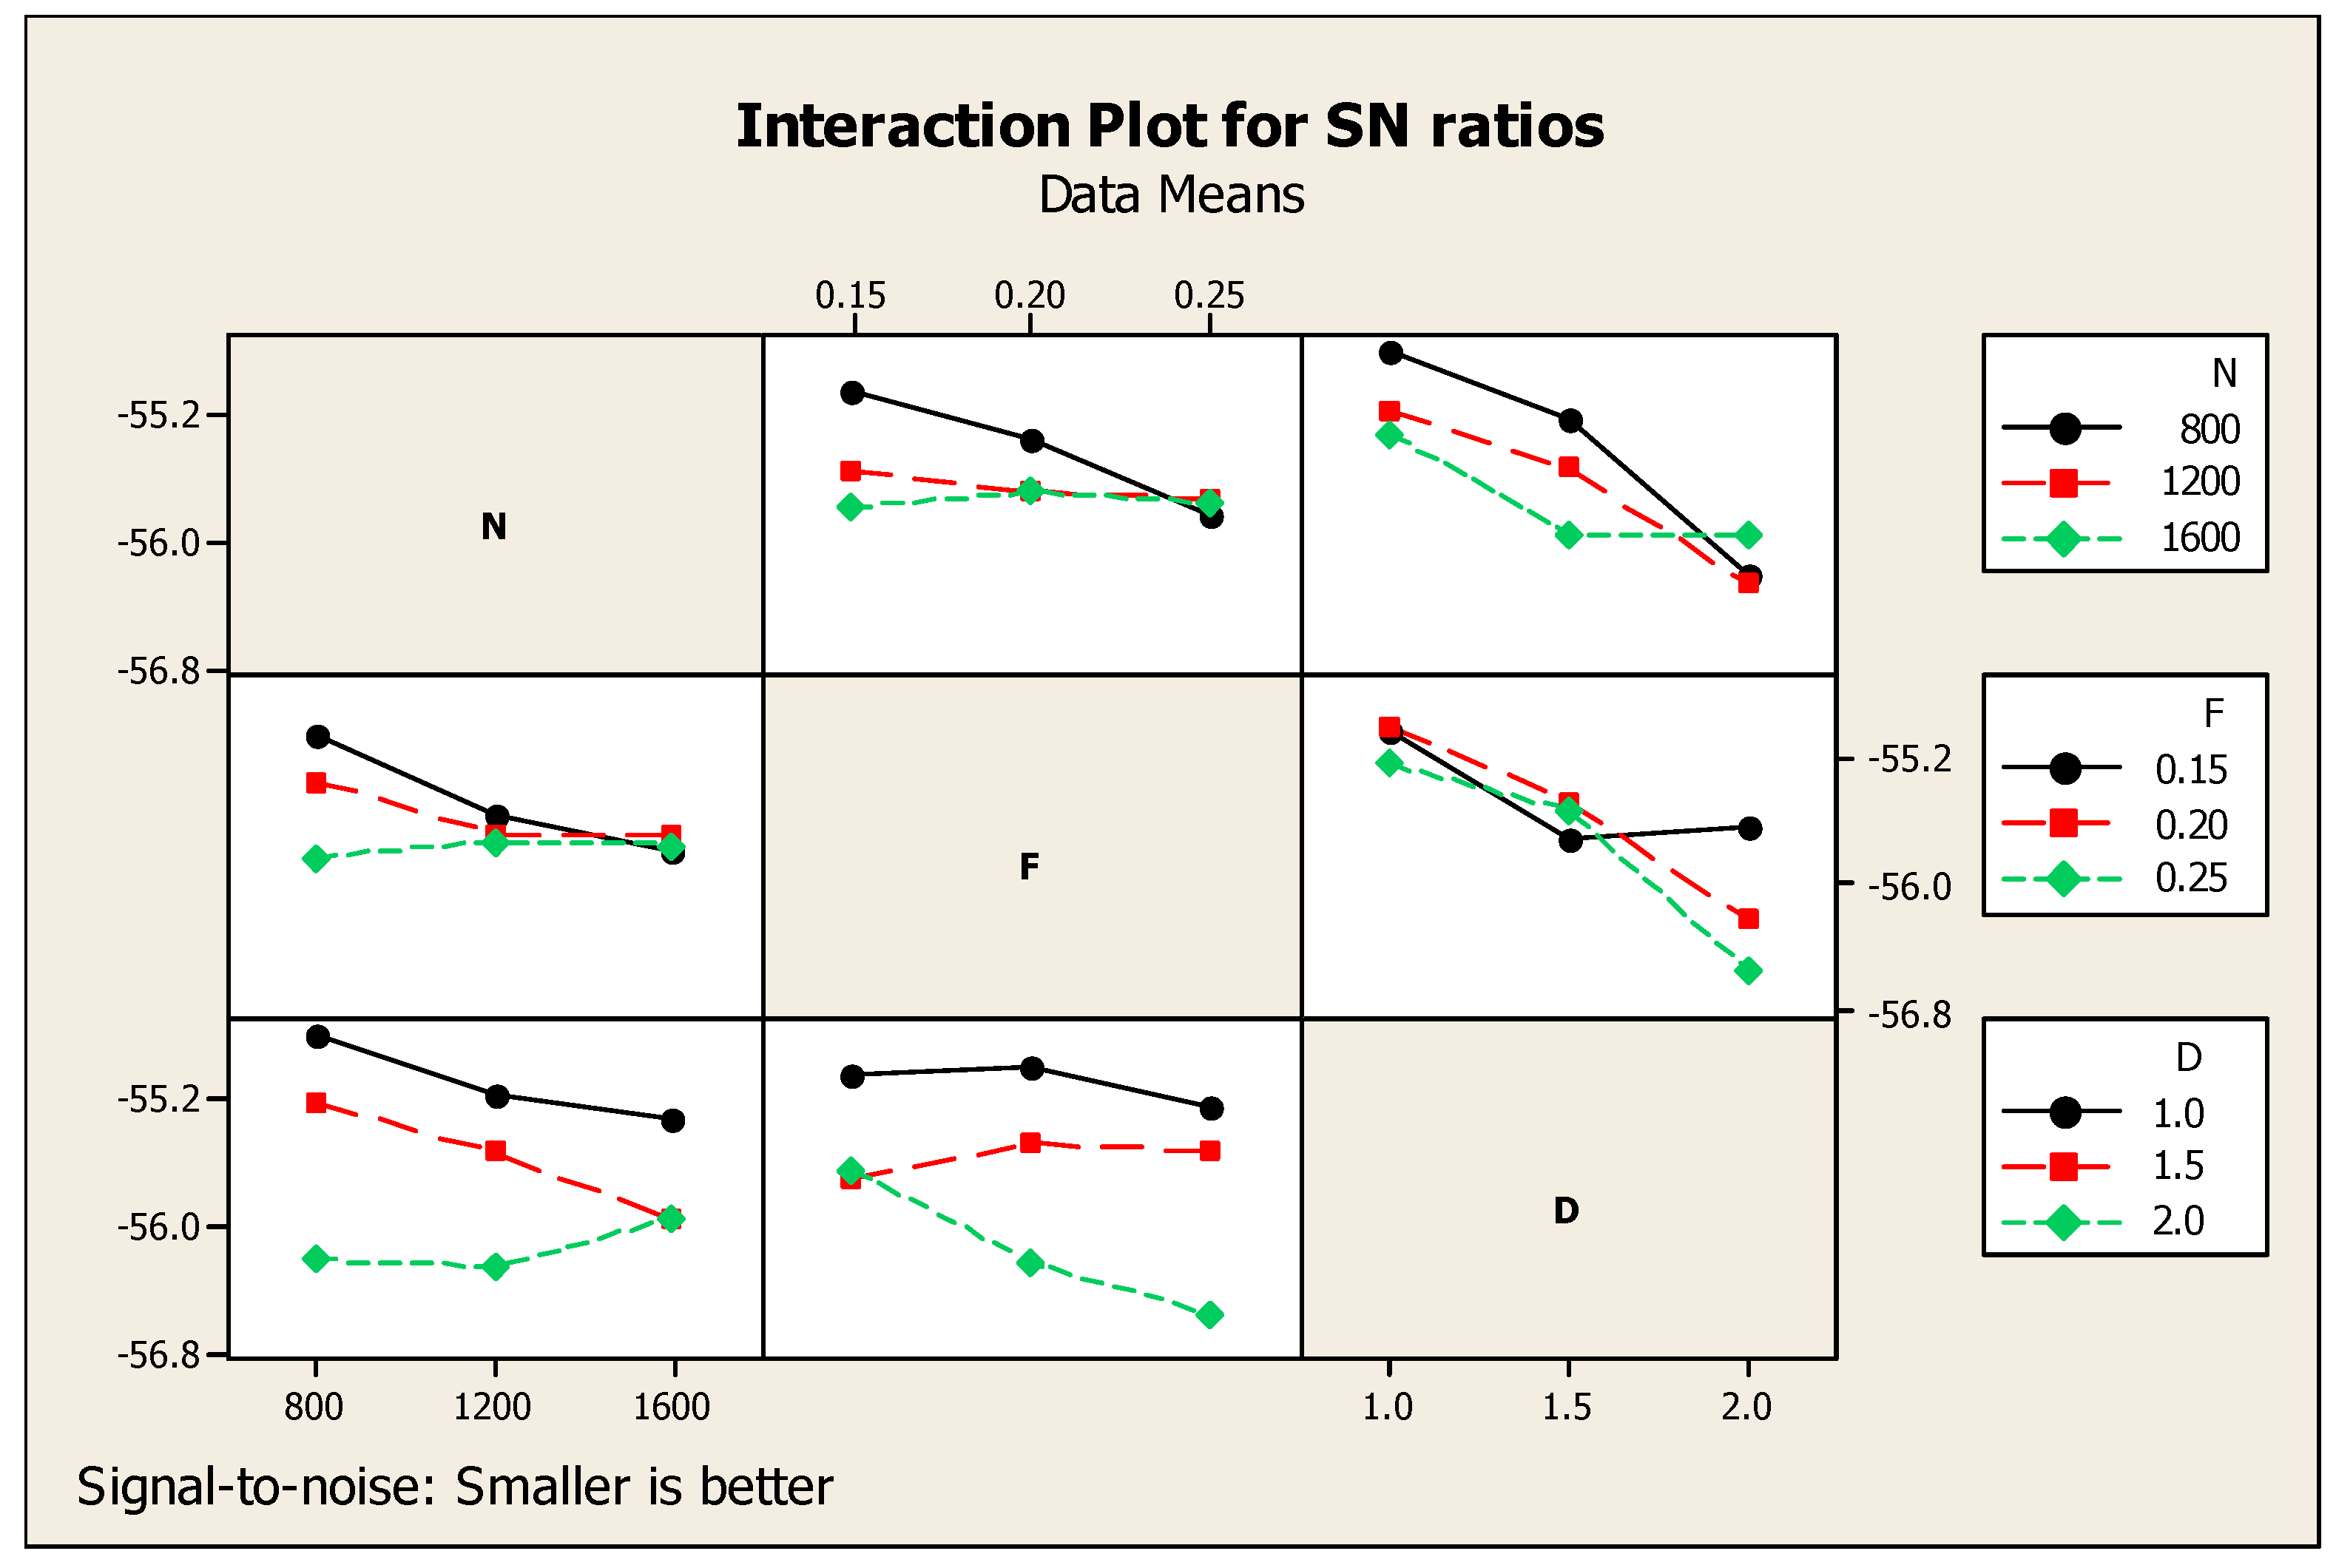
| SN Ratios Response Table | |||
|---|---|---|---|
| Level | N | F | D |
| 1 | −55.40 | −55.45 | −55.09 |
| 2 | −55.65 | −55.56 | −55.56 |
| 3 | −55.73 | −55.77 | −56.14 |
| Delta | 0.33 | 0.31 | 1.05 |
| Rank | 2 | 3 | 1 |
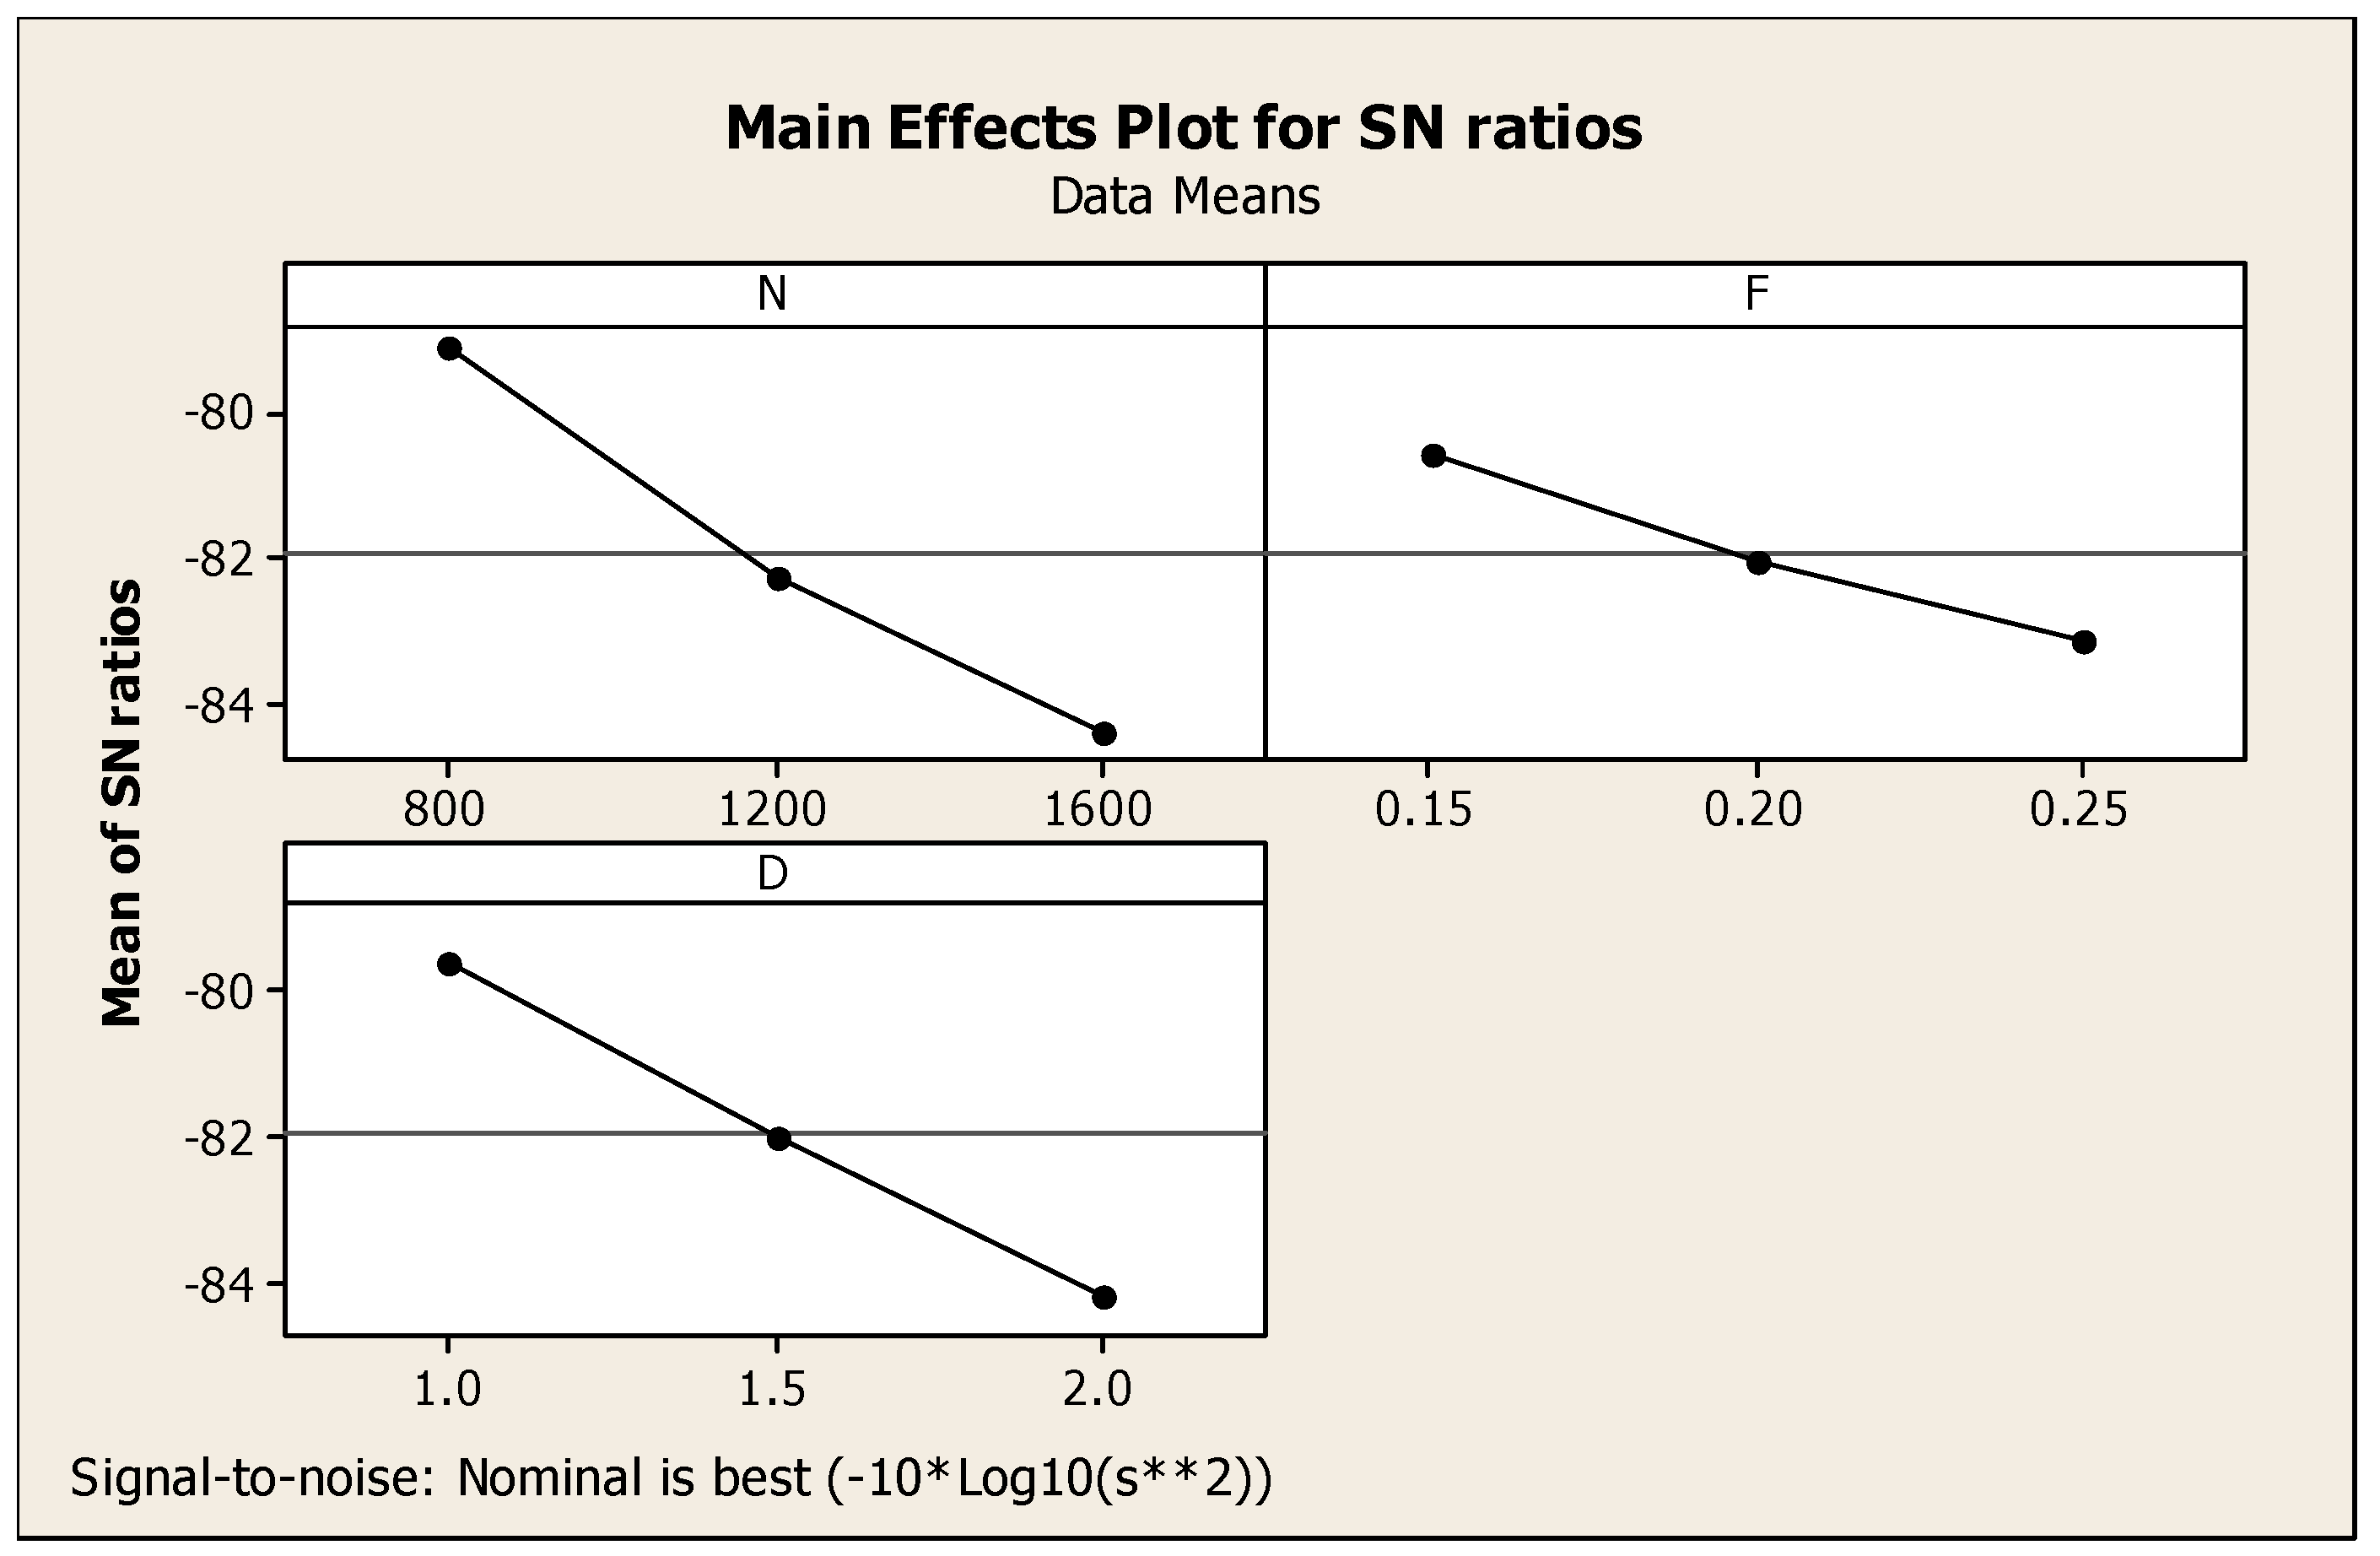
| SN Ratios Response Table | |||
|---|---|---|---|
| Level | N | F | D |
| 1 | −79.14 | −80.60 | −79.62 |
| 2 | −82.28 | −82.06 | −82.01 |
| 3 | −84.40 | −83.16 | −84.19 |
| Delta | 5.26 | 2.56 | 4.57 |
| Rank | 1 | 3 | 2 |
| Comparison | Responses | Conditions Better/Best | N | F | D |
|---|---|---|---|---|---|
| 1 | MRR | Larger | 2 | 1 | 3 |
| 2 | SR | Smaller | 2 | 3 | 1 |
| 3 | CF | Smaller | 1 | 3 | 2 |
| 4 | SR and CF | Smaller | 2 | 3 | 1 |
| 5 | MRR, SR, and CF | Nominal is best | 1 | 3 | 2 |
Publisher’s Note: MDPI stays neutral with regard to jurisdictional claims in published maps and institutional affiliations. |
© 2021 by the authors. Licensee MDPI, Basel, Switzerland. This article is an open access article distributed under the terms and conditions of the Creative Commons Attribution (CC BY) license (https://creativecommons.org/licenses/by/4.0/).
Share and Cite
Akhtar, M.N.; Sathish, T.; Mohanavel, V.; Afzal, A.; Arul, K.; Ravichandran, M.; Rahim, I.A.; Alhady, S.S.N.; Bakar, E.A.; Saleh, B. Optimization of Process Parameters in CNC Turning of Aluminum 7075 Alloy Using L27 Array-Based Taguchi Method. Materials 2021, 14, 4470. https://doi.org/10.3390/ma14164470
Akhtar MN, Sathish T, Mohanavel V, Afzal A, Arul K, Ravichandran M, Rahim IA, Alhady SSN, Bakar EA, Saleh B. Optimization of Process Parameters in CNC Turning of Aluminum 7075 Alloy Using L27 Array-Based Taguchi Method. Materials. 2021; 14(16):4470. https://doi.org/10.3390/ma14164470
Chicago/Turabian StyleAkhtar, Mohammad Nishat, T. Sathish, V. Mohanavel, Asif Afzal, K. Arul, M. Ravichandran, Inzarulfaisham Abd Rahim, S. S. N. Alhady, Elmi Abu Bakar, and B. Saleh. 2021. "Optimization of Process Parameters in CNC Turning of Aluminum 7075 Alloy Using L27 Array-Based Taguchi Method" Materials 14, no. 16: 4470. https://doi.org/10.3390/ma14164470
APA StyleAkhtar, M. N., Sathish, T., Mohanavel, V., Afzal, A., Arul, K., Ravichandran, M., Rahim, I. A., Alhady, S. S. N., Bakar, E. A., & Saleh, B. (2021). Optimization of Process Parameters in CNC Turning of Aluminum 7075 Alloy Using L27 Array-Based Taguchi Method. Materials, 14(16), 4470. https://doi.org/10.3390/ma14164470