Article

Effect of Minor Er Additions on the Microstructures and Mechanical Properties of Cast Al-Cu-Mg-Ag Alloys

1
School of Material Science and Engineering, Central South University, Changsha 410083, China
2
Key Laboratory of Nonferrous Metal Materials Science and Engineering, Central South University, Changsha 410083, China
3
The National Key Laboratory of Science and Technology on High-Strength Structural Materials, Central South University, Changsha 410083, China
*
Authors to whom correspondence should be addressed.
Materials 2021, 14(15), 4212; https://doi.org/10.3390/ma14154212
Submission received: 21 June 2021 / Revised: 15 July 2021 / Accepted: 19 July 2021 / Published: 28 July 2021
(This article belongs to the Section Metals and Alloys)

Abstract

:
The microstructures and mechanical properties of novel cast Al-Cu-Mg-Ag alloys with and without minor additions of Er (0.09 and 0.2 wt %) are investigated by Vickers hardness tests, tensile tests, optical metallographic examination, scanning electron microscopy (SEM), transmission electron microscopy (TEM), and X-ray diffraction (XRD). The results reveal that the Er addition decreases the hardness value of peak-aged Al-Cu-Mg-Ag alloy but has little influence on the time required for achieving the peak aging condition. Meanwhile, the Ω phase is suppressed in Er-added alloys, leading to a lower tensile strength at room temperature, which causes the (Mg, Ag, Er, V, Ti)-rich phase in the matrix in Er-added alloys. This blocky phase consumes available Mg and Ag atoms for Ω nucleation, leading to the low number density of Ω plates. The strength properties of Er-added alloys at 300 °C are found to be enhanced, which benefits from the pinning effect of the Al8Cu4Er phase on grain boundaries. Meanwhile, the brittle fracture of Er-added alloys at room temperature is directly associated with the Al8Cu4Er phase and the blocky (Mg, Ag, Er, V, Ti)-rich phase, which acts as the source of microcracks during deformation. In addition, no obvious grain refinement effect can be observed in Er-added alloys.

1. Introduction

Being a new type of high-strength and heat-resistant aluminum alloy, the Al-Cu-Mg-Ag alloy has been widely used in the field of aeronautics due to its excellent creep resistance and fatigue resistance at elevated temperatures [1,2,3]. These properties are mainly attributed to the particular precipitation in the alloy–Ω phase. The addition of Mg and Ag elements to the Al-Cu-based alloy has been documented to provide a favorable site for nucleation of the Ω phase on {111}α planes [4]. Moreover, the θ′ phase is also formed in the alloy, competing with the Ω phase for Cu atoms in the Al matrix during the aging process [5]. In contrast, the Ω phase not only exhibits high strength and excellent resistance to coarsening, but also reduces the coherency misfit strain and provides relatively low energy for coherent boundaries at elevated temperature of 250 °C [6,7,8]. However, the coarsening rate of Ω phase accelerates when the temperature further increases to 300 °C, limiting the use of the Al-Cu-Mg-Ag alloy [9,10].
Development through modification of the elemental constitution is an economical approach in application. The addition of rare-earth elements can effectively enhance the mechanical properties of aluminum alloy. Being new micro-alloying elements, the potential value of rare-earth elements such as Ce, Yb, and Sc has attracted significant academic scrutiny. According to the study conducted by Xiao et al., the addition of 0.45 wt % Ce induces the denser and finer Ω and θ′ phase, which boosted the yield strength of Al-5.3Cu-0.8Mg-0.6Ag alloy [11]. Nevertheless, Li et al. suggested a contrary view proving that 0.23 wt % Ce reduces the tensile properties of Al-4.66Cu-0.39Mg-0.48Ag alloy [12]. Moreover, Xiao et al.’s work demonstrates that the stability of the Ω phase is enhanced by the addition of 0.35 wt % Yb, improving the mechanical properties of Al-5.0Cu-1.0Mg-0.5Ag alloy at elevated temperatures [13]. As opposed to Ce and Yb, Sc is claimed as the most effective strengthening element in aluminum alloys, which is associated with its grain refinement and dynamic recrystallization controlling effect due to the high solid solubility in the α-Al matrix. For example, in Xue et al.’s work, the grain size of the Al-2.4Cu alloy is obviously refined after adding 0.1 wt % Sc [14]. Li et al.’s work also demonstrates that Al-4.12Cu-0.48Mg-0.53Ag-0.11Sc shows better thermal stability compared with the Sc-free alloy due to the formation of Al3Sc phases [15]. Furthermore, a previous study verified that a minority of the Sc exists as the form of Al8−xCu4+xSc phase and most of the Sc forms Al3(Sc, Zr) particles in Al-5.6Cu-0.72Mg-0.5Ag alloy, both of which are helpful to the mechanical properties at high temperatures of the alloy [16]. However, these rare-earth elements are limited in use in mass production because of their high price.
Erbium has garnered significant interest from researchers as an alternative element due to its low price. Furthermore, Er also acts as a grain refiner in Al-based alloys. Moreover, the Al3Er phase, which possesses the same L12 structure as the Al3Sc phase precipitated in aluminum alloy, can also be deemed a major strengthening phase. Based on Pan et al.’s research, the mechanical properties of Al-3Cu alloy are enhanced by the formation of Al3Er particles, also providing numerous nucleation sites for the θ′ phase [17]. Moreover, according to Li et al.’s work, the addition of minor Er favors a significant refinement in dendritic substructure in the Al-4.6Cu-0.39Mg-0.48Ag alloy [18]. However, Bai et al. found a coarser grain structure in the Al-6.23Cu-0.61Mg-0.47Ag-0.23Er alloy compared with the Er-free alloy, and the tensile properties also deteriorated [19].
As a potential material serving at elevated temperatures, more stringent requirements are set regarding aluminum alloys. Although the potential effects of Er on Al-based alloys’ grain structure and microalloying behavior have been thoroughly documented, most research still focuses on deformed alloys such as hot-rolled sheets or extruded pipes [20,21,22,23], which undoubtedly increase the production cost, particularly considering complex work pieces. The design of a novel cast Al-Cu-Mg-Ag alloy is, therefore, a matter of pressing urgency. This study mainly aims to explain the association between the tensile properties and the microstructures in order to design the optimal Er content as well as improving the mechanical properties of the Al-Cu-Mg-Ag alloy at 300 °C.

2. Experimental Details

All of the experimental alloys were cast using traditional casting methods. The chemical compositions of the studied alloys are provided in Table 1. All tested samples were solution-treated in a salt bath furnace at 530 °C for 12 h, then artificial aged at 165 °C for various time periods after water quenching.
The peak aged state was determined by Vickers hardness measurements applied at load of 3 kg for 15 s, and each hardness value was measured with at least five measurements from five samples.
The “dog-bone”-type tensile tests specimens were machined according to ISO 783-1999, then carried out at room temperature on an Instron-MTS810 machine (SINOTEST, Changchun, China) and at 200 °C and 300 °C on a RWS50 machine (MTS, Minneapolis, MN, USA) with a strain rate of 10−3 s−1 to obtain the tensile properties. For each alloy, three specimens were repeatedly experimented to ensure the accuracy of the data.
The optical microscope (OM), X-ray diffraction (XRD), scanning electron microscope (SEM), and transmission electron microscope (TEM) were applied to understand and clarify the discrepancies among all studied alloys. The metallograph was monitored by Caikon DMM-900C OM machine (Caikon, Shanghai, China) and the grain size was measured using Image J v1.8.0 software (Bethesda, MD, USA), with at least 500 grains of low magnification for each alloy. The main phases in different alloys were performed on a Rigaku D/Max 2500PC X-ray diffractometer (Bruker, Karlsruhe, Germany). The morphologies and the chemical compositions of different intermetallics were examined by FEI Quanta 200 SEM machine (FEI, Hillsboro, OR, USA). The differences of the precipitates in the three alloys were characterized by a Tecnai G2 20 TEM machine (FEI, Hillsboro, OR, USA). All TEM samples were electro-polished in a solution of 70% methanol and 30% nitric acid at approximately −20 °C. The average length, thickness, and number density of Ω and θ′ precipitates were measured by means of Image J software with at least 2000 precipitates from five different grains.
The method of Underwood was used to calculate the volume fraction of Ω and θ′ precipitates [24,25]. The volume fraction ( f v ) of Ω plates and θ′ is calculated by:
f v Ω = π ( d ¯ ) 2 t ¯ 4 · N ( 1 + T + d ¯ A ) A ( T + d )
f v θ = π ( d ¯ ) 2 t ¯ 4 · N ( 1 + 2 ( T + d ¯ ) A ) A ( T + d )
And the number density (N) of Ω and θ′ precipitate is calculated by:
N = 4 V π t ¯ d ¯ 2
where A is the corresponding area of the image, d ¯ and t ¯ represent the average plate diameter and thickness of the plate-shaped precipitates, respectively; T is the foil thickness obtained by the convergent beam electron diffraction (CBED) method by using Kossel–Mollenstedt fringe spacing [24,26,27].

3. Results

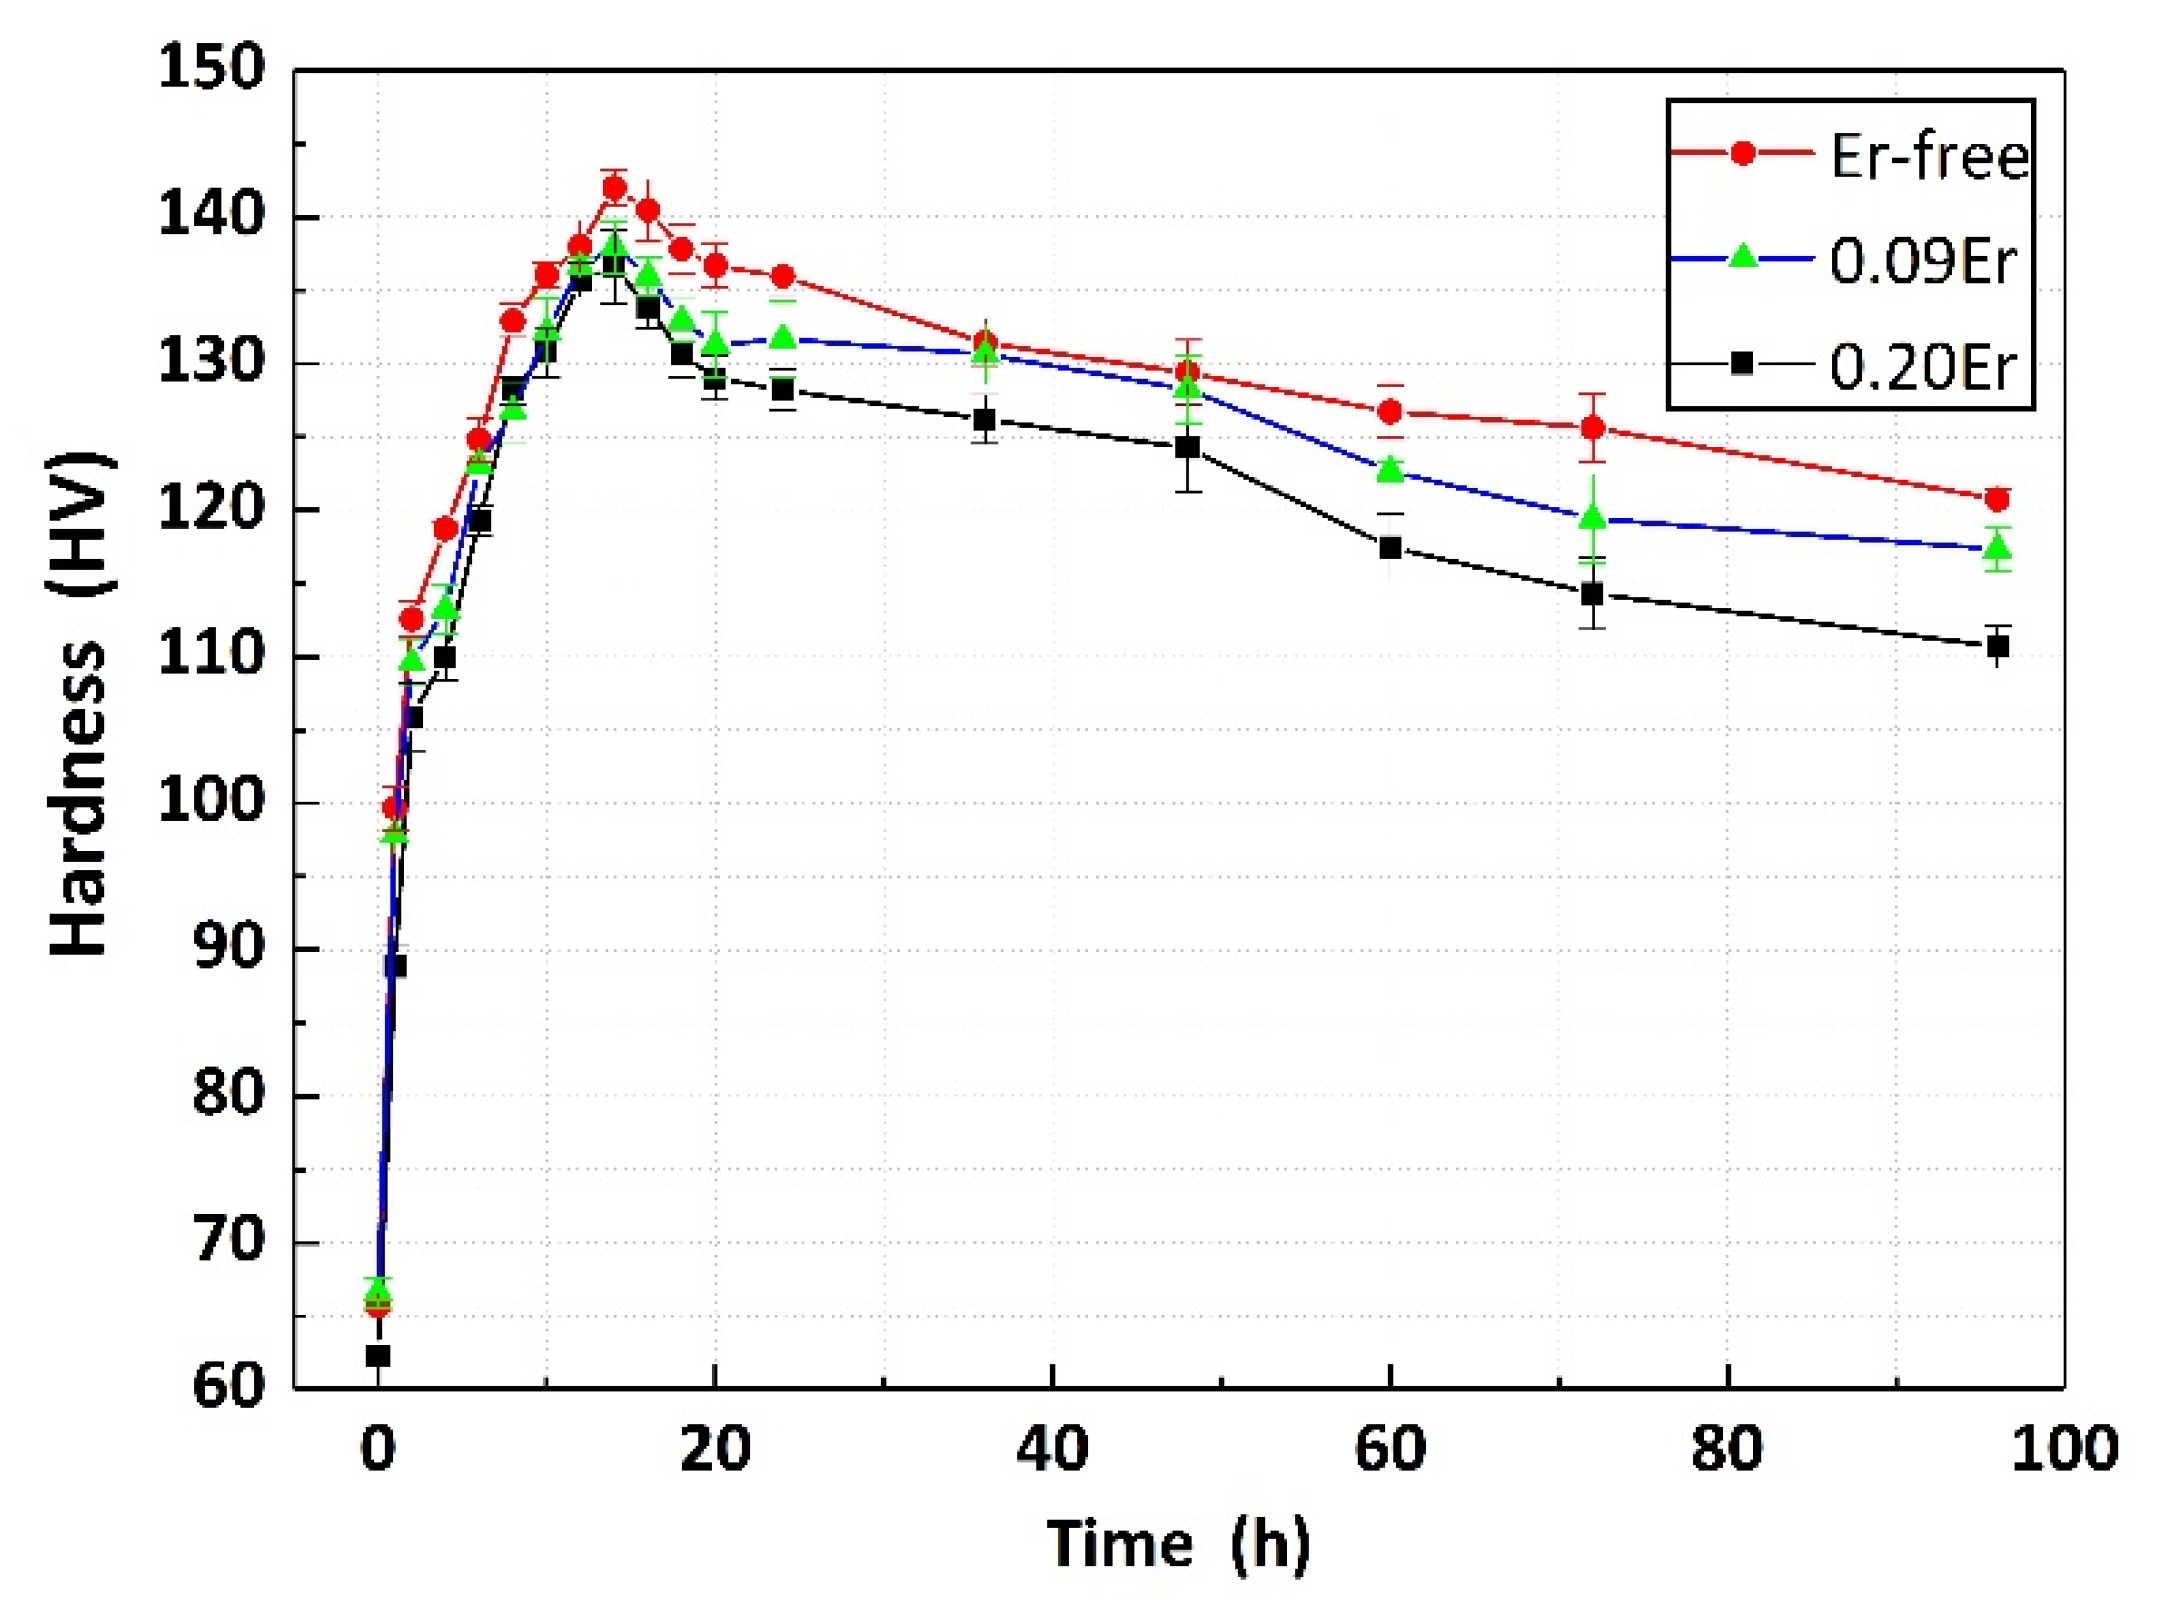
3.1. Age-Hardening Curves

Figure 1 shows the plot of age-hardening curves of investigated alloys with and without Er additions at 165 °C. It is found that in Figure 1, the trend of all curves is basically the same with a rapid increase and then a gradual decline. It is worth noting that minor Er addition has little effect on altering the time to peak aging condition with all studied alloys reaching peak aging condition (T6 state) for 14 h. However, the maximum hardness of 141.8 ± 3.5 HV for Er-free alloy decreases to 138.1 ± 2.7 HV in 0.09Er alloy and finally drops to 137.9 ± 2.8 HV in 0.20Er alloy. After the peak aging stage, the Vickers hardness of Er-free alloy is still superior to that of 0.09Er and 0.20Er alloys.

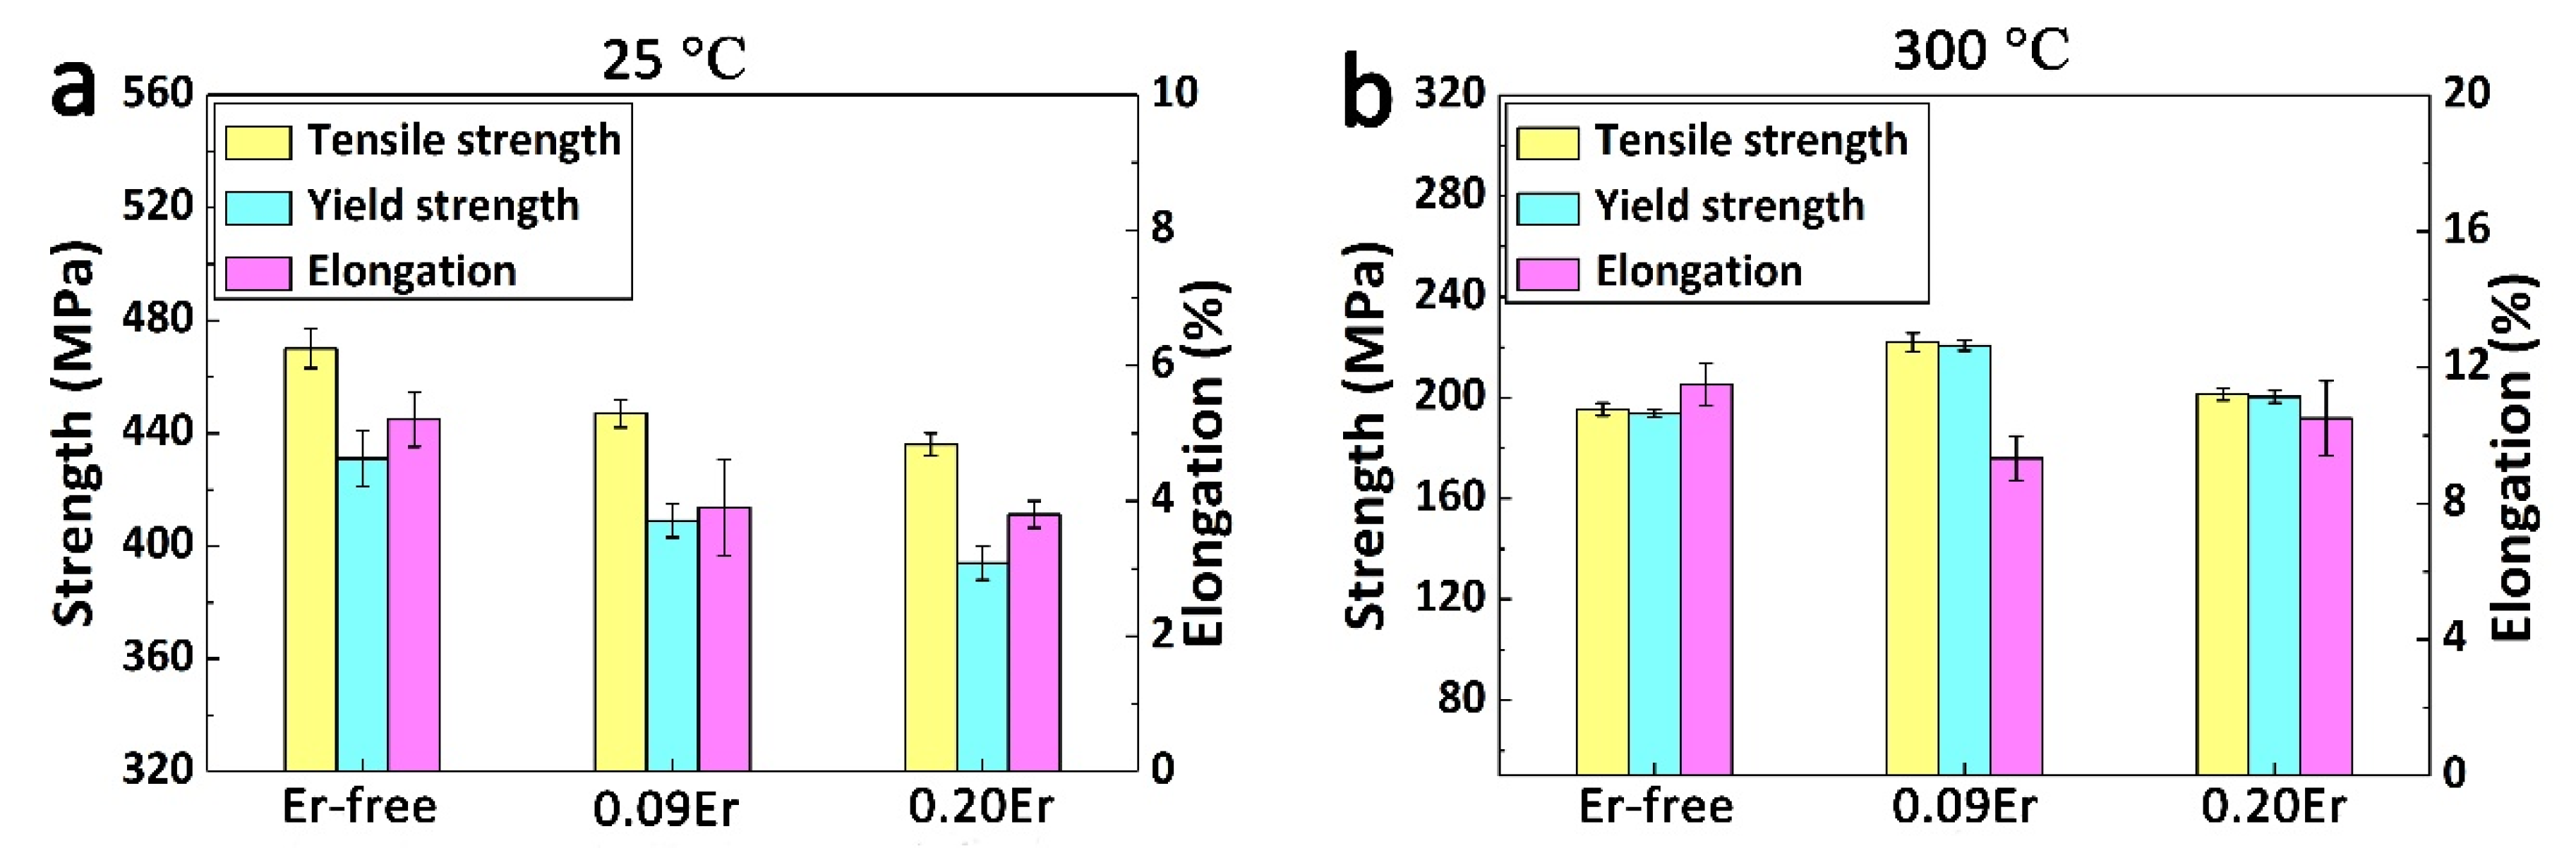
3.2. The Tensile Properties

Tensile properties of all T6 tempered alloys at different temperatures are revealed in Figure 2. With the Er content increasing from 0 wt % to 0.20 wt %, the tensile strength at room temperature decreases from 472 MPa to 452 MPa and ultimately drops to 438 MPa. On the contrary, the results of the tensile strength of the studied alloys at 300 °C are totally different, with the value of 195, 222, and 201 MPa for Er-free, 0.09Er, and 0.20Er alloy, respectively. In addition, a similar tendency is also found in yield strength of the three studied alloys with the increasing Er content. It is found that the highest yield strength of 431 MPa can be obtained in the Er-free alloy at ambient temperature. While under high temperature condition, the 0.09Er alloy shows the best yield strength, with a value of 220 MPa at 300 °C, which is much higher than that of the Er-free alloy (194 MPa) and the 0.20Er alloy (200 MPa).
In contrast, the reduction of elongation is detected with the addition of Er. At room temperature, the Er-free alloy owns the uppermost elongation about 5.3% after fracture, while the elongation value of 0.09Er and 0.20Er alloy drops to about 3.9%. Furthermore, the elongation among all alloys is always found to be above 9% at 300 °C. It can be concluded that small Er addition degrades the tensile properties of peak-aged Al-Cu-Mg-Ag alloys at ambient temperature but increases the tensile properties at elevated temperature.

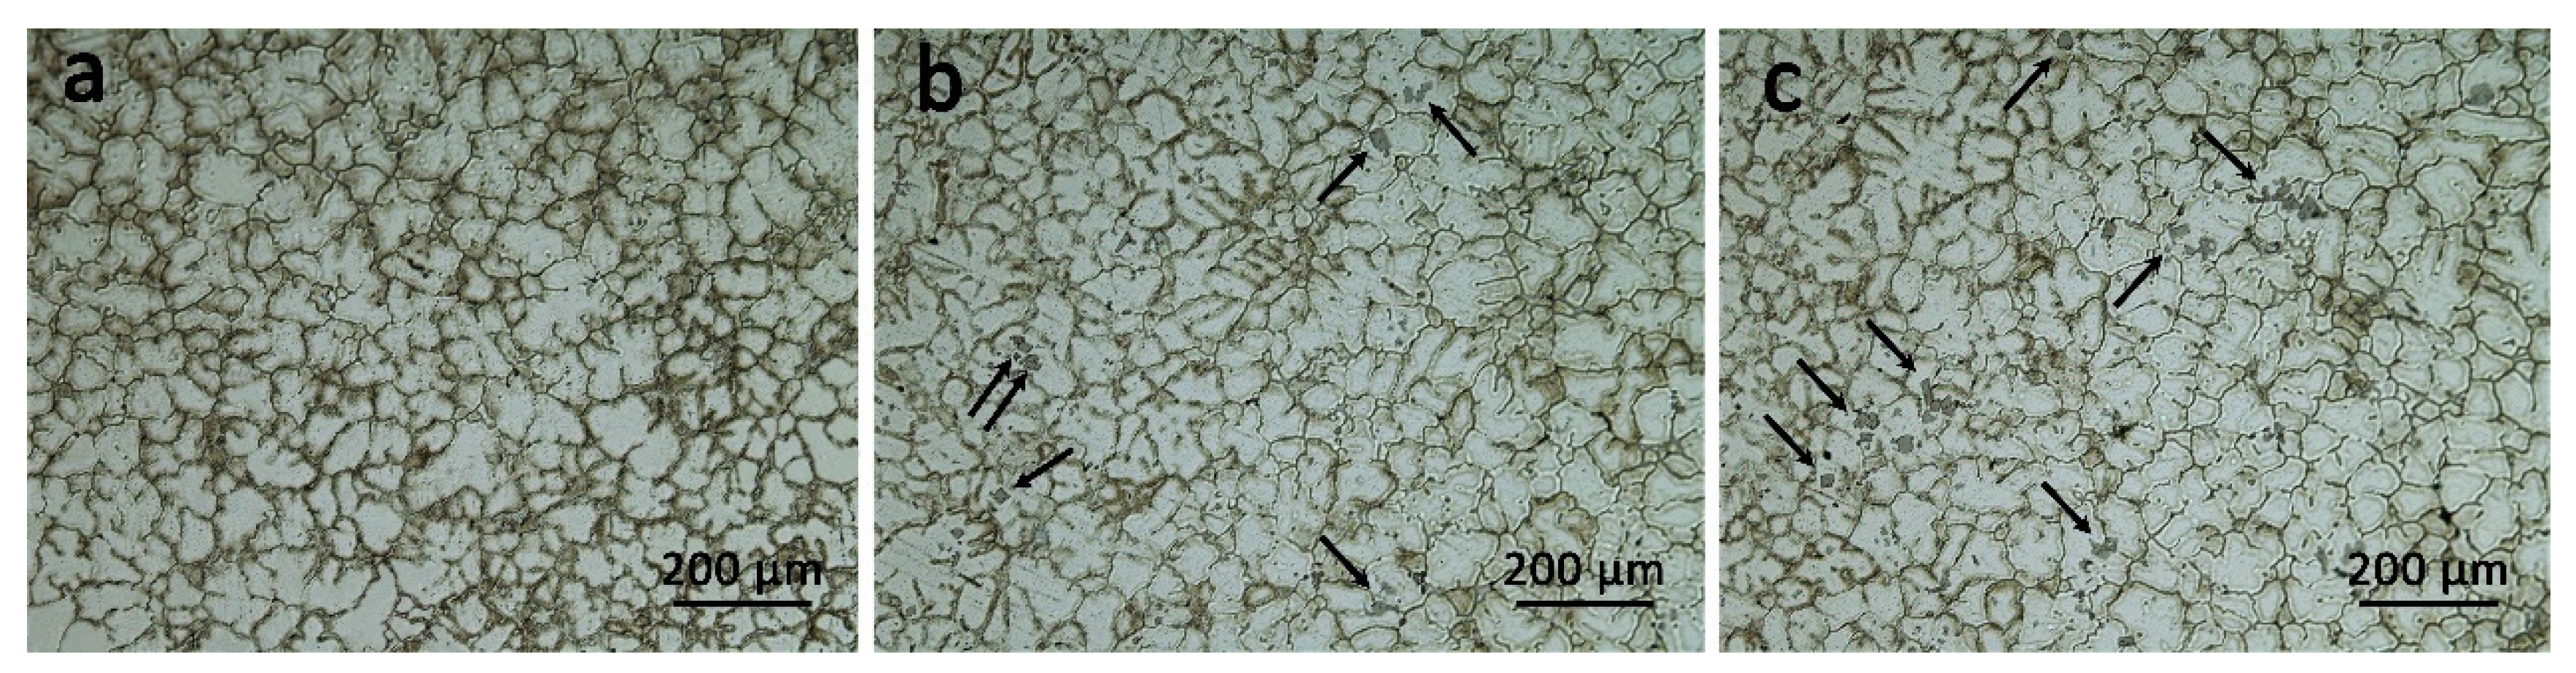
3.3. Grain Structures
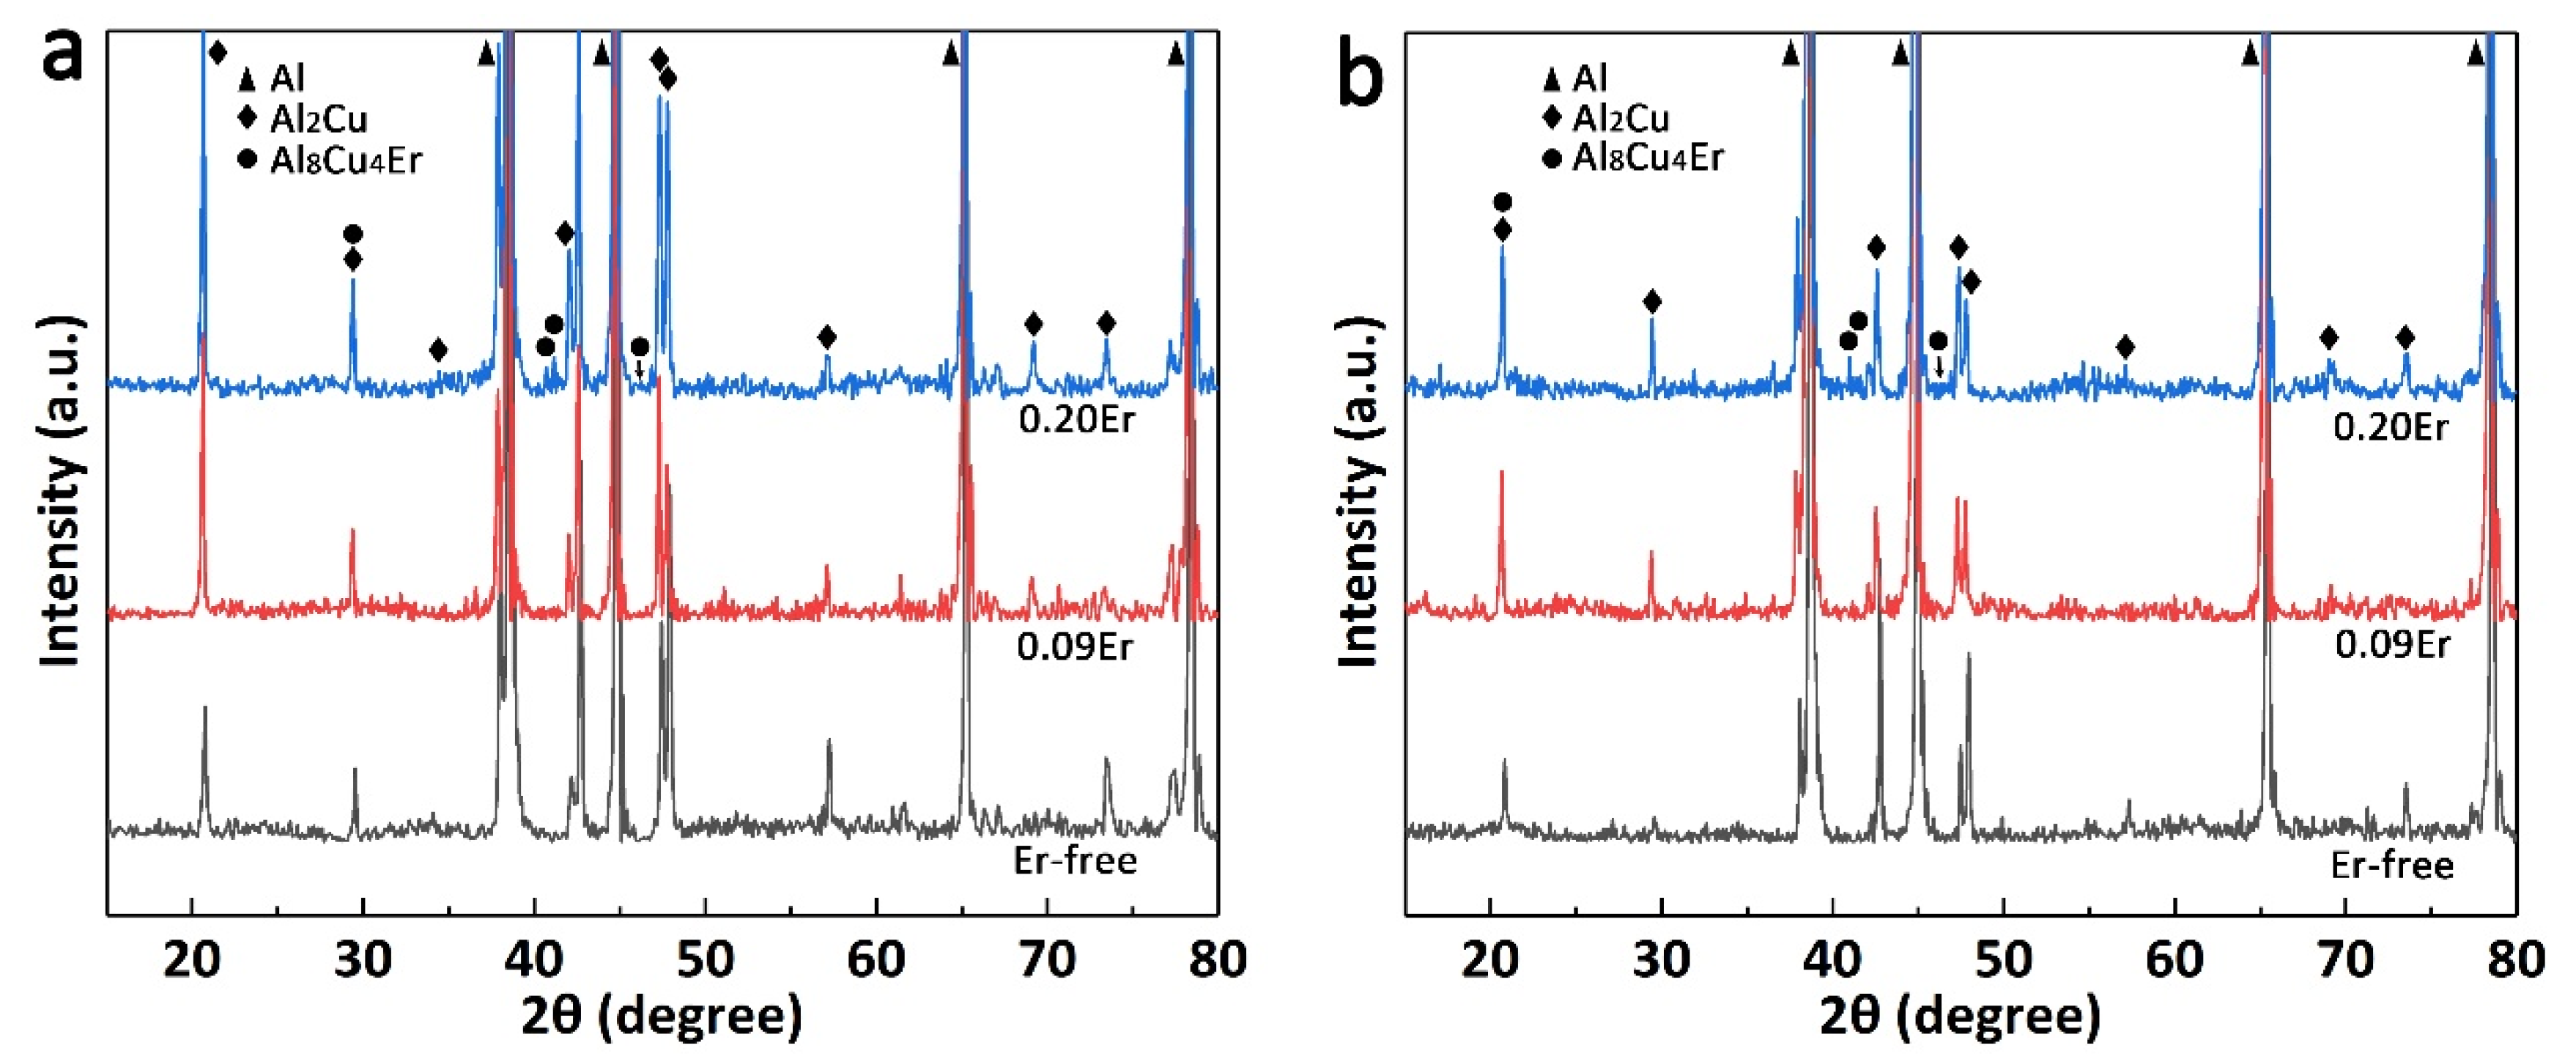
The metallographic photos of the as-cast alloys are shown in Figure 3. The as-cast Er-free alloy is predominated by a large amount of coarse dendritic structures and few fine equiaxed grains of about 86.7 μm in diameter. Whereas, it is worth noting that with the addition of Er element, the grain size did not change much. A small number of typical dendritic substructures as well as a large sort of fine equiaxed grains are still maintained with the size about 82.3 and 85.2 μm in Figure 3b,c, indicating that the effect of grain refinement of Er in this work is not obvious. In addition, a few coarse second-phase particles (marked by black arrows) appear in the grains of the alloy with Er addition.

3.4. XRD Analysis

The XRD patterns of three studied alloys after peak aging treatment are presented in Figure 4. For Er-free alloy, the XRD patterns only included peaks of α-Al and θ-Al2Cu [26]. While in the XRD patterns of 0.09Er alloy, the intensity of diffraction peak of Al8Cu4Er phase is not obvious since the volume fraction of Al8Cu4Er phase must be very low (<1%), which is even lower than the minimum detectable level of X-ray diffractometer. For 0.20Er alloy, extra peaks of Al8Cu4Er phase are observed, and the peak intensity of Al8Cu4Er phase increases significantly with the increase in Er content. However, after solution treatment, there is no significant difference in the peak intensity of the Al8Cu4Er phase in Er-added alloys, which proves its thermal stability. The peak intensity of the Al2Cu phase decreases but does not disappear completely, which is mainly caused by the fact that the Cu content in all tested alloys is higher than the maximum solid solubility in Al.

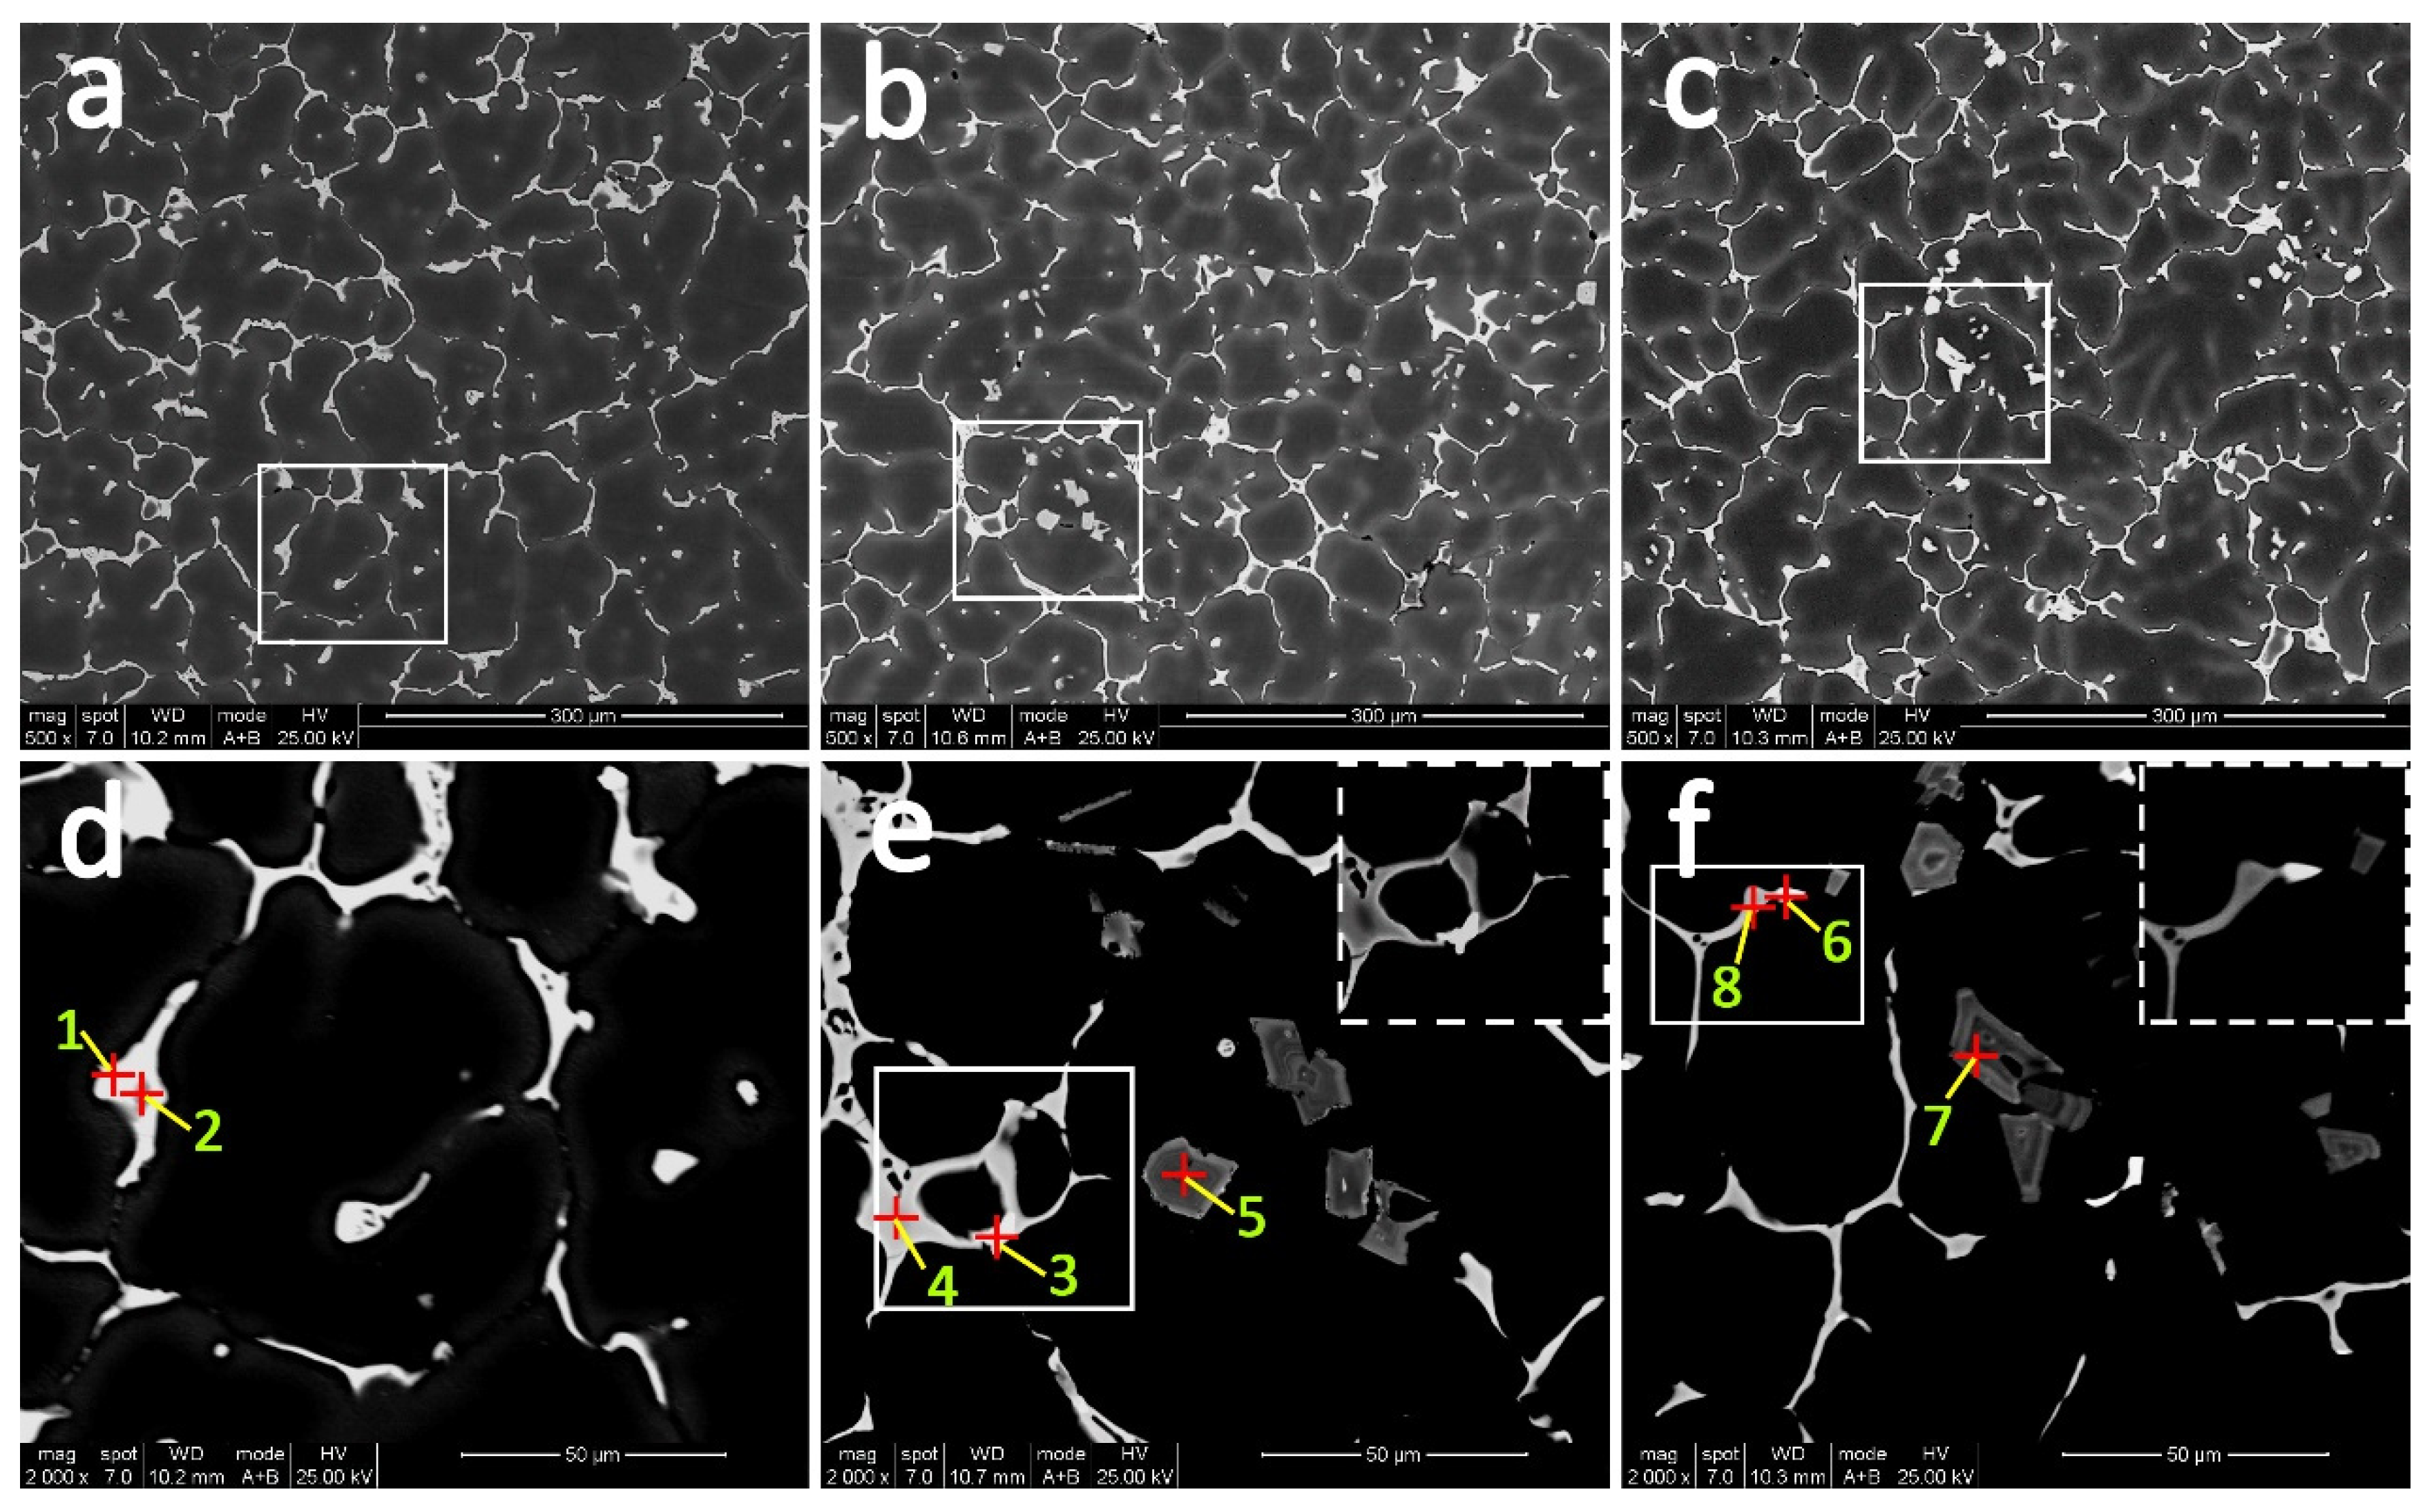
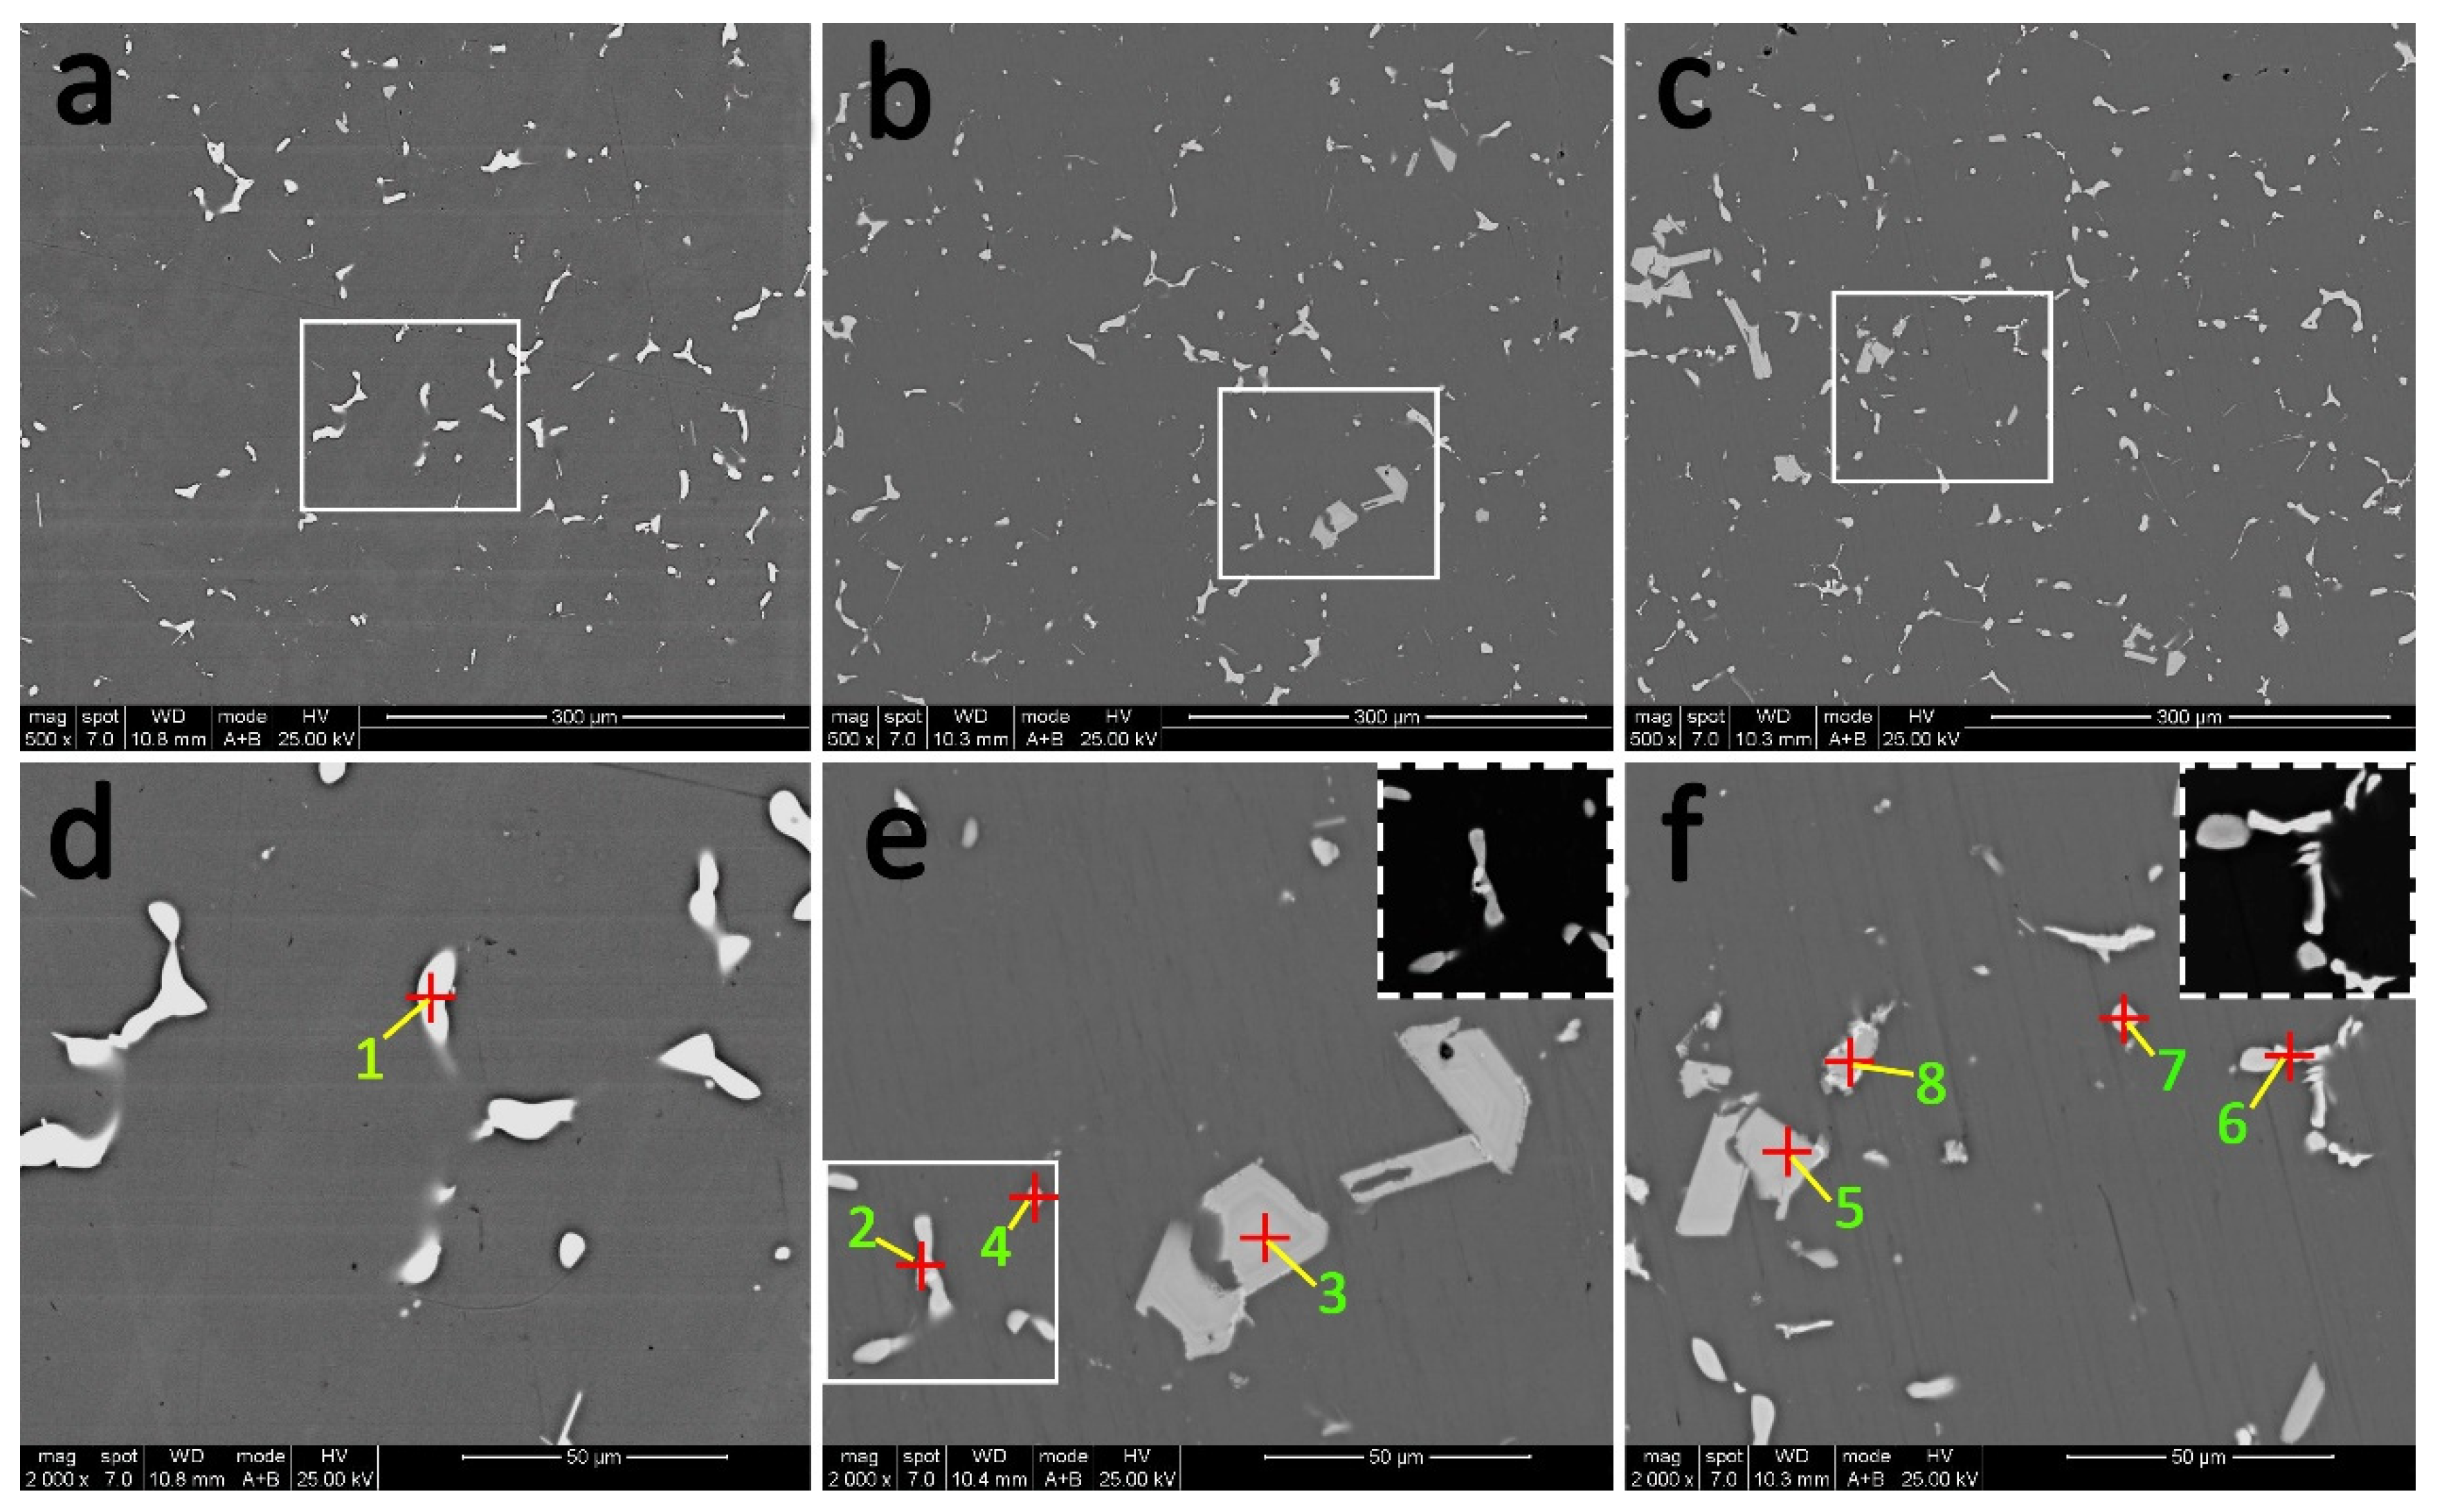
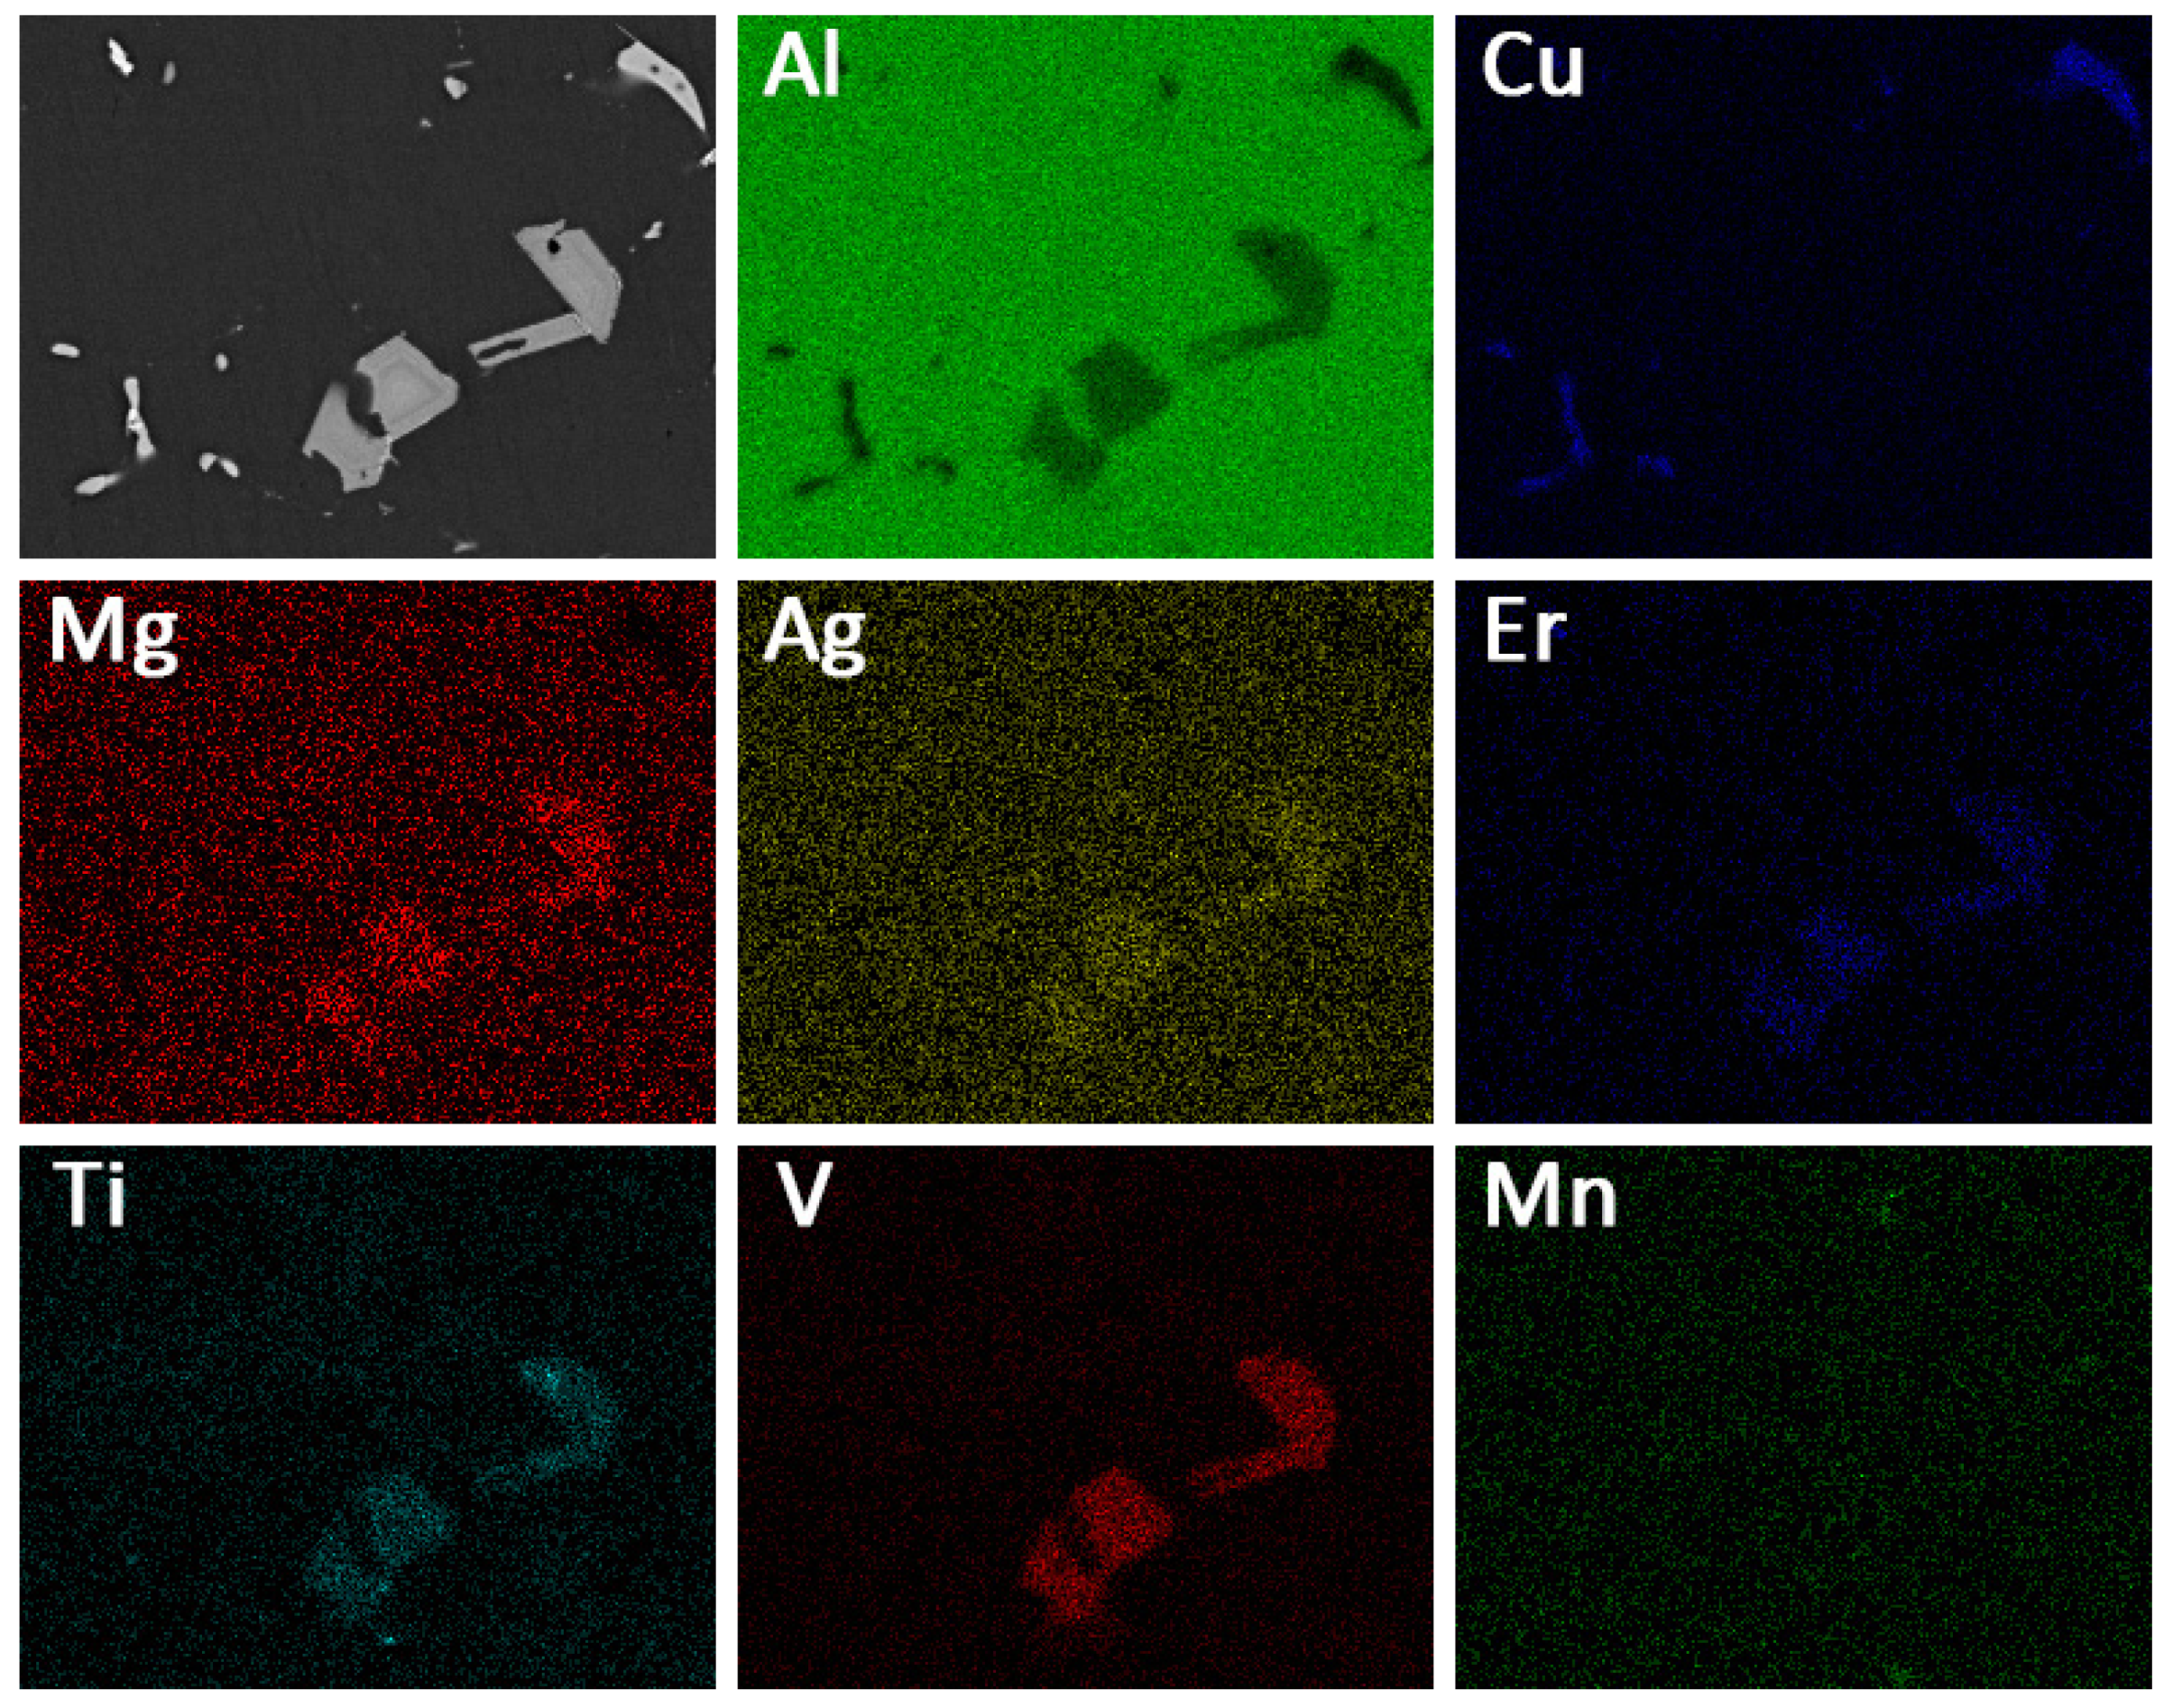
3.5. SEM Observation

The backscattered electron images (BSE) of the as-cast experimental alloys are shown in Figure 5. It is obvious that all studied alloys are predominated by reticulated dendritic α-Al and continuous intergranular primary phase. According to the results of EDS analysis in Table 2, the coarse gray phase in Er-free and Er-added alloys is believed to be Al2Cu phase (point 1, 4, and 8) in view of the atomic ratio of Al and Cu with 2:1, which is consistent with the Al-Cu-Mg diagram [28,29]. Additionally, the impurity Fe in the alloy segregates with Cu and Mn forms the AlCuMnFe phase in the matrix (point 2). However, a different brighter phase is detected at the grain boundary with the addition of Er. Points 3 and 6 indicate the bright particles are enriched with Cu and Er with the mole ratio of 4:1, which could be considered as Al8Cu4Er phase according to the Al-Cu-Er phase diagram [30] and XRD patterns in Figure 4. Meanwhile, another blocky phase consisting of several elements is discovered in the Er-added alloys (points 5 and 7), which is marked as the (Mg, Ag, Er, V, Ti)-rich phase in this paper. What is noteworthy is that the volume fraction of the thick, blocky intermetallics increases from 1.03% to 2.27% as the Er content increases from 0.09% to 0.20%.
Figure 6 shows the BSE images of different alloys after T6 heat treatment. Evidently, after the solution treatment, most second phase dissolves into the matrix, and second-phase particles along the grain boundaries change from continuous to discontinuous and thinner. However, due to the content of Cu in all studied alloys being far beyond the limit of solubility in Al, a small number of Al2Cu phase is still retained after solution treatment, which can be confirmed by EDS analysis of points 1, 4, and 7 in Table 3. Additionally, according to points 2 and 6 in Figure 6, it should be pointed out that Al8Cu4Er phase still remains in Er-added alloys after solution treatment. Similarly, coarse (Mg, Ag, Er, V, Ti)-rich phase was also not dissolved in the Al matrix, which could be proved by points 3, 5, and 8 in Figure 6 as well as EDS mapping in Figure 7. In addition, it is worth noting that the volume fraction of the blocky (Mg, Ag, Er, V, Ti)-rich phases did not change significantly compared with that before solution, which is sufficient to demonstrate its thermal stability at 300 °C.

3.6. TEM Observation

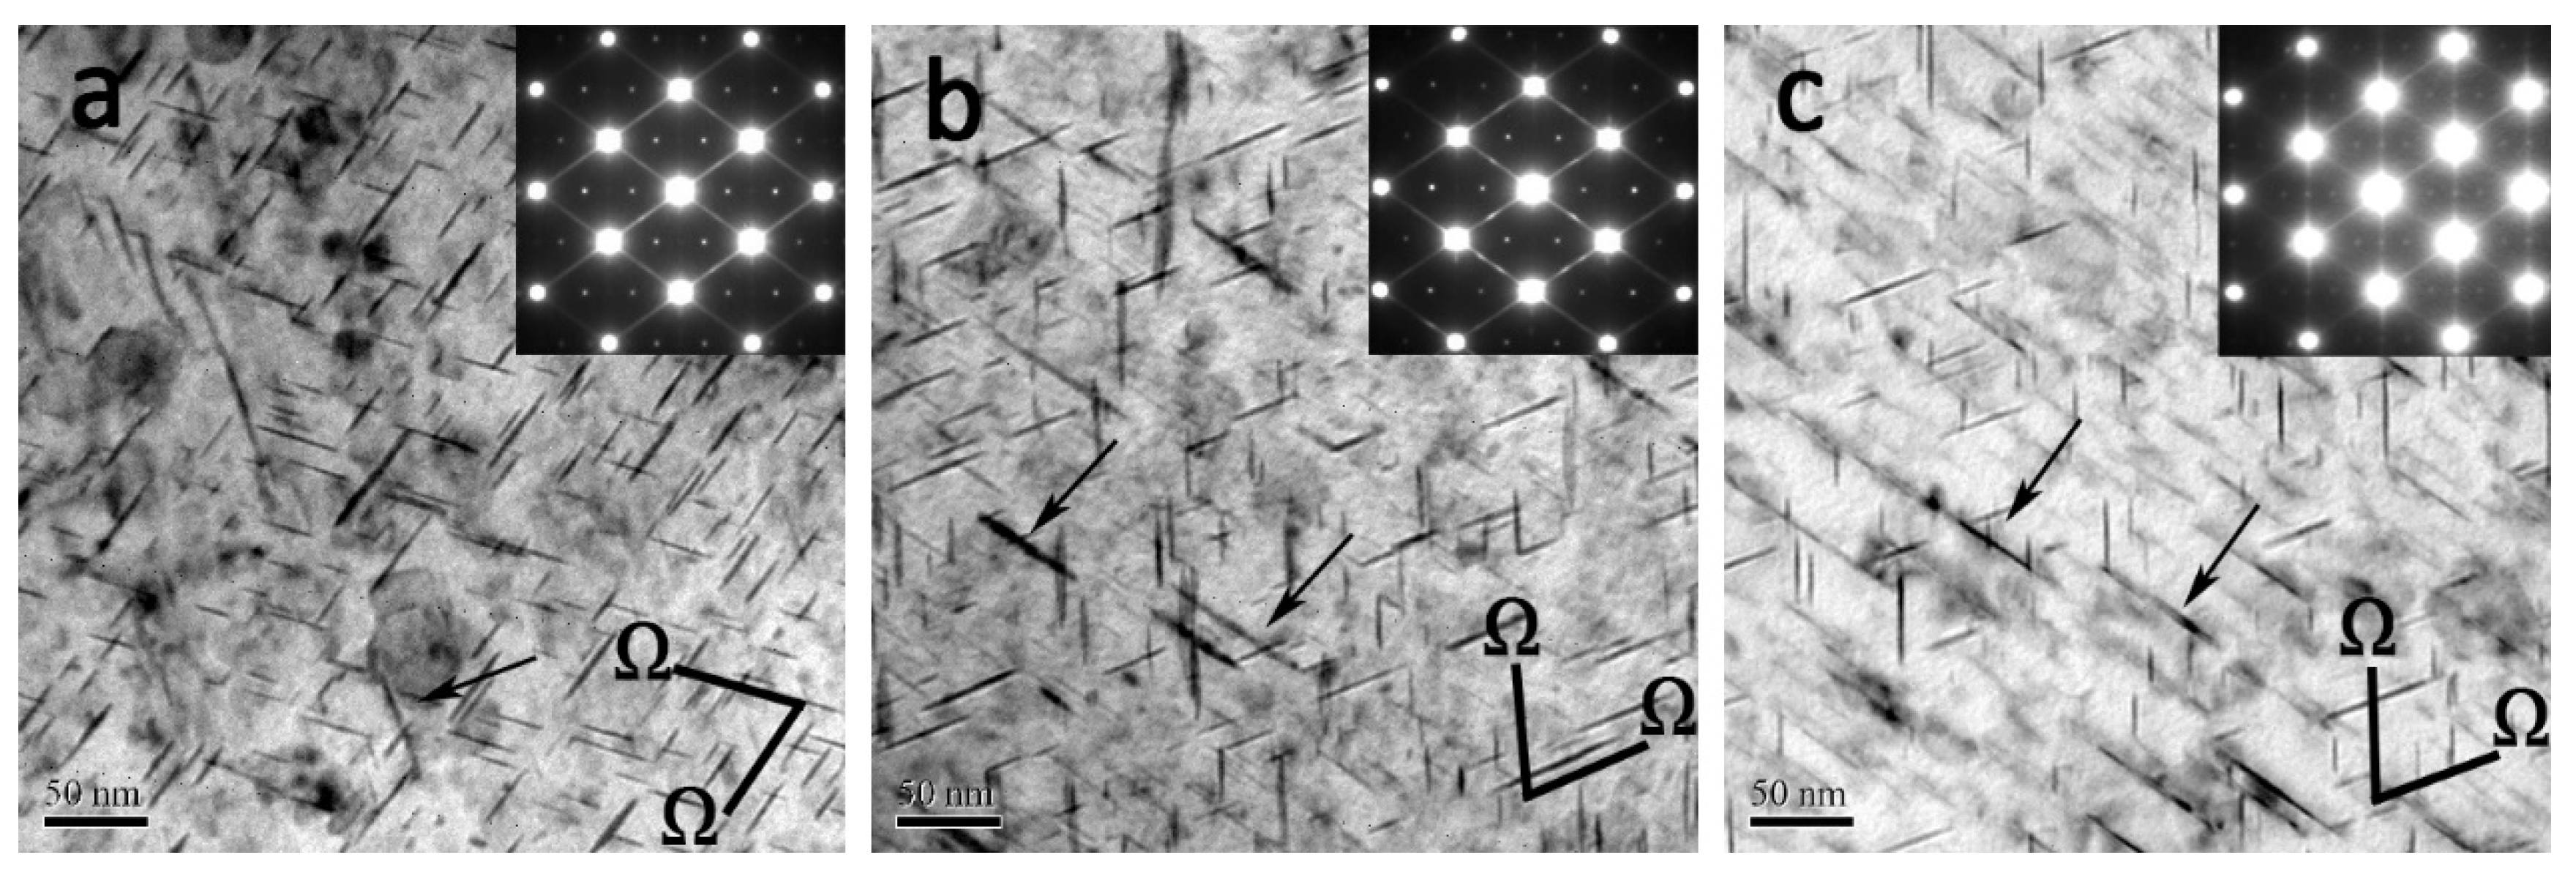
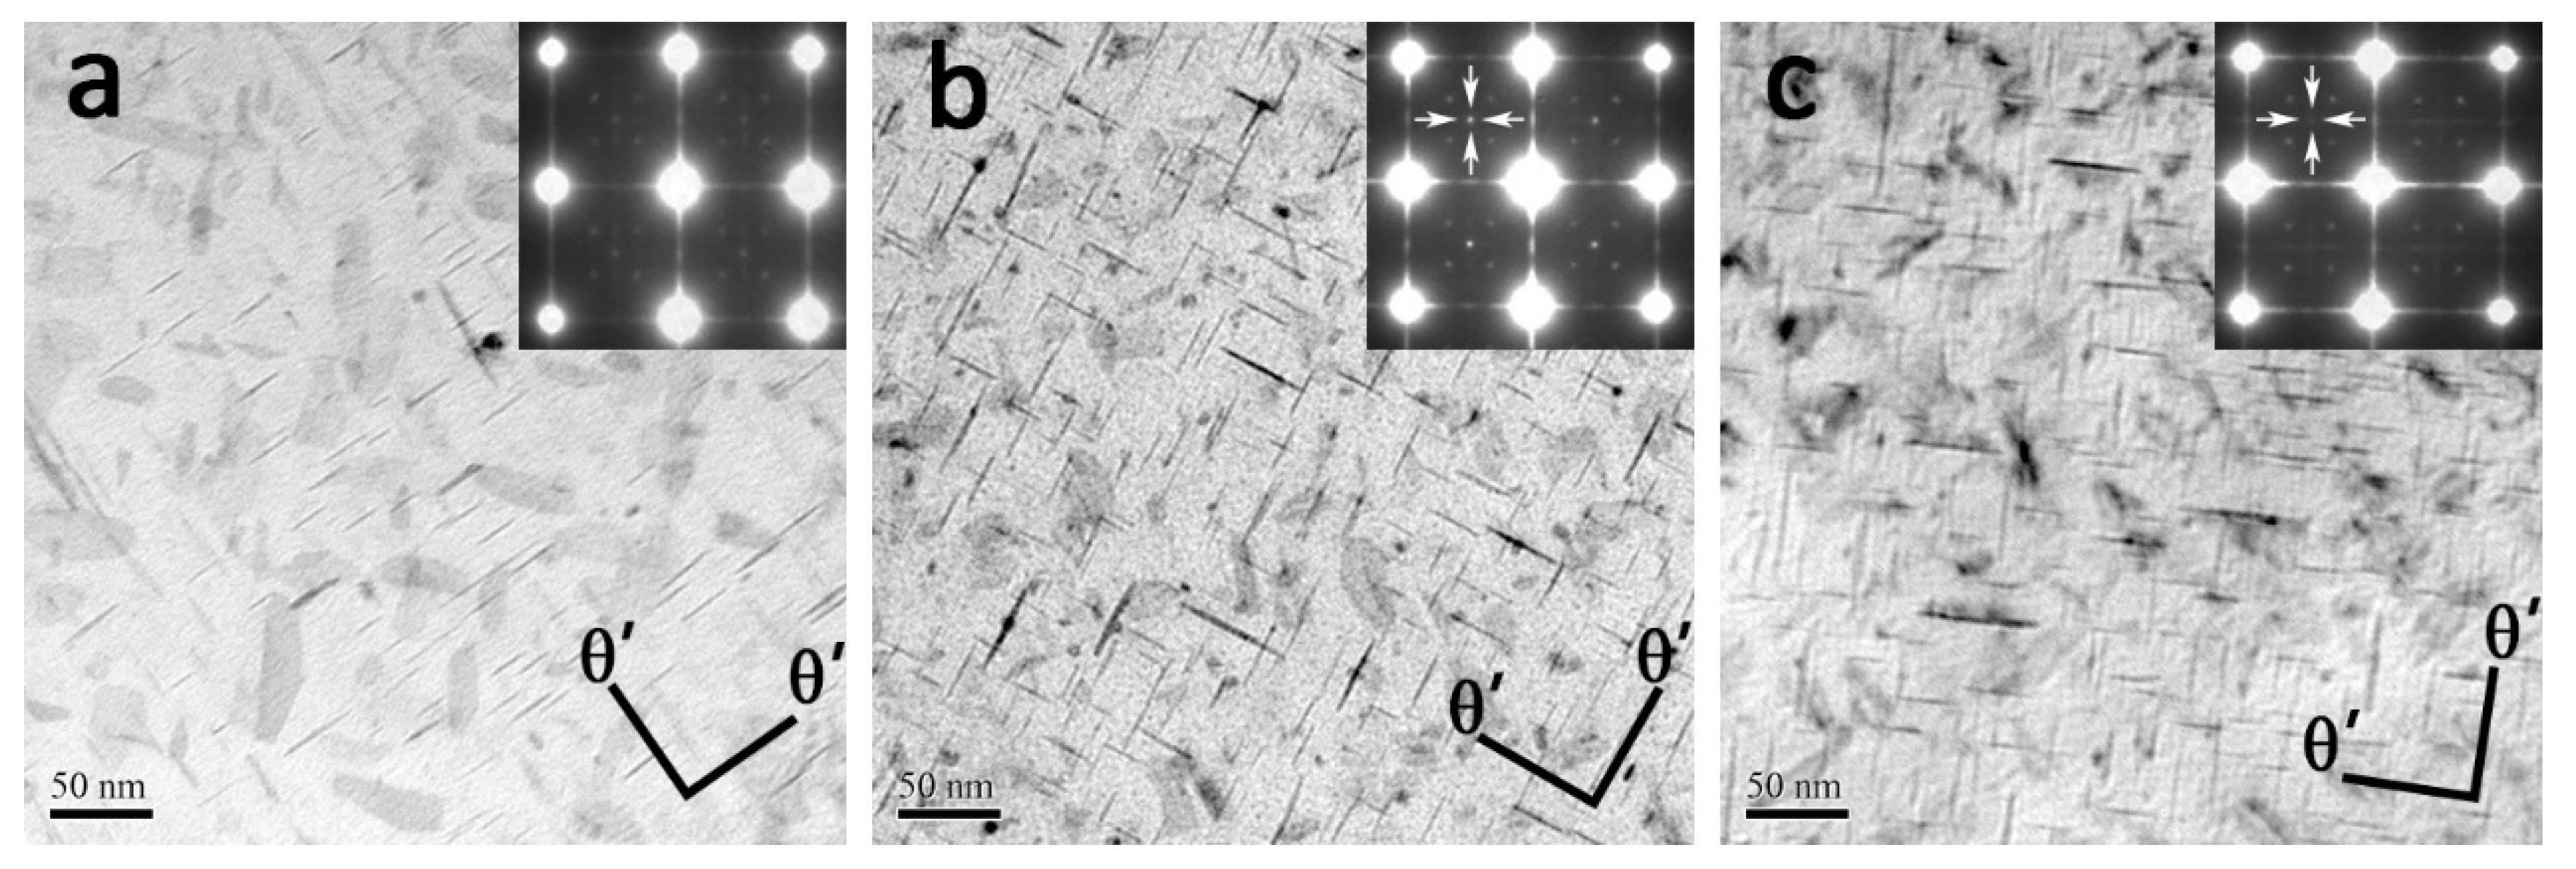
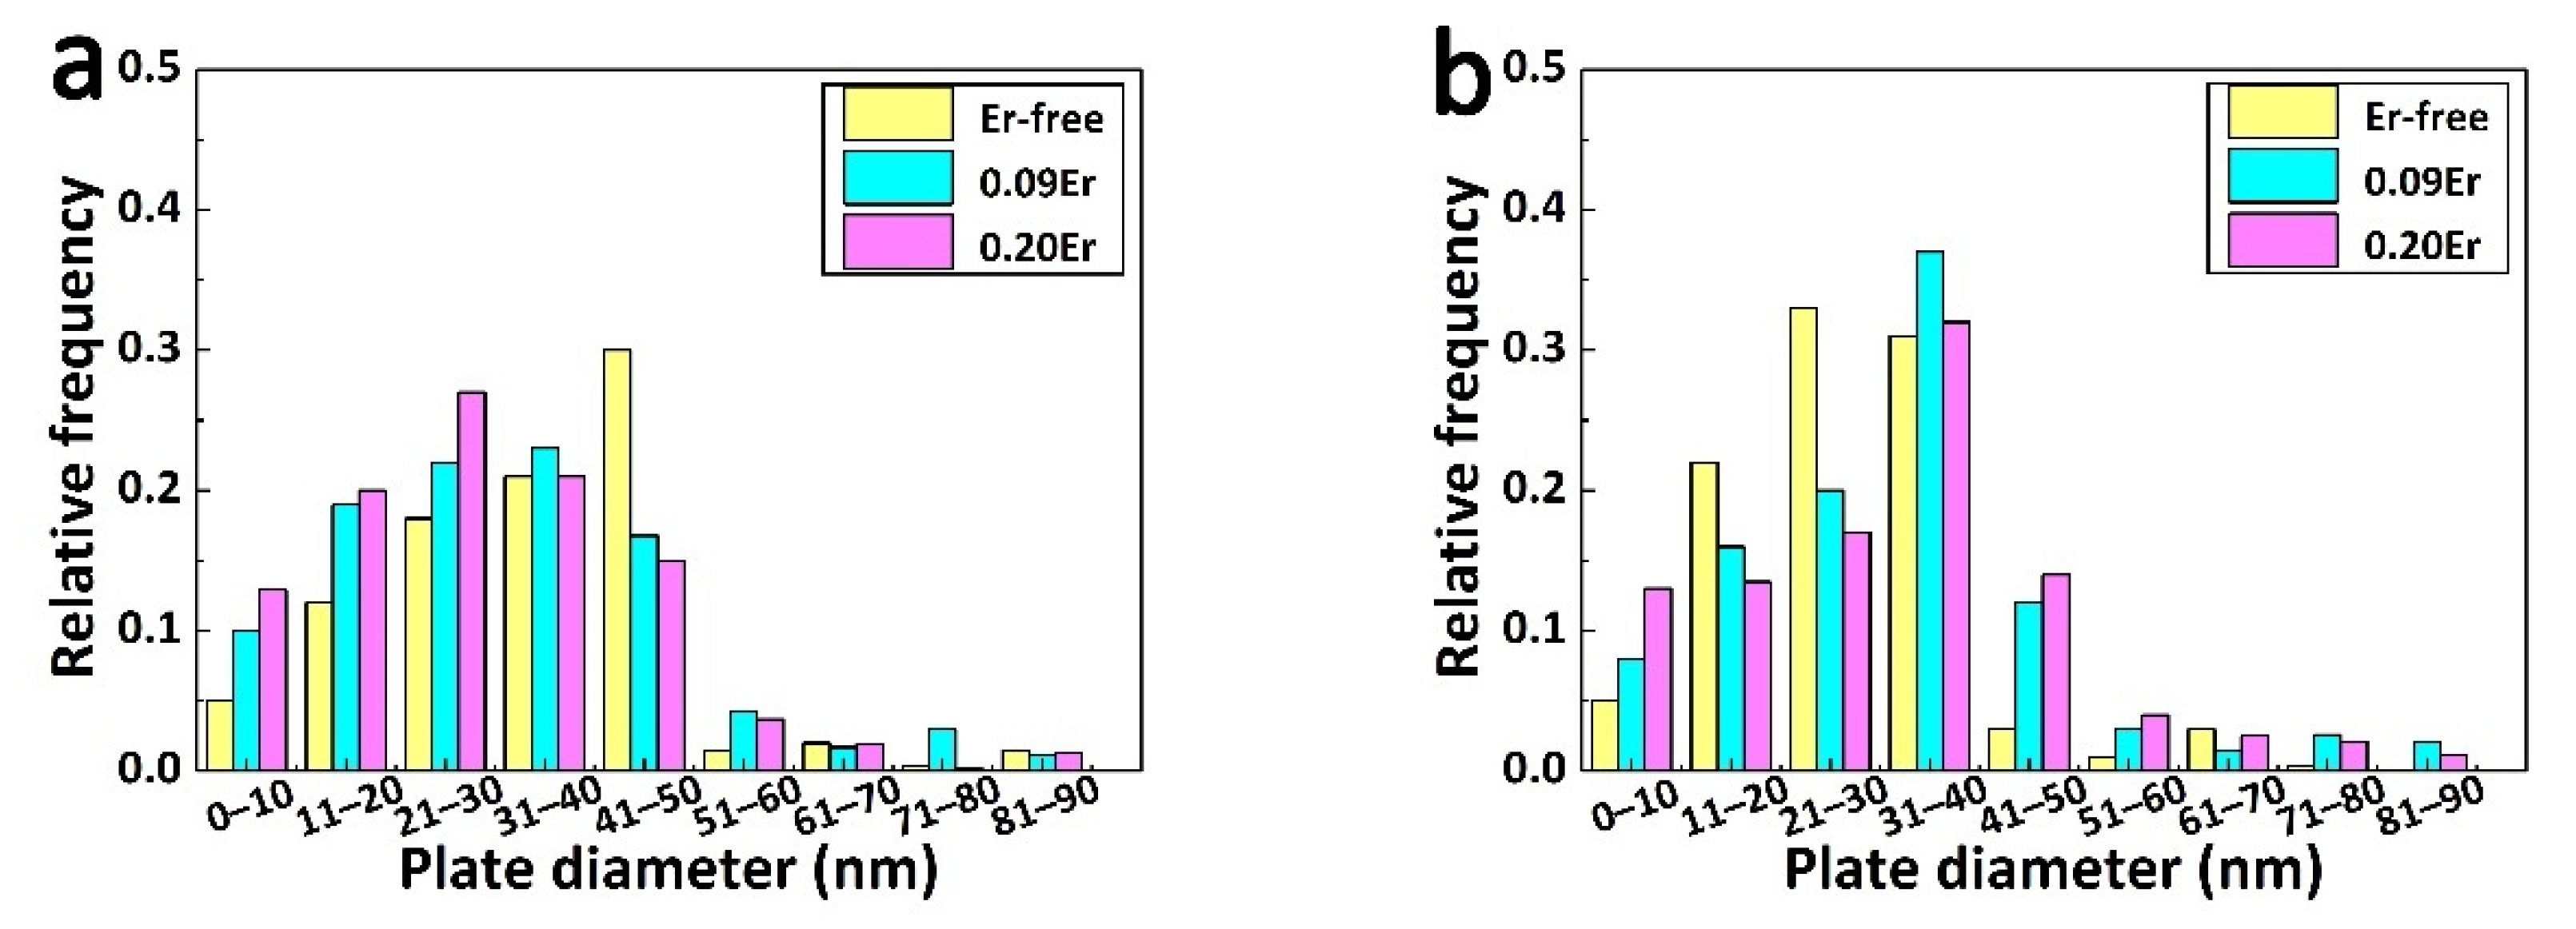
3.6.1. The Ω Phase and θ′ Phase

The TEM observation near the <110>α orientation in all experimental alloys is illustrated in Figure 8. It can be seen that the major strengthening phase in all alloys is the Ω phase, which corresponds to the diffraction spots of 1/3 and 2/3 {220}α positions. According to Table 4, the number density of Ω plates in the Er-free alloy is estimated to be 27.6 ± 10.3 × 10³/μm3, about 24% and 44% higher than that (21.1 ± 9.1 × 10³/μm3 and 15.4 ± 1.1 × 10³/μm3) of the 0.09Er and 0.20Er alloy, respectively. Compared with the average diameter of Ω plates in Er-free alloy (42.3 ± 12.4 nm), the average diameter of it in 0.09Er and 0.20Er alloy is almost the same (37.78 ± 9.5 nm and 37.5 ± 6.3 nm). Moreover, according to statistics, the addition of Er has little effect on altering the thickness of Ω plates, and the thickness of the Ω phase for all is basically maintained at about 2.5 nm.
In addition to the dense Ω phase, the alloys are accompanied by a large amount of θ′ phase. As shown in Figure 9a, there is only a sparse θ′ phase (marked by a black arrow) in the Er-free alloy. On the contrary, with the addition of the Er element, the θ′ phase in the matrix obviously increases as depicted in Figure 9b,c, which can be proved by the streaks at 1/2 {220}α positions. In order to further verify the influence of Er on θ′ precipitates, the examination along <100>α orientation is also chosen for analysis. The presence of dense θ′ precipitates can also be demonstrated by the reflections of 1/2 {220}α along the <100>α orientation in Figure 9b,c (marked as white arrows). According to Table 4, the number density of the θ′ phase in the Er-free alloy is estimated to be 2.65 ± 2.1 × 10³/μm3, which is absolutely lower than that of the 0.09Er (4.3 ± 3.1 × 10³/μm3) and 0.20Er (4.13 ± 6.7 × 10³/μm3) alloys, respectively. Furthermore, the average length of the θ′ phase in the Er-free alloy is about 32.7 ± 10.1 nm, quite different from that of the 0.09Er (36.8 ± 15.4 nm) and 0.20Er alloys (35.4 ± 16.3 nm).
TEM results showing how Er affects Ω and θ′ phases are presented in Figure 10. The distributions of length of Ω plates are presented in Figure 10a, which are similar in all alloys. However, the major average length of the Ω phase of the Er-free alloy is between 30 nm to 50 nm, while the length of the Ω plates of the Er-added alloys tends to be more even and shorter.
What is noteworthy is that the length distribution of θ′ precipitates in the alloy with and without Er is slightly different. θ′ precipitate lengths ranging from 20.0 nm to 30.0 nm are the majority of the population in the Er-free alloy, while lengths with a range from 30 nm to 40 nm dominate in Er-added alloys.

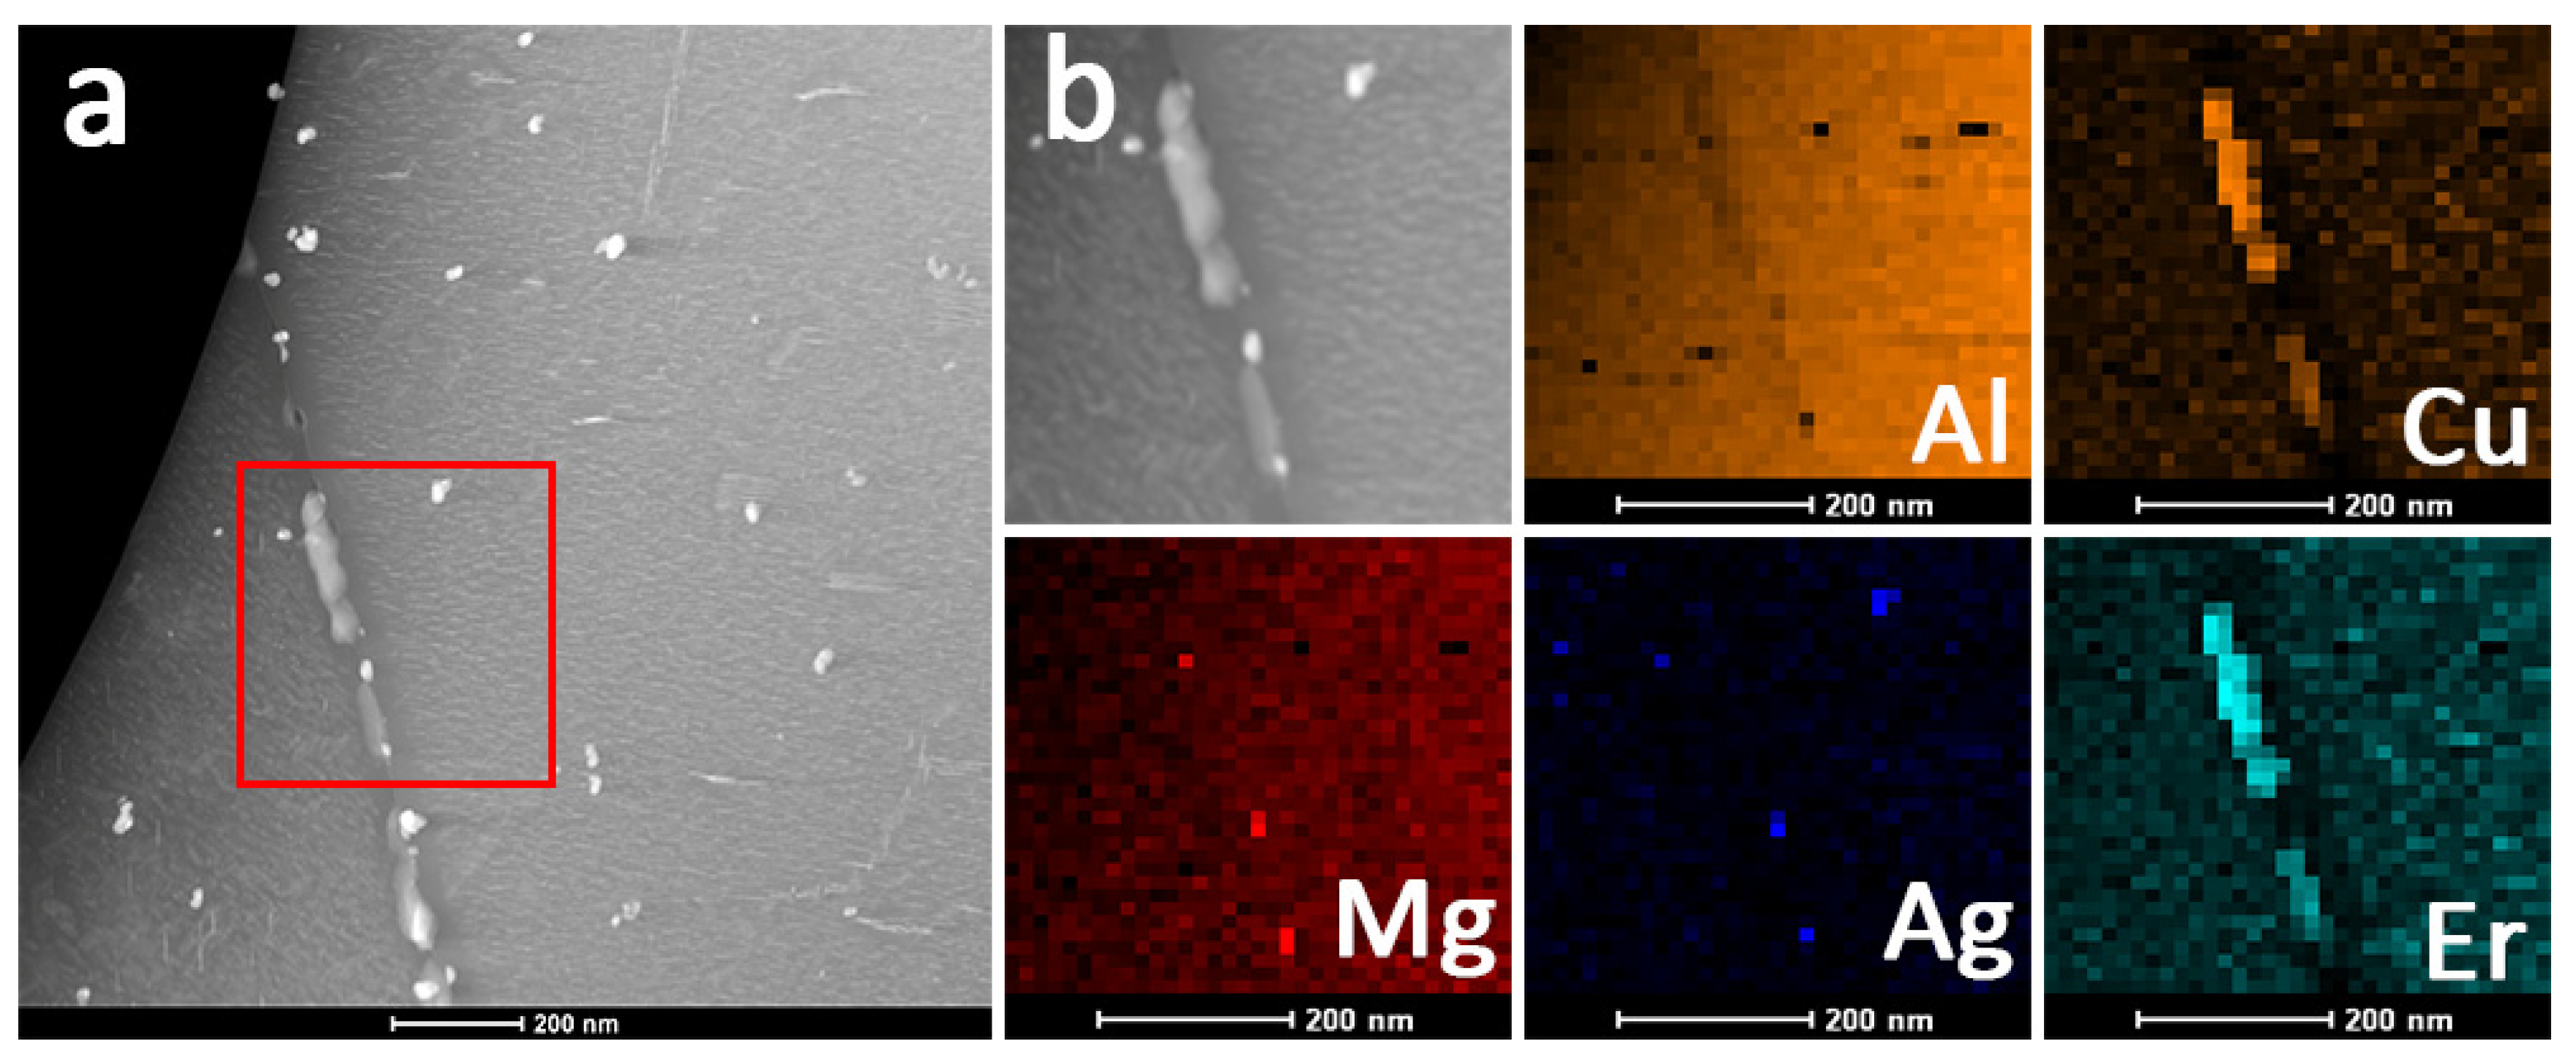
3.6.2. Al8Cu4Er Phase
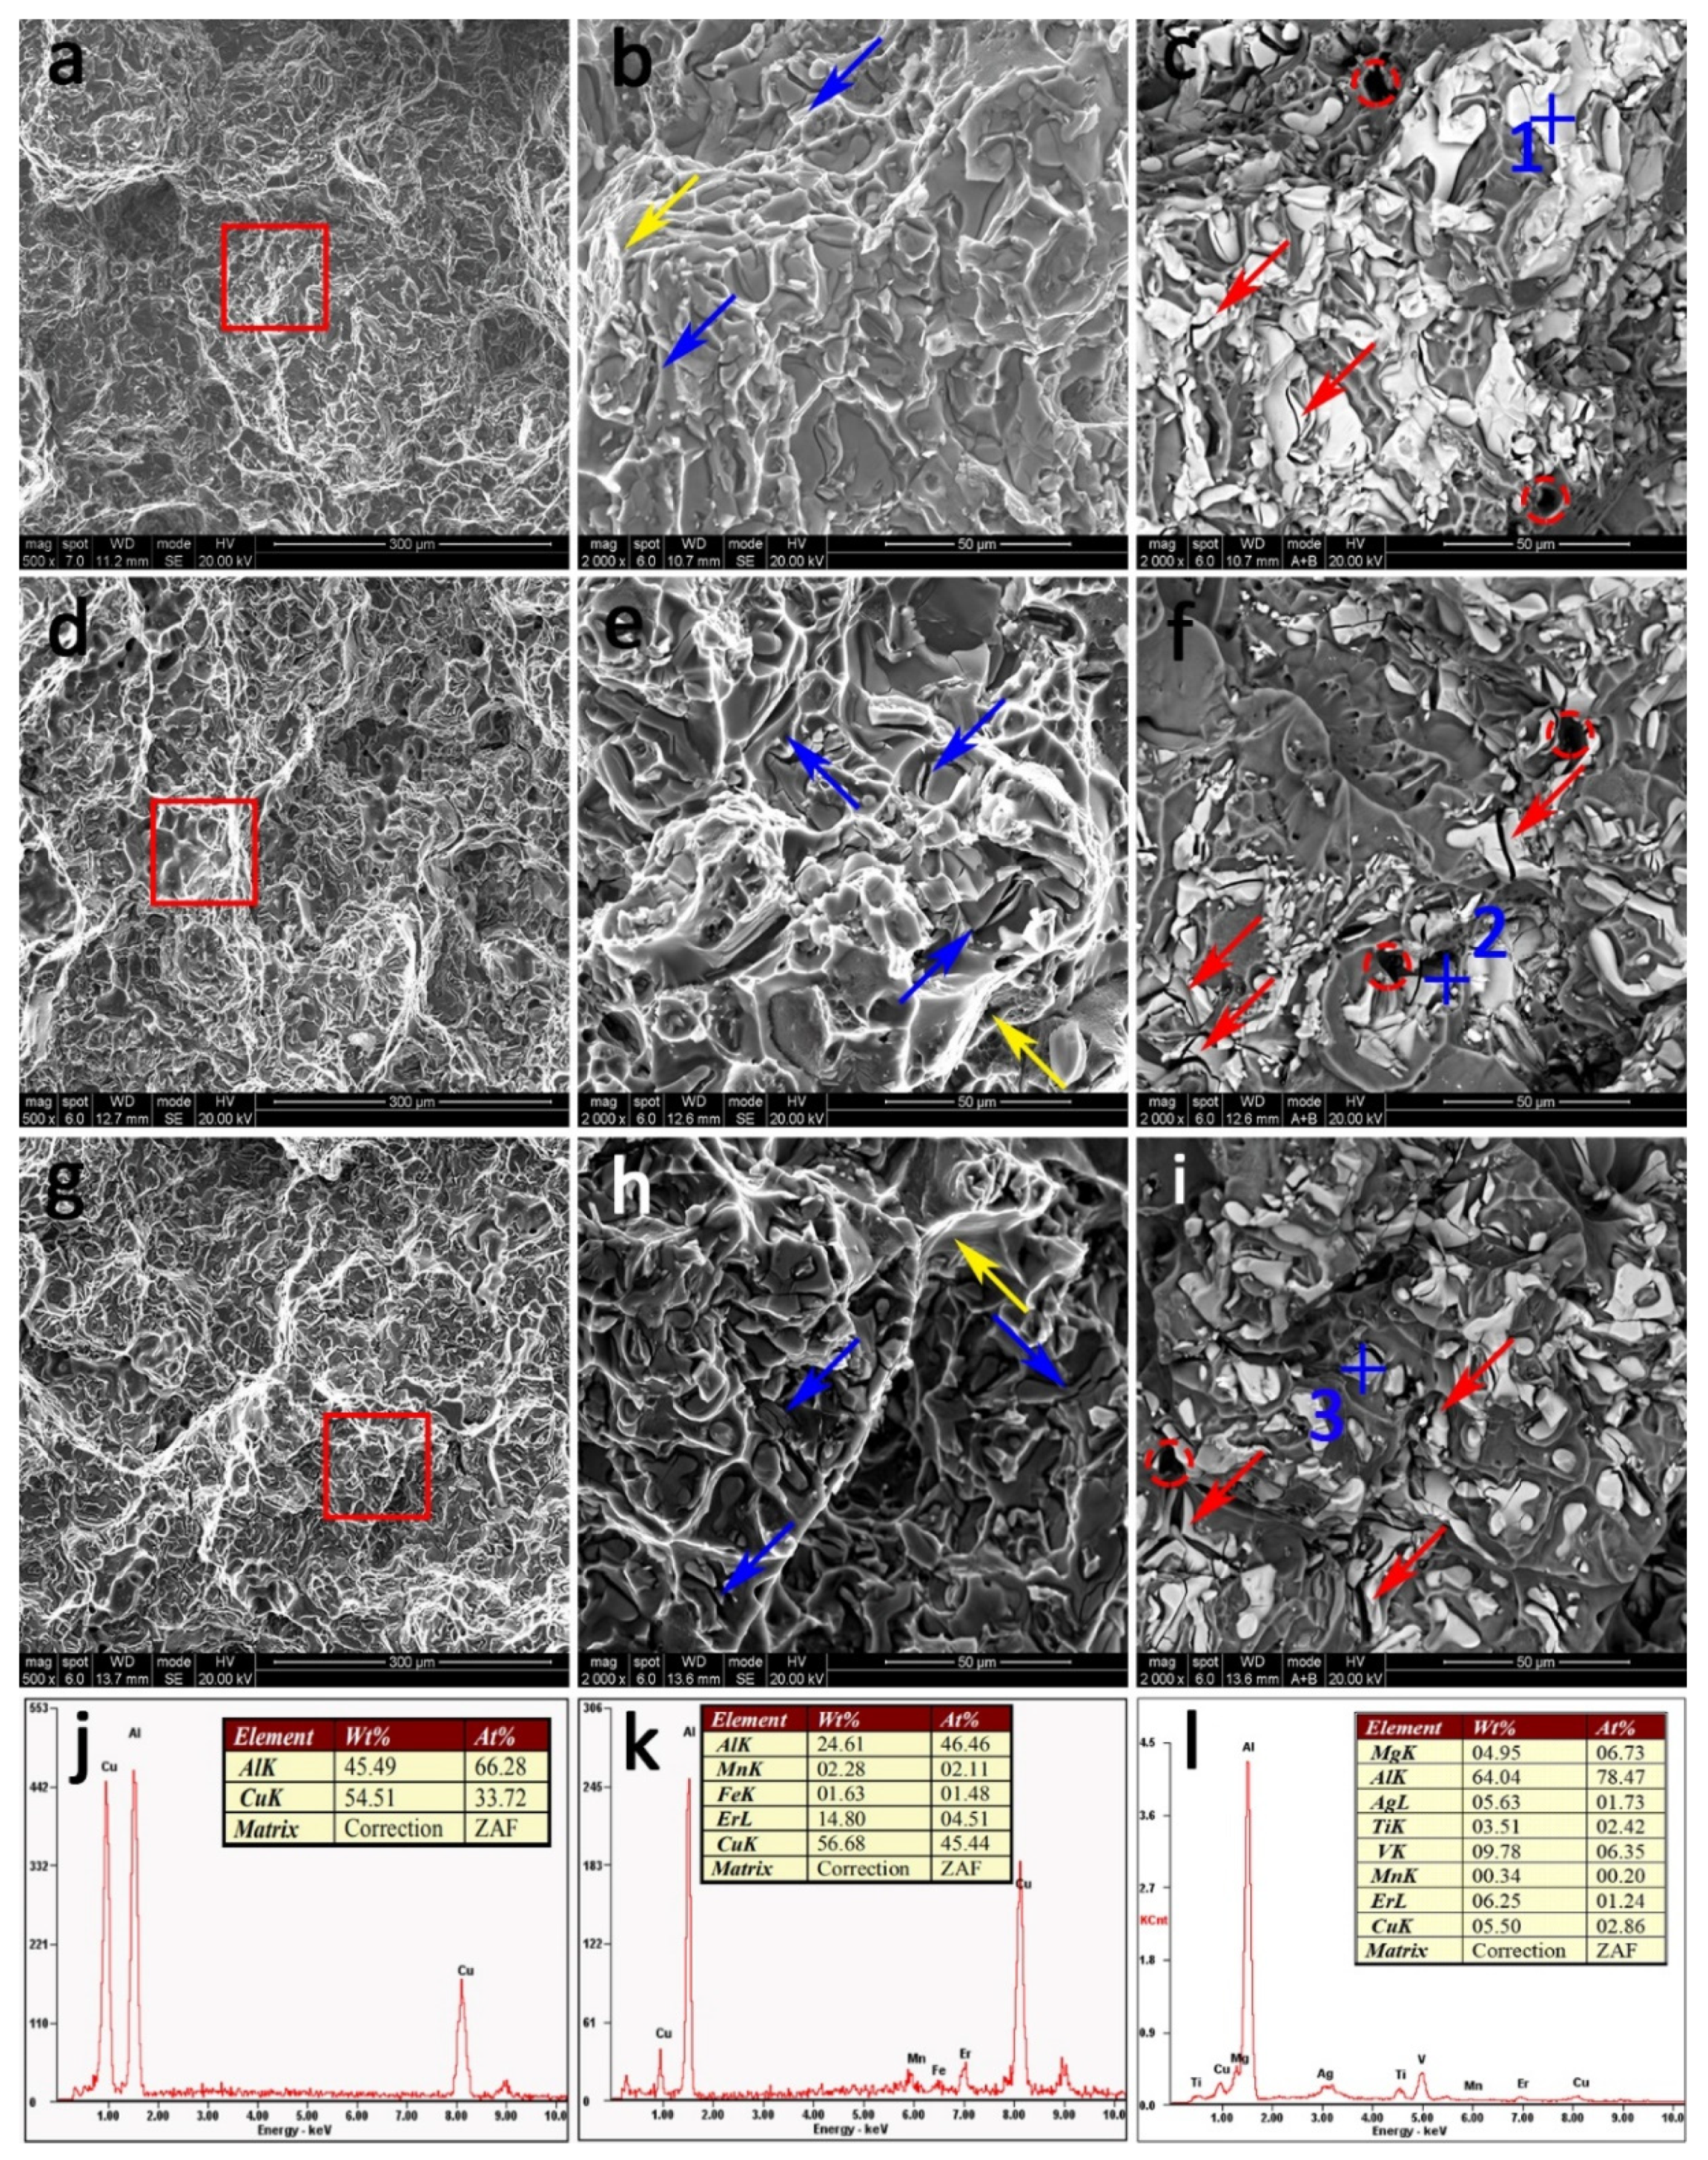
Based on the results of the tensile test and SEM images, it is necessary to reveal the microalloying behavior of erbium in Al-Cu-Mg-Ag alloys. Therefore, STEM-HAADF is specifically employed to observe the microstructures of the 0.09Er alloy in the T6 state after the tensile test at 300 °C. Based on Figure 11, the segregation of Cu and Er atoms appears at the grain boundary and according to the XRD results in Figure 4 it can be determined that Er tends to distribute to the grain boundaries and form the ternary Al8Cu4Er phase. It is also noteworthy that the Al8Cu4Er phase can still exist stably after a short period of time at 300 °C.

3.7. Fractography

Figure 12 shows SEM images of tensile fractures of three tested alloys at peak-aged state at a temperature of 25 °C. The selected positions enclosed by red boxes are magnified in Figure 12b,e,h, respectively. It is found that all alloys exhibit a typical brittle fracture pattern. It can be seen that there are some typical casting defects (marked as red circles in Figure 12c,f,i) in all alloys. Furthermore, the fracture surface of the Er-free alloy is covered by continuous intercrystalline compounds, which can be confirmed as coarse Al2Cu particles according to the EDS analysis results, whereas, the proportion of large Al2Cu is much lower than that of the Er-free alloy. In addition, the fracture surface of the 0.09Er and 0.20Er alloys contain more micro-voids and deeper tear ridges (marked by yellow arrows). Except for the continuous Al2Cu phase along the grain boundaries, two other phases are found at the fractures of the 0.09Er and 0.20Er alloys. One phase exists inside the dimples and can be identified as Al8Cu4Er phase according to the EDS analysis. The other is found in the matrix, and this intermetallic matrix contains Ag, Er, Ti, and V, which could be inferred from the above analysis and determined as the (Mg, Ag, Er, V, Ti)-rich phase.

4. Discussion

4.1. Microstructure Evolution with Er Addition

Generally, the addition of minor rare earth elements can refine the grain size, especially for Er, which can be used as an effective grain refiner in aluminum alloys [31,32,33]. However, the as-cast optical micrographs in Figure 3 indicate that Er-induced grain refinement is not significant. According to [34,35], the lack of obvious grain refinements may be explained from using other effective grain refiners such as Ti and B in this work, so that the grain refining effect of the Er element is not very obvious.
SEM results in this work clearly reveal how Er affects the overall morphology and distribution of residue particles in all alloys. Based on the SEM images in Figure 5 and Figure 6, the blocky (Mg, Ag, Er, V, Ti)-rich phase is formed in 0.09Er and 0.20Er alloys as they solidify, and the phase is not eliminated after solution treatment. It is noteworthy that the phase is rich in Mg and Ag elements, which are the key elements for the formation of the precursor of Ω phase–Mg-Ag co-clusters.
In [36,37,38], Mg-Ag co-clusters play an important role in nucleation and growth of the Ω phase. Bai et al.’s results demonstrate that the Ω phase is promoted as the Ag content increases. This is because during the early aging state, an Mg atom can be easily captured by Ag atoms, then the co-segregation of Mg and Ag atoms tends to form Mg-Ag co-clusters [39,40]. After solution treatment, a high density of Mg-Ag co-clusters are formed rapidly due to the strong tendency of the trapping effect of Ag atoms on Mg atoms in Al-Cu-Mg-Ag alloys. Then, during the aging process, the Mg-Ag co-clusters gradually grow by incorporating Cu solutes continuously and thus result in the Ω phase [38]. According to the EDS analysis of the (Mg, Ag, Er, V, Ti)-rich phase in Figure 5, Figure 6 and Figure 7, a fair number of Mg and Ag atoms segregate to these blocky second-phases, resulting in insufficient Ag and Mg atoms dissolving into the α-Al matrix and finally leading to a significant decrease in the number of Ω phases in Er-added alloys.
On the contrary, the density of the θ′ phase in the Er-free alloy is much less than that in the 0.09Er and 0.20Er alloys. In general, the formation and the growth of the Ω and θ′ phases in Al-Cu-Mg-Ag alloys compete with each other by consuming Cu atoms in the matrix [41,42]. Thus, under the premise that the Ω phase is inhibited, the slightly oversaturated Cu atoms in the experimental alloy tend to form the GP zones preferentially and ensure the precipitation of the θ′ phase at 165 °C [43,44]. That is, though the presence of a mass of Al8Cu4Er intermetallics in the 0.09Er and 0.20Er alloys, which consume a great deal of Cu solutes, there is still sufficient Cu solutes for the precipitation of the θ′ phase. According to quantitative calculations, only 0.15 wt % of Cu will be consumed even if the content of 0.1 wt % Er is used to form Al8Cu4Er, let alone the Er atoms that have been dissolved in the matrix and segregated at the (Mg, Ag, Er, V, Ti)-rich phase. Therefore, 0.09Er and 0.20Er alloys consume up to 0.15 wt % and 0.30 wt % Cu to form Al8Cu4Er phase. So even though all Er atoms prefer to form Al8Cu4Er particles, the available Cu remaining (5.77 wt % in the 0.09Er alloy and 5.65 wt % in the 0.20Er alloy) for θ′ precipitation will still be sufficient. Consequently, the nucleation of θ′ precipitates will be accelerated owing to the sufficient Cu atoms in the 0.09Er and 0.20Er alloys.

4.2. Relationship between Microstructures and Mechanical Properties

As an age-hardenable aluminum alloy, the ultimate microstructures and corresponding mechanical properties of Al-Cu-Mg-Ag alloys are controlled by the nucleation and growth of the Ω and θ′ phases. According to the TEM characterization in Figure 8 and Figure 9 and Table 4, the number density of the Ω phase in the Er-free alloy is much higher than that of the 0.09Er and 0.20Er alloys while the number density of the θ′ phase in the Er-added alloys increases with the increase in Er content. The significant difference among these alloys demonstrates that the precipitation of the Ω phase in Er-added alloys is limited but the formation of the θ′ phase is promoted after Er addition. Therefore, it is necessary to analyze the contributions of these precipitations to the yield strength in all alloys. For the three studied alloys, it can be concluded that the yield strength is related to the density of Ω and the θ′ interactions with dislocations. According to [45], the contribution of these two different phases to the yield strength can be calculated as follows:
Δ σ p Ω = 0.12 MGb d ¯ t ¯ · [ f v 1 2 + 0.7 d ¯ t ¯ f v + 0.12 d ¯ t ¯ f v 1 2 ] · ln 0.079 d ¯ r 0
Δ σ p θ = MGb 2 π 1 v 1 1.23 × 0.931 0.306 π d ¯ t ¯ f v π d ¯ 8 1.061 t ¯ ln ( 0.981 d ¯ t ¯ b )
where M is the Taylor factor, which equals 3.06. G, b, and υ represent the shear modulus of the matrix (27.8 GPa), magnitude of the Burgers vector (0.286 nm), and Poisson’s ratio for Al (0.345), respectively [25,46]. In addition to this, d ¯ is the average plate diameter, t ¯ is the average plate thickness, f v is the volume fraction of precipitates, r 0 represents the radius of the dislocation that by-passes the precipitates, which is equal to b.
Then, the total contribution of the Ω and θ′ phases to the yield strength of the alloys can be calculated as follows:
Δ σ = Δ σ p Ω + Δ σ p θ
Based on Equation (6), the overall strengthening contributions of different strengthening mechanisms to Er-free, 0.09Er, and 0.20Er alloys obtained by theoretical calculation are 360 MPa, 337 MPa, and 330 MPa. These are consistent with the tendency obtained by the experiments depicted in Figure 2a, indicating that the additions of Er have a deterioration effect on the mechanical properties of the Al-Cu-Mg-Ag alloys at room temperature.
Meanwhile, as a coarse second-phase in the 0.09Er and 0.20Er alloys, the (Mg, Ag, Er, V, Ti)-rich phase often acts as the origin of cracks during the tensile process. In general, the brittle fracture of an alloy is caused by the initiation, connection, and growth of microvoids near the coarse second-phase. Furthermore, the typical casting defects in cast alloys also provide favorable nucleation sites for microcracks in the alloy. Figure 12c illustrates that the fracture behavior of the Er-free alloy is controlled by intergranular semi-continuous Al2Cu, while the Al8Cu4Er phase and the blocky (Mg, Ag, Er, V, Ti)-rich phase controlled the fracture behavior of the Er-added alloy at 25 °C in addition to the Al2Cu phase. During the tensile process at room temperature, the secondary cracks are initiated near the Al8Cu4Er phase and the (Mg, Ag, Er, V, Ti)-rich phase after the separation of these Er-rich intermetallics from the grain boundaries and α-Al matrix (marked as blue arrows in Figure 12). On the other hand, some Al2Cu phases are torn under continuous stress, resulting in more secondary microcracks (marked as red arrows in Figure 12) at the same time. Finally, as the cracks are connected with each other, they expand and lead to the fracture of the alloys, which is consistent with the drop of tensile properties of Er-added alloys in Figure 2a.
When the tensile temperature rises to 300 °C, the tensile properties of the alloys with Er addition are improved compared with the Er-free alloy as shown in Figure 2b, which may be caused by the Al8Cu4Er phase at the grain boundaries of the 0.09Er and 0.20Er alloys. Compared with room temperature, the strength of the grain boundary is weaker than that of the matrix at the elevated temperature. Figure 11 also verified that the Al8Cu4Er phase still stably exists at the grain boundary after tensile test at 300 °C, which is sufficient to prove its thermal stability at high temperature and strengthening effect on grain boundaries. As stated in [47,48], in addition to the major precipitates, there is also an effect of Er-rich compounds at grain boundaries which hinder the motion of dislocations. Mei et al. also considered that Al8Cu4Y phases can make some contribution in improving the mechanical properties of the Al-Cu-Mg-Ag alloy at 300 °C because of their thermal stability [35]. Therefore, it can be inferred that the Al8Cu4Er phase plays a role in pinning the grain boundaries and preventing the slip of the grain boundaries, delaying the initiation, expansion, and connection of cracks during deformation at high temperature, thus improving the tensile strength of the Al-Cu-Mg-Ag alloy at high temperature.

5. Conclusions

In this work, the effect of minor Er additions on the microstructure and tensile properties of cast Al-Cu-Mg-Ag alloys were investigated and discussed. The main conclusions can be summarized as follows:
(1)
Al-Cu-Mg-Ag alloys with and without Er additions reach the peak aged condition after aging for 14 h, suggesting minor Er has little effect on the age-hardening response. However, the hardness value of the peak aged alloys slightly decreases from 141.8 ± 3.5 HV to 138.1 ± 2.7 HV and 137.9 ± 2.8 HV as Er increases from 0% to 0.2%.
(2)
No obvious grain refinement effect induced by Er additions can be found in as-cast Al-Cu-Mg-Ag alloys.
(3)
The precipitation of Ω plates is obviously restricted by Er while the denser precipitation of the θ′ phase is observed.
(4)
The tensile properties of Er-added Al-Cu-Mg-Ag alloys at room temperature degrade with Er addition, while the higher strength properties of Er-added alloys at 300 °C are ascribed to the Al8Cu4Er phase at the grain boundaries.
(5)
The Al8Cu4Er phase and (Mg, Ag, Er, V, Ti)-rich phase are detected in Er-added alloys, which cannot be dissolved in the Al-matrix after solution treatment and leads to an obvious brittle fracture of Al-Cu-Mg-Ag-Er alloys.

Author Contributions

H.X., methodology, writing—original draft, and writing—review & editing; J.Z., resources, formal analysis, and writing—review and editing; J.C., resources, formal analysis, and writing—review and editing; L.L., resources, formal analysis, and writing—review and editing; S.G., resources, formal analysis, and writing—review and editing; L.O., resources, formal analysis, and writing—review and editing; Z.L., conceptualization, methodology, validation, formal analysis, investigation, resources, writing—review and editing, and visualization; S.B., resources, formal analysis, and writing—review and editing. All authors have read and agreed to the published version of the manuscript.

Funding

This research received from the National Key Research and Development Program of China (2016YFB0300900), the National Key Fundamental Research Project of China (2012CB619506-3), and the National Natural Science Foundation of China (511712209).

Institutional Review Board Statement

Not applicable.

Informed Consent Statement

Not applicable.

Data Availability Statement

The raw/processed data required to reproduce these findings cannot be shared at this time due to technical or time limitations.

Conflicts of Interest

The authors declare that they have no known competing financial interests or personal relationships that could have appeared to influence the work reported in this paper.

References

  1. Gazizov, M.; Kaibyshev, R. High cyclic fatigue performance of Al–Cu–Mg–Ag alloy under T6 and T840 conditions. Trans. Nonferrous Met. Soc. China 2017, 27, 1215–1223. [Google Scholar] [CrossRef]
  2. Kurmanaeva, L.; Topping, T.D.; Wen, H.; Sugahara, H.; Yang, H.; Zhang, D.; Schoenung, J.M.; Lavernia, E.J. Strengthening mechanisms and deformation behavior of cryomilled Al–Cu–Mg–Ag alloy. J. Alloys. Compd. 2015, 632, 591–603. [Google Scholar] [CrossRef]
  3. Gazizov, M.; Boev, A.; Marioara, C.; Andersen, S.; Holmestad, R.; Kaibyshev, R.; Aksyonov, D.; Krasnikov, V. The unique hybrid precipitate in a peak-aged Al-Cu-Mg-Ag alloy. Scr. Mater. 2021, 194, 113669. [Google Scholar] [CrossRef]
  4. Ringer, S.; Hono, K.; Polmear, I.; Sakurai, T. Nucleation of precipitates in aged AlCuMg(Ag) alloys with high Cu:Mg ratios. Acta Mater. 1996, 44, 1883–1898. [Google Scholar] [CrossRef]
  5. Liu, X.Y.; Pan, Q.L.; Zheng, L.Y.; Fu, Q.R.; Gao, F.; Li, M.X.; Bai, Y.M. Effect of aging temper on the thermal stability of Al-Cu-Mg-Ag heat-resistant alloy. Mater. Des. 2013, 46, 360–365. [Google Scholar] [CrossRef]
  6. Lumley, R.N.; Morton, A.J.; Polmear, I.J. Enhanced creep performance in an Al-Cu-Mg-Ag alloy through underaging. Acta Mater. 2002, 50, 3597–3608. [Google Scholar] [CrossRef]
  7. Vural, M.; Caro, J. Experimental analysis and constitutive modeling for the newly developed 2139-T8 alloy. Mater. Sci. Eng. A 2009, 520, 56–65. [Google Scholar] [CrossRef]
  8. Wang, J.; Wu, X.; Xia, K. Creep behaviour at elevated temperatures of an Al-Cu-Mg-Ag alloy. Mater. Sci. Eng. A 1997, 234–236, 287–290. [Google Scholar] [CrossRef]
  9. Palmerin, J.M.; Rosales, H.J.D.; Hirata, V.M.L.; Castro, N.C.; Velázquez, J.L.G.; Ramirez, A.D.J.M. Hardening Behavior in Aged Al-4%Cu-0.3%Mg Alloys with 0.5 and 2%Ag Additions. Mater. Trans. 2009, 50, 2785–2789. [Google Scholar] [CrossRef]
  10. Hutchinson, C.R.; Fan, X.; Pennycook, S.J.; Shiflet, G.J. On the origin of the high coarsening resistance of Ω plates in Al-Cu-Mg-Ag alloys. Acta Mater. 2001, 49, 2827–2841. [Google Scholar] [CrossRef]
  11. Xiao, D.H.; Wang, J.N.; Ding, D.Y.; Yang, H.L. Effect of rare earth Ce addition on the microstructure and mechanical properties of an Al-Cu-Mg-Ag alloy. J. Alloys Compd. 2003, 352, 84–88. [Google Scholar] [CrossRef]
  12. Li, Y.T.; Liu, Z.Y.; Zhou, J.; Xia, Q.K. Microstructure and mechanical properties of Al-Cu-Mg-Ag alloyed with Ce. Trans. Nonferrous Met. Soc. China 2007, 17, 266–270. [Google Scholar]
  13. Xiao, D.-H.; Huang, B.-Y. Effect of Yb addition on precipitation and microstructure of Al-Cu-Mg-Ag alloys. Trans. Nonferrous Met. Soc. China 2007, 17, 1181–1185. [Google Scholar] [CrossRef]
  14. Xue, H.; Yang, C.; Kuang, J.; Zhang, P.; Zhang, J.; Liu, G.; Sun, J. Highly interdependent dual precipitation and its effect on mechanical properties of Al–Cu-Sc alloys. Mater. Sci. Eng. A 2021, 820, 141526. [Google Scholar] [CrossRef]
  15. Li, B.; Liang, S.; Wen, S.; Zhao, Z.; Wu, X.; Wang, W.; Gao, K.; Huang, H.; Nie, Z. Competition between precipitation and segregation of Sc and its effects on thermal stability of Al-Cu-Mg-Ag alloys. Mater. Lett. 2021, 297, 129927. [Google Scholar] [CrossRef]
  16. Gazizov, M.; Teleshov, V.; Zakharov, V.; Kaibyshev, R. Solidification behaviour and the effects of homogenisation on the structure of an Al–Cu–Mg–Ag–Sc alloy. J. Alloys Compd. 2011, 509, 9497–9507. [Google Scholar] [CrossRef]
  17. Pan, S.; Chen, X.; Zhou, X.; Wang, Z.; Chen, K.; Cao, Y.; Lu, F.; Li, S. Micro-alloying effect of Er and Zr on microstructural evolution and yield strength of Al-3Cu (wt.%) binary alloys. Mater. Sci. Eng. A 2020, 790, 139391. [Google Scholar] [CrossRef]
  18. Li, Y.; Liu, Z.; Xia, Q.; Liu, Y. Grain Refinement of the Al-Cu-Mg-Ag Alloy with Er and Sc Additions. Met. Mater. Trans. A 2007, 38, 2853–2858. [Google Scholar] [CrossRef]
  19. Bai, S.; Huang, T.; Xu, H.; Liu, Z.Y.; Wang, J.; Yi, X.L. Effects of small Er addition on the microstructural evolution and strength properties of an Al–Cu–Mg–Ag alloy aged at 200 °C. Mater. Sci. Eng. A 2019, 766, 138351. [Google Scholar] [CrossRef]
  20. Che, H.; Jiang, X.; Qiao, N.; Liu, X. Effects of Er/Sr/Cu additions on the microstructure and mechanical properties of Al-Mg alloy during hot extrusion. J. Alloys Compd. 2017, 708, 662–670. [Google Scholar] [CrossRef]
  21. Wu, H.; Wen, S.P.; Lu, J.T.; Mi, Z.P.; Zeng, X.L.; Huang, H.; Nie, Z.R. Microstructural evolution of new type Al-Zn-Mg-Cu alloy with Er and Zr additions during homogenization. Trans. Nonferrous Met. Soc. China 2017, 27, 1476–1482. [Google Scholar] [CrossRef]
  22. Fang, H.C.; Chao, H.; Chen, K.H. Effect of Zr, Er and Cr additions on microstructures and properties of Al-Zn-Mg-Cu alloys. Mater. Sci. Eng. A 2014, 610, 10–16. [Google Scholar] [CrossRef]
  23. He, Y.; Xi, H.H.; Ming, W.Q.; Shao, Q.Q.; Shen, R.H.; Lai, Y.X.; Wu, C.L.; Chen, J.H. Thermal stability and precipitate microstructures of Al-Si-Mg-Er alloy. Trans. Nonferrous Met. Soc. China 2021, 31, 1–10. [Google Scholar] [CrossRef]
  24. Gazizov, M.; Kaibyshev, R. Precipitation structure and strengthening mechanisms in an Al-Cu-Mg-Ag alloy. Mater. Sci. Eng. A 2017, 702, 29–40. [Google Scholar] [CrossRef]
  25. Nie, J.; Muddle, B. Strengthening of an Al–Cu–Sn alloy by deformation-resistant precipitate plates. Acta Mater. 2008, 56, 3490–3501. [Google Scholar] [CrossRef]
  26. Bai, S.; Ying, P.; Liu, Z.; Wang, J.; Li, J. Quantitative transmission electron microscopy and atom probe tomography study of Ag-dependent precipitation of Ω phase in Al-Cu-Mg alloys. Mater. Sci. Eng. A 2017, 687, 8–16. [Google Scholar] [CrossRef]
  27. Jiang, L.; Wang, C.S.; Fu, H.D.; Shen, J.; Zhang, Z.H.; Xie, J.X. Discovery of aluminum alloys with ultra-strength and high-toughness via a property-oriented design strategy. J. Mater. Sci. Technol. 2021, 822, 141641. [Google Scholar]
  28. Roosz, A.; Exner, H.E. Ternary restricted-equilibrium phase diagrams-II. Practical application: Aluminium-rich corner of the Al-Cu-Mg system. Acta Mater. 2008, 56, 3490–3501. [Google Scholar]
  29. Gable, B.M.; Zhu, A.W.; Shiflet, G.J.; Starke, E.A. Assessment of the aluminum-rich corner of the Al-Cu-Mg-(Ag) phase diagram. Calphad 2008, 32, 256–267. [Google Scholar] [CrossRef]
  30. Raghavan, V. Al-Cu-Er (Aluminum-Copper-Erbium). J. Phase Equilibria Diffus. 2010, 31, 285–287. [Google Scholar] [CrossRef]
  31. Gao, Z.; Li, H.; Lai, Y.; Ou, Y.; Li, D. Effects of minor Zr and Er on microstructure and mechanical properties of pure aluminum. Mater. Sci. Eng. A 2013, 580, 92–98. [Google Scholar] [CrossRef]
  32. Pandee, P.; Patakham, U.; Limmaneevichitr, C. Microstructural evolution and mechanical properties of Al-7Si-0.3Mg alloys with erbium additions. J. Alloys Compd. 2017, 728, 844–853. [Google Scholar] [CrossRef]
  33. Zhang, X.J.; Wang, H.W.; Yan, B.; Zou, C.M.; Wei, Z.J. The effect of grain refinement and precipitation strengthening induced by Sc and Er alloying on the mechanical properties of cast Al-Li-Cu-Mg alloys at elevated temperatures. Mater. Sci. Eng. A 2021, 822, 141641. [Google Scholar] [CrossRef]
  34. Zaki, G.A.; Samuel, A.M.; Doty, H.W.; Samuel, F.H. Microstructural evolution during solidification of Al-Cu-based alloys. Int. J. Mater. Res. 2015, 106, 1144–1153. [Google Scholar] [CrossRef]
  35. Mei, Z.; Liu, Z.; Bai, S.; Wang, J.; Cao, J. Effects of yttrium additions on microstructures and mechanical properties of cast Al-Cu-Mg-Ag alloys. J. Alloys Compd. 2021, 870, 159435. [Google Scholar] [CrossRef]
  36. Bai, S.; Liu, Z.Y.; Zhou, X.W.; Xia, P.; Zeng, S. Mg-controlled formation of Mg-Ag co-clusters in initial aged Al-Cu-Mg-Ag alloys. J. Alloys Compd. 2014, 602, 193–198. [Google Scholar] [CrossRef]
  37. Reich, L.; Murayama, M.; Hono, K. Evolution of Ω phase in an Al-Cu-Mg-Ag alloy- a three-dimensional atom probe study. Acta Mater. 1998, 46, 6053–6062. [Google Scholar] [CrossRef]
  38. Hono, K.; Sakurai, T.; Polmear, I.J. Pre-precipitate clustering in an Al-Cu-Mg-Ag alloy. Scripta. Mater. 1994, 30, 695–700. [Google Scholar] [CrossRef]
  39. Bai, S.; Zhou, X.; Liu, Z.; Xia, P.; Liu, M.; Zeng, S. Effects of Ag variations on the microstructures and mechanical properties of Al–Cu–Mg alloys at elevated temperatures. Mater. Sci. Eng. A 2014, 611, 69–76. [Google Scholar] [CrossRef]
  40. Chen, J.; Liu, C.; Li, Q.; Zhao, H. A three-dimensional characterization method for the preferentially oriented precipitation of Ω-phase in stress-aged Al-Cu-Mg-Ag single crystal. Mater. Charact. 2019, 153, 184–189. [Google Scholar] [CrossRef]
  41. Hyeongsub, S.; Sung, J.W.; Jihoon, P.; Soong, J.O.; Kyou, H.K. Mechanical properties and microstructural evolution in Al–Cu–Mg–Ag alloy with a CuxMgx/10 content. Mater. Sci. Eng. A 2021, 21, 141573. [Google Scholar]
  42. Muraishi, S.; Kumai, S.; Sato, A. Competitive nucleation and growth of {111} Ω with {001} GP Zones and θ in a stress-aged Al-Cu-Mg-Ag alloy. Mater. Trans. 2004, 45, 2974–2980. [Google Scholar] [CrossRef] [Green Version]
  43. Wang, S.C.; Starink, M.J. Precipitates and intermetallic phases in precipitation hardening Al-Cu-Mg-(Li) based alloys. Int. Mater. Rev. 2005, 50, 193–215. [Google Scholar] [CrossRef] [Green Version]
  44. Zhang, J.; Zhang, Y.; Zhu, B.; Wang, F.; Xiong, B. Effect of interrupted multi-step ageing on microstructure and properties of Al-Cu-Mg-Ag-Zr alloy. Rare Met. 2011, 30, 419–423. [Google Scholar]
  45. Zhu, A.; Starke, E. Strengthening effect of unshearable particles of finite size: A computer experimental study. Acta Mater. 1999, 47, 3263–3269. [Google Scholar] [CrossRef]
  46. Hu, Z.; Zhang, H.; Zhu, H.; Xiao, Z.; Nie, X.; Zeng, X. Microstructure, mechanical properties and strengthening mechanisms of AlCu5MnCdVA aluminum alloy fabricated by selective laser melting. Mater. Sci. Eng. A 2019, 759, 154–166. [Google Scholar] [CrossRef]
  47. Curtin, W. New interpretation of the Haasen plot for solute-strengthened alloys. Scr. Mater. 2010, 63, 917–920. [Google Scholar] [CrossRef]
  48. Singh, C.V.; Mateos, A.; Warner, D. Atomistic simulations of dislocation–precipitate interactions emphasize importance of cross-slip. Scr. Mater. 2011, 64, 398–401. [Google Scholar] [CrossRef]
Figure 1. Age-hardening curves of studied alloys at 165 °C.
Materials 14 04212 g001
Figure 2. Tensile properties of studied alloys in T6 state at (a) 25 °C; (b) 300 °C.
Materials 14 04212 g002
Figure 3. Metallographic images of three as-cast alloys (a) Er-free; (b) 0.09Er, (c) 0.20Er.
Materials 14 04212 g003
Figure 4. XRD patterns of three studied alloys of (a) as-cast state; (b) T6 state.
Materials 14 04212 g004
Figure 5. Backscattered electron (BSE) images of the as-cast alloys. (a,d) Er-free; (b,e) 0.09Er; (c,f) 0.20Er alloys.
Materials 14 04212 g005
Figure 6. Backscattered electron (BSE) images of alloys after T6 heat treatment. (a,d) Er-free; (b,e) 0.09Er; (c,f) 0.20Er alloys.
Materials 14 04212 g006
Figure 7. EDS mapping of selected region in Figure 6b.
Materials 14 04212 g007
Figure 8. TEM images of studied alloys in T6 state and corresponding SAED patterns (near <110>α direction). (a) Er-free; (b) 0.09Er; (c) 0.20Er.
Materials 14 04212 g008
Figure 9. TEM images of studied alloys in T6 state and corresponding SAED patterns (near <100>α direction). (a) Er-free; (b) 0.09Er; (c) 0.20Er.
Materials 14 04212 g009
Figure 10. Statistical diagram of the distribution of the Ω and θ′ phases of studied alloys. (a) Ω phase; (b) θ′ phase.
Materials 14 04212 g010
Figure 11. The (a) STEM-HAADF image and (b) corresponding EDS mapping of the microstructures of T6-tempered 0.09Er alloy after tensile test at 300 °C.
Materials 14 04212 g011
Figure 12. SEM images of the fracture surfaces of peak-aged alloys at room temperature in different magnifications. (ac) Er-free; (df) 0.09Er; (gi) 0.20Er; (jl) EDS spectrum of points 1, 2 and 3.
Materials 14 04212 g012
Table 1. Chemical composition of the studied Al-Cu-Mg-Ag-(Er) alloys (wt %).
AlloysCuMgAgMnTiBVErAl
Er-free5.970.320.810.300.150.020.16-Bal.
0.09Er5.920.280.760.290.130.020.170.09Bal.
0.20Er5.950.330.720.290.130.020.160.20Bal.
Table 2. EDS analysis (wt %/at %) of red points marked in Figure 4.
Points12345678
Al52.60/72.3260.83/77.8636.90/62.2344.74/65.5949.60/84.3656.08/77.6768.40/83.5347.33/67.91
Cu47.40/27.6828.34/15.4146.42/33.2355.26/34.414.65/2.3927.20/16.003.94/2.0452.67/32.09
Mg--- 2.34/3.15-1.81/2.45
Ag--- 3.85/1.17-2.80/0.85
Mn-3.39/2.13- -5.69/3.87-
Ti--- 3.22/2.20-5.41/3.72
Er--16.68/4.54 8.43/1.6511.03/2.468.91/1.75
V--- 7.91/5.08-8.73/5.65
Fe-7.43/4.60- ---
Table 3. EDS analysis (wt %/at %) of red points marked in Figure 5.
Points12345678
Al69.58/84.3439.49/64.2664.00/78.8248.71/69.1066.06/80.3438.93/63.8843.86/64.7962.91/77.96
Cu30.42/15.6646.36/32.035.53/2.8951.29/30.905.31/2.7446.18/32.1856.14/35.215.20/2.74
Mg--4.72/6.45-4.77/6.44--5.00/6.87
Ag--6.31/1.94-5.86/1.78--7.12/2.21
Mn-------0.27/0.16
Ti--2.78/1.93-2.66/1.82--3.14/2.19
Er-14.15/3.716.39/1.72-6.72/1.3214.89/3.94-6.30/1.26
V--10.27/6.70-8.62/5.55--10.06/6.60
Table 4. Quantitative analysis of TEM results of the Ω and θ′ phases in cast Al-Cu-Mg-Ag-(Er) alloys in peak-aged state.
AlloysΩ Phaseθ′ Phase
Plate Diameter
(nm)
Plate Thickness
(nm)
Number Density (×103/μm3)Plate Diameter (nm)Plate Thickness
(nm)
Number Density (×103/μm3)
Er-free42.3 ± 12.42.6 ± 1.227.6 ± 10.332.7 ± 10.12.5 ± 1.02.7 ± 2.1
0.09Er37.8 ± 9.52.3 ± 1.121.1 ± 9.136.8 ± 15.42.3 ± 0.94.3 ± 3.1
0.20Er37.5 ± 6.32.4 ± 1.219.4 ± 1.135.4 ± 16.32.6 ± 0.84.1 ± 6.7
Publisher’s Note: MDPI stays neutral with regard to jurisdictional claims in published maps and institutional affiliations.

