
A Study on the Sound Insulation Performance of Cross-laminated Timber


Abstract
:1. Introduction
2. Materials and Methods
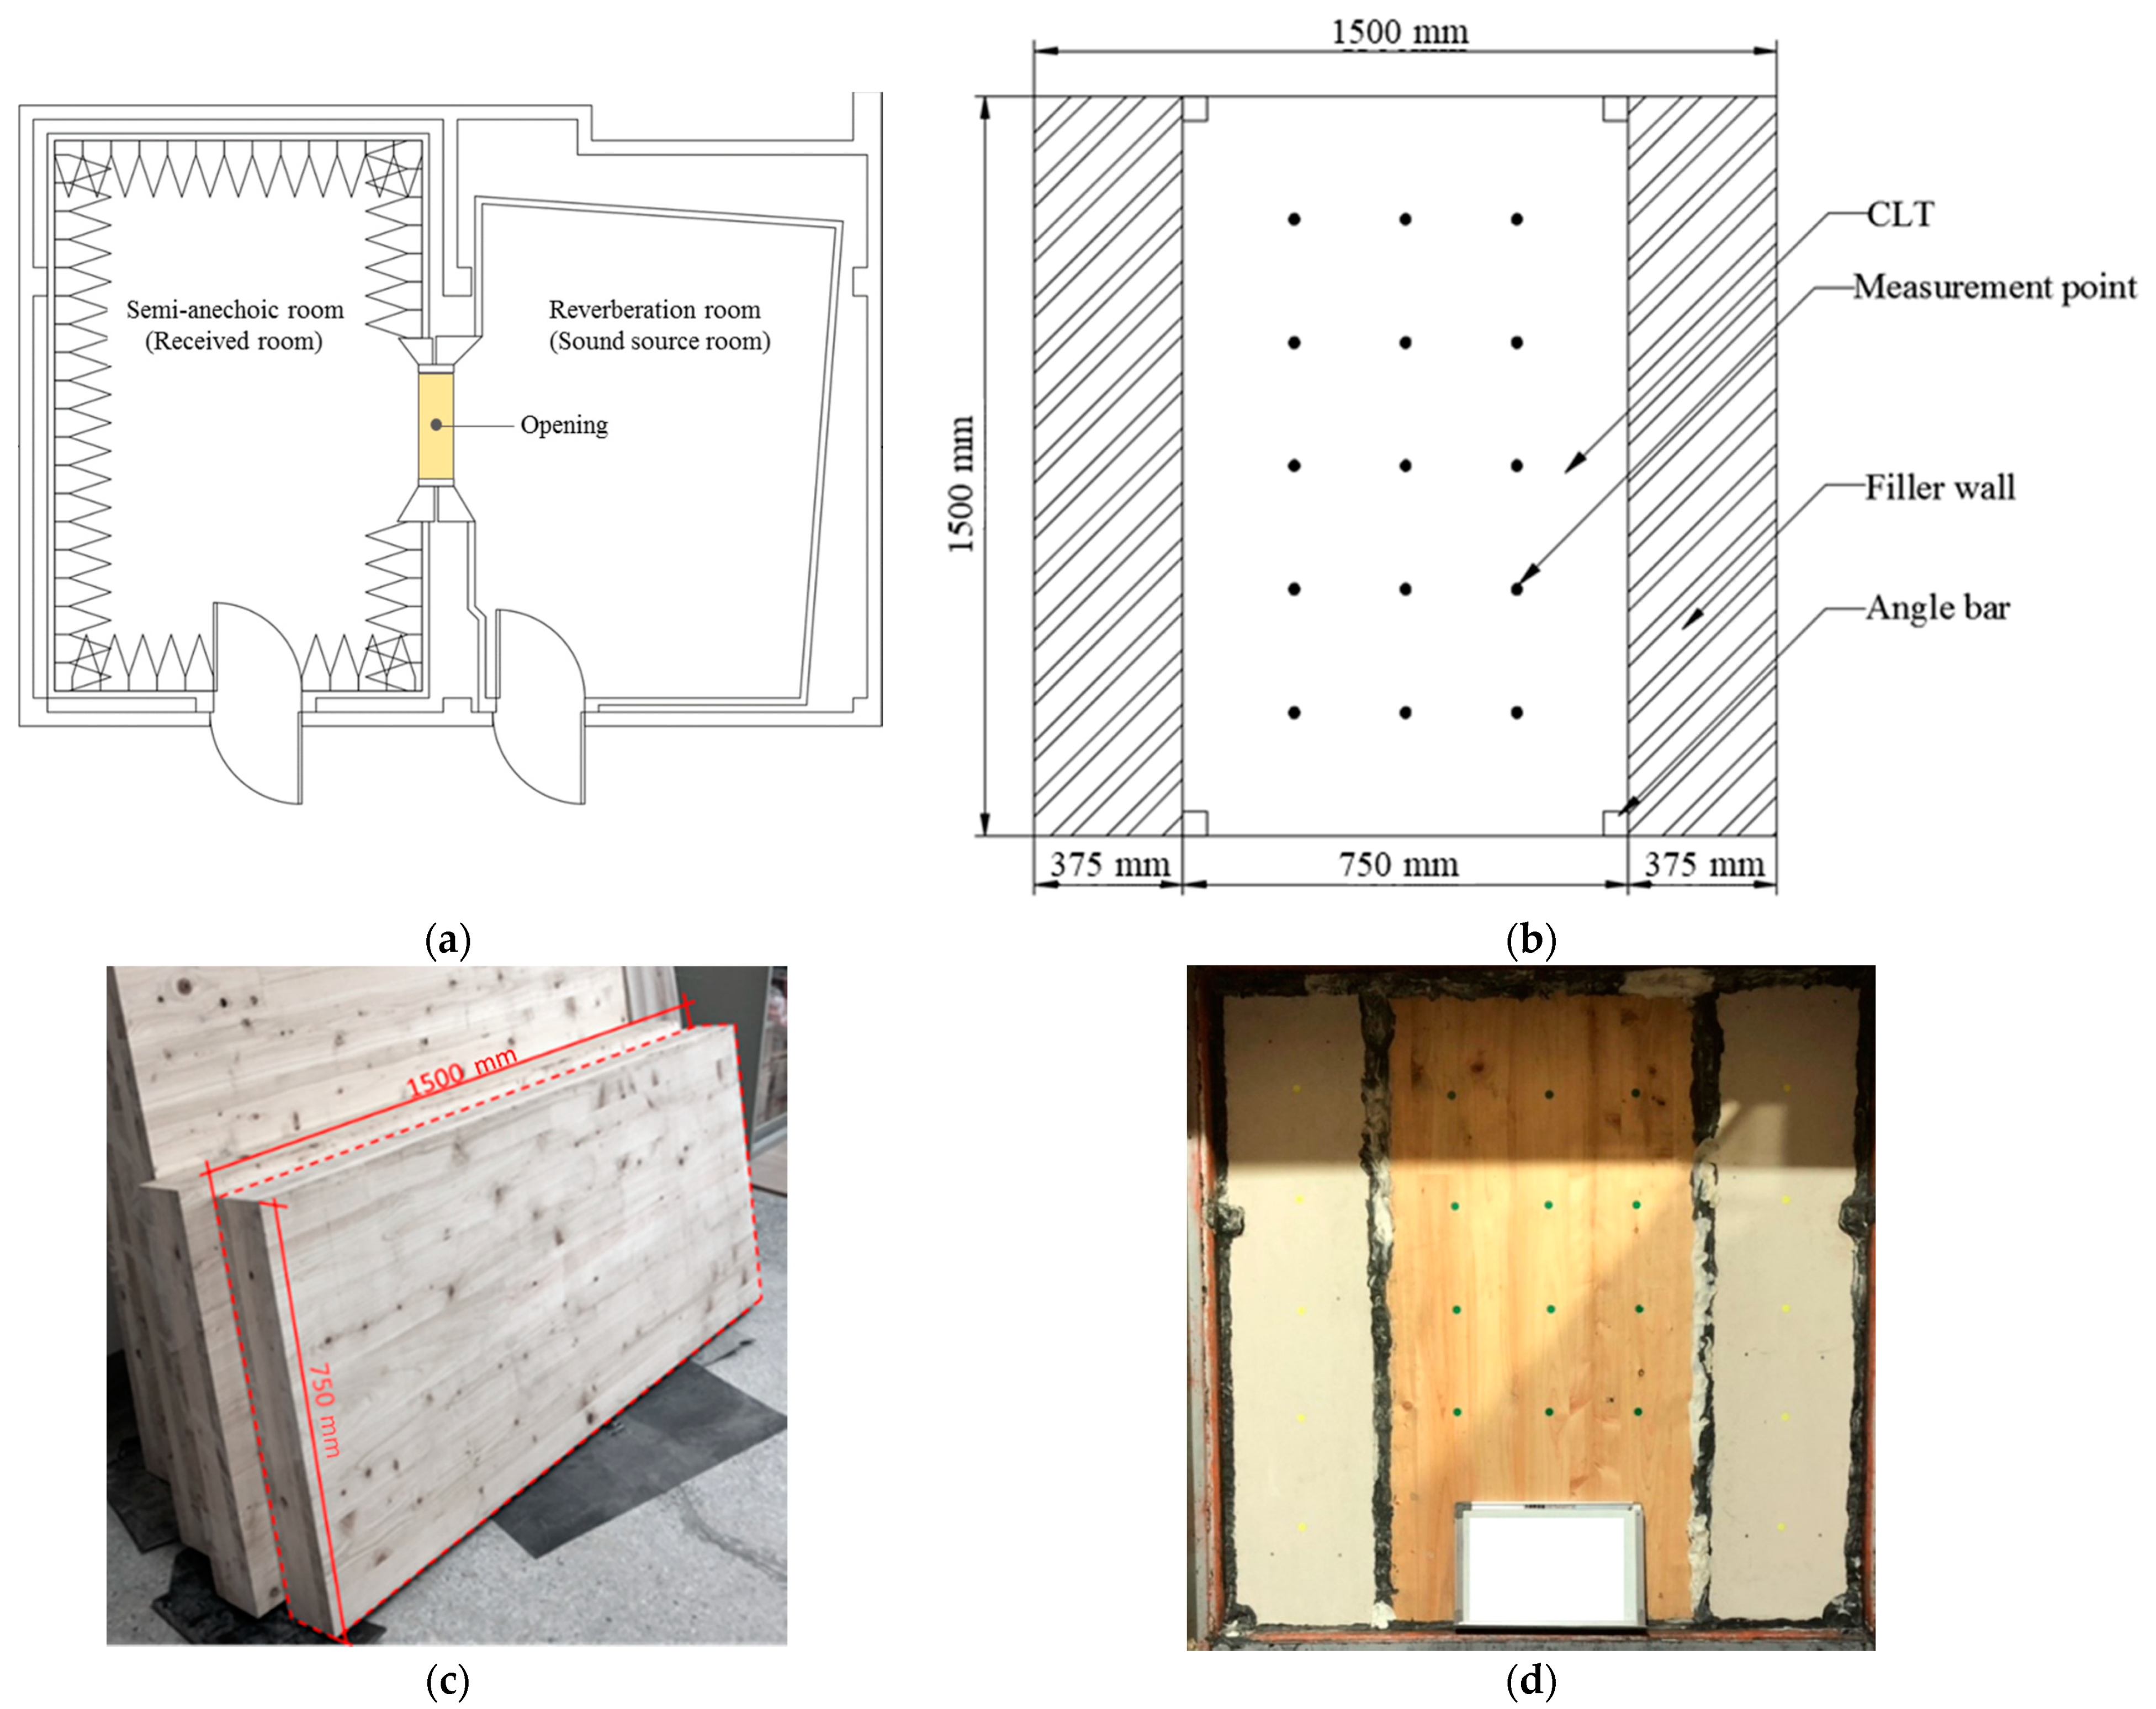
2.1. Specimen Boundary Condition
2.2. Laboratory Environment
2.3. Prediction Approaches
3. Results and Discussion
3.1. Sound Insulation Performance of CLT
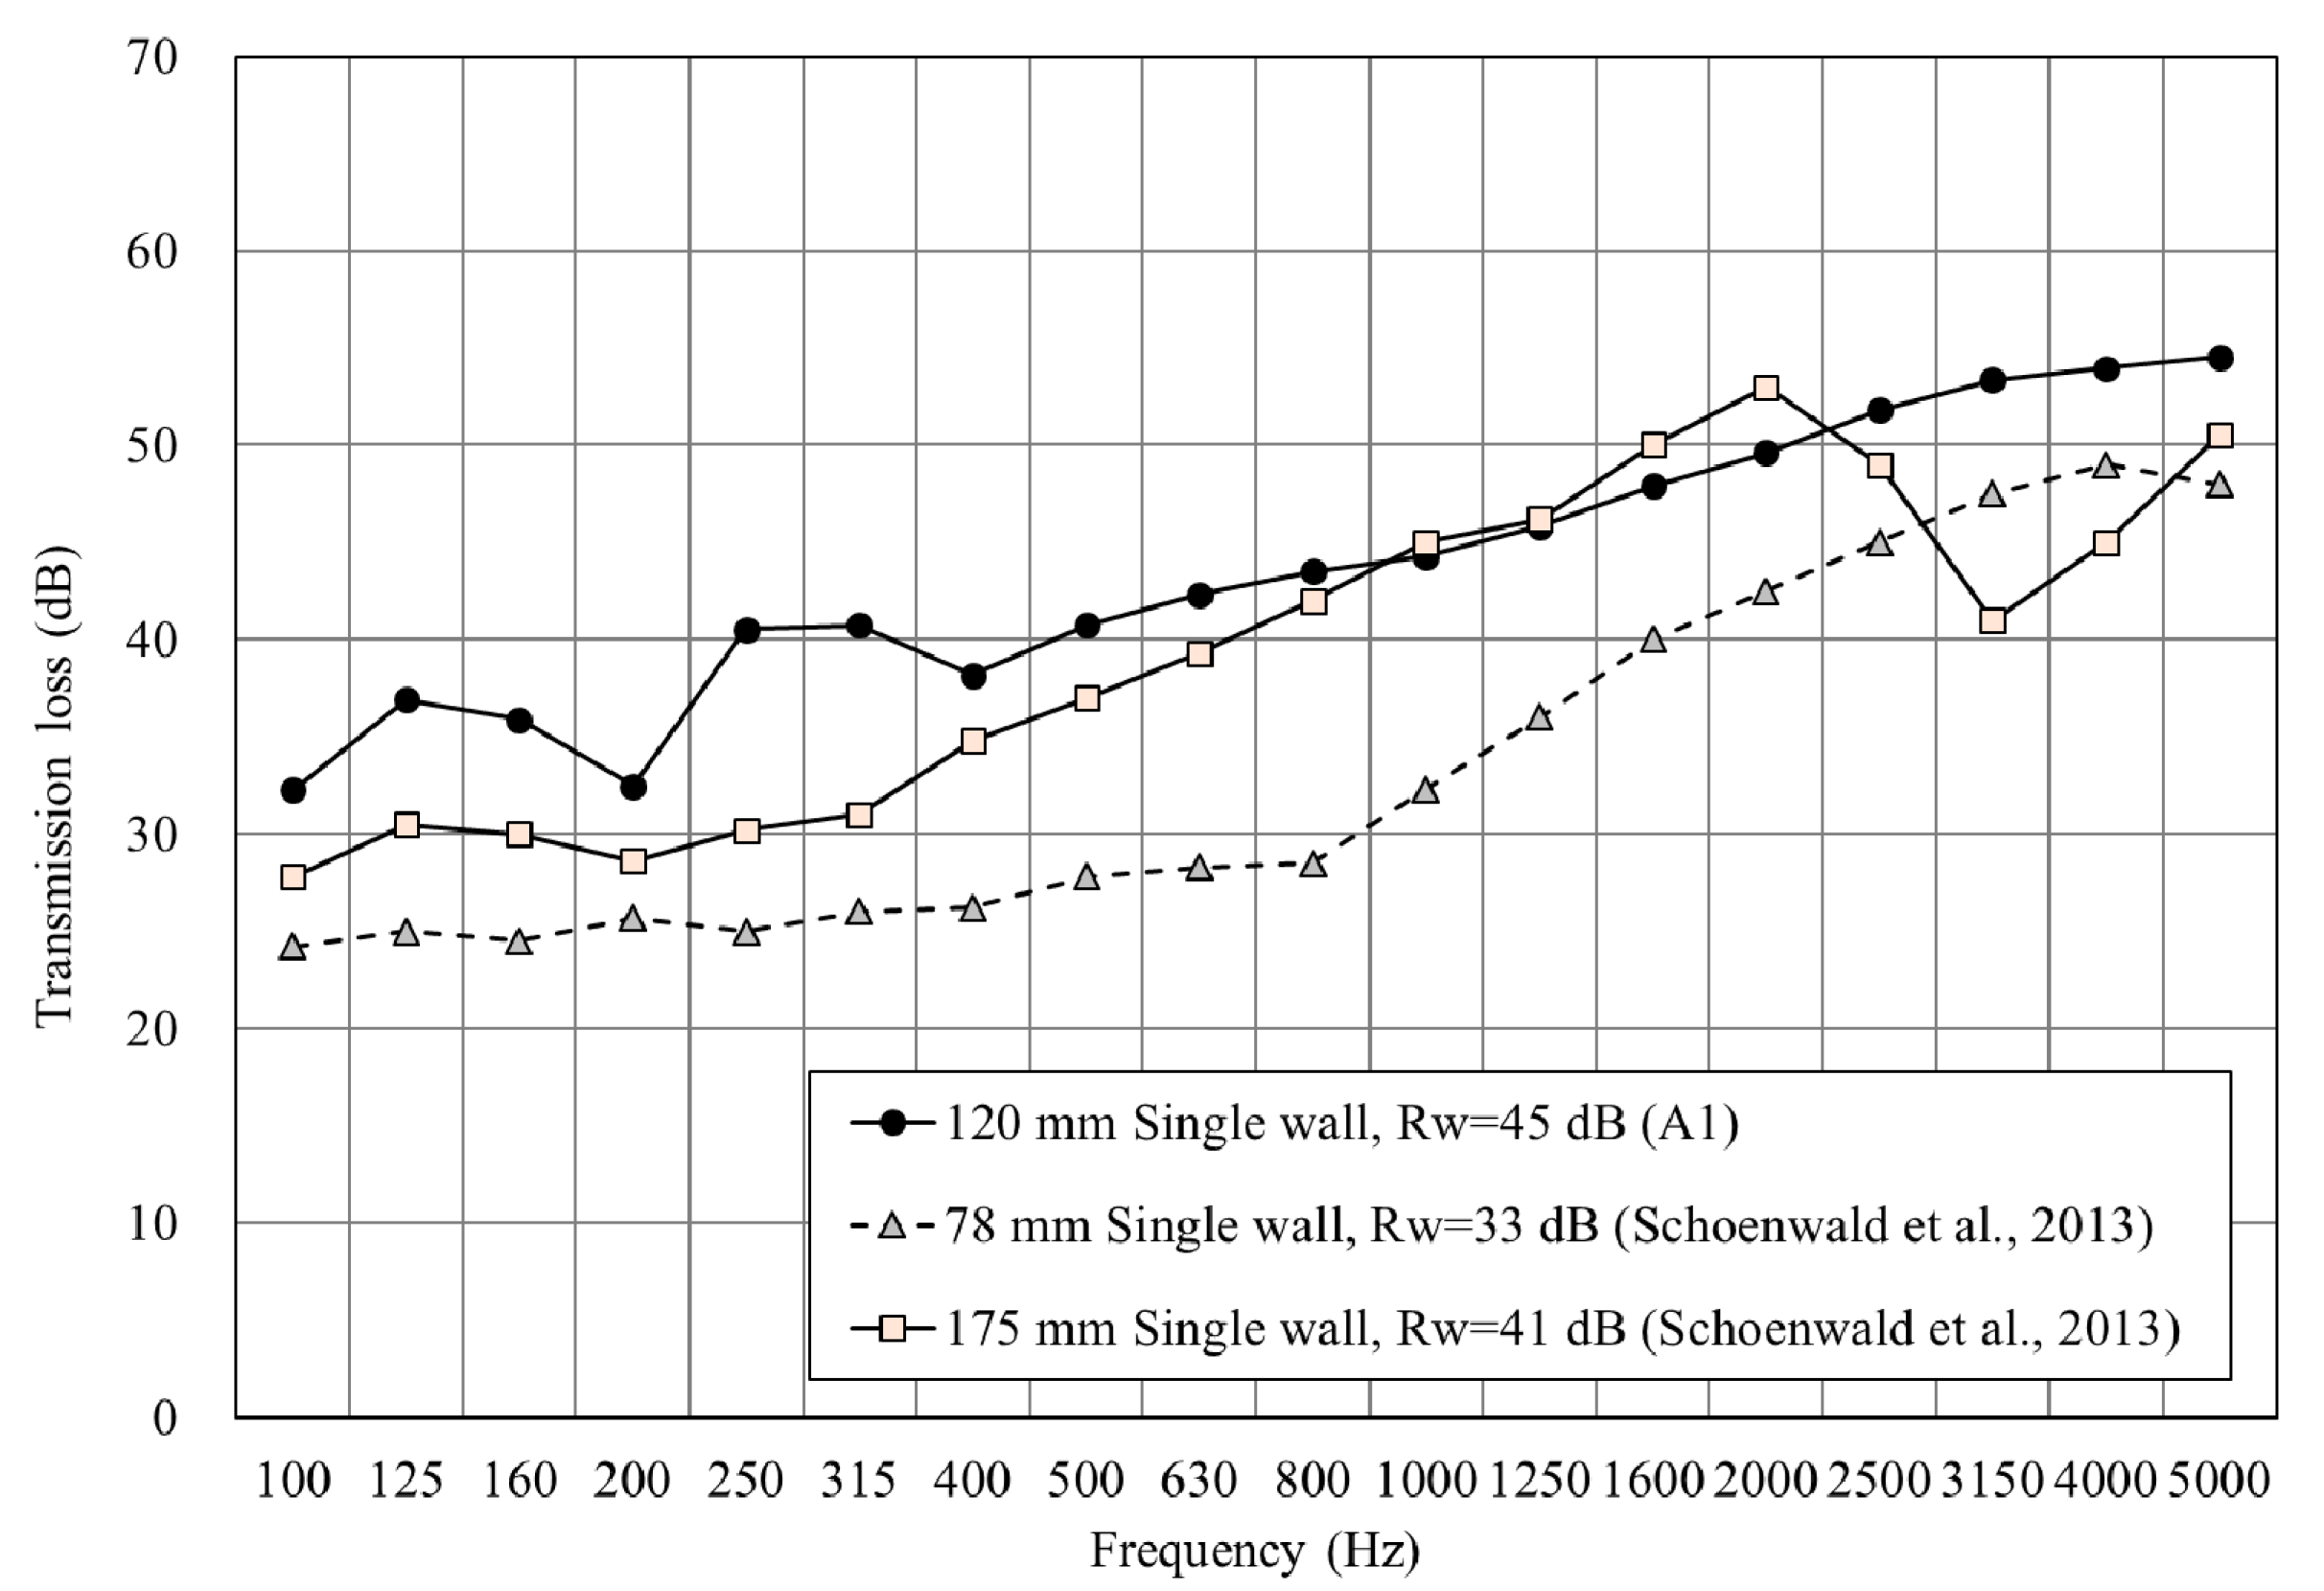
3.1.1. Single Wall of CLT
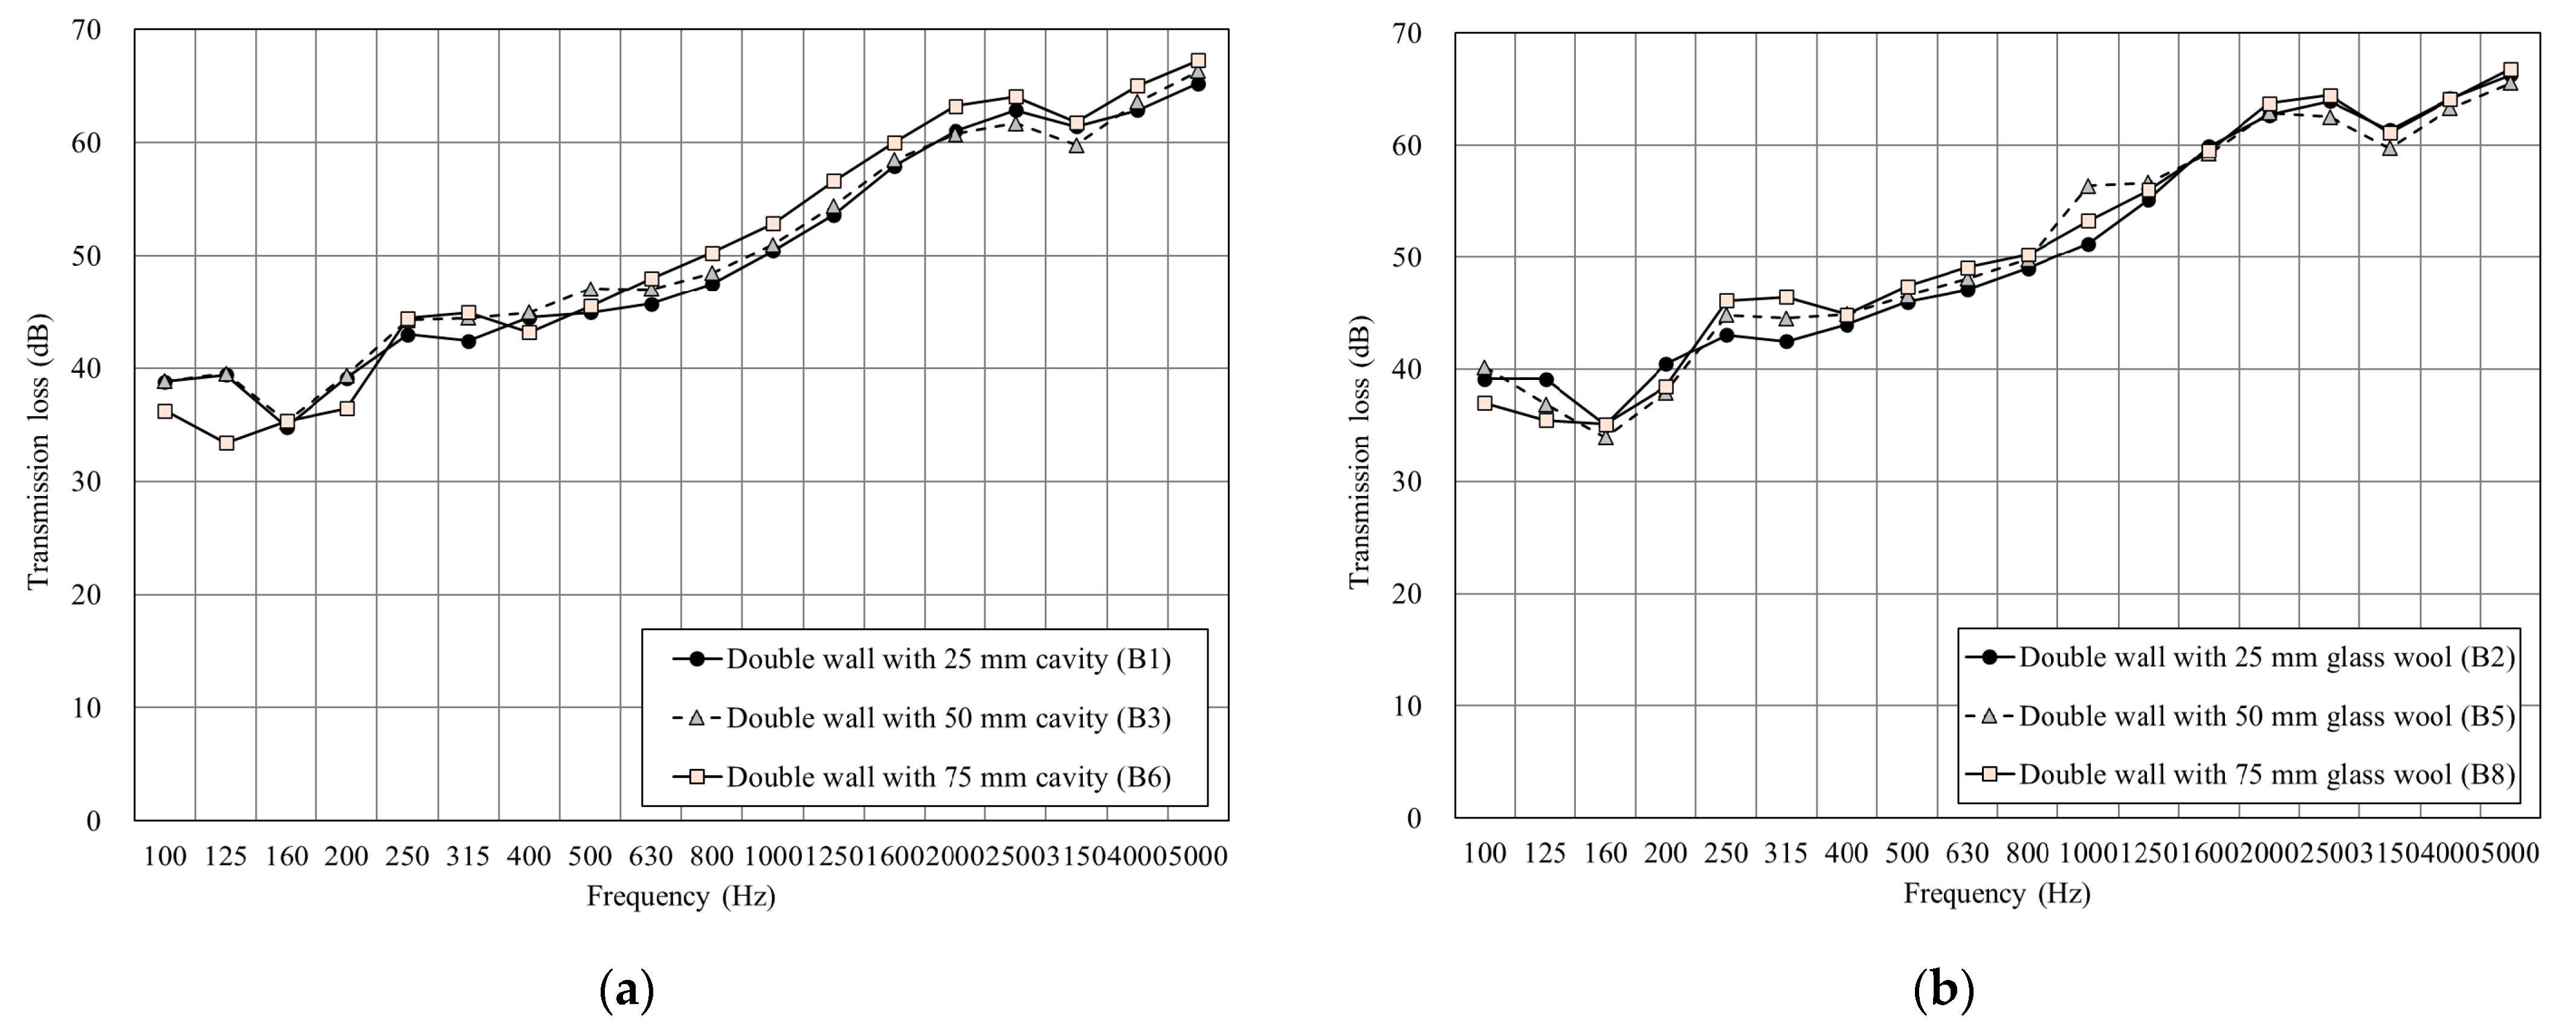
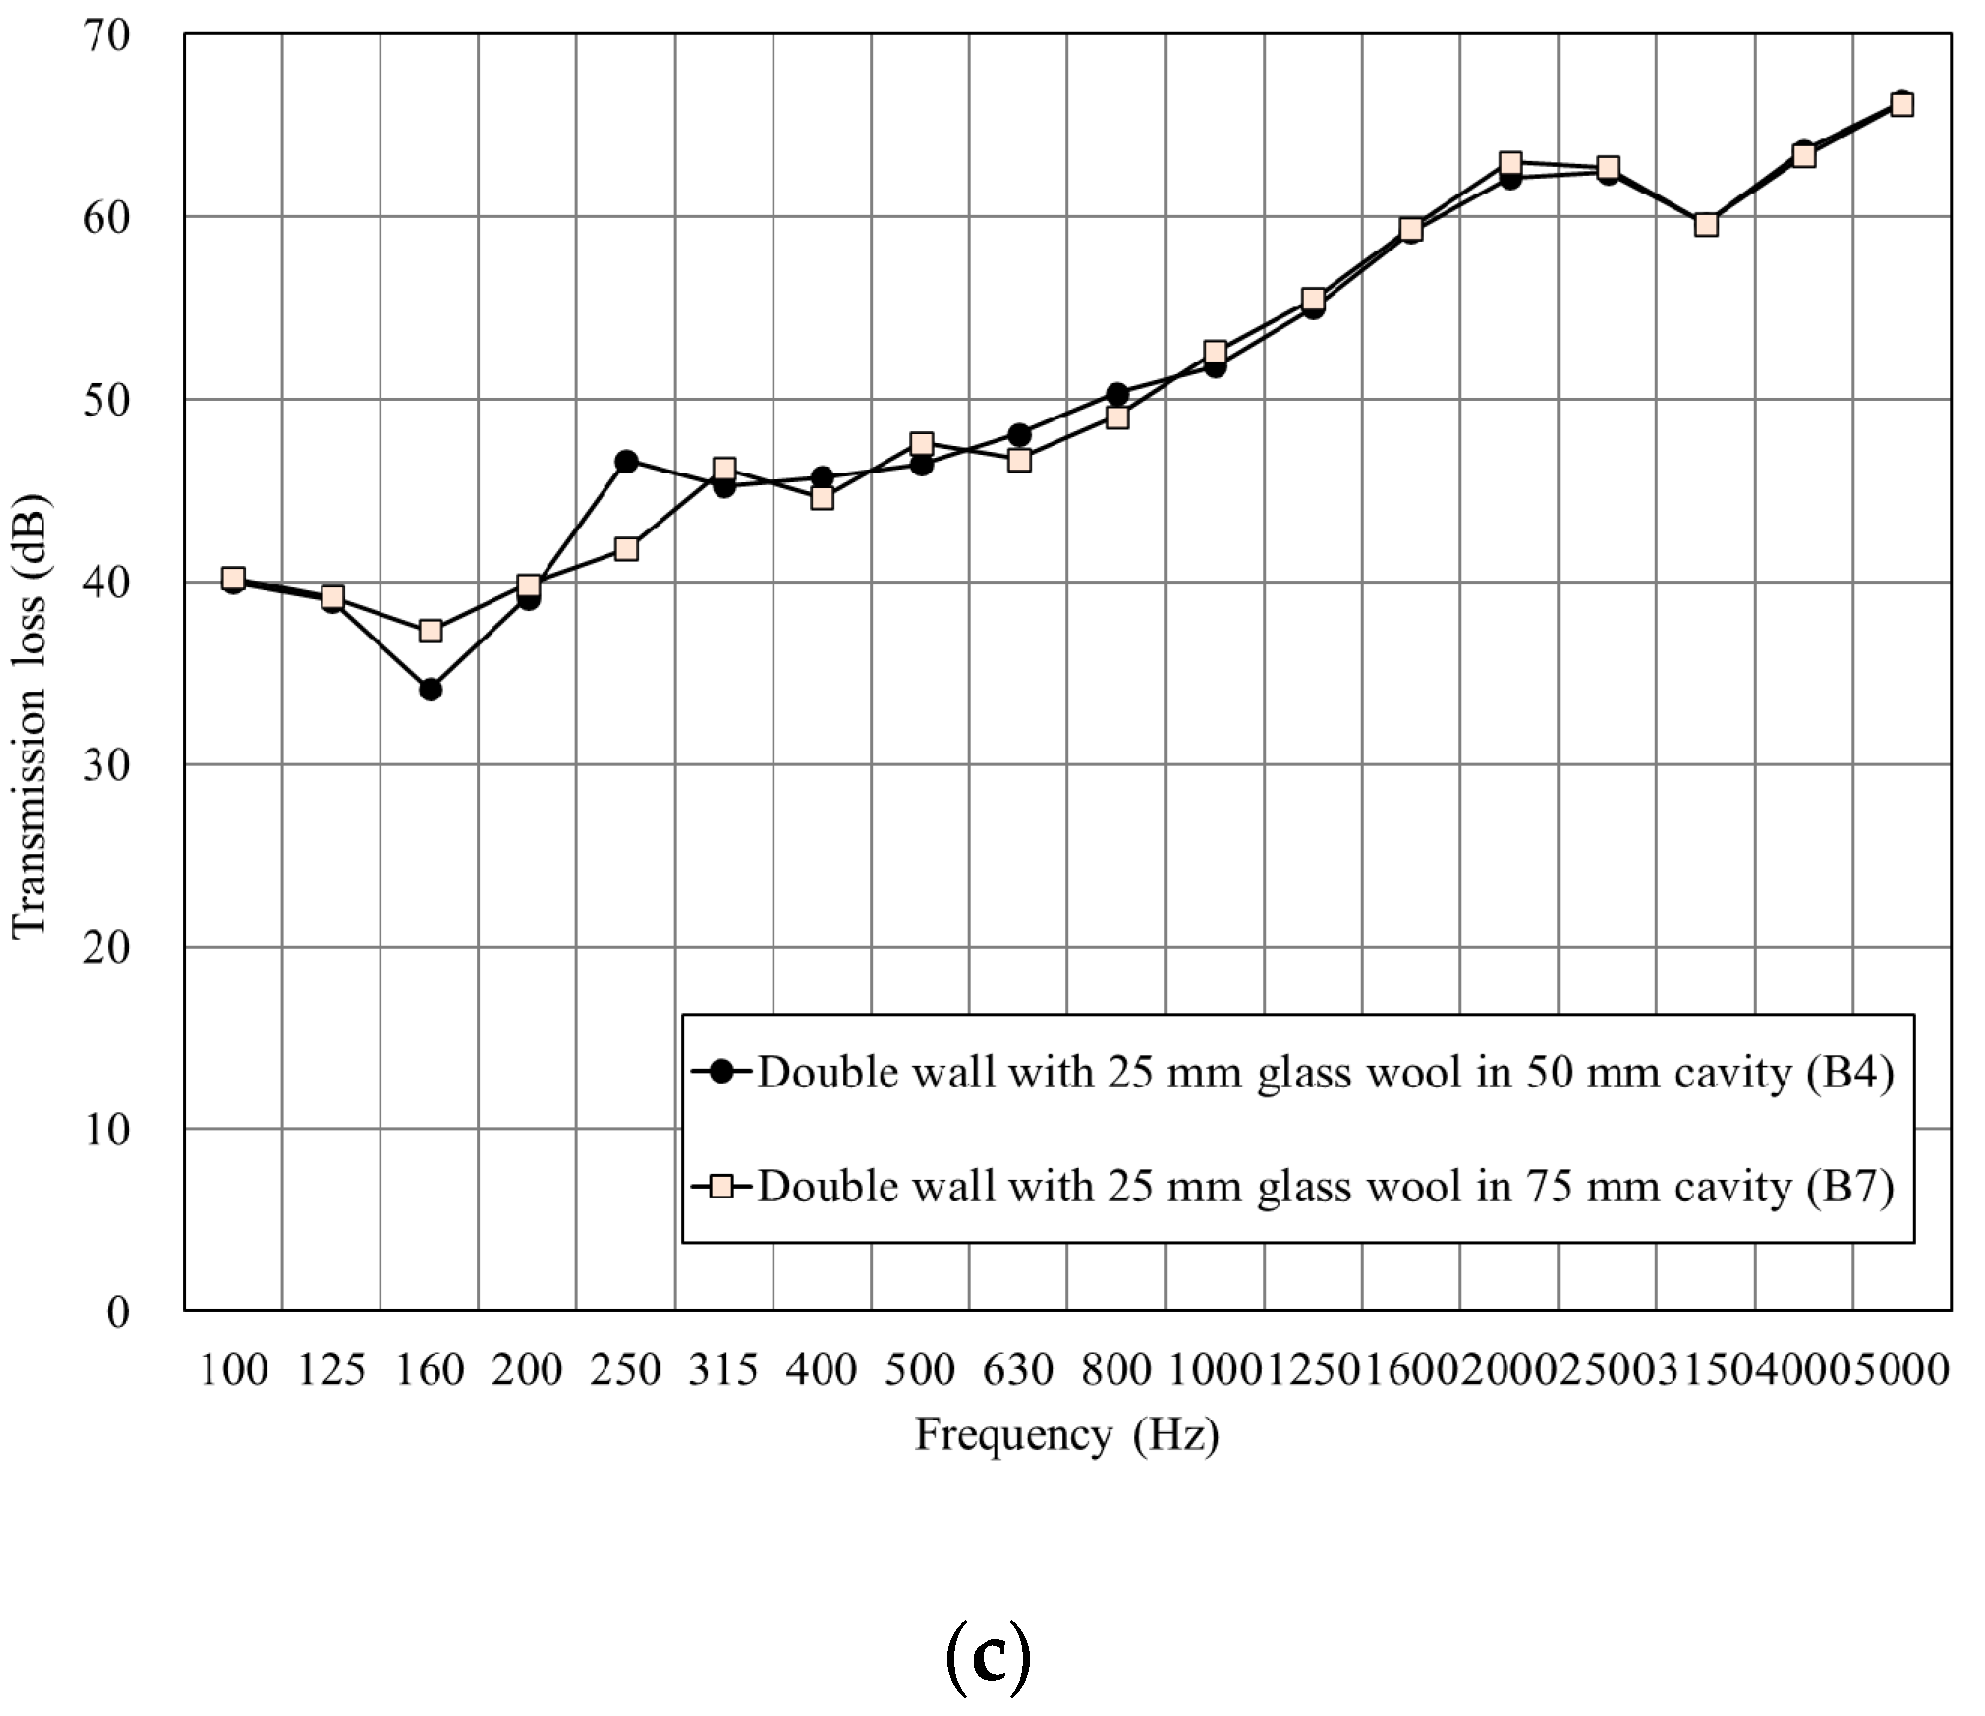
3.1.2. Double Wall of CLT
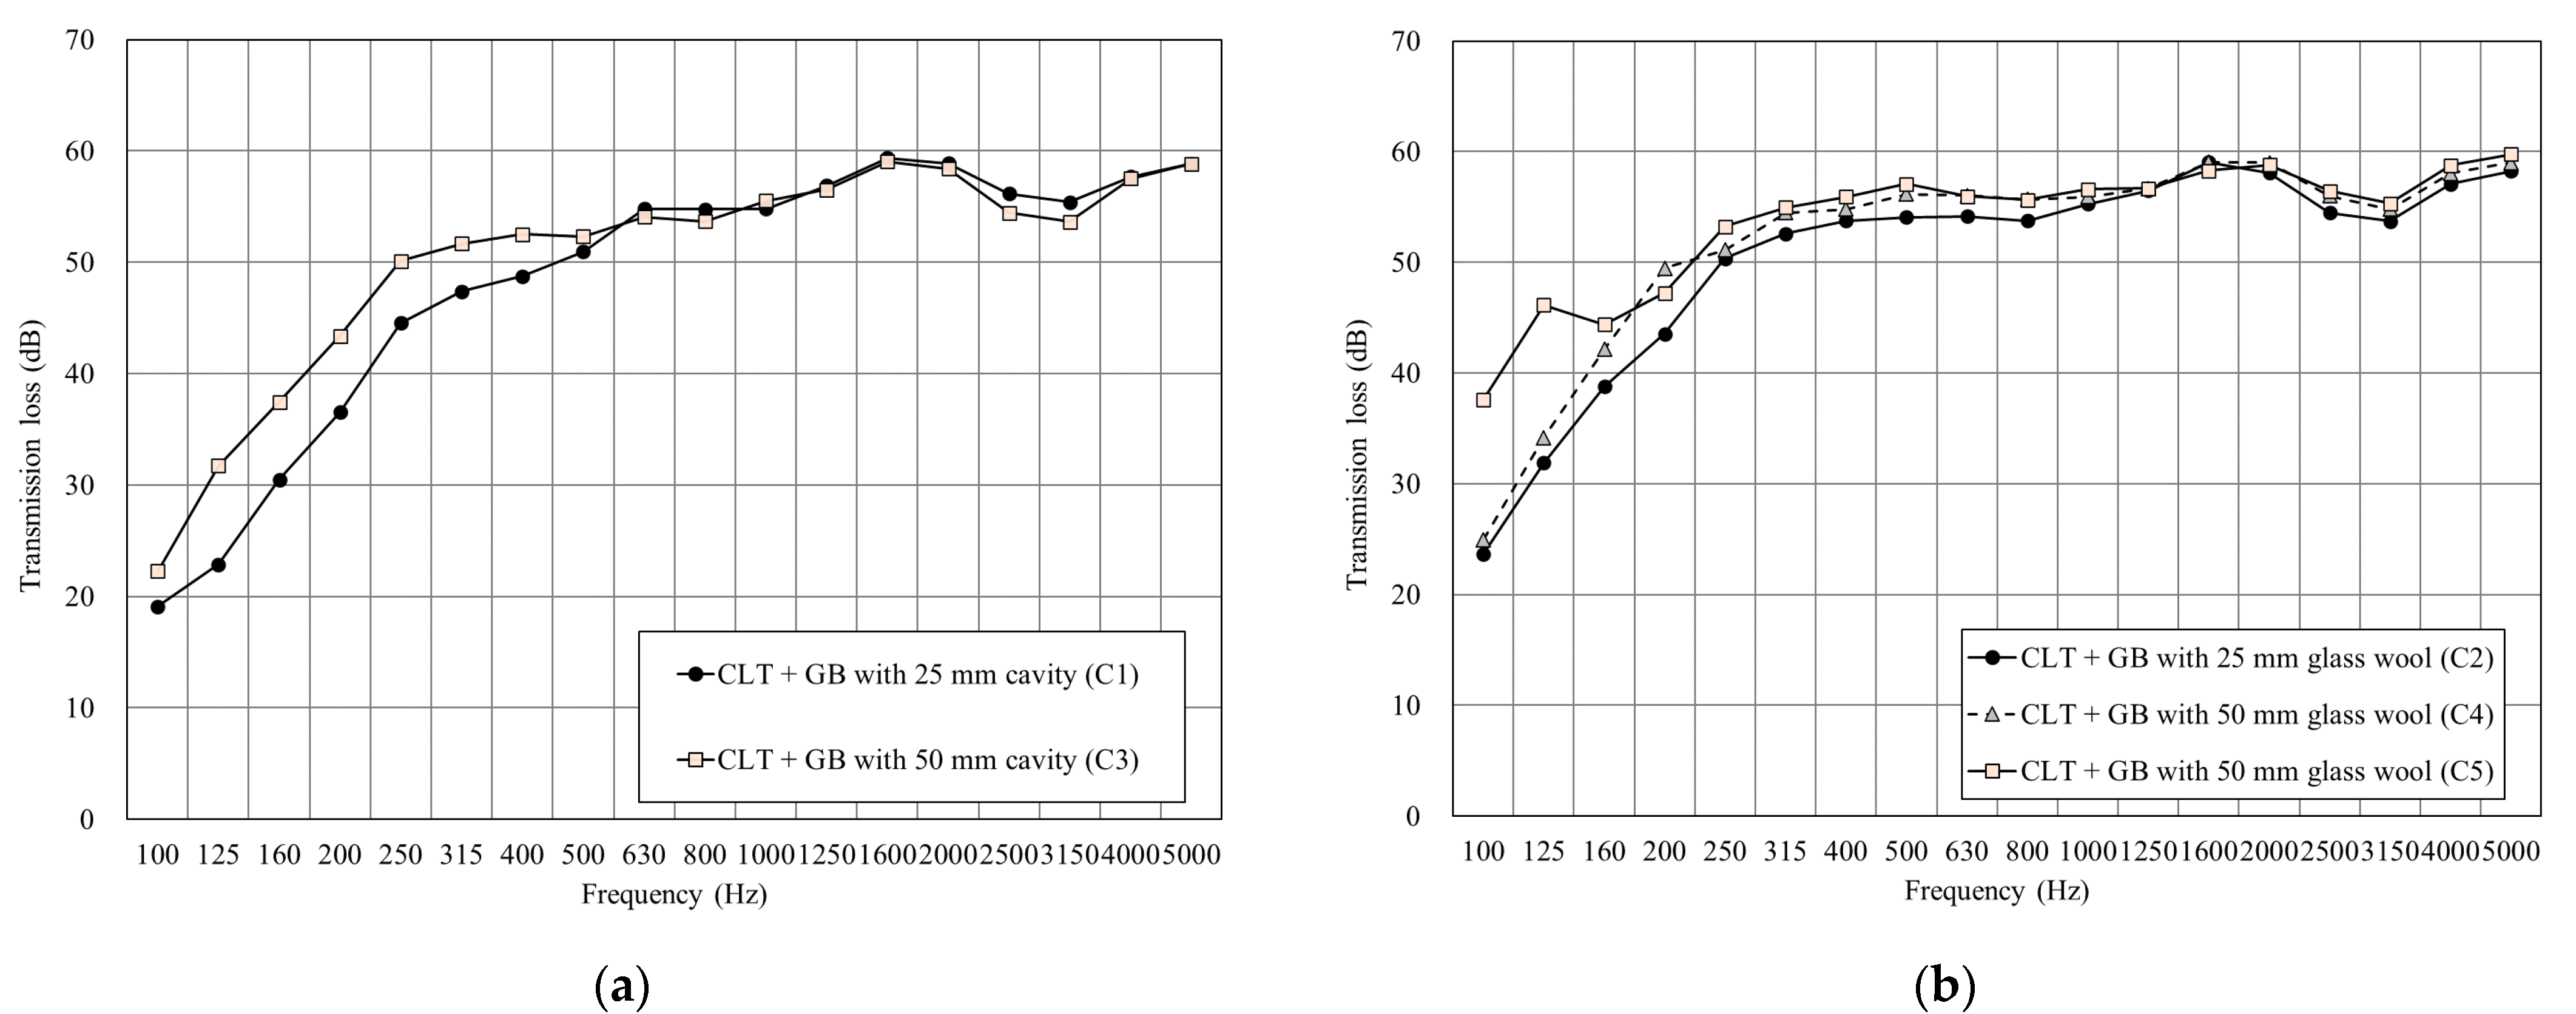
3.1.3. CLT + GB
3.2. Predict and Analysis of Sound Insulation
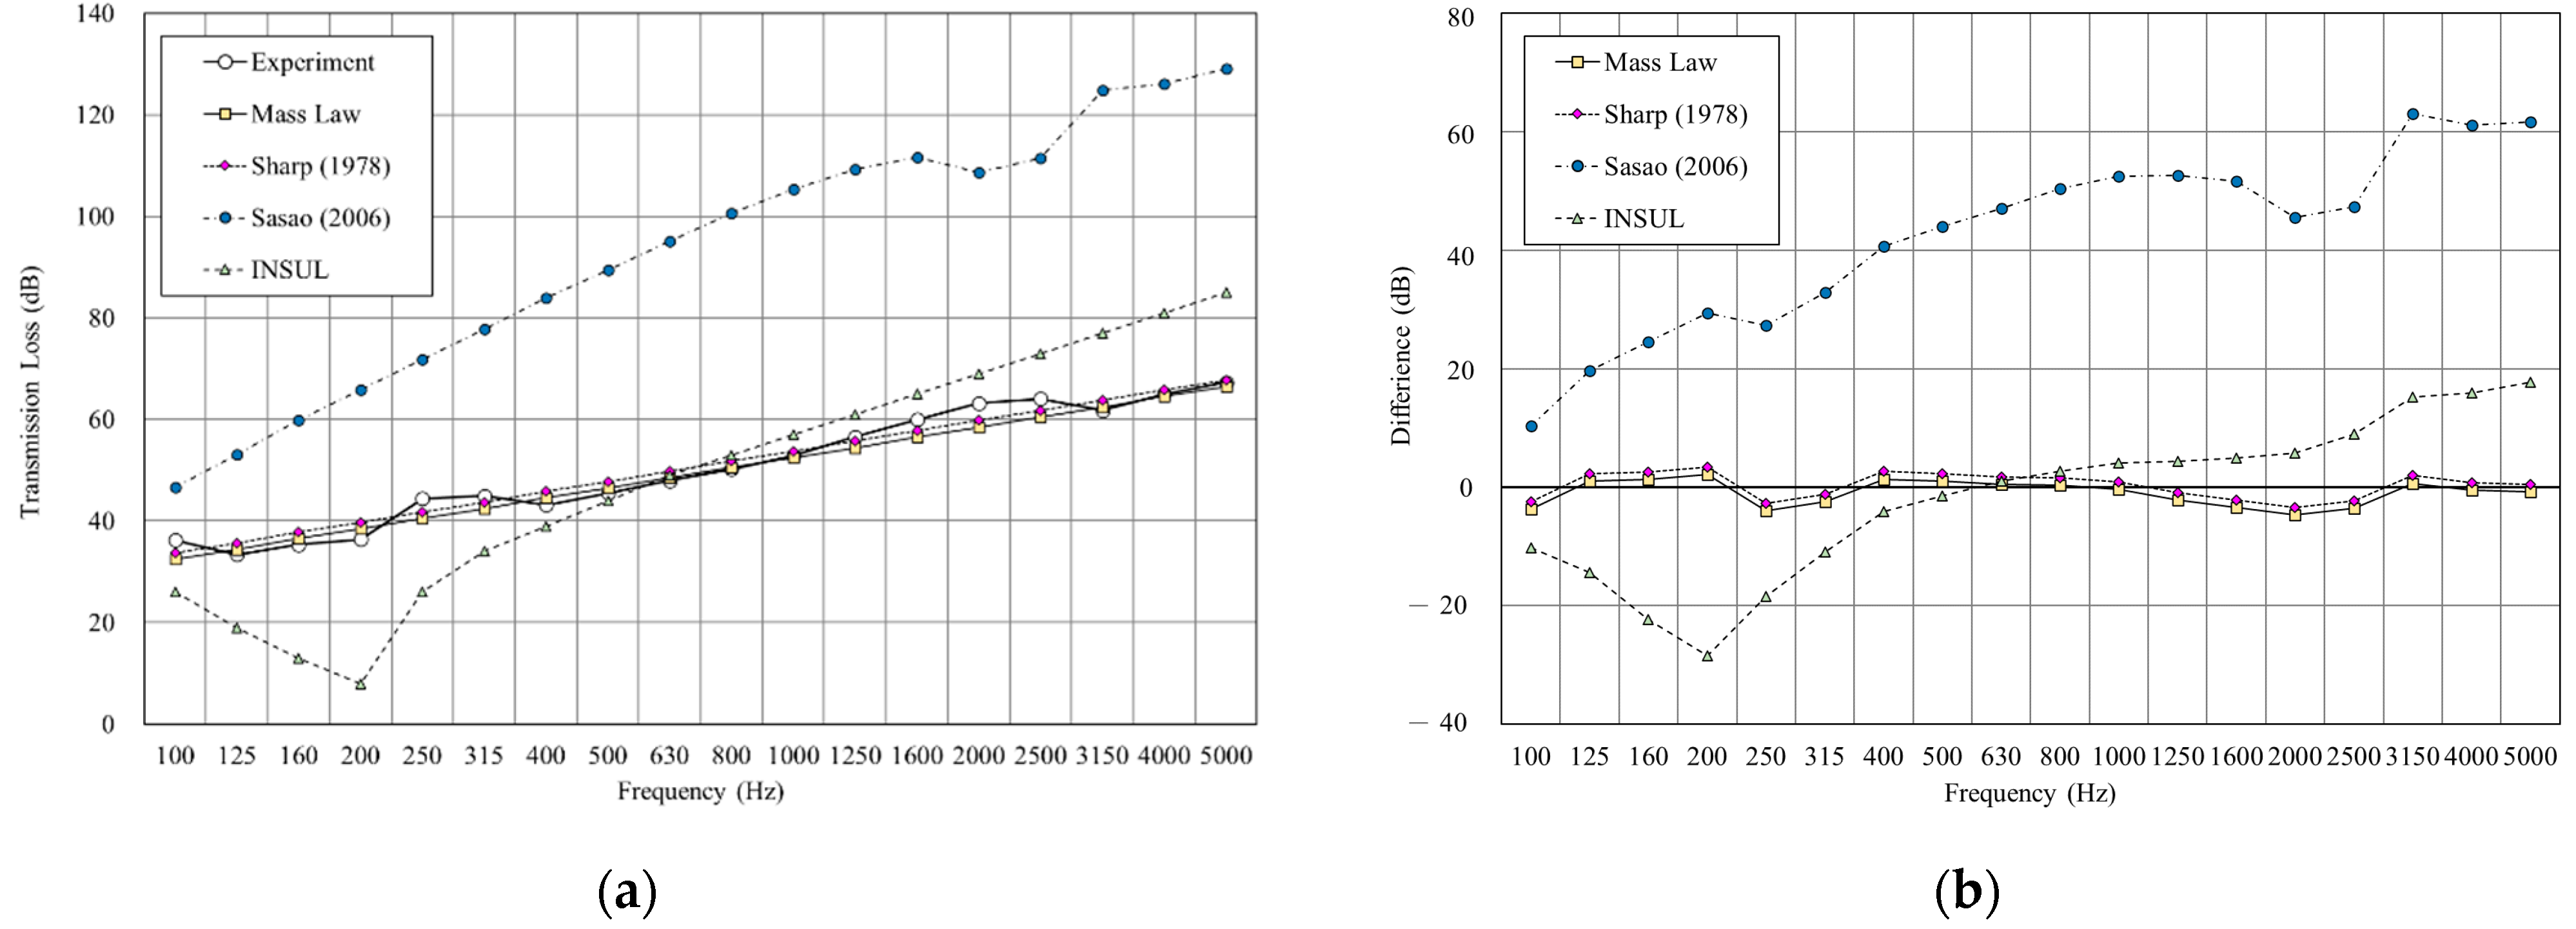
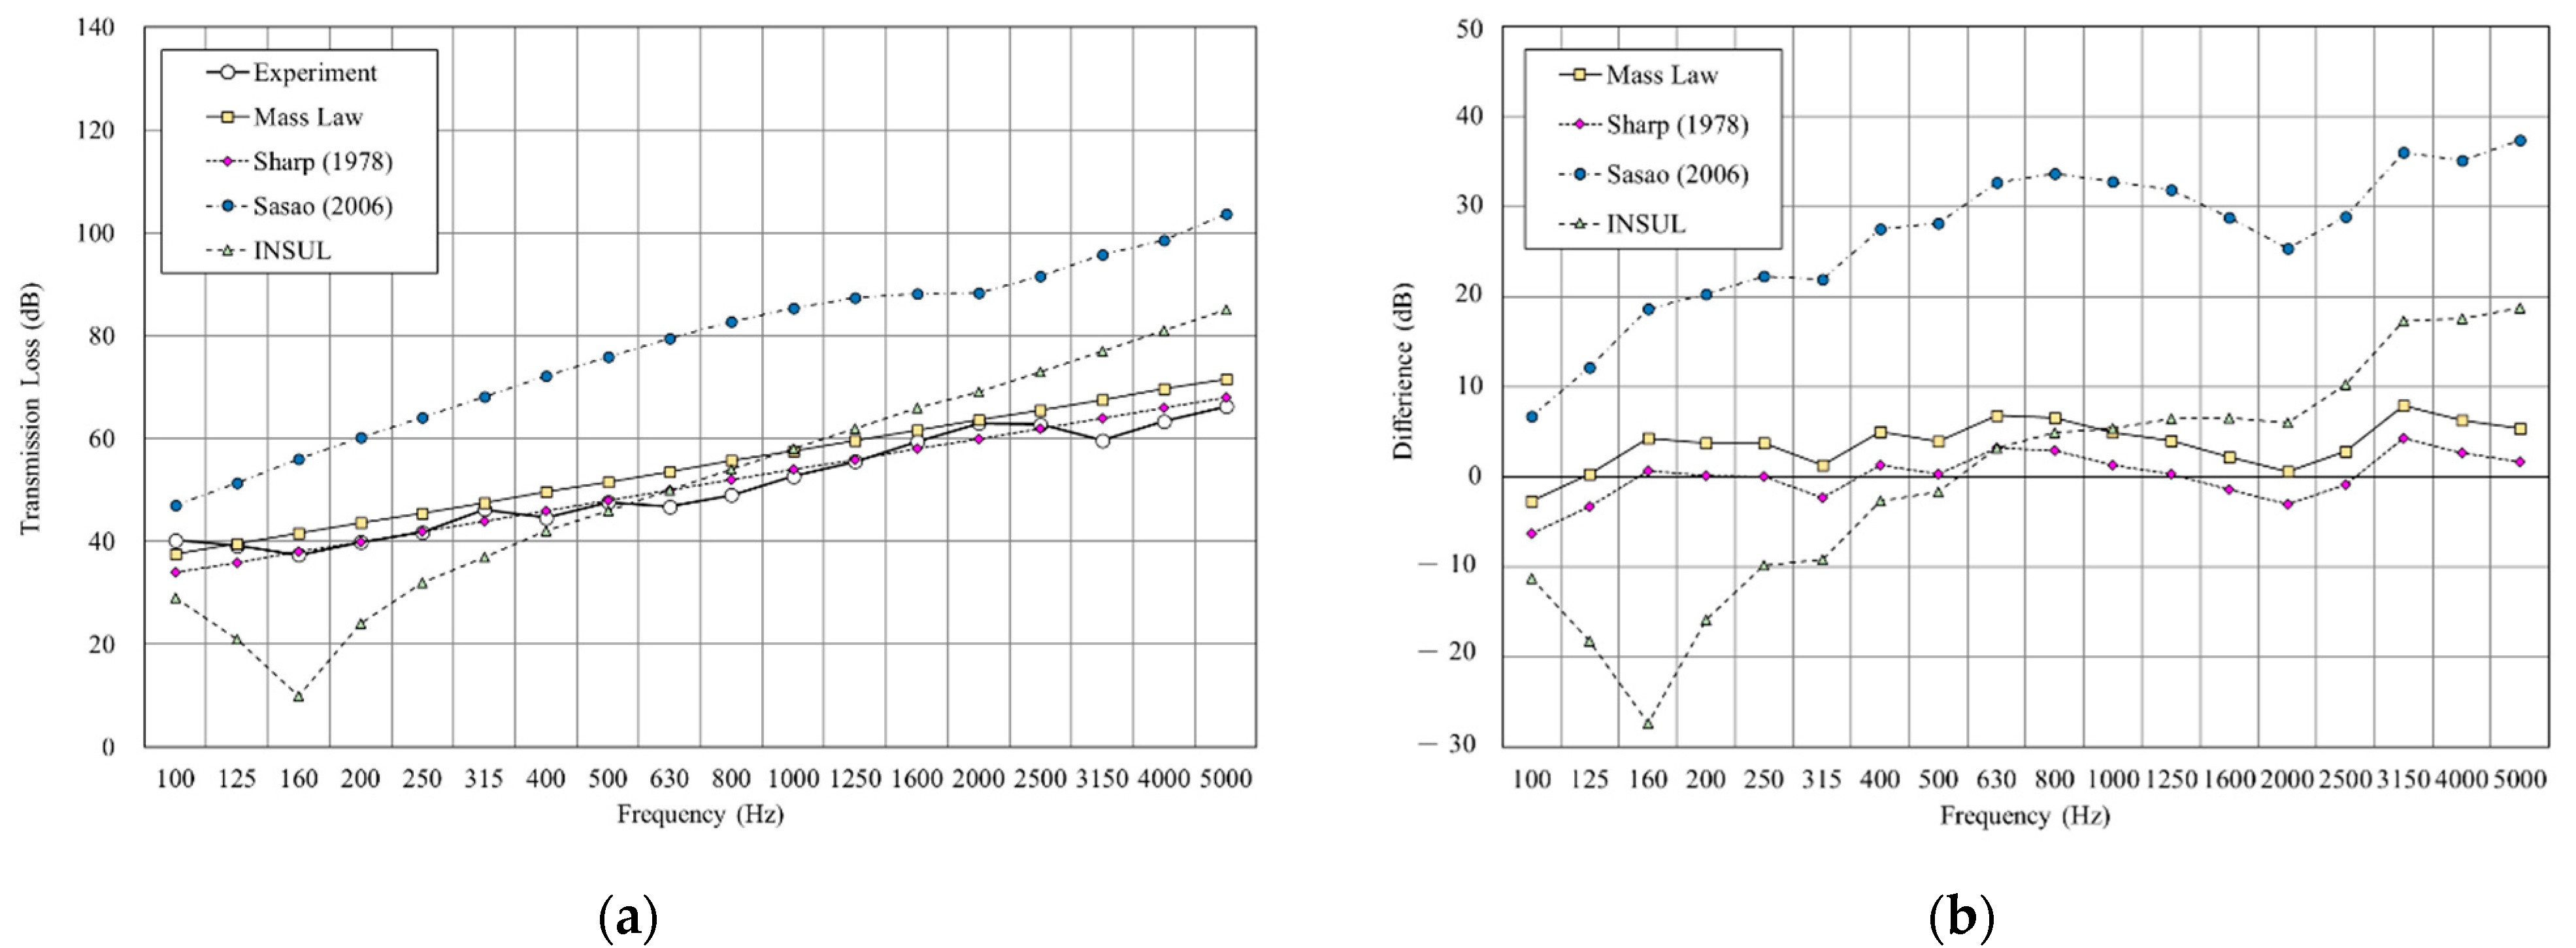
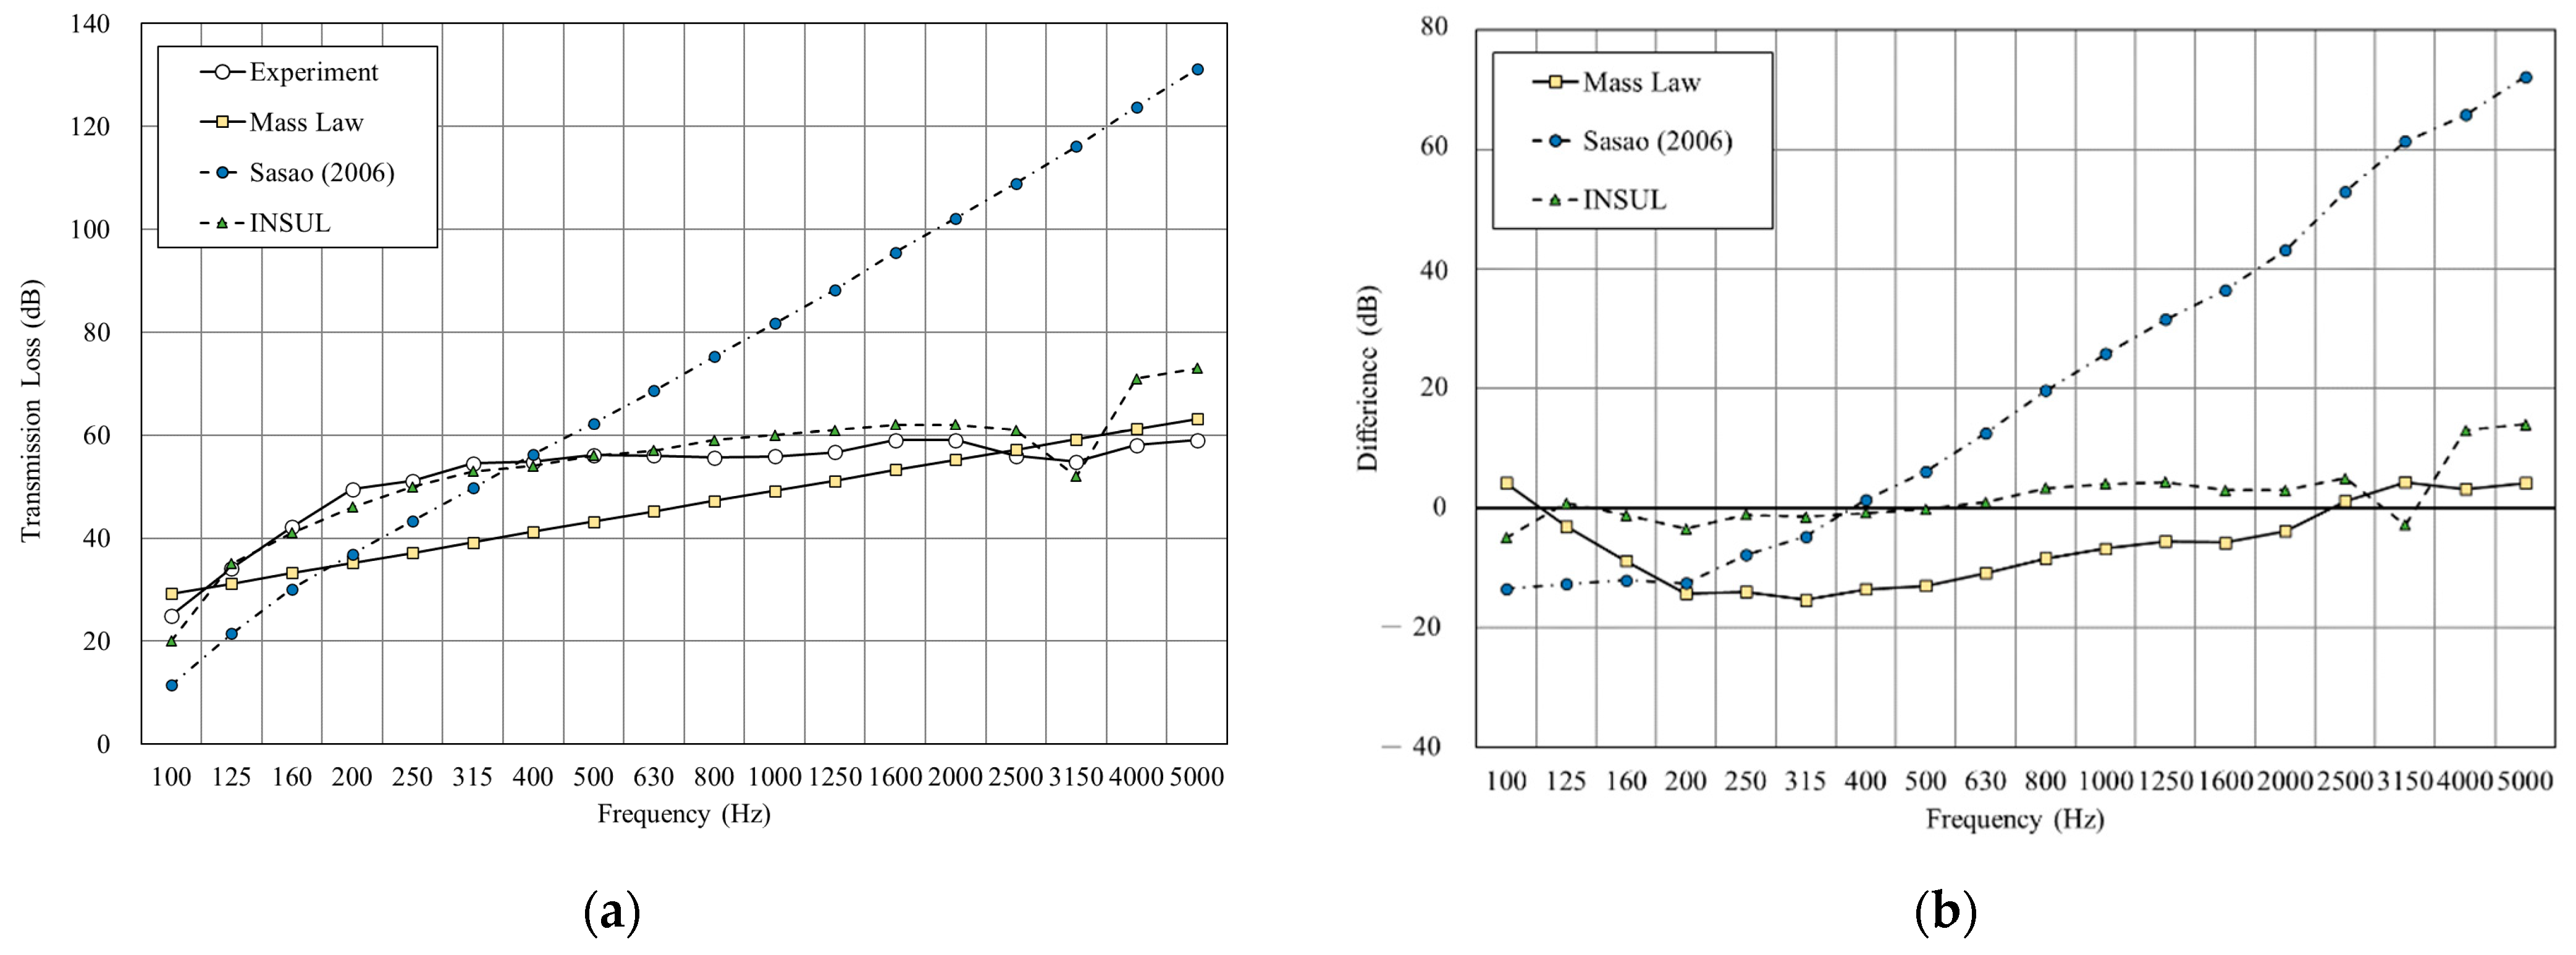
3.2.1. Sound Insulation Simulation and Analysis of a Double Wall
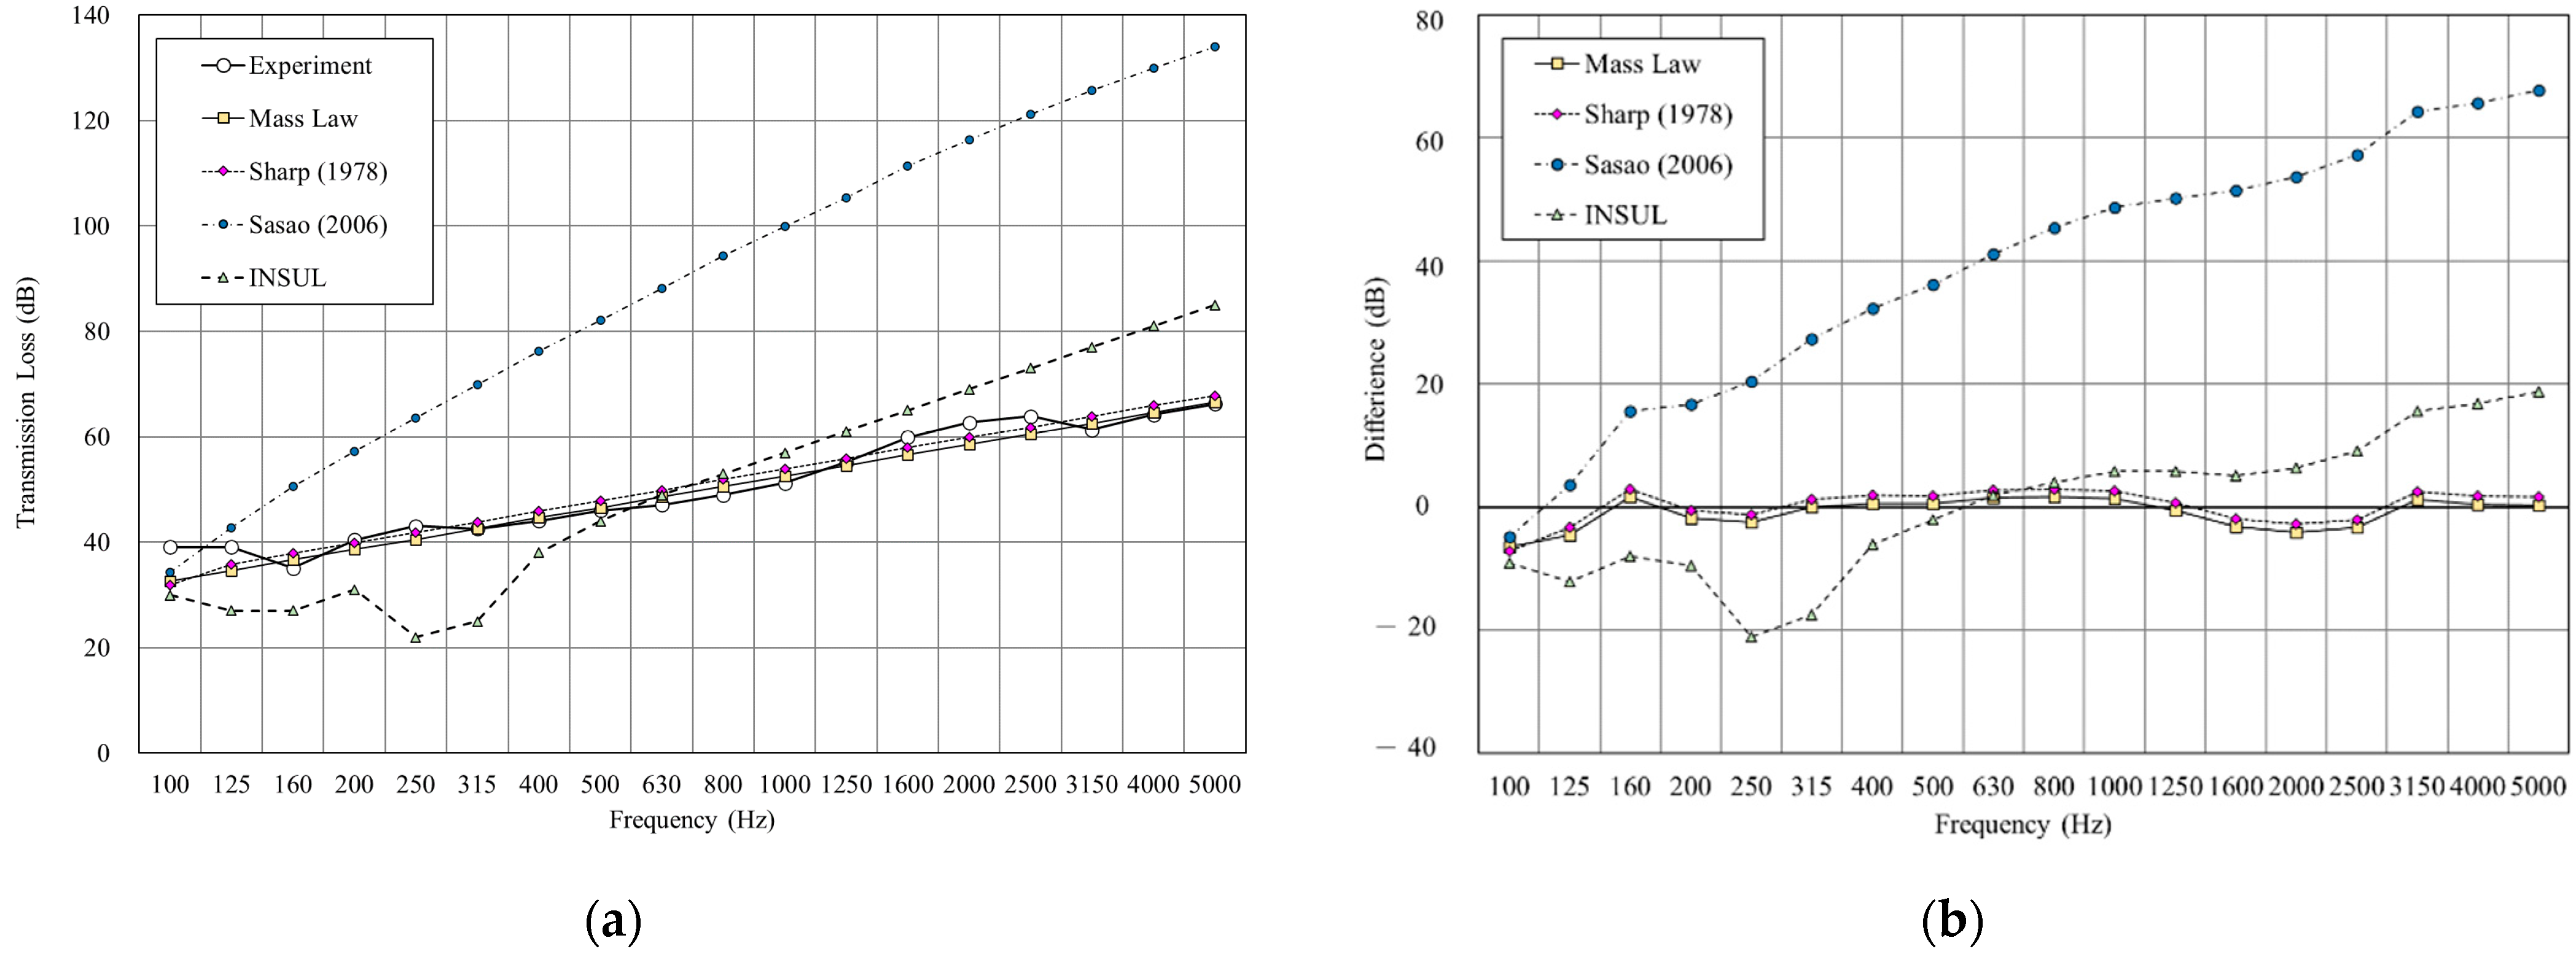
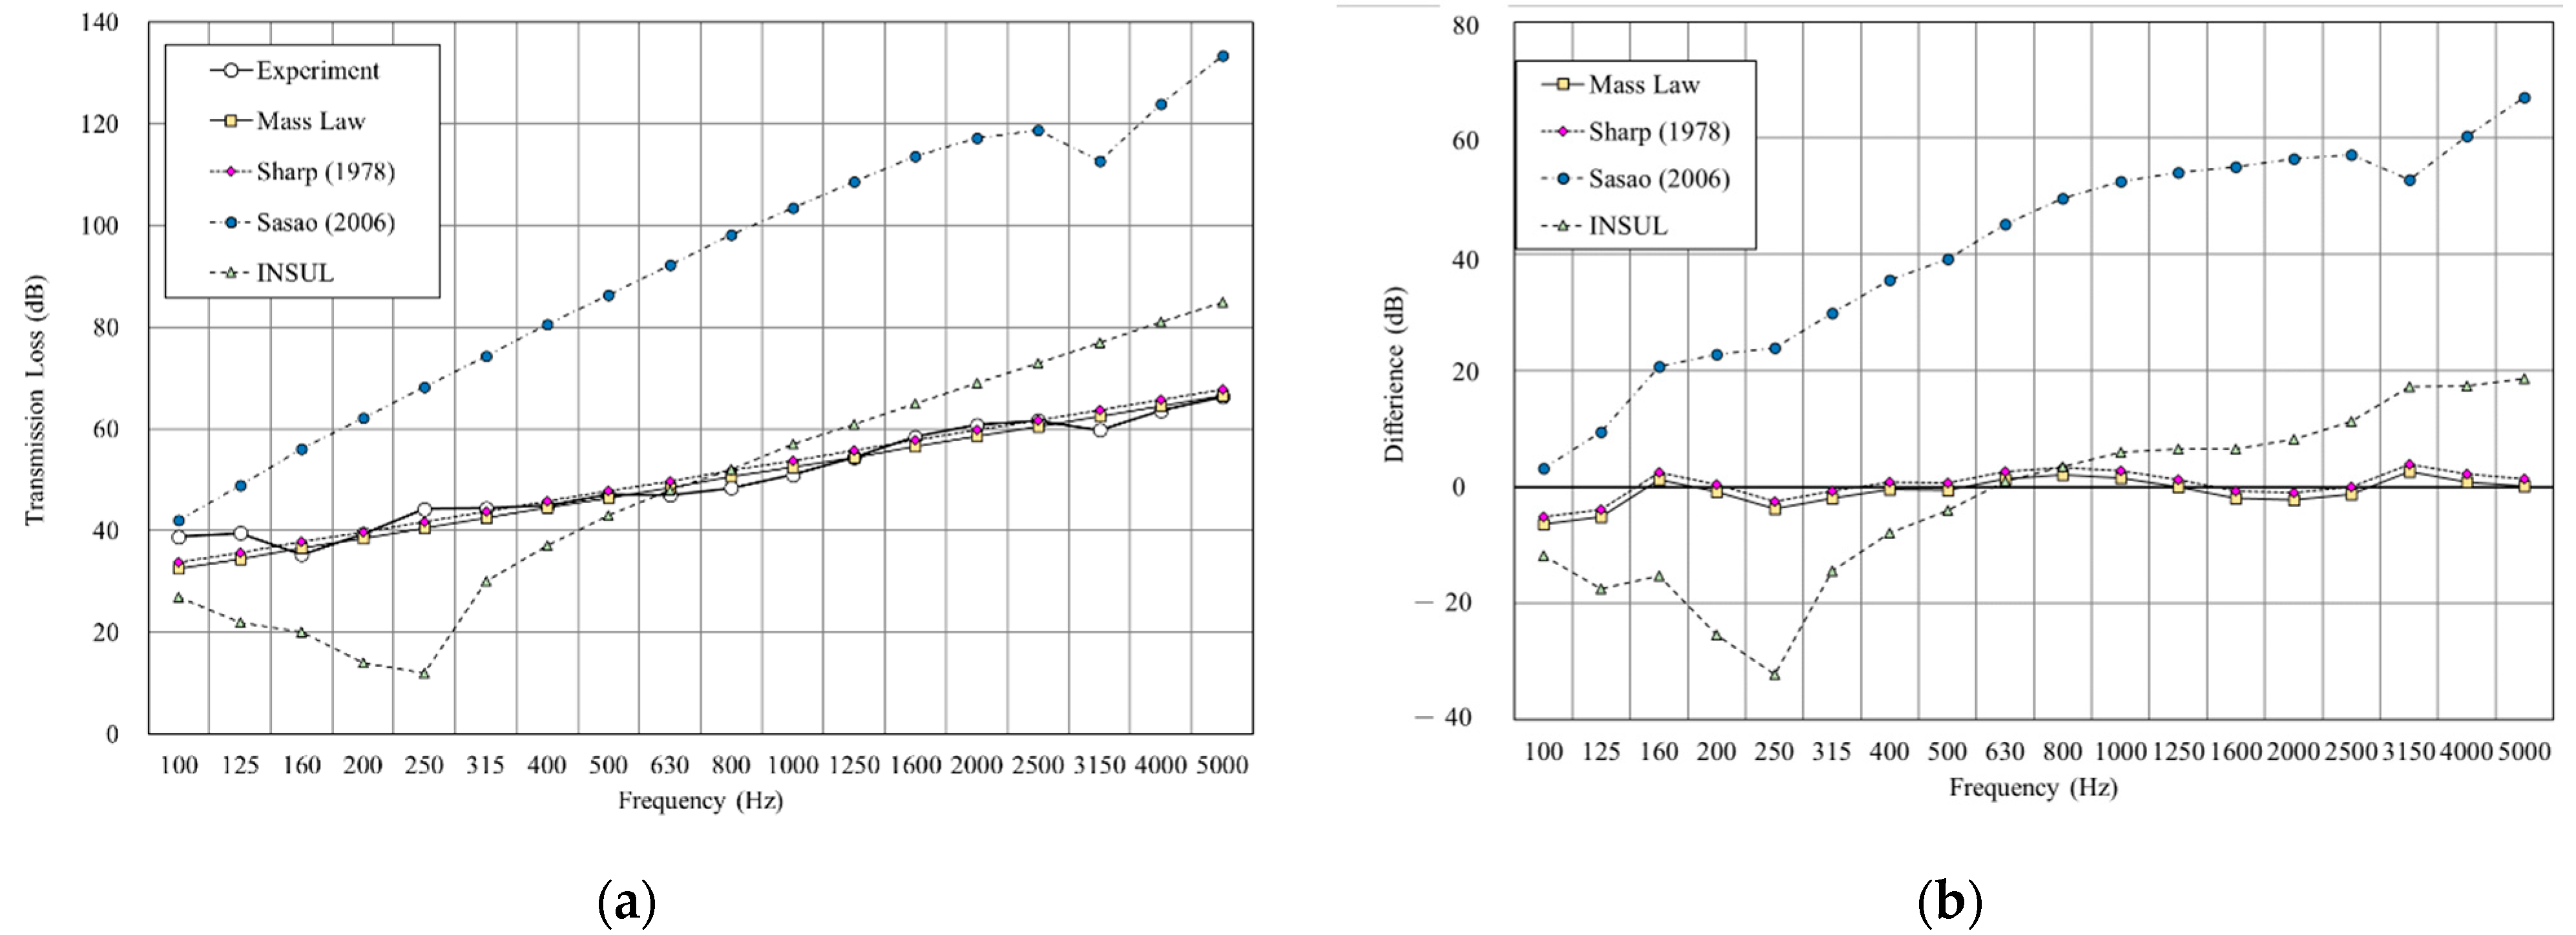
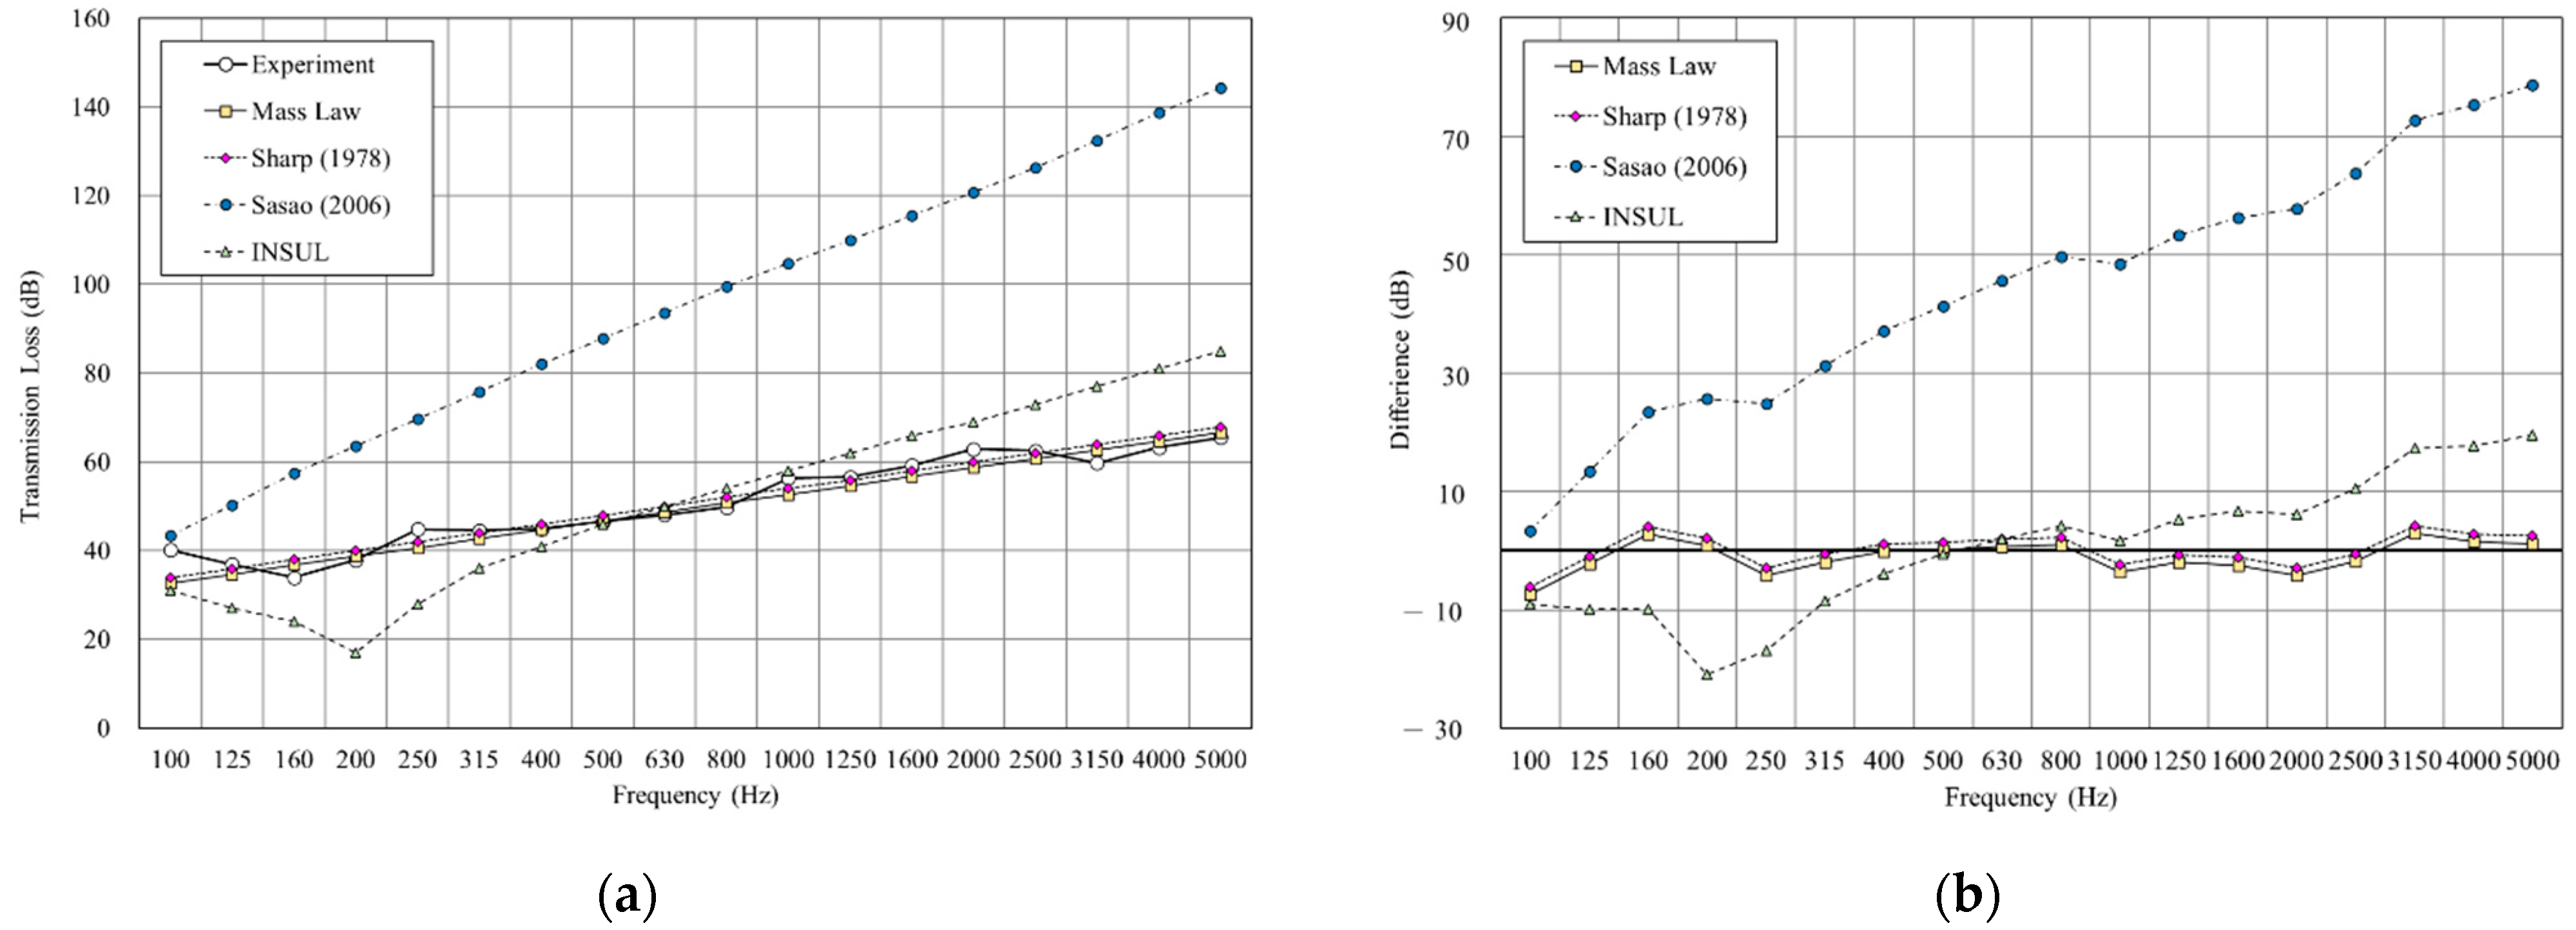
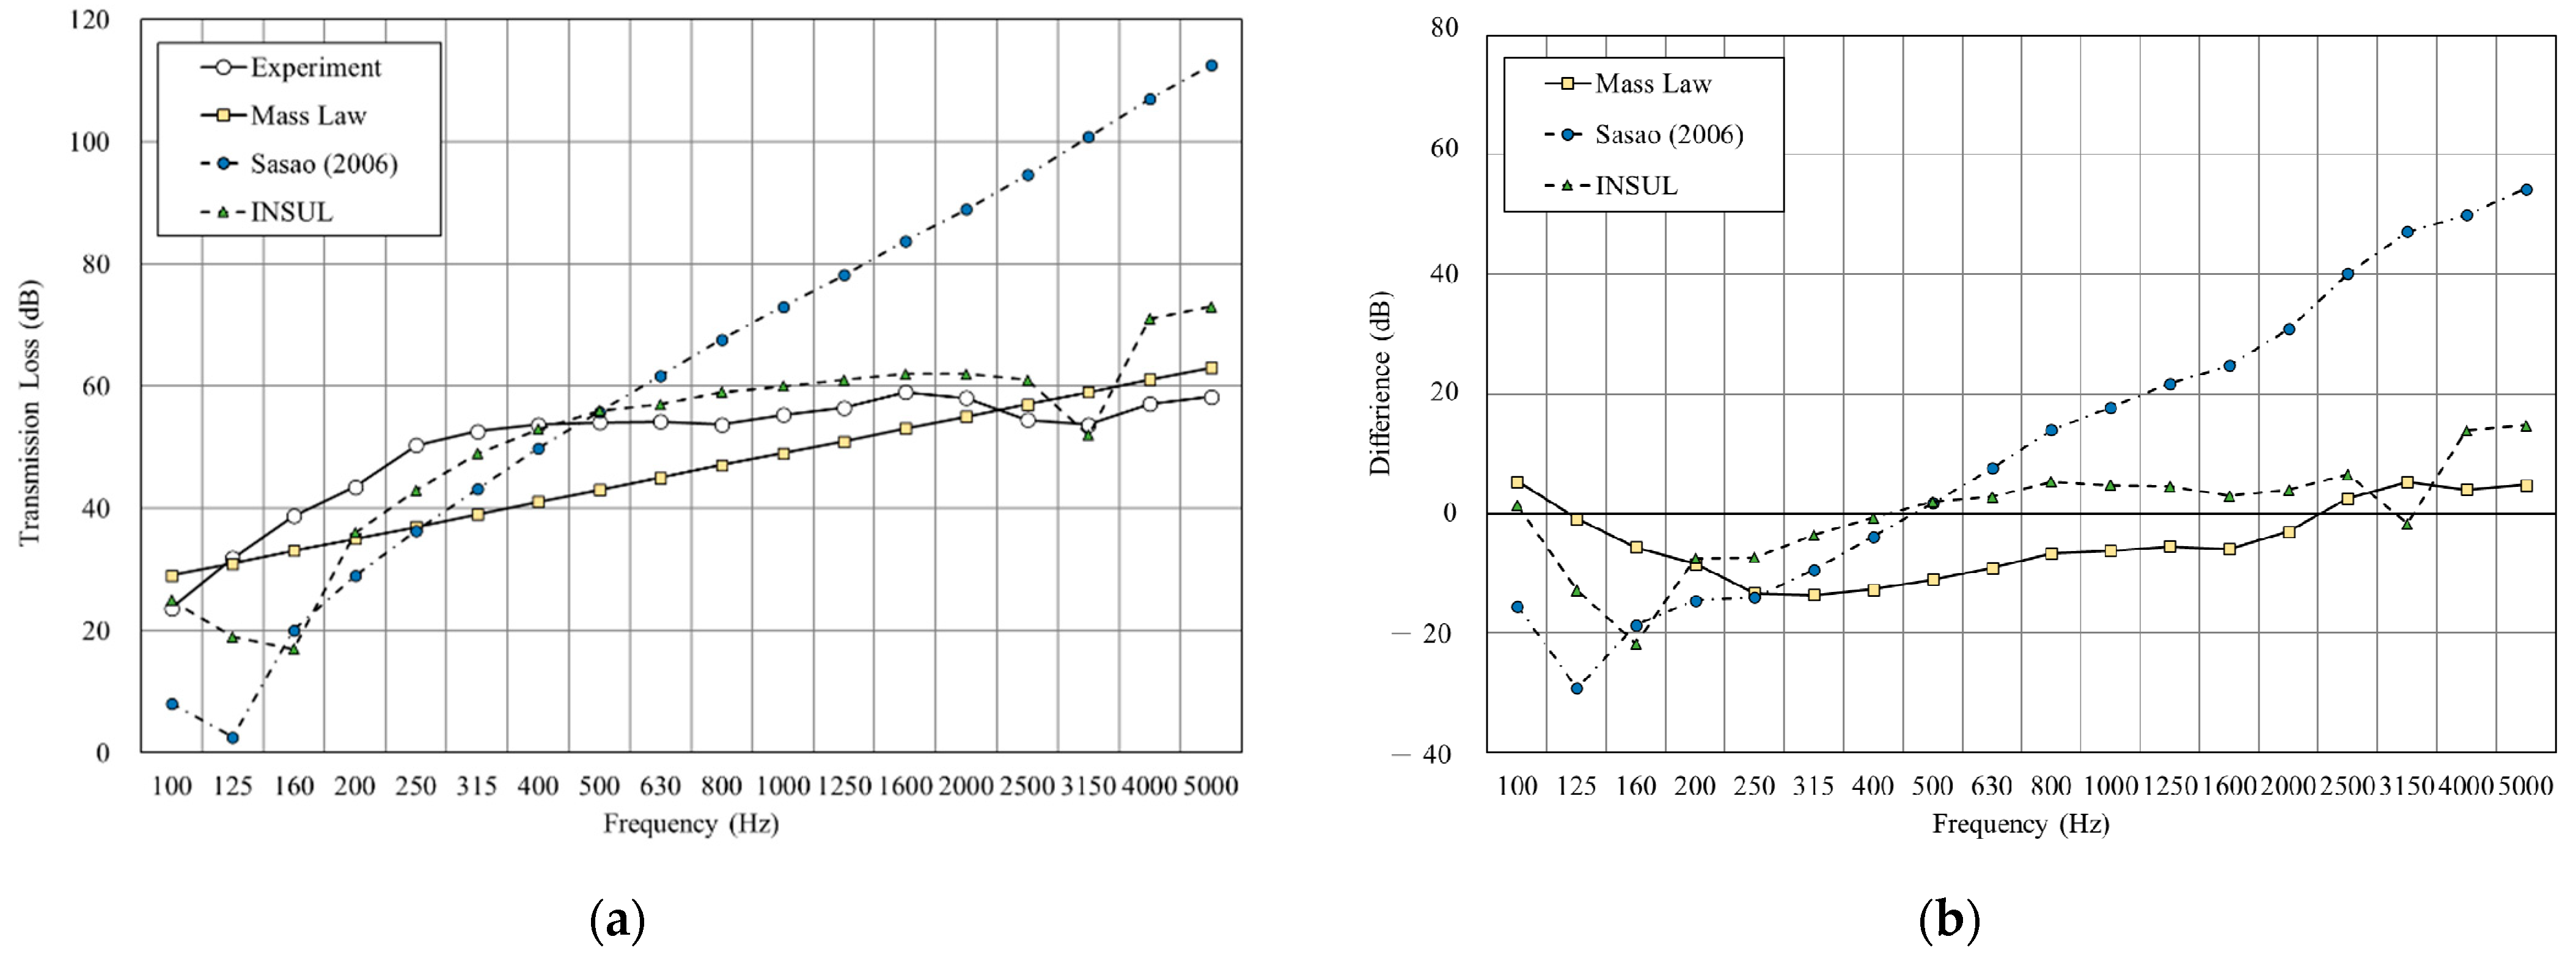
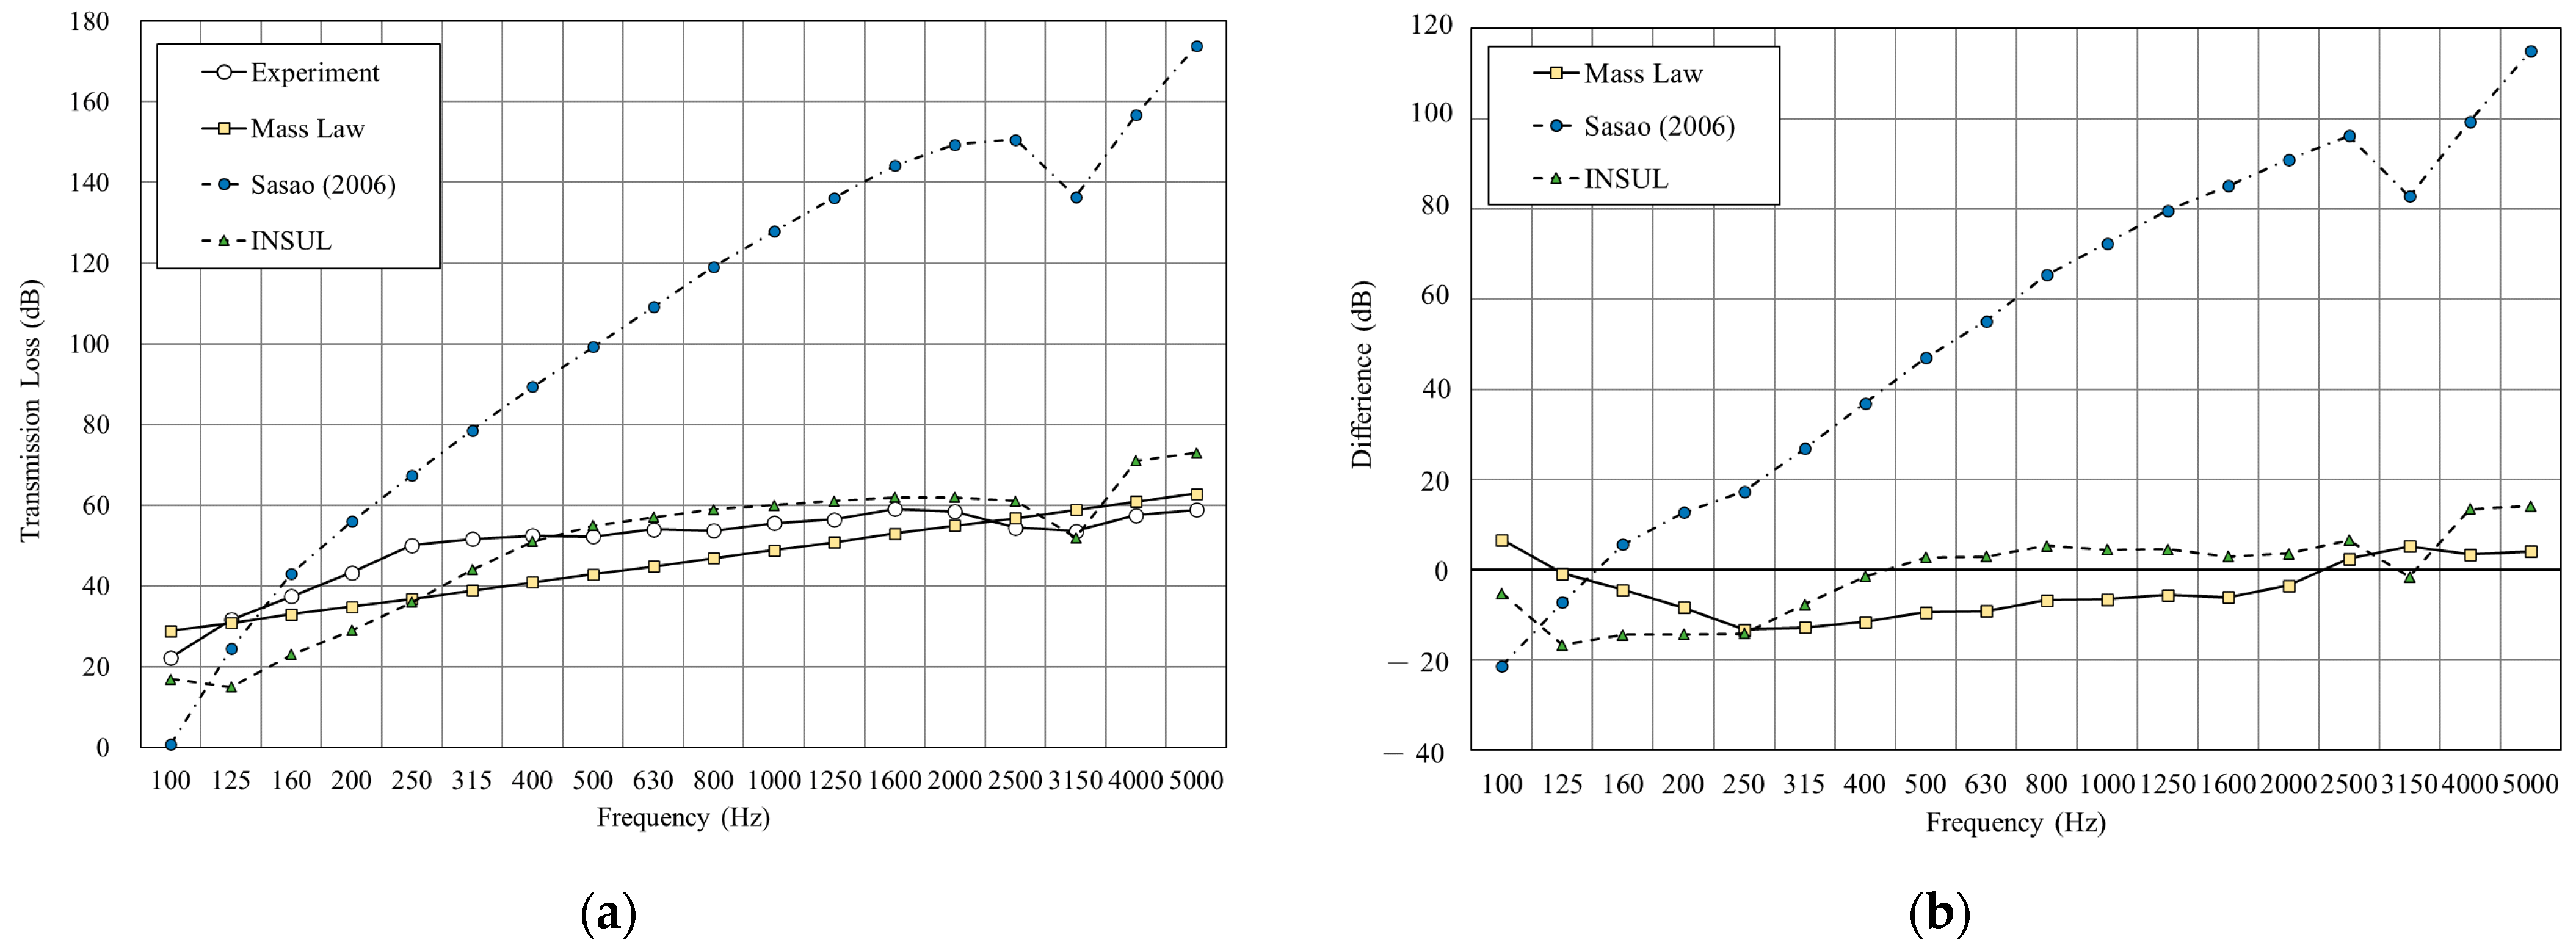
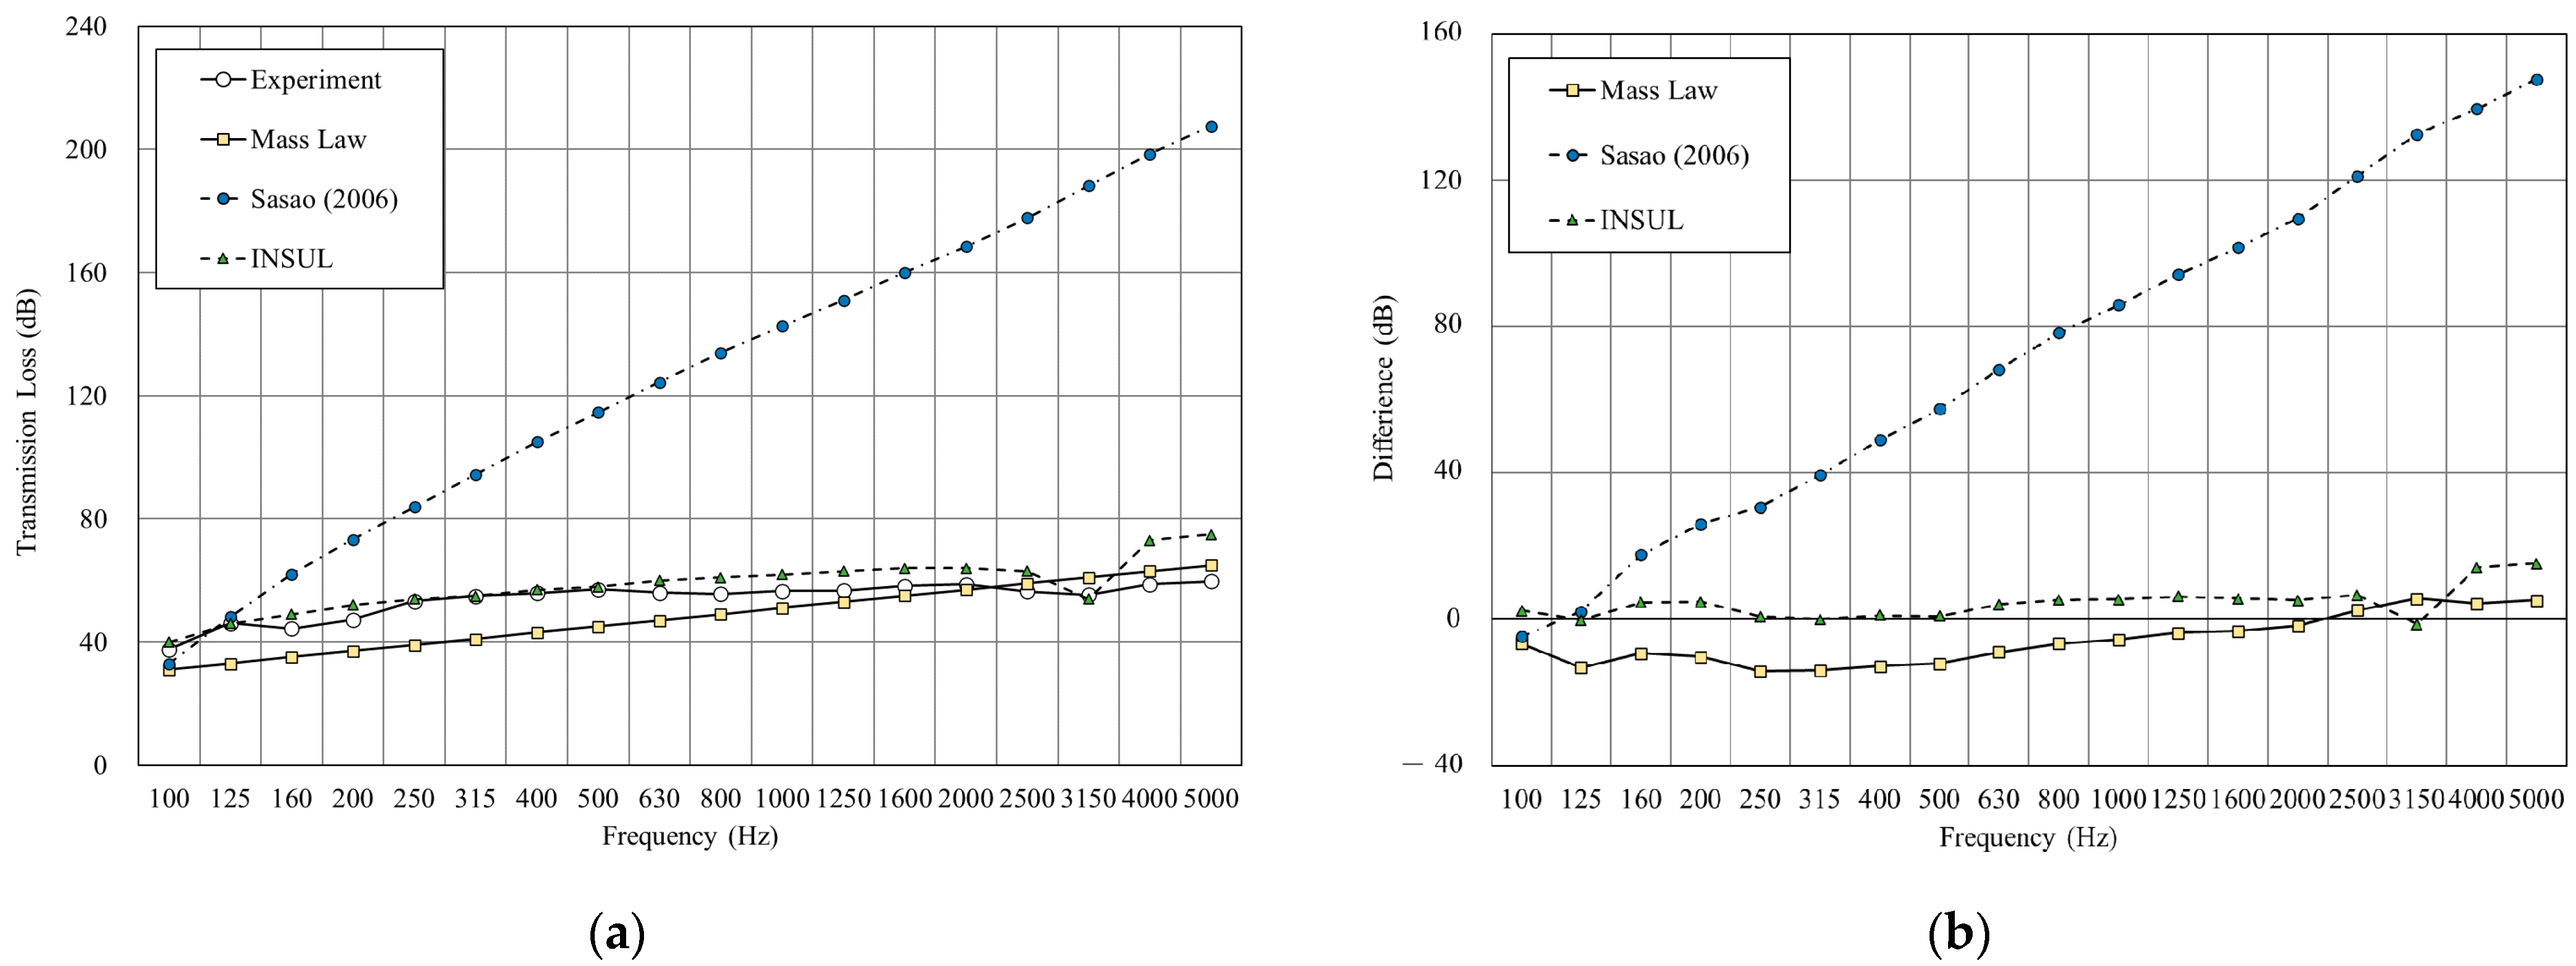
3.2.2. Sound Insulation Simulation and Analysis of CLT + GB
4. Conclusions
Author Contributions
Funding
Institutional Review Board Statement
Informed Consent Statement
Data Availability Statement
Conflicts of Interest
References
- Robertson, A.B.; Lam, F.C.; Cole, R.J. A comparative cradle-to-gate life cycle assessment of mid-rise office building construction alternatives: Laminated timber or reinforced Concrete. Buildings 2012, 2, 245–270. [Google Scholar] [CrossRef]
- Mohammad, M.; Gagnon, S.; Douglas, B.; Podesto, L. Introduction to cross laminated timber. Wood Des. Focus 2012, 22, 3–12. [Google Scholar]
- Tu, S.H. Contribution of Carbon Sequestration and Carbon Dioxide Reduction by Wooden Construction Buildings in Taiwan. Master’s Thesis, National Taiwan University, Taipei, Taiwan, 2007. [Google Scholar]
- Wang, S.Y.; Chi, M.Z.; Tu, S.H. The Contribution of Using Wood to Reduce Carbon Dioxide Emissions; Global Change Research Center National Taiwan University: Taipei, Taiwan, 2009; pp. 7–13. [Google Scholar]
- Karacabeyli, E.; Douglas, B. CLT Handbook; FPInnovations: Pointe-Claire, QC, Canada, 2013. [Google Scholar]
- Popovski, M.; Schneider, J.; Schweinsteiger, M. Lateral load resistance of cross laminated wood panels. In Proceedings of the World Conference on Timber Engineering, Trentino, Italy, 20–24 June 2010. [Google Scholar]
- Steiger, R.; Gülzow, A. Validity of bending tests on strip-shaped specimens to derive bending strength and stiffness properties of cross-laminated solid timber (X-lam). In Proceedings of the The Future of Quality Control for Wood and Wood Products, Edinburgh, UK, 4–7 May 2010. [Google Scholar]
- Silva, C.V.; Branco, J.M.; Lourenço, P.B. A Project Contribution to the Development of Sustainable Multi-storey Timber Buildings. In Proceedings of the Portugal SB13, Guimarães, Portugal, 30 October–1 November 2013. [Google Scholar]
- Brandner, R.; Flatscher, G.; Ringhofer, A.; Schickhofer, G.; Thiel, A. Cross laminated timber (CLT): Overview and development. Eur. J. Wood Wood Prod. 2016, 74, 331–351. [Google Scholar] [CrossRef]
- Jones, K.; Stegemann, J.; Sykes, J.; Winslow, P. Adoption of unconventional approaches in construction: The case of cross-laminated timber. Constr. Build. Mater. 2016, 125, 690–702. [Google Scholar] [CrossRef] [Green Version]
- Van De Kuilen, J.W.G.; Ceccotti, A.; Xia, Z.Y.; He, M. Very Tall Wooden Buildings with Cross Laminated Timber. Procedia Eng. 2011, 14, 1621–1628. [Google Scholar] [CrossRef] [Green Version]
- Digital Codes. Available online: https://codes.iccsafe.org/content/IBC2021P1/chapter-12-interior-environment#text-id-19067937 (accessed on 8 June 2021).
- Zhang, X.; Hu, X.; Gong, H.; Zhang, J.; Lv, Z.; Hong, W. Experimental study on the impact sound insulation of cross laminated timber and timber-concrete composite floors. Appl. Acoust. 2020, 161, 107173. [Google Scholar] [CrossRef]
- Meiken Lamwood Corp. Available online: https://www.pref.okayama.jp/uploaded/attachment/206226.pdf (accessed on 20 April 2021).
- Öqvist, R.; Ljunggren, F.; Ågren, A. On the uncertainty of building acoustic measurements—Case study of a cross-laminated timber construction. Appl. Acoust. 2012, 73, 904–912. [Google Scholar] [CrossRef]
- Wang, P.Y.; Chou, C.W.; Tsay, Y.S. Field study on the sound insulation performance of a CLT residential building in a subtropical climate. In Proceedings of the INTER-NOISE and NOISE-CON Congress and Conference Proceedings, Hong Kong, China, 27–30 August 2017. [Google Scholar]
- Storaenso. Soundproofing for CLT. Available online: https://www.storaenso.com/-/media/documents/download-center/documents/product-specifications/wood-products/clt-technical/soundproofing/soundproofing-for-clt-by-stora-enso-sweden-en.pdf (accessed on 8 June 2021).
- Schoenwald, S.; Zeitler, B.; Sabourin, I.; King, F. Sound insulation performance of Cross Laminated Timber Building Systems. In Proceedings of the INTER-NOISE and NOISE-CON congress and conference proceedings, Innsbruck, Austria, 27–30 August 2013. [Google Scholar]
- International Organization for Standardization. Acoustics—Rating of Sound Insulation in Buildings and of Building Elements—Part 1: Airborne sound Insulation; International Organization for Standardization: Geneva, Switzerland, 2013; ISO 717-1:2013. [Google Scholar]
- American Society for Testing and Materials. Classification for Rating Sound Insulation; American Society for Testing and Materials: West Conshohocken, PA, USA, 2016; ASTM E413-16. [Google Scholar]
- International Organization for Standardization. Acoustics—Measurement of Sound Insulation in Buildings and of Building Elements Using Sound Intensity—Part 1: Laboratory Measurements; International Organization for Standardization: Geneva, Switzerland, 2000; ISO 15186-1:2000. [Google Scholar]
- American Society for Testing and Materials. Standard Test Method for Laboratory Measurement of Airborne Transmission Loss of Building Partitions and Elements Using Sound Intensity; American Society for Testing and Materials: West Conshohocken, PA, USA, 2019; ASTM E2249-19. [Google Scholar]
- Sharp, B.H. Prediction Methods for the Sound Transmission of Building Elements. Noise Control Eng. 1978, 11, 53–63. [Google Scholar] [CrossRef]
- Sasao, H. Acoustic analysis of acoustic structural features using Excel (1) Analysis of sound absorption structure. Soc. Heat. Air Cond. Sanit. Eng. Jpn. 2006, 80, 779–789. (In Japanese) [Google Scholar]
- Sasao, H. Acoustic analysis of acoustic structural features using Excel (2) Analysis of sound absorption structure. Soc. Heat. Air Cond. Sanit. Eng. Jpn. 2006, 80, 919–927. (In Japanese) [Google Scholar]
- Sasao, H. Acoustic analysis of acoustic structural features using Excel (3) Analysis of sound absorption structure. Soc. Heat. Air Cond. Sanit. Eng. Jpn. 2006, 80, 1009–1016. (In Japanese) [Google Scholar]
- INSUL. Available online: http://www.insul.co.nz/media/30049/Insul-Manual-2017-word-version.pdf (accessed on 8 June 2021).


| Material | Thickness (mm) | Size(mm) | Density(kg/m3) | Young’s Modulus (GPa) | Poisson Ratio | Friction Loss (N·s/m4) |
|---|---|---|---|---|---|---|
| CLT | 120 | 750 × 1500 | 441 | 5.25 | 0.4 | - |
| Gypsum | 12 | 710 | 2 | 0.4 | - | |
| Glass wool | 25/50/75 | 48 | - | - | 27,000 |
| Type | No. | Materials (Thickness, mm) | Total Thickness (mm) | ||||||
|---|---|---|---|---|---|---|---|---|---|
| Layer 1 | Layer 2 | Layer 3 | Layer 4 | Layer 5 | Layer 6 | Layer 7 | |||
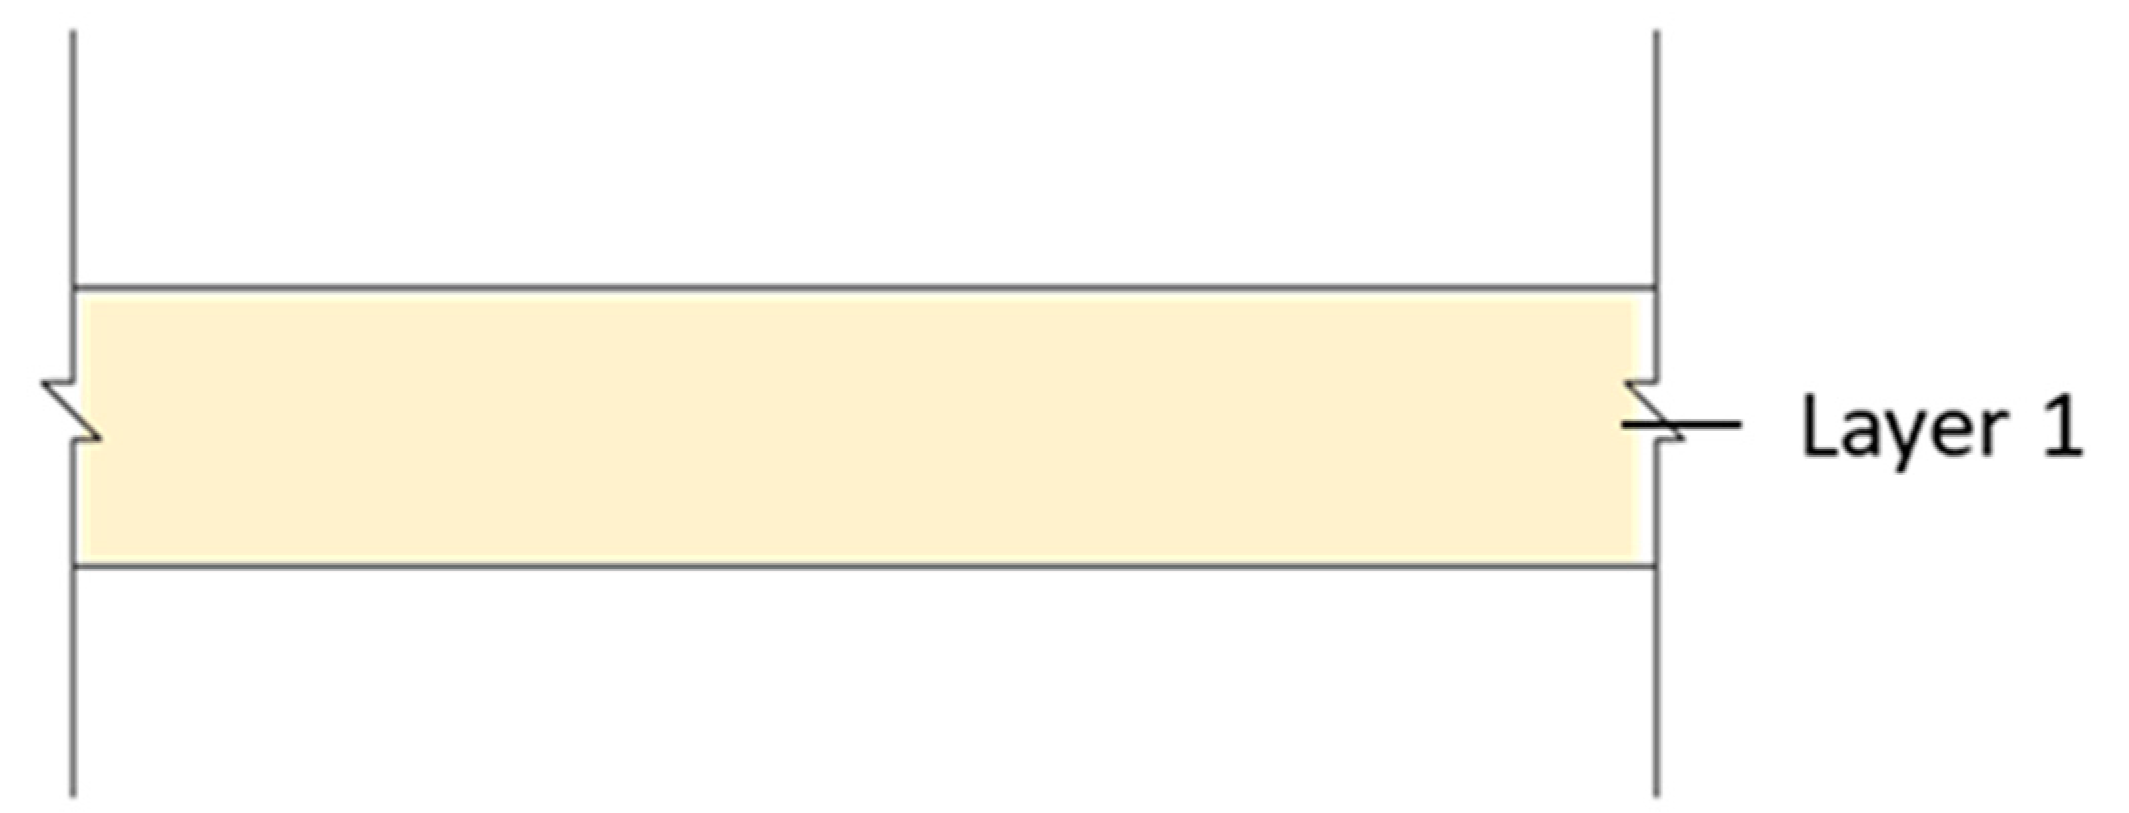
| Single wall | A1 | CLT (120) | - | - | - | - | - | - | 120 |
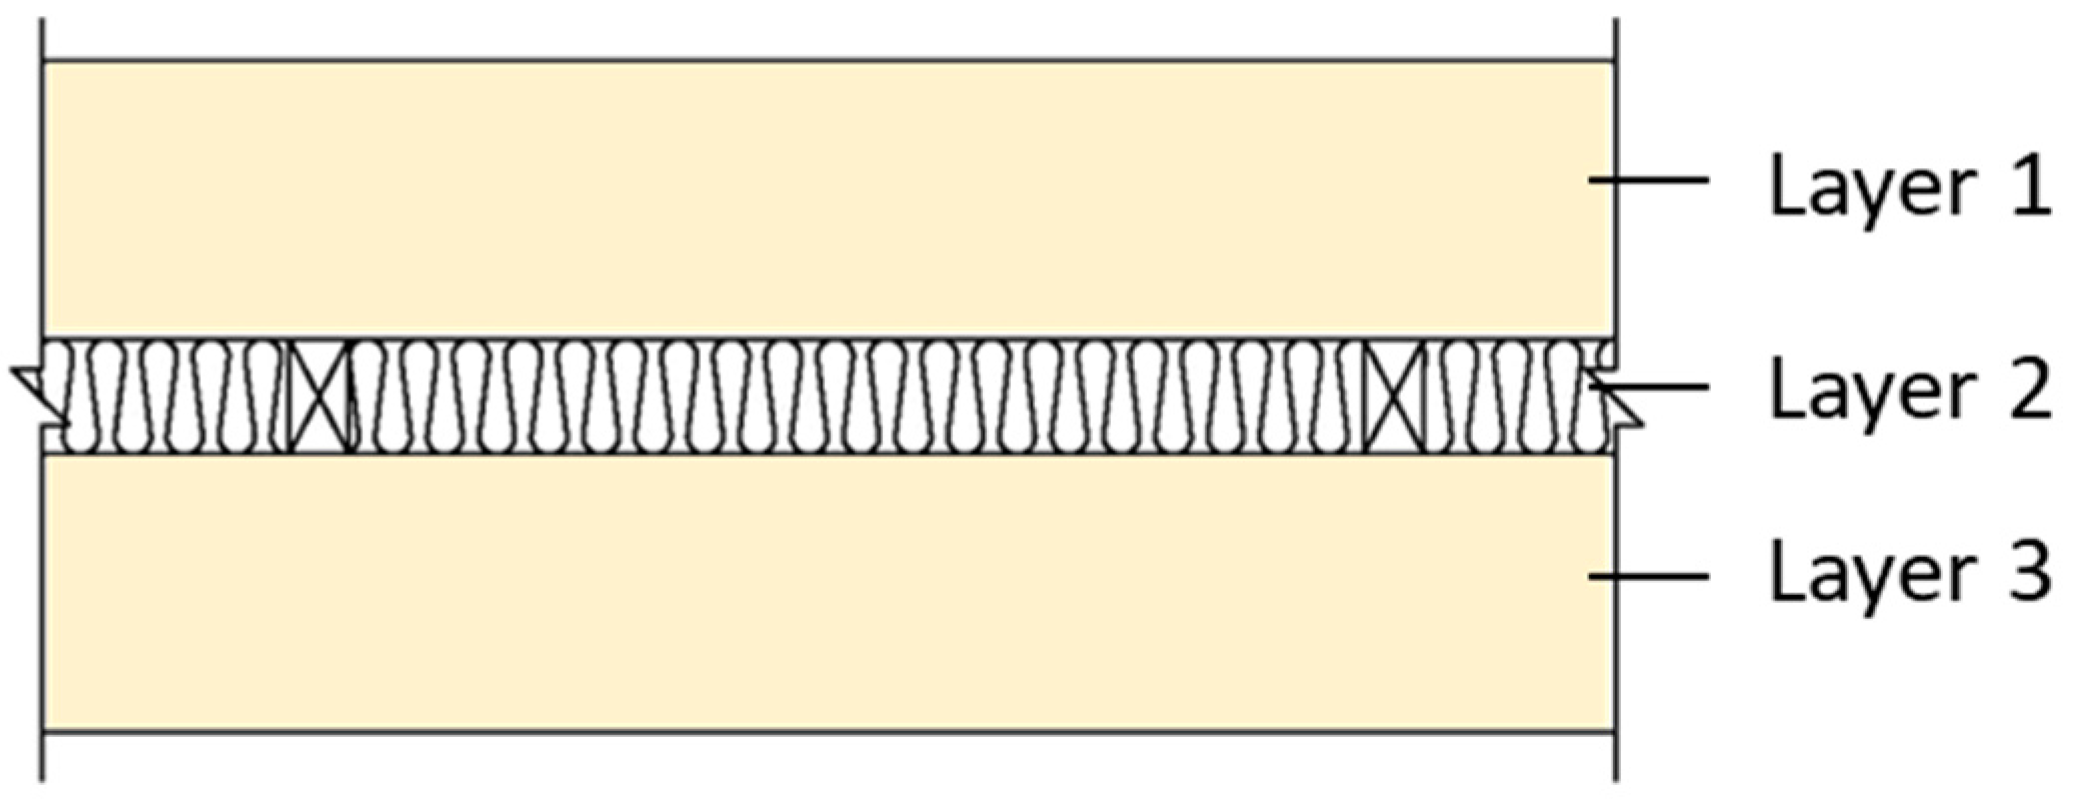
| Double wall | B1 | CLT (120) | Cavity (25) | CLT (120) | - | - | - | - | 265 |
| B2 | Glass wool (25) | ||||||||
| B3 | CLT (120) | Cavity (50) | CLT (120) | - | - | - | - | 290 | |
| B4 | Glass wool (25) in cavity (50) | ||||||||
| B5 | Glass wool (50) | ||||||||
| B6 | CLT (120) | Cavity (75) | CLT (120) | - | - | - | - | 315 | |
| B7 | Glass wool (25) in cavity (75) | ||||||||
| B8 | Glass wool (75) | ||||||||
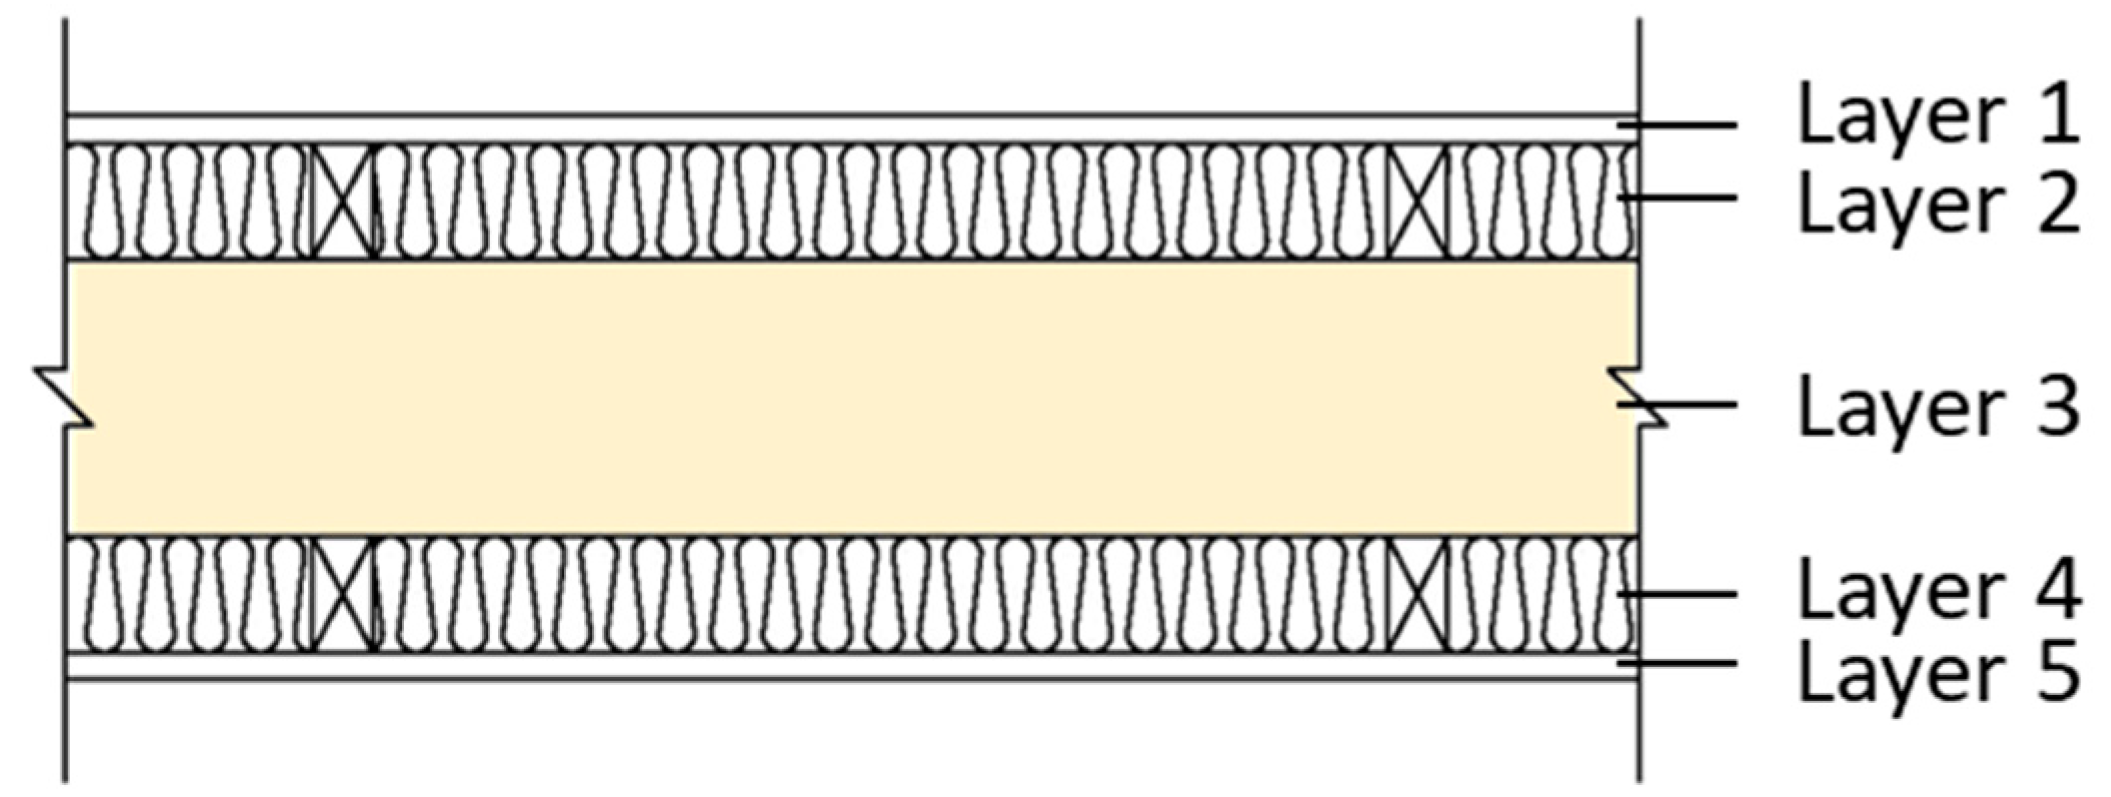
| CLT + GB | C1 | Gypsum (12) | Cavity (25) | CLT (120) | Cavity (25) | Gypsum (12) | - | - | 194 |
| C2 | Glass wool (25) | Glass wool (25) | |||||||
| C3 | Gypsum (12) | Cavity (50) | CLT (120) | Cavity (50) | Gypsum (12) | 244 | |||
| C4 | Glass wool (50) | Glass wool (50) | |||||||
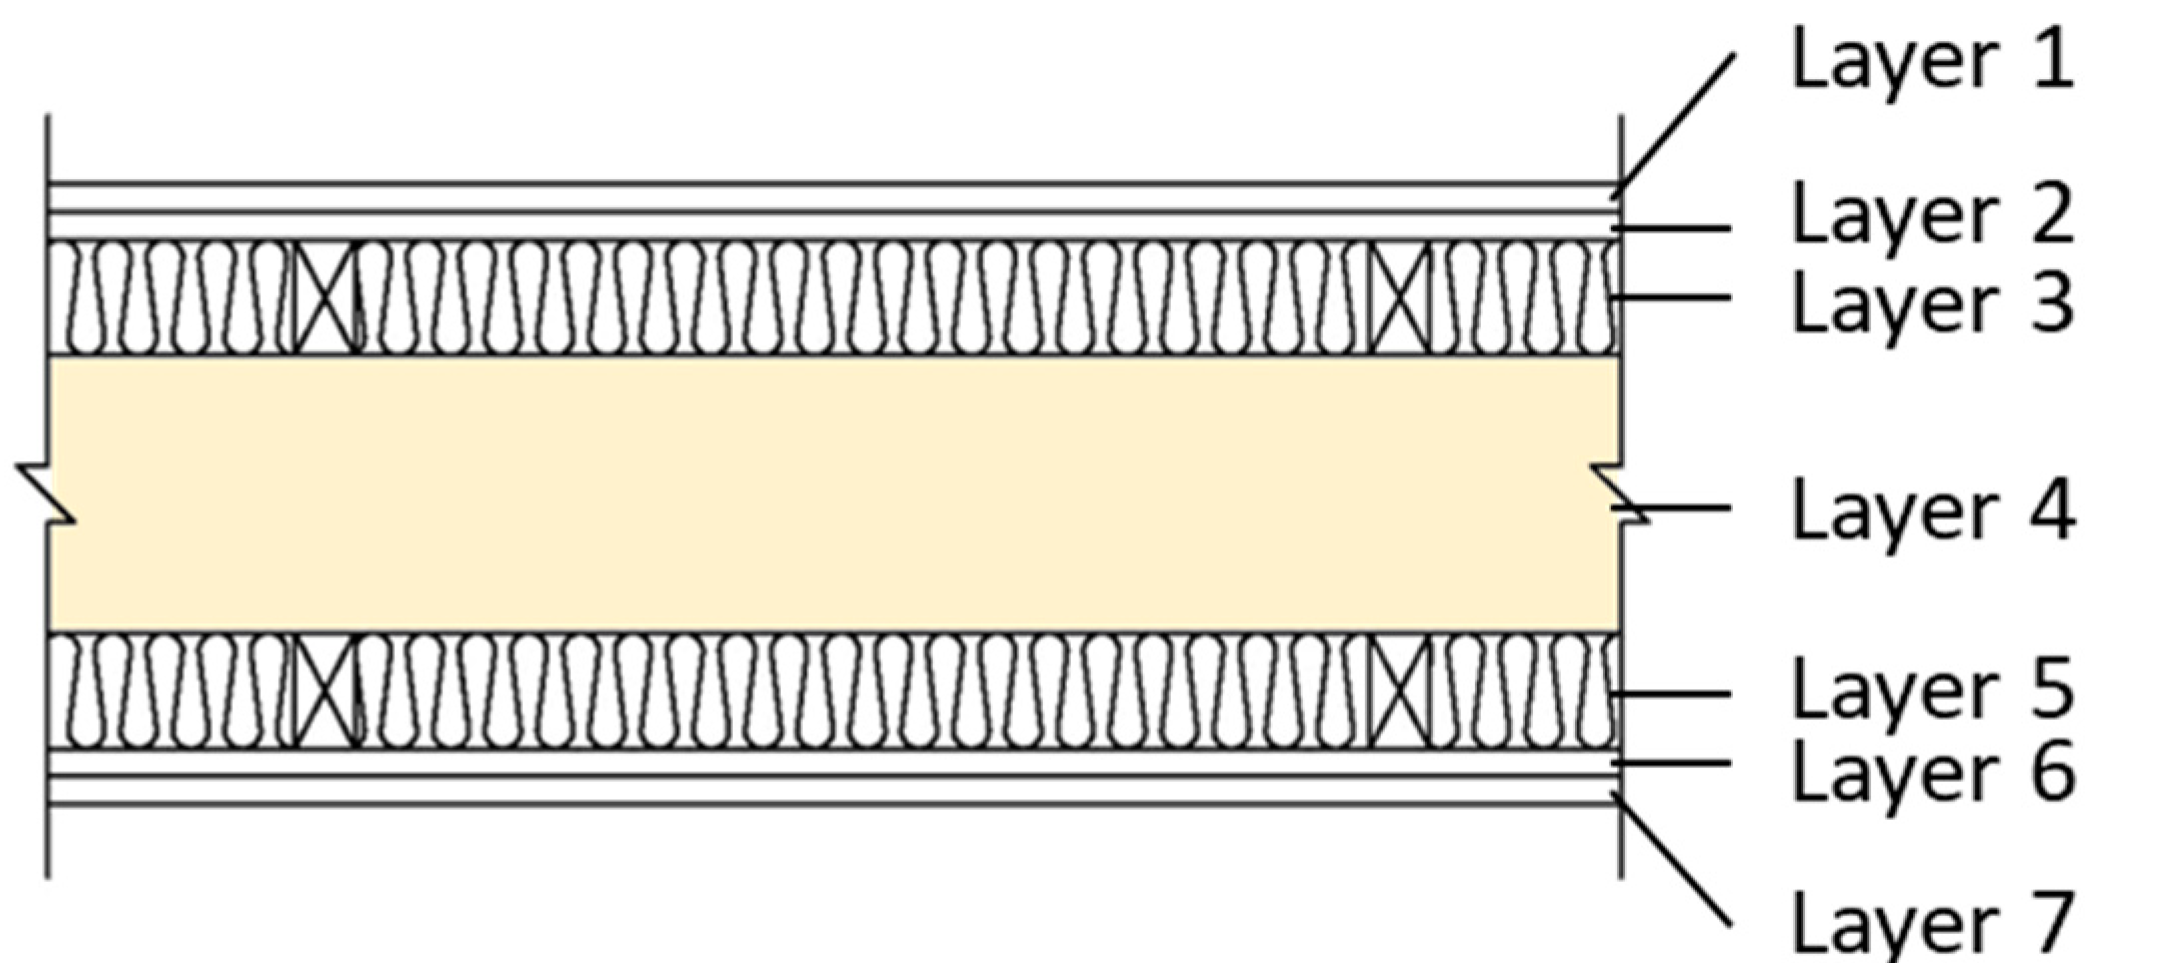
| C5 | Gypsum (12) | Gypsum (12) | Glass wool (50) | CLT (120) | Glass wool (50) | Gypsum (12) | Gypsum (12) | 268 | |
| Type | Single Wall | Double Wall | CLT + GB | |||||||||||
|---|---|---|---|---|---|---|---|---|---|---|---|---|---|---|
| No. | A1 | B1 | B2 | B3 | B4 | B5 | B6 | B7 | B8 | C1 | C2 | C3 | C4 | C5 |
| Total thickness (mm) | 120 | 265 | 290 | 315 | 194 | 244 | 268 | |||||||
(dB) | 45 | 50 | 51 | 50 | 50 | 50 | 51 | 50 | 52 | 49 | 53 | 53 | 55 | 57 |
| STC | 45 | 50 | 51 | 50 | 50 | 50 | 51 | 50 | 52 | 46 | 54 | 54 | 56 | 57 |
| Prediction Tool | Double Layer Structure | CLT + GB |
|---|---|---|
| Mass law | Applicable | 1. Not applicable under 2000 Hz 2. Applicable for 2000 Hz~500 Hz |
| Sharp (1978) | Applicable | - |
| Sasao (2006) | Not applicable | Not applicable |
| INSUL | Not applicable | Applicable |
Publisher’s Note: MDPI stays neutral with regard to jurisdictional claims in published maps and institutional affiliations. |
© 2021 by the authors. Licensee MDPI, Basel, Switzerland. This article is an open access article distributed under the terms and conditions of the Creative Commons Attribution (CC BY) license (https://creativecommons.org/licenses/by/4.0/).
Share and Cite
Lin, J.-Y.; Yang, C.-T.; Tsay, Y.-S. A Study on the Sound Insulation Performance of Cross-laminated Timber. Materials 2021, 14, 4144. https://doi.org/10.3390/ma14154144
Lin J-Y, Yang C-T, Tsay Y-S. A Study on the Sound Insulation Performance of Cross-laminated Timber. Materials. 2021; 14(15):4144. https://doi.org/10.3390/ma14154144
Chicago/Turabian StyleLin, Jui-Yen, Chieh-Ting Yang, and Yaw-Shyan Tsay. 2021. "A Study on the Sound Insulation Performance of Cross-laminated Timber" Materials 14, no. 15: 4144. https://doi.org/10.3390/ma14154144
APA StyleLin, J.-Y., Yang, C.-T., & Tsay, Y.-S. (2021). A Study on the Sound Insulation Performance of Cross-laminated Timber. Materials, 14(15), 4144. https://doi.org/10.3390/ma14154144