Article

Mechanism of Unusual Isosymmetric Order-Disorder Phase Transition in [Dimethylhydrazinium]Mn(HCOO)3 Hybrid Perovskite Probed by Vibrational Spectroscopy

by
Jan Albert Zienkiewicz
1,
Edyta Kucharska
2 and
Maciej Ptak
1,*
1
Institute of Low Temperature and Structure Research, Polish Academy of Sciences, Okólna 2 Str., 50-422 Wrocław, Poland
2
Department of Bioorganic Chemistry, Faculty of Production Engineering, Wroclaw University of Economics and Business, Komandorska 118/120 Str., 53-345 Wrocław, Poland
*
Author to whom correspondence should be addressed.
Materials 2021, 14(14), 3984; https://doi.org/10.3390/ma14143984
Submission received: 22 June 2021 / Revised: 13 July 2021 / Accepted: 14 July 2021 / Published: 16 July 2021
(This article belongs to the Special Issue Synthesis, Structure, and Spectral Properties of Perovskite Materials)

Abstract

:
[DMHy]Mn(HCOO)3 (DMHy+ = dimethylhydrazinium cation) is an example of an organic–inorganic hybrid adopting perovskite-like architecture with the largest organic cation used so far in the synthesis of formate-based hybrids. This compound undergoes an unusual isosymmetric phase transition at 240 K on heating. The mechanism of this phase transition has a complex nature and is mainly driven by the ordering of DMHy+ cations and accompanied by a significant distortion of the metal–formate framework in the low temperature (LT) phase. In this work, the Density Functional Theory (DFT) calculations and factor group analysis are combined with experimental temperature-dependent IR and Raman studies to unequivocally assign the observed vibrational modes and shed light on the details of the occurring structural changes. The spectroscopic data show that this first-order phase transition has a highly dynamic nature, which is a result of balanced interplay combining re-arrangement of the hydrogen bonds and ordering of DMHy+ cations. The tight confinement of organic cations forces simultaneous steric deformation of formate ions and the MnO6 octahedra.

Graphical Abstract

1. Introduction

3D hybrid metal–formate perovskites, a class of multifunctional materials described by the general formula [A]MII(HCOO)3, where A is an ammonium cation and MII denotes a divalent metal cation, caught the attention of materials scientists in a few recent years because of their unusual luminescent, [1,2] ferroelastic, [3,4] ferroelectric, [5,6,7] dielectric, [2,4,8] magnetic [2,9,10] or multiferroic [3,11,12,13] properties. These properties originate from order-disorder phase transitions (PTs) that enable utilizing them as molecular switches [14,15,16].
Up to date, hydrazine and its derivatives were used only a few times as templating agents in the synthesis of formate-based hybrids. Since the hydrazinium cation (Hy+) has a small size, [Hy]MII(HCOO)3 compounds with MII = Mn2+, Zn2+ and Fe2+ can adopt two types of structure, namely 412·63 perovskite-like with cubic cavities or 49·63 chiral with hexagonal channels [17,18,19]. Analogues comprising Co2+ and Mg2+ ions were found to adopt only chiral architecture. [Hy]MII(HCOO)3 perovskites undergo an order-disorder PT near 350 K from the LT ferroelectric Pna21 to the high-temperature (HT) paraelectric Pnma phase. However, chiral analogues transform from the ferroelectric P212121 LT to the ferroelectric P63 HT phase in the 336–380 K range. The chiral [Hy]Mn(HCOO)3 adopts exceptionally the P21 LT symmetry and exhibits lower PT temperature, 296 K [17,18,19].
The increased size of the methylhydrazinium cation (MHy+) affects the crystal structure, and only perovskite-like architecture is preferred for [MHy]MII(HCOO)3 (MII = Mn2+, Mg2+, Fe2+, Zn2+) [20]. All MHy+ analogues experience two PTs. The first one occurs in the 168–243 K range from the LT polar phase of P1 symmetry to the intermediate polar R3c phase, whereas the second one, near 310–327 K, to the paraelectric HT R 3 ¯ c phase [20].
Further increase in the cation size caused by the presence of the second methyl group leads to complete suppression of non-centrosymmetric structures in [DMHy]Mn(HCOO)3, (DMHy+ denotes 1,1-dimethylhydrazinium cation). This crystal, recently synthesized by us, exhibits unusual order-disorder PT among metal–formate hybrids [2]. In fact, [DMHy]Mn(HCOO)3 is the first example of a formate-based perovskite that does not change the space group symmetry as a result of LT ordering. Therefore, it is of great importance to elucidate the mechanism of this PT in detail and focus on the hydrogen bond (HB) interactions. Furthermore, DMHy+ cation is the largest organic cation successfully used in the synthesis of formate-based hybrids. The tolerance factor of [DMHy]Mn(HCOO)3 perovskite is at the theoretically predicted limit by Kieslich et al. [21], making this compound an interesting model for structure-stability considerations.
It is well-known that vibrational spectroscopy, as a support for X-ray diffraction methods, is commonly used to shed some light on the dynamical properties and mechanisms of PTs occurring in hybrid organic–inorganic perovskites. A great advantage of Raman and IR spectroscopy is its high sensitivity to local structural changes involving dynamics of light atoms that are responsible for the formation of HBs. Since the arrangement of HBs is usually strongly affected during PTs, detailed studies of phonon properties can give access to structural information not available using other probing techniques.
IR and Raman studies were used to understand PT mechanisms observed in Hy+ and MHy+ analogues [18,20]. Therefore, we have decided to undertake similar studies for [DMHy]Mn(HCOO)3 and compare its phonon properties to former compounds. Detailed temperature-dependent studies with small temperature increments allowed to obtain deeper insight into structural changes occurring in this compound at 244.4 K (283.0 K) on cooling (heating) [2] and to elucidate the main driving force of the PT. It is worth adding that the P21/nP21/n isosymmetric PT is also interesting from the spectroscopic point of view because weak changes of vibrational selection rules are expected in spite of significant structural changes and the associated high change of entropy [2]. Moreover, the isosymmetric and isostructural PTs occurring in the coordination polymers are still poorly understood [16,22,23,24,25,26,27,28,29].
The main goal of this paper is to analyse the phonon properties of [DMHy]Mn(HCOO)3 as a function of temperature. We propose an assignment of the observed IR and Raman bands based on literature data for Hy+ and MHy+ analogues supported by DFT calculations reported in this paper for DMHy+ cation. We show that the presence of an additional methyl group significantly affects the phonon properties of [DMHy]Mn(HCOO)3. In the discussion of temperature-dependent spectra, particular attention is paid to the factor group analysis in order to obtain deep insight into the PT mechanism.

2. Materials and Methods

2.1. Materials and Synthesis

The 1,1-dimethylhydrazine (Sigma-Aldrich, Saint Louis, MO, USA), formic acid (85%, Avantor Performance Materials Poland, Gliwice, Poland), anhydrous methanol (Sigma-Aldrich, Saint Louis, MO, USA) and manganese(II) perchlorate hexahydrate (Sigma-Aldrich, Saint Louis, MO, USA) were purchased from commercial sources and used without further purification.
The cubic transparent crystals of [DMHy]Mn(HCOO)3 were obtained from a sealed and undisturbed mixture of two solutions. The first containing 40 mmol (ca. 3 mL) of 1,1-dimethylhydrazine dissolved in 10 mL of methanol with the addition of 160 mmol (7.25 mL) of HCOOH and the second, composed of 1 mmol (0.3619 g) of Mn(ClO4)2·6H2O dissolved in 10 mL of methanol. Further details can be found in [2].

2.2. Raman ad IR Spectroscopy

A room-temperature (RT) Raman spectrum of the polycrystalline sample was measured in the 4000–75 cm−1 range using a FT 100/S spectrometer with YAG:Nd laser excitation at 1064 nm (Bruker, Billerica, MA, USA). The temperature-dependent (80–400 K) Raman spectra of a randomly oriented single crystal in the 3500–50 cm−1 range were measured using a Renishaw inVia Raman spectrometer (Renishaw, Wotton-under-Edge, UK), equipped with confocal DM2500 Leica optical microscope, a thermoelectrically cooled CCD as a detector and an Ar+ ion laser operating at 488 nm. The temperature was controlled using a THMS600 stage (Linkam Scientific Instruments Ltd., Epsom, Tadworth, UK).
An RT polycrystalline IR spectrum in the range of 4000–400 cm−1 (mid-IR) was measured using a Nicolet iS50 infrared spectrometer (Thermo Fisher Scientific, Waltham, MA, USA) as a suspension in nujol (mineral oil) and Fluorolube (Sigma-Aldrich, Saint Louis, MO, USA). Additional mid-IR spectrum was recorded using an ATR module and diamond crystal. A far-IR spectrum in the range of 650–50 cm−1 was measured on a polyethylene plate as a suspension in nujol. The temperature-dependent (80–400 K) IR spectra in the 4000–650 cm−1 range were measured using a Nicolet iN10 infrared microscope (Thermo Fisher Scientific, Waltham, MA, USA). The temperature was controlled using a THMS600 stage equipped with ZnSe windows (Linkam Scientific Instruments Ltd., Epsom, Tadworth, UK).

2.3. Quantum Chemical Calculations

The geometry optimization of the molecular structure of dimethylhydrazine molecule (DMHy) and DMHy+ cation was performed using a Gaussian 03 package [30]. All calculations were carried out using density functional three-parameters hybrid (B3LYP) methods [31,32,33] with the 6-311G(2d,2p) [34,35] basis set starting from the X-ray geometry taken from [2]. The harmonic and anharmonic vibrational wavenumbers were also calculated. The calculated harmonic frequencies were scaled using scaling factors (0.96 and 0.98) to correct the evaluated wavenumbers for vibrational anharmonicity and deficiencies inherent to the used computational level. The potential energy distribution (PED) of the normal modes among the respective internal coordinates was calculated for studied compounds using the BALGA program [36]. The data from DFT calculations were input into the BALGA program. The theoretical Raman intensities were calculated using the Chemcraft program [37] that was also used for the visualization of molecules.

3. Results

3.1. Crystal Structure and Geometry Optimization

Both LT and HT phases of [DMHy]Mn(HCOO)3 are described by the P21/n monoclinic symmetry [2]. The crystal structure is built from the manganese–formate 3D framework forming pseudo-cubic voids that accommodate the DMHy+. Organic cations balance the negative charge of the manganese–formate framework and are bonded by medium strength HBs. In the HT phase, DMHy+ cations exhibit a threefold disorder, while in the LT phase, disorder is no longer observed (Figure 1). In the LT phase, the Mn2+ centres occupy only one C1 (4e) site, whereas, in the HT phase, they are distributed equally into two Cs sites (2a and 2d) [2]. All remaining atoms in both phases occupy C1 sites (4e).
The results of geometry optimisation performed for DMHy+ and DMHy are presented in Table S1. Figure S1 presents the numbering of atoms used for calculations. The calculated skeletal N1–N4, N4–C5 and N4–C10 distances (1.450, 1.504 and 1.503 Å, respectively) for DMHy+ are in good agreement with experimental values obtained using X-ray diffraction methods, i.e., 1.428(6)–1.482(6), 1.398(10)–1.538(8) and 1.476(10)–1.538(8) Å at 300 K and 1.447(3), 1.488(4) and 1.490(4) at 100 K, respectively [2]. The calculated N1–N4–C5, N1–N4–C10 and C5–N4–C10 angles for DMHy+ are equal to 115.46, 108.69 and 112.70°, respectively, and correspond well to ranges of values obtained for crystal structures solved at 100 K (109.0(2)–114.2(2)°) [2]. The calculated lengths of C–H and N–H bonds are higher in comparison to the experimental ones, but this is an expected effect caused by imprecise positioning of H atoms by crystallographic methods and by in vacuo character of performing calculations.
The optimised geometry of the DMHy molecule is similar to DMHy+. However, the N–C distances seem to be more sensitive than the N–N one to the presence of proton bonded to N4. The lack of proton causes the shortening of N–C and N–N bonds by 3.2% and 1.3%, respectively.

3.2. Selection Rules and Factor Group Analysis

All 30 vibrational degrees of freedom for DMHy can be subdivided into 11 stretching and 19 bending modes. The stretching (ν) modes can be roughly described as 4 × νasCH3 (antisymmetric), 2 × νsCH3 (symmetric), νasNH2, νsNH2, νasCNC, νsCNC and νNN. The deformational modes can be described as 4 × δasCH3, 2 × δsCH3, 4 × ρCH3 (rocking) and 2 × τCH3 (twisting), δNH2 (bending), ρNH2, ωNH2(wagging), τNH2, 2 × δCNN and δCNC.
The additional proton bonded to the N4 atom in DMHy+ increases the number of vibrational degrees of freedom to 33. Apart from the vibrations mentioned above, there are three additional vibrations involving the N4-H+ group, namely νNH+, δNH+ (in-plane) and γNH+ (out-of-plane bending).
IR and Raman spectra of [DMHy]Mn(HCOO)3 can be understood by subdividing all Brillouin zone-centre vibrations into internal and external (lattice vibrations). The six internal vibrations of free formate ion (see Table S2) are described as νCH (ν1), νsCO (ν2) (symmetric stretching), νasCO (ν4) (antisymmetric stretching), δOCO (ν3), δCH (ν5) and γCH (ν6) [38]. The 12 formate ions in the primitive cell of [DMHy]Mn(HCOO)3 give rise to 72 internal modes (18Ag + 18Au + 18Bg + 18Bu) in both the LT and HT phases. The number of expected translational (T’) and librational (L) modes of formate ions is 36 each (9Ag + 9Au + 9Bg + 9Bu).
A free DMHy+ cation has Cs symmetry similar to isopropylamine [39], and therefore, the symmetries of particular vibrations can be derived (see Table S2). Thus, the 18A′ + 15A″ normal vibrations exhibit factor group splitting to 132 modes (33Ag + 33Au + 33Bg + 33Bu) in the studied crystal. The translations and librations of DMHy+ give rise to 12 modes each (3Ag + 3Au + 3Bg + 3Bu). Although the DMHy+ cations are disordered in the HT phase, the total number of their theoretically predicted modes do not change during PT.
The symmetry of Mn2+ translations is different for both phases because of occupied sites. In the LT (ordered) phase, the number of expected translations is 12 and distributed into 3Ag + 3Au + 3Bg + 3Bu. In the HT phase, the total number is unchanged, however, is distributed into 6Au + 6Bu modes. In both phases, three of these translational modes (Au + 2Bu) are acoustic, thus cannot be detected using IR and Raman spectroscopy.
To conclude, the total number of expected optical modes is 309 (75Ag + 80Au + 75Bg + 79Bu) in the HT phase, as well as in the LT phase (78Ag + 77Au + 78Bg + 76Bu). All g-symmetry modes are Raman-active, and u-symmetry modes are IR-active. Therefore, the number of expected Raman and IR bands is 150 (75Ag + 75Bg) and 159 (80Au + 79Bu) in the HT phase, respectively, and 156 (78Ag + 78Bg) and 153 (77Au + 76Bu) in the LT phase, respectively. It should be added that because u-symmetry modes are solely IR-active, the T’(Mn2+) is not detectable in the Raman spectrum of the HT phase.

3.3. DFT Calculations

The calculated wavenumbers, together with PEDs, are listed in Table S3. The theoretical spectra calculated in harmonic and anharmonic approximations are presented in Figure S2. The results of DFT calculations for DMHy showed that 21 vibrational modes have a nearly pure (96% and higher) contribution of a single vibration, 4 modes have the main contribution with PED ranging from 71% to 81%, and the remaining 5 modes have more complex origin. The protonation causes stronger coupling of observed modes, i.e., 15 bands have close to pure contribution (95% or higher), 13 bands have a clearly dominant contribution (63–89%), and 3 bands exhibit stronger coupling. Furthermore, the protonation-induced shifts of some bands are evidenced. For instance, the strongest downshifts in harmonic approximation are observed for the νsNH2 (by 125 cm−1) and νsCH3 (by 163–169 cm−1) modes. This is an interesting behaviour since their antisymmetric counterparts are less sensitive and downshifted only by 24 and 61–106 cm−1.
The largest differences between harmonic and anharmonic wavenumbers are observed for both DMHy and DMHy+ for bands originating from the νNH2 and νCH3 vibrations. Interestingly, anharmonicity in DMHy is stronger for νsCH3 (downshifts up to 182 cm−1) than for νasCH3 (downshifts in the 125–153 cm−1 range) and comparable for νsNH2 (downshifts by 197 cm−1) and νasNH2 (downshift by 188 cm−1) counterparts. For DMHy+, the tendency observed for νCH3 is opposite, namely νsCH3 and νasCH3 are downshifted by 100–103 and 143–144 cm−1, respectively. Among νNH2 vibrations, the stronger anharmonicity is observed for νasNH2 (downshift by 167 cm−1) and for νsNH2 (downshift by 107 cm−1). The anharmonicity of νNH+ is comparable to that observed for νasNH2 and reaches a value of 157 cm−1. Furthermore, τNH2 and τCH3 vibrations of DMHy exhibit negative anharmonic shifts (from −18 to −40 cm−1). This effect is not evidenced for DMHy+; therefore, the high sensitivity of bands assigned to νNH2, νCH3, τNH2 and τCH3 to the protonation may be related to their stronger intrinsic anharmonicity.

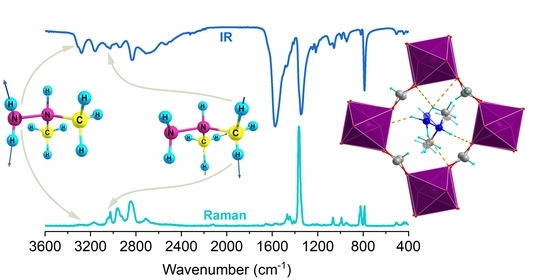
3.4. Room-Temperature IR and Raman Spectra and Assignment of Bands

RT polycrystalline IR and Raman spectra are presented in Figure 2. The proposed assignment of the observed bands, based on comparative analysis and DFT data, is listed in Table 1. The assignment of the bands corresponding to formate ions is straightforward since internal vibrations of formate ions are commonly observed in narrow spectral ranges for other members of the large [A]Mn(HCOO)3 (A = protonated amine) family. For instance, the ν1, ν2, ν3, ν4, ν5 and ν6 modes were previously observed in the 2827–2888, 1352–1364, 789–805, 1562–1594, 1368–1387 and 1063–1071 cm−1 ranges, respectively, for analogues with A = Hy+ [18], MHy+ [20] and dimethylammonium cation [40]. Thus, we assign the IR and Raman bands of [DMHy]Mn(HCOO)3 observed in the 2826–2858, 1342–1352, 788–792, 1560–1593, 1363–1365 and 1056–1065 cm−1 ranges to ν1–ν6 vibrations, respectively. The assignment of the bands corresponding to DMHy+ in [DMHy]Mn(HCOO)3 crystal is based on our DFT calculations and previous ab initio calculations for DMHy molecule performed by Durig et al. [41]. The positions of νasCH3, νsCH3, νasNH2 and νsNH2 bands for [DMHy]Mn(HCOO)3 are in good agreement with the calculations. Weak bands between 3039 and 3054 cm−1, not present for DMHy, were assigned to νNH+. They are expected to be observed at lower wavenumbers than νasNH2 and νsNH2 bands because the –NH+ group is able to form stronger HBs [2]. The remaining stretching vibrations, νasCNC, νsCNC and νNN, are located in the 990–1002, 820–832 and 1089–1098 cm−1 range, respectively. The position of the νsCNC bands is in good agreement with previous studies, i.e., this band was observed at 874 cm−1 for [MHy]Mn(HCOO)3 [20], 877 cm−1 for [MHy]Mn(H2POO)3 [42], 868 and 871 cm−1 for [MHy]PbBr3 [43] and 881 cm−1 for [MHy]PbCl3 [44]. The antisymmetric counterpart was previously observed at 1010 cm−1 for [MHy]Mn(H2POO)3 [42], 1004 cm−1 for [MHy]PbBr3 [43] and 1011 cm−1 for [MHy]PbCl3 [44]. For the [MHy]Mn(HCOO)3 crystal, this vibration was assigned to bands observed near 1092 cm−1 [20], but our DFT and previous ab initio calculations [41] showed that bands observed in the 1089–1098 cm−1 range for [DMHy]Mn(HCOO)3 originate from νNN. This mismatch relates to a different division into normal vibrations of the skeleton.
The assignment of bending vibrations of the skeleton is undoubted since they cover the spectral range free of any other vibrational bands. In this manner, bands in the 419–442 and 504–507 cm−1 were ascribed to δCNN and δCNC, respectively. The lack of δCNC bands for MHy+ analogues and the presence of δCNN ranging from 437–444 cm−1 [20,42,43] confirms this assignment.
The bending vibrations of the amino group are expected to be broader than bands corresponding to the methyl group, and therefore, we assign bands observed in the 1639–1654 range to δNH2. For other formate perovskites, they were observed in similar ranges, i.e., 1589–1654 cm−1 [20]. For non-formate analogues, the bending vibrations of protonated amino groups were observed 21–55 cm−1 lower than δNH2 [42,43]. Therefore, in the case of [MHy]Mn(H2POO)3, the δNH+ bands are expected to coincide with bands corresponding to the ν4 vibrations of formate ions. The distinction between the broad ρNH2, ωNH2 and τNH2 bands is more tentative in the literature, but our DFT results and previous ab initio calculations [41] are in good agreement. We found these vibrations in the 1342–1352, 937–958 and 219–282 cm−1 ranges, respectively. According to our DFT data, the γNH+ vibration is expected to contribute to bands at 1374 (1396) cm−1 and 1419 (1422) cm−1 in an anharmonic (scaled harmonic) model. Therefore, we assign weak and broad bands in the 1411–1439 cm−1 range to this vibration.
Vibrations of the methyl groups are expected to be less sensitive to the surroundings than vibrations of the amino groups. The bending modes (δasCH3 and δsCH3) can be assigned to the IR and Raman bands observed in the 1445–1480 and 1411–1439 cm−1 range, respectively. They were previously observed in similar ranges, i.e., 1454–1478 and 1421–1433 cm−1 [20,42]. The ρCH3 and τCH3 bands were found between 1098 and 1246 cm−1, as well as between 219–282 cm−1, respectively. These ranges are in a good agreement with reported values for [MHy]Mn(HCOO)3 and [MHy]Mn(H2POO)3, namely 1092–1234 cm−1 (ρCH3) and 210–237 cm−1 (τCH3) [20,42]. Bands located below 240 cm−1 are assigned to lattice modes (Table 1).

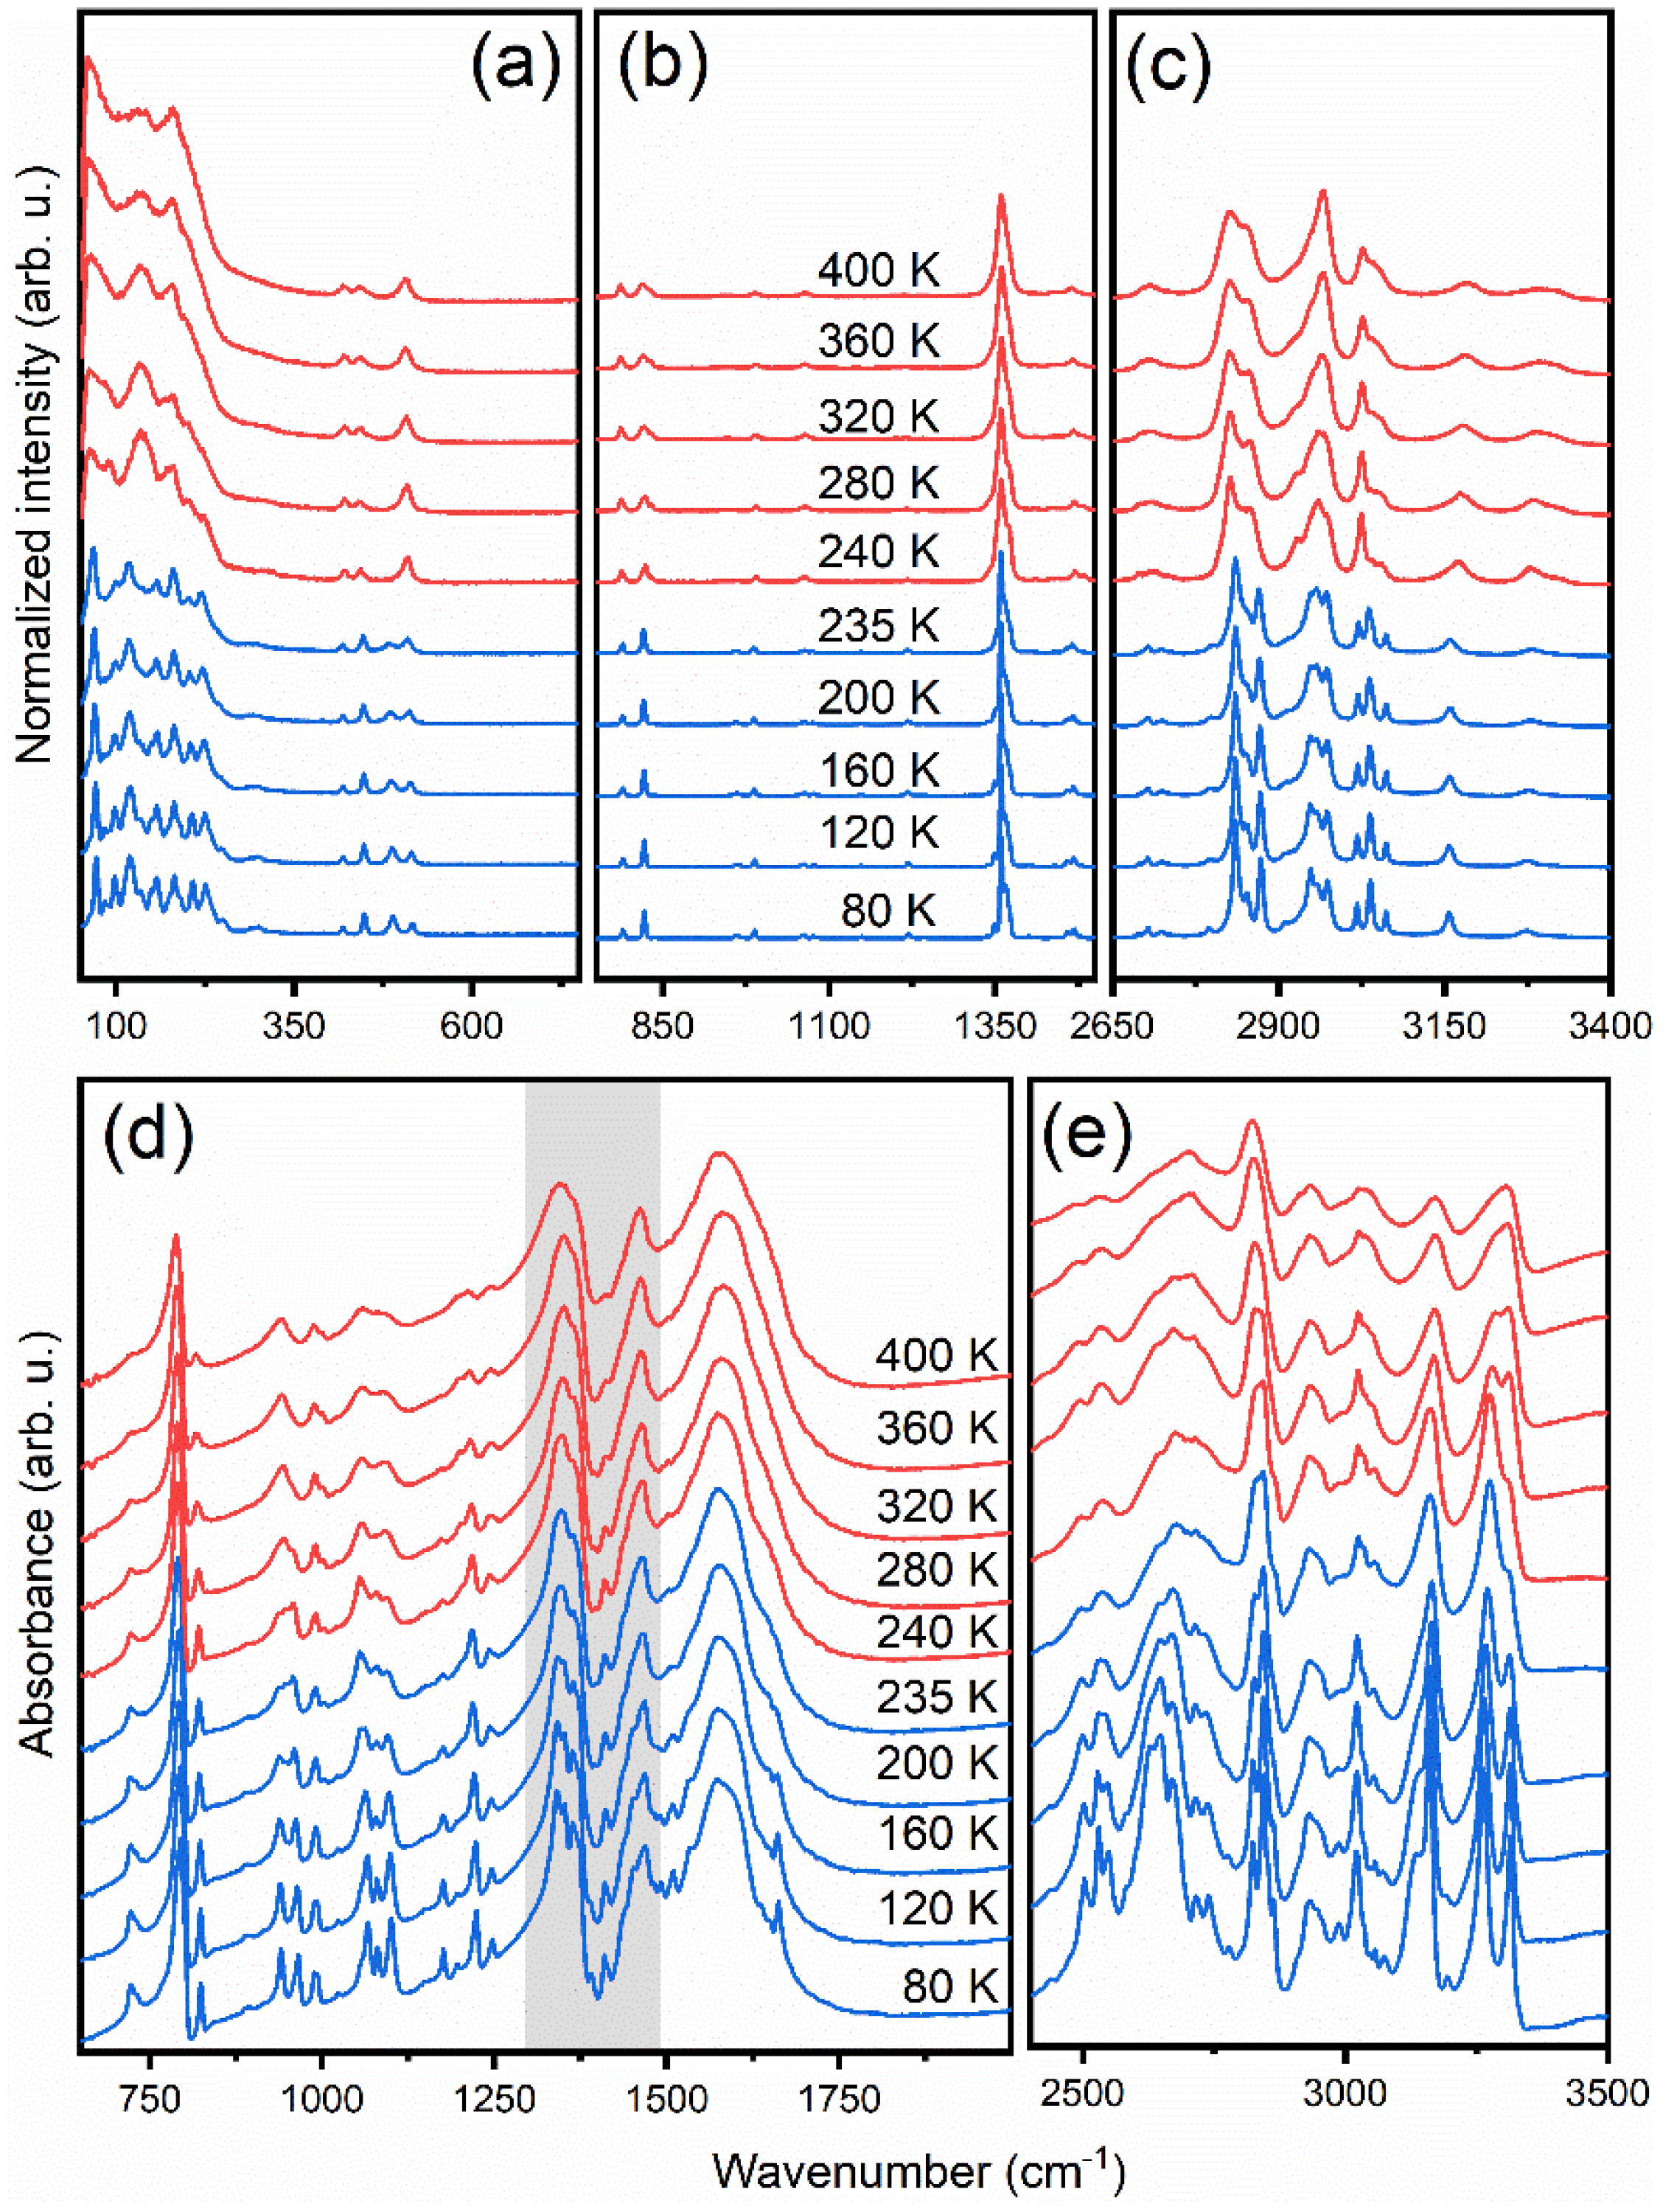
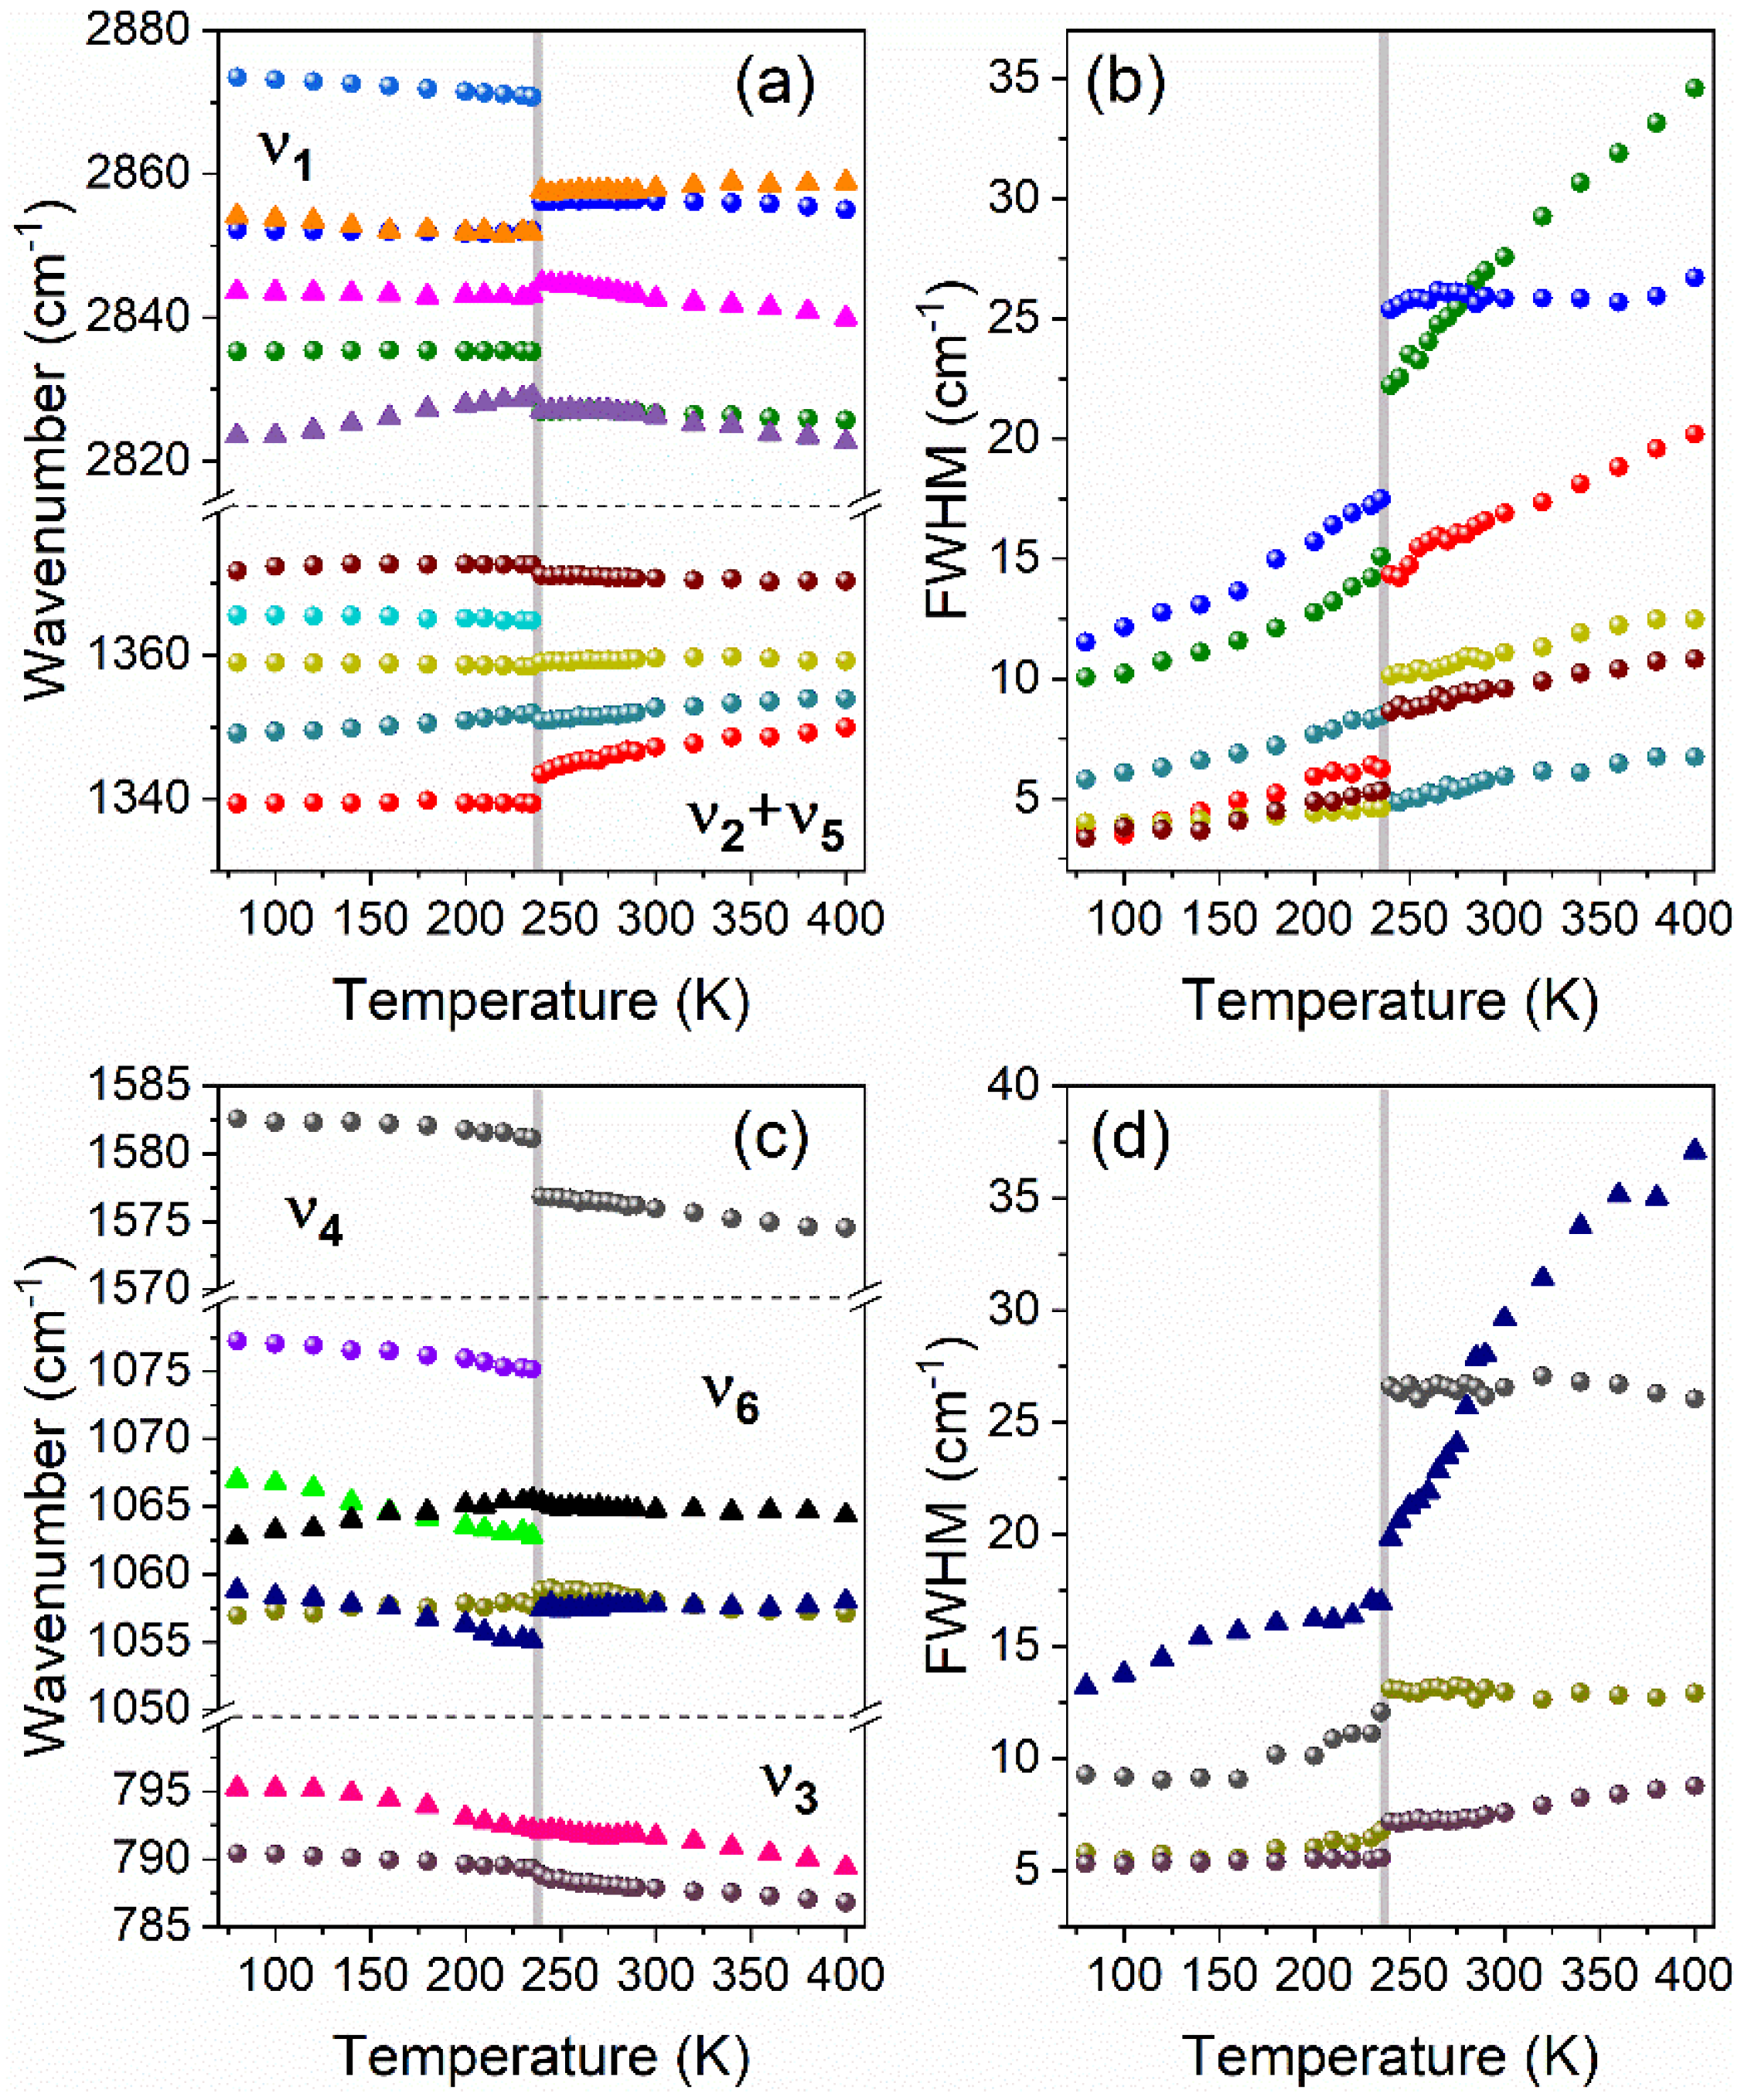
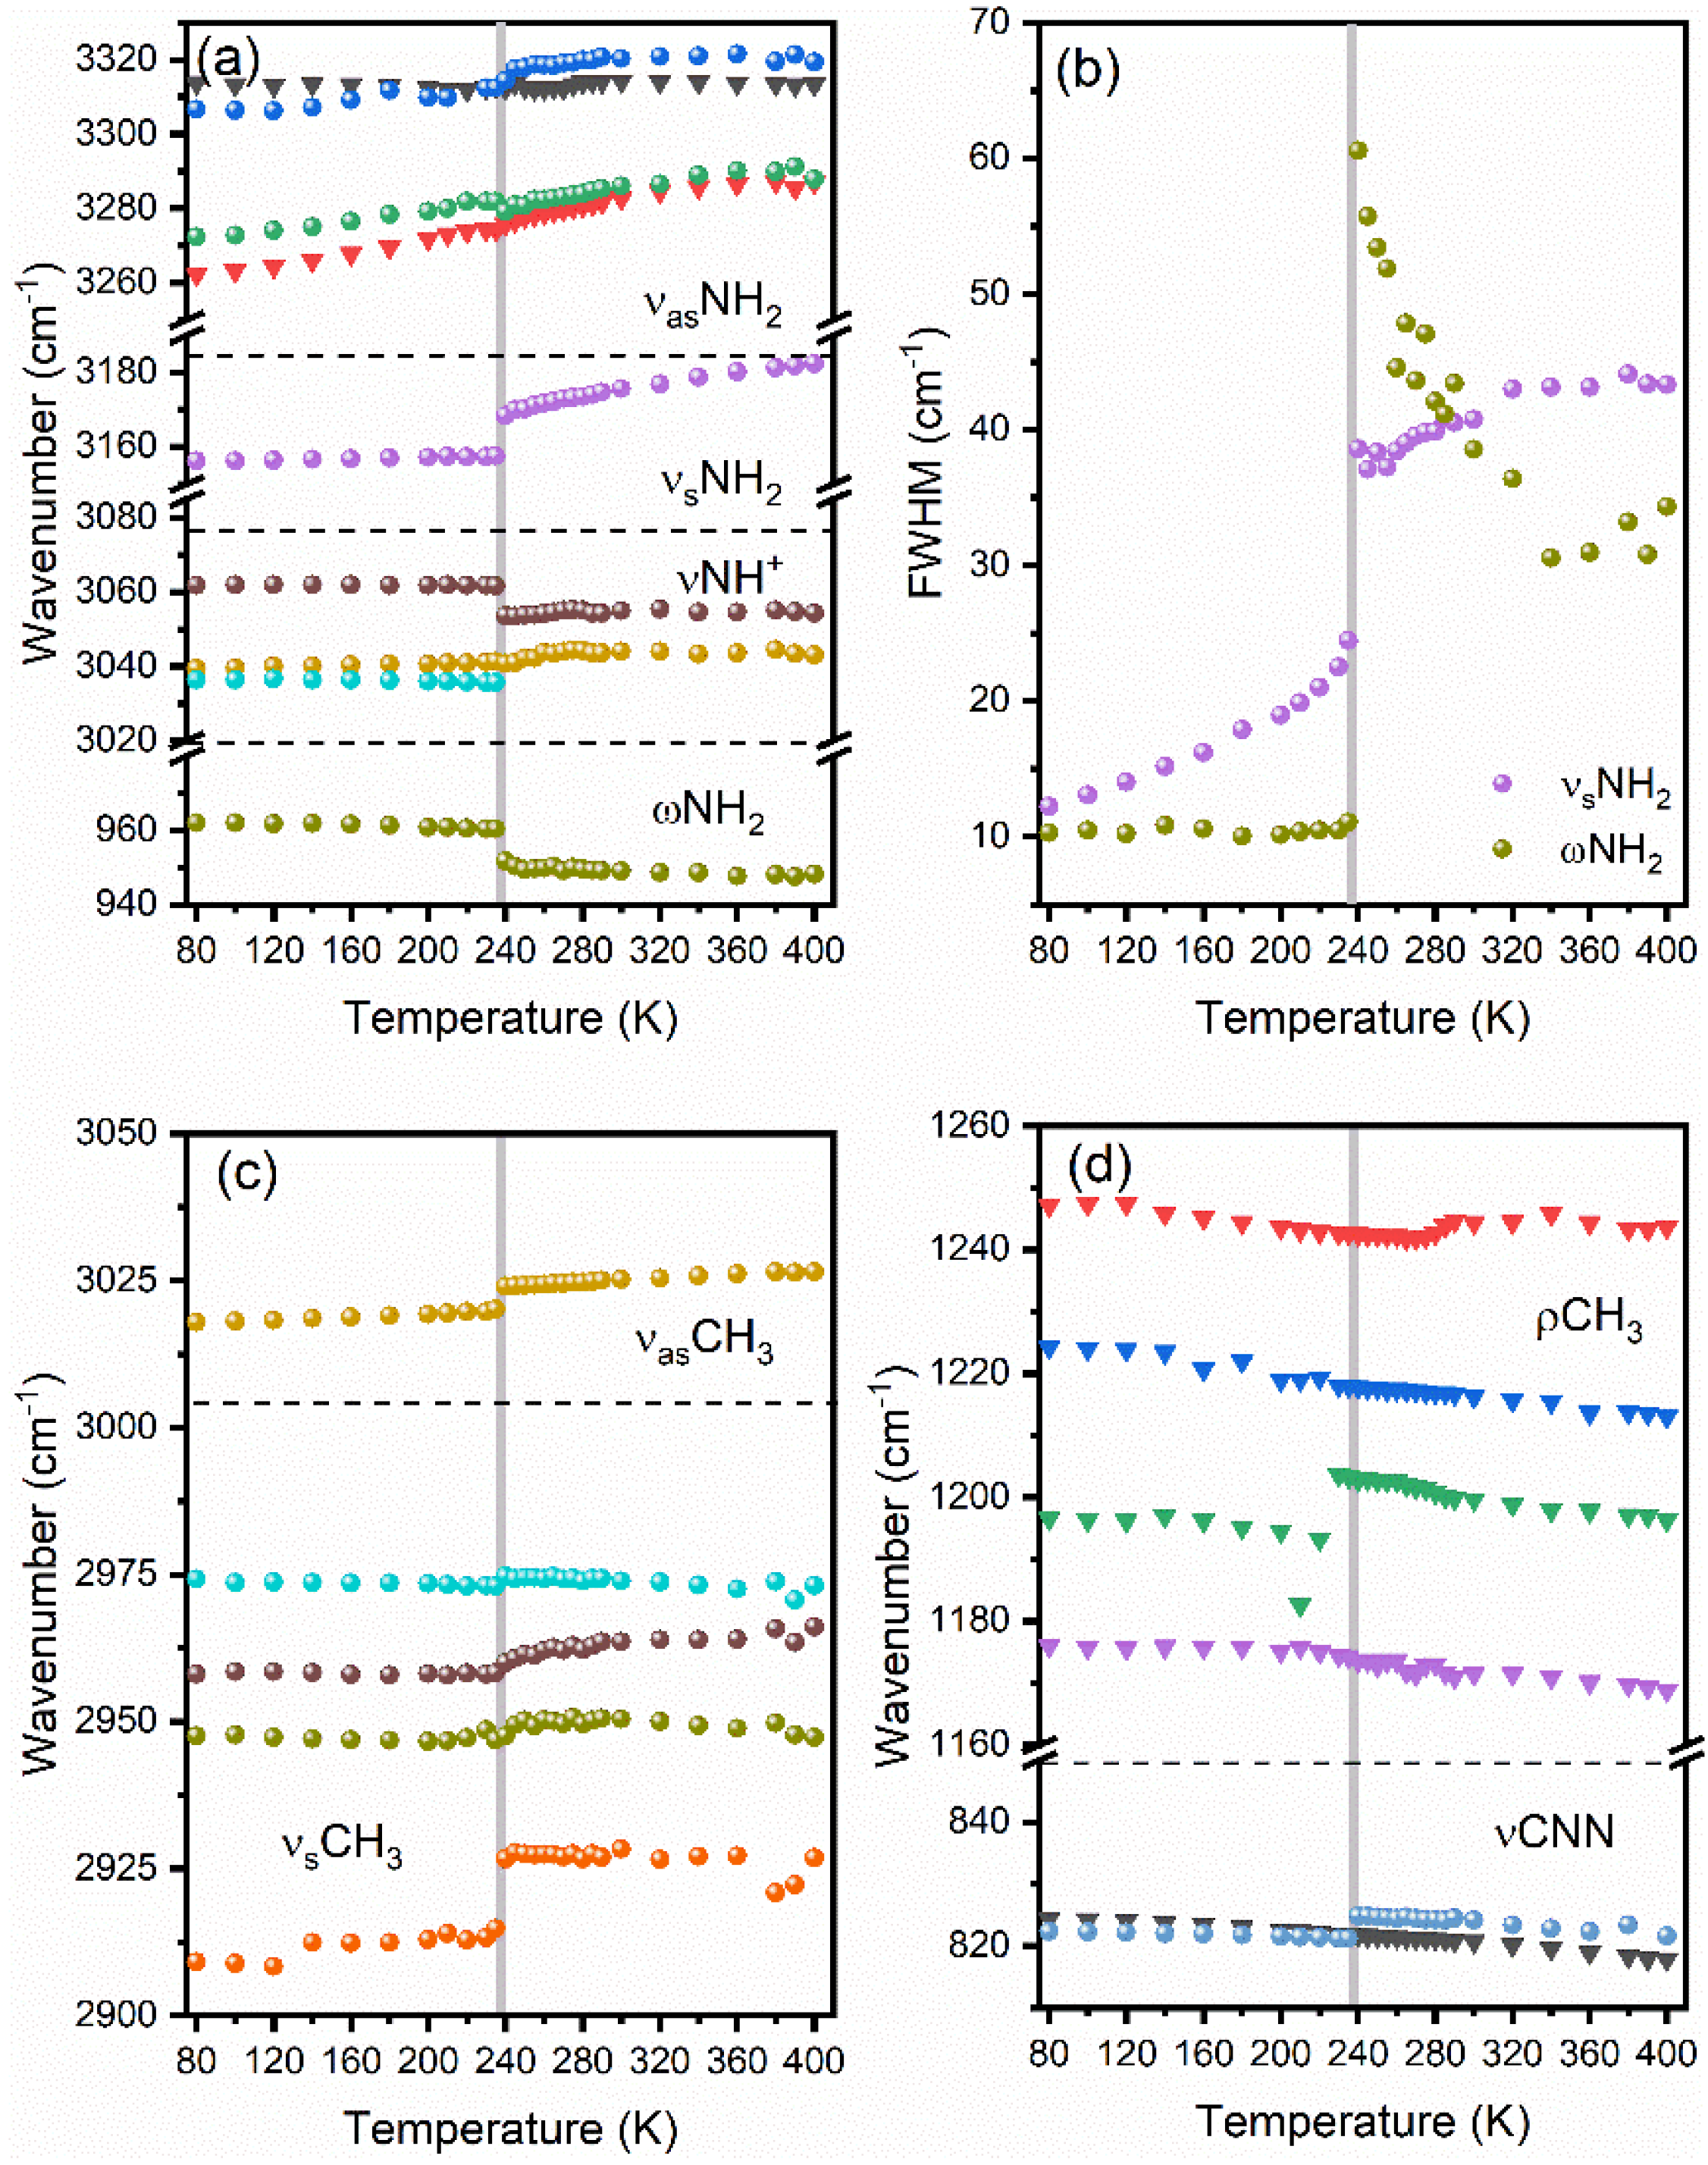
3.5. Temperature-Dependent IR and Raman Spectra

The thermal evolution of Raman spectra (measured from single crystal) and polycrystalline IR spectra (measured as a suspension in Fluorolube and nujol) is presented in Figure 3. The observed wavenumbers at 80 and 300 K are listed in Table S4. To obtain more detailed information on the PT mechanism, the fitting of the IR and Raman spectra was conducted through the deconvolution of complex contours to Lorentzian curves.

3.5.1. Internal Modes of Formate Ions

The resulting positions and full widths at half maximum (FWHM) of the IR and Raman bands corresponding to formate linkers are presented as a function of temperature in Figure 4. During the PT (on heating), the IR (Raman) bands above 2840 cm−1 corresponding to the ν1 mode exhibit upshifts by 1.8–6.5 cm−1 (3.9 cm−1), while bands below this limit downshift by 2.1 cm−1 (8.4 cm−1) (Figure 4a). The sensitivity of bands to the PT is also manifested as a significant broadening by 7.2–7.9 cm−1 (Figure 4b). Similar co-occurrence of positive and negative shifts is observed for the ν5 and ν6 bending vibrations. The hardening (softening) of the corresponding IR and Raman bands during the PT on heating does not exceed 2.4 cm−1 (1.4 cm−1). The corresponding increase in FWHMs for these modes ranges from 2.9 to 6.2 cm−1.
The ν2 and ν4 bands corresponding to stretching modes involving oxygen atoms exhibit downshifts by 1.1–4.2 cm−1 and upshift by 4.1 cm−1, respectively, at the PT temperature. The ν4 and one of the ν2 Raman bands exhibit strong broadening at the PT temperature upon heating, by 14.7 cm−1 and 7.7 cm−1, respectively. Interestingly, the second ν2 Raman band exhibits unusual narrowing by 3.5 cm−1.
The bending COC modes (ν3) seem to be less sensitive to the occurring structural transformation. Shifts of IR and Raman bands during the PT are weaker than 0.4 cm−1, and the broadening of the 790 cm−1 Raman band (1.6 cm−1) is the lowest among all ν1–ν6 bands. Selected detailed ranges of temperature-dependent Raman spectra corresponding to the ν1–ν6 formate anion internal modes are presented in Figure S3.

3.5.2. Internal Modes of DMHy+ Cation

The results of fitting of IR and Raman bands corresponding to DMHy+ cation (positions and widths of the bands) are presented as a function of temperature in Figure 5. The details of IR and Raman spectra corresponding to DMHy+ vibrations are presented in Figures S4 and S5.
Two Raman bands observed above 3260 cm−1, corresponding to the νasNH2 modes, exhibit weak shifts (less than 2.5 cm−1) at the PT temperature (Figure 5a). Almost no changes at the PT temperature are also observed for the IR counterparts. Raman bands corresponding to the νsNH2 and ωNH2 modes are significantly more sensitive, i.e., they exhibit upshift by 10.8 cm−1 and downshift by 8.7 cm−1, respectively. They also disclose significant broadening by ca 14.1 cm−1 and 49.5 cm−1, respectively (Figure 5b). The shifts observed for the νNH+ modes are up to 8.0 cm−1.
Shifts observed for the Raman-active νasCH3 and νsCH3 modes are also strong, up to 12 cm−1. The rocking vibrations exhibit weaker changes and seem to be less affected by the PT. The only exception is the 1202 cm−1 mode (at 300 K), for which the upshift on heating is equal to 11.5 cm−1. The νCNN skeleton vibrations are weakly affected by the PT.

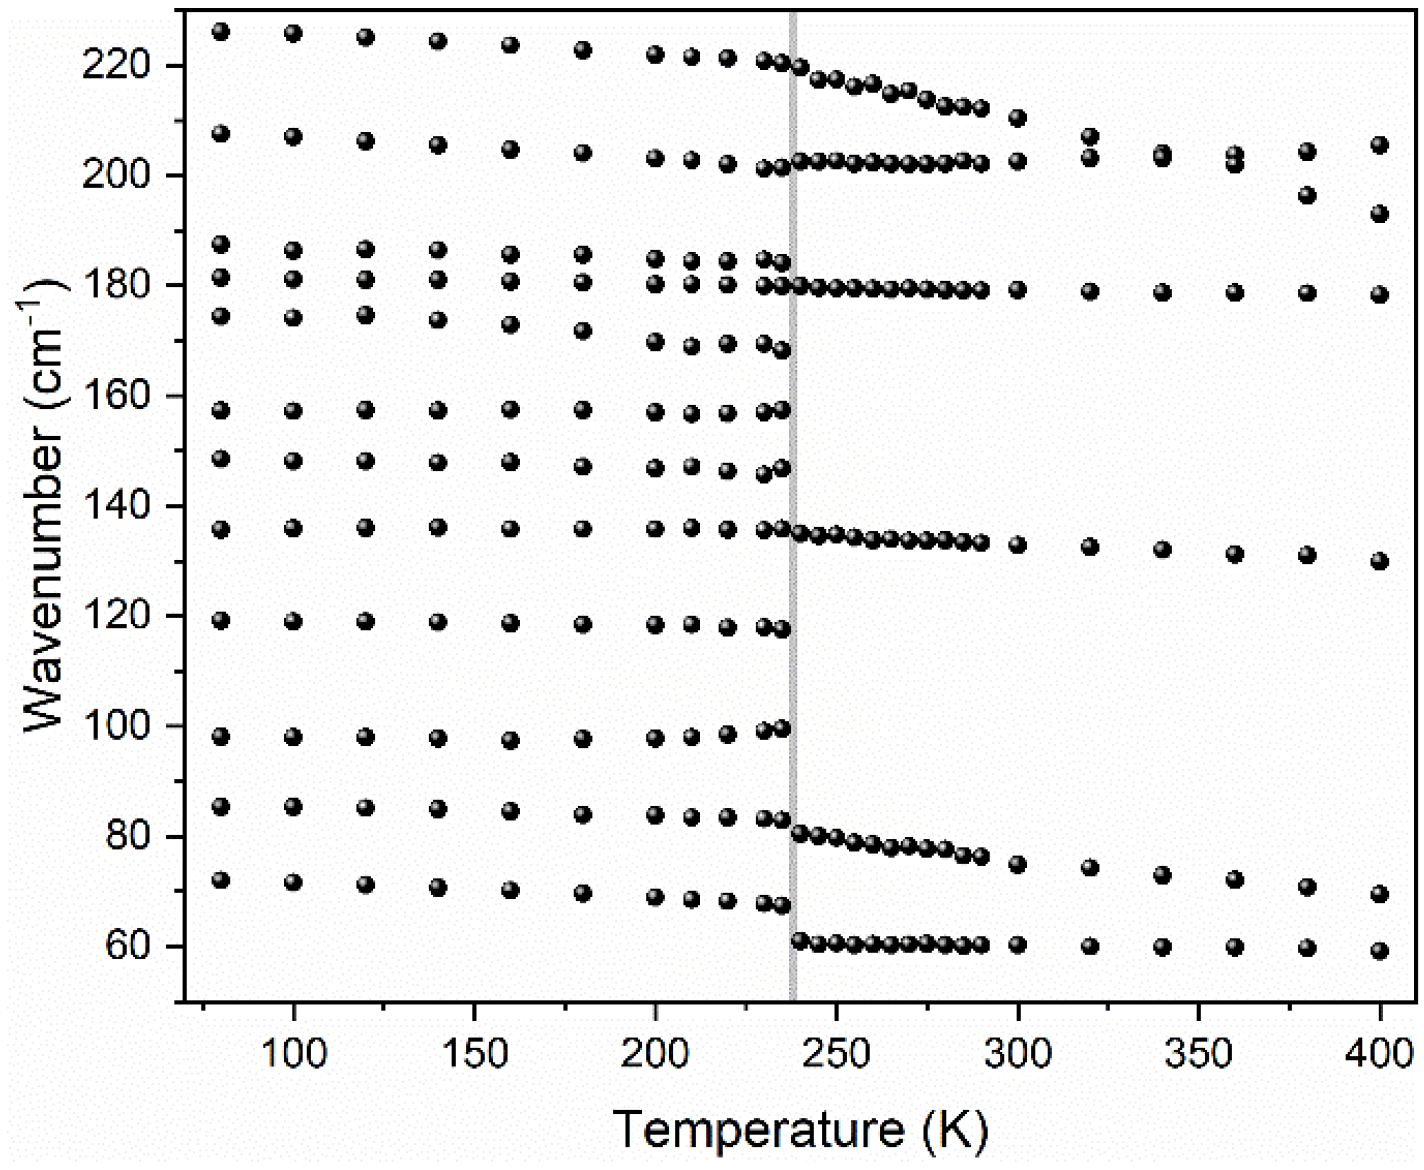
3.5.3. Lattice Modes

Figure 6 and Figure S6 show the temperature dependence of Raman bands observed in the 50–225 cm−1 range corresponding to the lattice modes. They exhibit the most significant changes during the PT. As one can see, after heating to 240 K, a few bands disappear. Furthermore, a large increase in bandwidth is observed (see Figure 6). Similar to the internal modes, they exhibit either up- or down-shifts. The strongest softening during the heating, by 6.7 cm−1, is observed for the lowest wavenumber mode located at 72 cm−1 (at 80 K). A weaker decrease in energy at the PT temperature, by 2.3, 0.9 and 0.7 cm−1, is observed for the 86, 136 and 227 cm−1 bands. The 180 cm−1 band is nearly insensitive to the change of temperature, while that at 208 cm−1 slightly hardens at 240 K, by 1.2 cm−1. Details of temperature-dependent Raman spectra corresponding to the range of lattice modes are presented in Figure S6.

4. Discussion

All observed dependencies show clear jumps at 240 K, evidencing the PT. A sudden character of these changes points to the first-order nature of this transformation. According to the selection rules, the P21/nP21/n isosymmetric PT in [DMHy]Mn(HCOO)3 should not lead to any splitting or appearance of new bands for DMHy+ and HCOO ions. Nonetheless, some minor splitting of many internal modes below PT is evidenced. This effect is related to the thermal narrowing of closely lying and superimposed vibrational bands that become well separated at lower temperatures. On the other hand, factor group analysis showed that significant changes are expected for lattice modes with a strong contribution of T’(Mn2+). Indeed, pronounced changes upon cooling are observed for bands located below 225 cm−1. Our experiment shows that 6 of 12 Raman bands in this region disappear upon heating, which is in good agreement with our predictions. All 6 Raman-active T’(Mn2+) modes (3Ag + 3Bg) in the LT phase become solely IR-active because of a change of symmetry to Au and Bu.
Such a strong splitting observed below 225 cm−1 confirms a strong deformation of the MnO6 octahedra in the LT phase. Since lattice modes are strongly coupled and involve librational and translational vibrations of all crystal units, this effect reflects also a strong deformation of the whole manganese–formate framework. This conclusion is further supported by the strong broadening of the ν4 mode corresponding to the antisymmetric stretching vibration of CO groups and the low sensitivity of the ν3 bending COC mode. The co-occurrence of up- and down-shits, observed in the same type of vibrational modes corresponding to the formate ion, suggests the presence of a few symmetrically independent formate linkers in the unit cell that have slightly different distortions before and after PT. The crystallographic data reported at 100 and 300 K are consistent with the spectroscopic data [2]. They show three different formate linkers in both LT and HT phases that have different susceptibility to structural distortions. At 300 K, two of them have increased C-O bonds by 1.4–1.8% and the COC angle by 2.6% in comparison to the LT phase, while the third linker has one weakly increased C-O distance (0.8%) and one strongly elongated (2.4%) C-O bond. The corresponding COC angle remains weakly affected by about 0.4% [2]. This phenomenon and co-occurring wide range of changes corresponding to Mn-O distances, from −0.36 to 0.19%, explain well the observed up- or down-shifts of vibrational bands corresponding to lattice modes and formate linkers.
Large broadening observed in the lattice mode region is also caused by the disordering of DMHy+ interplaying with the re-arrangement of HBs. This effect is most clearly visible for bands corresponding to both amino groups. A strong broadening at the PT temperature evidences the highly dynamic nature of this PT. Both IR and Raman bands corresponding to the νNH2 stretching modes experience shifts and sudden broadening at the PT during heating. In particular, IR and Raman bands corresponding to the νsNH2 and νasNH2 vibrations harden when going from the LT to the HT phase. This behaviour is strong evidence that the strength of HBs created by unprotonated amino groups is lower in the HT phase. In contrast to this behaviour, bands corresponding to the νNH+ modes soften during the PT on heating. This indicates that the HBs related to the protonated amino group become stronger in the HT phase, in agreement with the crystallographic data [2]. Furthermore, this behaviour proves that both types of amino groups play a crucial role in the PT mechanism. A significant broadening and change of shape of the νCH3 bands at the PT temperature can also be attributed to their disorder in the HT phase and their ability to form weak HBs.
The X-ray diffraction structural analysis showed that in the HT phase, the amino and methyl groups bonded to the middle N4 atom are disordered; however, one of the N4-(C|N) bonds is slightly shorter [2]. In the LT phase, the N-N bond is shorter compared to two N-C bonds, and the conformation of the skeleton is preserved [2]. We suppose, therefore, that most of the changes observed in the Raman and IR spectra are a consequence of cation ordering. The ordering of cations, along with the re-arrangement of HBs, because of tight confinement in the crystal void, forces the simultaneous deformation of the manganese–formate framework. The order-disorder mechanism is in good agreement with the high change of PT entropy observed for [DMHy]Mn(HCOO)3 [2].

5. Conclusions

We have studied phonon properties of manganese–formate framework templated by DMHy+ cations combining the DFT calculations and the temperature-dependent IR and Raman spectroscopy as a probe. We have presented selection rules and a correlation diagram for the LT and HT monoclinic (P21/n) phases. We have proposed the assignment of the observed IR and Raman bands to the respective internal and external (lattice) vibrations based on the DFT calculations performed for the DMHy molecule and its single protonated cation and the comparative analysis. We have shown that some bands exhibit stronger anharmonic behaviours and are more sensitive to structural changes.
The detailed analysis of temperature-dependent Raman and IR studies allowed us to obtain deeper insight into the PT mechanism occurring in this hybrid perovskite. We have concluded that the unusual isosymmetric order-disorder phase transformation from one P21/n to the second P21/n phase occurring near 240 K has a highly dynamic nature because of the ordering of DMHy+ ions and re-arrangement of HBs. We have also proved that this transition has a first-order nature. The observed splitting of lattice modes below 240 K has been explained using selection rules that are slightly different for manganese ions in both phases.
Certainly, the mechanism of the PT involves the ordering of DMHy+ cations as suggested in the previous work. However, the analysis of the thermal evolution of particular bands revealed that the PT mechanism has a more complex nature and is a result of a few contributions. It involves the simultaneous ordering of the organic cations and re-arrangement of the HBs network, but without conformational change of the DMHy+ cations. This ordering and re-orientational motions, because of the tight confinement of the cations and steric hindrance, forces a strong deformation of the manganese–formate framework and MnO6 octahedra in the LT phase.

Supplementary Materials

The following are available online at https://www.mdpi.com/article/10.3390/ma14143984/s1, Table S1: Calculated and experimental bond angles and lengths of DMHy+ cation and DMHy molecule; Table S2: Optical modes in LT and HT phases; Table S3: Calculated PED and harmonic and anharmonic wavenumbers of DMHy+ and DMHy; Table S4: Experimental IR and Raman bands of LT and HT forms with the assignment; Figure S1: The numbering of atoms in DMHy+ and DMHy; Figure S2: Calculated IR and Raman spectra of DMHy+ and DMHy; Figure S3: Raman bands corresponding to vibrational modes of the formate anion; Figure S4: Details of temperature-dependent Raman spectra, corresponding to vibrational modes of DMHy+ cation; Figure S5: Details of temperature-dependent IR spectra, corresponding to vibrational modes of DMHy+ cation; Figure S6: Raman bands corresponding to lattice modes.

Author Contributions

Conceptualization, J.A.Z. and M.P.; methodology, J.A.Z.; software, E.K.; validation, J.A.Z., E.K. and M.P.; formal analysis, J.A.Z.; investigation, J.A.Z. and E.K.; writing—original draft preparation, J.A.Z., E.K.; writing—review and editing, M.P.; visualization, J.A.Z. and E.K.; supervision, M.P.; project administration, J.A.Z. All authors have read and agreed to the published version of the manuscript.

Funding

This research received no external funding.

Institutional Review Board Statement

Not applicable.

Informed Consent Statement

Not applicable.

Data Availability Statement

The data presented in this study are available on request from the corresponding author.

Conflicts of Interest

The authors declare no conflict of interest.

References

  1. Mączka, M.; Bondzior, B.; Dereń, P.; Sieradzki, A.; Trzmiel, J.; Pietraszko, A.; Hanuza, J. Synthesis and characterization of [(CH3)2NH2][Na0.5Cr0.5(HCOO)3]: A rare example of luminescent metal-organic frameworks based on Cr(III) ions. Dalt. Trans. 2015, 44, 6871–6879. [Google Scholar] [CrossRef]
  2. Zienkiewicz, J.A.; Kowalska, D.A.; Fedoruk, K.; Stefański, M.; Pikul, A.; Ptak, M. Unusual isosymmetric order-disorder phase transition in the new perovskite-type dimethylhydrazinium manganese formate exhibiting ferrimagnetic and photoluminescent properties. J. Mater. Chem. C 2021, 9, 6841–6851. [Google Scholar] [CrossRef]
  3. Li, W.; Zhang, Z.; Bithell, E.G.; Batsanov, A.S.; Barton, P.T.; Saines, P.J.; Jain, P.; Howard, C.J.; Carpenter, M.A.; Cheetham, A.K. Ferroelasticity in a metal-organic framework perovskite; Towards a new class of multiferroics. Acta Mater. 2013, 61, 4928–4938. [Google Scholar] [CrossRef]
  4. Wang, K.; Xiong, J.B.; Xia, B.; Wang, Q.L.; Tong, Y.Z.; Ma, Y.; Bu, X.H. Ferroelastic phase transition and switchable dielectric constant in heterometallic niccolite formate frameworks. Inorg. Chem. 2018, 57, 537–540. [Google Scholar] [CrossRef] [PubMed]
  5. Jain, P.; Dalal, N.S.; Toby, B.H.; Kroto, H.W.; Cheetham, A.K. Order-disorder antiferroelectric phase transition in a hybrid inorganic-organic framework with the perovskite architecture. J. Am. Chem. Soc. 2008, 130, 10450–10451. [Google Scholar] [CrossRef] [PubMed]
  6. Abhyankar, N.; Bertaina, S.; Dalal, N.S. On Mn2+ EPR probing of the ferroelectric transition and absence of magnetoelectric coupling in dimethylammonium manganese formate (CH3)2NH2Mn(HCOO)3, a metal-organic complex with the Pb-free perovskite framework. J. Phys. Chem. C 2015, 119, 28143–28147. [Google Scholar] [CrossRef] [Green Version]
  7. Kieslich, G.; Forse, A.C.; Sun, S.; Butler, K.T.; Kumagai, S.; Wu, Y.; Warren, M.R.; Walsh, A.; Grey, C.P.; Cheetham, A.K. Role of amine-cavity interactions in determining the structure and mechanical properties of the ferroelectric hybrid perovskite [NH3NH2]Zn(HCOO)3. Chem. Mater. 2016, 28, 312–317. [Google Scholar] [CrossRef]
  8. Yu, Y.; Shang, R.; Chen, S.; Wang, B.-W.; Wang, Z.-M.; Gao, S. A Series of bimetallic ammonium AlNa formates. Chem. A Eur. J. 2017, 23, 9857–9871. [Google Scholar] [CrossRef]
  9. Wang, Z.; Hu, K.; Gao, S.; Kobayashi, H. Formate-based magnetic metal-organic frameworks templated by protonated amines. Adv. Mater. 2010, 22, 1526–1533. [Google Scholar] [CrossRef] [PubMed]
  10. Mączka, M.; Gągor, A.; Hermanowicz, K.; Sieradzki, A.; Macalik, L.; Pikul, A. Structural, magnetic and phonon properties of Cr(III)-doped perovskite metal formate framework [(CH3)2NH2][Mn(HCOO)3]. J. Solid State Chem. 2016, 237, 150–158. [Google Scholar] [CrossRef]
  11. Nagabhushana, G.P.; Shivaramaiah, R.; Navrotsky, A. Thermochemistry of multiferroic organic-inorganic hybrid perovskites [(CH3)2NH2][M(HCOO)3] (M = Mn, Co, Ni, and Zn). J. Am. Chem. Soc. 2015, 137, 10351–10356. [Google Scholar] [CrossRef]
  12. Jain, P.; Ramachandran, V.; Clark, R.J.; Hai, D.Z.; Toby, B.H.; Dalal, N.S.; Kroto, H.W.; Cheetham, A.K. Multiferroic behavior associated with an order-disorder hydrogen bonding transition in metal-organic frameworks (MOFs) with the perovskite ABX3 architecture. J. Am. Chem. Soc. 2009, 131, 13625–13627. [Google Scholar] [CrossRef]
  13. Thomson, R.I.; Jain, P.; Cheetham, A.K.; Carpenter, M.A. Elastic relaxation behavior, magnetoelastic coupling and order-disorder processes in multiferroic metal-organic frameworks. Phys. Rev. B 2012, 214304, 1–7. [Google Scholar] [CrossRef] [Green Version]
  14. Brenes, R.; Eames, C.; Bulović, V.; Islam, M.S.; Stranks, S.D. The impact of atmosphere on the local luminescence properties of metal halide perovskite grains. Adv. Mater. 2018, 30, 1–8. [Google Scholar] [CrossRef]
  15. Sun, D.-S.; Zhang, Y.-Z.; Gao, J.-X.; Hua, X.-N.; Chen, X.-G.; Mei, G.-Q.; Liao, W.-Q. Reversible high temperature dielectric switching Reversible high temperature dielectric switching in a 2H-perovskite compound: [Me3NCH2CH3]CdCl3. CrystEngComm 2019, 21, 2669–2674. [Google Scholar] [CrossRef]
  16. Rok, M.; Bator, G.; Zarychta, B.; Dziuk, B.; Medycki, W.; Zamponi, M.; Banys, J. Isostructural phase transition, quasielastic neutron scattering and magnetic resonance studies of a bistable dielectric ion-pair crystal [(CH3)2NH2]2KCr(CN)6. Dalt. Trans. 2019, 48, 4190–4202. [Google Scholar] [CrossRef] [PubMed]
  17. Chen, S.; Shang, R.; Hu, K.-L.L.; Wang, Z.-M.M.; Gao, S. [NH2NH3][M(HCOO)3] (M = Mn2+, Zn2+, Co2+ and Mg2+): Structural phase transitions, prominent dielectric anomalies and negative thermal expansion, and magnetic ordering. Inorg. Chem. Front. 2014, 1, 83–98. [Google Scholar] [CrossRef]
  18. Mączka, M.; Pasińska, K.; Ptak, M.; Paraguassu, W.; da Silva, T.A.; Sieradzki, A.; Pikul, A. Effect of solvent, temperature and pressure on the stability of chiral and perovskite metal formate frameworks of [NH2NH3][M(HCOO)3] (M = Mn, Fe, Zn). Phys. Chem. Chem. Phys. 2016, 18, 31653–31663. [Google Scholar] [CrossRef] [PubMed]
  19. Kieslich, G.; Kumagai, S.; Butler, K.T.; Okamura, T.; Hendon, C.H.; Sun, S.; Yamashita, M.; Walsh, A.; Cheetham, A.K. Role of entropic effects in controlling the polymorphism in formate ABX3 metal-organic frameworks. Chem. Commun. 2015, 51, 15538–15541. [Google Scholar] [CrossRef] [Green Version]
  20. Mączka, M.; Gągor, A.; Ptak, M.; Paraguassu, W.; Da Silva, T.A.; Sieradzki, A.; Pikul, A. Phase transitions and coexistence of magnetic and electric orders in the methylhydrazinium metal formate frameworks. Chem. Mater. 2017, 29, 2264–2275. [Google Scholar] [CrossRef]
  21. Kieslich, G.; Sun, S.; Cheetham, A.K. Solid-state principles applied to organic-inorganic perovskites: New tricks for an old dog. Chem. Sci. 2014, 5, 4712–4715. [Google Scholar] [CrossRef]
  22. Christy, A.G. Isosymmetric structural phase transitions: Phenomenology and examples. Acta Crystallogr. Sect. B Struct. Sci. 1995, 51, 753–757. [Google Scholar] [CrossRef]
  23. Zhang, W.; Ye, H.-Y.; Graf, R.; Spiess, H.W.; Yao, Y.-F.; Zhu, R.-Q.; Xiong, R.-G. Tunable and switchable dielectric constant in an mmphidynamic crystal. J. Am. Chem. Soc. 2013, 135, 5230–5233. [Google Scholar] [CrossRef]
  24. Rok, M.; Bator, G.; Medycki, W.; Zamponi, M.; Balčiūnas, S.; Šimėnas, M.; Banys, J. Reorientational dynamics of organic cations in perovskite-like coordination polymers. Dalt. Trans. 2018, 47, 17329–17341. [Google Scholar] [CrossRef]
  25. Xu, W.-J.; Chen, S.-L.; Hu, Z.-T.; Lin, R.-B.; Su, Y.-J.; Zhang, W.-X.; Chen, X.-M. The cation-dependent structural phase transition and dielectric response in a family of cyano-bridged perovskite-like coordination polymers. Dalt. Trans. 2016, 45, 4224–4229. [Google Scholar] [CrossRef] [PubMed] [Green Version]
  26. Zhang, X.; Shao, X.D.; Li, S.C.; Cai, Y.; Yao, Y.F.; Xiong, R.G.; Zhang, W. Dynamics of a caged imidazolium cation-toward understanding the order-disorder phase transition and the switchable dielectric constant. Chem. Commun. 2015, 51, 4568–4571. [Google Scholar] [CrossRef] [PubMed]
  27. Zhang, W.; Cai, Y.; Xiong, R.-G.; Yoshikawa, H.; Awaga, K. Exceptional dielectric phase transitions in a perovskite-type cage compound. Angew. Chem. Int. Ed. 2010, 49, 6608–6610. [Google Scholar] [CrossRef]
  28. Zhao, X.H.; Huang, X.C.; Zhang, S.L.; Shao, D.; Wei, H.Y.; Wang, X.Y. Cation-dependent magnetic ordering and room-temperature bistability in azido-bridged perovskite-type compounds. J. Am. Chem. Soc. 2013, 135, 16006–16009. [Google Scholar] [CrossRef] [PubMed]
  29. Mączka, M.; Marinho Costa, N.L.; Gągor, A.; Paraguassu, W.; Sieradzki, A.; Hanuza, J. Structural, thermal, dielectric and phonon properties of perovskite-like imidazolium magnesium formate. Phys. Chem. Chem. Phys. 2016, 18, 13993–14000. [Google Scholar] [CrossRef] [PubMed] [Green Version]
  30. Frisch, M.J.; Trucks, G.W.; Schlegel, H.B.; Scuseria, G.E.; Robb, M.A.; Cheeseman, J.R.; Montgomery, J.A.; Vreven, T.; Kudin, K.N.; Burant, J.C.; et al. Gaussian 03, Revision A.1; Gaussian, Inc.: Pittsburgh, PA, USA, 2003. [Google Scholar]
  31. Becke, A.D. Density-functional thermochemistry. IV. A new dynamical correlation functional and implications for exact-exchange mixing. J. Chem. Phys. 1996, 104, 1040–1046. [Google Scholar] [CrossRef]
  32. Lee, C.; Yang, W.; Parr, R.G. Development of the Colic-Salvetti correlation-energy formula into a functional of the electron density. Phys. Rev. B 1988, 37, 785–789. [Google Scholar] [CrossRef] [Green Version]
  33. Parr, R.G.; Yang, W. Density-Functional Theory of Atoms and Molecules; Springer: Dordrecht, The Netherlands, 1989. [Google Scholar]
  34. Mclean, A.D.; Chandler, G.S. Contracted Gaussian basis sets for molecular calculations. I. Second row atoms, Z = 11–18. J. Chem. Phys. 1980, 72, 5639–5648. [Google Scholar] [CrossRef]
  35. Krishnan, R.; Binkley, J.S.; Seeger, R.; Pople, J.A. Self-consistent molecular orbital methods. XX. A basis set for correlated wave functions. J. Chem. Phys. 1980, 72, 650–654. [Google Scholar] [CrossRef]
  36. Rostkowska, H.; Lapinski, L.; Nowak, M.J. Analysis of the normal modes of molecules with D3h symmetry: Infrared spectra of monomeric s-triazine and cyanuric acid. Vib. Spectrosc. 2009, 49, 43–51. [Google Scholar] [CrossRef]
  37. Zhurko, G.A.; Zhurko, D.A. Chemcraft Graphical Program of Visualization of Computed Results. Available online: http://chemcraftprog.com (accessed on 9 March 2021).
  38. Ptak, M.; Mączka, M.M.; Gągor, A.; Sieradzki, A.; Stroppa, A.; Di Sante, D.; Perez-Mato, J.M.; Macalik, L. Experimental and theoretical studies of structural phase transition in a novel polar perovskite-like [C2H5NH3][Na0.5Fe0.5(HCOO)3] formate. Dalt. Trans. 2016, 45, 2574–2583. [Google Scholar] [CrossRef] [PubMed]
  39. Zeroka, D.; Jensen, J.O.; Samuels, A.C. Infrared spectra of some isotopomers of isopropylamine: A theoretical study. J. Mol. Struct. Theochem 1999, 465, 119–139. [Google Scholar] [CrossRef]
  40. Mączka, M.; Gągor, A.; Macalik, B.; Pikul, A.; Ptak, M.; Hanuza, J. Order-disorder transition and weak ferromagnetism in the perovskite metal formate frameworks of [(CH3)2NH2][M(HCOO)3] and [(CH3)2ND2][M(HCOO)3] (M = Ni, Mn). Inorg. Chem. 2014, 53, 457–467. [Google Scholar] [CrossRef]
  41. Durig, J.R.; Zheng, C. On the vibrational spectra and conformational stability of 1,1-dimethylhydrazine from temperature dependent FT-IR spectra of krypton solutions and ab initio calculations. J. Mol. Struct. 2004, 690, 31–44. [Google Scholar] [CrossRef]
  42. Ciupa-Litwa, A.; Ptak, M.; Kucharska, E.; Hanuza, J.; Mączka, M. Vibrational properties and DFT calculations of perovskite-type methylhydrazinium manganese hypophosphite. Molecules 2020, 25, 5215. [Google Scholar] [CrossRef]
  43. Mączka, M.; Ptak, M.; Gągor, A.; Stefańska, D.; Zaręba, J.K.; Sieradzki, A. Methylhydrazinium lead bromide: Noncentrosymmetric three-dimensional perovskite with exceptionally large framework distortion and green photoluminescence. Chem. Mater. 2020, 32, 1667–1673. [Google Scholar] [CrossRef]
  44. Mączka, M.; Ptak, M.; Vasconcelos, D.L.M.; Giriunas, L.; Freire, P.T.C.; Bertmer, M.; Banys, J.; Simenas, M. NMR and Raman scattering studies of temperature-and pressure-driven phase transitions in CH3NH2NH2PbCl3 perovskite. J. Phys. Chem. C 2020, 124, 26999–27008. [Google Scholar] [CrossRef]
Figure 1. The crystal structure of the LT (a) and HT (b) phase of [DMHy]Mn(HCOO)3.
Materials 14 03984 g001
Figure 2. RT polycrystalline IR (a) and Raman (b) spectra of [DMHy]Mn(HCOO)3. The shaded fields correspond to regions where absorption bands of dielectric media (nujol, Fluorolube) or ATR crystal occur, and therefore, they are not analysed.
Materials 14 03984 g002
Figure 3. Temperature-dependent Raman spectra measured form single-crystal in the (a) 50–750 cm−1, (b) 750–1500 cm−1 and (c) 2650–3400 cm−1 ranges compared to temperature-dependent polycrystalline IR spectra measured in nujol (d) and Fluorolube (e). The grey range in (d) was not analysed due to the coexistence of bands corresponding to the nujol and sample.
Materials 14 03984 g003
Figure 4. The temperature evolution of selected Raman (circles) and IR (triangles) wavenumbers (a,c) and bandwidths (b,d) of bands corresponding to the ν1, ν2 + ν5 (a,b) as well as to ν3, ν4 and ν6 (b,d) stretching vibrations of formate linkers. Horizontal dashed lines separate ranges of ν1–ν6 modes, vertical grey lines correspond to the PT temperature.
Materials 14 03984 g004
Figure 5. The thermal evolution of positions (a,c,d) and widths (b) of selected Raman (circles) and IR (triangles) bands corresponding to stretching and wagging vibrations of NH2 and NH+ groups (a,b), stretching vibrations of CH3 (c) and stretching vibrations of CNN skeleton and rocking vibration of CH3 group (d). Horizontal dashed lines separate ranges of different modes, and vertical grey lines correspond to the temperature of PT.
Materials 14 03984 g005
Figure 6. The temperature evolution of Raman lattice modes. The vertical grey line corresponds to the temperature of PT.
Materials 14 03984 g006
Table 1. The tentative assignments of IR and Raman bands observed for polycrystalline [DMHy]Mn(HCOO)3.
RamanIR (ATR)IR (Nujol)IR (Fluorolube)Assignment
3286vw3306sh, 3279w3312w, 3283w3310w, 3283wνasNH2
3173w3157w3171w3170wνsNH2
3052sh, 3041w3054vw, 3040vw3054vw, 3039vw3052sh, 3039shνNH+
3025m3027vw3025vw3025wνasCH3
2968sh, 2963m, 2926m2952sh, 2936vw*2953sh, 2931wνsCH3
2851sh, 2844w, 2831sh2832w*2858w, 2843sh, 2826shν1
2732sh, 2712w, 2684sh2710w, 2676sh,
2534vw, 2498vw
2715w, 2674w, 2639sh, 2540vw, 2495vw2717w, 2675vw, 2639sh, 2540vw, 2494vwνNH2 + νNH+ + o + cb
1654vw1639sh1644sh1642shδNH2
1578vw, 1560vw1574vw1591vs1593vsν4 + δNH+
1480w, 1469w, 1445w1478m, 1468m, 1447sh*1477w, 1467w, 1446vwδasCH3
1439sh, 1412w1436vw, 1411vw*1436vw, 1411vwδsCH3 + γNH+
1365vs1363sh**ν5
1345sh1347vs1352s, 1342sh*ν2 + ρNH2
1243vw, 1217vw, 1202vw, 1145vw1244w, 1217w, 1202w, 1149vw1246w, 1217w, 1201vw, 1146sh*ρCH3
1098vw1089w1093w*ρCH3 + νNN
1065w1056w1058w*ν6
1002vw, 991w1002w, 991w1002w, 990vw*νasCNC
957w, 946w, 937vw957w, 946vw958w, 946w*ωNH2
832m, 823m821w820vw820vwνsCNN
789m788vs792s792mν3
507vw506w504w*δCNC
442vw, 421w442sh, 421w441w, 419w*δCNN
219sh 282s, 233m τNH2 + τCH3 + lm
198sh, 177s, 144s 191s, 161sh lm
Key: ν, stretching; δ, bending; ρ, rocking; γ, out-of-plane bending; ω, wagging; τ, twisting; vs, very strong; s, strong; m, medium; w, weak; vw, very weak; ν1–ν6, internal vibrations of formate ion (see description in text); *, regions of absorption related to the medium; o, overtones; cb, combinational bands; lm, lattice modes.
Publisher’s Note: MDPI stays neutral with regard to jurisdictional claims in published maps and institutional affiliations.

