Article

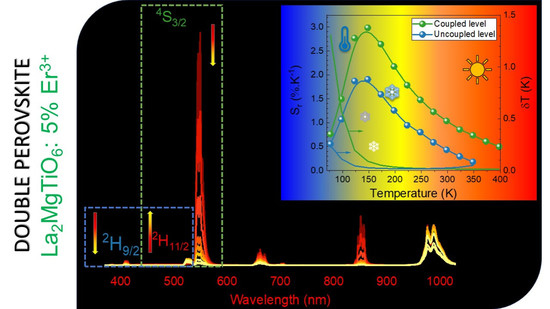
Exploration of the Temperature Sensing Ability of La2MgTiO6:Er3+ Double Perovskites Using Thermally Coupled and Uncoupled Energy Levels

by
Thi Hong Quan Vu
,
Bartosz Bondzior
,
Dagmara Stefańska
and
Przemysław J. Dereń
*
Institute of Low Temperature and Structure Research, Polish Academy of Sciences, Okólna 2, 50-422 Wrocław, Poland
*
Author to whom correspondence should be addressed.
Materials 2021, 14(19), 5557; https://doi.org/10.3390/ma14195557
Submission received: 16 August 2021 / Revised: 14 September 2021 / Accepted: 22 September 2021 / Published: 24 September 2021
(This article belongs to the Special Issue Synthesis, Structure, and Spectral Properties of Perovskite Materials)

Abstract

:
This work aimed to explore the temperature-sensing performance of La2MgTiO6:Er3+ double perovskites based on thermally coupled and uncoupled energy levels. Furthermore, the crystal structure, chemical composition, and morphology of the samples were investigated by powder X-ray diffraction, energy-dispersive X-ray spectroscopy, and scanning electron microscopy, respectively. The most intense luminescence was observed for the sample doped with 5% Er3+. The temperature-dependent emission spectra of La2MgTiO6:5% Er3+ were investigated in the wide range of 77–398 K. The highest sensitivity of the sample was equal to 2.98%/K corresponding to the thermally coupled energy level 2H11/24I15/2 and 4S3/24I15/2 as compared to 1.9%/K, obtained for the uncoupled energy level 2H11/24I15/2 and 2H9/24I15/2. Furthermore, the 300 K luminescent decay profiles were analyzed using the Inokuti–Hirayama model. The energy transfer among Er3+ ions was mainly regulated by the dipole–dipole mechanism. The critical transfer distance R0, critical concentration C0, energy transfer parameter Cda, and energy transfer probability Wda were 9.81 Å, 2.53 × 10 20 ions·cm−3, 5.38 × 10 39   cm6·s−1, and 6020 s−1, respectively.

Graphical Abstract

1. Introduction

Double perovskite compounds (DP) are among the most intensely studied materials because of their interesting chemical and physical properties, as well as their diverse applications stemming from the compositional flexibility of their structure. La2MgTiO6 (LMT), a representative of the double perovskite family, has recently been extensively investigated as a host of many lanthanide ions [1,2,3]. The energy transfer process from TiO6 groups to lanthanides ions takes place very efficiently [3]. Erbium ions have been widely applied in eye-safe lasers, optical communications, or lighting owing to their broad spectral range spans in the ultraviolet, visible, and near-infrared regions [4,5,6]. The most universal approach for LMT is a white-light conversion material related to emission from Sm3+ and Eu3+ [7], Mn4+ and Yb3+ [8], Bi3+ [9], Eu3+ [10], Eu2+ [11], Mn4+ [12,13,14,15], and Gd3+, Bi3+, Sm3+, and Eu3+ ions [16]. Furthermore, an ample potential for optical thermal sensing has recently been demonstrated through these studies including LMT:Pr3+ [17], LMT:Eu3+ [3], and LMT:Nd3+ [2].
Temperature is one of the most important physical parameters which is present in many fields of science and life. In the last few decades, there has been an explosion of research on such optical thermometry [17,18,19,20,21,22,23] to fulfil the requirements of fast growth in a myriad of fields including chemistry, physics, biomedicine, and industry. Indeed, noncontact thermometers possess numerous advantages, such as remote, handy, and precise application, high spatial resolution, and a broad operating temperature range as compared to the conventional thermometers [24]. What is more, they can operate in harsh conditions, e.g., high pressure, corrosive, and very low or high temperature, where the traditional techniques are infeasible [22]. To design luminescent thermometry, taking into account the reliance of peak position, emission intensity, and lifetime when elevating temperature, the sensitivity of thermometers should be estimated. The ratio of emission intensity between two distinct transitions is preferable since it is an external interference-independent factor [24]. It is worth noting that there has only been one investigation into LMT:Er3+ published recently with regard to temperature readout application. However, it was synthesized using the conventional solid-state method, the working temperature range was quite narrow, and it was only focused on thermally coupled levels [25].
Therefore, a comprehensive investigation of the temperature-sensing ability of LMT:Er3+ synthesized via the coprecipitation method was conducted by exploring both thermally coupled and uncoupled energy levels. The well-known thermally coupled levels correspond to the transitions 2H11/24I15/2 and 4S3/24I15/2, which are separated from each other by 592 cm−1. The energy gap between these levels should be neither too close to overlap nor too far to be easily populated by the other; moreover, it should be in the range from 200 cm−1 to 2000 cm−1 [26]. Nonetheless, uncoupled levels, which are related to the phonon-assisted process, have also gained significant attention for temperature sensing [18,27,28]. This is due to the fact that the phonon-assisted process enhanced by elevating temperature is also related to absorption, emission, and energy transfer. Thus, the exploration of all possibilities including thermally coupled and uncoupled levels is crucial to choose the highest sensitivity with the lowest uncertainty.
The aim of this work was to explore the temperature sensing performance of a novel double perovskite LMT:Er3+ as a function of the ratio of emission intensity of thermally coupled and uncoupled energy levels of Er3+ ions. Additionally, the structural, morphological, and spectroscopic properties including absorption and emission spectra were investigated. The energy transfer mechanism among Er3+ ions and the characteristics of luminescent decay kinetics were clarified using the Inokuti–Hirayama model.

2. Experimental

2.1. Synthesis

La2MgTiO6:x Er3+ (where x = 0%, 0.1%, 0.5%, 1%, 3%, 5%, or 7%) was successfully obtained via the coprecipitation method. The procedure was calculated for 0.5 g of sample. The erbium ions were incorporated into the lanthanum site in the structure. All precursors used for the syntheses were purchased from the Alfa Aesar company (Kandel, Germany), including lanthanum acetate (La(CH3COO)3∙1.5H2O, 99.9%), magnesium nitrate (Mg(NO3)2∙6H2O, 99.97%), titanium isopropoxide (Ti(C3H7O)4, 95%), erbium oxide (Er2O3, 99.99%), nitric acid (HNO3, 65%, POCH), and ammonium hydroxide (NH4OH, 25%, CHEMPUR). The synthesis method, annealing time, and sintering temperature were described in previous publications [2,3]. Firstly, the proper amounts of erbium oxide and titanium isopropoxide were separately diluted in nitric acid solution. Afterward, the prepared solution of titanium isopropoxide was added into the mixture of the aqueous solution containing lanthanum, magnesium, and erbium ions (for doped samples). However, it should be emphasized that a 10% excess amount of magnesium ions was applied due to the likelihood of the sublimation of magnesium ions during the high-temperature sintering process. To obtain the precipitate, a solution of ammonium hydroxide (1 mL) was added. The obtained precipitate was dried at 80 °C for 24 h on a heater. Then, it was sintered at 600 °C for 12 h in a porcelain crucible. The second annealing was conducted at 1300 °C for 8 h in a corundum crucible in air. Grinding for a few minutes was necessary after each step of annealing.

2.2. Characterization

The powder X-ray diffractions of all samples were measured on an X’Pert ProPANalytical (PANalytical, Almelo, The Netherlands) using an X-ray diffractometer with Cu Kα radiation (λ = 1.54056 Å) in a 2 θ range from 10° to 90° with a step size of Δ2θ = 0.02°. The morphology and chemical composition of LMT:5% Er3+ were investigated using a scanning electron microscope FEI NOVA NanoSEM230 (FEI, Hillsboro, OR, USA). To determine the absorption spectrum of LMT:7% Er3+, a Varian Cary 5E UV/Vis–NIR spectrophotometer (Varian Incorporation, Palo Alto, CA, USA) was used. The 300 K emission spectra of all samples were obtained using a Hamamatsu Photonic multichannel analyzer PMA-12 (Hamamatsu Photonics K.K, Shizuoka, Japan) along with a BT-CCD linear image sensor. Furthermore, a McPherson spectrometer linear PIXcel detector (McPherson Incorporation, Chelmsford, MA, USA) equipped with an 808 diode laser was used for infrared emission measurement. The 300 K emission decay profiles were recorded with a Lecroy digital oscilloscope (Teledyne Technologies, New York, NY, USA) using an excitation source of Nd:YAG. The thermal quenching measurements were measured using the Hamamatsu Photonic multichannel analyzer PMA-12 equipped with the BT-CCD linear image sensor. The temperature of the samples was controlled by a Linkam THMS 600 Heating/Freezing Stage (The McCRONE Group, Westmont, IL, USA).

3. Results and Discussion

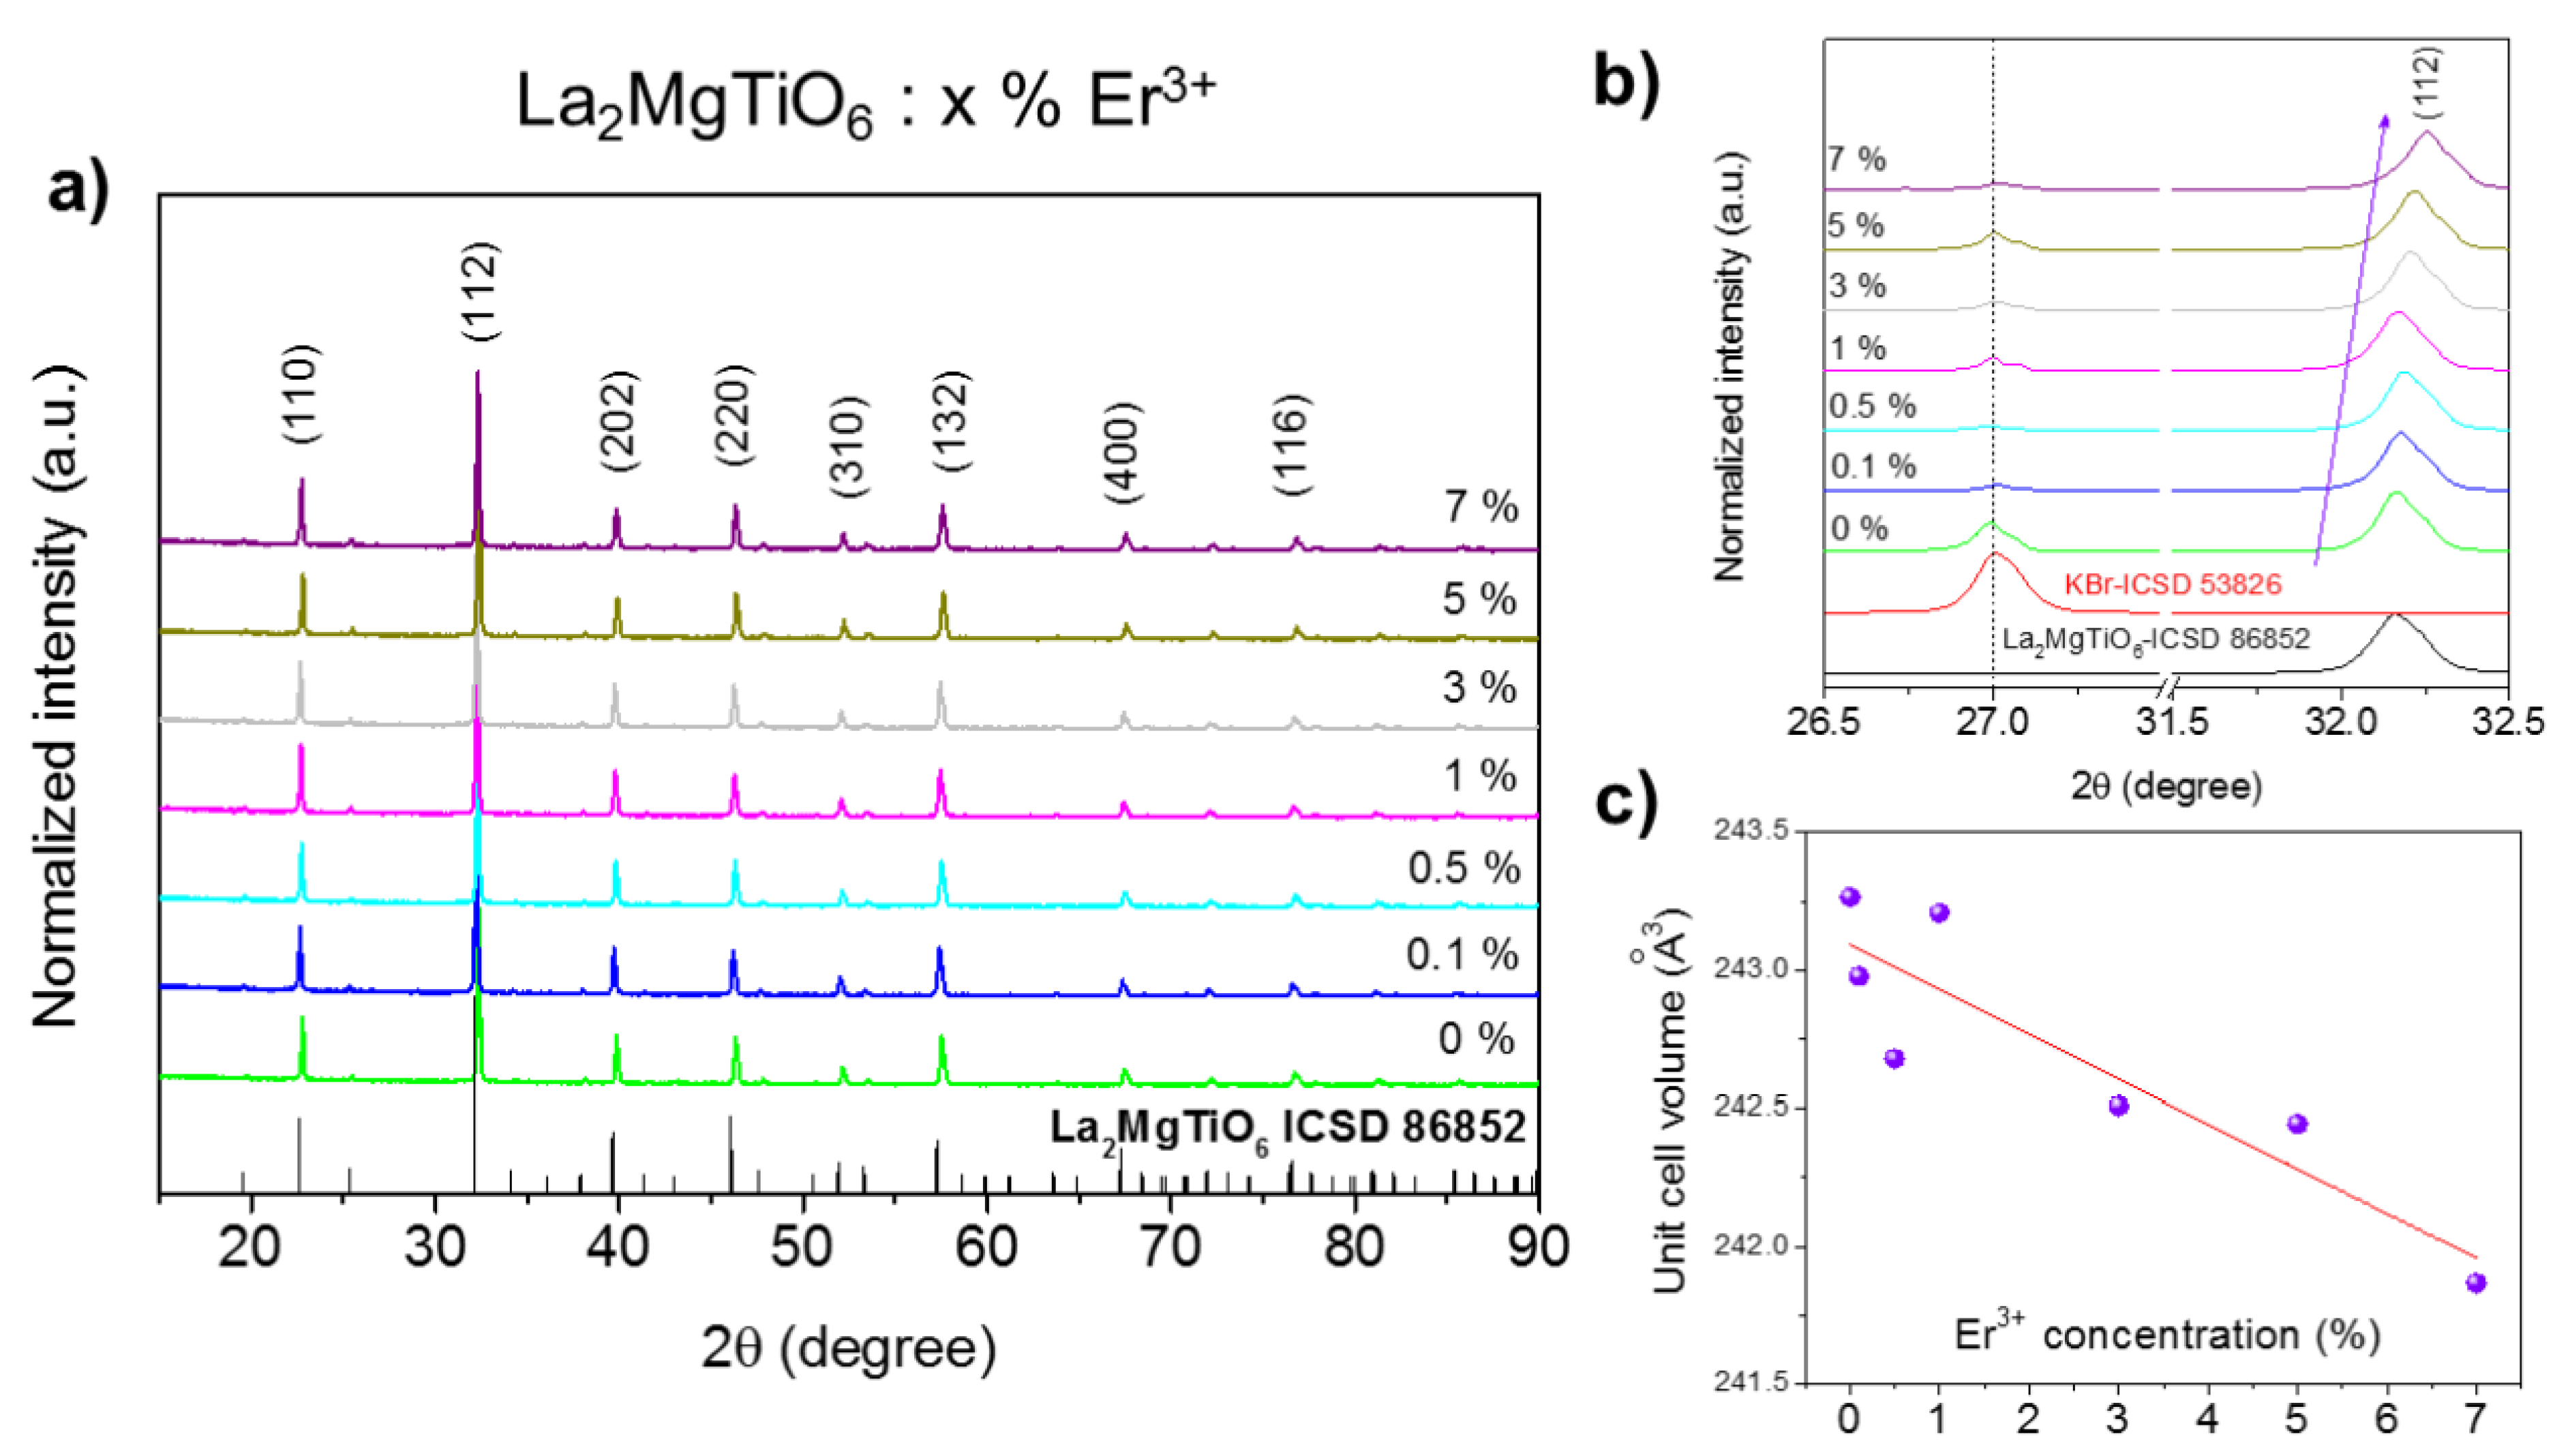
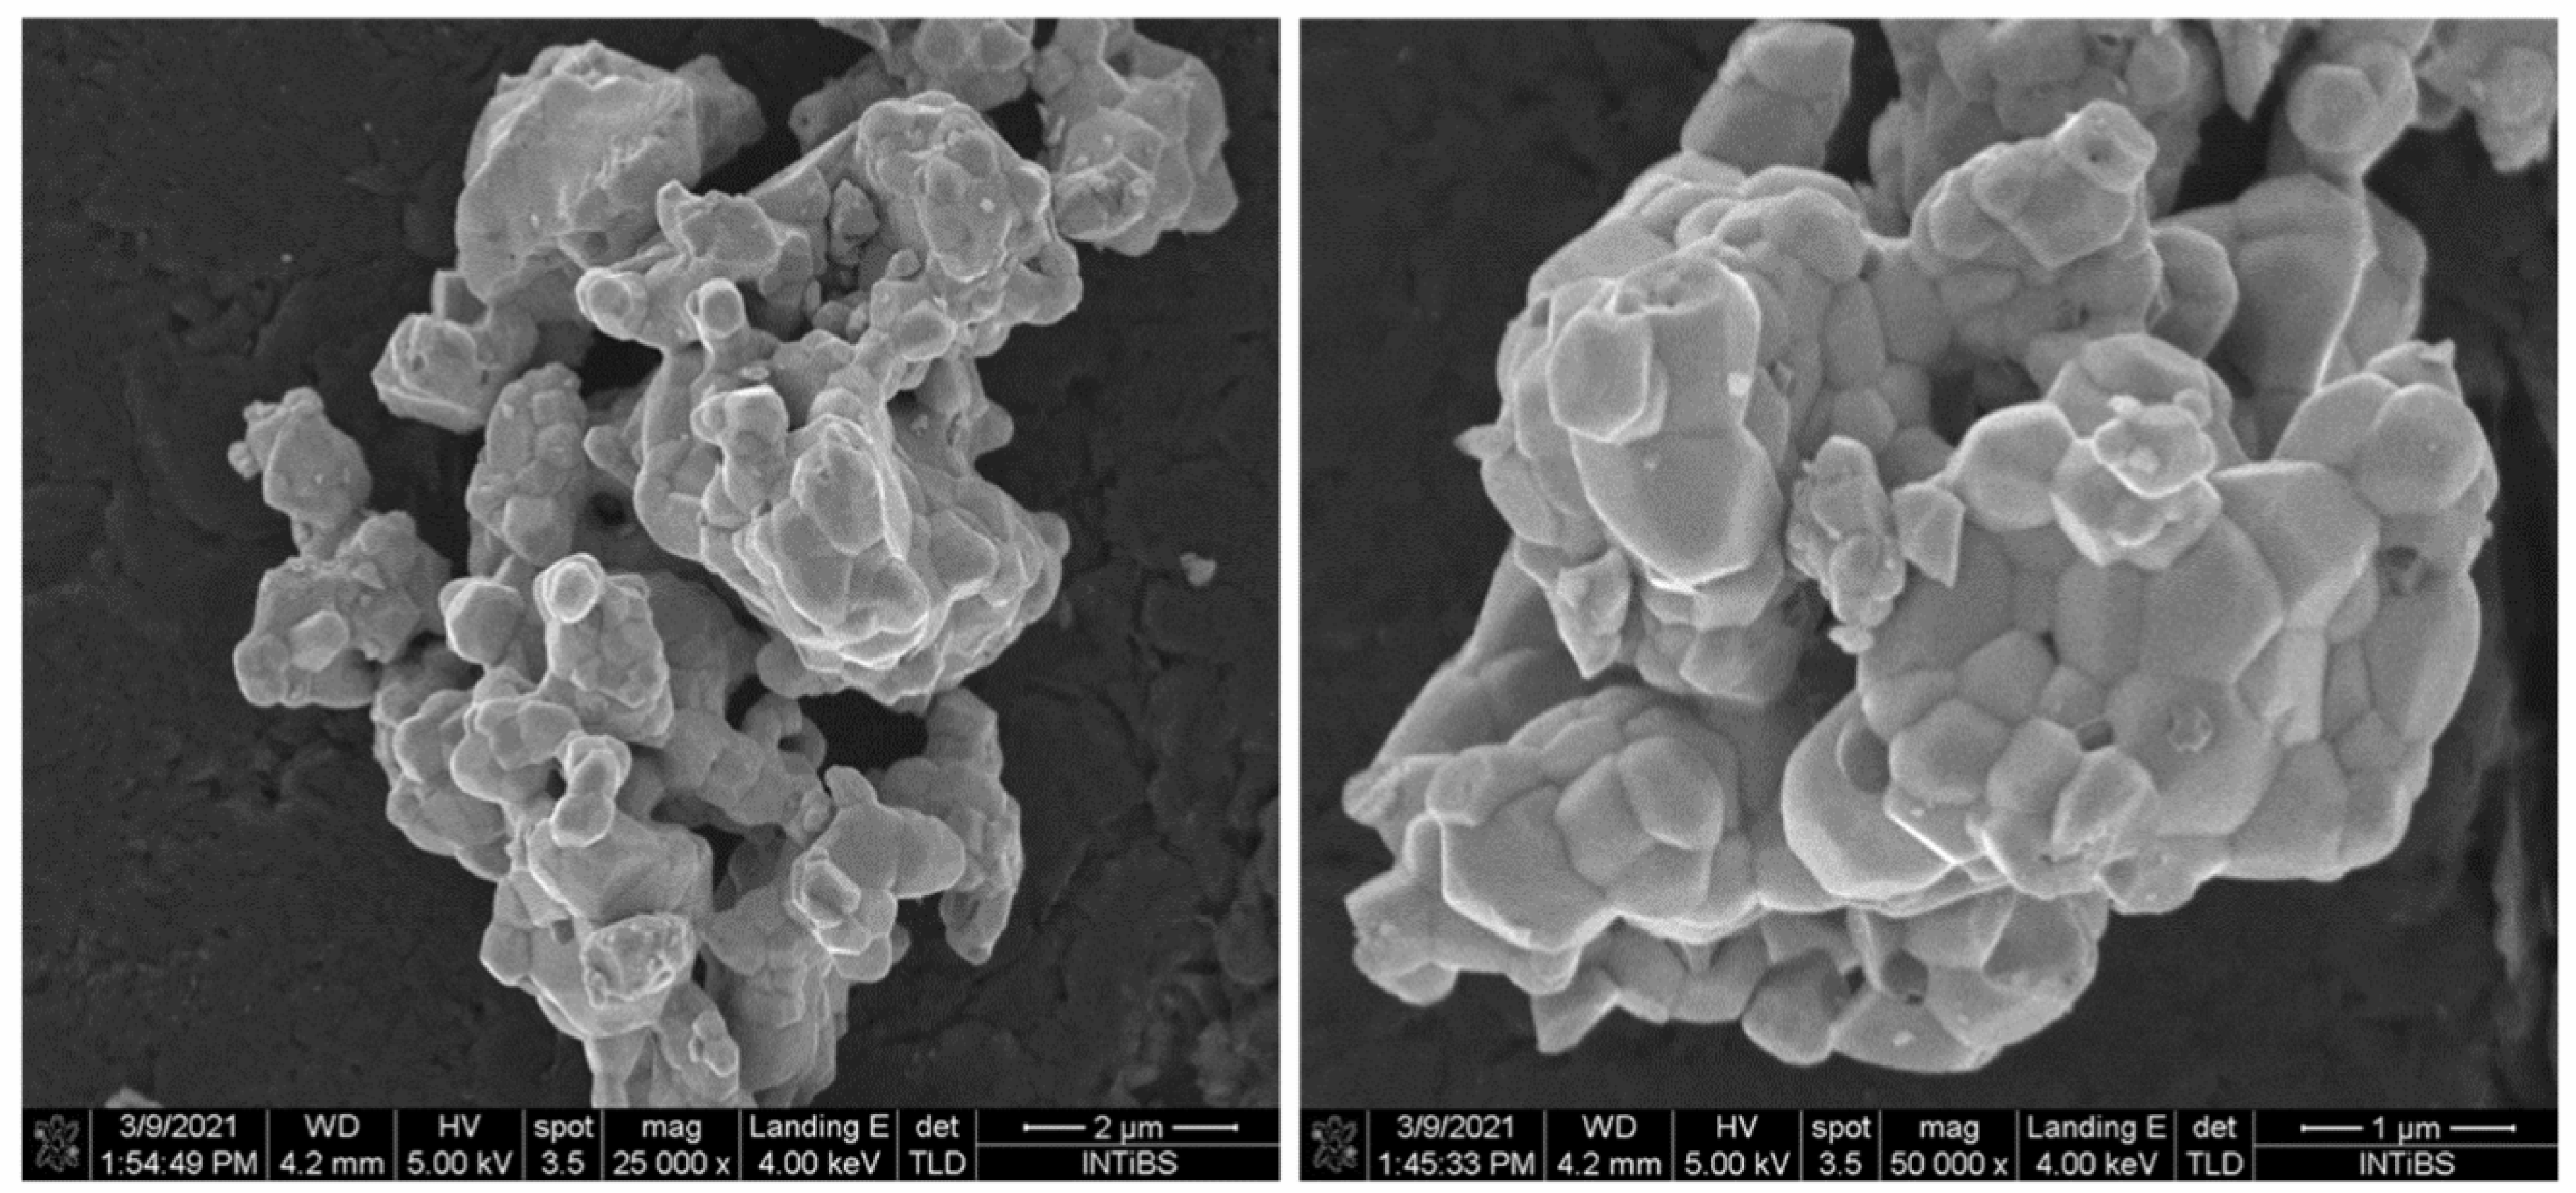
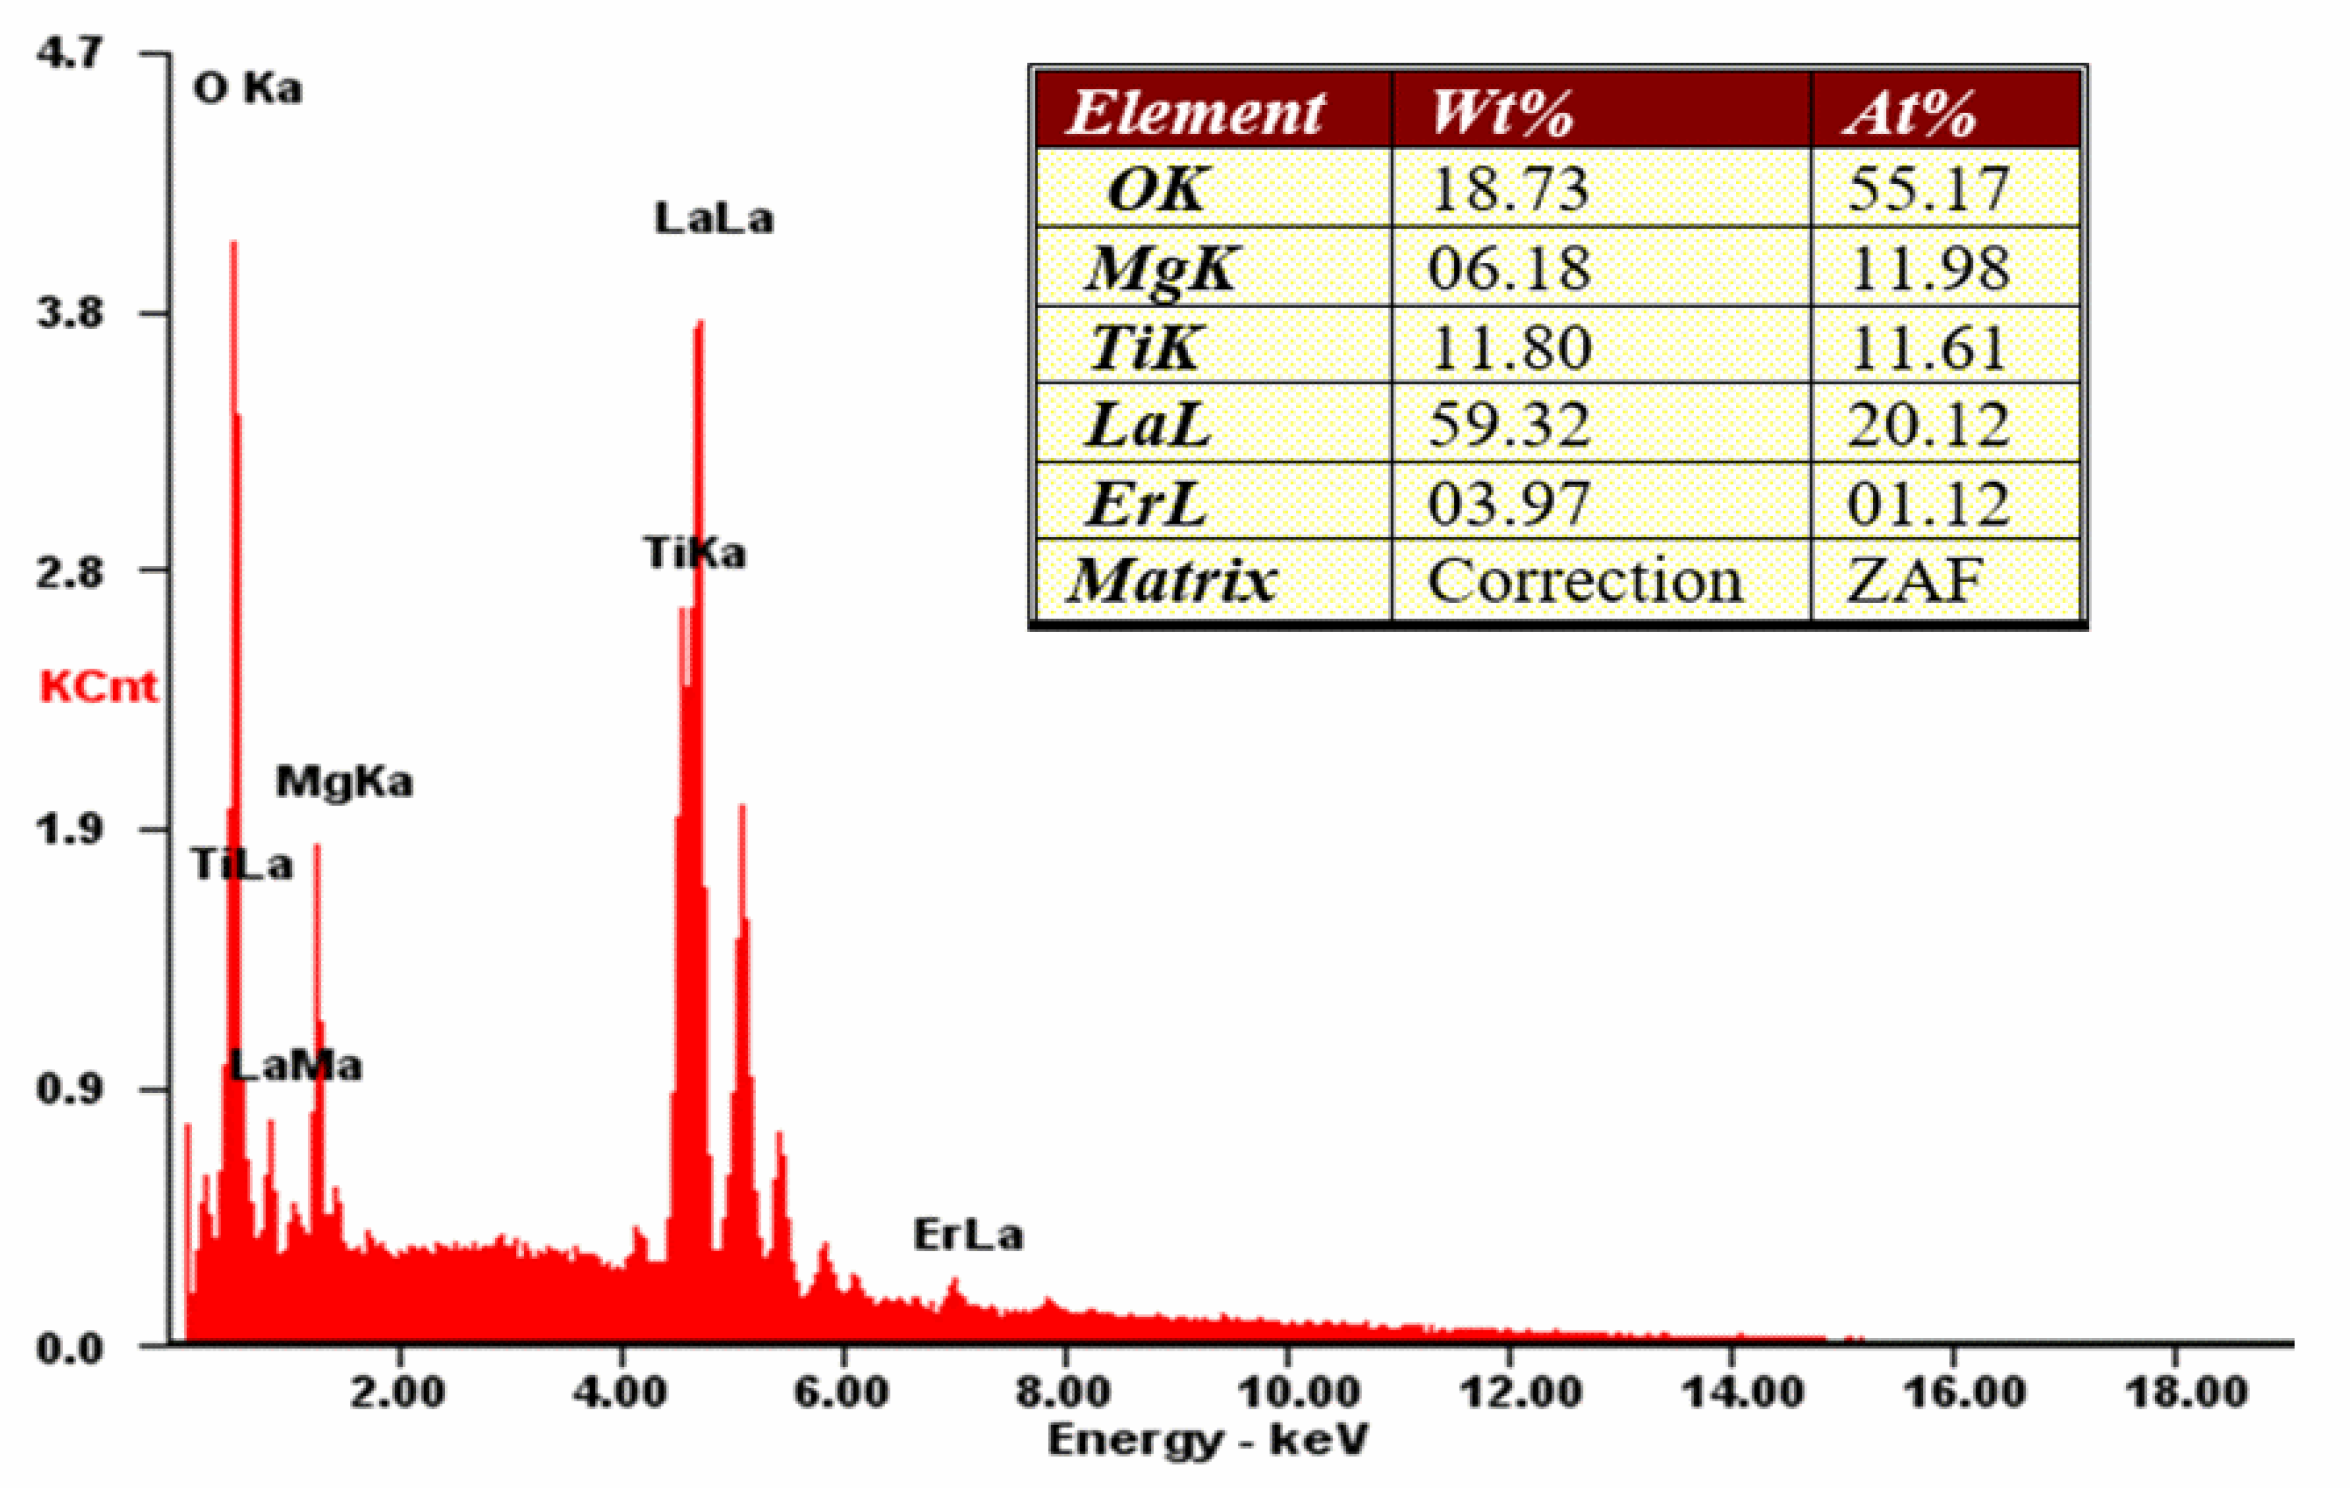
3.1. Structural and Morphological Characterization

The XRD patterns of all prepared samples and the standard pattern of La2MgTiO6 (ICSD no. 86852) are shown in Figure 1. All samples crystallized in an orthorhombic structure with space group Pbnm (62) with the following lattice parameters: a = 5.5609 (1), b = 5.5738 (1), c = 7.8623 (2), V = 243.69 Å3, and Z = 4 [2,3]. No impurity traces were found. The main diffraction lines of the samples observed at 2θ values of 22.72°, 32.33°, 39.87°, 46.30°, 52.16°, 57.59°, 67.52°, and 76.82° were assigned to the lattice planes (hkl) of (110), (112), (202), (220), (310), (132), (400), and (116), respectively [29].
Due to the similarity of charge and ionic radius (121.6 pm for La3+ and 106.2 pm for Er3+ with the same coordination number, CN = 9 [30]), it can be assumed that Er3+ ions most likely substituted for La3+ ions located in the Cs symmetry site. Therefore, the replacement of smaller Er3+ ions with larger La3+ ions resulted in the contraction of the crystal structure at higher dopant concentration. In order to prove our hypothesis, the XRD of all samples was measured again with a pure powder of potassium bromide (KBr, ICSD no. 53826), and the position of diffraction lines (2 θ = 32.3°) of La2MgTiO6 was corrected (Figure 1b). The observed right-shifting of the diffraction peaks (Figure 1b) and the shrinkage of the unit cell volume with an increase in Er3+ concentration (Figure 1c) confirmed the above assumption. The concentration-dependent lattice parameters are shown in Figure S1 (Supplementary Materials).
The morphology and the energy-dispersive spectroscopy (EDS) X-ray microanalysis of LMT:5% Er3+ are presented in Figure 2 and Figure 3, respectively. From the SEM images, no individual grains were observed, and the grain size ranged from 0.5 to 1.0 mm, much smaller than that (5 μm) obtained via the conventional solid-state method [25]. It is clearly shown that small grains were strongly aggerated to form bigger objects. From the EDS measurements, all elemental compositions of LMT:5% Er3+ were identified and quantified including La (59.32 wt.%), Er (3.97 wt.%), Mg (6.18 wt.%), Ti (11.8 wt.%), and O (18.73 wt.%). These values are consistent with the general chemical formula: La (58.8 wt.%), Er (3.73 wt.%), Mg (5.41 wt.%), Ti (10.67 wt.%), and O (21.39 wt.%).

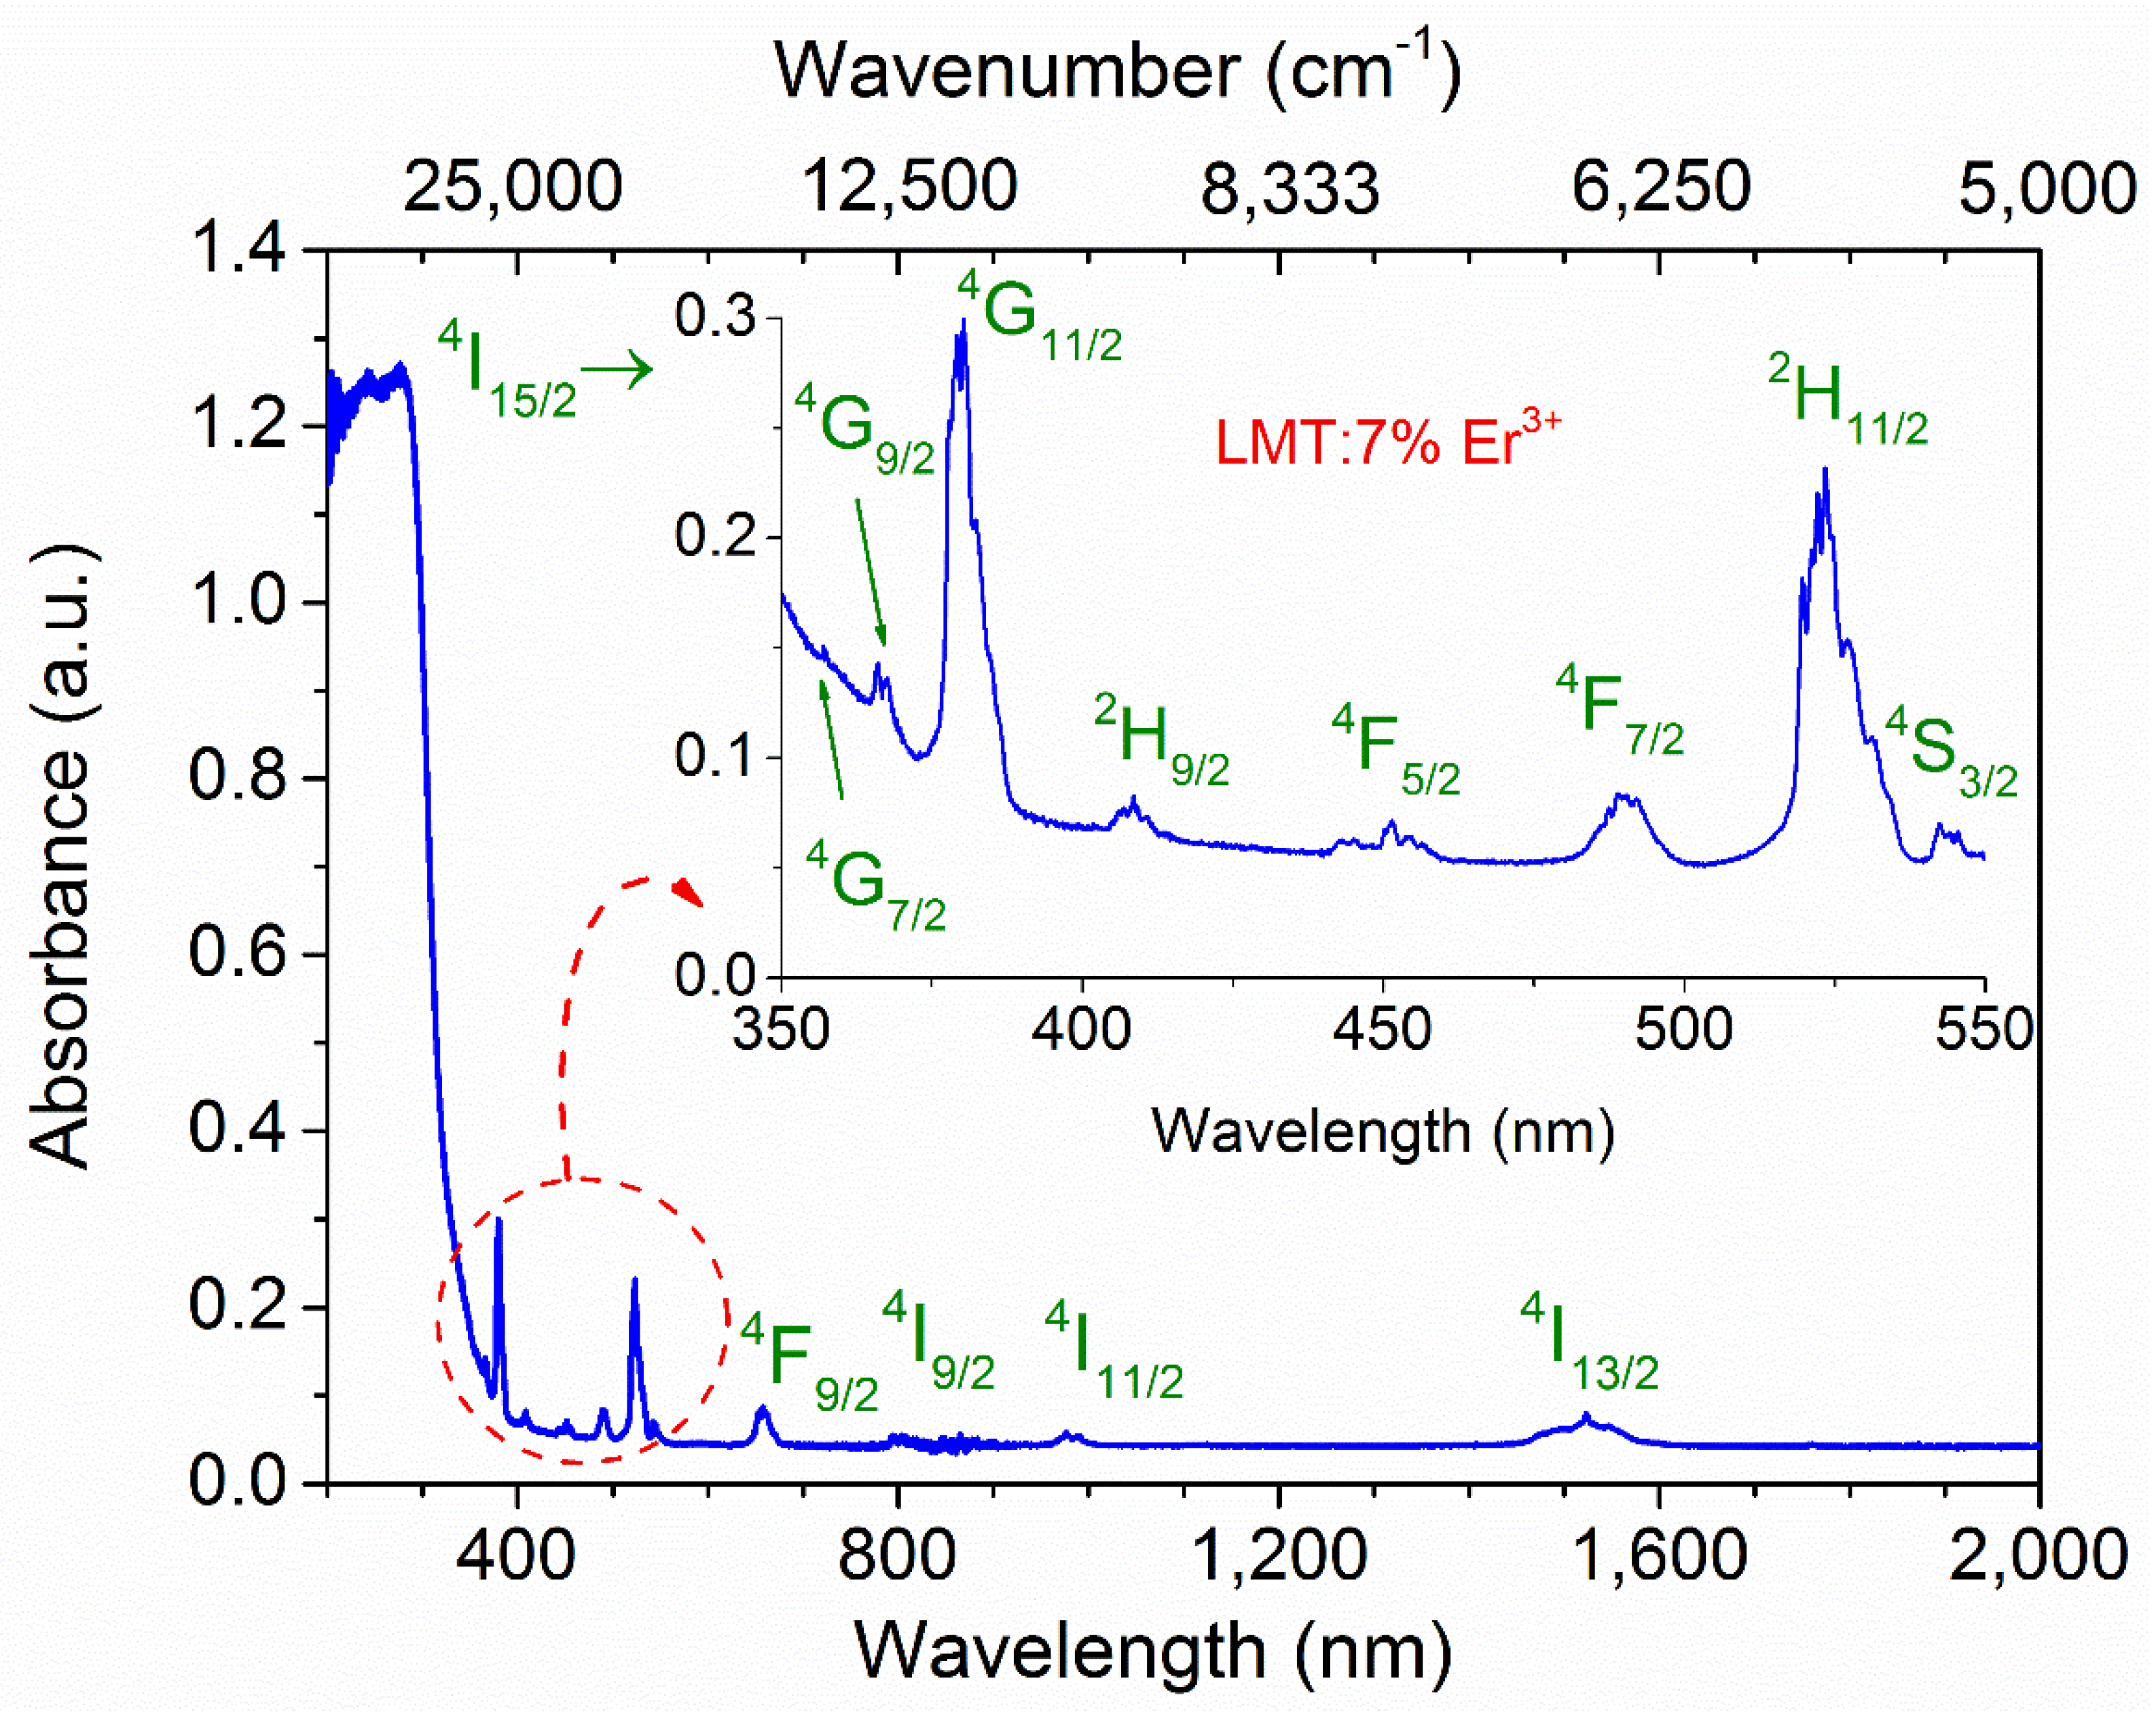
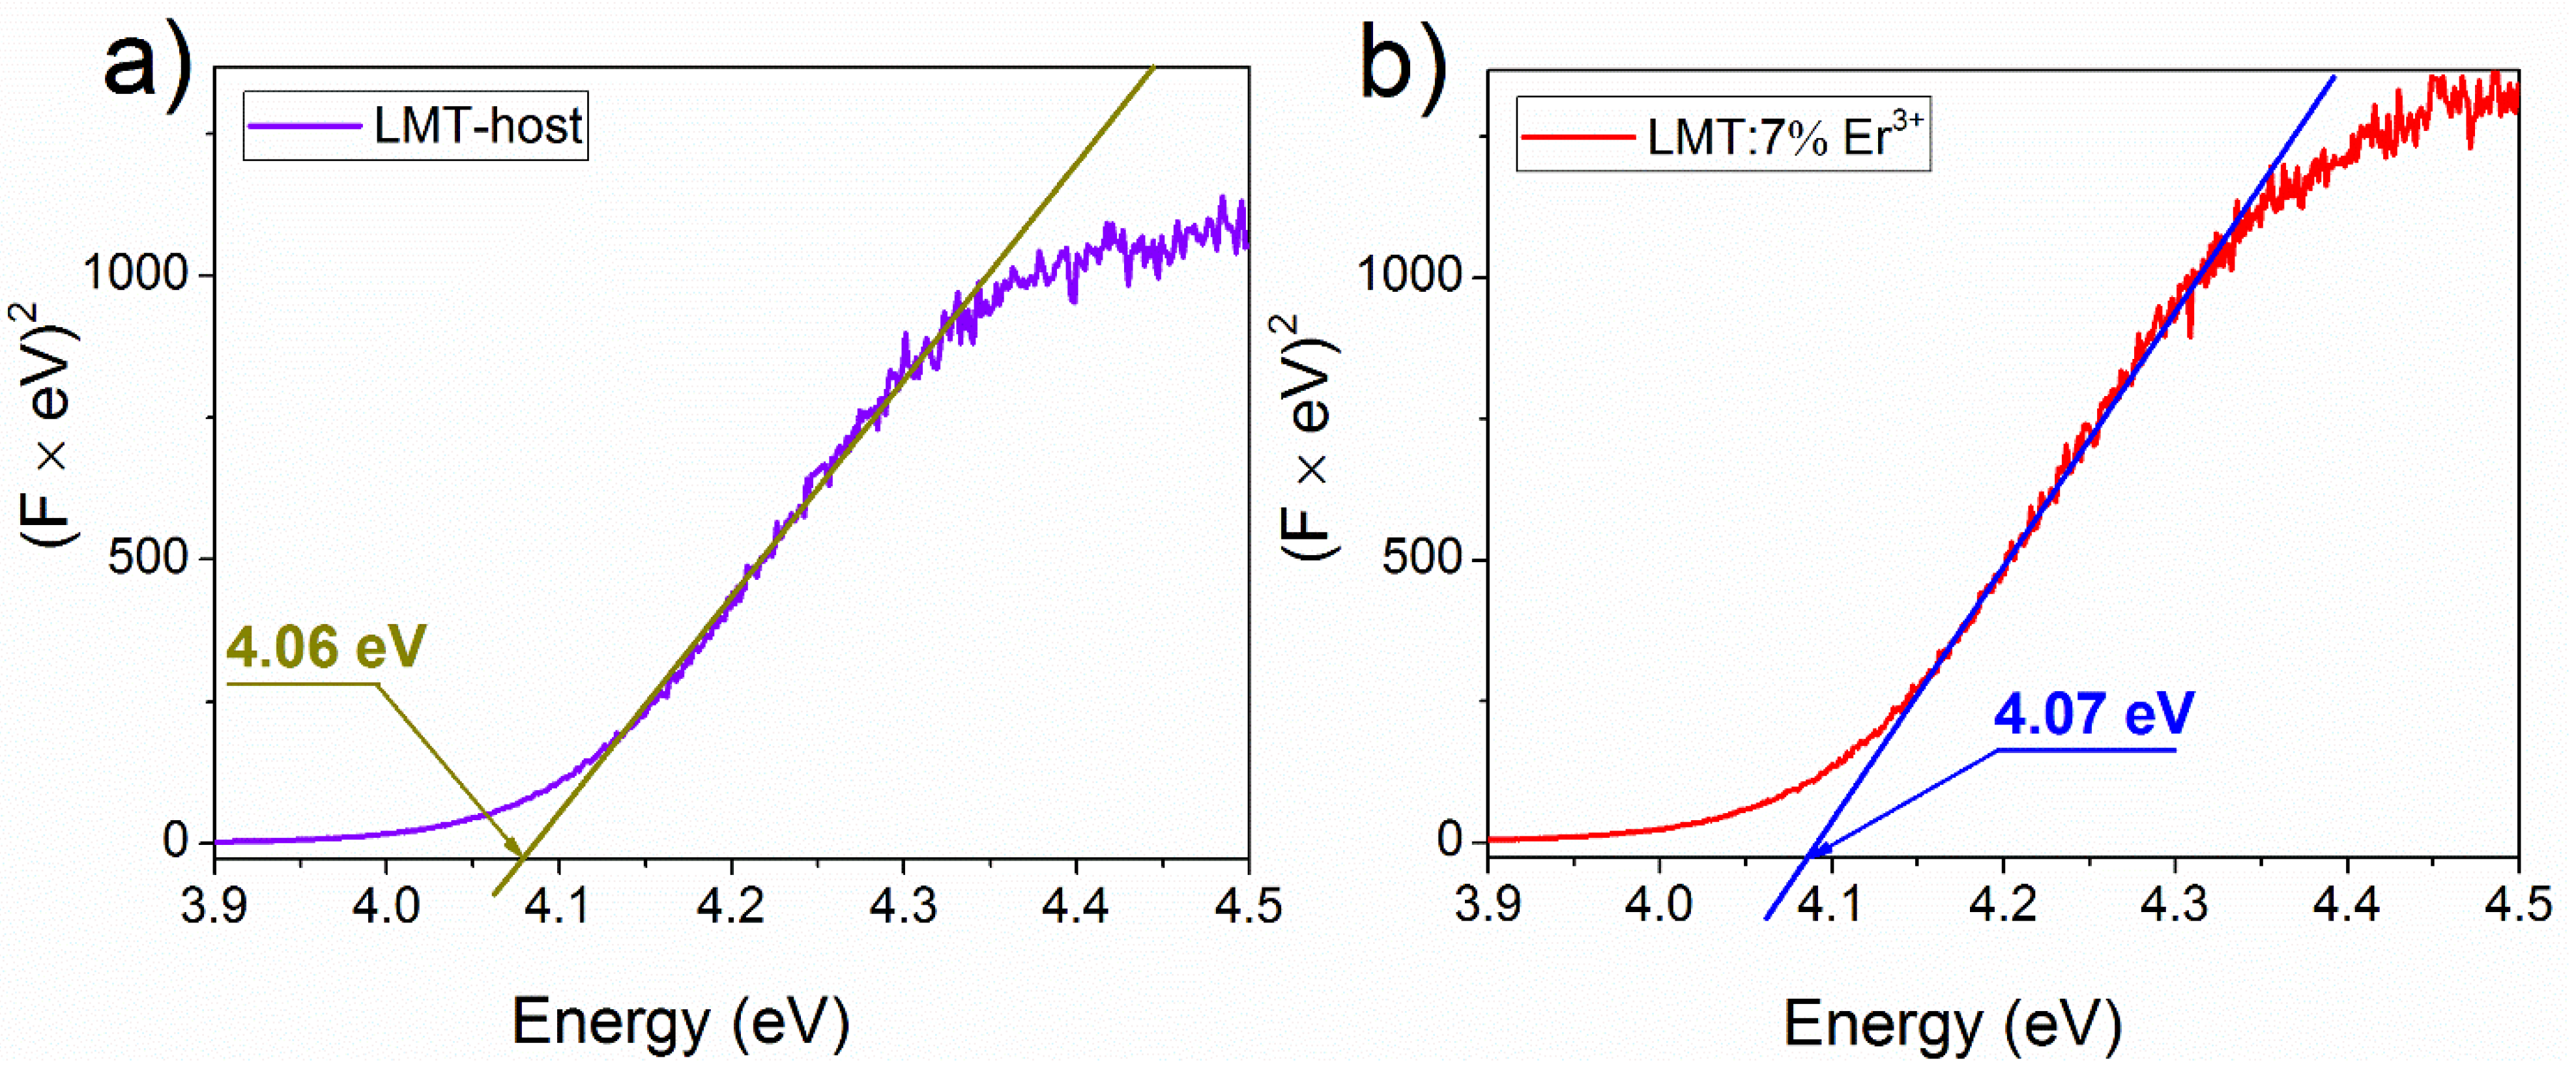
3.2. Absorption Spectrum

The absorption spectrum of LMT:7% Er3+ in the range of 200–2000 nm, shown in Figure 4, exhibited typical transitions for Er3+ ions. Intense absorption bands starting from 200 nm up to 350 nm were attributed to the absorption of the host. In accordance with previous studies [6,31,32,33], the obtained absorption lines were well assigned to the typical f–f transitions of Er3+ ions from ground state 4I15/2 to the successive excited states including 4G7/2, 4G9/2, 4G11/2, 2H9/2, 4F5/2, 4F7/2, 2H11/2, 4S3/2, 4F9/2, 4I9/2, 4I11/2, and 4I13/2, among which, 4I15/2 → 4G11/2 was the dominant one (see the inset in Figure 4).
To determine the energy of the forbidden bandgap of the host and the sample doped with 7% Er3+, the modified Kubelka–Munk function (also known as the Tauc method) [34] was applied to the 300 K absorption spectra. The energy gap between the top of the valence band and the bottom of the conduction band of the host and LMT:7% Er3+ were found to be 4.06 eV and 4.07 eV, respectively (Figure 5). The insignificant difference between them could have resulted from a measurement error. This value was slightly higher than that (3.98 eV) obtained for the same Pr3+-doped host [17].

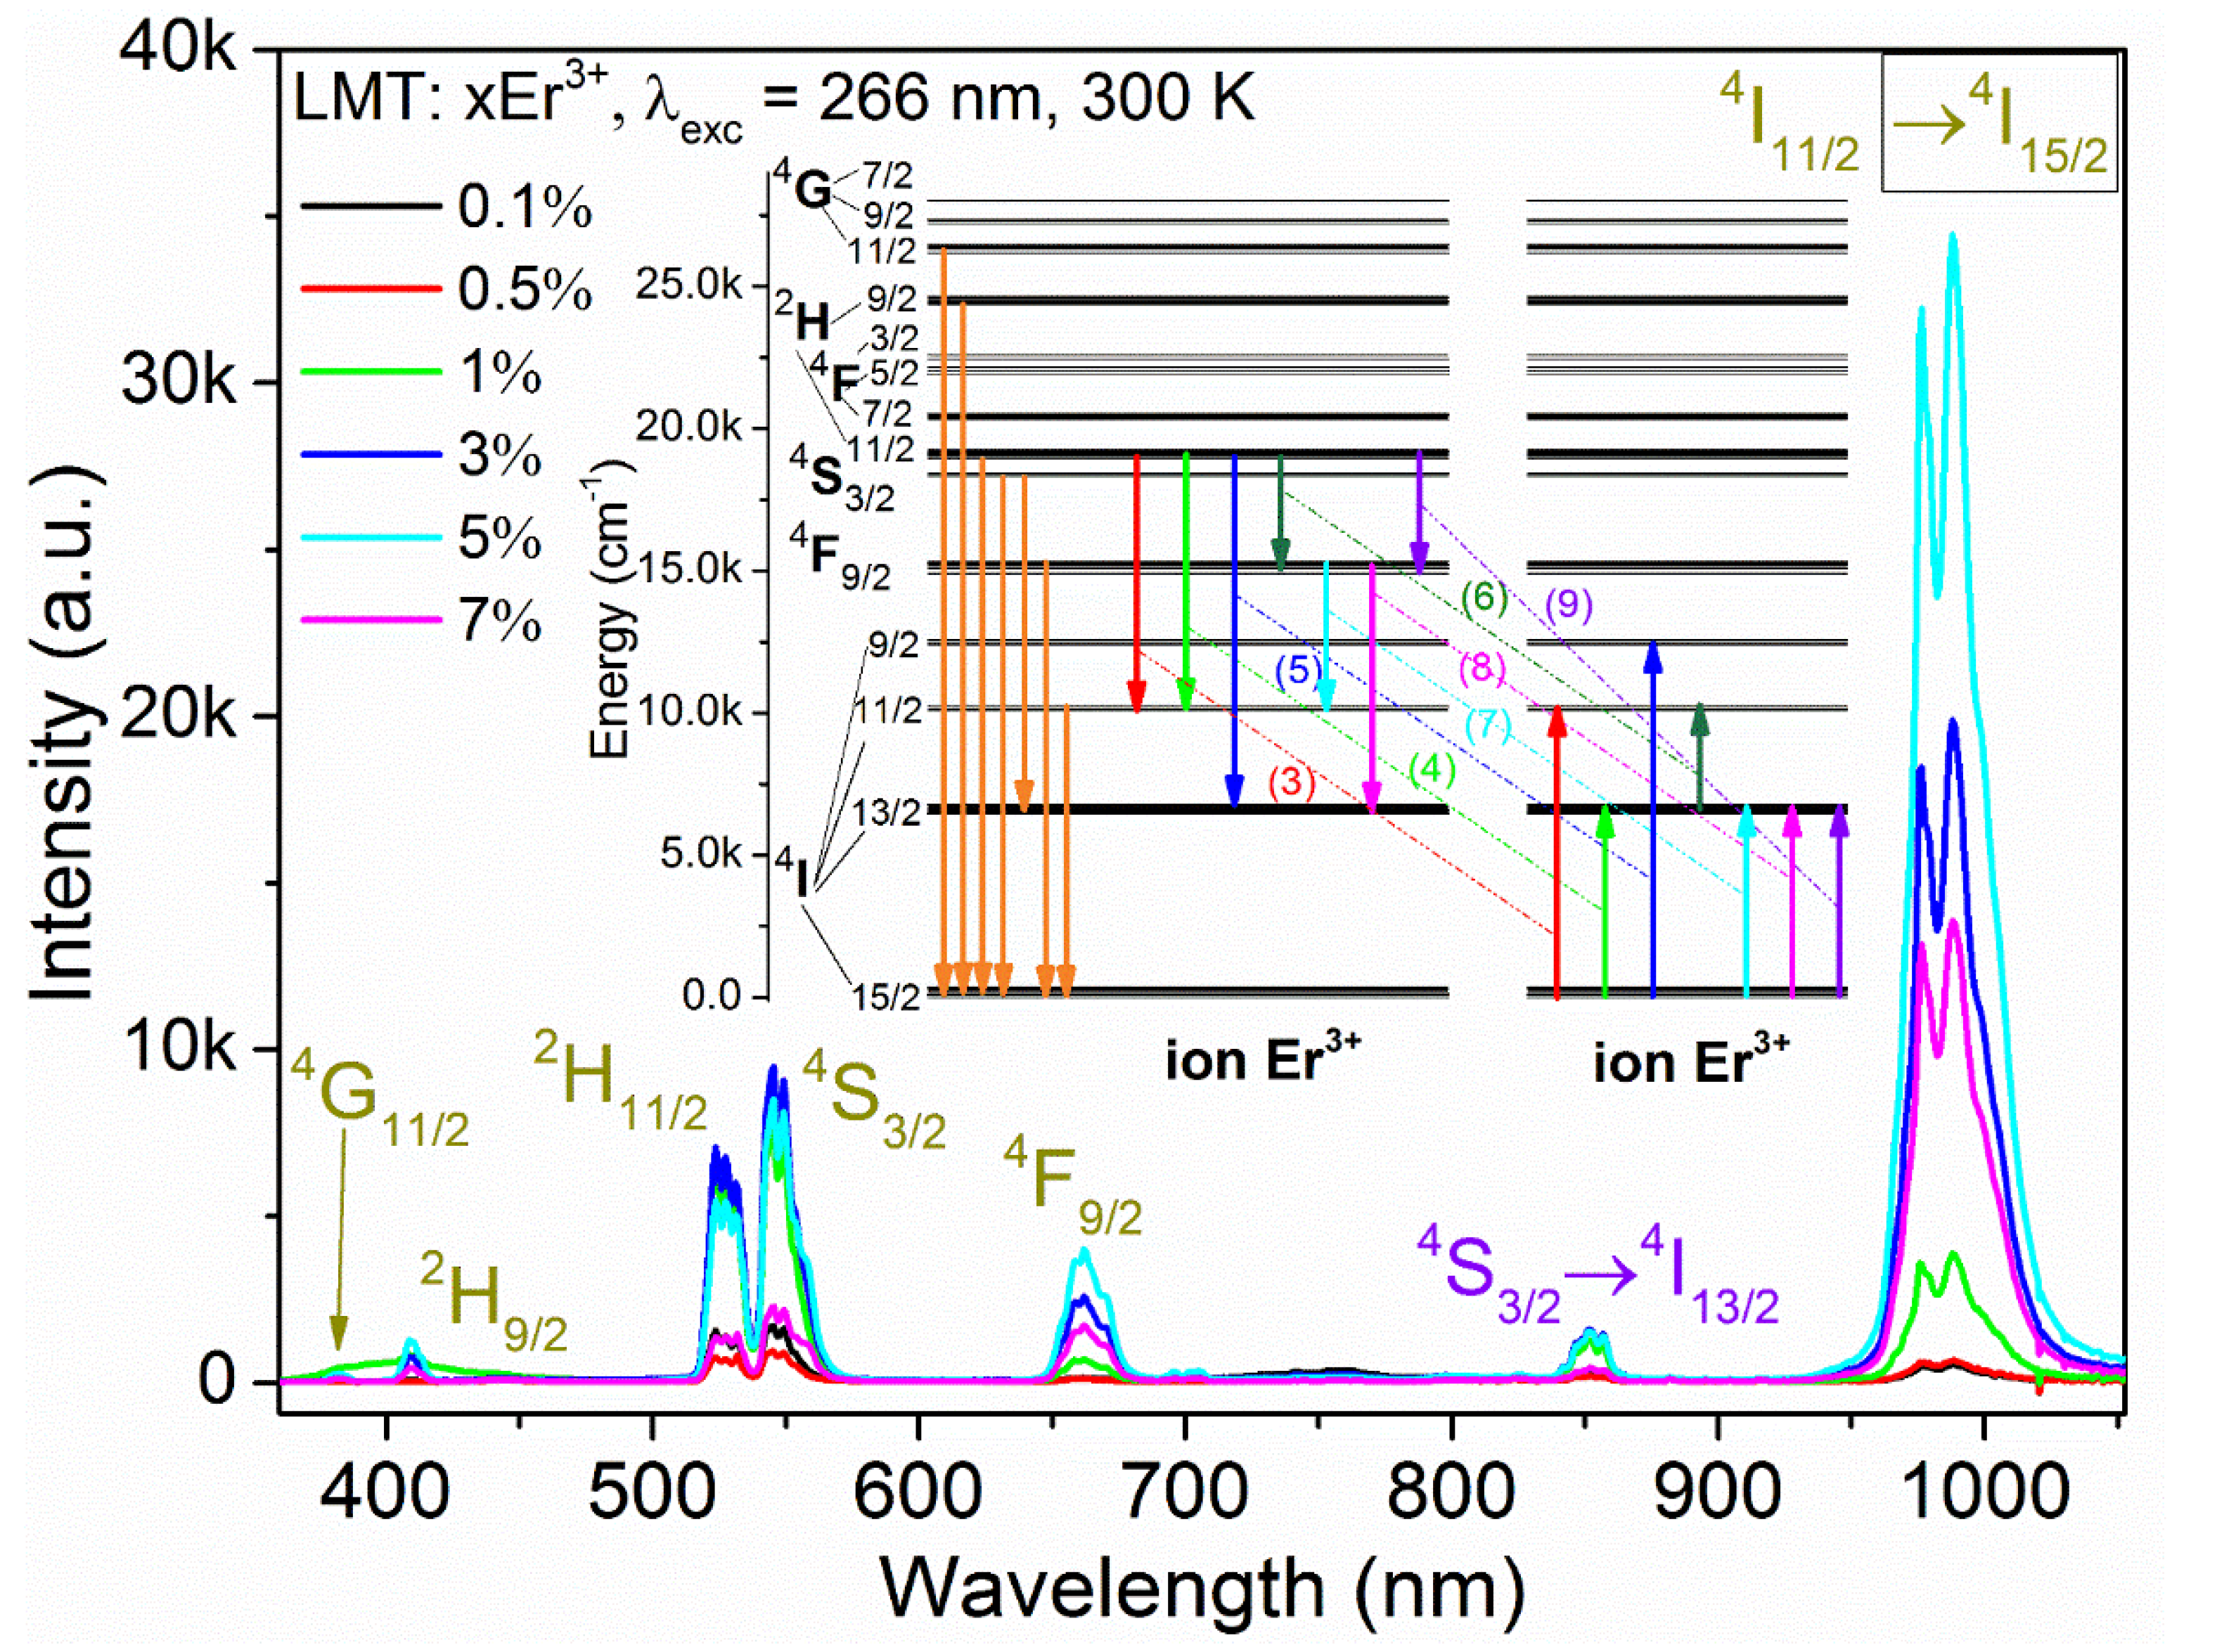
3.3. Luminescence Studies

A wide spectral range from visible to the near-infrared of LMT doped with different concentrations of Er3+ ions, observed for 266 nm wavelength direct excitation of TiO6 groups, is shown in Figure 6. As can be seen, there was no difference in the shape of the emission spectrum across the samples. According to the absorption spectrum (Figure 4) and the emission spectra (Figure 6), the assignment of all energy levels of Er3+ ions was tabulated in Table S1.
Similarly to the LMT samples doped with Eu3+ [3] and Nd3+ [2], a broad emission band of TiO6 groups also appeared from 400 nm to 550 nm at 77 K (Figure S2). The energy transfer from TiO6 groups to Er3+ ions was perfectly exemplified by temperature and Er3+ concentration. A higher Er3+ content resulted in a lower intensity of the emission of TiO6 groups. This process was also facilitated by elevating temperature. No TiO6 emission was observed at room temperature (Figure 6). For visible emission including 2H11/2, 4S3/2, and 4F9/2 to the ground state, 4I15/2 located in the green, yellow, and red regions was centered at 531.7 nm (18,807 cm−1), 549 nm (18,215 cm−1), and 662 nm (15,106 cm−1), respectively. In addition, infrared emission from 4I11/2 and 4I13/2 levels to the ground state was maximum at 988 nm (10,121 cm−1) and 1524 nm (6562 cm−1), respectively (Figure S3). Furthermore, the emission spectra were also contributed to by a few less intense transitions corresponding to 4G11/2, 2H9/2 → 4I15/2, and 4S3/2 → 4I13/2 levels.
The energy difference (∆E) between 2H11/2 and 4S3/2 was 592 cm−1; this value is similar to that found in LaAlO3:Er3+ with 660 cm−1 [6]. Due to the small energy difference, the transition from 2H11/2 to ground state can be easily populated at room temperature by thermalization (see Figure 6).
Temperature plays an important role in the thermal population of 2H11/2 from the 4S3/2 level. It is regulated by the following Boltzmann distribution formula:
N A N B = g A g B exp ( Δ E kT ) ,
where NA (NB) is the population of level 2H11/2 (4S3/2), gA (gB) is the degeneration of level 2H11/2 (4S3/2), k is the Boltzmann constant, and ΔE is the energy difference between these levels. These levels were further considered in terms of temperature sensing.
Moreover, the integrated emission intensity of all samples is plotted in the inset. It can be clearly seen that the integrated intensity moderately increased with Er3+ concentration. The highest intensity was achieved for the sample doped with 5% Er3+ (Figure S4). Above this threshold value, the intensity decreased as a result of concentration quenching. This phenomenon could result from an exchange interaction or multipolar interaction depending on the critical transfer distance Rc between Er3+ ions. Therefore, to better understand, Blasse’s model was applied [35].
R C = 2 × ( 3 V 4 π x C N ) 1 / 3 ,
where V is the unit cell volume, and xc is the quenching concentration. For samples doped with 5% Er3+, V = 242.45 Å3, xc = 0.05, and N = 4. The value of R C was equal to 13.2 Å, indicating that the quenching mechanism which occurred in LMT:Er3+ samples was predominantly regulated by the electric multipolar interaction. A similar phenomenon was previously observed in LMT doped with Nd3+ ions [2].
The analysis of the emission spectra of LMT:Er3+ allowed concluding that, with the increase in the concentration of doping ions, two competing phenomena are observed. The increased amount of Er3+ ions initially led to an increase in the emission intensity of all bands (see Figure S5); however, the intensity of each of these bands changed differently depending on the Er3+ concentration. Due to thermalization at 300 K, both 2H11/2 and 4S3/2 levels could be regarded as one. It can be seen that, in the range 1–5% Er3+, the emission intensity of 4S3/2 remained almost constant with a local maximum for 3%. On the other hand, the emission of the 4F9/2 and 4I11/2 levels increased from the 0.5% Er3+ concentration. This was mainly to the detriment of the (2H11/2, 4S3/2) level, which transferred energies to these lower levels in the process of cross-relaxation. As the dopant concentration increased, the likelihood of these processes increased as a function of the number of Er3+ ion pairs. If one of the ions in a pair was excited and the other was not, the first would be the donor and the second would be the acceptor, and the energy transfer processes could be described as follows:
(2H11/2 + 4S3/2, 4I15/2) → (4I11/2, 4I11/2), ΔE = −1130 cm−1,
(2H11/2 + 4S3/2, 4I15/2) → (4I11/2, 4I13/2), ΔE = 2210 cm−1,
(2H11/2 + 4S3/2, 4I15/2) → (4I13/2, 4I9/2), ΔE = 93 cm−1.
At continuous wave excitation, the 4I13/2 level would be populated; therefore, it is possible to write another path of the CR process as follows:
(2H11/2 + 4S3/2, 4I13/2) → (4I9/2, 4I11/2), ΔE = 436 cm−1.
The 4I11/2 level could also be fed in another cross-relaxation process from the 4F9/2 level as follows:
(4F9/2, 4I15/2) → (4I11/2, 4I13/2) ΔE = −1530 cm−1.
The 4F9/2 level could also be drained by the following process:
(4F9/2, 4I15/2) → (4I13/2, 4I13/2) ΔE = 1500 cm−1.
There was a certain probability of the following CR populating the 4F9/2 level:
(2H11/2 + 4S3/2, 4I15/2) → (4F9/2, 4I13/2) ΔE = −2280 cm−1.
Please note that the maximum energy phonon of this host was found to be 741 cm−1 [36]. In the processes described by Equations (3), (7), and (9), there is a shortage of energy, which can easily be obtained from the crystal lattice at 300 K. These are phonon-assisted processes; however, the process described by Equation (9), requiring the assistance of up to three phonons, is the least likely in this list. In the processes described by Equations (4) and (8), a small excess of energy would be easily absorbed by the crystal lattice. All processes are pictured in the inset of Figure 6.

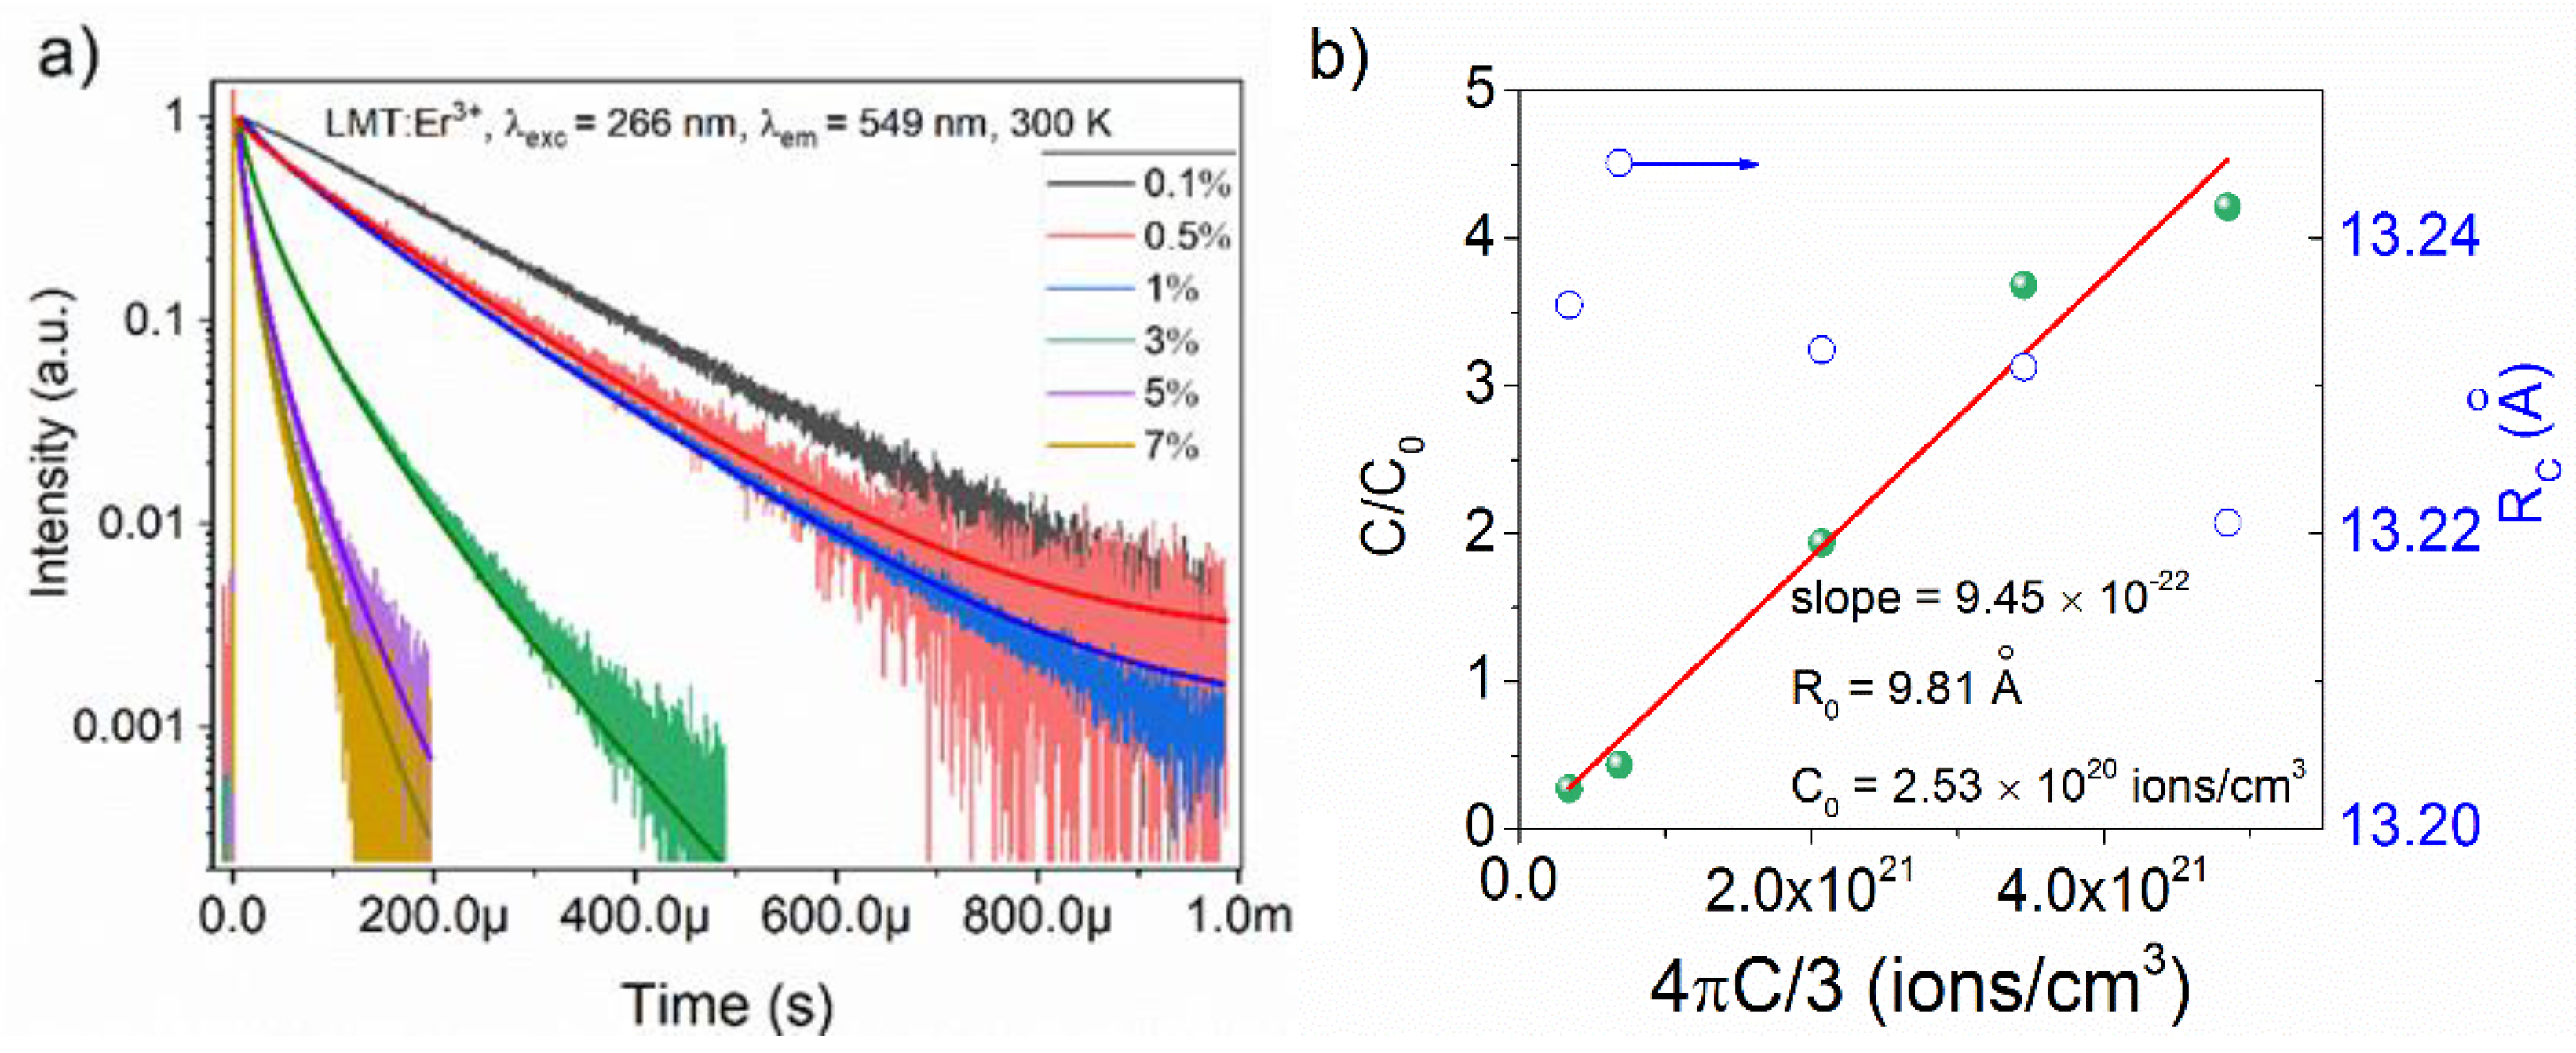
3.4. Luminescent Decay Profiles

To better understand the quenching behavior of the green, red, and IR emission, the decay profiles of some samples at room temperature, registered at 549 nm, 662 nm, and 988 nm corresponding to 4S3/2, 4F9/2, and 4I11/2 levels were taken into account (Figure S6). Nonexponential decay was observed for the samples doped with more than 1% Er3+. Due to the thermalization phenomenon, the decay of the 4S3/2 level consisted of two components attributed to 4S3/2 and 2H11/2, respectively. Similarly, nonexponential luminescent decay monitored at 4F9/2 was contributed by the 4F9/2 and 4S3/2 levels. The decay time of 4F9/2 level was twofold shorter than that of the 4S3/2 level observed for the samples containing less than 3% Er3+. Among these levels, the decay time of the 4I11/2 level was the longest one, as also observed for LaAlO3:Er3+ [6]. In addition, a very fast rise time was obtained for all samples as a result of cross-relaxation processes (Figure S6 and Table S2).
Figure S5 shows the integrated emission intensity of some levels, including 2H11/2 (I2), 4S3/2 (I3), 4F9/2 (I4), and 4I11/2 (I6) to ground state 4I15/2. The observed emission of each level can be contributed by radiative emission or nonradiative relaxation (multi-phonon relaxation) and cross-relaxation phenomena.
As can be clearly seen, the 300 K decay profiles upon 266 nm excitation (except for the sample doped with 0.1% Er3+) exhibited a nonexponential behavior on account of the energy transfer between Er3+ ions (Figure 7). Thus, the Inokuti–Hirayama model was used to calculate the critical transfer distance R 0 and the critical concentration C 0 by the following equation [37]:
I t = I 0 exp [ t τ α × ( t τ ) 3 s ] + ( offset ) ,
where I 0 ,   I t represent the emission intensity at t = 0 and after pulse excitation, τ   is the radiative decay time, C is the Er3+ concentration, C 0 is the Er3+ critical concentration, Γ ( 1 3 S ) is the gamma function, S defines the dipole–dipole, dipole–quadrupole, and quadrupole–quadrupole interactions corresponding to S = 6, 8, and 10, respectively, and Q is the energy transfer parameter [37,38,39,40].
α = 4 π 3 × Γ ( 1 3 S ) × C × R 0 3 ,
where R 0 stands for the critical transfer distance at which the energy transfer efficiency achieves 50% and is equal the radiative decay rate τ 0 1 .
The correlation of C ,   C 0 ,   R 0   can be derived from Equations (10) and (11) to yield the following formula [37,38,39,40]:
C C 0 = 4 π CR 0 3 3 .
The donor–acceptor energy transfer parameter ( C da ) and the energy transfer probability ( W da ) can be calculated using the following equations [40,41,42,43]:
C da = R 0 6 × τ 0 1 ,
W da = R 0 6 × C da =   τ 0 1 .
The energy transfer decay rates of the samples as a function of Er3+ concentration can be estimated as follows:
W tot = W rad + W da = 1 τ rad + W da ,
where τ rad is supposedly equal to the decay time of the sample doped with 0.1% Er3+ ( τ rad   = 166 μs, Table S2).
W tot = aC n + b ,
where n indicates the strength of the multipole interaction between dopants; a weak interaction is exhibited by n = 1, while a strong one is exhibited by n = 2 [43].
As seen in Figure 7, the dipole–dipole interaction was responsible for the energy transfer in all samples, as exemplified by the best-fitting curves for S = 6. The experimental data can be described by Equation (12) as a linear function of the density of Er3+ ions (Figure 7b). The value of R 0 was 9.81 Å, similar to the R c derived from the Blasse model. However, it is worth emphasizing that the values have different physical meaning [44]. Furthermore, C 0 = 2.53 × 10 20 ions/cm−3, whereas C da   and W da were estimated by considering the radiative decay time value of the sample doped with 0.1% Er3+ as τ rad = 166 μs. Thereafter, C da   and W da were found to be 5.38 × 10 39   cm6·s−1 and 6020 s−1, respectively. With n = 1.8 obtained from the fitting curve (Figure S7), one can conclude that a strong interaction among Er3+ ions happened in LMT at 300 K.

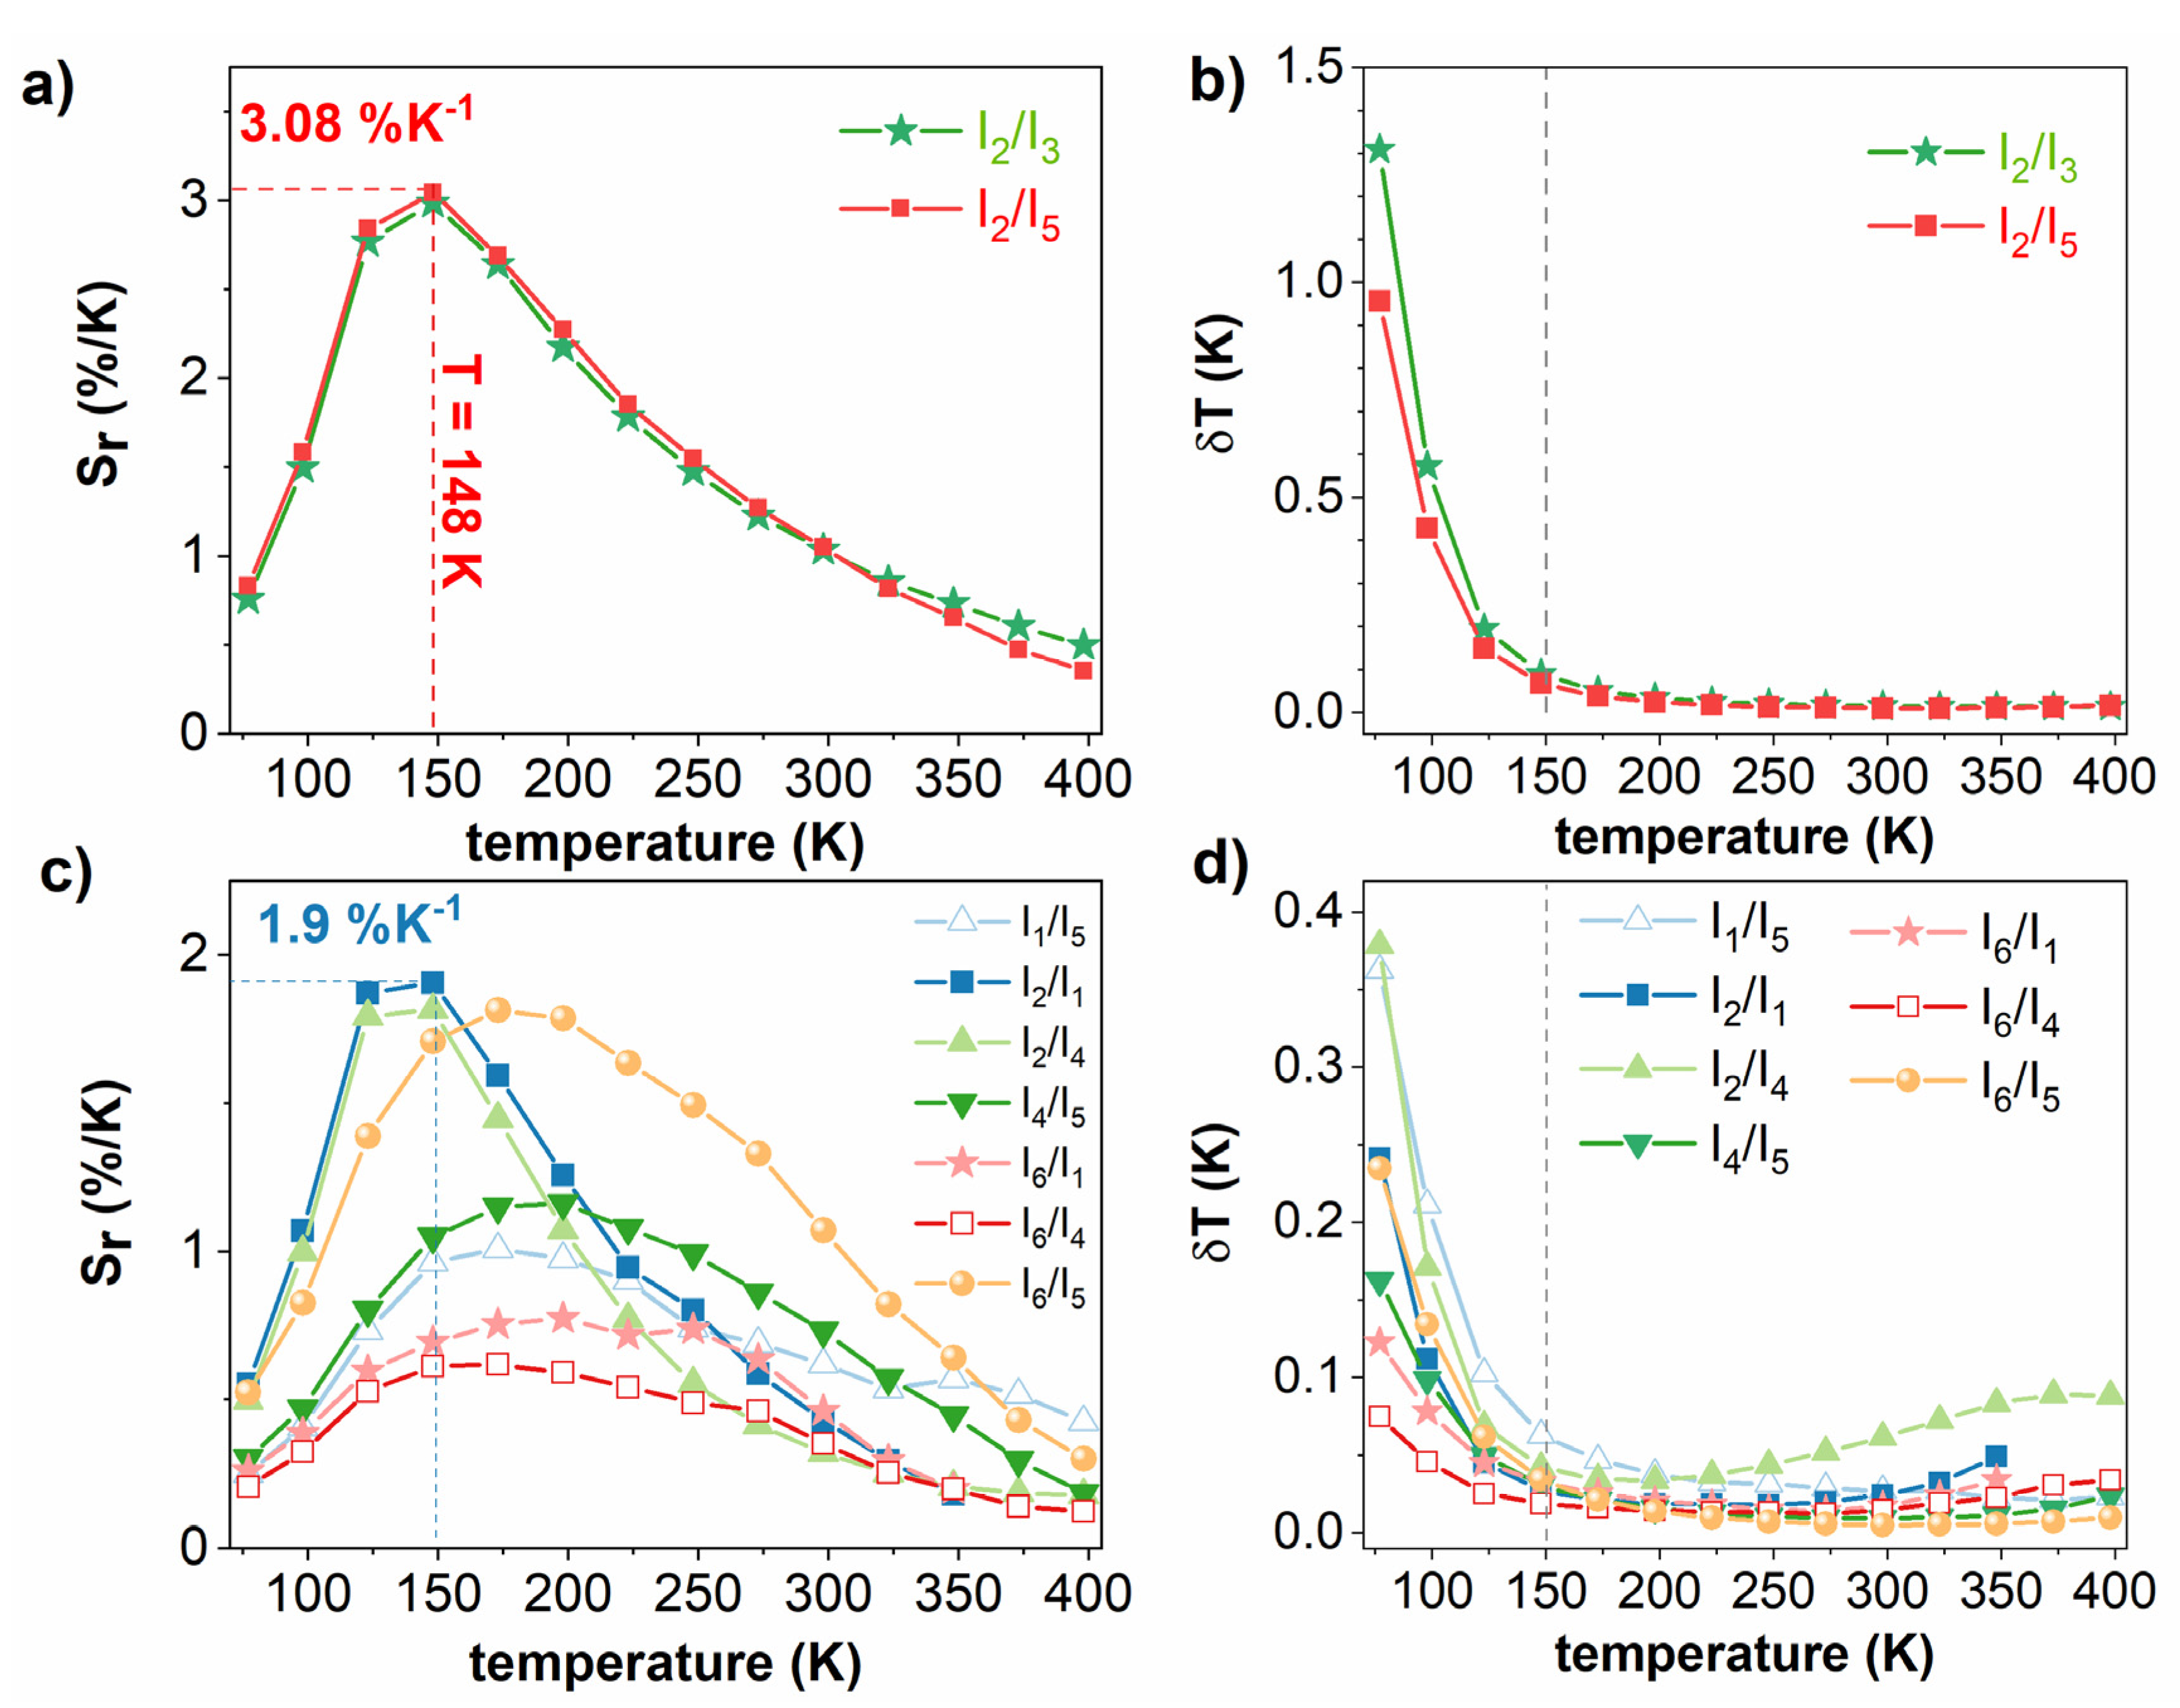
3.5. Temperature-Sensing Ability

Furthermore, the temperature dependence of the emission intensity of LMT 5% Er3+ is presented in Figure 8 for the 77–398 K range, and the temperature-dependent integrated emission intensity of some levels is also shown in the inset. It is shown that the most intense emission came from 4S3/24I15/2 (I3). In general, I3 and some other levels, including 2H9/24I15/2 (I1), 4S3/24I13/2 (I5), and 4F3/24I15/2 (I4), are strongly depopulated by elevating temperature, especially I3 since it acts as an energy pump for the 2H11/2 x2192; 4I15/2 transition (I2) via the thermalization process. The emission of I2 reached its maximum at 248 K, before being quenched very quickly at a higher temperature. On the other hand, the 4I11/2 → 4I15/2 transition (I6) was quite stable, remaining mostly unchanged until 248 K, at which point it then exhibited a significant decrease.
To verify the potential applicability of using LMT:Er3+ as a noncontact thermometer, all possible combinations of Er3+ emission bands were taken into account in the temperature range of 77–398 K (Figure 9). The first was devoted to the most frequently used, thermally coupled levels of Er3+, including 2H11/2 → 4I15/2 and 4S3/2 → 4I15/2 (abbreviated as I2/I3) and a combination which also started from the same level 4S3/2, i.e., 2H11/2 → 4I15/2 and 4S3/2 → 4I13/2 (I2/I5). The second was constructed on the basis of uncoupled levels; due to the different thermal behaviors through radiative emission, it is highly probable that these combinations would also be sensitive to temperature fluctuations.
The temperature-sensing performance of a thermometer can be evaluated through the absolute Sa and relative sensitivity Sr parameters. However, Sa depends on the sample characteristics and experimental setup, whereas Sr can be used for a comparison among distinct materials [24].
Δ = I i I j ,
S a = Δ Δ T ,  
S r = 1 Δ | Δ Δ T | ,
where thermometric parameter Δ is denoted as the ratio between two different emission levels Ii, Ij.
For thermally coupled levels, the emission intensity of the 2H11/2 → 4I15/2 transition was strongly populated by thermalization via the 4S3/2 level. As a result, the emission intensity of the transition coming from 4S3/2 decreased, i.e., 4S3/2 → 4I15/2 (I3) and 4S3/2 → 4I13/2 (I5). However, 4S3/2 → 4I13/2 exhibited a steady quench with respect to 4S3/2 → 4I15/2, resulting in a much faster growth in the thermometric parameter and a higher absolute sensitivity (Sa) for I2/I5 (see Figure S8a,b). As shown in Figure 9, the relative sensitivities (Sr) of given coupled levels were identical as predicted, since both (I3) and (I5) originated from the same level 4S3/2. The highest Sr recorded at 148 K with the values of 2.98%·K−1 and 3.08%·K−1 corresponded to I2/I3 and I2/I5, respectively.
Regarding the thermally uncoupled levels, the Sr values are plotted in Figure 9c. The best performance for temperature determination was obtained for the I2/I1 pair with 1.9%·K−1 at 148 K.
It is crucial to note that higher relative sensitivity does not imply more reliable results. Therefore, temperature uncertainty (δT), which is usually intentionally ignored, was determined using the below equation [24].
δ T = 1 S r δ Δ Δ .
δT is known as the smallest change in temperature which can be detected by the measurement. In the range from 77–150 K, δT was found to be less than 1.3 K and 0.4 K for coupled levels and uncoupled levels, respectively. From 150–400 K, the values were found to be less than 0.1 K in both cases (Figure 9b,d).
Table 1 presents the relative sensitivities of numerous materials doped or co-doped with Er3+ ions. The results in this work completely dominate in comparison with other compounds investigated in the literature. For some samples studied on both thermally coupled and uncoupled levels, it can be seen that the thermally coupled levels had higher sensitivity. However, only a few transitions can work as thermally coupled levels, while many uncoupled levels can provide more promising pairs across the different temperature ranges. Furthermore, the introduction of some co-dopants (Y3+, La3+, Yb3+) into the Er3+-doped system was not only to enhance the green up-conversion emission of Er3+ ions, but also to create more potential pairs to tackle the limitations of the thermally coupled level-based optical thermometer.

4. Conclusions

In this study, La2MgTiO6:Er3+ was prepared via the coprecipitation method. All samples crystallized in n orthorhombic structure with the space group Pbnm (62). The chemical composition of the representative sample was in agreement with the theoretical chemical composition. The morphology of the sample was inhomogeneous, and the grain size was distributed in the micro range, from 0.5 to 1 µm. The energy transfer among Er3+ ions occurred predominantly via dipole–dipole interactions. The critical transfer distance R0, critical concentration C0, energy transfer parameter Cda, and energy transfer probability Wda were found to be 9.81 Å, 2.53 × 10 20 ions·cm−3, 5.38 × 10 39   cm6·s−1, and 6020 s−1, respectively. More importantly, the low-temperature-sensing ability of La2MgTiO6:5% Er3+ was explored using the ratio of emission intensity of the thermally coupled and uncoupled energy levels. The thermally coupled energy levels 2H11/2 → 4I15/2 and 4S3/2 → 4I15/2 exhibited the greatest sensitivity of around 2.98%·K−1 at 148 K, and the uncertainty temperature was less than 1 K in the range of 77–398 K. The abovementioned findings indicate the huge potential of La2MgTiO6:Er3+ for temperature-sensing operating at low temperature.

Supplementary Materials

The following are available online at https://www.mdpi.com/article/10.3390/ma14195557/s1, Figure S1: Lattice parameters (a: black squares, b: blue triangles, c: red circles) changes of La2MgTiO6:x Er3+, (x = 1, 3, 5, 7%) as a function of Er3+ concentration. Figure S2: 77 K emission spectra of La2MgTiO6:x Er3+, (x = 0.1, 0.5, 1, 3, 5, 7%) recorded under 266 nm excitation. Figure S3: Emission spectra of La2MgTiO6:3% Er3+ obtained in the infrared regions under 808 excitation. Figure S4: Integrated emission intensity of La2MgTiO6:x Er3+, (x = 0.1, 0.5, 1, 3, 5, 7%) recorded under 266 nm excitation at 300 K. Figure S5: Integrated emission intensity of each level as a function of Er3+ concentration at 300 K. Figure S6: 300 K decay profiles of La2MgTiO6:Er3+ and rise time (in the inset) excited at 266 nm and monitored at 549 nm (a), at 662 nm (b), at 988 nm (c). Figure S7: Energy transfer rates Wtot = aCn at 300 K as a function of Er3+ concentration. Figure S8. Thermometric parameters (a) and absolute sensitivities, Sa (K-1) (b) based on thermally coupled levels; Thermometric parameters (c) and absolute sensitivities, Sa (K-1) (d) based on thermally uncoupled levels. Table S1: Energy levels of Er3+ ions in La2MgTiO6 double perovskites obtained from the 77 K and 300 K emission spectra and the 300 K absorption spectrum *. Table S2: Decay time of La2MgTiO6:Er3+ obtained at different monitoring wavelength corresponding to 4S3/2 (549 nm), 4F9/2 (662 nm), 4I11/2 (988 nm) levels and their rise time (*) single-exponential decay for the sample La2MgTiO6:0.1% Er3+.

Author Contributions

Conceptualization, T.H.Q.V.; data curation, T.H.Q.V. and B.B.; formal analysis, T.H.Q.V., B.B., D.S. and P.J.D.; funding acquisition, P.J.D.; investigation, T.H.Q.V., B.B., D.S. and P.J.D.; methodology, T.H.Q.V., B.B. and D.S.; project administration, P.J.D.; resources, T.H.Q.V. and B.B.; supervision, D.S. and P.J.D.; validation, T.H.Q.V., B.B. and P.J.D.; visualization, T.H.Q.V.; writing—original draft, T.H.Q.V.; writing—review and editing, T.H.Q.V., B.B., D.S. and P.J.D. All authors have read and agreed to the published version of the manuscript.

Funding

This work was supported by the National Science Center Poland under Grant no. 2017/25/B/ST5/02670, as a part of the research project implementation OPUS13.

Institutional Review Board Statement

Not applicable.

Informed Consent Statement

Not applicable.

Data Availability Statement

Data is contained within the article or supplementary material.

Acknowledgments

The authors wish to thank E. Bukowska for XRD measurements, D. Szymanski for SEM analysis, and B. Macalik for the absorption measurements.

Conflicts of Interest

The authors declare no conflict of interest.

References

  1. Stefańska, D.; Bondzior, B.; Vu, T.H.Q.; Grodzicki, M.; Dereń, P.J. Temperature sensitivity modulation through changing the vanadium concentration in a La2MgTiO6:V5+,Cr3+ double perovskite optical thermometer. Dalton Trans. 2021, 50, 9851–9857. [Google Scholar] [CrossRef]
  2. Vu, T.; Bondzior, B.; Stefańska, D.; Dereń, P. Influence of temperature on near-infrared luminescence, energy transfer mechanism and the temperature sensing ability of La2MgTiO6:Nd3+ double perovskites. Sensors Actuators A Phys. 2021, 317, 112453. [Google Scholar] [CrossRef]
  3. Bondzior, B.; Stefańska, D.; Vũ, T.; Miniajluk-Gaweł, N.; Dereń, P. Red luminescence with controlled rise time in La2MgTiO6:Eu3+. J. Alloys Compd. 2021, 852, 157074. [Google Scholar] [CrossRef]
  4. Antic-Fidancev, E.; Deren, P.; Krupa, J.-C. Energy levels and crystal field calculations of Er3+ in LaAlO3. J. Alloys Compd. 2004, 380, 376–379. [Google Scholar] [CrossRef]
  5. Dereń, P.; Mahiou, R.; Pazik, R.; Lemanski, K.; Strek, W.; Boutinaud, P. Upconversion emission in CaTiO3:Er3+ nanocrystals. J. Lumin. 2008, 128, 797–799. [Google Scholar] [CrossRef]
  6. Deren, P.; Mahiou, R. Spectroscopic characterisation of LaAlO3 crystal doped with Er3+ ions. Opt. Mater. 2007, 29, 766–772. [Google Scholar] [CrossRef]
  7. Su, B.; Xie, H.; Tan, Y.; Zhao, Y.; Yang, Q.; Zhang, S. Luminescent properties, energy transfer, and thermal stability of double perovskites La2MgTiO6:Sm3+, Eu3+. J. Lumin. 2018, 204, 457–463. [Google Scholar] [CrossRef]
  8. Li, W.; Chen, T.; Xia, W.; Yang, X.; Xiao, S. Near-infrared emission of Yb3+ sensitized by Mn4+ in La2MgTiO6. J. Lumin. 2018, 194, 547–550. [Google Scholar] [CrossRef]
  9. Srivastava, A.; Comanzo, H.; Brik, M. Luminescence of Bi3+ in the double perovskite, La2MgTiO6. Opt. Mater. 2018, 75, 809–813. [Google Scholar] [CrossRef]
  10. Yin, X.; Yao, J.; Wang, Y.; Zhao, C.; Huang, F. Novel red phosphor of double perovskite compound La2MgTiO6:x Eu3+. J. Lumin. 2012, 132, 1701–1704. [Google Scholar] [CrossRef]
  11. Huang, J.; Qin, M.; Yu, J.; Ma, A.; Yu, X.; Liu, J.; Zheng, Z.; Wang, X. La2MgTiO6:Eu2+/TiO2-based composite for methyl orange (MO) decomposition. Appl. Phys. A 2019, 125, 862. [Google Scholar] [CrossRef]
  12. Srivastava, A.M.; Brik, M.G.; Comanzo, H.A.; Beers, W.W.; Cohen, W.E.; Pocock, T. Spectroscopy of Mn4+ in Double Perovskites, La2LiSbO6 and La2LiSbO6: Deep Red Photon Generators for Agriculture LEDs. ECS J. Solid State Sci. Technol. 2018, 7, R3158–R3162. [Google Scholar] [CrossRef]
  13. Li, L.; Qin, F.; Zhou, Y.; Miao, J.; Zhang, Z. Origin of the giant thermal enhancement of the Er3+ ion’s 4I9/2-4I15/2 photoluminescence. Spectrochim. Acta Part A Mol. Biomol. Spectrosc. 2020, 229, 117862. [Google Scholar] [CrossRef]
  14. Gai, S.; Zhu, H.; Gao, P.; Zhou, C.; Kong, Z.; Molokeev, M.S.; Qi, Z.; Zhou, Z.; Xia, M. Structure analysis, tuning photoluminescence and enhancing thermal stability on Mn4+-doped La2-xYxMgTiO6 red phosphor for agricultural lighting. Ceram. Int. 2020, 46, 20173–20182. [Google Scholar] [CrossRef]
  15. Takeda, Y.; Kato, H.; Kobayashi, M.; Kobayashi, H.; Kakihana, M. Photoluminescence Properties of Mn4+-activated Perovskite-type Titanates, La2MTiO6:Mn4+(M = Mg and Zn). Chem. Lett. 2015, 44, 1541–1543. [Google Scholar] [CrossRef] [Green Version]
  16. Xie, H.; Su, B.; Tan, Y.; Zhao, Y.; Chai, S. Effect of Gd3+, Bi3+, or Sm3+ on luminescent properties of La2−x MgTiO6:x Eu3+ phosphors. Luminescence 2018, 33, 1450–1455. [Google Scholar] [CrossRef]
  17. Shi, R.; Lin, L.-T.; Dorenbos, P.; Liang, H. Development of a potential optical thermometric material through photoluminescence of Pr3+ in La2MgTiO6. J. Mater. Chem. C 2017, 5, 10737–10745. [Google Scholar] [CrossRef]
  18. Brandão-Silva, A.C.; Gomes, M.A.; Novais, S.M.V.; Macedo, Z.S.; Avila, J.F.M.; Rodrigues, J.J.; Alencar, M.A.R.C. Size influence on temperature sensing of erbium-doped yttrium oxide nanocrystals exploiting thermally coupled and uncoupled levels’ pairs. J. Alloys Compd. 2018, 731, 478–488. [Google Scholar] [CrossRef]
  19. Rijckaert, H.; Kaczmarek, A.M. Ho3+–Yb3+ doped NaGdF4 nanothermometers emitting in BW-I and BW-II. Insight into the particle growth intermediate steps. Chem. Commun. 2020, 56, 14365–14368. [Google Scholar] [CrossRef]
  20. Stefańska, D.; Dereń, P.J. High Efficiency Emission of Eu2+ Located in Channel and Mg-Site of Mg2Al4Si5O18 Cordierite and Its Potential as a Bi-Functional Phosphor toward Optical Thermometer and White LED Application. Adv. Opt. Mater. 2020, 8, 1–10. [Google Scholar] [CrossRef]
  21. Stefańska, D.; Stefanski, M.; Dereń, P.J. Unusual emission generated from Ca2Mg0.5AlSi1.5O7:Eu2+ and its potential for UV-LEDs and non-contact optical thermometry. J. Alloys Compd. 2021, 863, 158770. [Google Scholar] [CrossRef]
  22. Trojan-Piegza, J.; Brites, C.D.S.; Ramalho, J.F.C.B.; Wang, Z.; Zhou, G.; Wang, S.; Carlos, L.D.; Zych, E. La0.4Gd1.6Zr2O7:0.1%Pr transparent sintered ceramic—A wide-range luminescence thermometer. J. Mater. Chem. C 2020, 8, 7005–7011. [Google Scholar] [CrossRef]
  23. Sójka, M.; Brites, C.D.S.; Carlos, L.D.; Zych, E. Exploiting bandgap engineering to finely control dual-mode Lu2(Ge,Si)O5:Pr3+ luminescence thermometers. J. Mater. Chem. C 2020, 8, 10086–10097. [Google Scholar] [CrossRef]
  24. Brites, C.; Millán, A.; Carlos, L. Lanthanides in Luminescent Thermometry. Metals 2016, 339–427. [Google Scholar] [CrossRef]
  25. Hua, Y.; Yu, J.S. Strong Green Emission of Erbium(III)-Activated La2MgTiO6 Phosphors for Solid-State Lighting and Optical Temperature Sensors. ACS Sustain. Chem. Eng. 2021, 9, 5105–5115. [Google Scholar] [CrossRef]
  26. Wade, S.; Collins, S.F.; Baxter, G. Fluorescence intensity ratio technique for optical fiber point temperature sensing. J. Appl. Phys. 2003, 94, 4743–4756. [Google Scholar] [CrossRef]
  27. Ćirić, A.; Aleksić, J.; Barudžija, T.; Antić, Ž.; Đorđević, V.; Medić, M.; Periša, J.B.; Zeković, I.; Mitrić, M.; Dramićanin, M.D. Comparison of Three Ratiometric Temperature Readings from the Er3+ Upconversion Emission. Nanomaterials 2020, 10, 627. [Google Scholar] [CrossRef] [Green Version]
  28. Rakov, N.; Maciel, G.S. Exploring the 4I13/24I15/2 radiative transition from Er3+ in Y2O3 for temperature sensing. J. Lumin. 2018, 199, 293–297. [Google Scholar] [CrossRef]
  29. Ran, W.; Noh, H.M.; Park, S.H.; Lee, B.R.; Kim, J.H.; Jeong, J.H.; Shi, J.; Liu, G. Simultaneous bifunctional application of solid-state lighting and ratiometric optical thermometer based on double perovskite LiLaMgWO6:Er3+ thermochromic phosphors. RSC Adv. 2019, 9, 7189–7195. [Google Scholar] [CrossRef] [Green Version]
  30. Shannon, R.D. Revised effective ionic radii and systematic studies of interatomic distances in halides and chalcogenides. Acta Crystallogr. A 1976, 32, 751–767. [Google Scholar] [CrossRef]
  31. Ölsä, J.; Säilynoja, E.; Lamminmäki, R.-J.; Deren, P.; Strek, W.; Porcher, P. Crystal field energy level scheme of Er3+ in GdOCl Parametric analysis. J. Chem. Soc. Faraday Trans. 1997, 93, 2241–2246. [Google Scholar] [CrossRef]
  32. Stręk, W.; Dereń, P.; Maruszewski, K.; Pawlik, E.; Wojcik, W.; Malashkevich, G.; Gaishun, V.; Strȩk, W. Spectroscopic properties of erbium doped silica glasses obtained by sol-gel method. J. Alloys Compd. 1998, 275-277, 420–423. [Google Scholar] [CrossRef]
  33. Macalik, L.; Dereń, P.; Hanuza, J.; Stręk, W.; Demidovich, A.; Kuzmin, A. Effect of random distribution and molecular interactions on optical properties of Er3+ dopant in KY(WO4)2 and Ho3+ in KYb(WO4)2. J. Mol. Struct. 1998, 450, 179–192. [Google Scholar] [CrossRef]
  34. López, R.; Gómez, R. Band-gap energy estimation from diffuse reflectance measurements on sol–gel and commercial TiO2: A comparative study. J. Sol-Gel Sci. Technol. 2012, 61, 1–7. [Google Scholar] [CrossRef]
  35. Blasse, G. Energy transfer in oxidic phosphors. Phys. Lett. A 1968, 28, 444–445. [Google Scholar] [CrossRef]
  36. Levin, I.; Vanderah, T.A.; Amos, T.G.; Maslar, J.E. Structural Behavior and Raman Spectra of Perovskite-Like Solid Solutions (1 − x)LaMg0.5Ti 0.5O3−xLa2/3TiO3. Chem. Mater. 2005, 17, 3273–3280. [Google Scholar] [CrossRef]
  37. Inokuti, M.; Hirayama, F. Influence of Energy Transfer by the Exchange Mechanism on Donor Luminescence. J. Chem. Phys. 1965, 43, 1978–1989. [Google Scholar] [CrossRef]
  38. Puchalska, M.; Watras, A. A clear effect of charge compensation through Na+ co-doping on luminescent properties of new CaGa4O7:Nd3+. J. Alloys Compd. 2016, 688, 253–260. [Google Scholar] [CrossRef]
  39. Puchalska, M.; Watras, A. A clear effect of charge compensation through Na+ co-doping on the luminescence spectra and decay kinetics of Nd3+-doped CaAl4O7. J. Solid State Chem. 2016, 238, 259–266. [Google Scholar] [CrossRef]
  40. Rudnicka, D.; Dereń, P. Preliminary spectroscopic properties of K4SrSi3O9 doped with Eu3+. Opt. Mater. 2013, 35, 2531–2534. [Google Scholar] [CrossRef]
  41. Zheng, Y.; Chen, B.; Zhong, H.; Sun, J.; Cheng, L.; Li, X.; Zhang, J.; Tian, Y.; Lu, W.; Wan, J.; et al. Optical Transition, Excitation State Absorption, and Energy Transfer Study of Er3+, Nd3+ Single-Doped, and Er3+/Nd3+ Codoped Tellurite Glasses for Mid-Infrared Laser Applications. J. Am. Ceram. Soc. 2011, 94, 1766–1772. [Google Scholar] [CrossRef]
  42. Llanos, J.; Espinoza, D.; Castillo, R. Energy transfer in single phase Eu3+-doped Y2WO6 phosphors. RSC Adv. 2017, 7, 14974–14980. [Google Scholar] [CrossRef] [Green Version]
  43. Bondzior, B.; Stefanska, D.; Kubiak, A.; Dereń, P. Spectroscopic properties of K4SrSi3O9 doped with Sm3+. J. Lumin. 2015, 173, 38–43. [Google Scholar] [CrossRef]
  44. Bin Im, W.; Fellows, N.N.; Denbaars, S.; Seshadri, R.; Kim, Y.-I. LaSr2AlO5, a Versatile Host Compound for Ce3+-Based Yellow Phosphors: Structural Tuning of Optical Properties and Use in Solid-State White Lighting. Chem. Mater. 2009, 21, 2957–2966. [Google Scholar] [CrossRef]
  45. Dong, B.; Wang, X.J.; Li, C.R.; Liu, D.P. Er3+-Y3+-Codoped Al2O3 for High-Temperature Sensing. IEEE Photon-Technol. Lett. 2008, 20, 117–119. [Google Scholar] [CrossRef]
  46. Wang, Y.; Liu, Y.; Shen, J.; Wang, X.; Yan, X. Controlling optical temperature behaviors of Er3+ doped Sr2CaWO6 through doping and changing excitation powers. Opt. Mater. Express 2018, 8, 1926–1939. [Google Scholar] [CrossRef]
  47. Kumar, K.U.; Santos, W.Q.; Silva, W.F.; Jacinto, C. Two photon thermal sensing in Er3+/Yb3+ Co-doped nanocrystalline NaNbO3. J. Nanosci. Nanotechnol. 2013, 13, 6841–6845. [Google Scholar] [CrossRef] [PubMed]
  48. Ran, W.; Noh, H.M.; Park, S.H.; Lee, B.R.; Kim, J.H.; Jeong, J.H.; Shi, J. Er3+-Activated NaLaMgWO6 double perovskite phosphors and their bifunctional application in solid-state lighting and non-contact optical thermometry. Dalton Trans. 2019, 48, 4405–4412. [Google Scholar] [CrossRef]
  49. Šević, D.; Rabasovic, M.; Križan, J.; Savić-Šević, S.; Marinkovic, B.P.; Nikolic, M. Effects of temperature on luminescent properties of Gd2O3:Er, Yb nanophosphor. Opt. Quantum Electron. 2020, 52, 1–9. [Google Scholar] [CrossRef]
  50. León-Luis, S.F.; Monteseguro, V.; Rodriguez-Mendoza, U.; Rathaiah, M.; Venkatramu, V.; Lozano-Gorrin, A.; Valiente, R.; Munoz, A.; Lavin, V. Optical nanothermometer based on the calibration of the Stokes and upconverted green emissions of Er3+ ions in Y3Ga5O12 nano-garnets. RSC Adv. 2014, 4, 57691–57701. [Google Scholar] [CrossRef] [Green Version]
Figure 1. (a) X-ray powder diffraction of La2MgTiO6:x Er3+, (x = 0%, 0.1%, 0.5%, 1%, 3%, 5%, or 7%); (b) position correction of main diffraction peak of La2MgTiO6 with the help of KBr; (c) changing of unit cell volume as a function of Er3+ concentration (in the inset).
Materials 14 05557 g001
Figure 2. SEM images of sample La2MgTiO6:5% Er3+.
Materials 14 05557 g002
Figure 3. Results of EDS X-ray microanalysis of La2MgTiO6:5% Er3+.
Materials 14 05557 g003
Figure 4. Absorption spectrum of La2MgTiO6:7% Er3+ at room temperature.
Materials 14 05557 g004
Figure 5. Forbidden energy bandgaps (Eg) of La2MgTiO6 host (a) and La2MgTiO6:7% Er3+ (b) calculated from the absorption spectra obtained from the reflection spectra applying the modified Kubelka–Munk function (also known as the Tauc method).
Materials 14 05557 g005
Figure 6. The 300 K emission spectra of La2MgTiO6:x Er3+ (x = 0.1%, 0.5%, 1%, 3%, 5%, or 7%) recorded under a 266 nm excitation Nd:YAG line. Inset: Some possible cross-relaxation processes in La2MgTiO6:Er3+.
Materials 14 05557 g006
Figure 7. (a) The 300 K decay profiles under 266 nm excitation, monitored at 549 nm and fitted to the Inokuti–Hirayama function (solid lines) for S = 6; (b) critical transfer distance R 0 and critical concentration C 0 calculated from the slope of the plot of ( C / C 0 ) vs. ( 4 π C / 3 ) and the interionic distance between dopants (Rc) of all Er3+-doped samples (right Y-axis).
Materials 14 05557 g007
Figure 8. Temperature-dependent emission spectra of La2MgTiO6:5% Er3+ excited at 266 nm in the range 77–398 K. Inset: Integrated emission intensity for distinct transitions as a function of temperature.
Materials 14 05557 g008
Figure 9. Relative sensitivities (Sr) and temperature uncertainties (δT) derived from thermometric parameters based on thermally coupled levels (a,b) and uncoupled levels (c,d).
Materials 14 05557 g009
Table 1. The maximum relative sensitivity Sm (%·K−1) of some materials doped with Er3+ corresponding to thermally coupled level and uncoupled levels at temperature Tm (K) with temperature uncertainty δTm (K).
Materialλexc (nm)Temperature Range (K)Sm (%·K−1)Tm (K)δTm (K)References
Al2O3:Er3+, Y3+978295–9730.354500.3[45]
Sr2CaWO6:Er3+, La3+980250–20000.5439-[46]
NaNbO3:Er3+976293–3530.51355-[47]
NaLaMgWO6:Er3+378303–4831.04303-[48]
Gd2O3:Er3+, Yb3+980300–5501.18300-[49]
Y2O3:Er3+ Coupled levels379296–5001.54483-[18]
Uncoupled levels379303–4340.87434-[18]
LiLaMgWO6:Er3+378303–4832.24483-[29]
Y3Ga5O12:Er3+488300-8500.64547-[50]
La2MgTiO6:Er3+380303–4831.107303-[25]
(solid-state)
La2MgTiO6:Er3+26677–3982.981480.09This work
(coprecipitation)
Coupled levels
Uncoupled levels26677–3981.91480.027This work
The obtained result is also easily comparable with various dopants, such as LMT: Pr3+ Sr = 1.28%·K−1 at 350 K [17], LMT:Eu3+ Sr = 3%·K−1 at 77 K [3], LMT:Nd3+ Sr = 0.83%·K−1 at 275 K [2], and LMT:V5+ and Cr3+ Sr = 1.96%·K−1 at 165 K [1]. Such an exceptional value of Sr of 2.98%·K−1 at 148 K demonstrates LMT:5% Er3+ as a potential candidate for temperature readout at low temperature.
Publisher’s Note: MDPI stays neutral with regard to jurisdictional claims in published maps and institutional affiliations.

