
Prediction Model for Compressive Strength of Porous Concrete with Low-Grade Recycled Aggregate

Abstract
:1. Introduction
- To study the influence of low-grade recycled aggregate on the compressive strength of POC. The proposed relationship is incorporated into the compressive strength and porosity models of brittle, porous materials, and the validity of the method is verified through error analysis;
- Establish a simple and universal prediction model for compressive strength of POC with low-grade RA by analyzing the mechanism of compressive damage.

| Authors | Type of Cementitious Material | Volume of RA (%) | Tests Performed | Main Findings |
|---|---|---|---|---|
| Chindaprasirt et al. | Normal Portland cement W/B of 0.20~0.36 | 0 |
| σ = σ0exp (−bV) |
| Lian et al. | Ordinary Portland cement W/B of 0.30~0.38 | 0 |
| σ = B |
| Wang et al. | Ordinary Portland cement W/B of 0.20 | 0 |
| The optimum thickness of cement paste of porous concrete is 590 μm. |
| Zhong and Wille | White cement W/C of 0.22~0.55 | 0 |
| σ = σ0(1 − mφ)()n |
| Zhang et al. | Type I Portland cement W/B of 0.25~0.50 | 0 |
| A MOLSSVR hyperparameter tuning system based on RBF core is developed. |
| Aliabdo et al. | Type I Portland cement W/B of 0.30 | 0, 50, 100 |
| The relationship between permeability and strength performance is established. |
| Hatanaka et al. | Portland cement W/B of 0.22 | 100 |
| The compressive strength of recycled aggregate porous concrete can be roughly calculated from the porosity and the strength of broken concrete. |
| Rasiah et al. | Ordinary Portland cement and ground granulated blast furnace slag W/B of 0.33 | 100 |
| σ = mσR·exp(np) |
| Lu et al. | Type I Portland cement W/B of 0.40 | 25, 50, 75, 100 |
| The use of waste glass or RA to replace the NA resulted in the decrease in the density and weak bonding between the paste and the aggregates. |
| Zhang et al. | Portland cement and fly ash W/B of 0.28 | 100 |
| The compressive strength, flexural strength and static elastic modulus of POC decrease significantly with the increase in crushing index of RA. |
| Naderpour and Mirrashid | — | — |
| An ANFIS model with six Gaussian membership functions for each input variable and six fuzzy rules |
| Chen et al. | Ordinary portland cement and fly ash W/B of 0.30 | 100 |
| Unilateral prediction model and Bilateral prediction model |
2. Experimental
2.1. Raw Materials
2.1.1. Cement
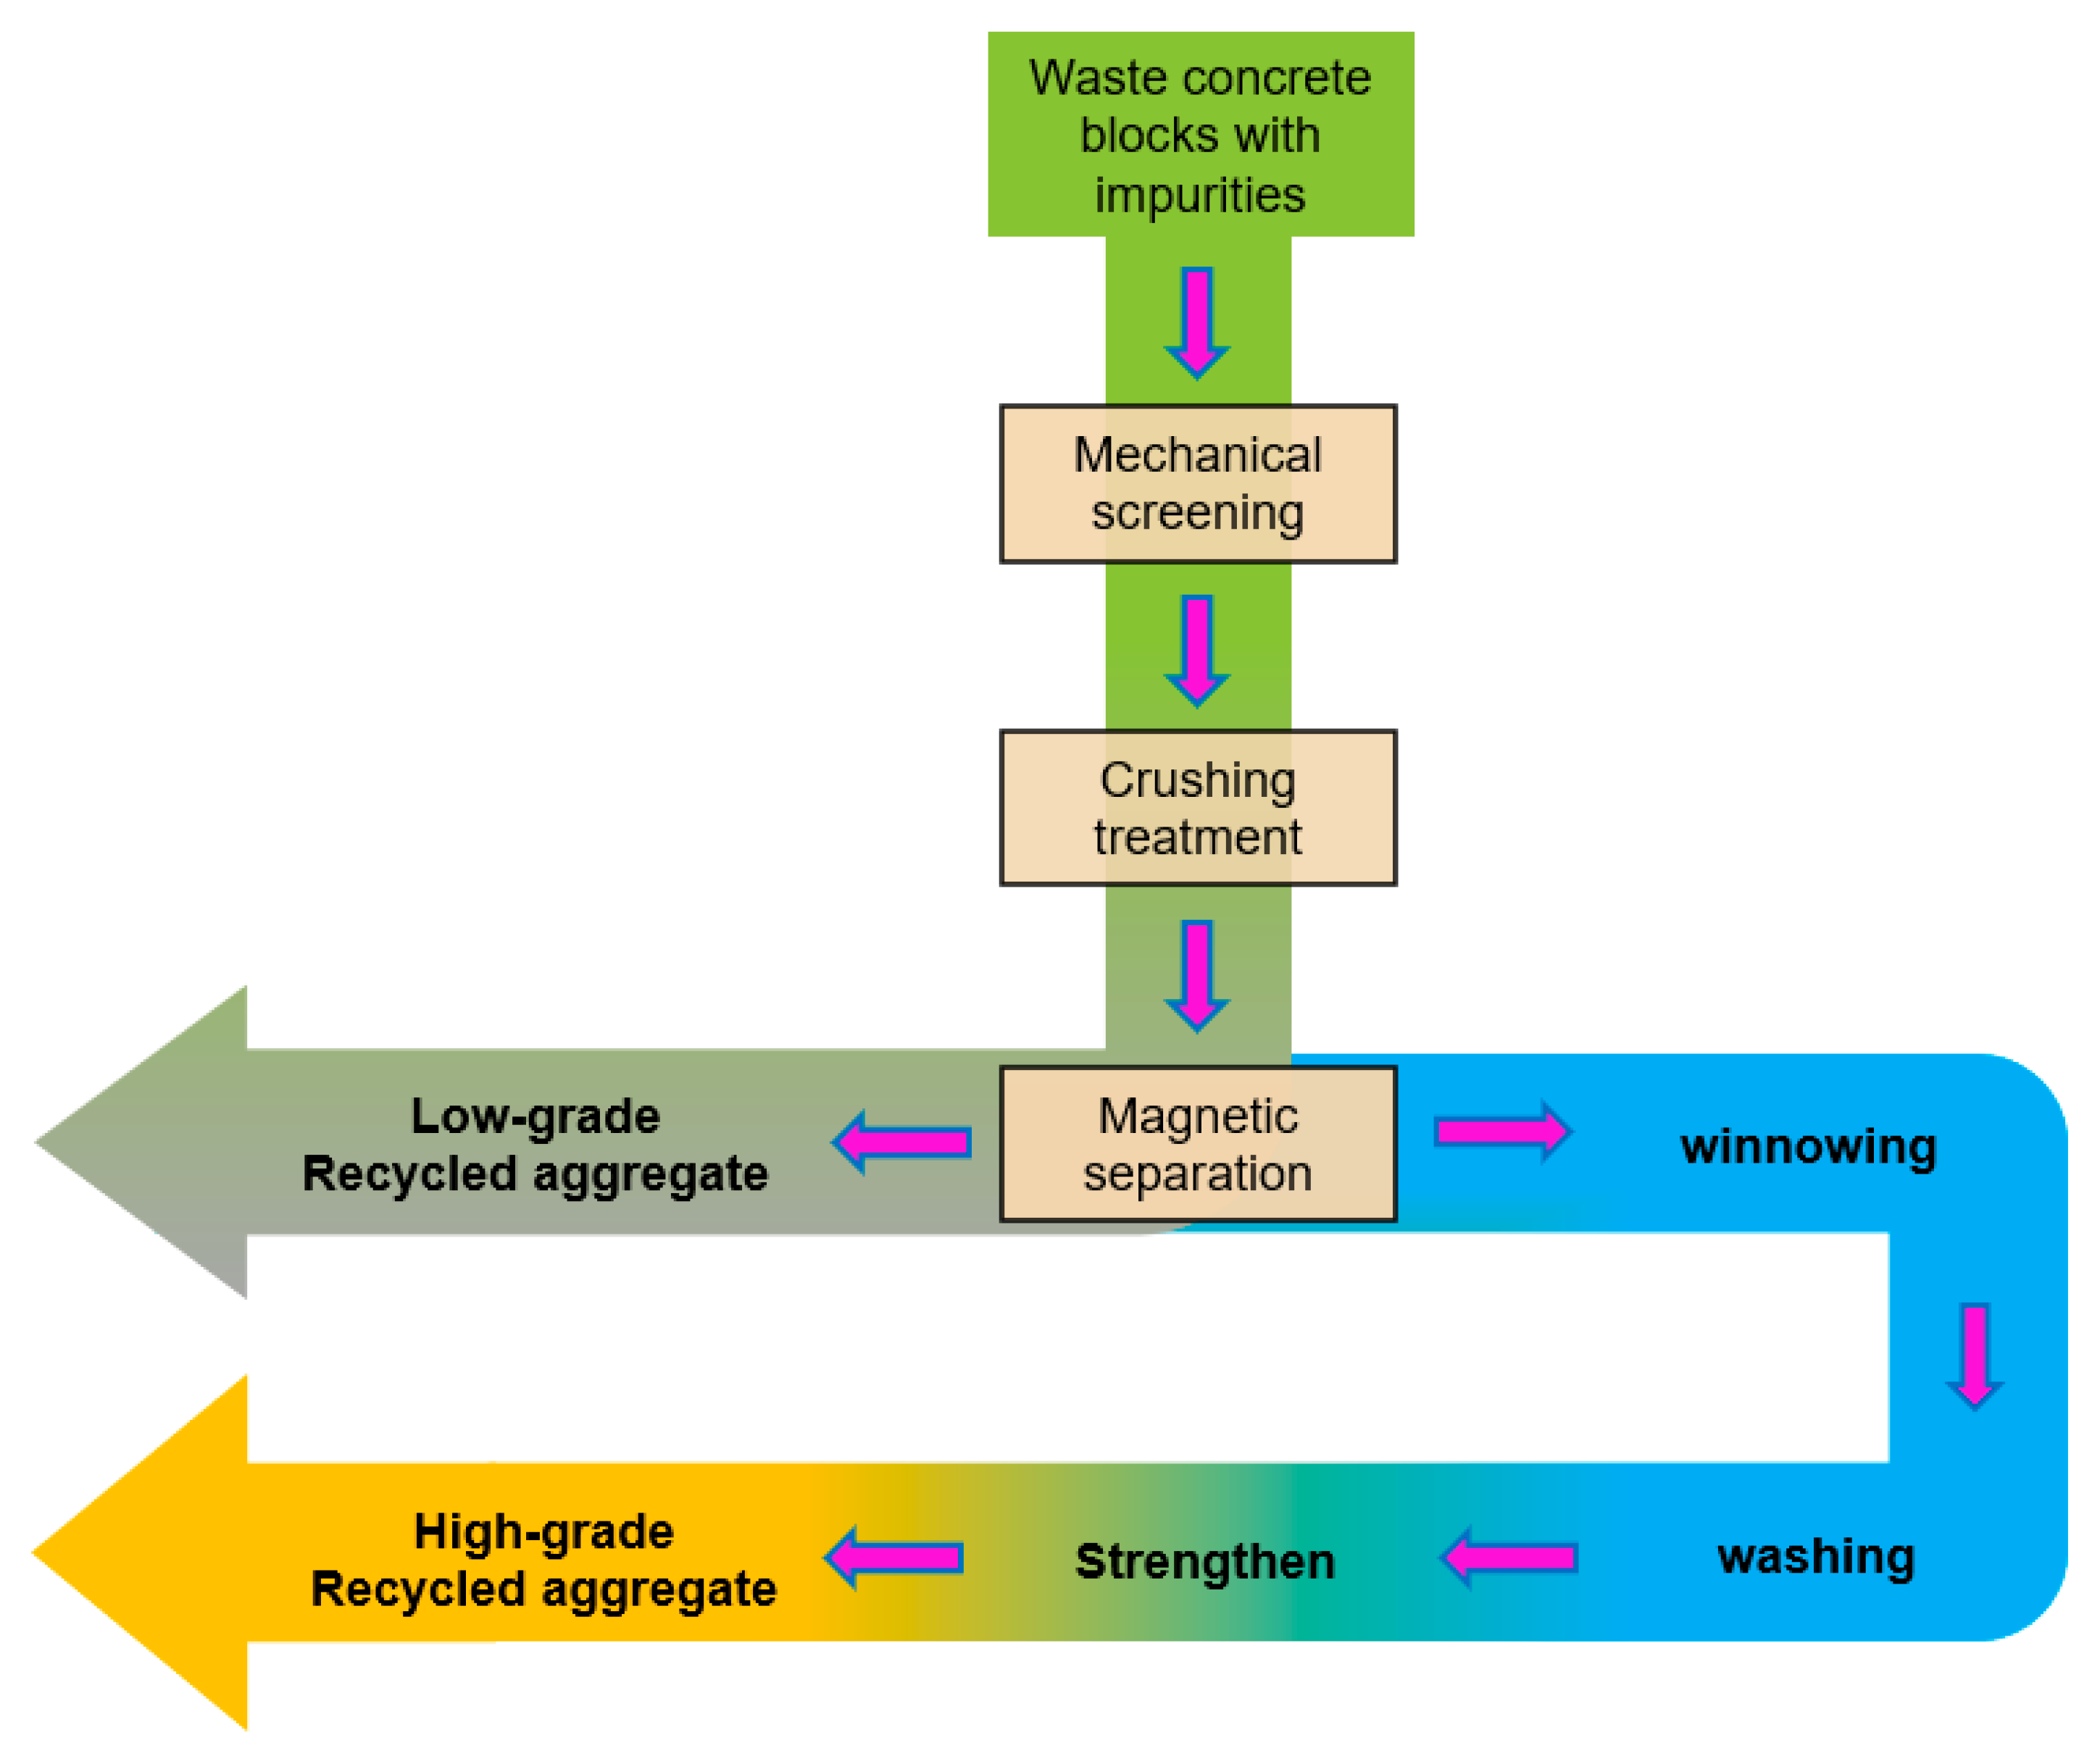
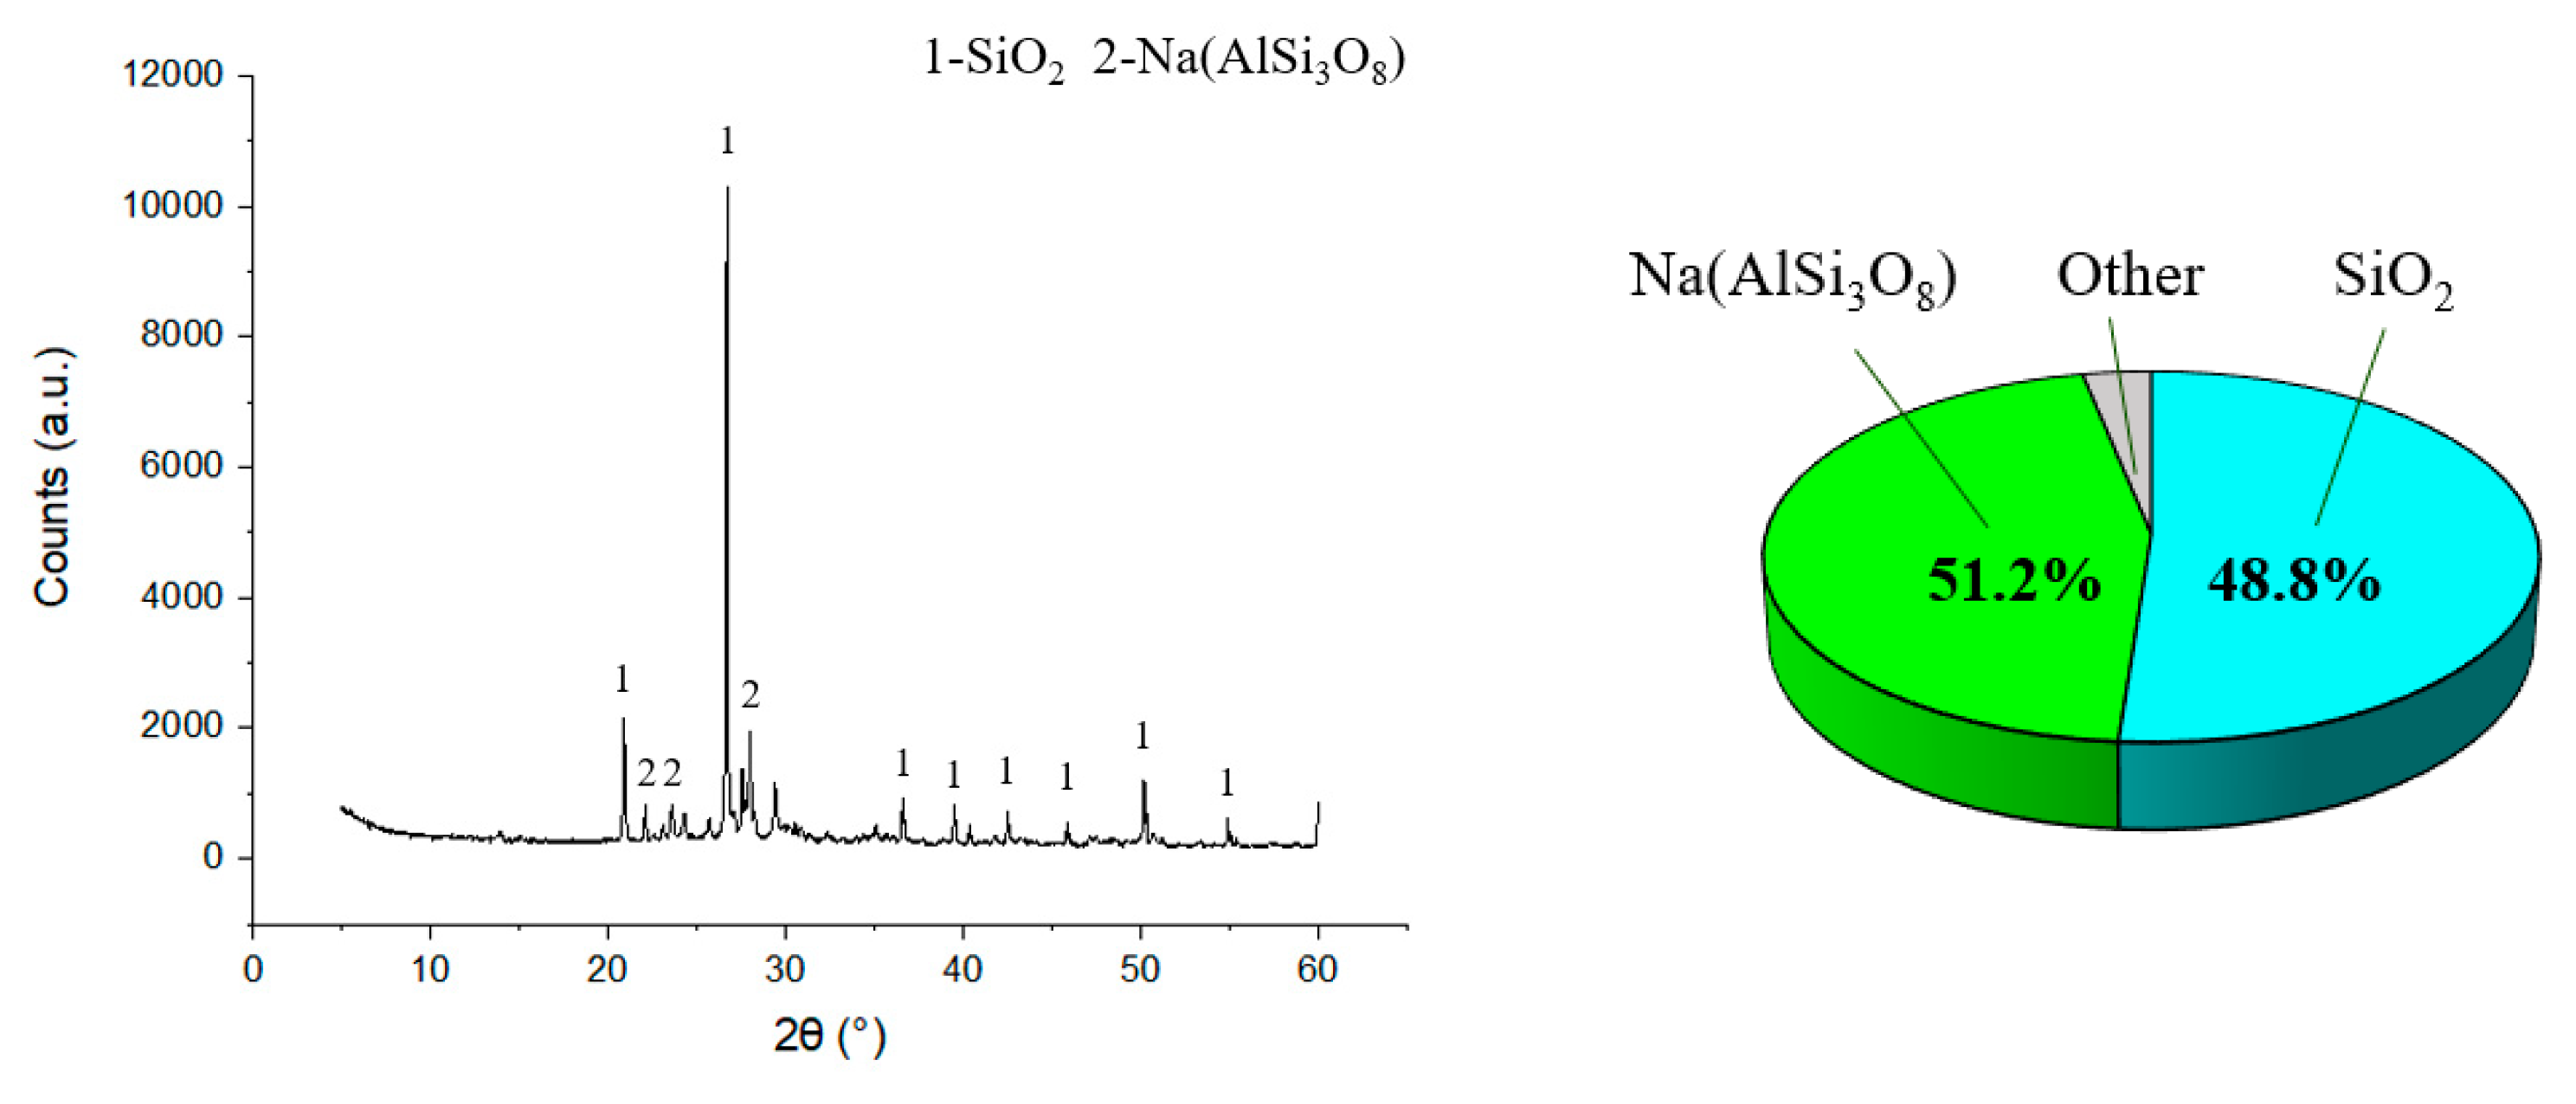
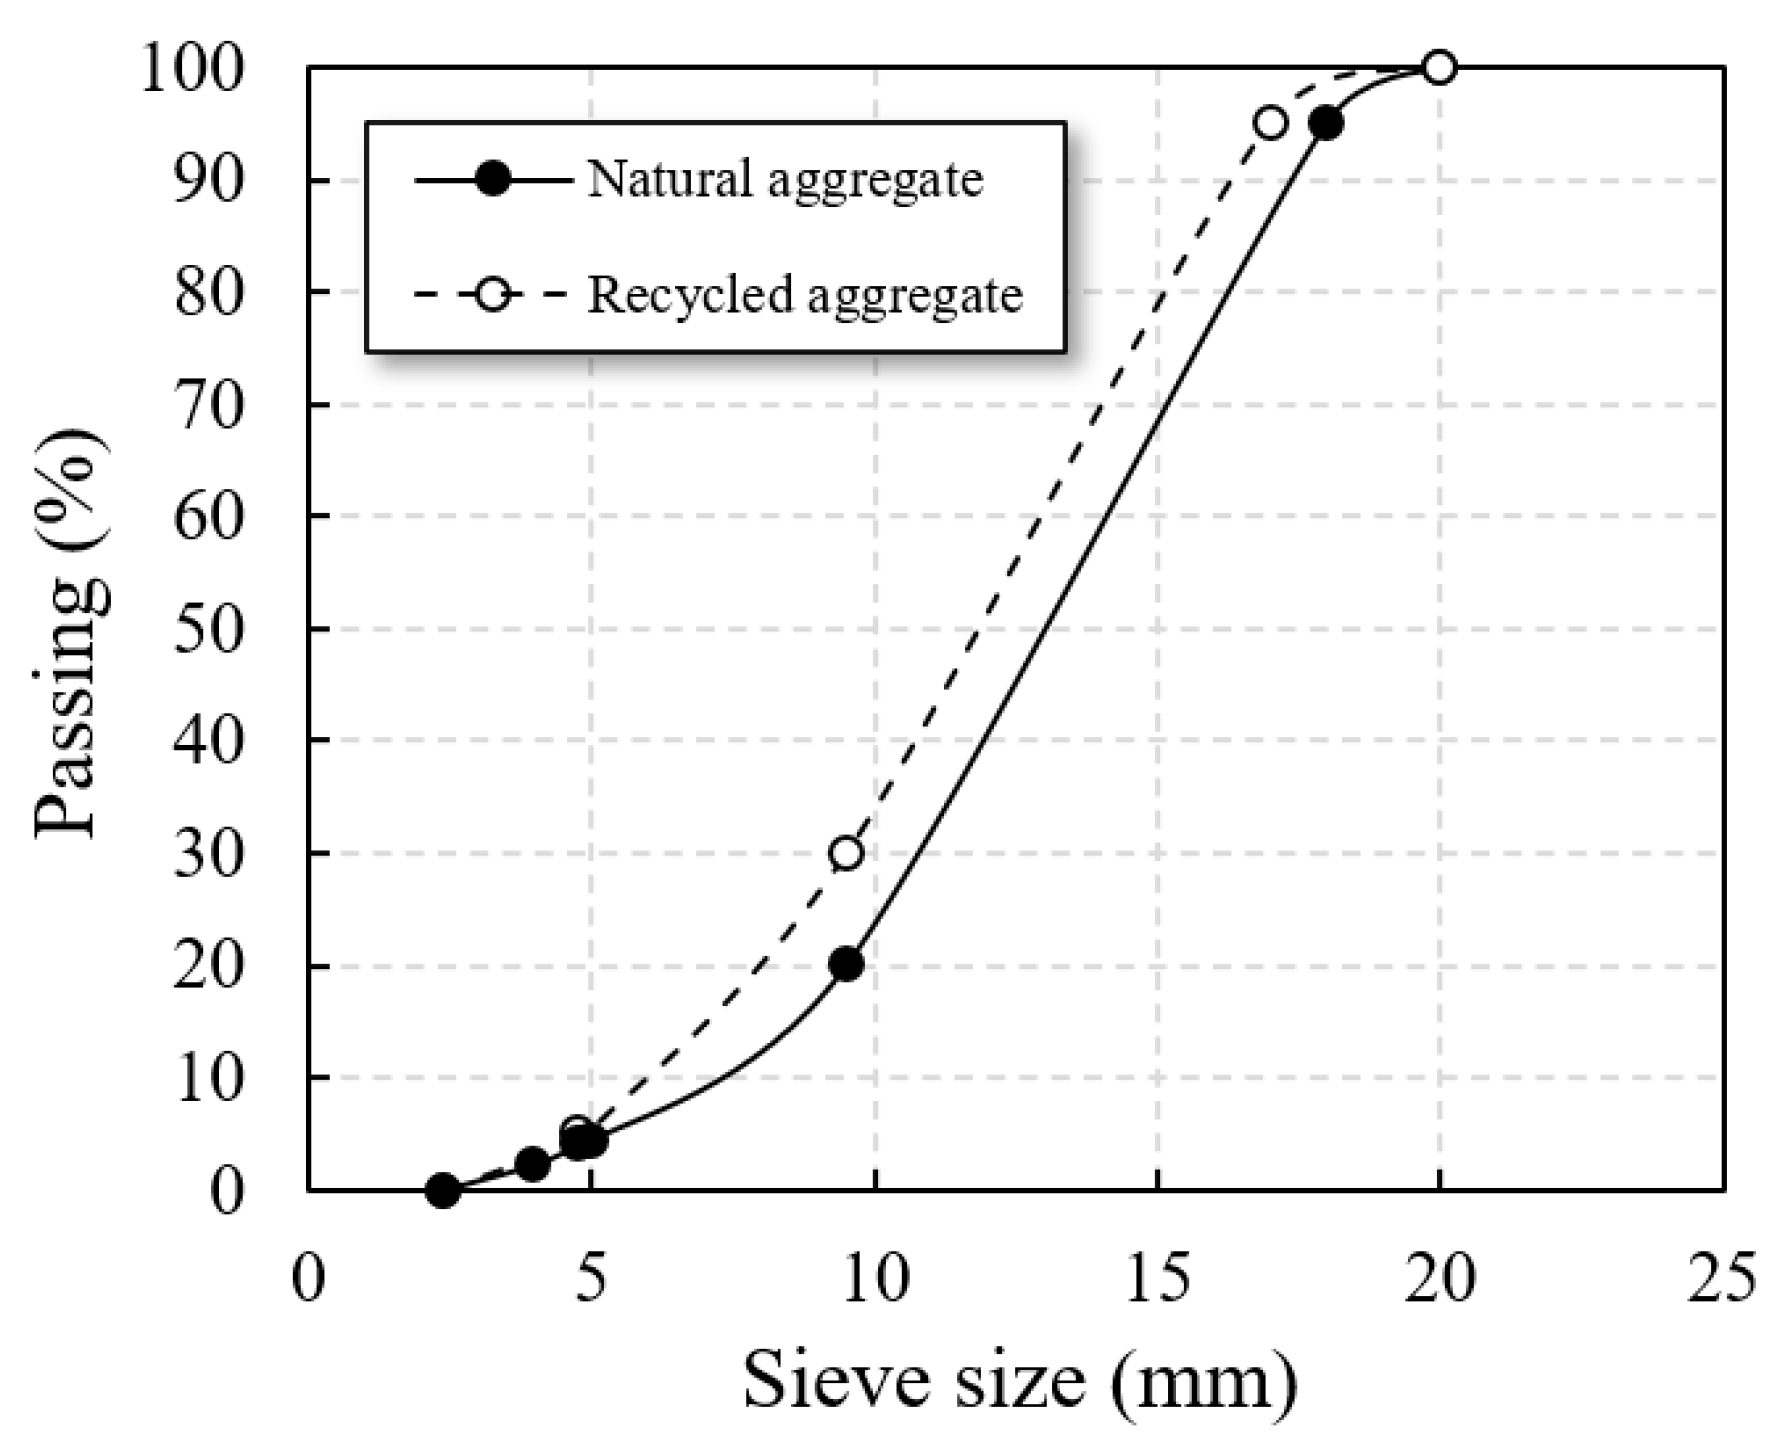
2.1.2. Aggregates
2.1.3. Water Reducer Agent and Water
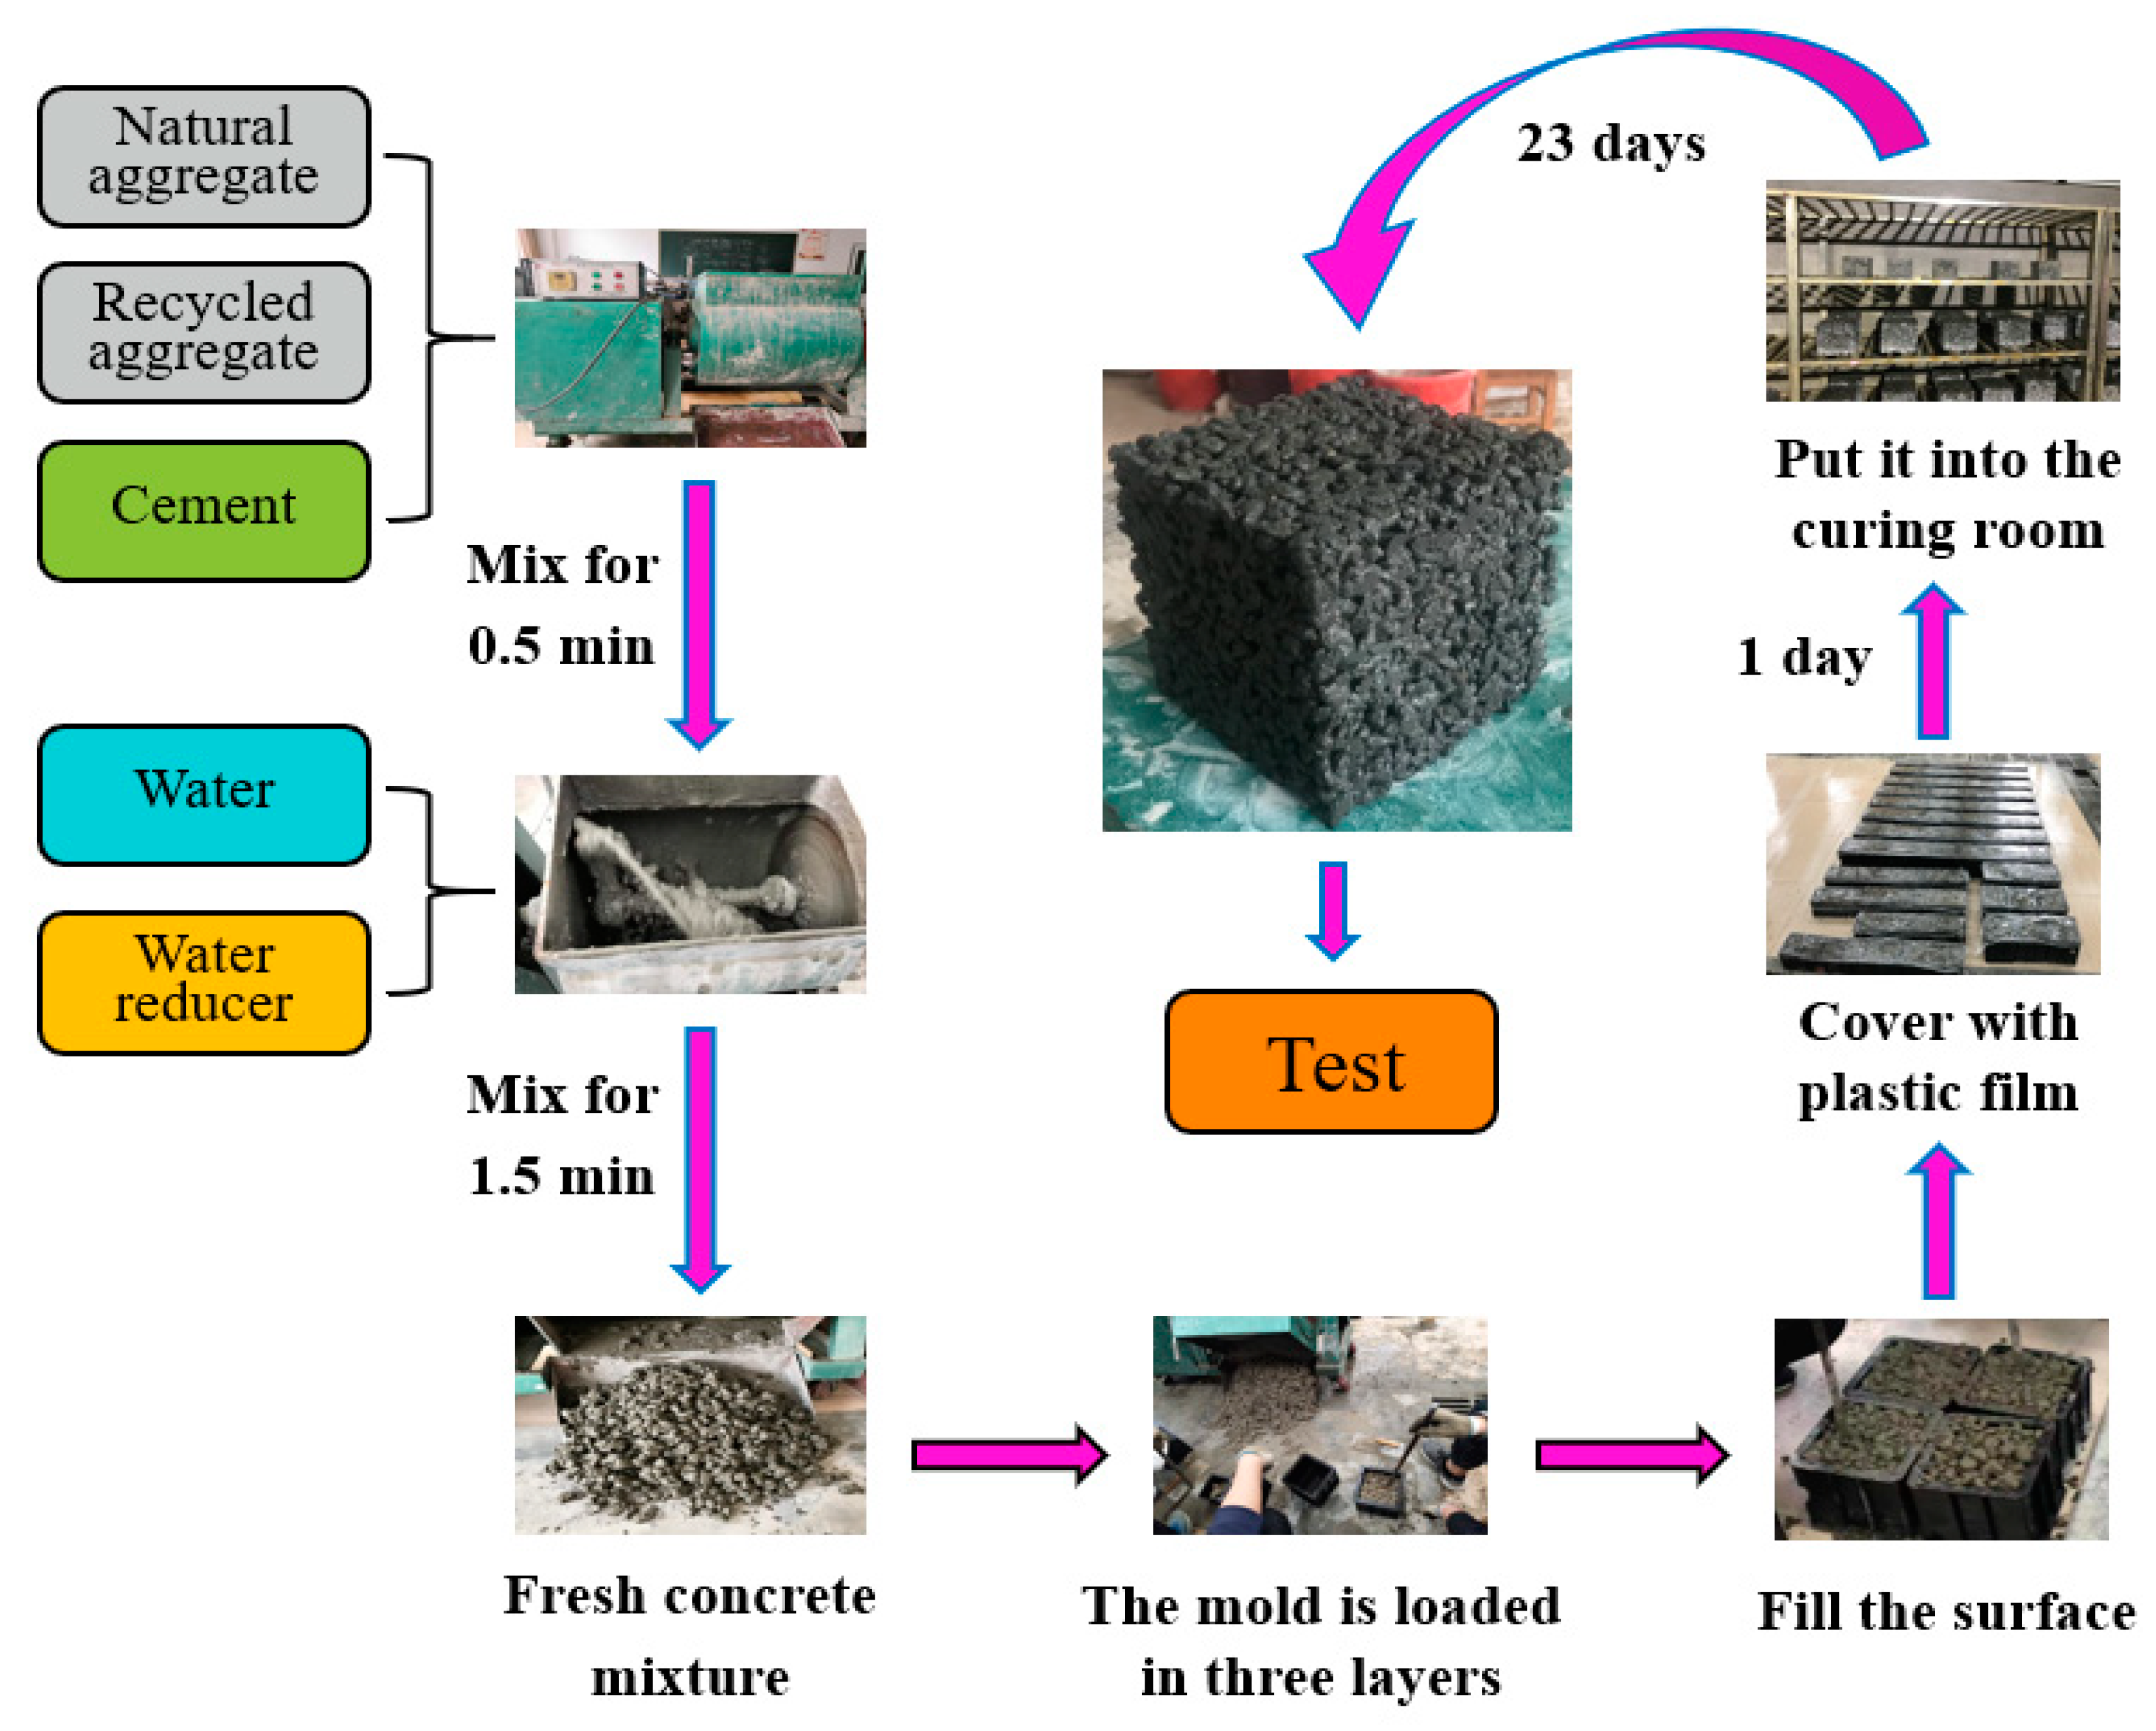
2.2. Mix Proportion and Preparation
- Water–cement ratio: according to previous research results [38], the optimal water-cement ratio of POC is around 0.25;
- Replacement rate of RA: The total volume of aggregate was replaced by 0%, 25%, 50%, 75% and 100% of RA, respectively. The POC with NA was denoted as NPOC, and the POC with RA was denoted as RPOC-x (x = replacement rate of recycled aggregate, %);
- Design porosity: Design porosity: 15%, 20%, 25%, 30% were selected with reference to actual engineering requirements [39];
- Dosage of PS: PS was added to control the fluidity of the concrete mixture. According to the existing literature [40] and many tests, it is determined that when the fluidity of the cement paste is between 180 mm and 200 mm, POC is easy to form.
3. Tests of Properties of Concrete
3.1. Compressive Strength
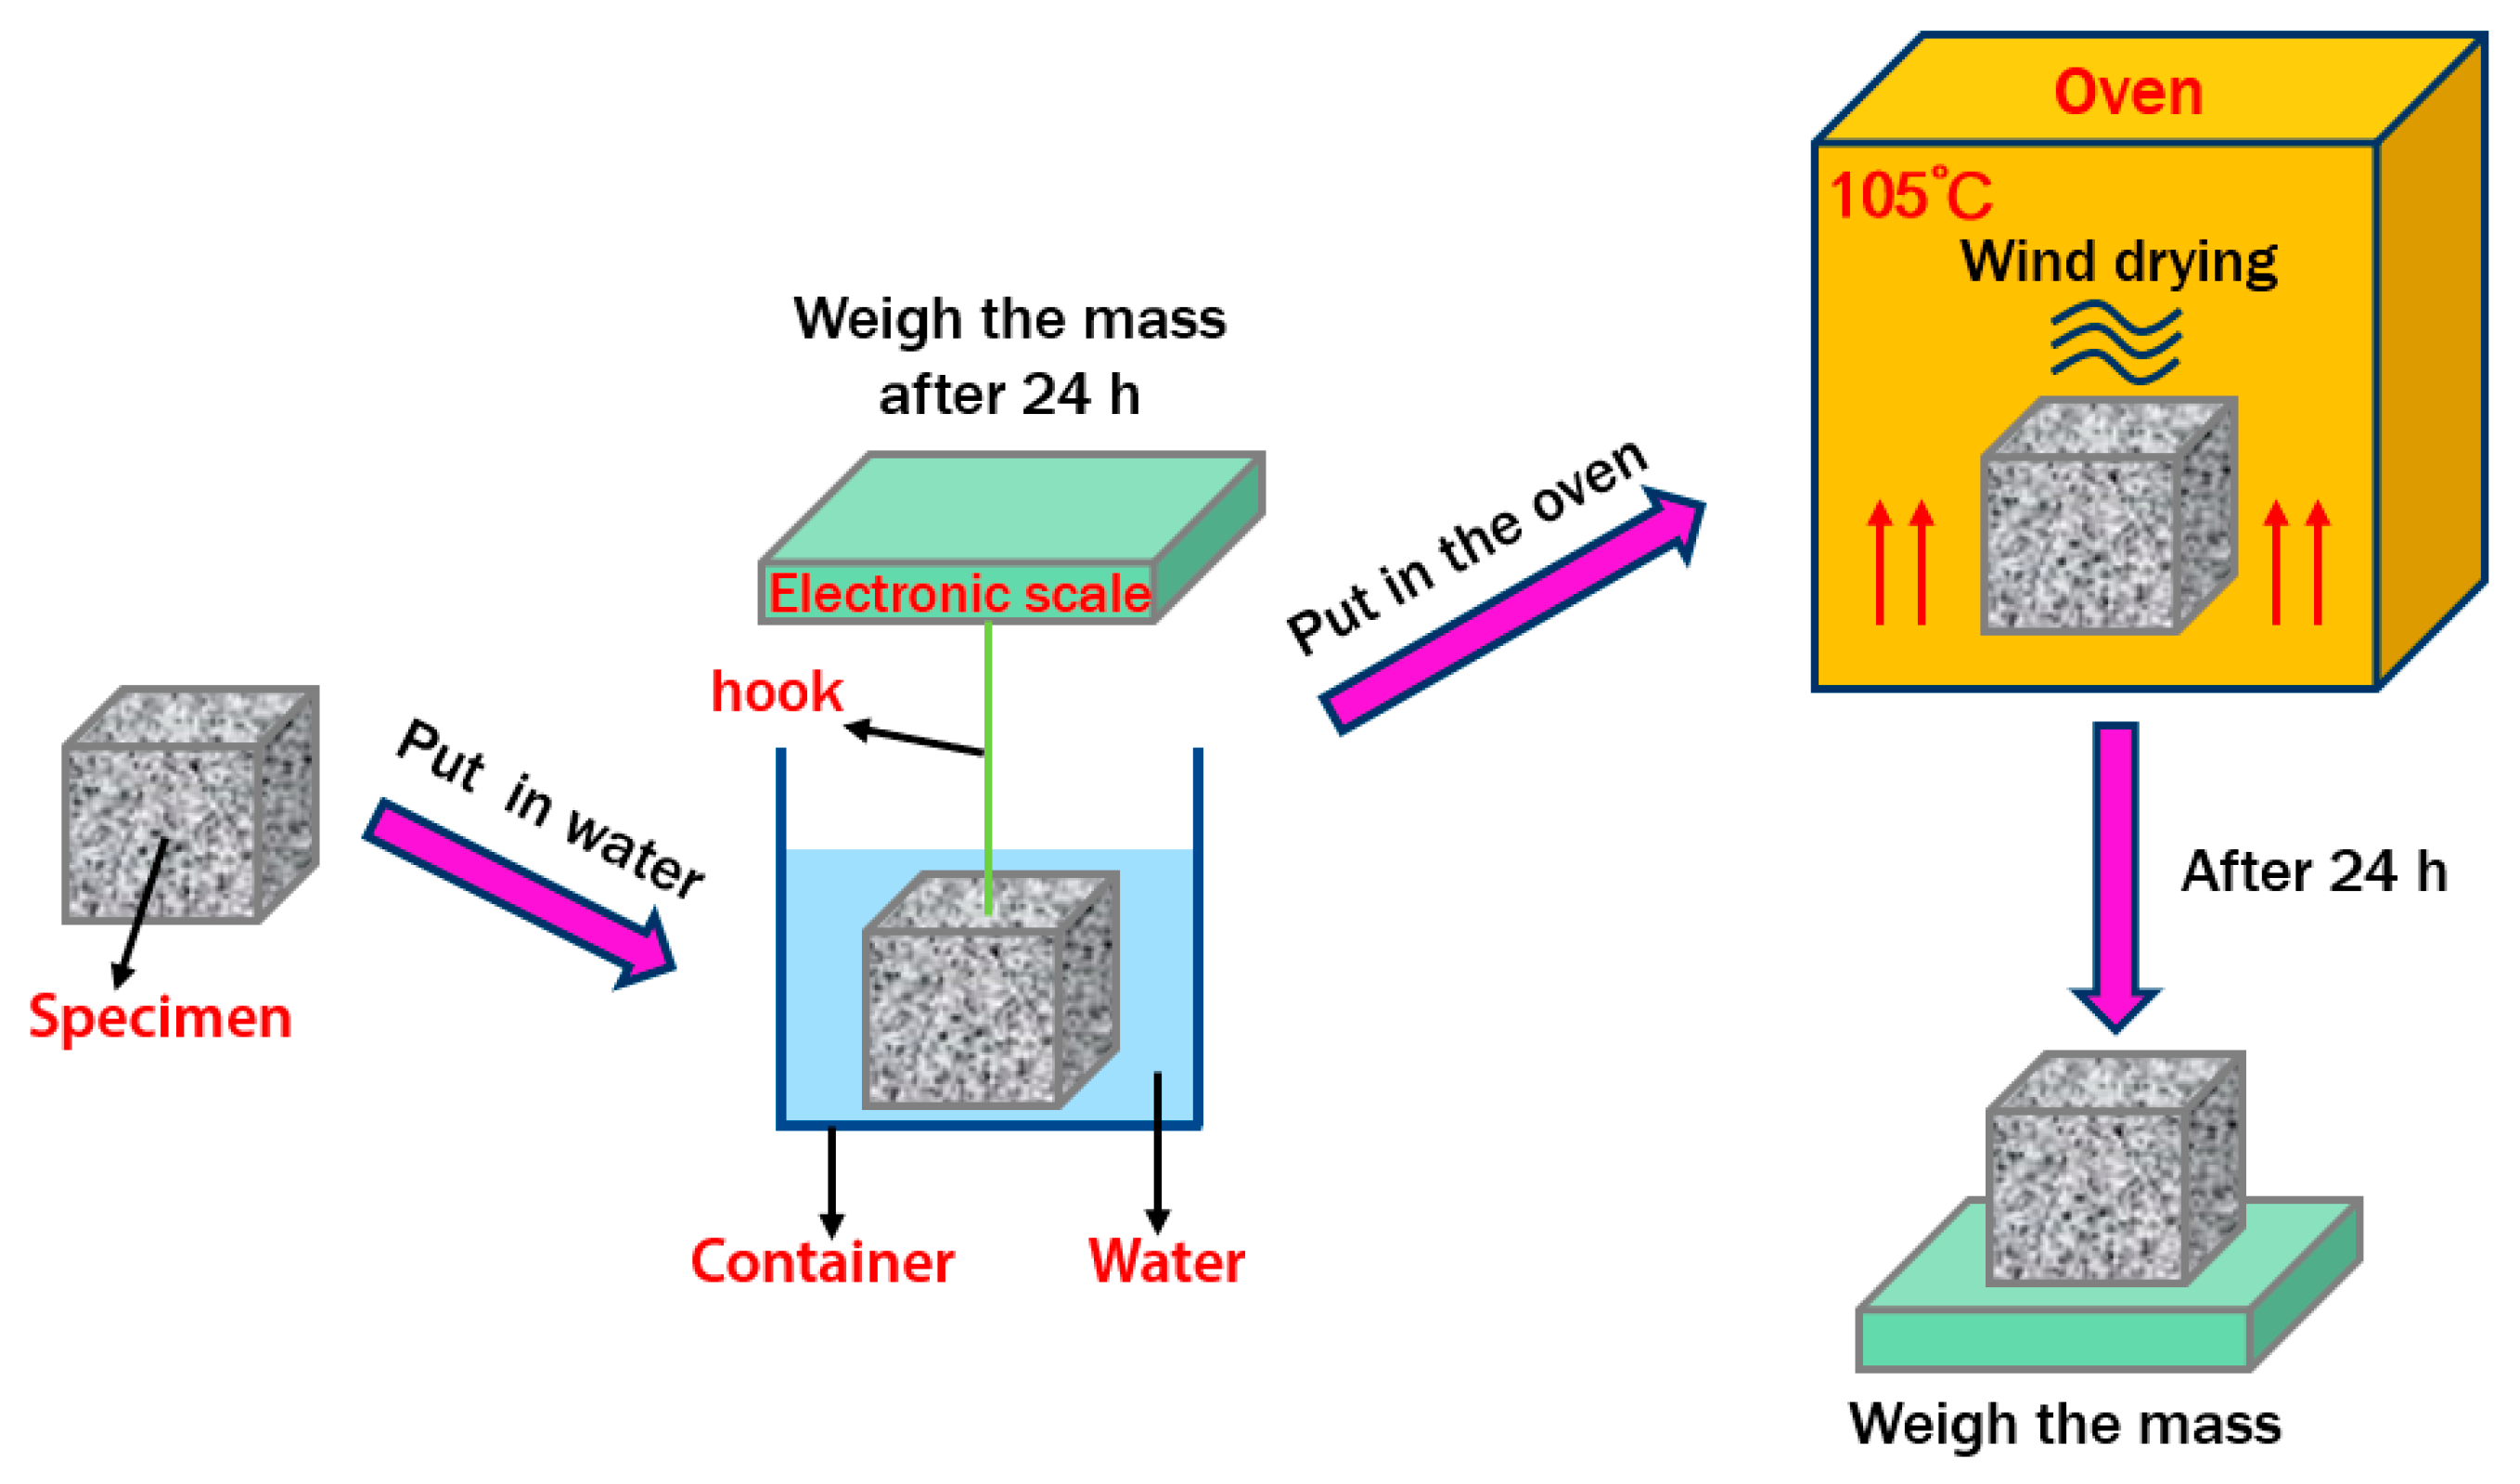
3.2. Porosity
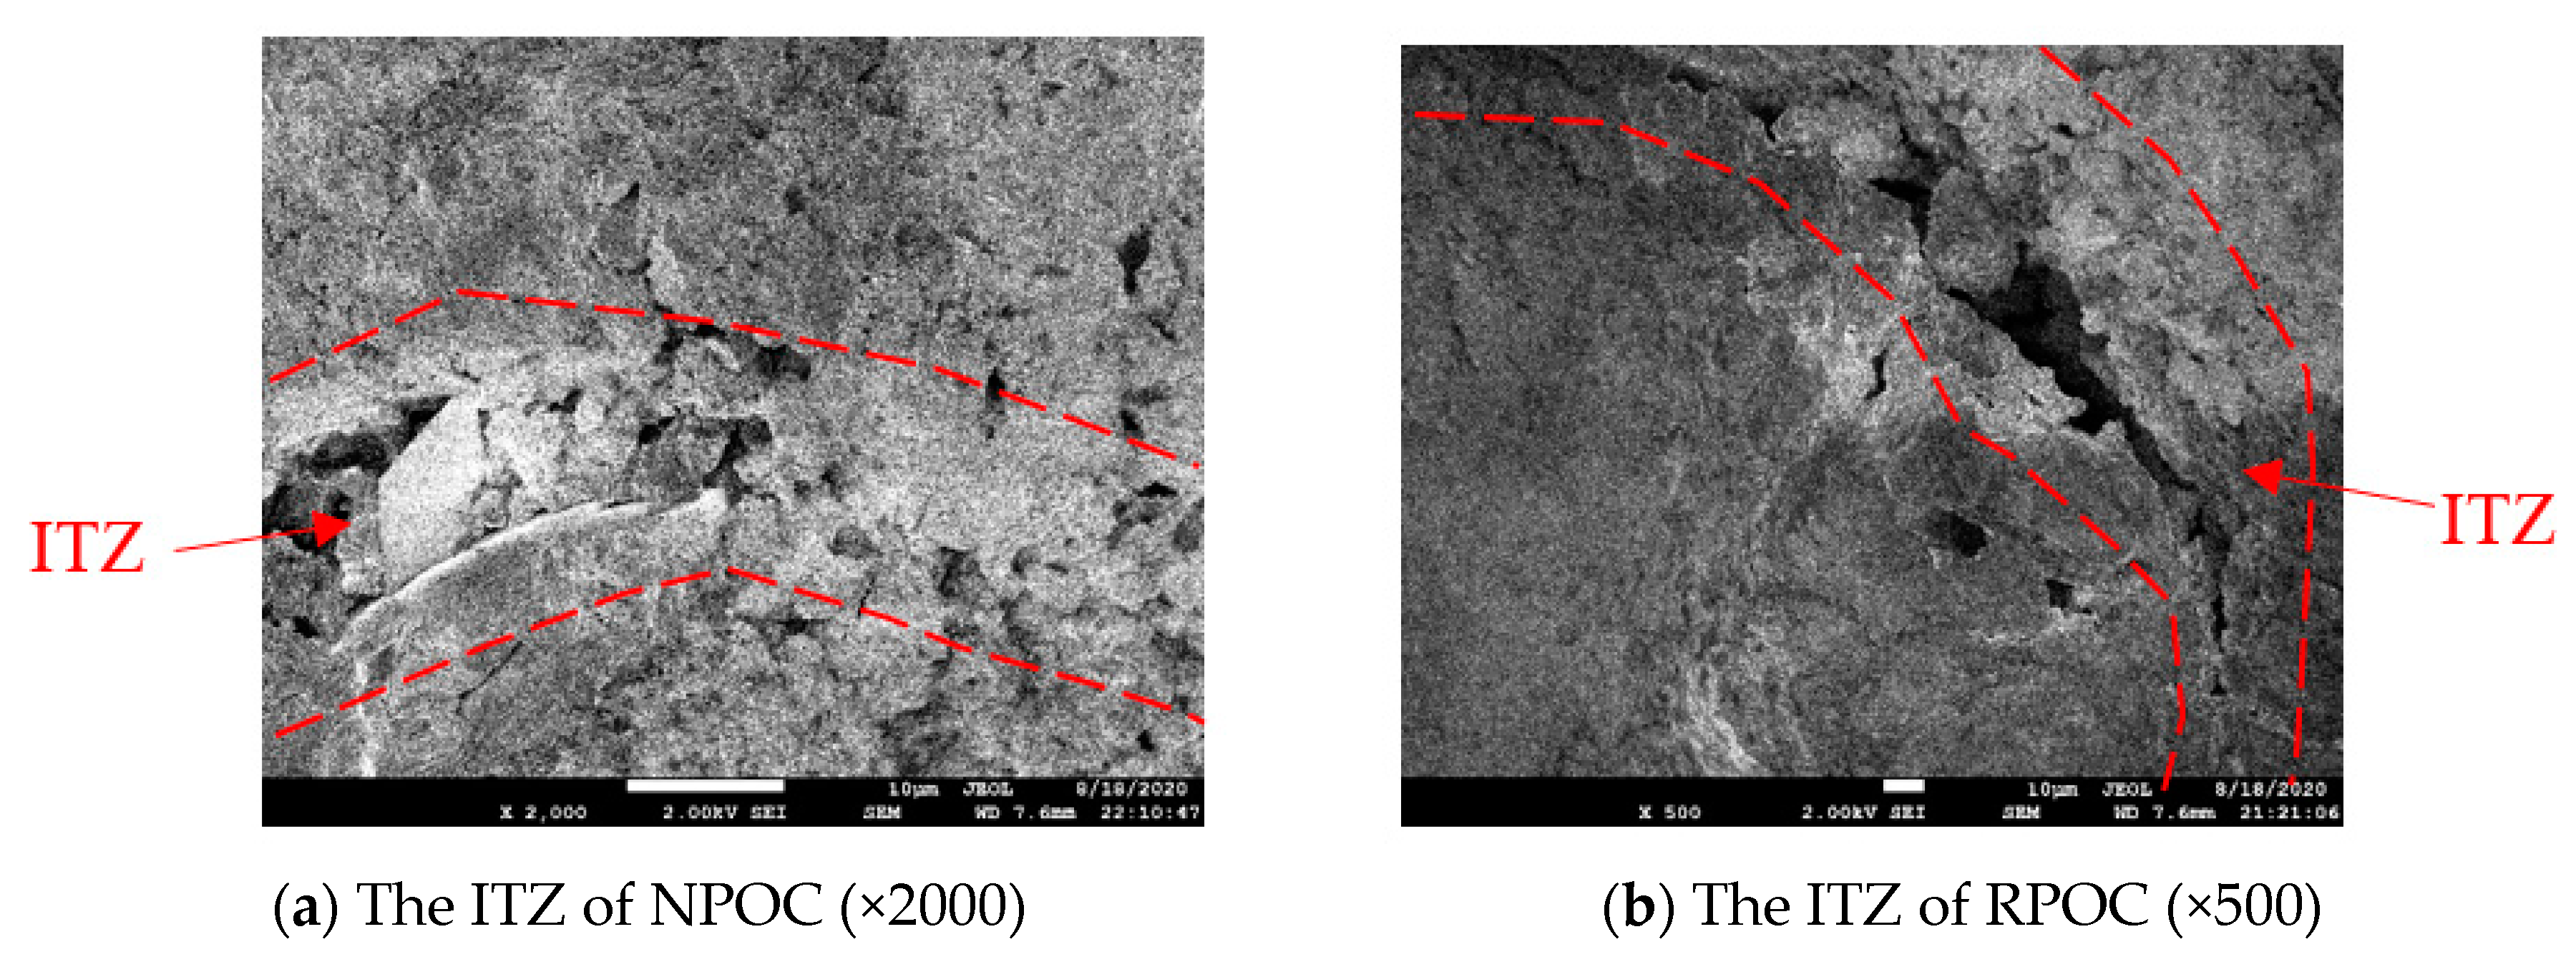
3.3. SEM Analysis
4. Results and Discussions
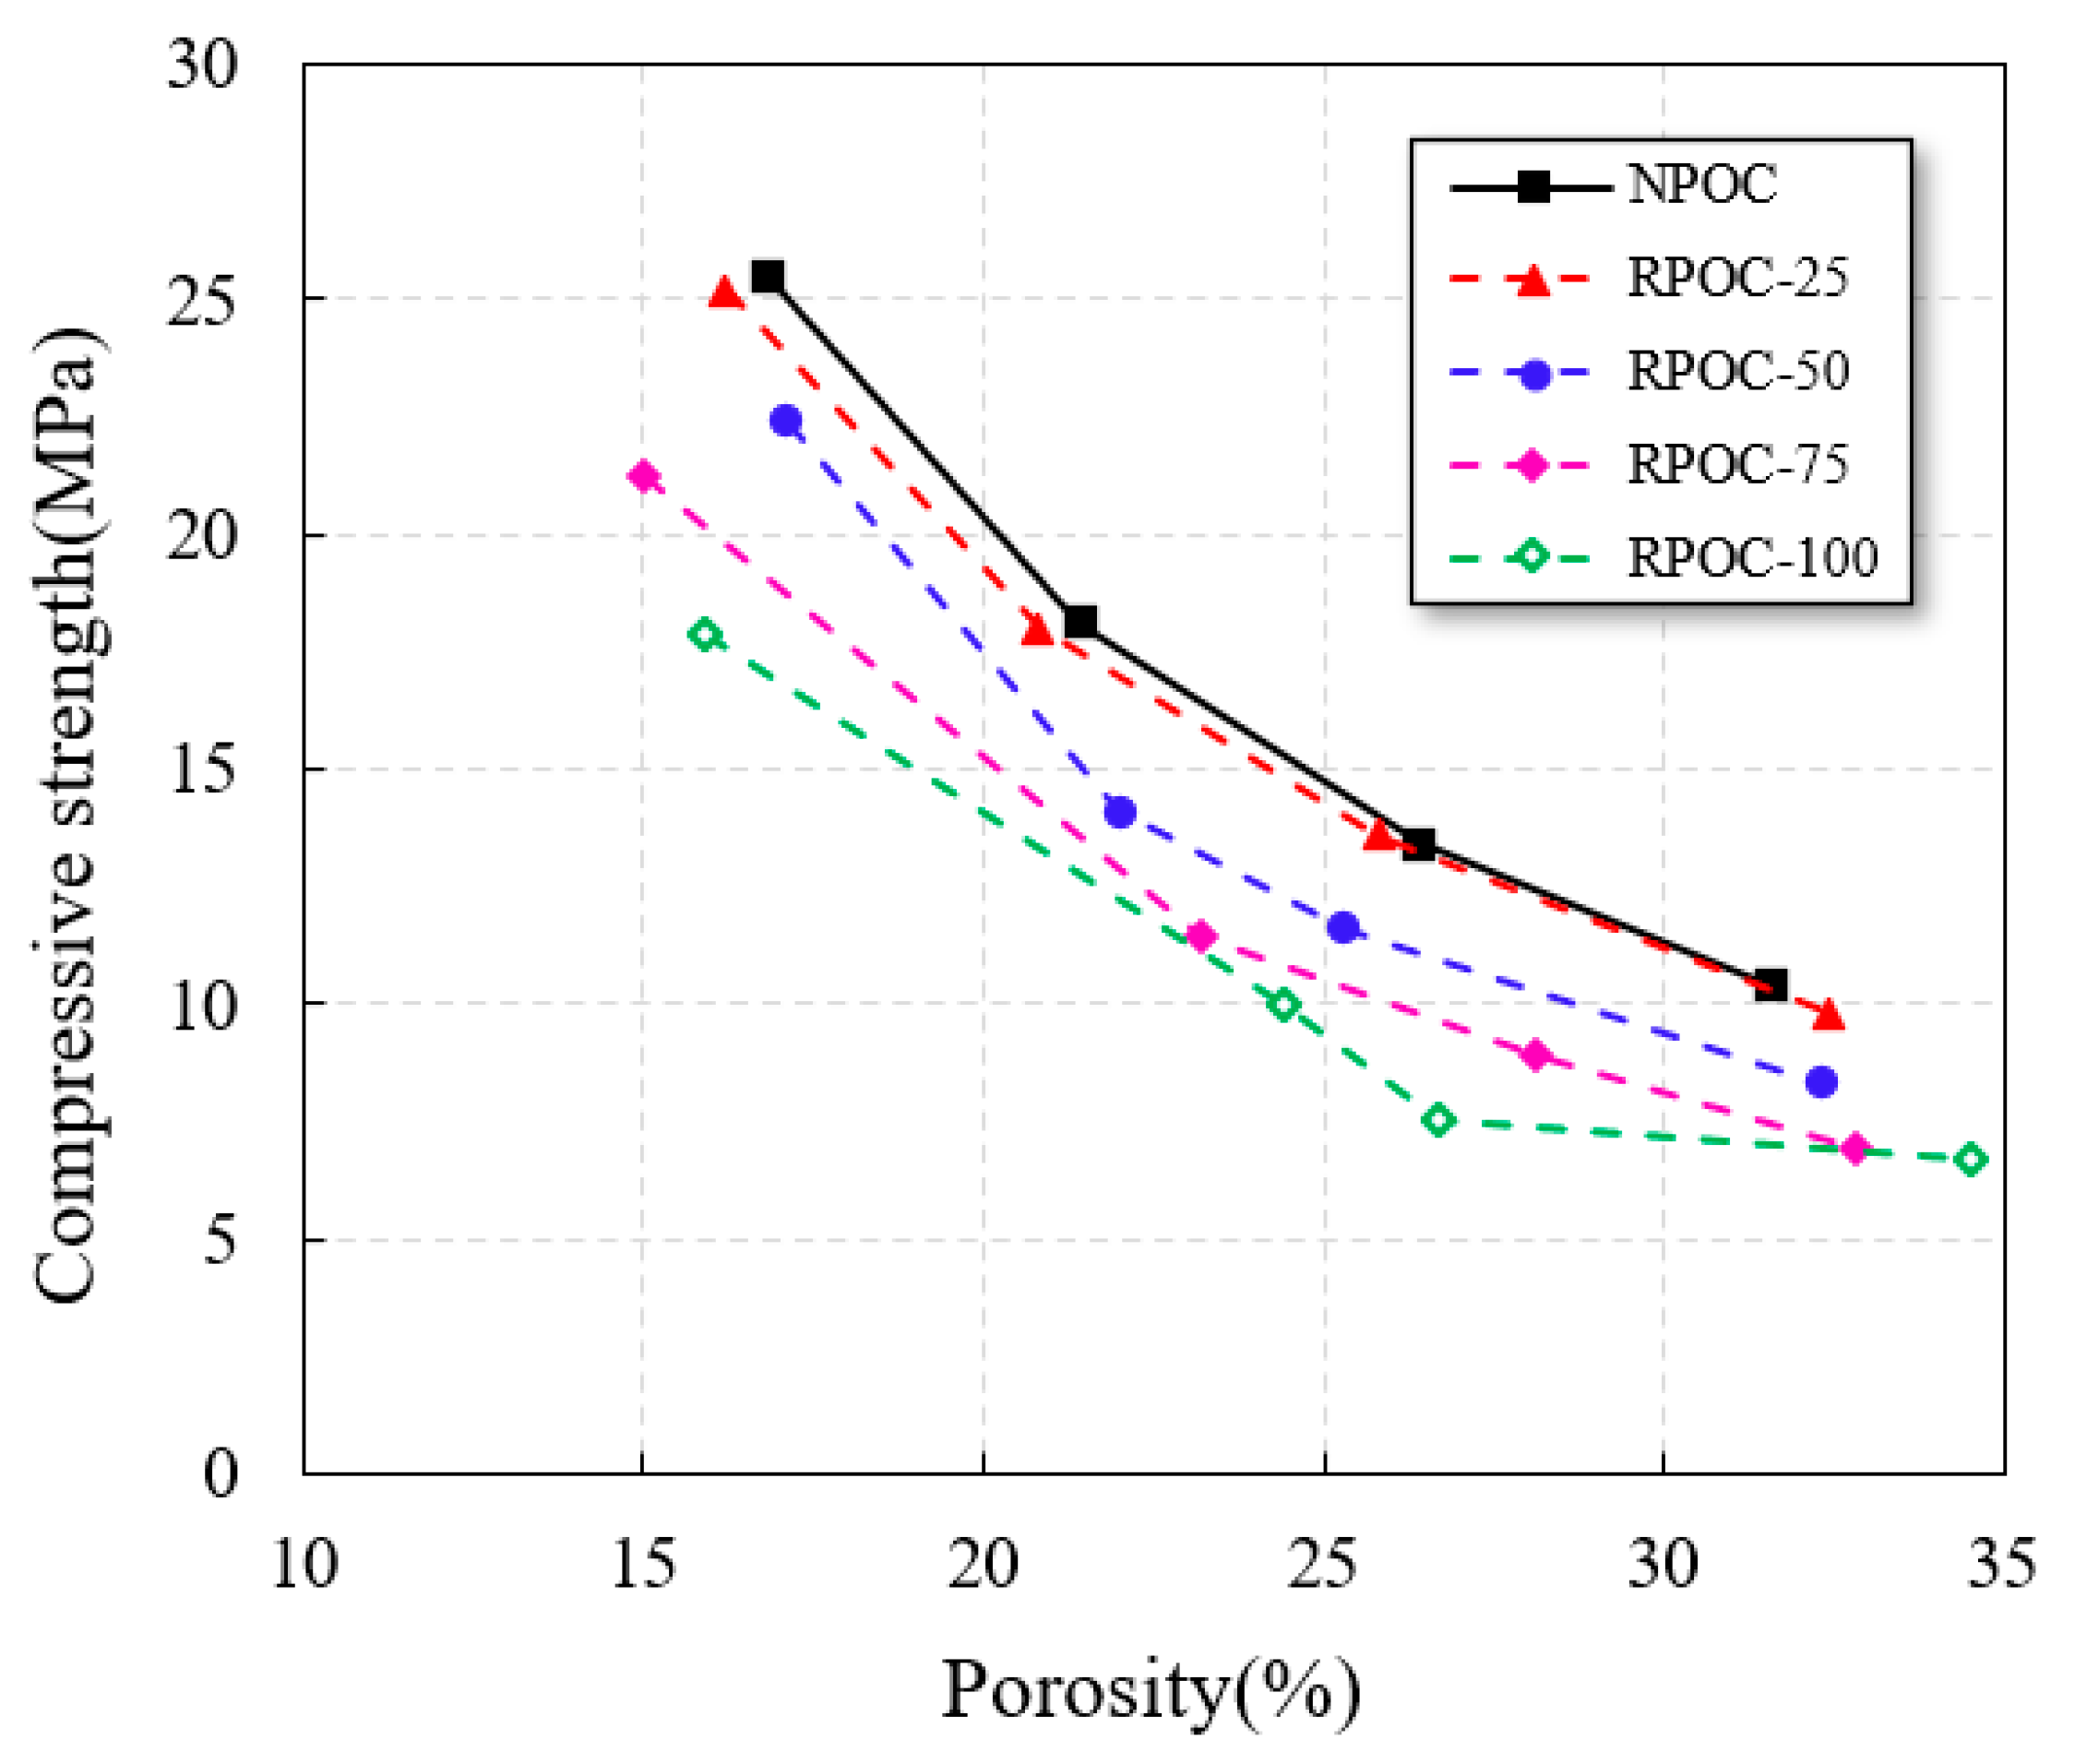
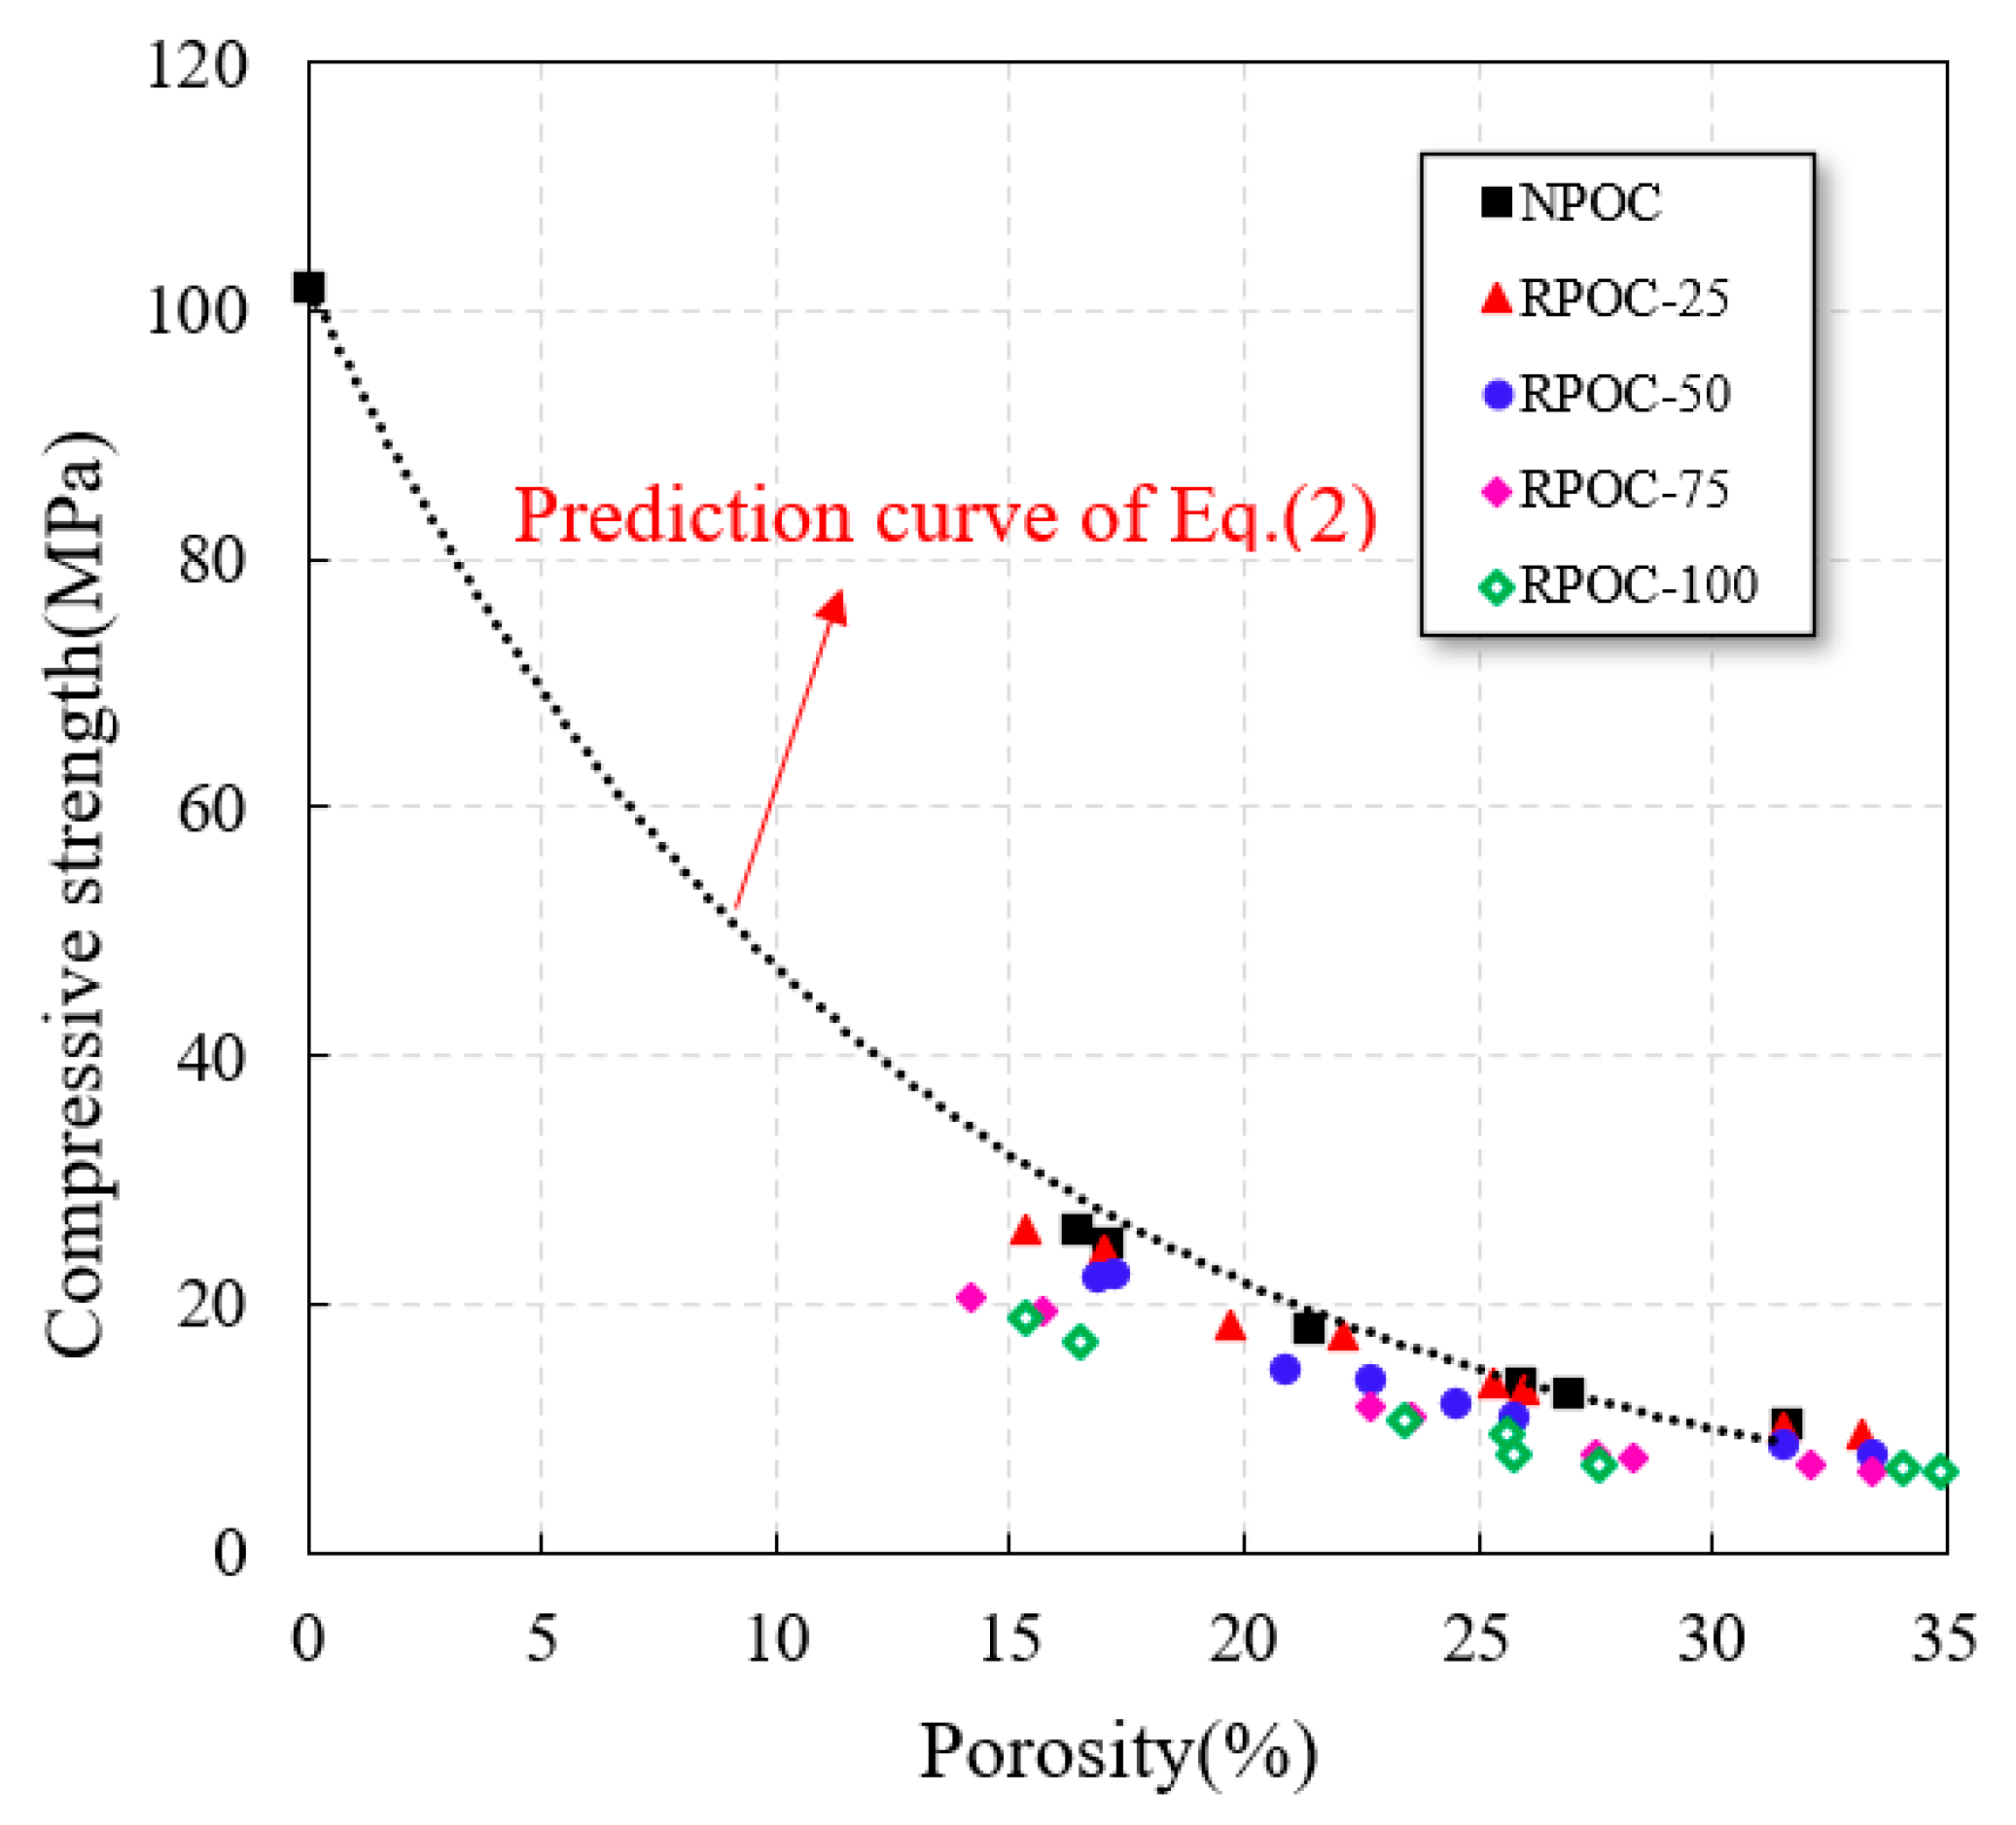
4.1. Influence of RA on Compressive Strength of POC
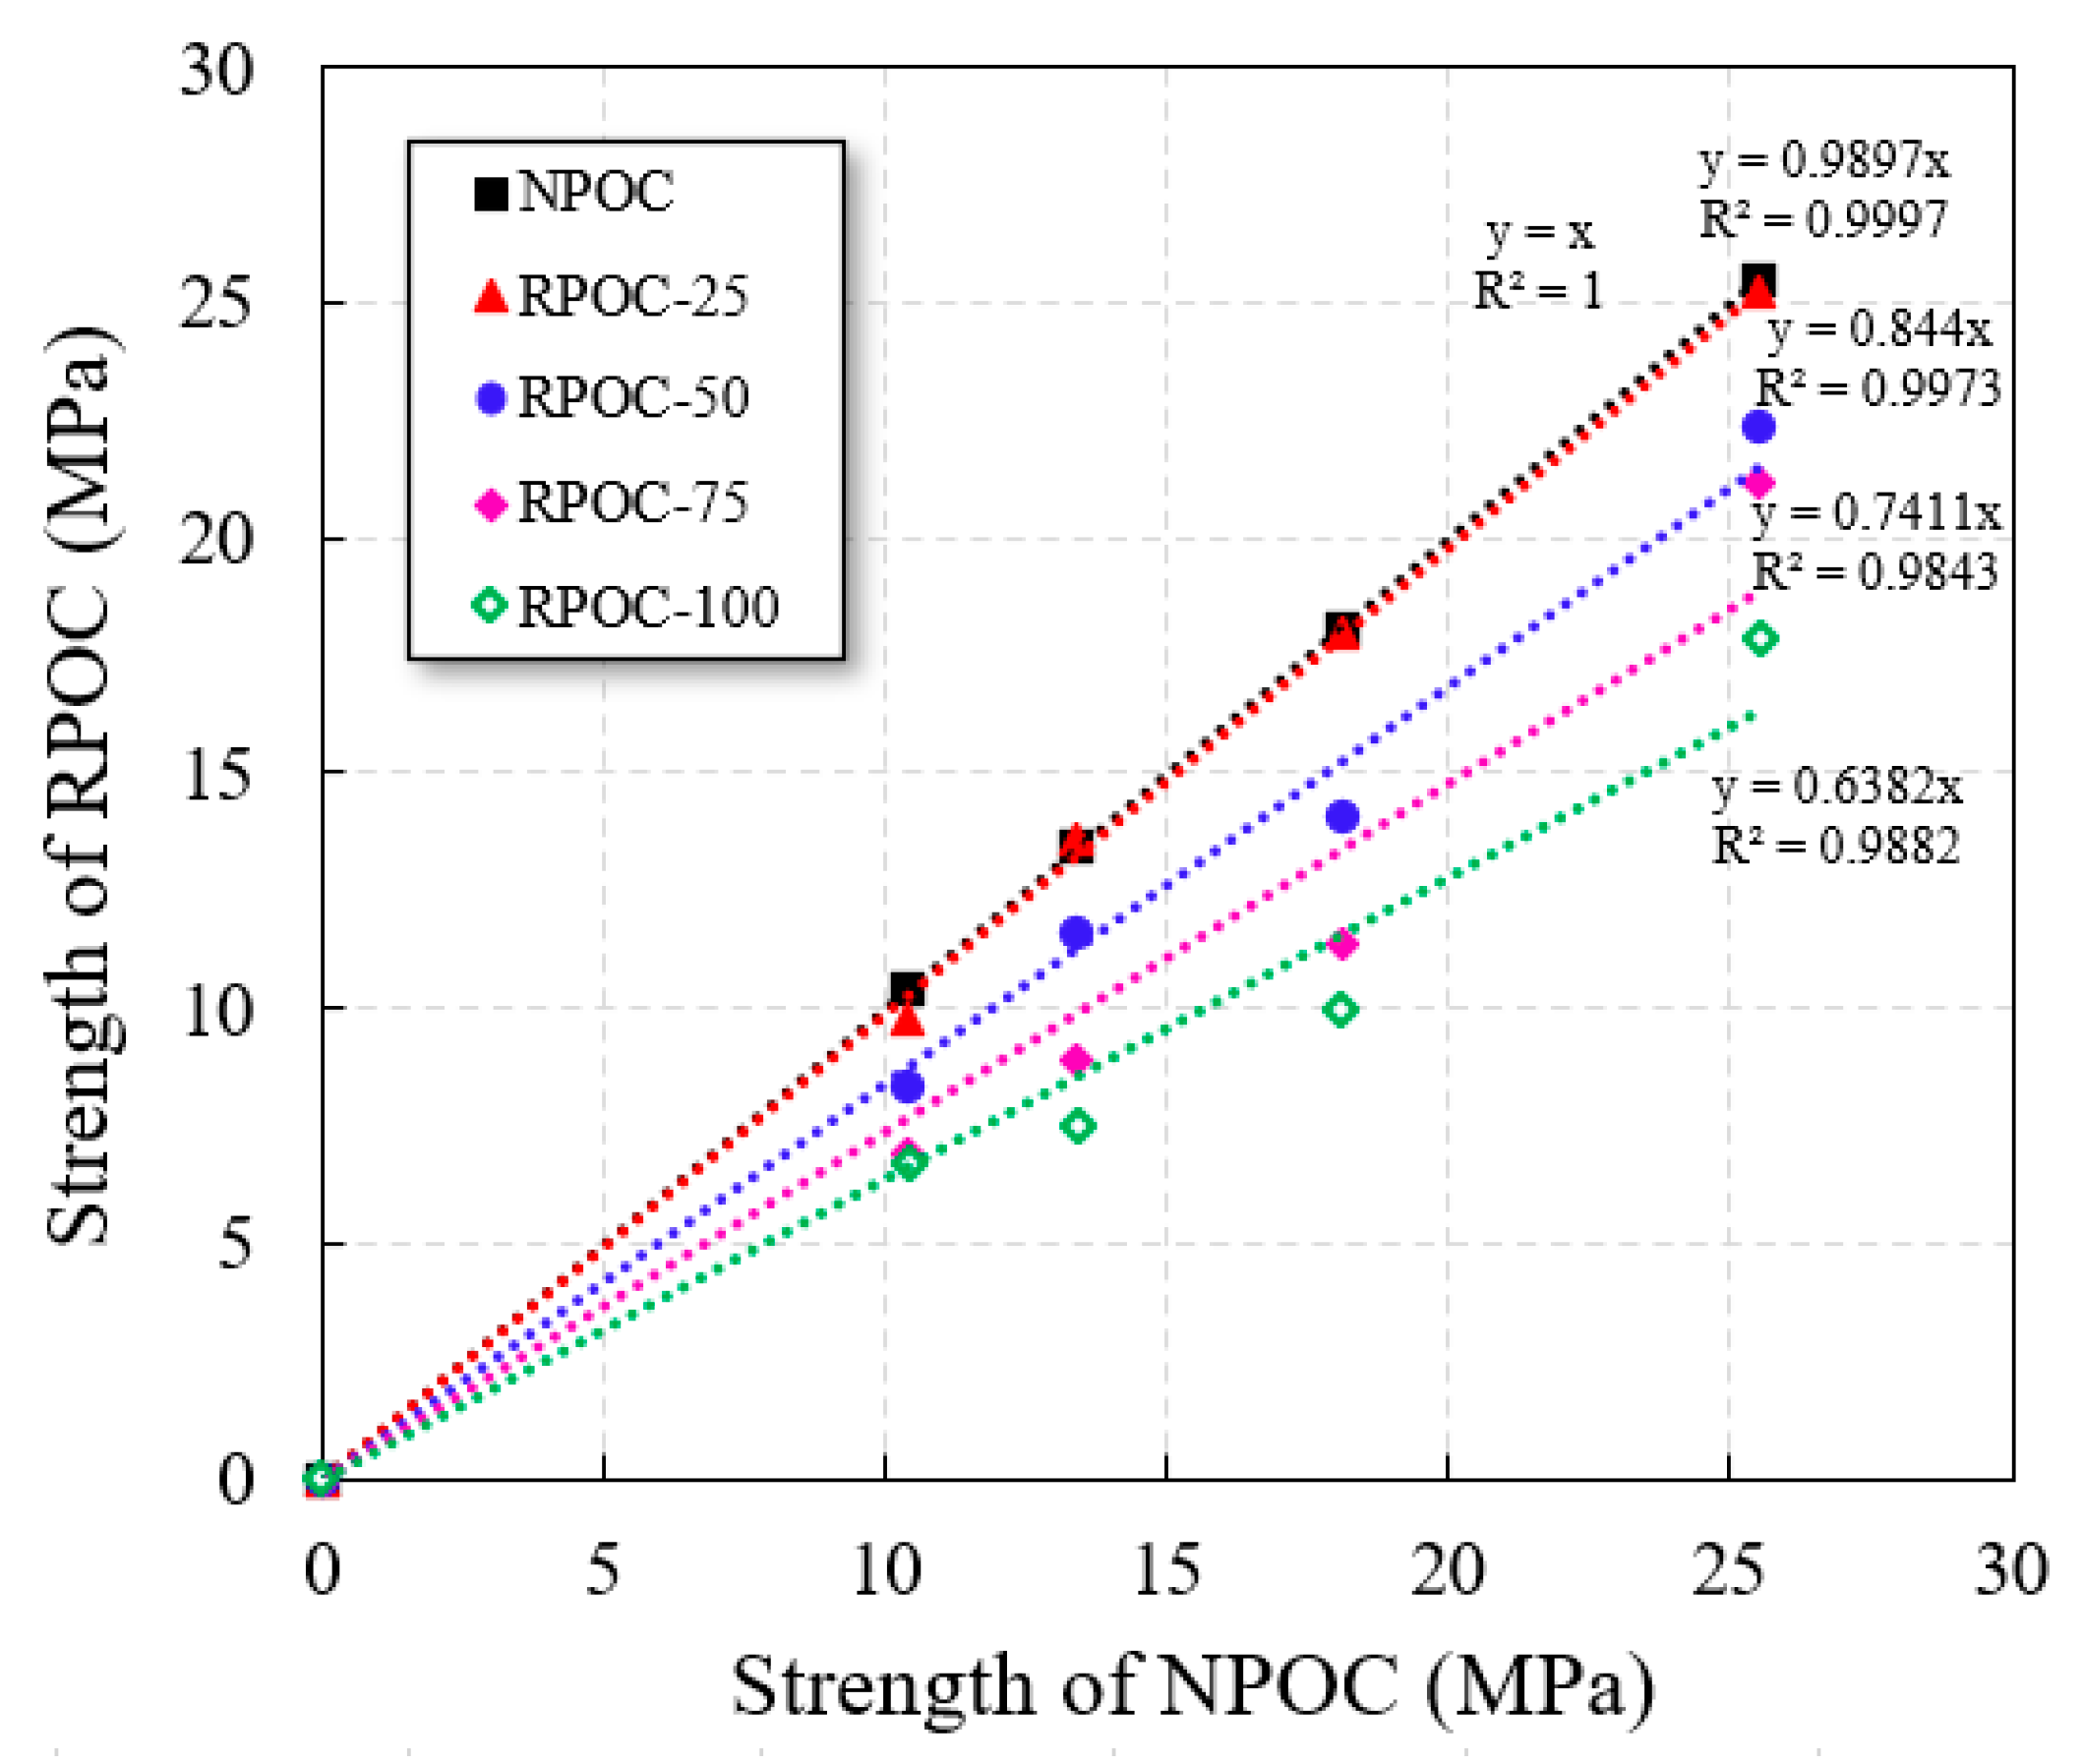
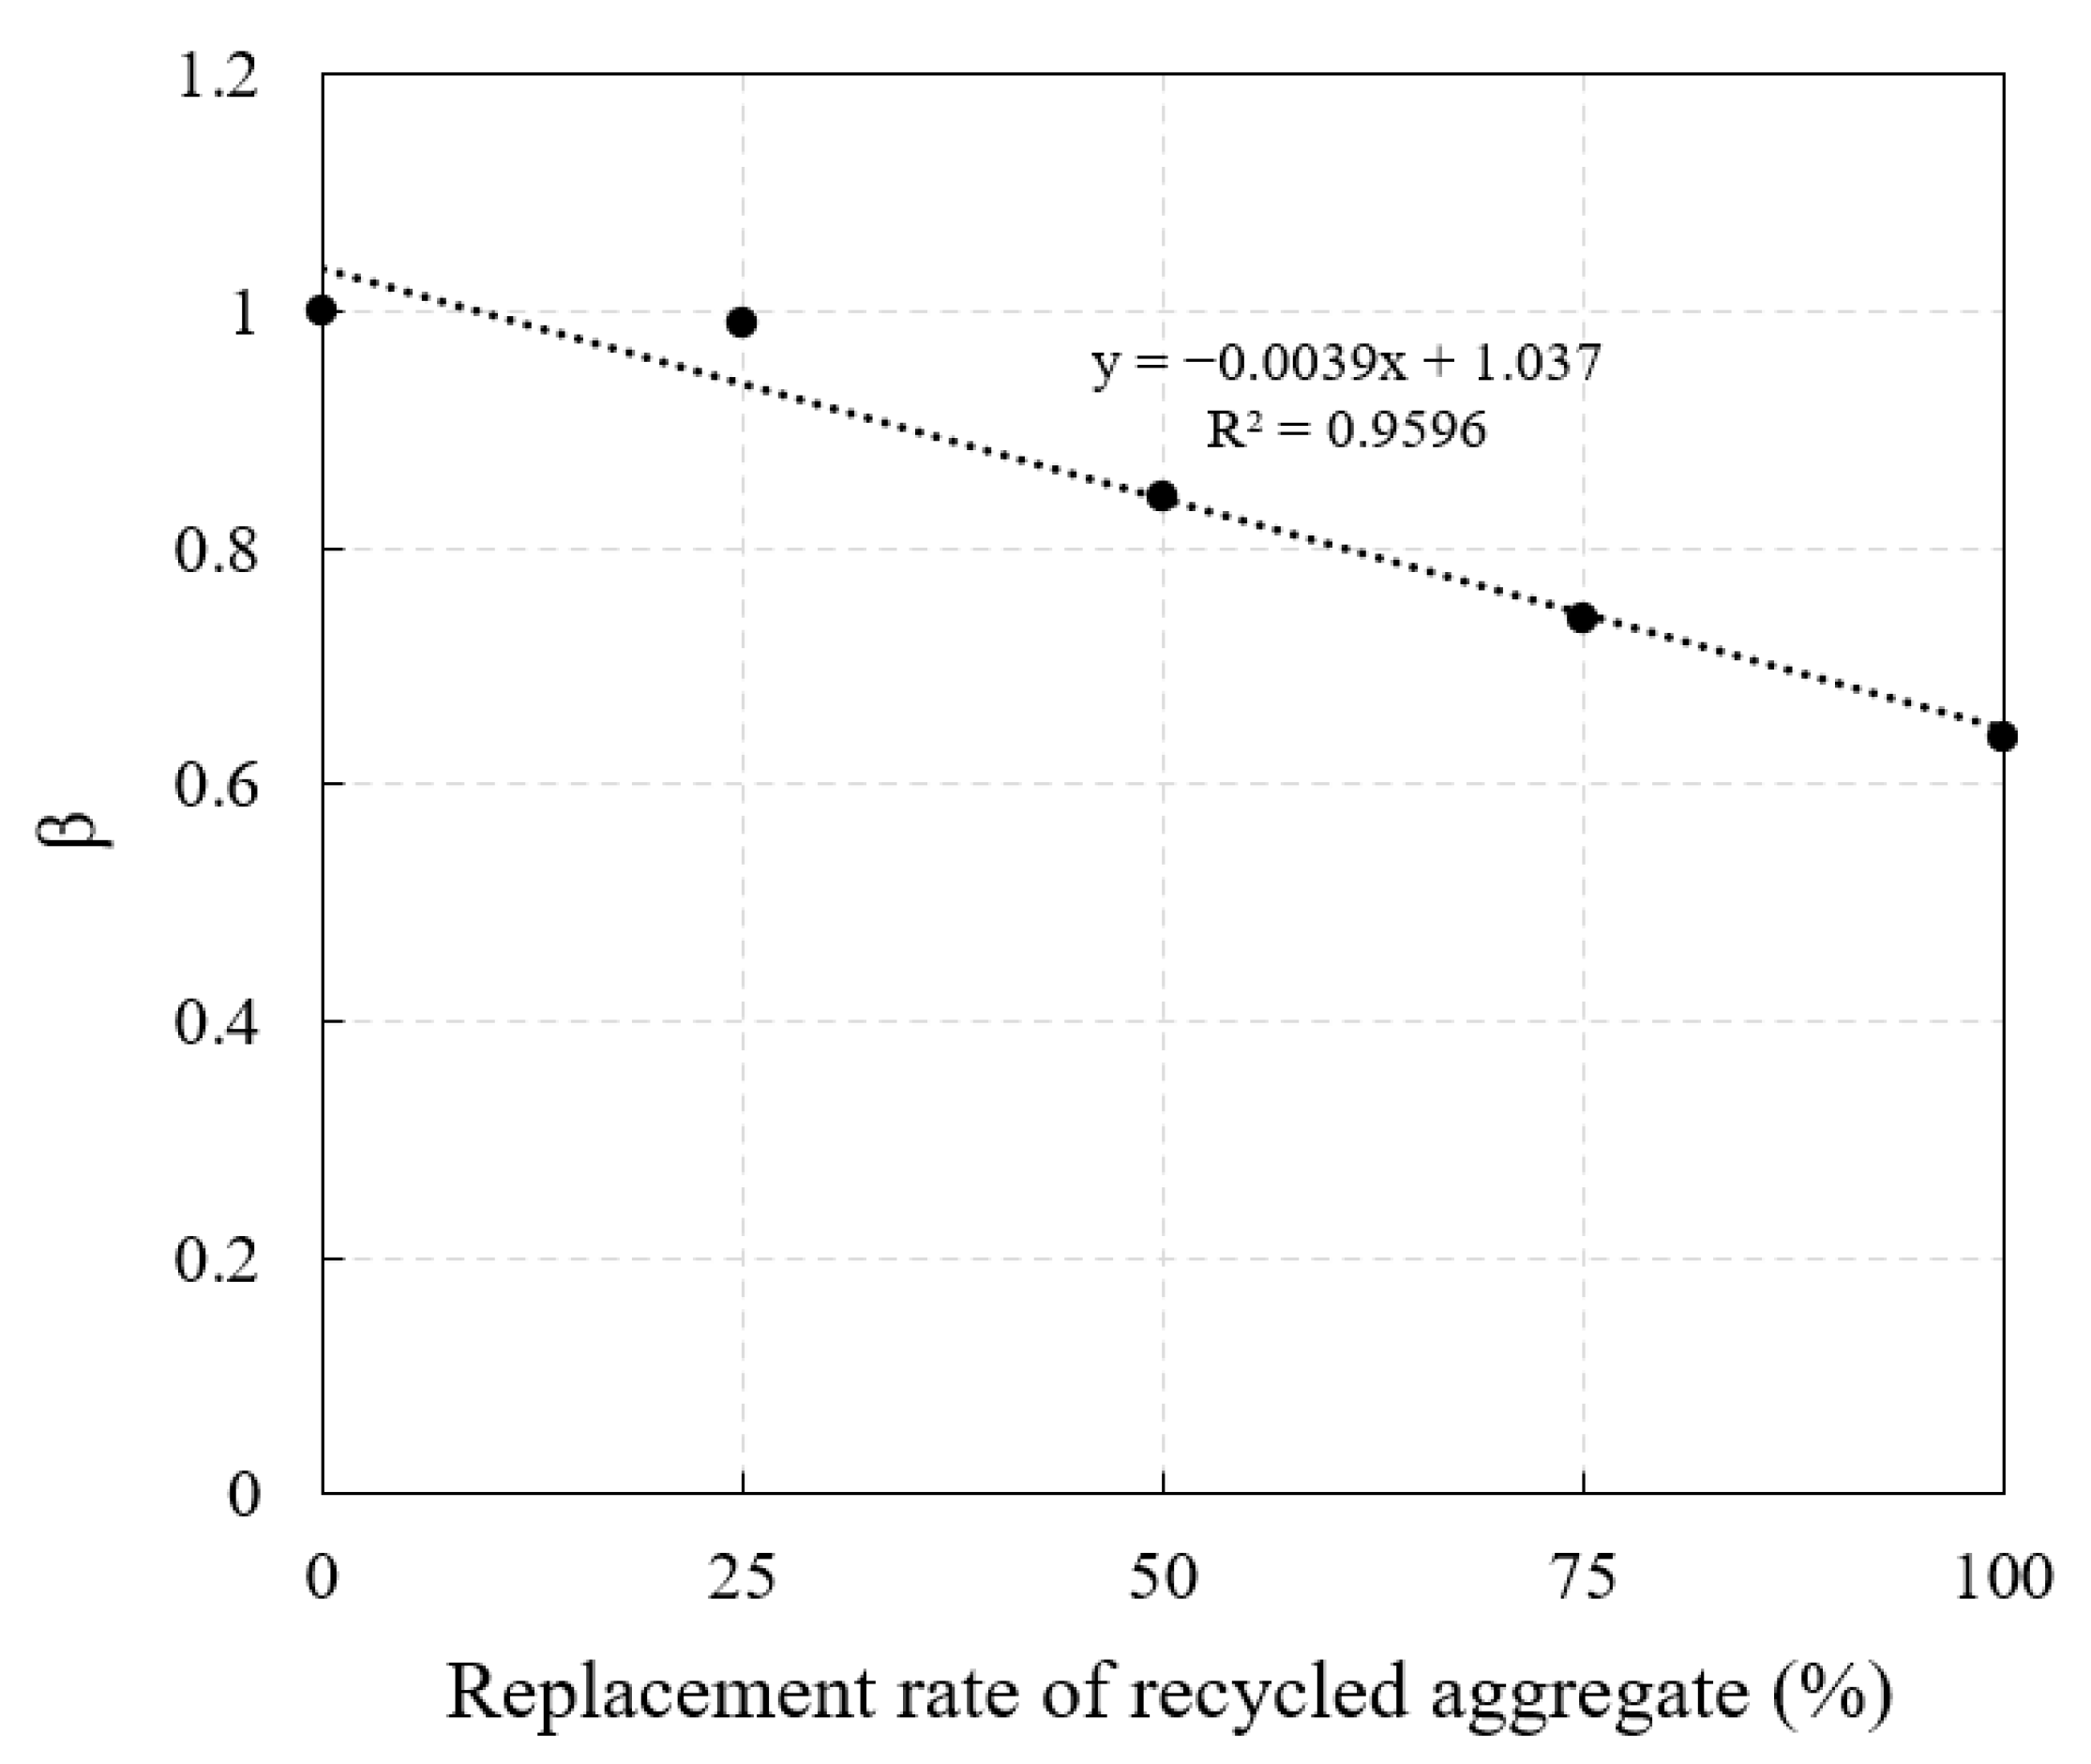
4.2. Relationship between NPOC and RPOC
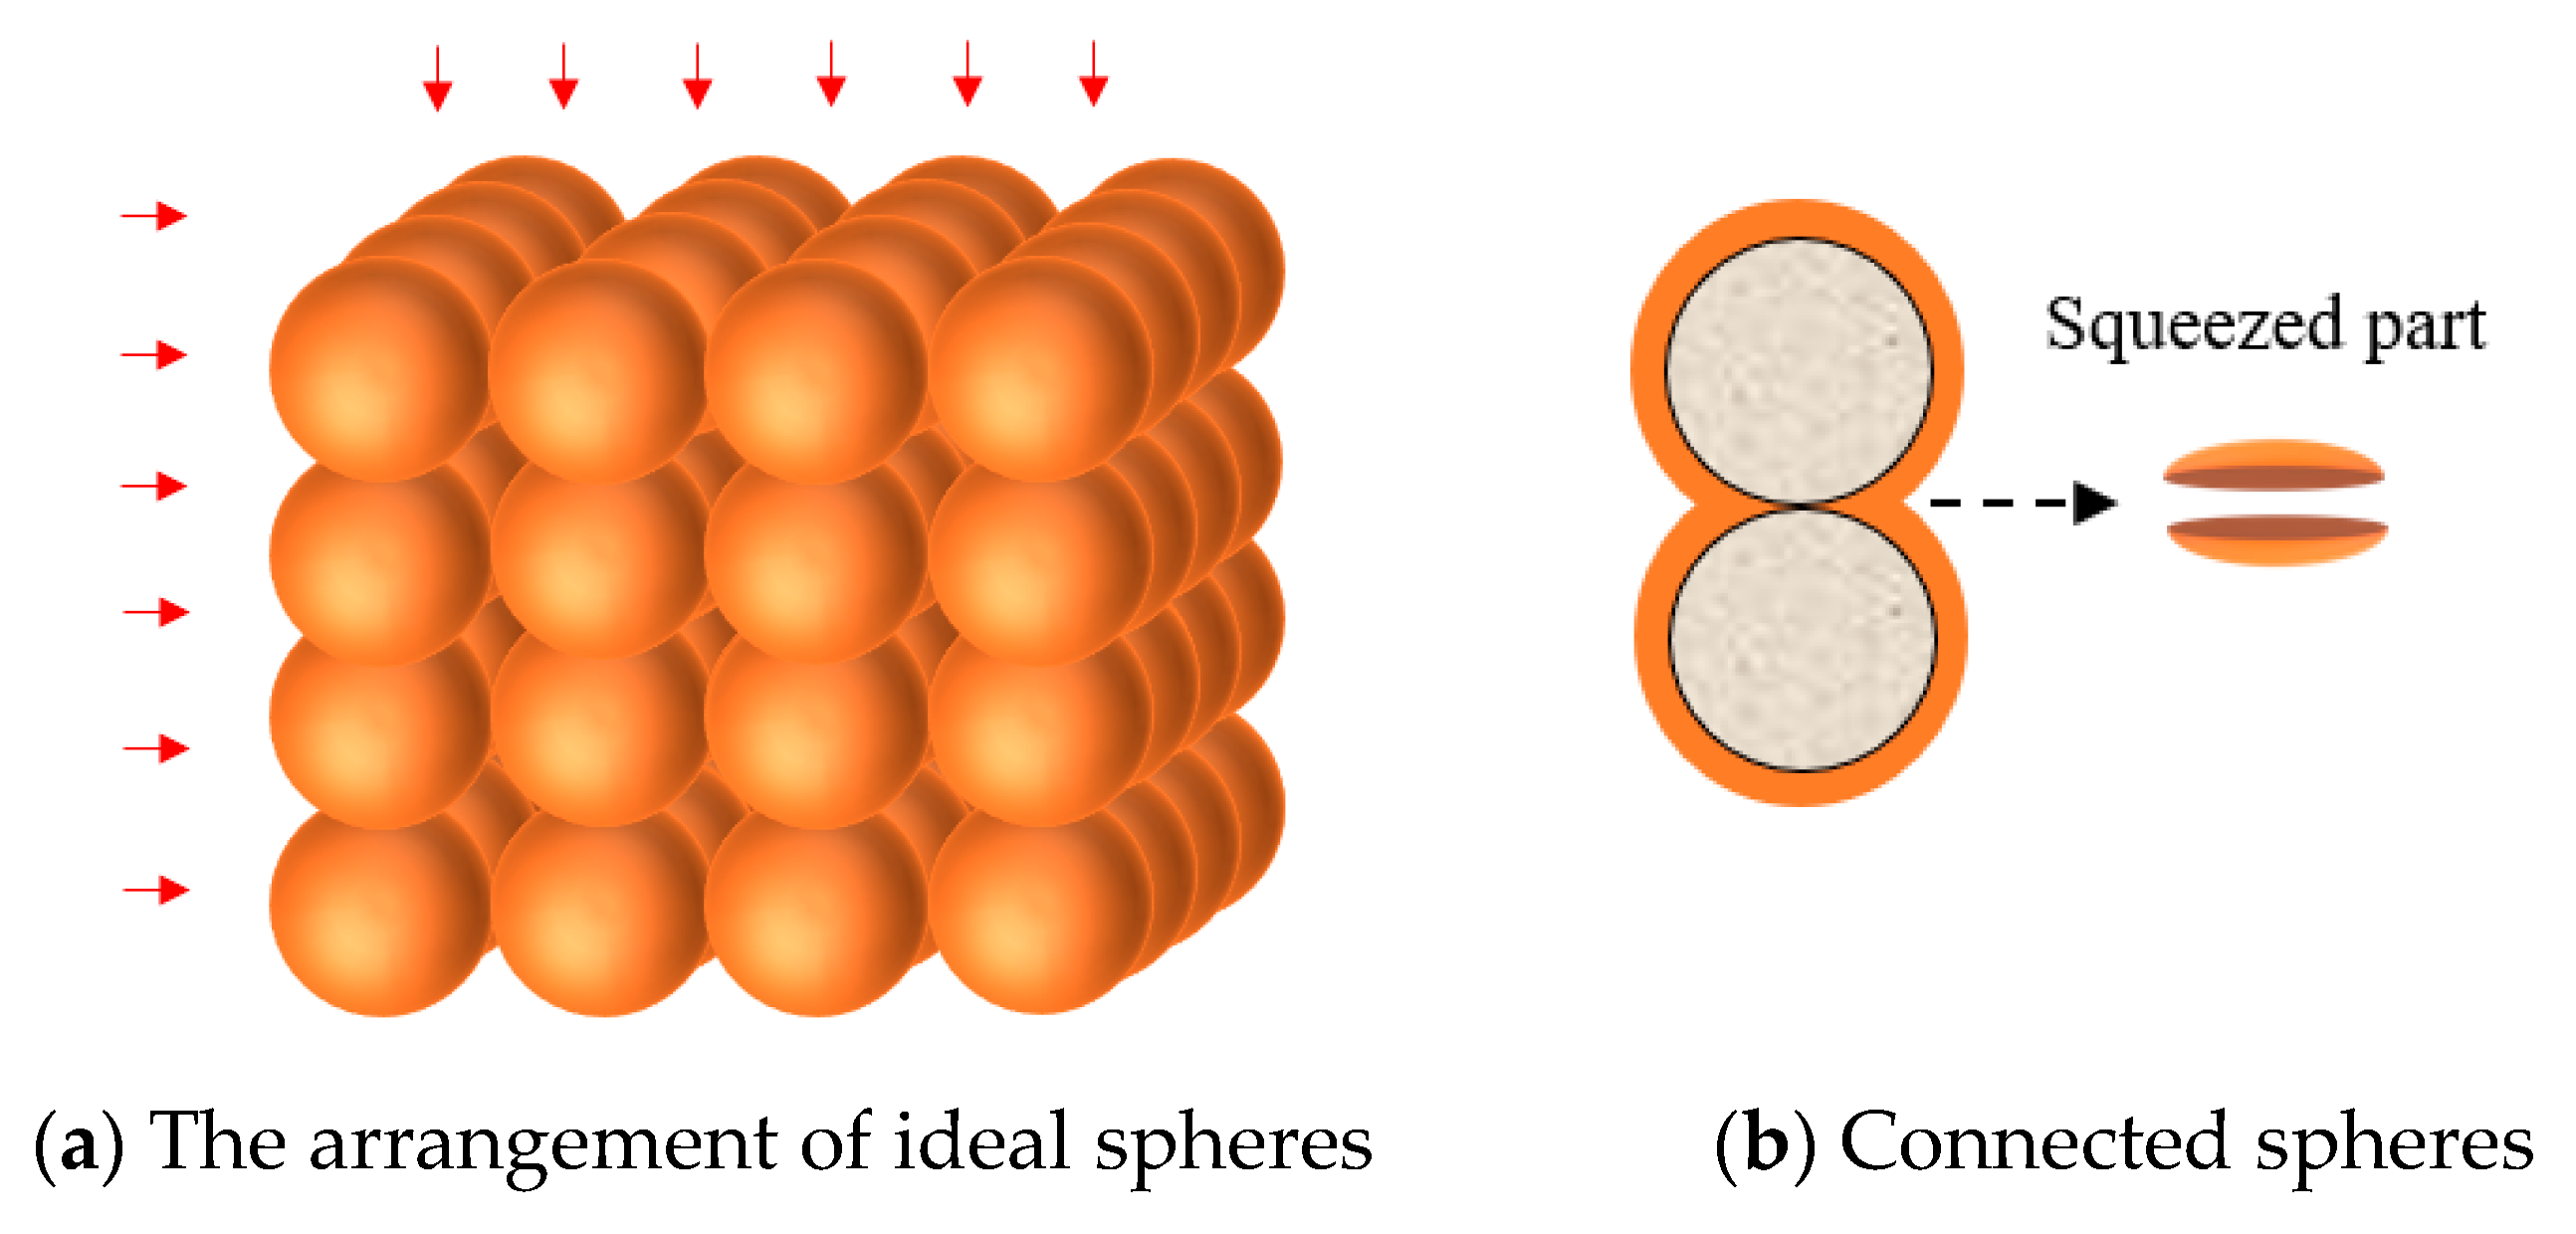
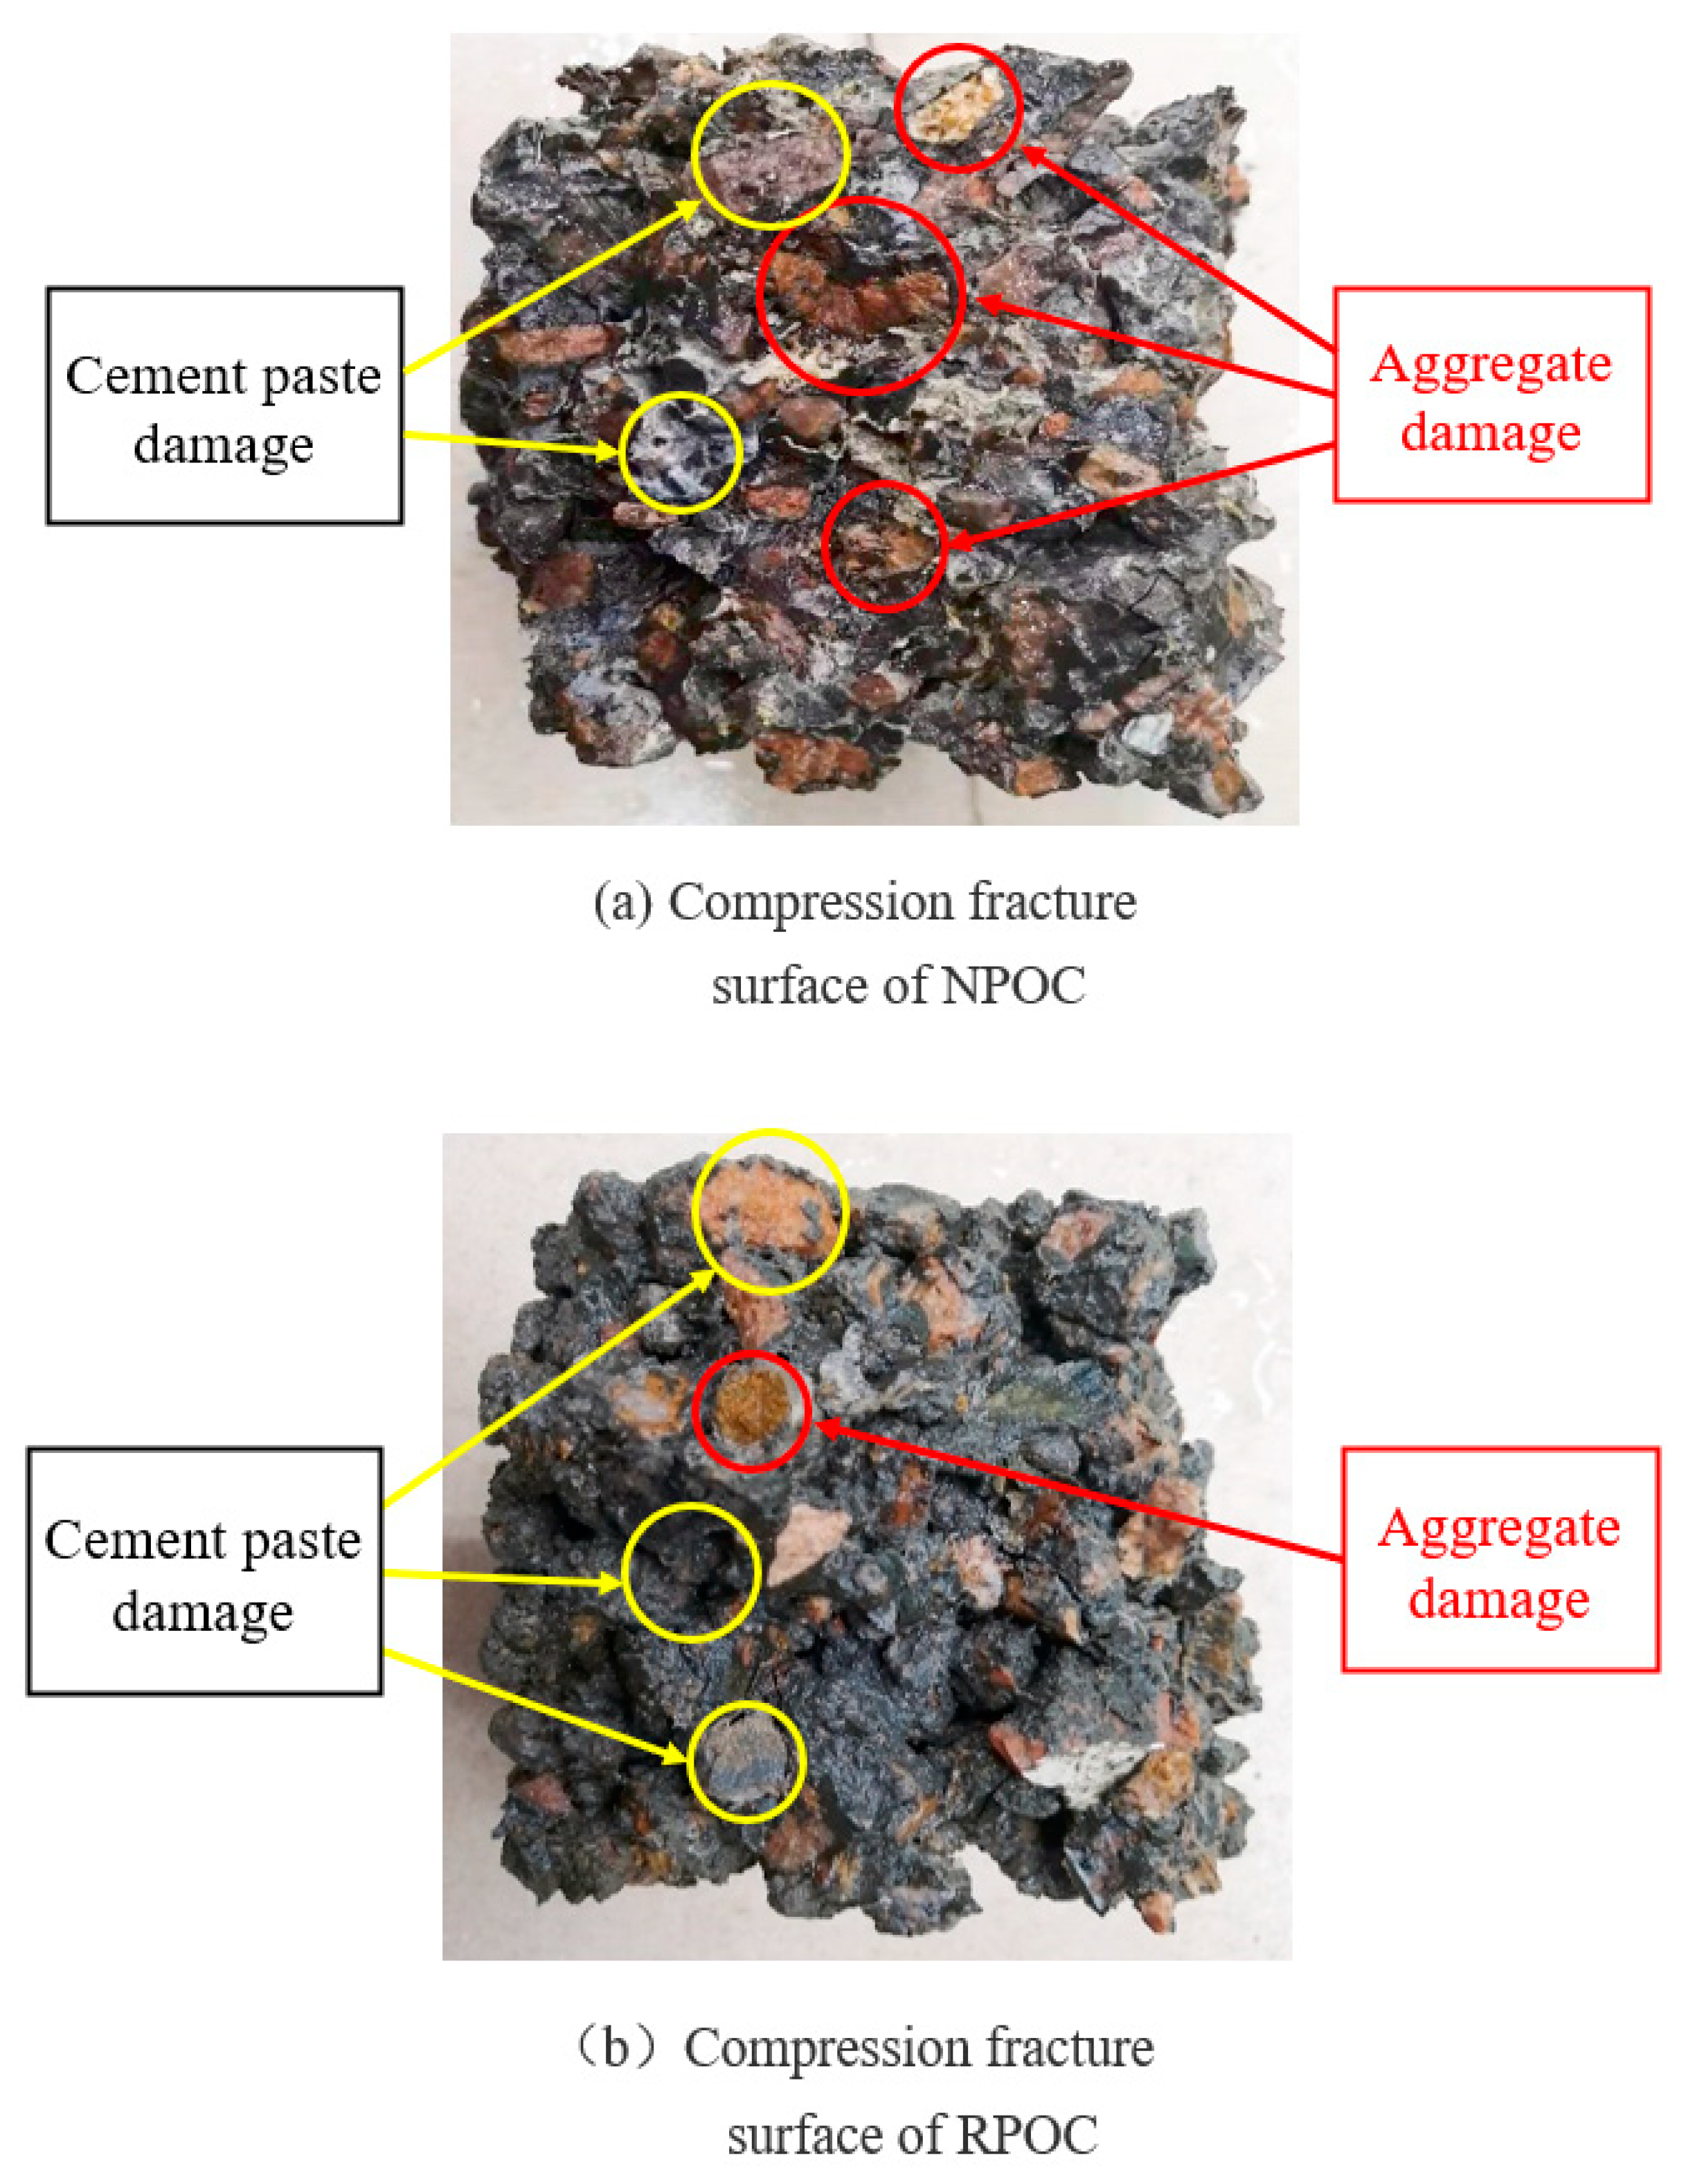
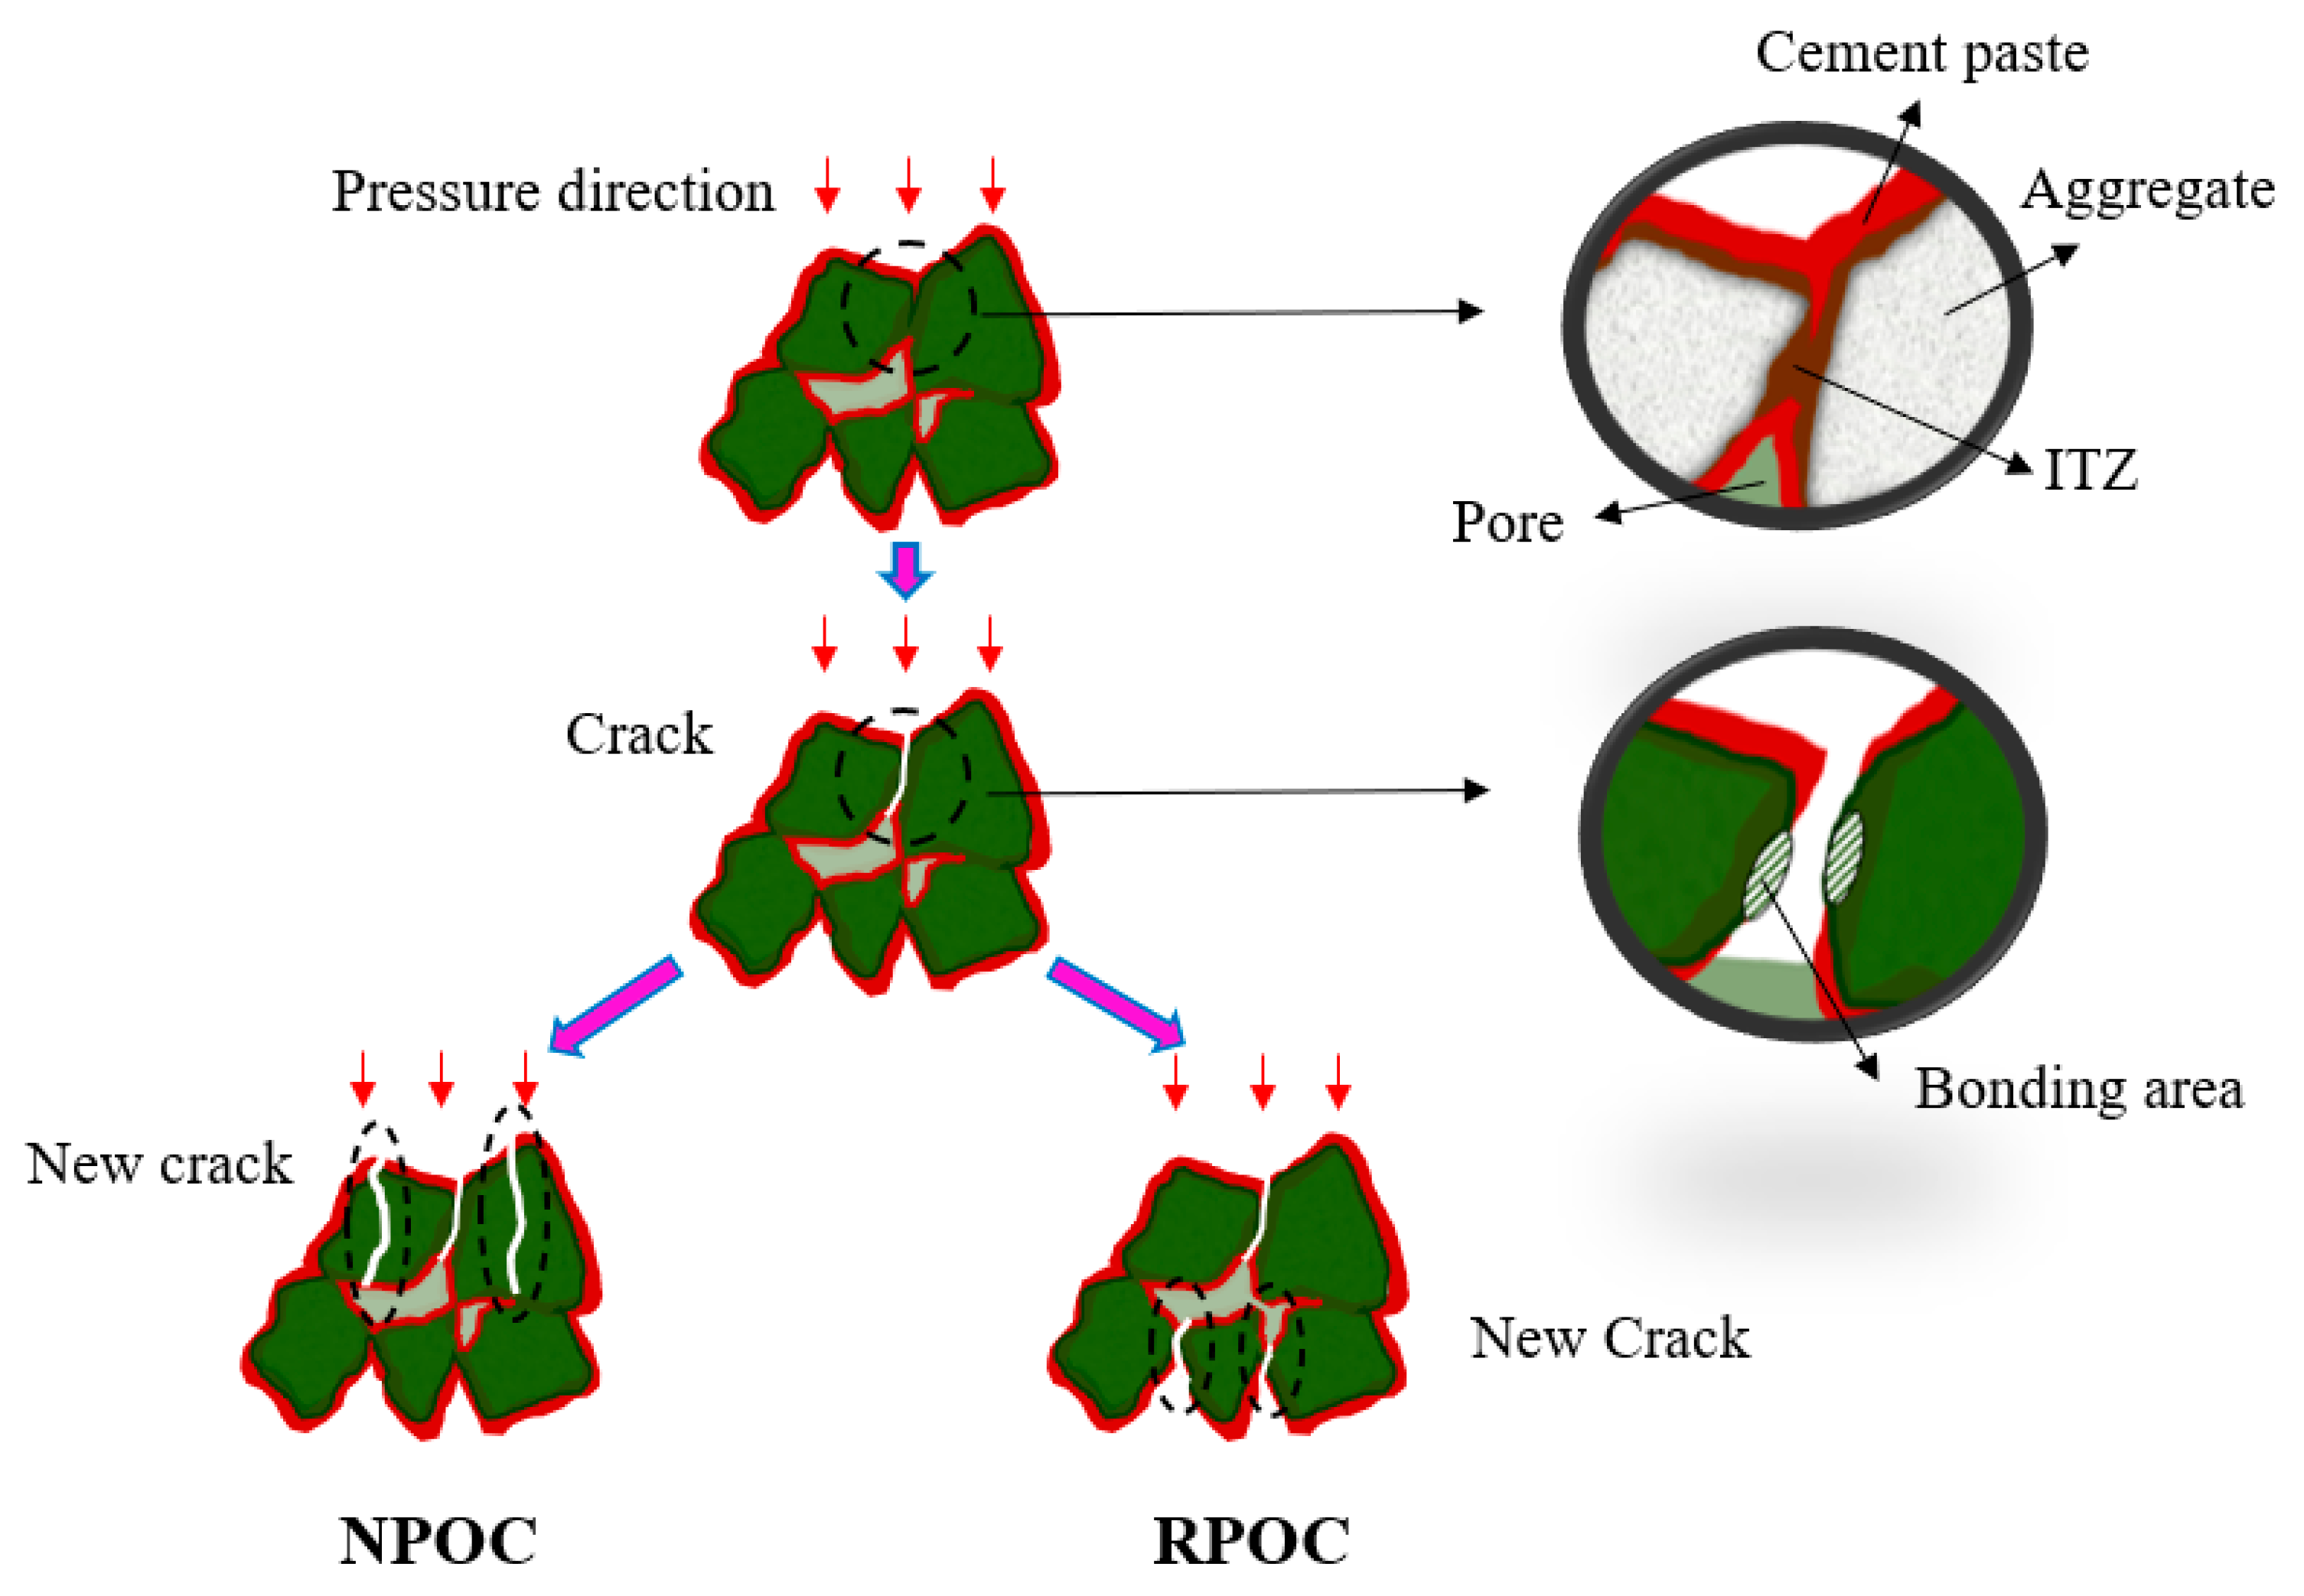
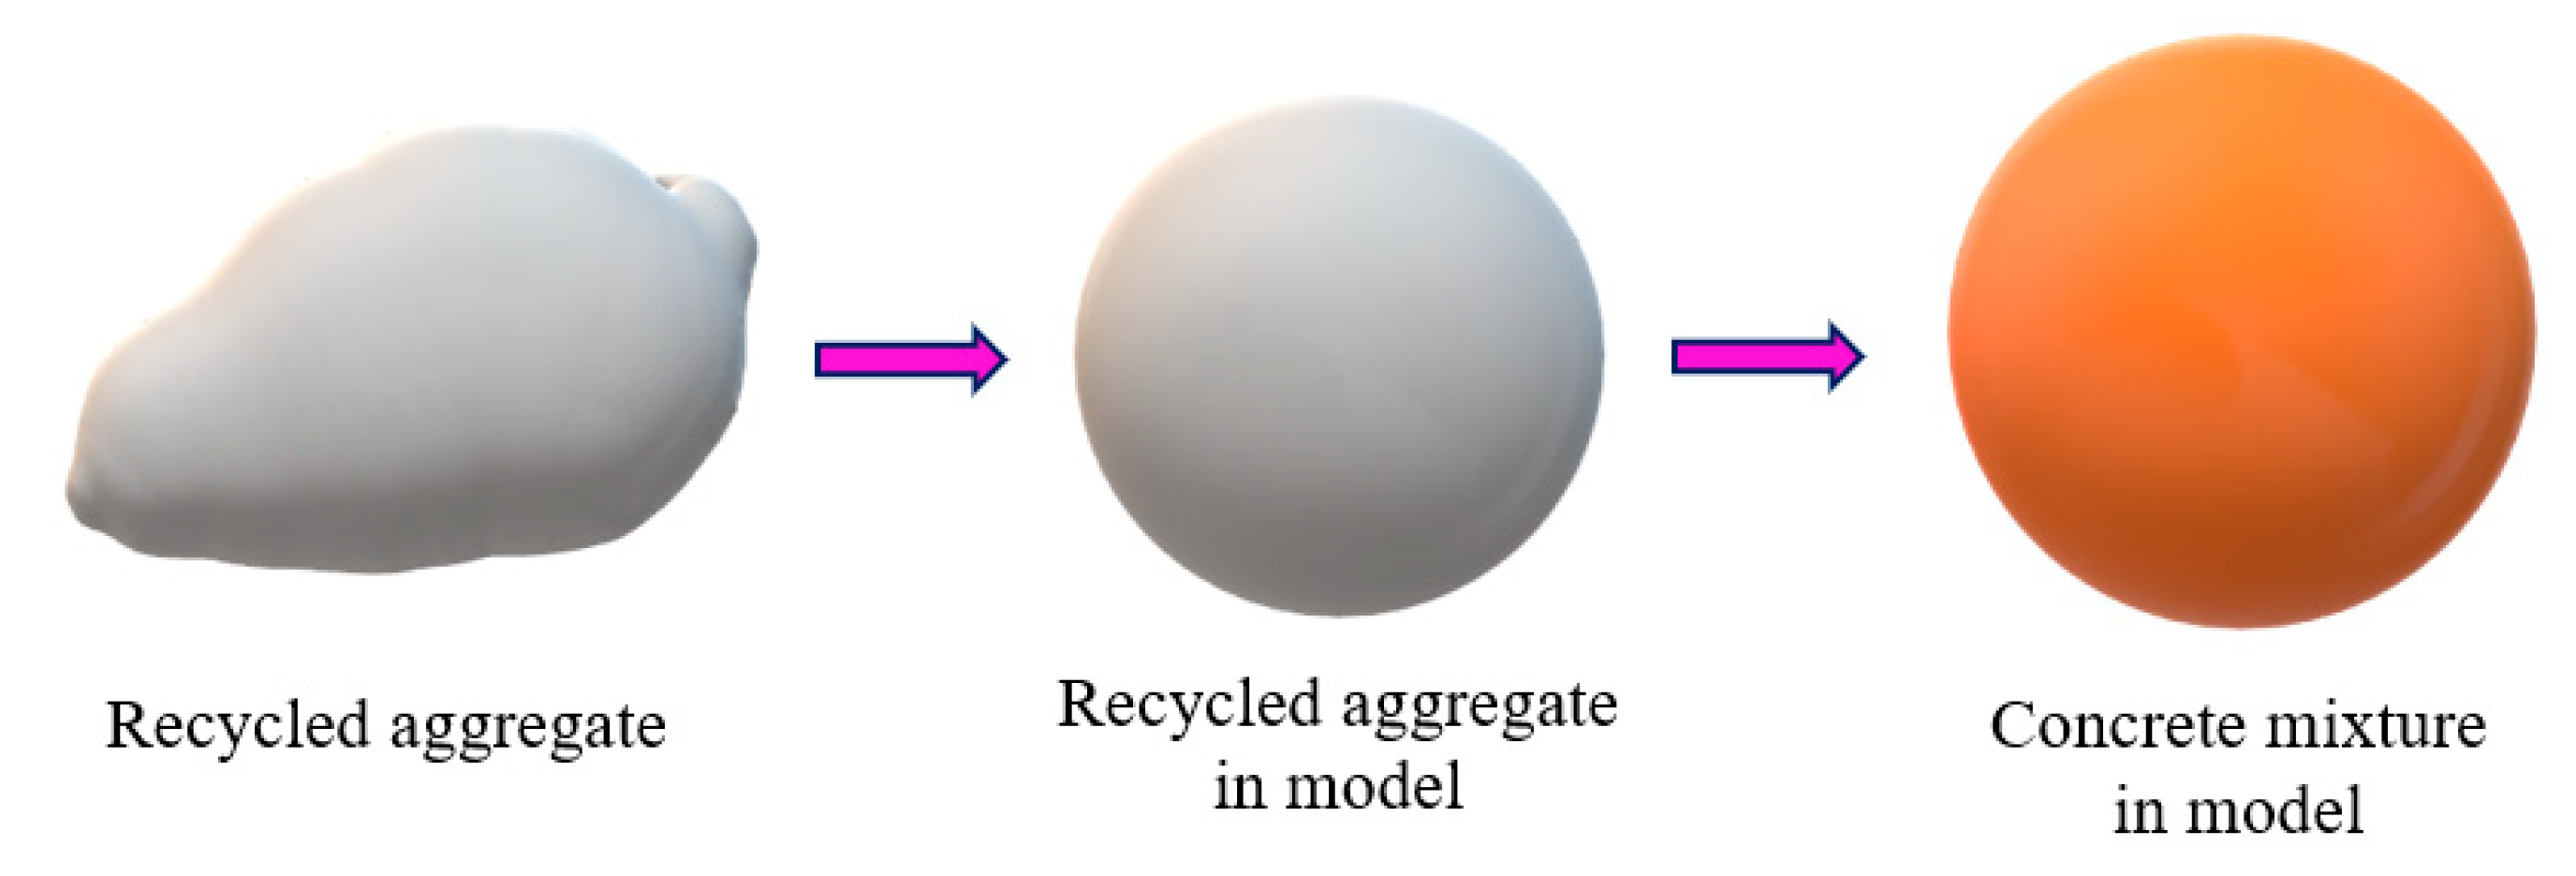
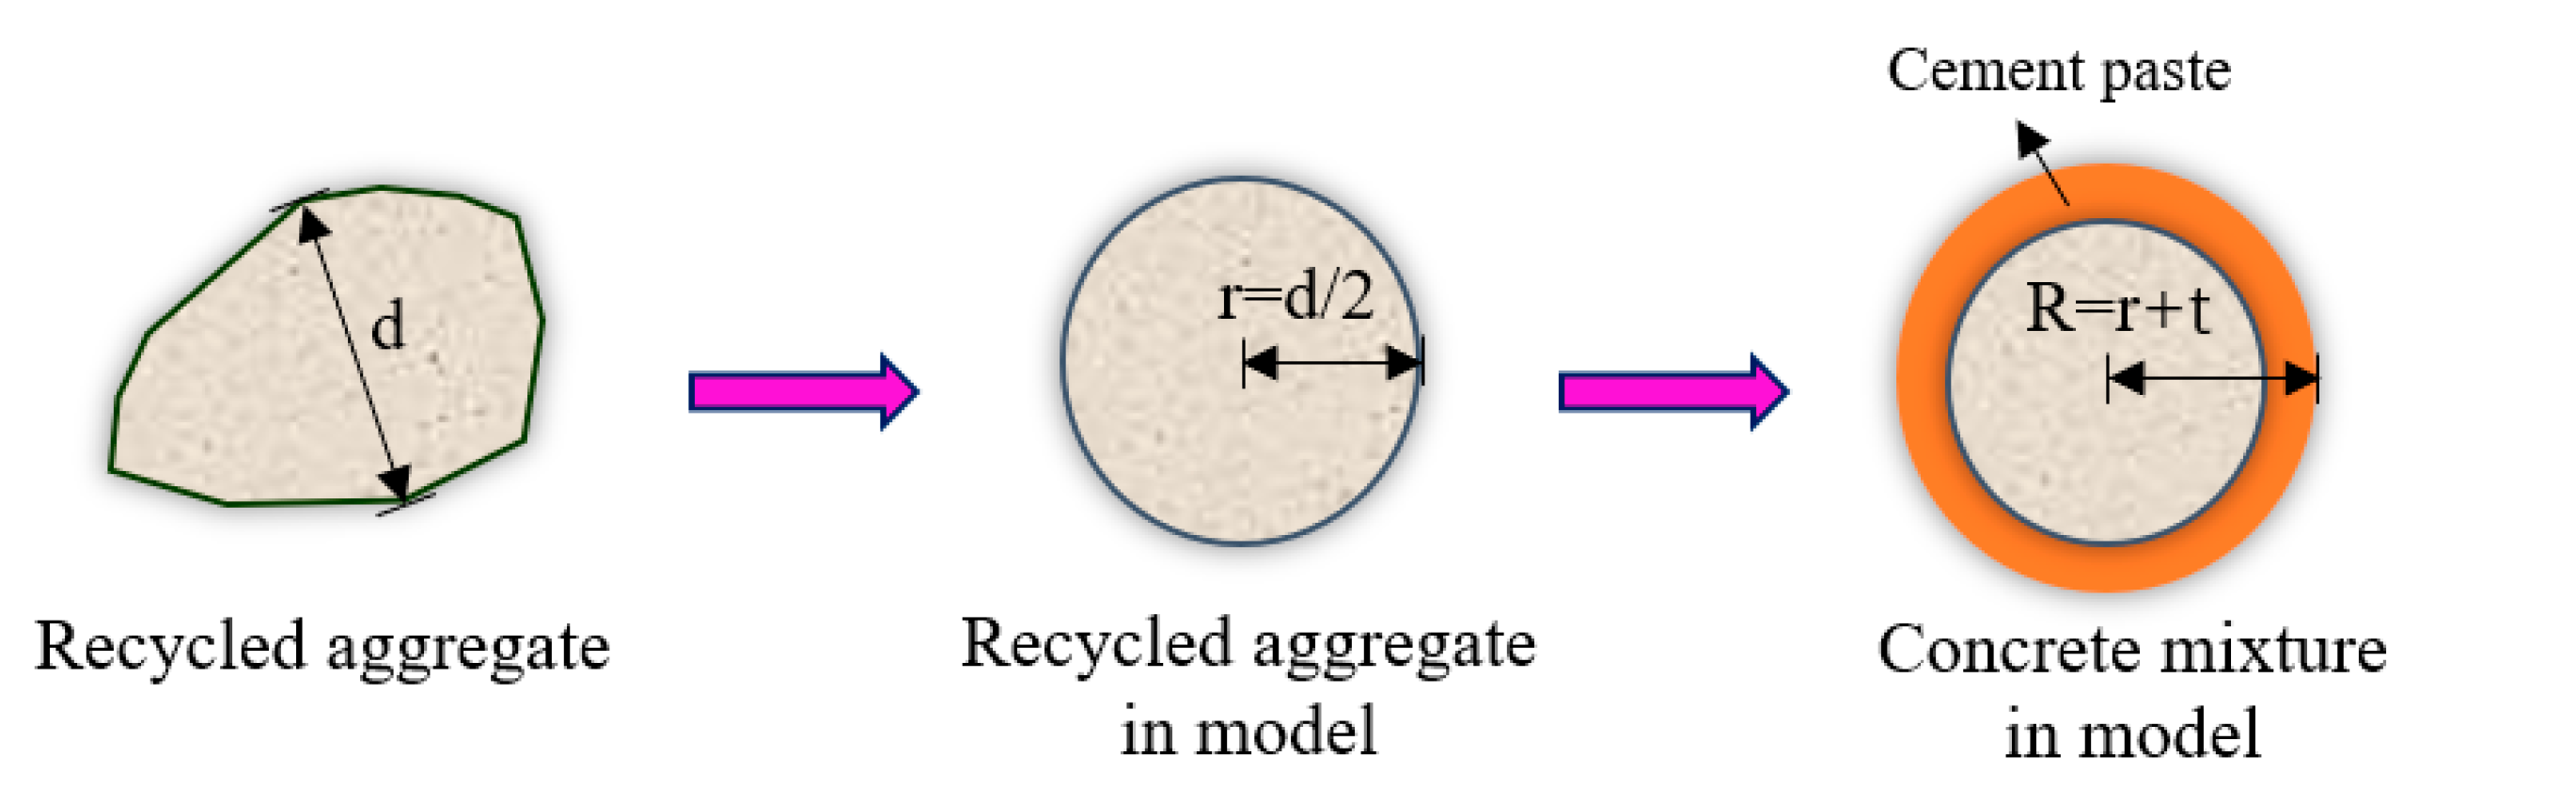
4.3. Compression Damage Mechanism of POC
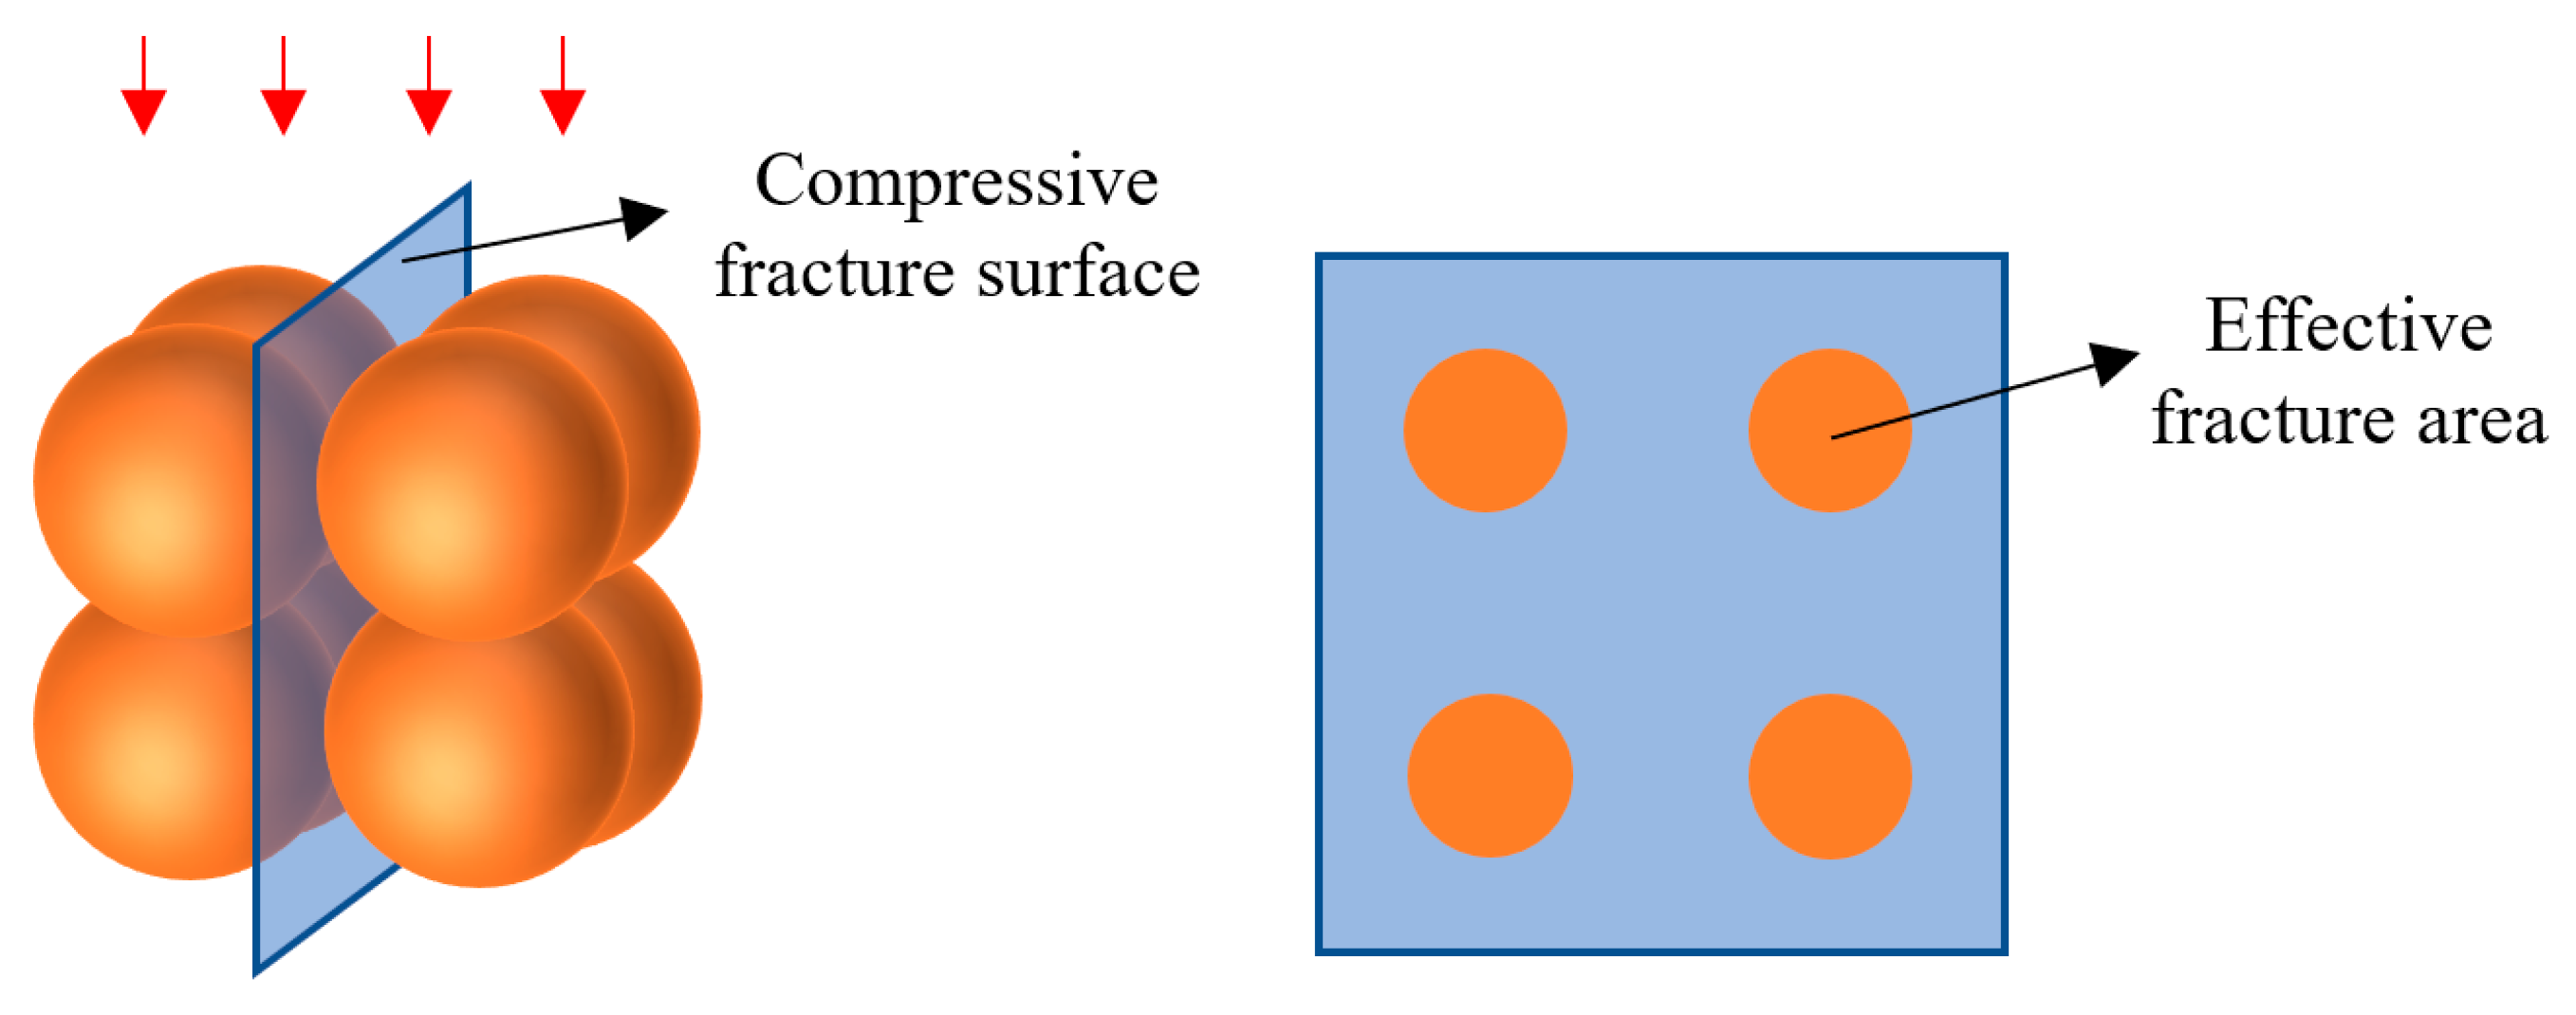
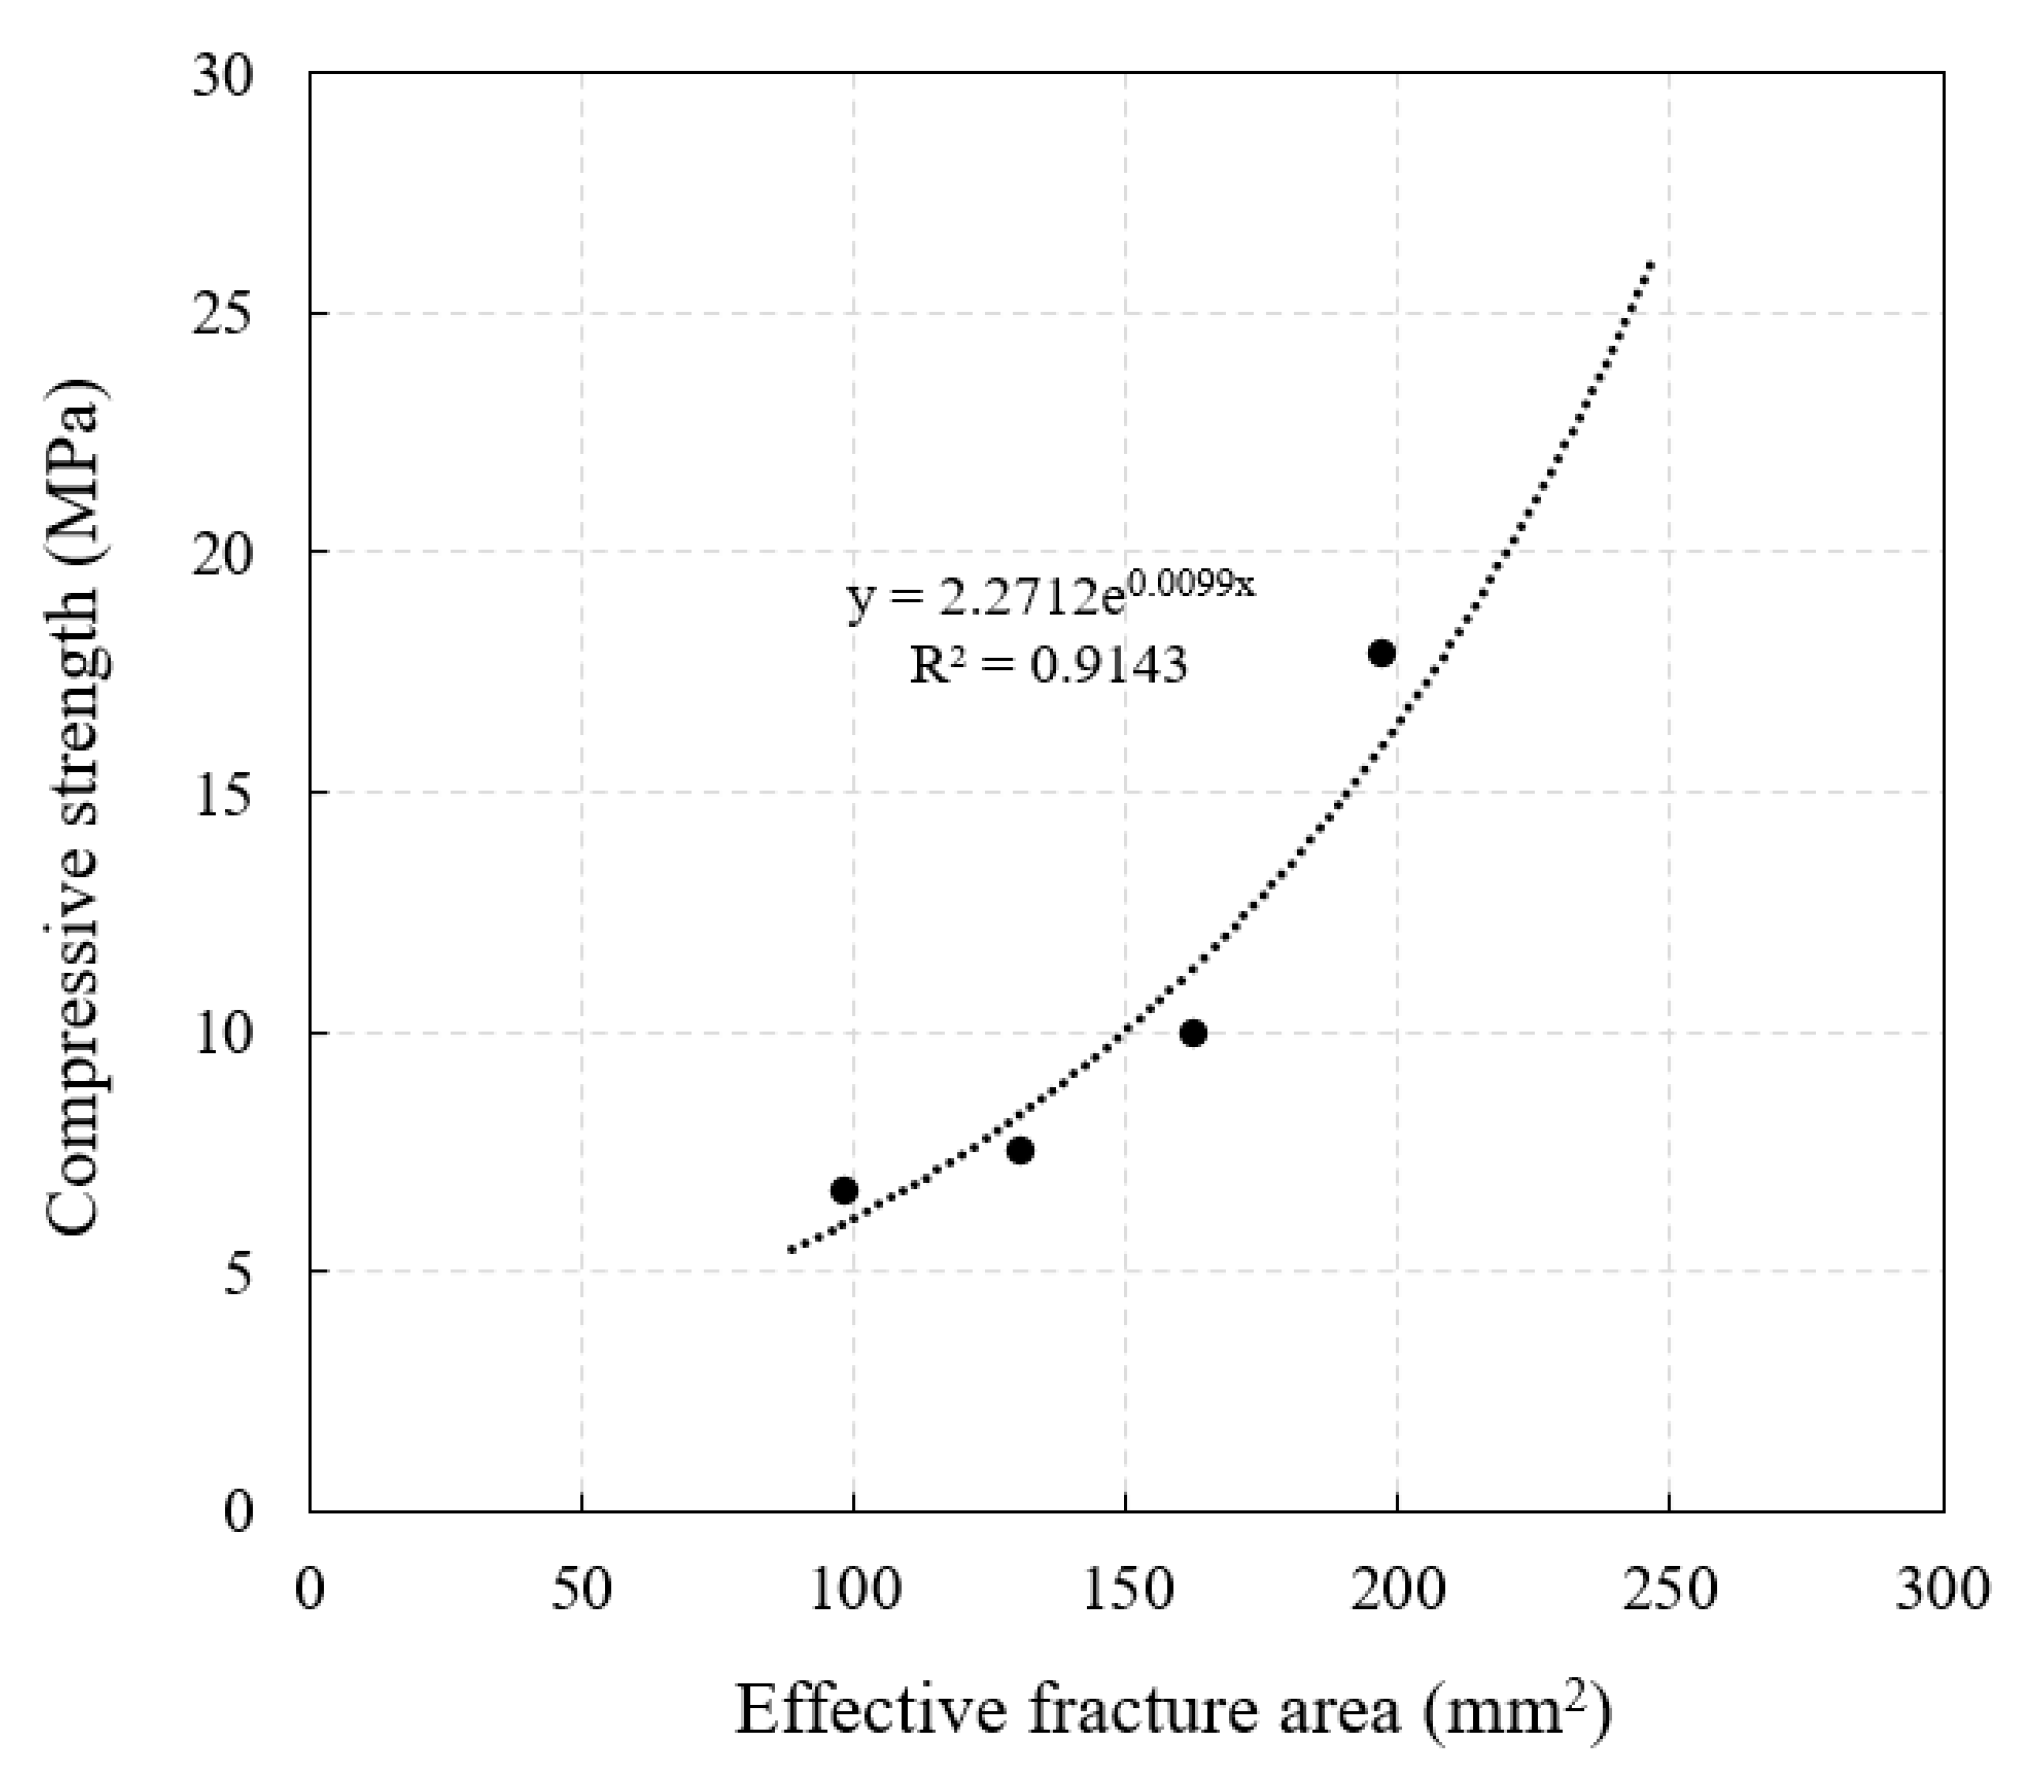
4.4. Relationship between Compressive Strength of RPOC and Bonding Area of Aggregate
5. Conclusions
- The results show that the compressive strength of POC decreases with the increase in low-grade recycled aggregate. However, when the replacement rate is low, the change in strength is not obvious. On the contrary, the overall compactness will be increased due to the grain shape of the aggregate, and the strength will be improved to a certain extent;
- When the target porosity is constant, the compressive strength of POC with different replacement rates of low-grade RA can be expressed by a linear relationship. The influence coefficient of RA proposed in this paper based on the replacement rate of RA can be effectively used to express the compressive strength relationship between NPOC and RPOC. This solution can also be used for POC prepared from different grades of RA;
- The results on the compression damage mechanism of POC with low-grade RA show that the cement paste fractures first when the RPOC is compressed. Because the cement paste on the surface of low-grade RA is weakly bonded, most of the aggregate is peeled off without playing a supporting role, so it is easy to be damaged under pressure. This result can be understood as determining the compressive strength of POC is not the average grade of raw materials, but the lowest grade;
- The compressive strength of RPOC is related to the bonding paste between aggregates. When the paste material remains unchanged, the compressive strength of RPOC increases with the increase in bonding area, and the two can be expressed by an exponential relationship;
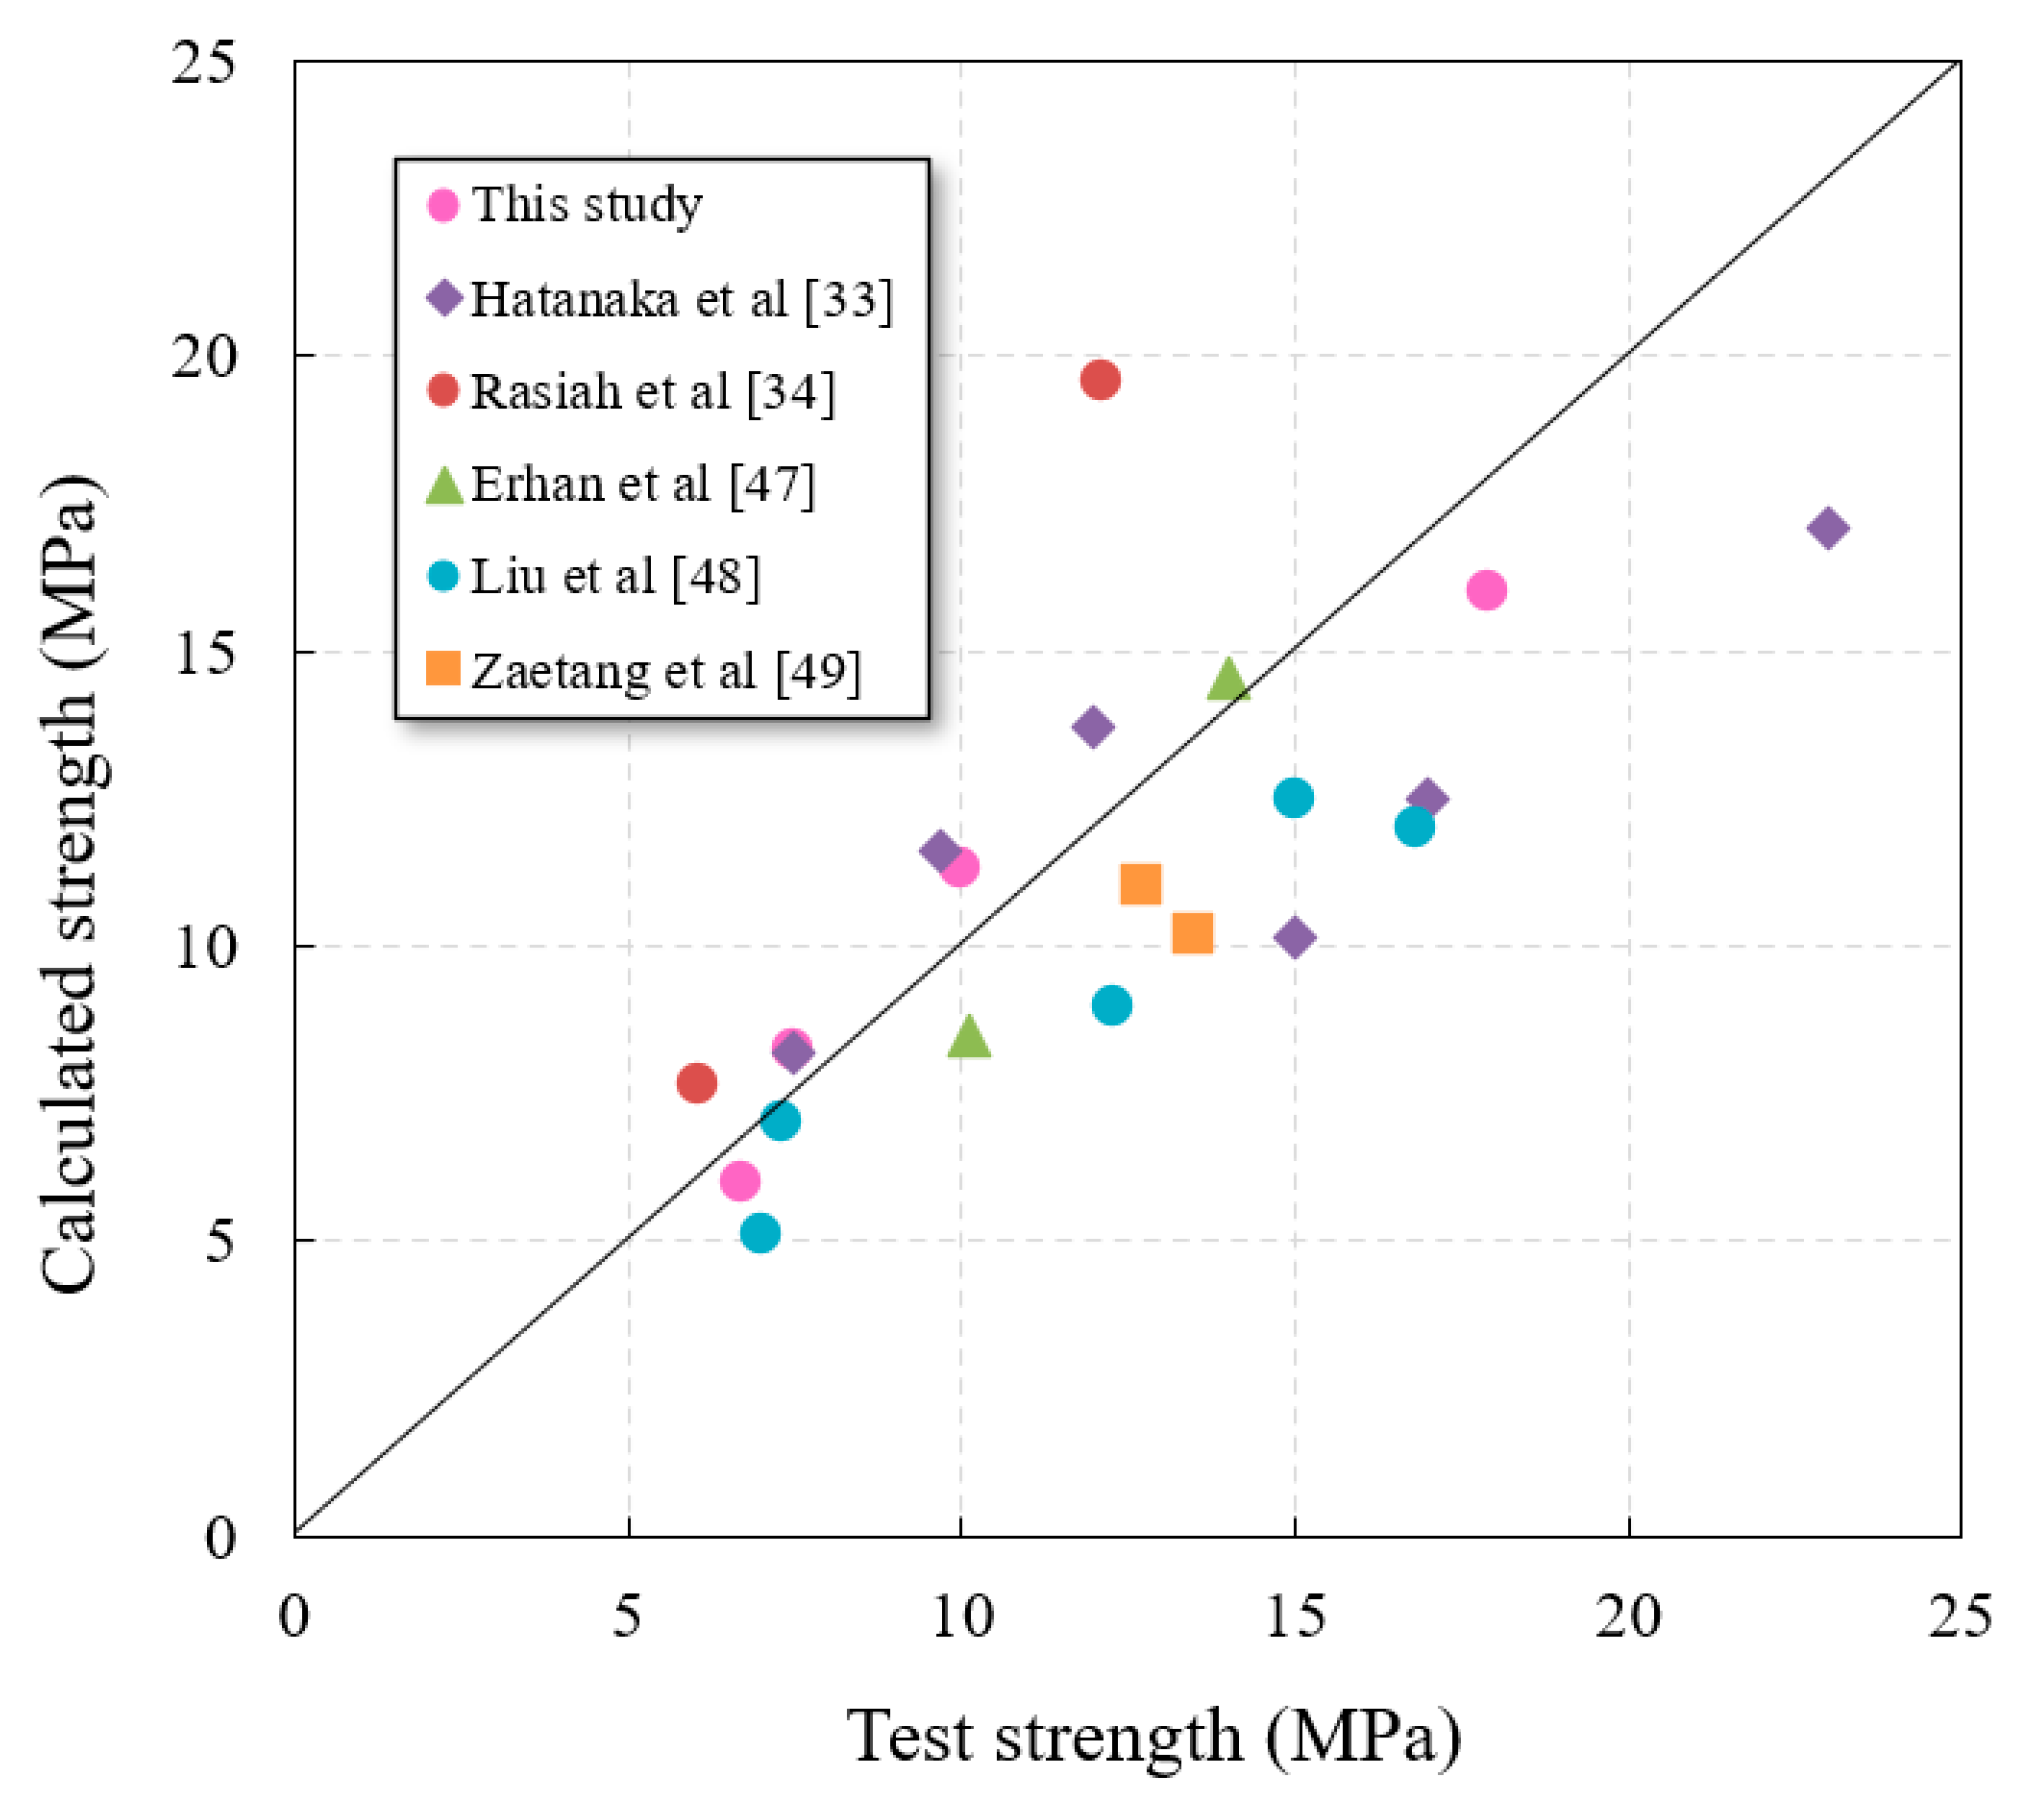
- The compressive strength of POC with low-grade RA can be accurately calculated by the compressive strength prediction formula based on the ideal sphere model.
- The shortcoming of the proposed structure analysis and modeling method of RPOC is that the diversity of recycled aggregate is not considered. Low-grade RA has different particle shapes, and the real scene cannot be reflected by the same physical model. Therefore, in further study, the authors will focus on the development of expression models of different RA, such as the method of polar coordinate axes, in order to more truly reflect the bonding state between aggregates in RPOC.
Author Contributions
Funding
Acknowledgments
Conflicts of Interest
Abbreviations
References
- Tang, Z.; Li, W.; Tam, V.W.; Xue, C. Advanced progress in recycling municipal and constructionn solid wastes for manufacturing sustainable construction materials. Resour. Conserv. Recycl. 2020, X6, 100036. [Google Scholar]
- Huang, B.; Wang, X.; Kua, H.; Geng, Y.; Bleischwitz, R.; Ren, J.Z. Construction and Demolition Waste Management in China through the 3R Principle. Resour. Conserv. Recycl. 2020, 129, 36–44. [Google Scholar] [CrossRef]
- Shoukai, C.; Zhao, Y.P.; Bie, Y.J. The prediction analysis of properties of recycled aggregate permeable concrete based on back-propagation neural network. J. Clean. Prod. 2020, 276, 124187. [Google Scholar]
- Rosario, H.; Pablo, P.; Laura, G.; Javier, O.G. Use of Recycled Construction and Demolition Waste Aggregate for Road Course Surfacing. J. Transp. Eng. 2012, 138, 182–190. [Google Scholar]
- Thomas, C.; Setién, J.; Polanco, J.A.; Alaejos, P.; Sánchez de Juan, M. Durability of recycled aggregate concrete. Constr. Build. Mater. 2012, 40, 1054–1065. [Google Scholar] [CrossRef]
- Park, S.B.; Lee, B.J.; Lee, J.; Jang, Y. A study on the seawater purification characteristics of water-permeable concrete using recycled aggregate. Resour. Conserv. Recycl. 2010, 54, 658–665. [Google Scholar] [CrossRef]
- Bru, K.; Touzé, S.; Bourgeois, F.; Lippiatt, N.; Ménard, Y. Assessment of a microwave assisted recycling process for the recover of high-quality aggregate from concrete waste. Int. J. Miner. Process. 2014, 126, 90–98. [Google Scholar] [CrossRef] [Green Version]
- Spaeth, V.; Djerbi, T.A. Improvement of recycled concrete aggregate properties by polymer treatments. Int. J. Sustain. Built Environ. 2013, 2, 143–152. [Google Scholar] [CrossRef] [Green Version]
- Younis, K.H.; Mustafa, S.M. Feasibility of Using Nanoparticles of SiO2 to Improve the Performance of Recycled Aggregate Concrete. Adv. Mater. Sci. Eng. 2018, 2018, 1–11. [Google Scholar] [CrossRef] [Green Version]
- Kim, J.H.; Sung, J.H.; Jeon, C.S.; Lee, S.H.; Kim, H.S. A Study on the Properties of Recycled Aggregate Concrete and Its Production Facilities. Appl. Sci. 2019, 9, 1935. [Google Scholar] [CrossRef] [Green Version]
- Ozbakkaloglu, T.; Gholampour, A.; Xie, T. Mechanical and Durability Properties of Recycled Aggregate Concrete: Effect of Recycled Aggregate Properties and Content. J. Mater. Civ. Eng. 2017, 30, 04017275. [Google Scholar] [CrossRef]
- Lotfi, S.; Eggimann, M.; Wagner, E.; Radoslaw, M.; Deja, J. Performance of recycled aggregate concrete based on a new concrete recycling technology. Constr. Build. Mater. 2015, 95, 243–256. [Google Scholar] [CrossRef]
- Brito, J.D.; Gonalves, P. Recycled aggregate concrete (RAC)—Comparative analysis of existing specifications. Mag. Concr. Res. 2010, 62, 339–346. [Google Scholar]
- Andreu, G.; Miren, E. Experimental analysis of properties of high performance recycled aggregate concrete. Constr. Build. Mater. 2014, 52, 227–235. [Google Scholar] [CrossRef]
- Tayeh, B.A.; Saffar, D.; Alyousef, R. The utilization of recycled aggregate in high performance concrete: A review. J. Mater. Res. Technol. 2020, 9, 8469–8481. [Google Scholar] [CrossRef]
- Park, W.J.; Kim, T.; Roh, S.; Kim, R. Analysis of Life Cycle Environmental Impact of Recycled Aggregate. Appl. Sci. 2019, 9, 1021. [Google Scholar] [CrossRef] [Green Version]
- Kou, S.C.; Poon, C.S.; Wan, H.W. Properties of concrete prepared with low-grade recycled aggregates. Constr. Build. Mater. 2012, 36, 881–889. [Google Scholar] [CrossRef]
- Yanagibashi, K.; Yonezawa, T. Properties and performance of green concrete. Recent Adv. Concr. Technol. 1998, 178, 141–158. [Google Scholar]
- Laura, M.; Paola, D.M.; Ciro, F. Porous Concrete for Pedestrian Pavements. Water 2019, 11, 2105. [Google Scholar]
- Quan, H.Z. Study on the Coexistence of Porous Ecological Concrete with Plants. Adv. Mater. Res. 2011, 311–313, 1551–1554. [Google Scholar]
- Song, W.J.; Fu, H.Y.; Wang, G.Y. Study on a Kind of Eco-concrete Retaining Wall’s Block with Water Purification Function. Procedia Eng. 2012, 28, 182–189. [Google Scholar]
- Wong, J.M.; Glasser, F.P.; Imbabi, M.S. Evaluation of thermal conductivity in air permeable concrete for dynamic breathing wall construction. Cem. Concr. Compos. 2007, 29, 647–655. [Google Scholar] [CrossRef]
- Zhang, Y.; Li, H.; Abdelhady, A.; Yang, J. Effect of different factors on sound absorption property of porous concrete. Transp. Res. Part D-Transp. Environ. 2020, 87, 102532. [Google Scholar] [CrossRef]
- Sucharda, O. Identification of Fracture Mechanic Properties of Concrete and Analysis of Shear Capacity of Reinforced Concrete Beams without Transverse Reinforcement. Materials 2020, 13, 2788. [Google Scholar] [CrossRef]
- Chindaprasirt, P.; Hatanaka, S.; Chareerat, T.; Mishima, N.; Yuasa, Y. Cement paste characteristics and porous concrete properties. Constr. Build. Mater. 2008, 22, 894–901. [Google Scholar] [CrossRef]
- Lian, C.; Yan, Z.G.; Beecham, S. The relationship between porosity and strength for porous concrete. Constr. Build. Mater. 2011, 25, 4294–4298. [Google Scholar] [CrossRef]
- Yan, X.B.; Gong, C.C.; Wang, S.D.; Lu, L.C. Effect of aggregate coating thickness on pore structure features and properties of porous ecological concrete. Mag. Concr. Res. 2013, 65, 962–969. [Google Scholar] [CrossRef]
- Zhong, R.; Wille, K. Compression response of normal and high strength pervious concrete. Constr. Build. Mater. 2016, 109, 177–187. [Google Scholar] [CrossRef]
- Zhang, J.F.; Huang, Y.M.; Ma, G.W.; Sun, J.B.; Nener, B. A metaheuristic-optimized multi-output model for predicting multiple properties of pervious concrete. Constr. Build. Mater. 2020, 249, 118803. [Google Scholar] [CrossRef]
- Moreno-Juez, J.; Tavares, L.M.; Artoni, R.; Carvalho, R.M.d.; da Cunha, E.R.; Cazacliu, B. Simulation of the Attrition of Recycled Concrete Aggregates during Concrete Mixing. Materials 2021, 14, 3007. [Google Scholar] [CrossRef] [PubMed]
- Omary, S.; Ghorbel, E.; Wardeh, G. Relationships between recycled concrete aggregates characteristics and recycled aggregates concretes properties. Constr. Build. Mater. 2016, 108, 163–174. [Google Scholar] [CrossRef]
- Aliabdo, A.A.; Abd, E.; Abd, E.M.; Fawzy, A.M. Experimental investigation on permeability indices and strength of modified pervious concrete with recycled concrete aggregate. Constr. Build. Mater. 2018, 193, 105–127. [Google Scholar] [CrossRef]
- Hatanaka, S.; Yuasa, Y.; Mishima, N. Eeperimental study on compressive strength of porous concrete with recycled aggregates. J. Struct. Constr. Eng. 2003, 68, 31–36. [Google Scholar] [CrossRef] [Green Version]
- Rasiah, S.; Wang, N.; Lai, J. Mix Design for Pervious Recycled Aggregate Concrete. Int. J. Concr. Struct. Mater. 2012, 6, 239–246. [Google Scholar]
- Lu, J.X.; Yan, X.; He, P.P.; Poon, C.S. Sustainable design of pervious concrete using waste glass and recycled concrete aggregate. J. Clean. Prod. 2019, 234, 1102–1112. [Google Scholar] [CrossRef]
- Zhang, Z.; Zhang, Y.; Yan, C.; Liu, Y. Influence of crushing index on properties of recycled aggregates pervious concrete. Constr. Build. Mater. 2017, 135, 112–118. [Google Scholar] [CrossRef]
- Naderpour, H.; Mirrashid, M. Estimating the compressive strength of eco-friendly concrete incorporating recycled coarse aggregate using neuro-fuzzy approach. J. Clean. Prod. 2020, 265, 121886. [Google Scholar] [CrossRef]
- Lim, E.; Tan, K.H.; Fwa, T.F. Effect of Mix Proportion on Strength and Permeability of Pervious Concrete for Use in Pavement. J. East. Asia Soc. Transp. Stud. 2013, 10, 1565–1575. [Google Scholar]
- Xu, G.L.; Shen, W.G.; Huo, X.J.; Yang, Z.F.; Wang, J.; Zhang, W.S.; Ji, X.L. Investigation on the properties of porous concrete as road base material. Constr. Build. Mater. 2018, 158, 141–148. [Google Scholar] [CrossRef]
- Li, Y.; Yang, J.R.; Li, J.Y. Study on recycled aggregate water-permeable concrete. In Proceedings of the International Conference on Electric Technology & Civil Engineering, Lushan, China, 22–24 April 2011; pp. 6236–6239. [Google Scholar]
- Chindaprasirt, P.; Hatanaka, S.; Mishima, N.; Yuasa, Y.; Chareerat, T. Effects of binder strength and aggregate size on the compressive strength and void ratio of porous concrete. Int. J. Miner. Metall. Mater. 2009, 16, 714–719. [Google Scholar]
- Hatanaka, S.; Mishima, N.; Maegawa, A.; Sakamoto, E. Fundamental Study on Properties of Small Particle Size Porous Concrete. J. Adv. Concr. Technol. 2014, 12, 24–33. [Google Scholar] [CrossRef] [Green Version]
- Liu, B.; Feng, C.; Deng, Z. Shear behavior of three types of recycled aggregate concrete. Constr. Build. Mater. 2019, 217, 557–572. [Google Scholar] [CrossRef]
- Etxeberria, M.; Vázquez, E.; Marí, A.; Barra, M. Influence of amount of recycled coarse aggregates and production process on properties of recycled aggregate concrete. Cem. Concr. Res. 2007, 37, 735–742. [Google Scholar] [CrossRef]
- Nguyen, D.H.; Sebaibi, N.; Boutouil, M.; Leleyter, L.; Baraud, F. A modified method for the design of pervious concrete mix. Constr. Build. Mater. 2014, 73, 271–282. [Google Scholar] [CrossRef]
- Li, G.; Zhao, Y.; Pang, S.S. Four-phase sphere modeling of effective bulk modulus of concrete. Cem. Concr. Res. 1999, 29, 839–845. [Google Scholar] [CrossRef]
- Erhan, G.; Gesolu, M.; Kareem, Q.; Ipek, S. Effect of different substitution of natural aggregate by recycled aggregate on performance characteristics of pervious concrete. Mater. Struct. 2016, 49, 521–536. [Google Scholar]
- Liu, T.J.; Wang, Z.Z.; Zou, D.J.; Zhou, A.; Du, J.Z. Strength enhancement of recycled aggregate pervious concrete using a cement paste redistribution method. Cem. Concr. Res. 2019, 122, 72–82. [Google Scholar] [CrossRef]
- Zaetang, Y.; Sata, V.; Wongsa, A.; Chindaprasirt, P. Properties of pervious concrete containing recycled concrete block aggregate and recycled concrete aggregate. Constr. Build. Mater. 2016, 111, 15–21. [Google Scholar] [CrossRef]


| SiO2 | AI2O3 | Fe2O3 | CaO | MgO | SO3 | Na2O | LOSS |
|---|---|---|---|---|---|---|---|
| 21.51 | 5.98 | 3.94 | 60.72 | 1.30 | 2.68 | 2.84 | 1.03 |
| Density (g/cm3) | Specific Surface Area (m2/kg) | Setting Time (min) | Flexural Strength (MPa) | Compressive Strength (MPa) | |||
|---|---|---|---|---|---|---|---|
| Start | Final | 3 d | 28 d | 3 d | 28 d | ||
| 3.13 ± 0.02 | 342 ± 5 | 182 ± 2 | 251 ± 2 | 4.7 ± 0.5 | 7.5 ± 0.5 | 21.8 ± 1 | 47.6 ± 1 |
| Materia | Constituents (% by Weight) | |||
|---|---|---|---|---|
| Old Concrete | Natural Stones | Clay Bricks | Other Impurities (Glass, Wood, Pitch, Plastic, Paper, etc.) | |
| Recycled aggregate | 81.8 | 9.1 | 7.7 | 1.4 |
| Type of Aggregates | Physical and Mechanical Properties | |||||
|---|---|---|---|---|---|---|
| Aggregate Size (mm) | Bulk Density (kg/m3) | Oven-Dried Particle Density (kg/m3) | Water Absorption (%) | Void Ratio (%) | Crushing Value (%) | |
| NA | 5~20 | 1327 | 2632 | 1.18 | 46.2 | 9.7 |
| RA | 5~20 | 1288 | 2421 | 3.20 | 45.5 | 26.1 |
| Type | W/C | Design Porosity (%) | Natural Aggregate (kg/m3) | Recycled Aggregate (kg/m3) | Cement (kg/m3) | Water (kg/m3) | PS a (%) |
|---|---|---|---|---|---|---|---|
| NPOC | 0.25 | 15 | 1426 | 0 | 627 | 157 | 0.30 |
| 20 | 1426 | 0 | 539 | 135 | 0.30 | ||
| 25 | 1426 | 0 | 451 | 113 | 0.30 | ||
| 30 | 1426 | 0 | 363 | 91 | 0.30 | ||
| RPOC-25 | 0.25 | 15 | 1063 | 354 | 608 | 152 | 0.32 |
| 20 | 1063 | 354 | 520 | 130 | 0.32 | ||
| 25 | 1063 | 354 | 432 | 108 | 0.32 | ||
| 30 | 1063 | 354 | 344 | 86 | 0.32 | ||
| RPOC-50 | 0.25 | 15 | 705 | 705 | 590 | 148 | 0.35 |
| 20 | 705 | 705 | 502 | 126 | 0.35 | ||
| 25 | 705 | 705 | 414 | 104 | 0.35 | ||
| 30 | 705 | 705 | 327 | 82 | 0.35 | ||
| RPOC-75 | 0.25 | 15 | 350 | 1050 | 573 | 143 | 0.37 |
| 20 | 350 | 1050 | 485 | 121 | 0.37 | ||
| 25 | 350 | 1050 | 397 | 99 | 0.37 | ||
| 30 | 350 | 1050 | 309 | 77 | 0.37 | ||
| RPOC-100 | 0.25 | 15 | 0 | 1391 | 555 | 139 | 0.40 |
| 20 | 0 | 1391 | 467 | 117 | 0.40 | ||
| 25 | 0 | 1391 | 379 | 95 | 0.40 | ||
| 30 | 0 | 1391 | 291 | 73 | 0.40 |
| Type | Design Porosity (%) | Actual Porosity (%) | Standard Deviation (%) | Compressive Strength (MPa) | Standard Deviation (MPa) |
|---|---|---|---|---|---|
| NPOC | 15 | 16.8 | 1.12 | 25.5 | 0.93 |
| 20 | 21.4 | 1.26 | 18.1 | 0.87 | |
| 25 | 26.4 | 0.89 | 13.4 | 1.13 | |
| 30 | 31.6 | 1.58 | 10.4 | 0.69 | |
| RPOC-25 | 15 | 16.2 | 1.26 | 25.2 | 0.77 |
| 20 | 20.8 | 0.63 | 18.0 | 1.05 | |
| 25 | 25.8 | 0.94 | 13.6 | 1.14 | |
| 30 | 32.4 | 1.48 | 9.8 | 0.89 | |
| RPOC-50 | 15 | 17.1 | 0.83 | 22.4 | 1.22 |
| 20 | 22.0 | 1.22 | 14.1 | 0.55 | |
| 25 | 25.3 | 1.18 | 11.6 | 0.71 | |
| 30 | 32.3 | 1.41 | 8.3 | 0.89 | |
| RPOC-75 | 15 | 15.0 | 0.77 | 21.2 | 1.14 |
| 20 | 23.2 | 0.55 | 11.4 | 0.95 | |
| 25 | 28.1 | 1.34 | 7.9 | 0.84 | |
| 30 | 32.8 | 1.34 | 6.9 | 0.89 | |
| RPOC-100 | 15 | 15.9 | 0.89 | 17.9 | 1.10 |
| 20 | 24.4 | 0.71 | 10.0 | 0.71 | |
| 25 | 26.7 | 1.18 | 7.5 | 0.77 | |
| 30 | 34.5 | 1.55 | 6.7 | 0.89 |
Publisher’s Note: MDPI stays neutral with regard to jurisdictional claims in published maps and institutional affiliations. |
© 2021 by the authors. Licensee MDPI, Basel, Switzerland. This article is an open access article distributed under the terms and conditions of the Creative Commons Attribution (CC BY) license (https://creativecommons.org/licenses/by/4.0/).
Share and Cite
Liu, J.; Ren, F.; Quan, H. Prediction Model for Compressive Strength of Porous Concrete with Low-Grade Recycled Aggregate. Materials 2021, 14, 3871. https://doi.org/10.3390/ma14143871
Liu J, Ren F, Quan H. Prediction Model for Compressive Strength of Porous Concrete with Low-Grade Recycled Aggregate. Materials. 2021; 14(14):3871. https://doi.org/10.3390/ma14143871
Chicago/Turabian StyleLiu, Junshi, Fumin Ren, and Hongzhu Quan. 2021. "Prediction Model for Compressive Strength of Porous Concrete with Low-Grade Recycled Aggregate" Materials 14, no. 14: 3871. https://doi.org/10.3390/ma14143871
APA StyleLiu, J., Ren, F., & Quan, H. (2021). Prediction Model for Compressive Strength of Porous Concrete with Low-Grade Recycled Aggregate. Materials, 14(14), 3871. https://doi.org/10.3390/ma14143871