3.1. Powder Preparation via Transamination/Deamination/Nitridation Chemistry
The driving force behind facile preparation of the metal imides as direct precursors for nitride nanopowders is an efficient transamination in refluxing ammonia of both individual Ga(III)- and Ti(IV)-dimethylamides, which is followed at room temperature by spontaneous multistep deamination in the solid state to approach the theoretical metal imide formulae of {Ga(NH)
3/2} and {Ti(NH)
2}. The resulting polymeric Ga-imide precursor is then subjected to nitridation pyrolysis at increased temperatures, preferentially under an ammonia flow to complete the deamination steps according to {Ga(NH)
3/2} → GaN + 1/2 NH
3 and to form the nitride nanopowders with no separation efforts. For the theoretical Ti-imide Ti(NH)
2, the deamination is accompanied by redox reactions as approximated by {Ti(IV)(NH)
2} → Ti(III)N + 1/2 NH
3 + 1/4 H
2 + 1/4 N
2. The general transamination/deamination chemistry was precedented in the 1980s [
29,
30] and, specifically, it was detailed by us for the dimethylamide derivatives of gallium [
19,
20], manganese-doped gallium [
28], aluminum [
20], mixtures of gallium and aluminum [
20,
31], and mixtures of aluminum and titanium [
32]. It was also demonstrated to work for some trimethylsilylamides as reported for the preparation of manganese nitride
η-Mn
3N
2 from Mn-bis(trimethylsilyl)amide [
35].
It is instructive to recall that, in the dimeric Al-tris(dimethylamide) plus dimeric Ga-tris(dimethylamide) system refluxed in hexane, the presence of some mixed-metal dimeric Al/Ga-tris(dimethylamide) was confirmed in the equilibrated solution and shown to be linked to the formation of known Al
xGa
1−xN alloy upon further nitridation workup [
20,
31]. In this regard, the course of transamination/deamination reactions in such a bimetallic dimethylamide system is thought to yield some mixed M-amide-imide species (M = Al/Ga) and, eventually, to facilitate metal nitride solid solution formation as indeed observed. In the actual bimetallic system of dimeric Ga-tris(dimethylamide) and monomeric Ti-tetrakis(dimethylamide), the formation of the mixed bimetallic Ga/Ti-tris/tetrakis/(dimethylamide) seems unlikely due to steric factors, although the possibility cannot be excluded. In the recently reported by us and very closely related bimetallic system of dimeric Al-tris(dimethylamide) and monomeric Ti-tetrakis(dimethylamide), no equilibration in hexane solution toward mixed bimetallic molecular species was observed, which was reflected by no solid solution formation in that system made at the end of the individual nitrides of cubic TiN and hexagonal AlN [
32].
In order to check the possibility of the molecular metal-mixed Ga/Ti-dimethylamide species formation, the
1H- and
13C-NMR spectra were collected for a solid sample isolated after the equilibration step in refluxing hexane (
Figure 2).
The
13C-NMR spectrum for pure Ti-tetrakis(dimethylamide) (
Figure 2, bottom) is consistent with its monomeric character, resulting in the single signal at 44.38 ppm [
32]. On the other hand, the spectrum for pure Ga-tris(dimethylamide) confirms its dimeric character in the solution with four terminal and two bridging –N(CH
3)
2 groups to yield two nonequivalent carbon sites at 44.40 and 44.68 ppm with the intensity ratio 2:1 [
20]. For the equilibrated mixture (
Figure 2, top parts), the carbon spectrum is essentially unchanged upon superimposing the two spectra for the pure M-dimethylamides. The small variations in peak positions on the order of 0.01 ppm are likely due to concentration-dependent effects and are insignificant from the point of view of major structural changes. All this is consistent with the proton spectrum for the refluxed product (
Figure 2, top), which shows resonances expected for the individual M-dimethylamides in the mixture—a single peak at 3.08 ppm for the monomeric Ti component [
34] and two peaks at 2.79 and 2.48 ppm with 2:1 intensity ratio, respectively, for the dimeric Ga component with four terminal and two bridging –N(CH
3)
2 groups [
20]. It appears that, on the NMR time scale, the amide mixture is just made of the dimeric Ga-tris(dimethylamide) and monomeric Ti-tetrakis(dimethylamide) with no essential bimetallic amide formation. Therefore, this stage of precursor processing is expected to be indifferent for a potential and otherwise unlikely formation of the metastable bimetallic Ti
xGa
1−xN along the nitridation pathways to composite nitride nanopowders.
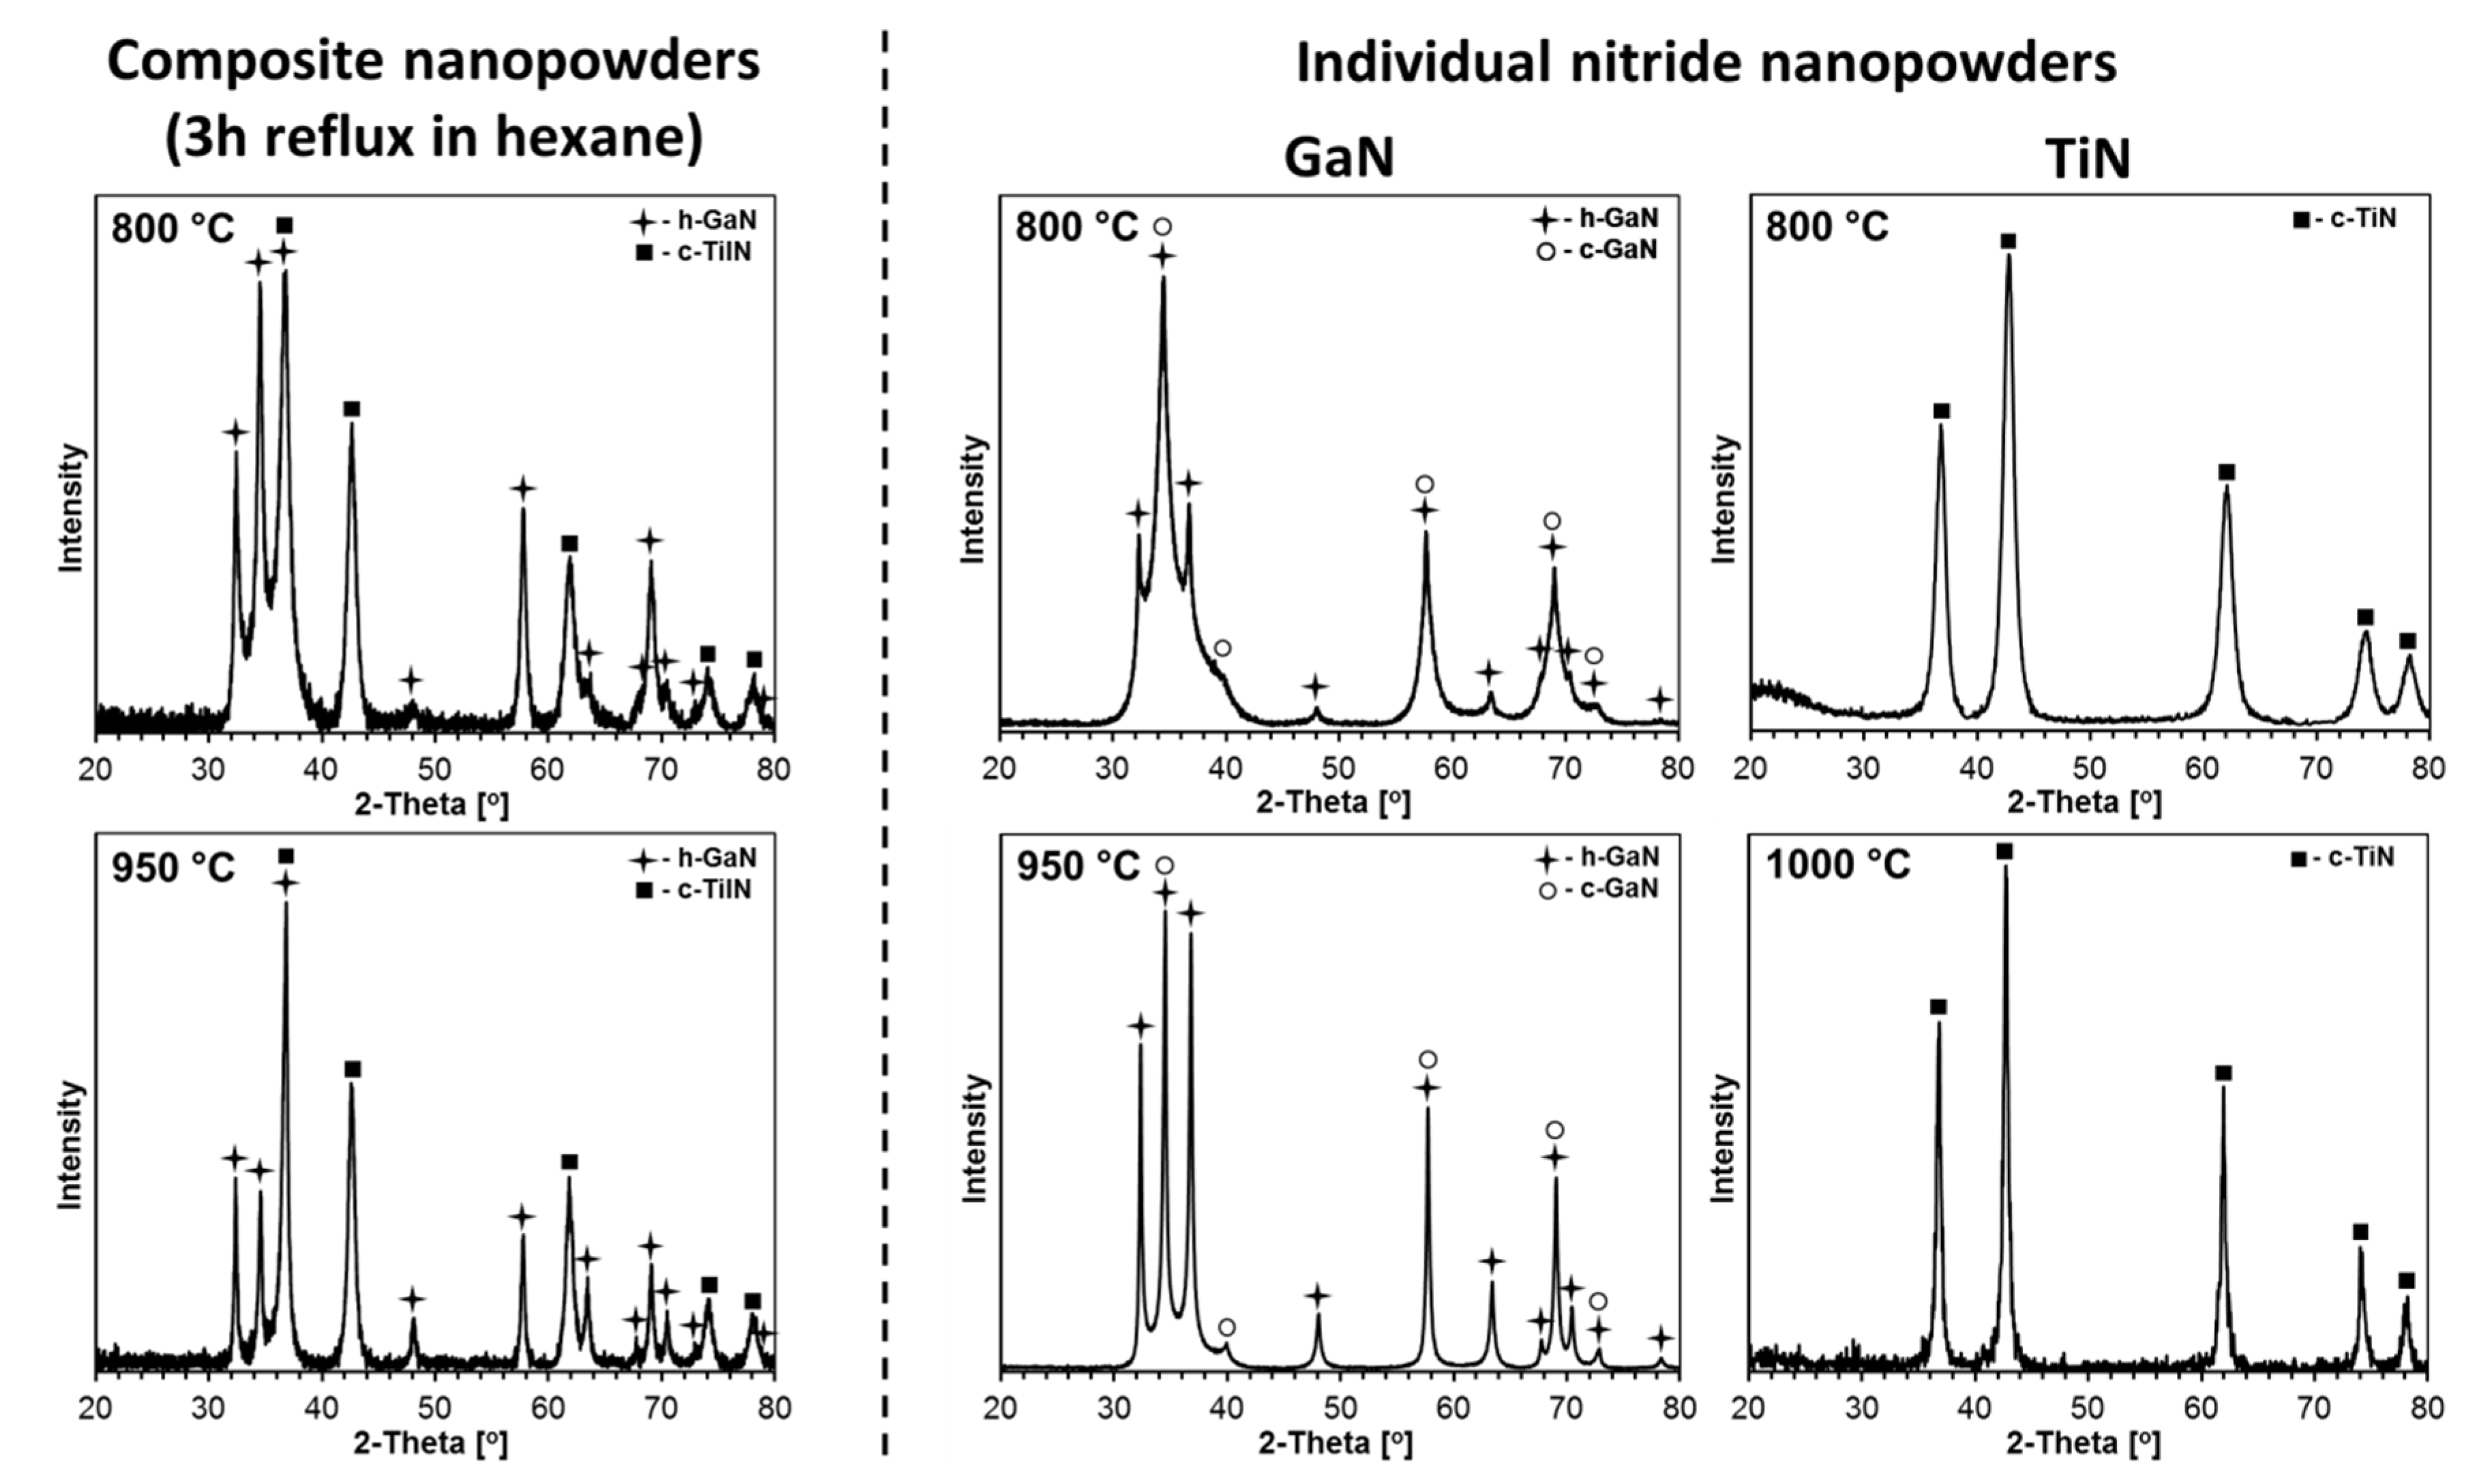
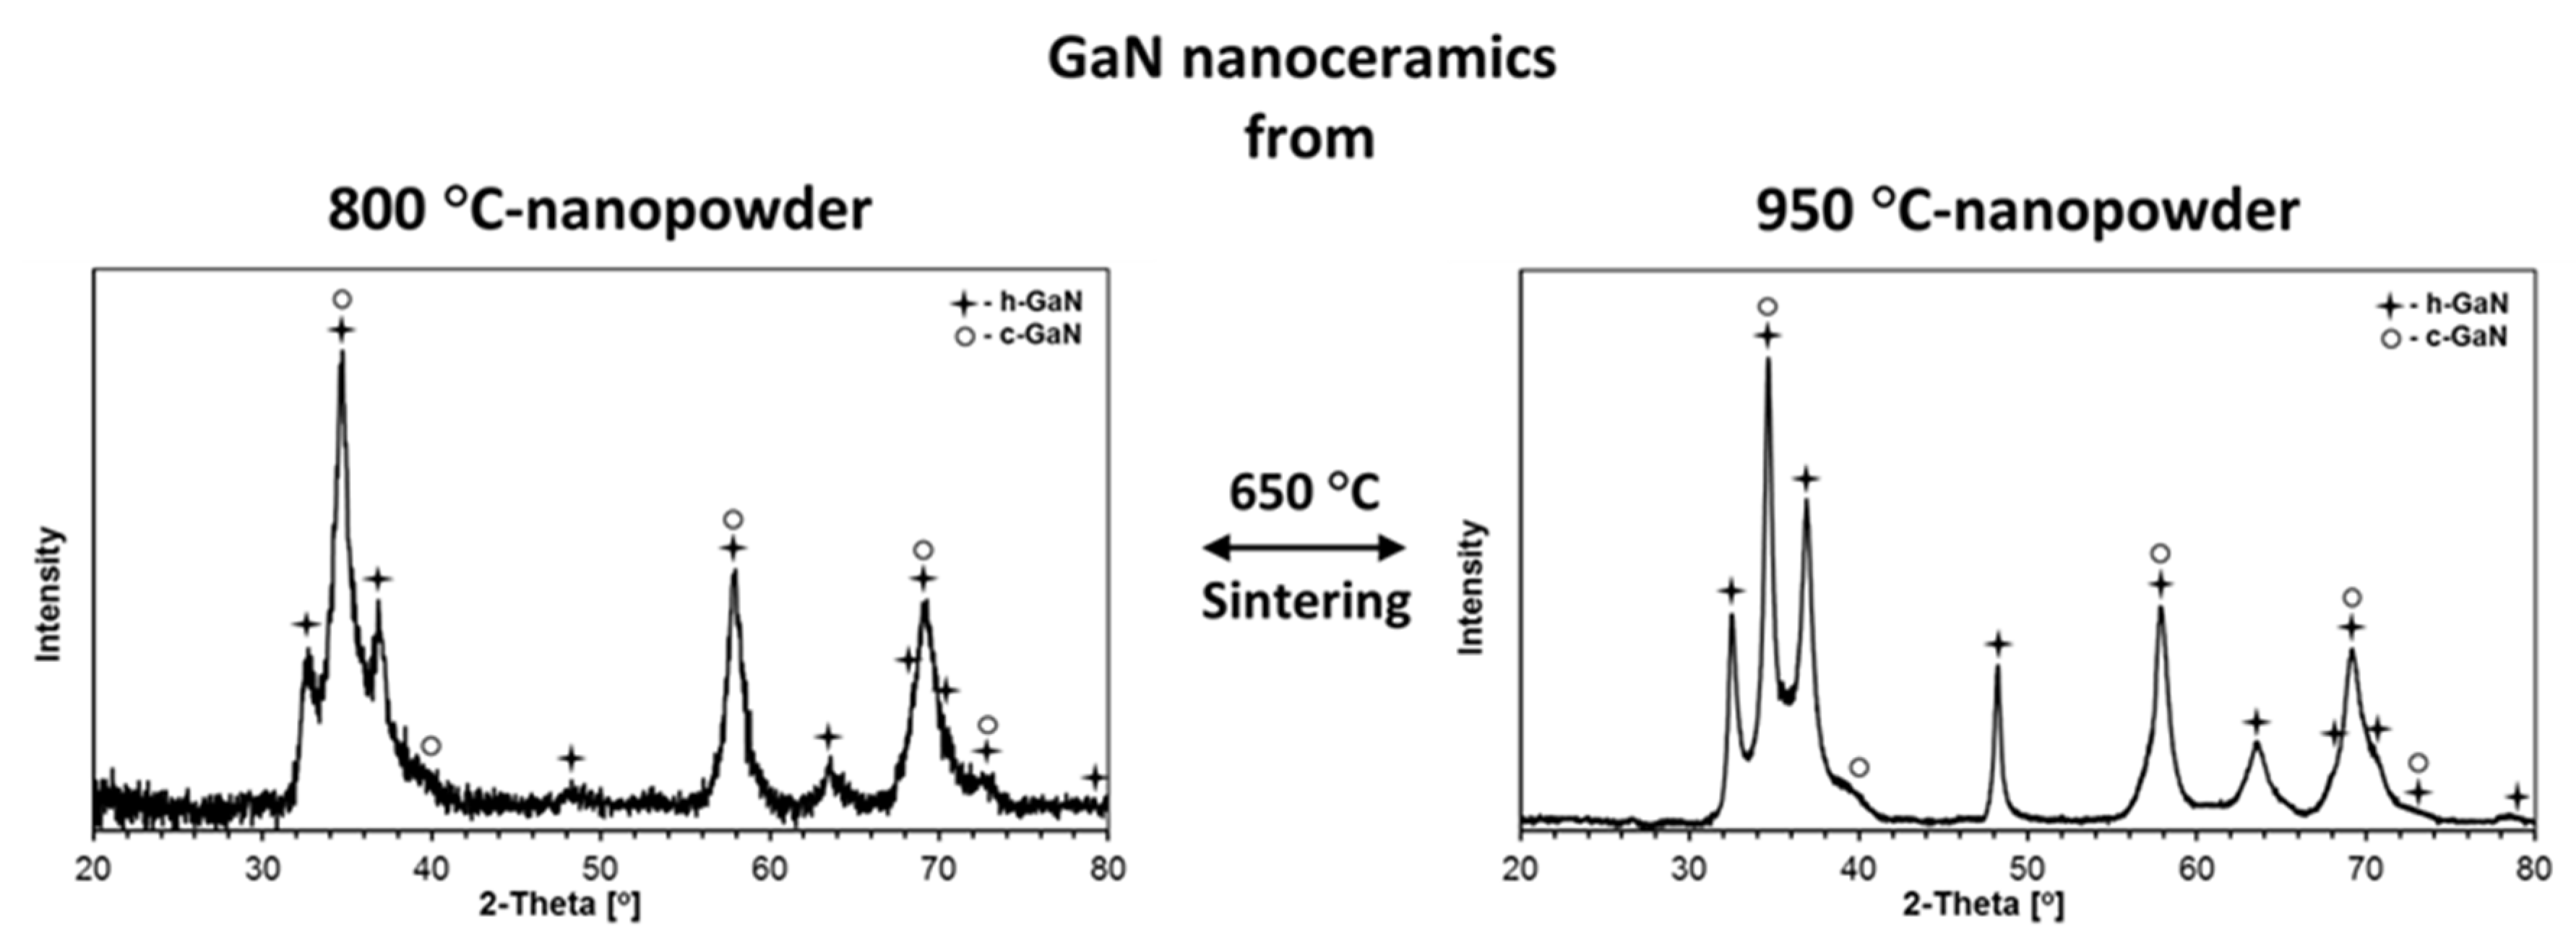
The XRD patterns for the nanopowders from two composite nitrides prepared at 800 and 950 °C and reference pure nitrides, GaN, prepared at 800 and 950 °C, as well as TiN, prepared at 800 and 1100 °C, are displayed in
Figure 3. The calculated cell parameters for the determined GaN and TiN polytypes in composites and in individual nitrides, as well as their proportions and estimated average crystallite sizes, are included in
Table 1.
The composite nanopowders from both nitridation temperatures are 1:1 mixtures of the thermodynamically stable hexagonal GaN and cubic TiN with no evidence for any metastable bimetallic nitride. Interestingly, the composites contain exclusively h-GaN, and there are no detectable quantities of the c-GaN polytype that is otherwise present in significant proportions in the reference pure GaN both from 800 °C (h-GaN/c-GaN = ca. 1/1) and 950 °C (h-GaN/c-GaN = ca. 2/1), as seen in
Table 1. In this regard, the anaerobic method used for GaN preparation often specifically yields a mixture of h-GaN and c-GaN, especially, at relatively low nitridation temperatures. A higher temperature results in lower amounts of the metastable c-GaN due to its conversion to the stable h-GaN. It is apparent that the nitridation of the two metal-imide precursors (mixture of Ga-imide and Ti-imide) prevents c-GaN formation in the resulting composites. If present, c-GaN could possibly participate in making some solid solutions c-Ti
xGa
1−xN with the crystallographically alike polytype of c-TiN. The low likelihood for such a solid solution formation stems mainly from a relatively large mismatch between the recorded lattice parameters of c-GaN (a = 4.50–4.51 Å) and c-TiN (a = 4.24–4.25 Å). The observed
a-constants of 4.24 and 4.25 Å for the c-TiN component in the composites are very close to the reported typical values of 4.23–4.24 Å for pure c-TiN [
36,
37,
38] and the value of 4.24 Å found here for the reference pure c-TiN from both nitridation temperatures. Some doping of the c-TiN lattice with gallium centers cannot be excluded, however, given the two-metal-precursor system mixed on the molecular level, thus undergoing conversions to the nitrides.
The application of the higher nitridation temperature of 950 °C for the composite system resulted in visibly increased average crystallite sizes of both components compared with 800 °C, i.e., D
av for h-GaN increased from 27 to 55 nm and, for c-TiN, it increased from 10 to 14 nm. It is clear that the size effect is much more pronounced for the h-GaN component that, remarkably, reaches its stability limits in the range 950–1000 °C [
22]. These values can be confronted with data for the individually prepared pure gallium nitride and titanium nitride nanopowders. As discussed earlier, the former nitride is present as a mixture of two polytypes confirmed at both nitridation temperatures. In this regard, for the nitridation temperatures of 800 and 950 °C, the h-GaN component in pure gallium nitride in relation to the composites with D
av’s of 27 and 55 nm shows comparable D
av’s of 17 and 50 nm, respectively. Similarly, the 800 °C prepared pure c-TiN with D
av of 8 nm compares satisfactorily with the D
av of 10 nm for the c-TiN component in the related composite. There is a lack of XRD data for c-TiN from the 950 °C nitridation, but the available data for the very closely related 1000 °C prepared c-TiN qualitatively confirm an anticipated D
av increase to reach 19 nm on application of the higher nitridation temperature. This particular piece of data can find relevant use when discussing the effects of sintering temperatures in the 650–1200 °C range, including the 1000 °C level, on crystallite growth of the components (vide infra).
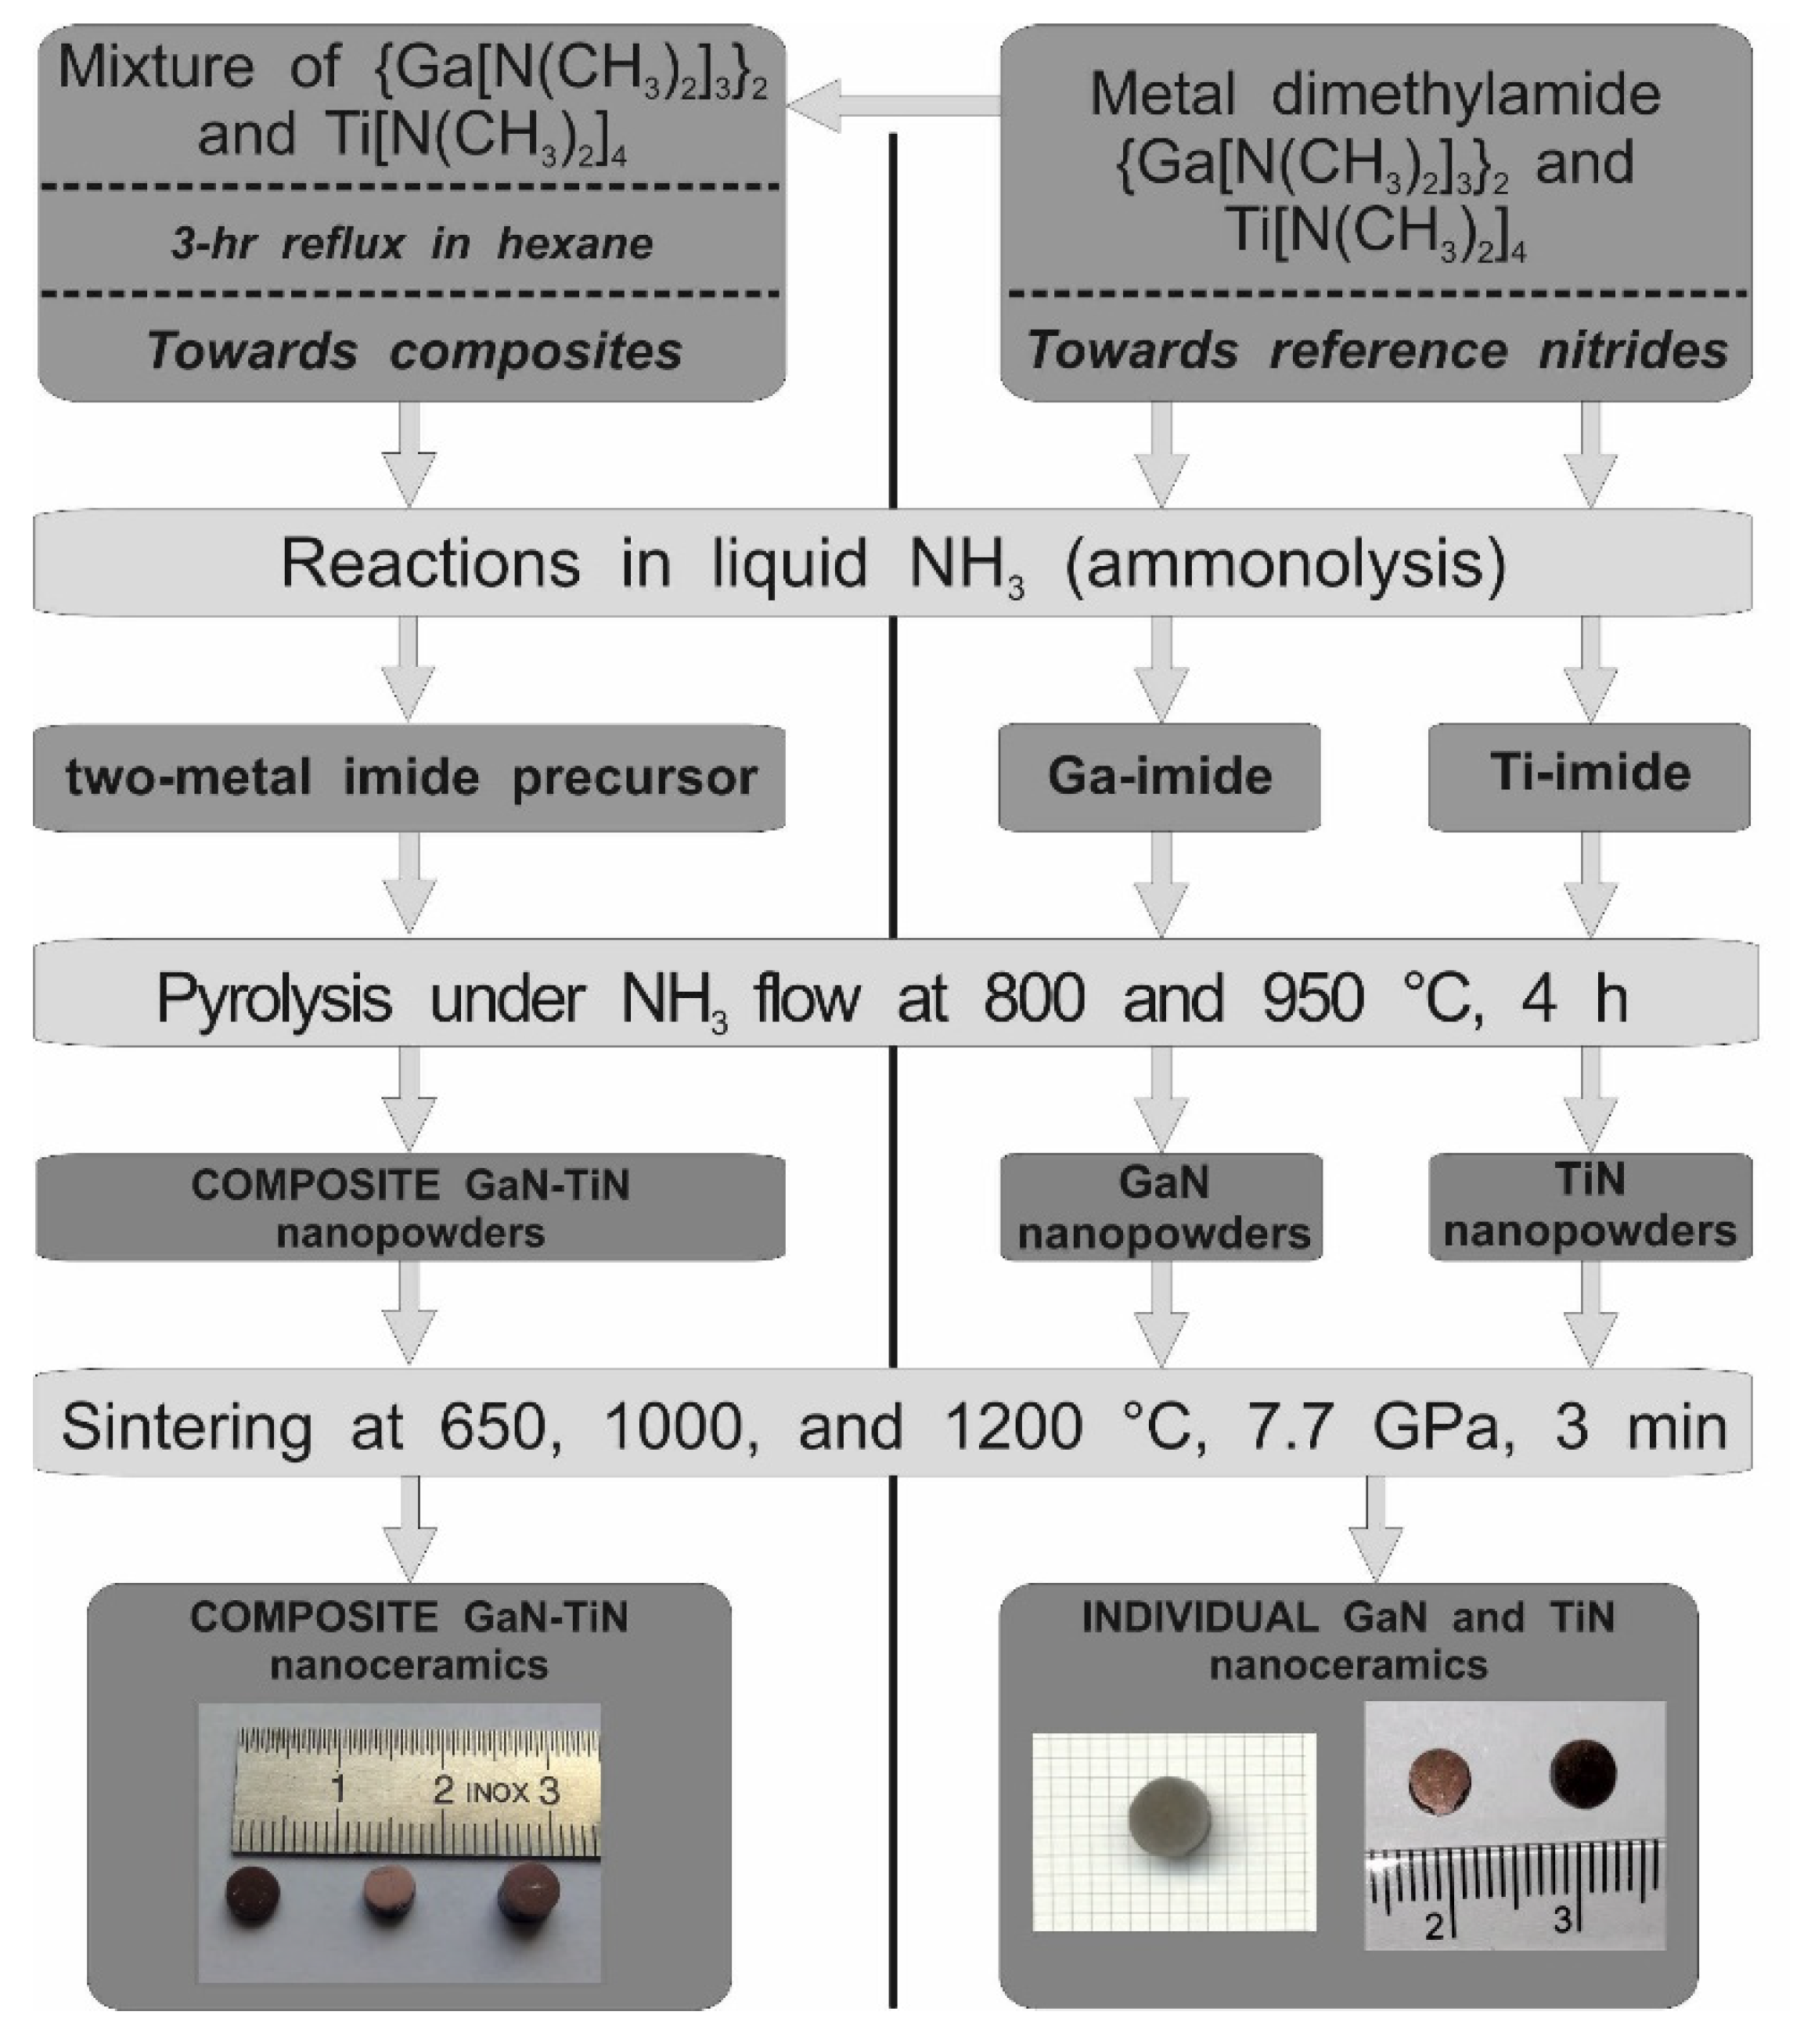
3.2. High-Pressure and High-Temperature (HP–HT) Powder Sintering
The as-synthesized powders were sintered with no additives following the procedure previously reported by us for nanopowders in the related systems of AlN–GaN [
31] and TiN–AlN [
32]. These are quite relevant cases since analogous precursor routes and powder nitridation schemes were employed. Specifics are concerned with some differences in nitridation and sintering temperatures. Specifically, in this study the powder nitridation temperatures were 800 and 950 °C (except for 800 and 1000 °C used in the case of pure TiN), and sintering temperatures for the composite powders were 650, 1000, and 1200 °C to be compared with the most relevant case of the system AlN–GaN with the same nitridation levels at 800 and 950 °C and sintering at 650 and 1000 °C, respectively. The lower nitridation temperature of 800 °C was used in both cases to afford powders with average crystallite diameters of several nanometers. The higher temperature of 950 °C provided larger crystallite diameters, whereas its level was dictated by an increased thermal instability of nanocrystalline GaN above it [
22]. In this regard, the TiN component in the current system of GaN-–TiN is reasonably stable up to at least 1200 °C [
25]. The selection of sintering temperatures was based on the same two criteria in all these studies. First, the lower temperature of 650 °C was below the lower nitridation temperature of 800 °C and, therefore, sintering was anticipated to occur with no temperature-induced recrystallization. Second, the higher temperatures of 1000 and 1200 °C were above the higher nitridation temperature of 950 °C with possible positive impact on crystal growth and, consequently, sintering with temperature-induced recrystallization. Additionally, the application of the 1200 °C sintering temperature for a short sintering time of 3 min and under the pressure of 7.7 GPa, i.e., a relatively high temperature regarding the thermal stability of GaN nanopowders (vide intra), was intended to check any interactions of decomposing GaN with the stable TiN component under such conditions. We also expected to observe similar effects of high pressure as previously that at the lowest sintering temperature and no crystal growth caused a net nanocrystallite “crushing”/lowering of average crystallite sizes, whereas, at the higher sintering temperature and associated temperature-induced crystal growth, the “crushing” competed with crystal growth. This serves to recall that high pressures are mostly used to significantly speed up sintering of powders. Lastly, the HP–HT sintering resulted in hard round-shaped pellets made of composite or individual nitride nanoceramics, as shown in
Figure 1. The pellets containing TiN were brown or golden brown, while those of pure GaN were gray.
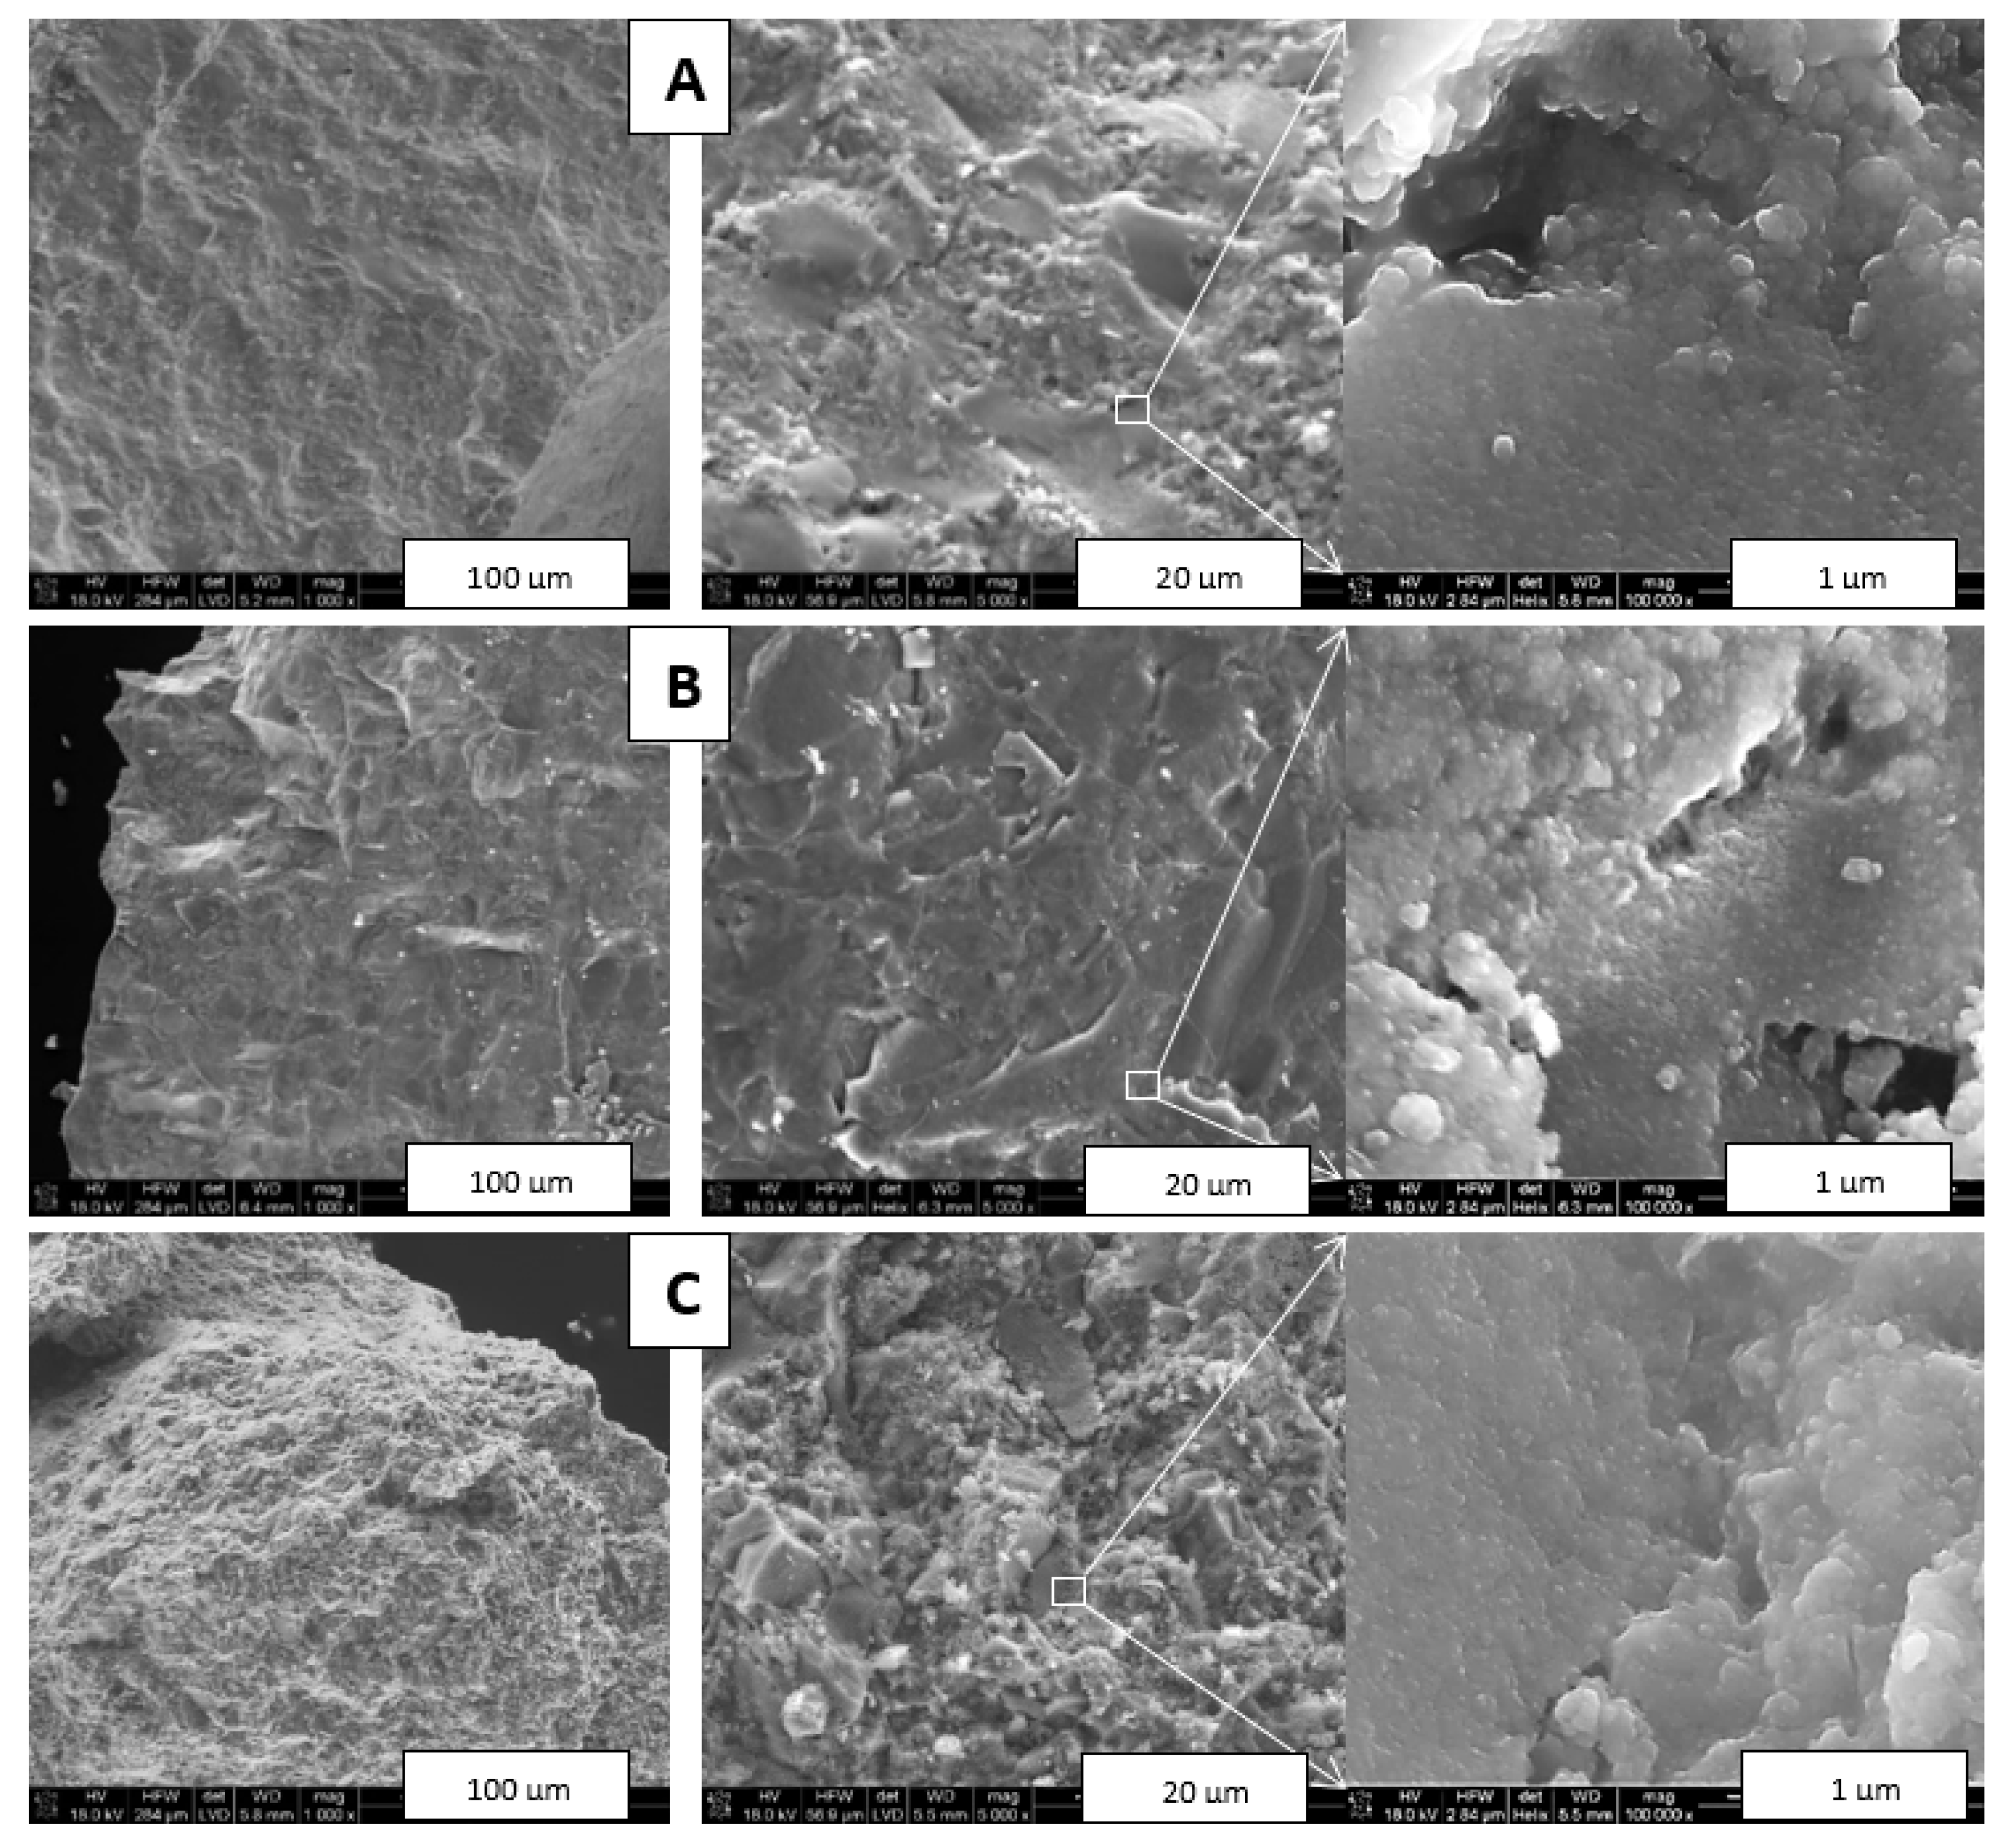
Figure 4 shows typical images of intentionally fractured fragments of composite nitride nanoceramics made from Composite_950 at all three sintering temperatures, i.e., 650, 1000, and 1200 °C, while
Figure 5 presents similar graphics for nanoceramics made from Composite_800 sintered at 1200 °C.
The fractures in
Figure 4 confirmed a dense material packing of homogeneous appearance at low magnification (left row). At higher magnification, the characteristic feature of all composite ceramics was the presence of intermixed and relatively large (up to several tens of micrometer) two distinct domains each with specific appearance, i.e., solid, seemingly dense/homogeneous islands with smoothly fractured surfaces that were embedded in an apparently porous matrix with irregularly shaped surfaces (middle row). The interfaces between the two types of domains were easily discerned. The EDX analysis confirmed that the solid areas were prevailingly TiN, whereas the surface-irregular matrix was significantly enriched in GaN. Furthermore, quite numerous micron- and submicron-sized pores could be seen, especially at the highest magnifications (right row). These images confirmed also the homogeneous, grainy in appearance submicron morphology that, upon inspection, was made of similar in size and densely agglomerated/sintered nanocrystallites in the several tens of nanometer range. At the higher magnifications for the 1200 °C ceramics, there were occasionally seen some regularly shaped relatively large crystallites in a few micrometer size range (
Figure 4C). Their characteristics were consistent with hexagonal GaN, and their size could be linked to a rapid crystal growth competing with decomposition under the sintering conditions. It should be noted, however, that no metallic Ga was observed in any of the ceramics examined in
Figure 4. In conclusion, the HP–HT sintering of the Composite_950 nanopowder appeared to be associated with significant phase separation and resulted in the intermixed nitride-specific domains on the several micrometer scale. This is exactly what was observed in the related system of TiN–AlN [
32], which supports a similar sintering mechanism in both composite nitride systems.
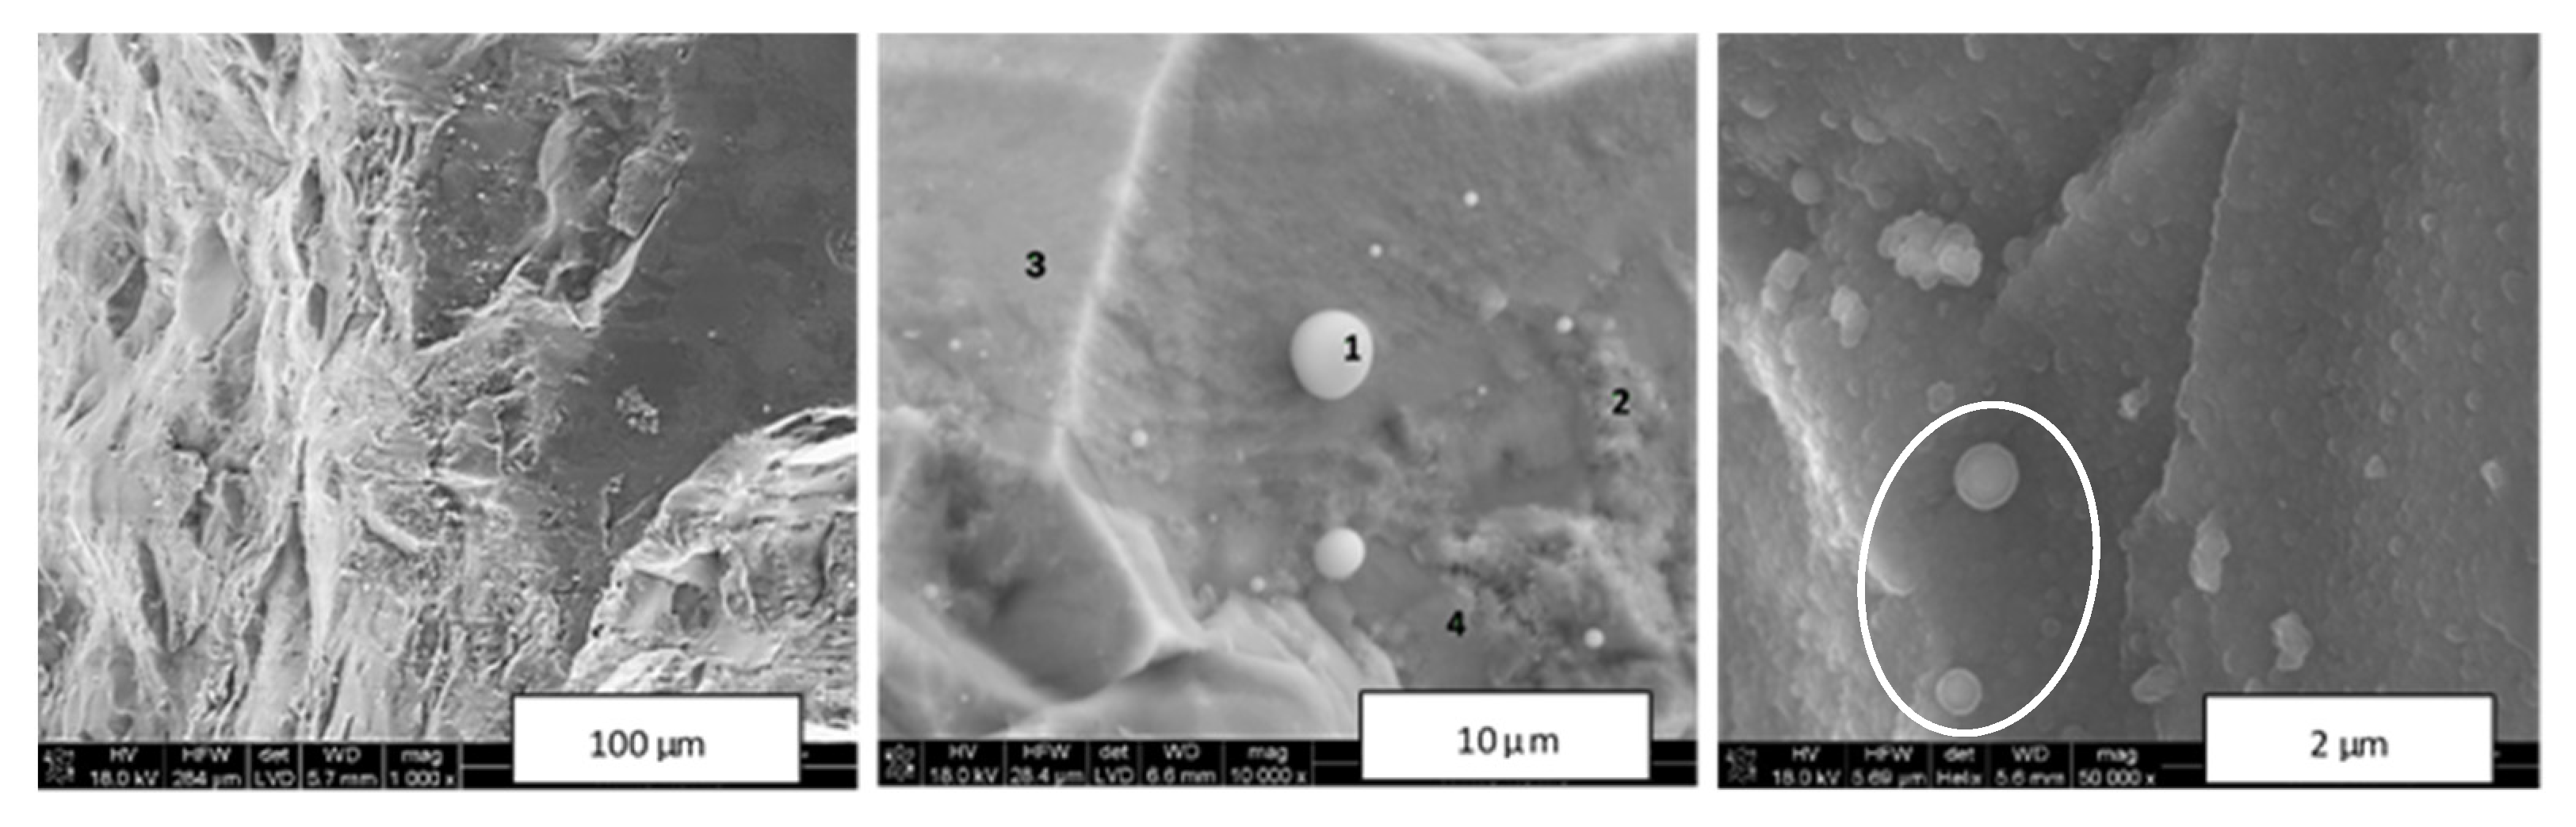
All the above observations applied closely to similar sintering of the Composite_800 nanopowder. In this case, however, an SEM examination of the Composite_800_sint_1200 nanoceramics, sintered at the highest applied temperature of 1200 °C, provided evidence for partial decomposition of the GaN component and formation of metallic gallium (
Figure 5). In a few areas, micron- and submicron-sized droplets were seen (
Figure 5, middle). The EDX analysis carried out for the middle image confirmed the droplets being elemental Ga (point 1), with the solid-looking areas adjoining to pores being significantly enriched in GaN to pure GaN (point 4), while the other dense areas were enriched in TiN (points 2 and 3). This is consistent with our previous observations that the applied sintering temperatures above 1000 °C, here 1200 °C, may cause not only decomposition of some GaN, but also concomitant rapid GaN crystal growth, making the initial GaN domains (agglomerates of nanocrystallites) appear dense (aggregates of microcrystallites) while also showing evolving porosity due to excessive mass transfer during such recrystallization. At the highest magnifications that resolved nanosized objects, shell droplets a few hundred nanometers in size, as if split-broken, attached to a homogeneous grainy/nanosized solid bulk could occasionally be observed (
Figure 5, right). The overall round-shaped appearance of the objects and the presence of the shells suggested a partial surface decomposition of small GaN agglomerates with formation of a layer of initially molten Ga (m.p. 29.8 °C) on the core made of not yet decomposed crystallites of GaN.
In concluding this section, there clearly must be a strong enough driving force during HP–HT sintering for nitride segregation and extended agglomeration via particle displacement even without recrystallization and associated mass transport phenomena. This takes place even for the 650 °C sintering that is neutral to temperature-induced crystal growth. Since the precursor nanopowders were synthesis-mixed on a submicron-size scale, it is the application of high pressure which appears to promote the alike nitride particle agglomeration and result in the different nitride phase segregation on a few micron scale. It is quite likely that, under such circumstances, the Van der Waals forces among the chemically and crystallographically similar nitride particles play an essential role in this phenomenon.
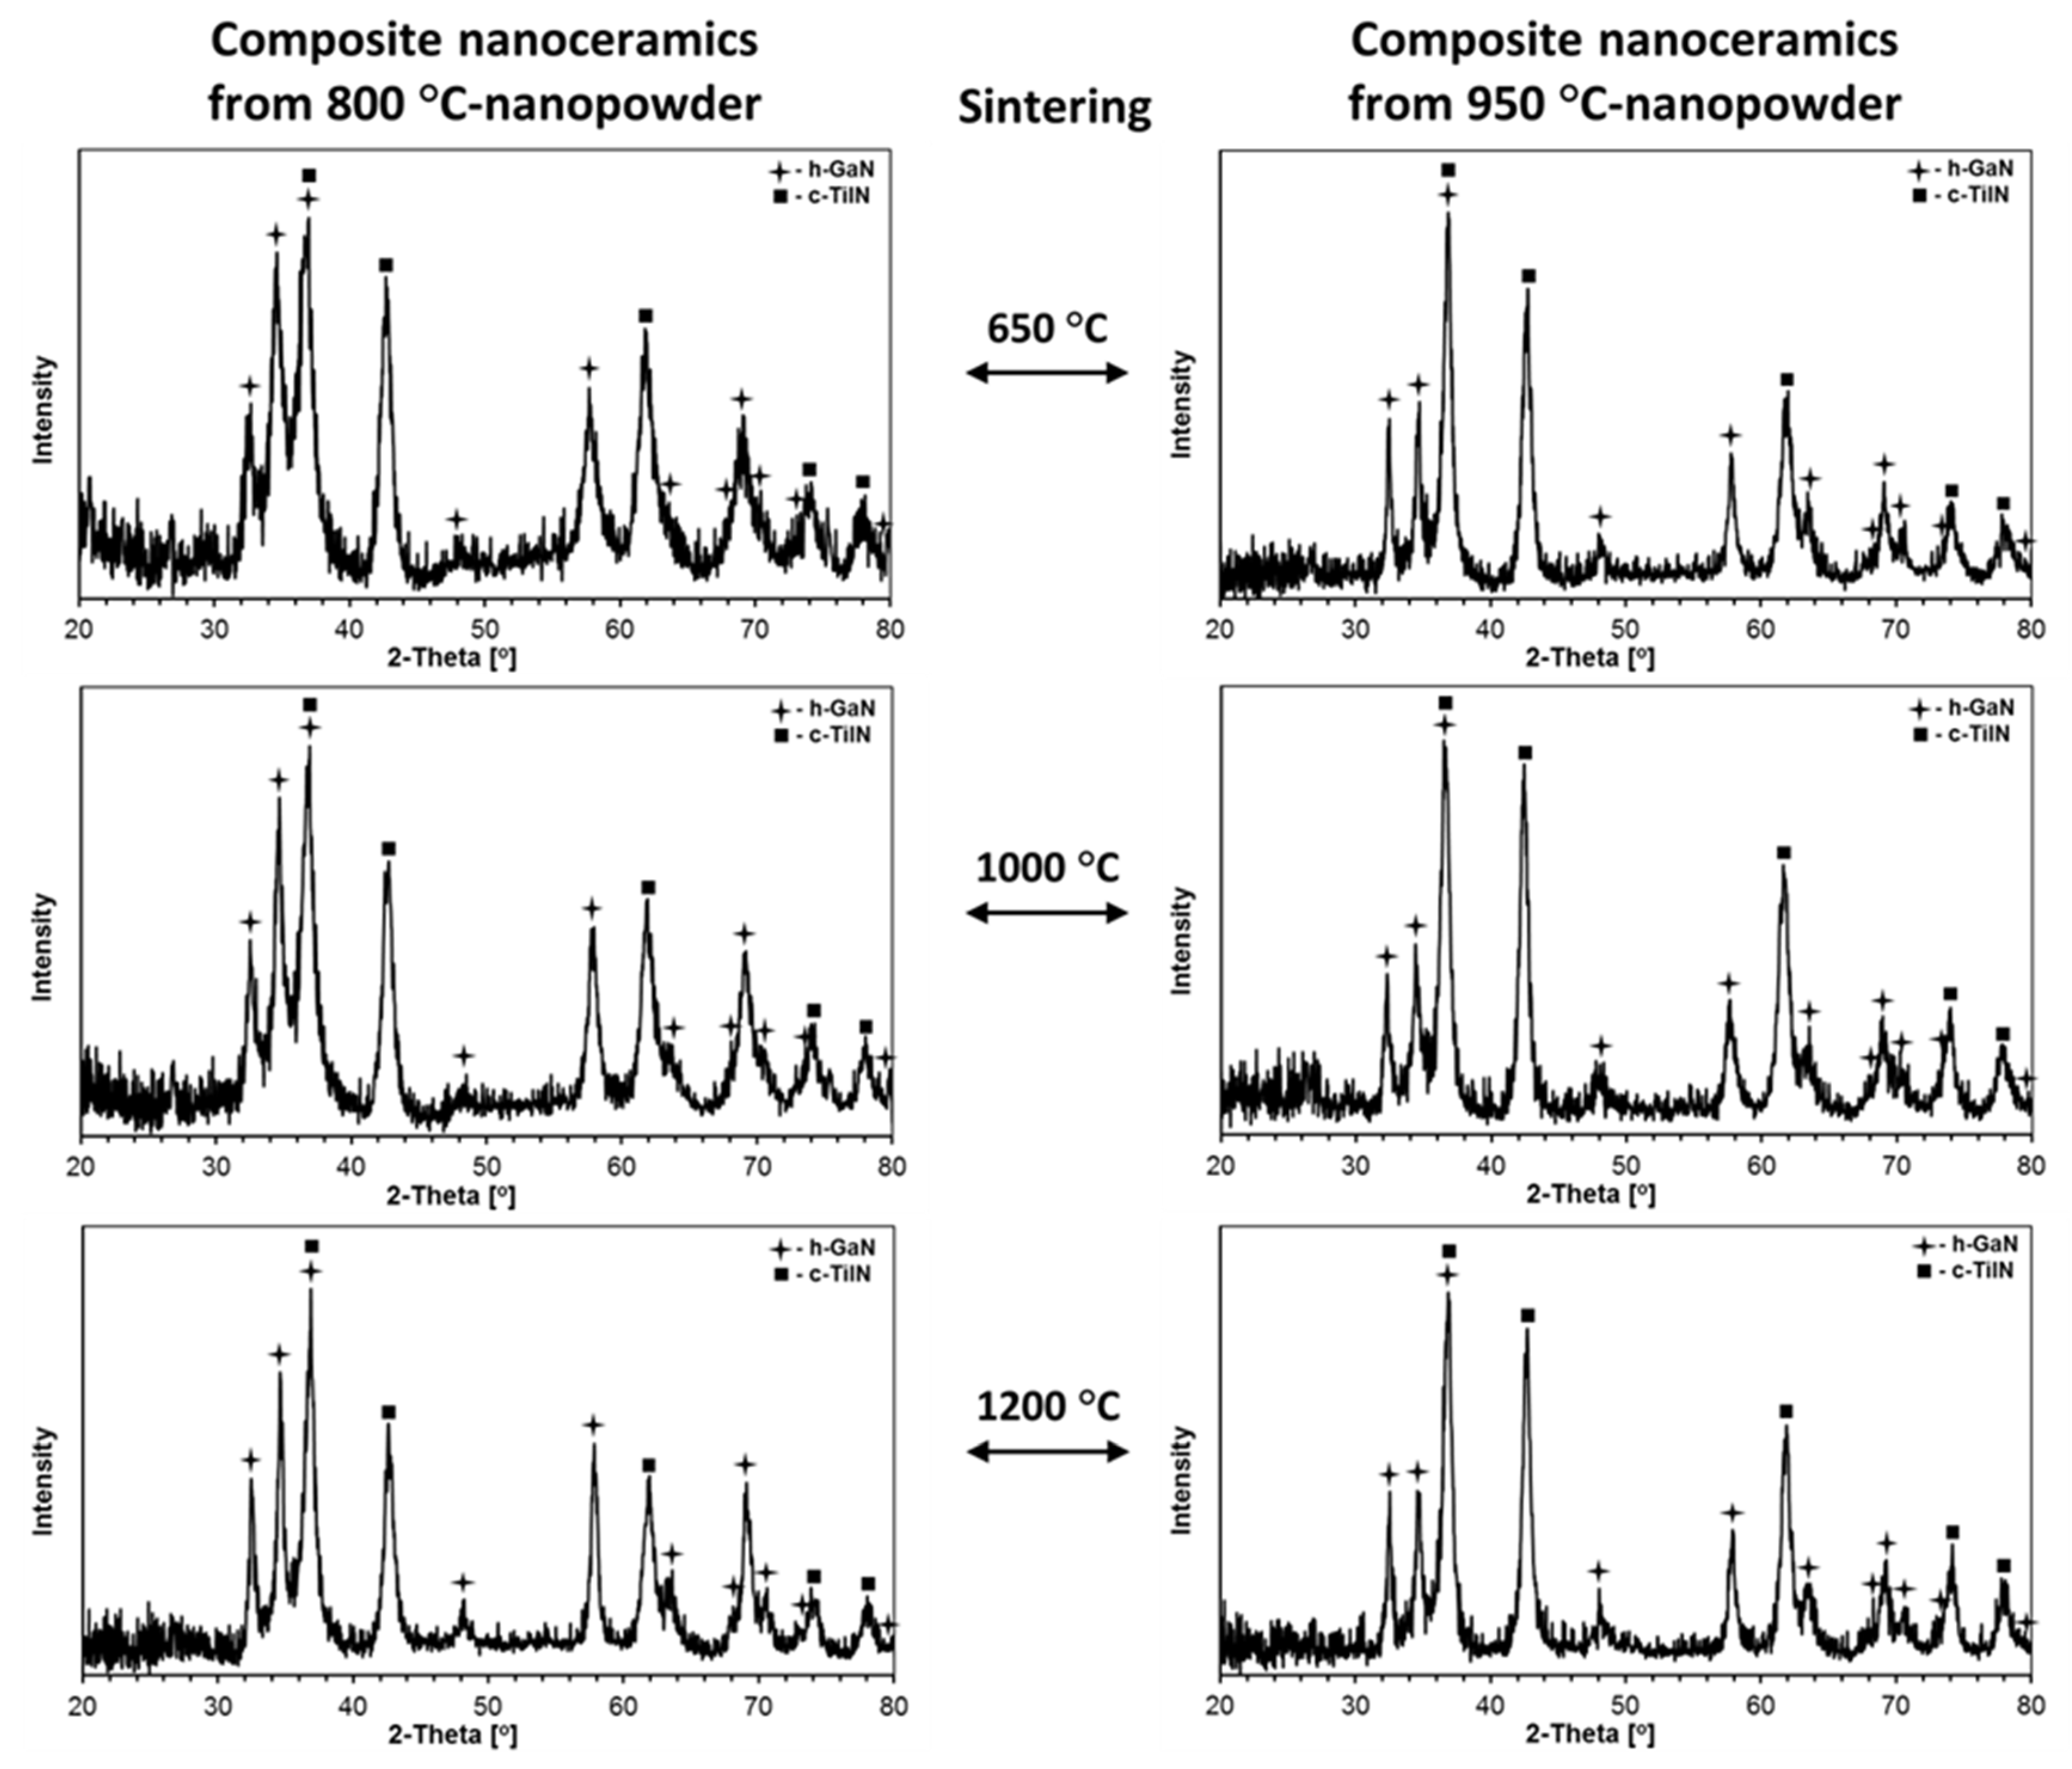
The powder XRD patterns for all ceramics produced from the composite nanopowders are shown in
Figure 6 and, for reference purposes, the XRD patterns for selected ceramics from pure GaN are displayed in
Figure 7. The evaluated lattice cell constants and average crystallite sizes are included in
Table 2.
It can be noted that all composite nanoceramics were made of the stable hexagonal GaN and cubic TiN polytypes with no detectable amounts of the metastable cubic GaN that was present in varying quantities in the starting powders. This is consistent with the conversion of all c-GaN to h-GaN upon the HP–HT sintering conditions. As observed by us earlier in the systems AlN–GaN [
31] and TiN–AlN [
32], the sintering temperature of 650 °C, lower than both powder nitridation temperatures (800 and 950 °C), yielded mostly smaller average crystallite sizes D
av’s in such nanoceramics compared with the starting powders. This can be illustrated by comparing the D
av’s (h-GaN/c-TiN) for the Composite_800 and Composite_950 nanopowders (
Table 1) with their 650 °C derived nanoceramics (
Table 2). For the composite nanopowders, the D
av’s (h-GaN/c-TiN) were 27 nm/10 nm for 800 °C and 55 nm/14 nm for 950 °C, whereas, for the 650 °C composite-derived nanoceramics, they were, respectively, 19 nm/10 nm and 35 nm/12 nm. As previously, we assigned such an outcome to “crushing” of the nanocrystallites by the extremely high pressure in the absence of crystal growth, here more prominent for the larger-sized h-GaN component. However, at the sintering temperatures of 1000 and 1200 °C (sintering with recrystallization), a competition between “crushing” and temperature-induced crystal growth yielded different results. In particular, for the 1000 °C composite-derived nanoceramics, the D
av’s were found for the respective starting nanopowders at 20 nm/12 nm and 33 nm/13 nm, while, for the 1200 °C derived nanoceramics, the average particle sizes for the polytypes were, respectively, 26 nm/13 nm and 37 nm/14 nm. It is interesting to note that, at the discussed sintering temperatures, the recrystallization was more pronounced for h-GaN than for c-TiN, and was still confined to the crystallite low nanosize range.
It is instructive to relate some of these structural features of the composite nanoceramics to the individual nitride nanoceramics at comparable HP–HT sintering conditions (see
Table 1 and
Table 2). When considering the case of pure GaN, sintering at 650 °C of both 800 and 950 °C nanopowders resulted in nanoceramics with relatively increased proportions of the stable h-GaN polytype relative to c-GaN, and sintering at 1000 °C yielded in both cases only the stable h-GaN. This serves to recall that sintering of the composite nanopowders resulted exclusively in the formation of the h-GaN component. For the sintering at 650 °C, the D
av’s for h-GaN were comparable with the values in the related 650 °C composites, whereas the sintering of pure GaN with recrystallization at 1000 °C yielded D
av = 160 nm for GaN_800 and D
av = 31 nm for GaN_950. Apparently, the temperature spread between the powder preparation and powder sintering temperatures, which was much higher for the GaN_800 precursor, i.e., 200 vs. 50 °C, is a major driving force behind the rate of crystal growth. It is also clear that sintering with recrystallization at 1000 °C created much less restrained conditions for crystal growth in pure GaN nanopowders than in the composite nanopowders, the latter being consistent with a TiN-component thinning effect. This is supported by the h-GaN data with D
av = 160 nm for GaN_800_sint_1000 vs. D
av = 20 nm for Composite_800_1000 with the 200 °C spread, while there was apparently no such effect for the 50 °C spread, yielding D
av = 31 nm for GaN_950_1000 vs. D
av = 33 nm for Composite_950_1000. There was no sintering of pure GaN done at 1200 °C in this study due to thermal instability of the pure nitride [
22]. However, as revealed earlier by the SEM study, the 1200 °C sintering of the composite powders was successfully accomplished with only traces of GaN decomposition, which we attributed to the action of high pressure and the relatively short sintering time of 3 min. As far as the case of pure TiN is concerned, some related data were already published by us for the TiN–AlN system [
32], i.e., in the case where the powder nitridation temperatures were 800 and 1100 °C and the sintering ones were 650 and 1200 °C. The closely related case was that of the TiN_800 nanopowder (a = 4.24 Å, D
av = 8 nm) sintered at 650 °C to yield the TiN_800_sint_650 nanoceramics (a = 4.24 Å, D
av = 8 nm), consistent with no essential changes in structure and particle size parameters, including no crystallite “crushing”, in such sintering without recrystallization. Sintering at 1200 °C resulted in merely moderate recrystallization for TiN_800_sint_1200 (a = 4.24, D
av = 13 nm). The data for pure TiN can now be referred to the relevant cases of the GaN–TiN composites in this study. For Composite_800_sint_650, the D
av for the c-TiN component equal to 10 nm can be favorably compared to 8 nm in pure TiN_800_sint_650. Similarly, for Composite 800_sint_1200, the relevant D
av of 10 nm can be compared with 13 nm for pure TiN_800_sint_1200 (quoted in [
32]). It is apparent that the growth of TiN was somewhat restrained in the composites; however, as mentioned before, the changes in D
av’s for TiN were clearly smaller than found for GaN in all comparable cases.
Raman spectroscopy is a versatile tool to probe composite nanoceramics from the point of view of phase domains. In this regard, the first-order Raman spectra are forbidden for perfect O
h symmetry in cubic TiN. Due to high propensity of the nitride for non-stoichiometry with nitrogen deficiency (as in TiN
x, x < 1) with the then active modes, Raman spectroscopy is often used for various titanium nitride products such as single crystals [
39], thin layers [
40], and powders [
41]. As examples,
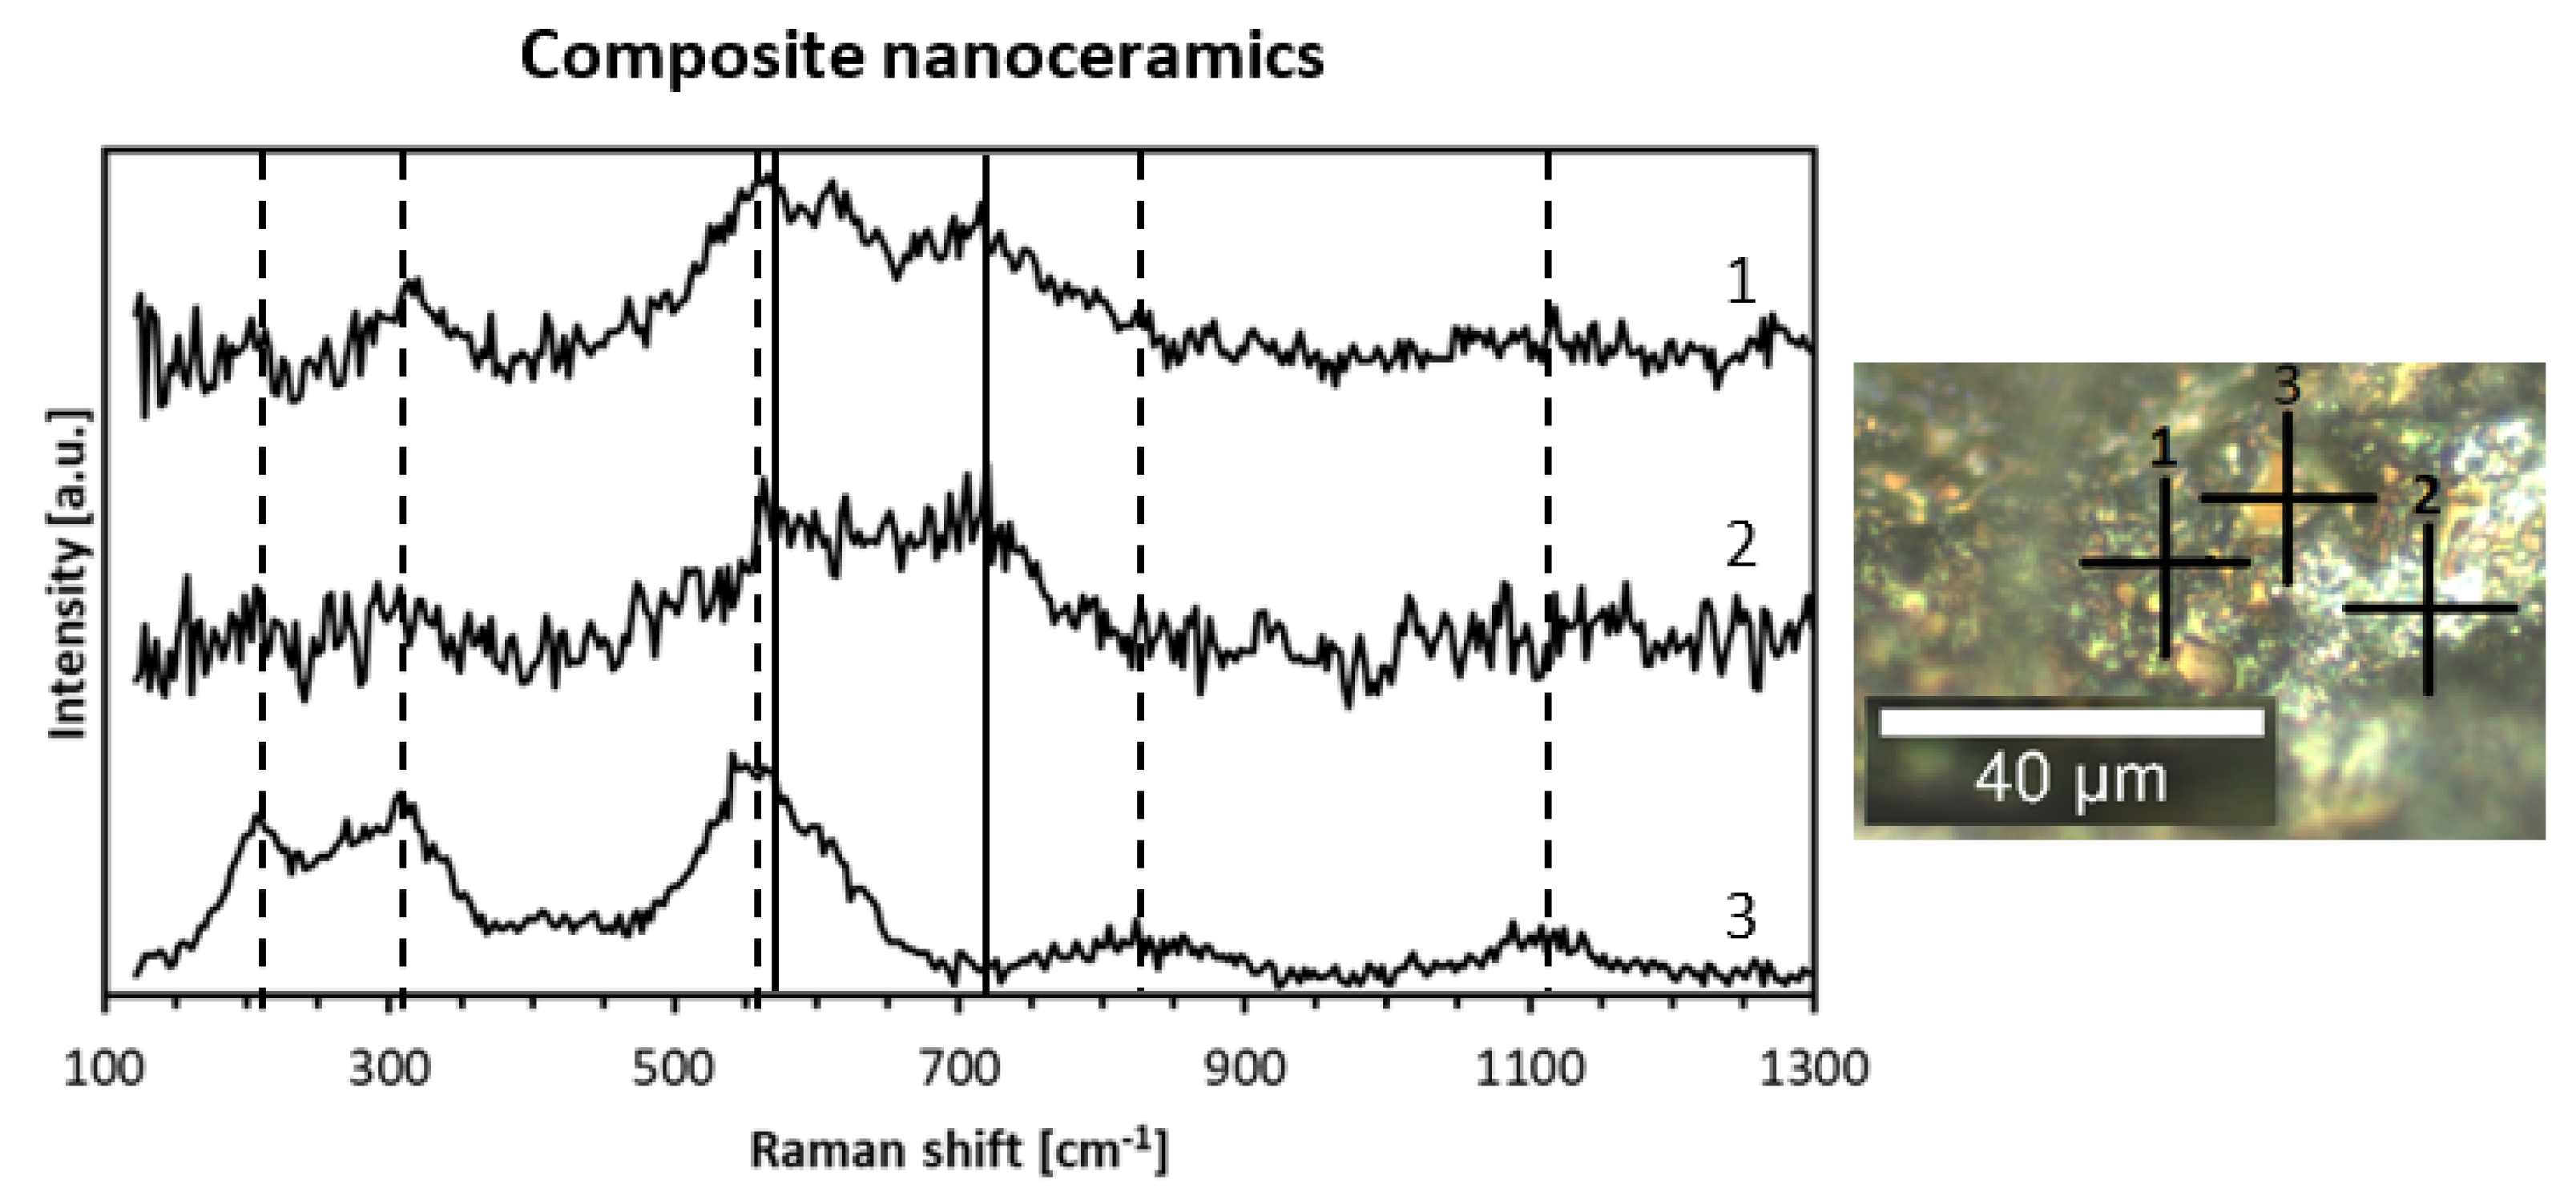
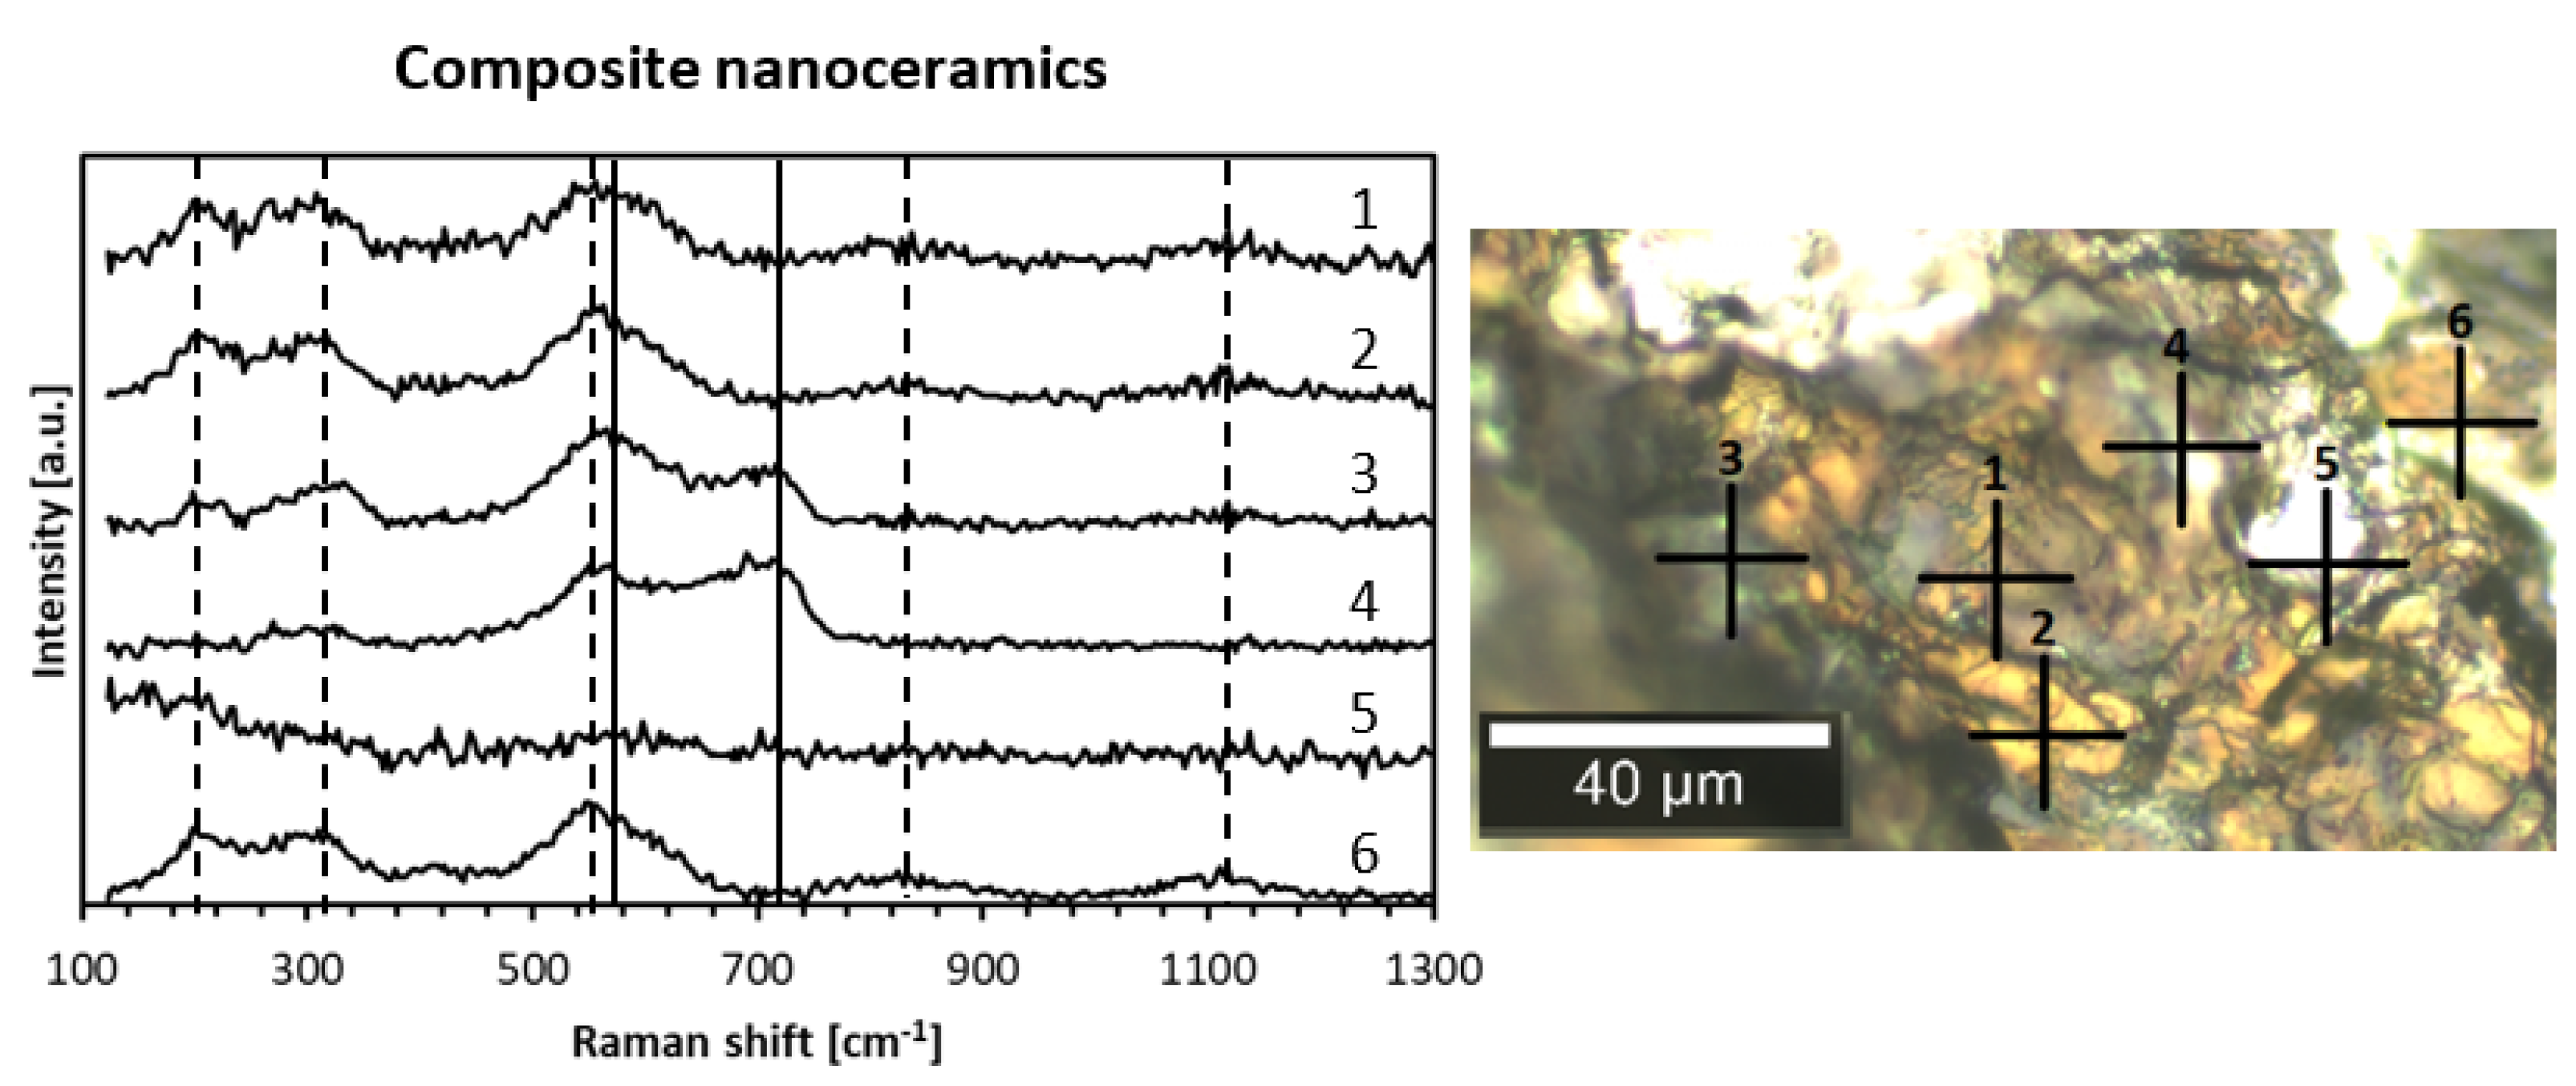
Figure 8 shows the Raman spectra for three points (indicated as crosses in the adjoining microscopic image) for the nanoceramics of Composite 800_sint_1000, and
Figure 9 includes such spectra for six points for Composite_950_sint_1000.
Raman confocal microscopy for the nanoceramics confirmed the distinct micrometer-sized domains discussed earlier during SEM analysis, i.e., solid looking and quite regularly shaped golden-brown areas (TiN) embodied in the bright porous-type matrix (GaN). Typical features of the Raman spectrum for a few micrometer-sized TiN domain labeled 3 is displayed in
Figure 8, curve 3. The spectrum consisted of square-like shaped acoustic phonons with TA and LA modes at ca. 220 cm
−1 to 320 cm
−1, triangular-like shaped TO modes at 560 cm
−1 with a weak contribution of the LO modes up to 620 cm
−1, and two wide maxima of overtones at ca. 820 (LA + TO) and 1120 cm
−1 (2 TO), as reported in the literature for nearly stoichiometric titanium nitride [
42]. The square and triangular-like features resulted from defect-induced first-order Raman scattering in sub-stoichiometric TiN
x (x < 1). The appearance of the second-order overtones was consistent with a relatively small N-deficiency in the titanium nitride domains since the intensities of the second-order signals are reported to decrease rapidly with increased non-stoichiometry [
43]. The Raman spectra for the surface-uneven and apparently porous GaN domains labeled 1 and 2 are presented in
Figure 8, curves 1 and 2. Since the most intense band E
2 (high) for h-GaN showed up at ca. 570–580 cm
−1 [
21,
44], it can be easily confused with the strong TO mode at 560 cm
−1 for TiN. However, the appearance of an active band at ca. 720–730 cm
−1 was diagnostic for GaN being in the range of the A
1 (LO) mode [
21], especially when coupled with the absence of the square-like shaped acoustic phonons (TA and LA modes) typical for TiN. Eventually, for
Figure 8 and Composite_800_sint_1000, spectra 1 and 2 were assigned to GaN and spectrum 3 was assigned to TiN, confirming nitride separation on the micrometer scale in these nanoceramics. Such a conclusion is fully corroborated by the Raman spectra for Composite_950_sint_1000 shown in
Figure 9. Curves 1, 2, and 6 were consistent with TiN domains, curve 4 was consistent with GaN domains, and curve 3 represented both phases with prevailing GaN. Interestingly, curve 5 for a very bright point 5 showed no distinct spectral features. It was tempting to assign this to metallic gallium due to a likely beginning of GaN decomposition at the sintering temperature of 1000 °C. In this regard, this serves to recall that droplets of metallic Ga were seen by SEM after sintering of one of the composites at a higher temperature of 1200 °C.
The Vicker’s hardness and helium density data for the nanoceramics are compiled in
Table 3. The Vicker’s hardness, H
v, was measured by an indentation method under two loads of 100 and 300 gf (gram-force), yielding comparable results, and the data-set for 300 gf is used for discussion. In this regard, too low load (below ca. 200 gf) indents often displayed a dependence of H
v on indent depth, known as the indentation size effect [
45]. The H
v values for the sintered pellets in the current system GaN–TiN were relatively moderate to high in the range 7.5 to 13.2 GPa. The lowest value of 7.5 GPa was determined for nanoceramics of Composite_950_sint_650 that were sintered without recrystallization to be compared to the highest of 13.2 GPa for two nanoceramics sintered with recrystallization, namely, the nanoceramics of Composite_800_sint_1200 and Composite_950_sint_1000. Interestingly, in the series of three nanoceramics made from Composite_800, when compared to sintering at 1000 °C, there was a noticeable increase in H
v upon sintering at 1200 °C, whereas, for Composite_950, there was an equally noticeable decrease in H
v for this temperature. In the latter case, this coincided with SEM-detected GaN decomposition with metallic Ga formation, which could have been responsible for loosening interparticle binding with deterioration of the hardness. Given the established impact in HP–HT sintering at high pressure (nanocrystallite “crushing”, speeding up compaction) and high temperature (sintering without or with recrystallization, rates of diffusion/recrystallization and pore formation, possible GaN decomposition), the weighted-out interplay of these two phenomena appeared to determine the final hardness. It is clear, however, that, within the component stability regimes, the recrystallization/crystal growth conditions were crucial for material hardness, while some accompanied microsized porosity formation did not prevent the formation of relatively hard nanoceramics in the system. The H
v values in
Table 3 can be compared to the individually sintered nitrides. In this regard, the relevant pure h-GaN nanoceramics made by us from GaN_800_sint_650 and GaN_800_sint_1000 showed H
v’s of 13.6/15.0 and 10.0 GPa, respectively, whereas those made from GaN_950_sint_650 and GaN_950_sint_1000 showed, respectively, H
v’s of 10.6 and 17.4 GPa [
28]. It is interesting to note that the H
v values for the GaN nanoceramics were in most cases larger than the reference literature value of 11 GPa [
46]. At the same time, notably high H
v‘s of 15.5 and 19.7 GPa were recorded by us for pure c-TiN nanoceramics from TiN_800_sint_650 and TiN_800_sint_1200, respectively [
32], and H
v‘s of 9.2–15 GPa for few micrometer thick layers of TiN were shown by others [
47]. If one relates the Vicker’s hardness of the composite nanoceramics in this study to the hardness of the individual nitride nanoceramics, generally, slightly higher hardness was found for the latter, and the hardness of the significantly recrystallized and visibly porous h-GaN component appeared to be a limiting factor in the former.
The helium density data, which were the real/skeletal densities while possibly supporting (or not) the occurrence of closed pores, provided further insight into microstructure of the nanoceramics (
Table 3). The densities for the pool of the sintered composites ranging from 4.25–4.66 g/cm
3 were referred to 5.73 g/cm
3, i.e., a theoretical value calculated for a 1:1 mixture (on the molar basis) of h-GaN (6.15 g/cm
3) and c-TiN (5.24 g/cm
3). The measured densities in this study were 74–81% of this value (
Table 3, % theor.). In our previously reported data on the TiN–AlN system [
32], the related densities were found in a very similar range of 70–82%, supporting a similar closed porosity evolution upon HP–HT sintering in both systems. It is interesting to relate these densities to those determined for the sintered pure nitrides, i.e., ranges of 85–92% for GaN [
31] and 84–90% for TiN [
32], and the comparison points to visibly lower densities determined for the GaN–TiN composites. This serves to recall that the SEM examination of the nanoceramics supports a quite extensive microporosity evolution associated mostly with the GaN domains. The relatively low densities of the composites, similarly to the case of the TiN–AlN system, appear to result from the complex nitride segregation–crystal growth–pore formation processes that are kinetically frozen and consolidated due to the short time and diverse mass transport rates for the GaN and TiN components during the HP–HT sintering of their reaction-mixed nanopowder composites.


 ,
, 


