
Comparison of Tensile Strength and Fracture Toughness of Co-Bonded and Cold-Bonded Carbon Fiber Laminate-Aluminum Adhesive Joints


Abstract
:1. Introduction
- Co-curing, that is, the two adherends are cured together and bonding occurs by CFRP resin adhesion (not generally used for hybrid joints);
- Co-bonding, where a high-temperature curing adhesive, typically in the form of a film, is placed on a cured adherend and the other adherend is laminated over;
- Secondary bonding by either high-temperature or cold bonding: two cured adherends (metals do not have to cure, of course) are bonded with either a one-component (high temperature) or a two-component (room or “cold” temperature).
2. Materials and Methods
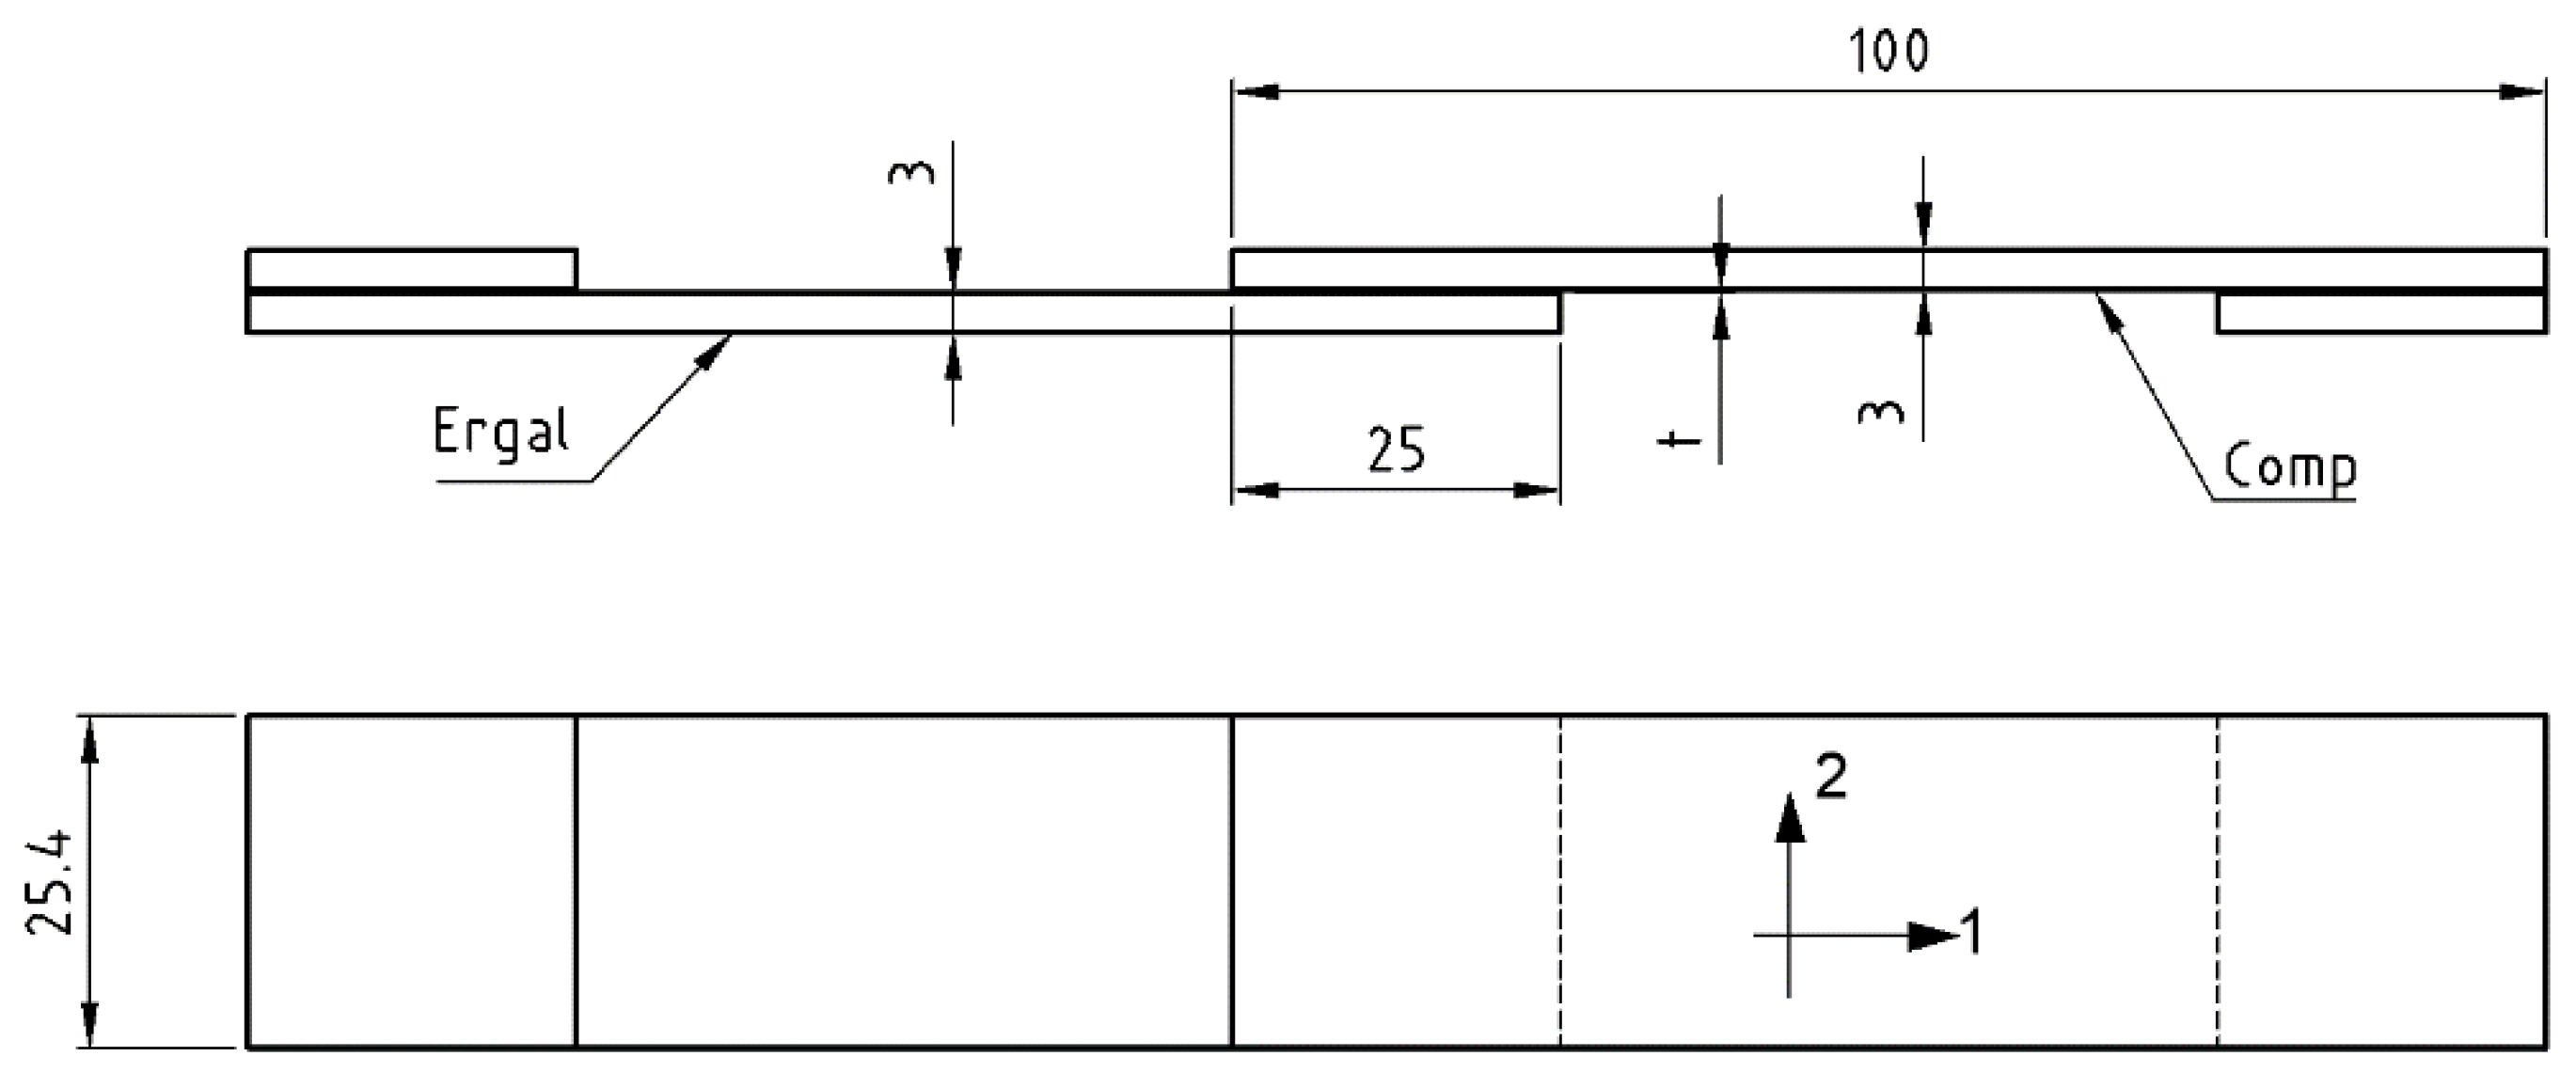
2.1. Materials and Specimen Manufacturing
2.2. Experimental Plan
- -
- SLJ: Single-Lap Joint to evaluate average overlap shear strength;
- -
- TRAZ-BJ: tensile test on butt-bonded cylindrical joints to evaluate the average tensile strength;
- -
- DCB: Double Cantilever Beam Mode I joint fracture test;
- -
- ENF: End Notched Flexure Mode II joint fracture test.
2.2.1. SLJ
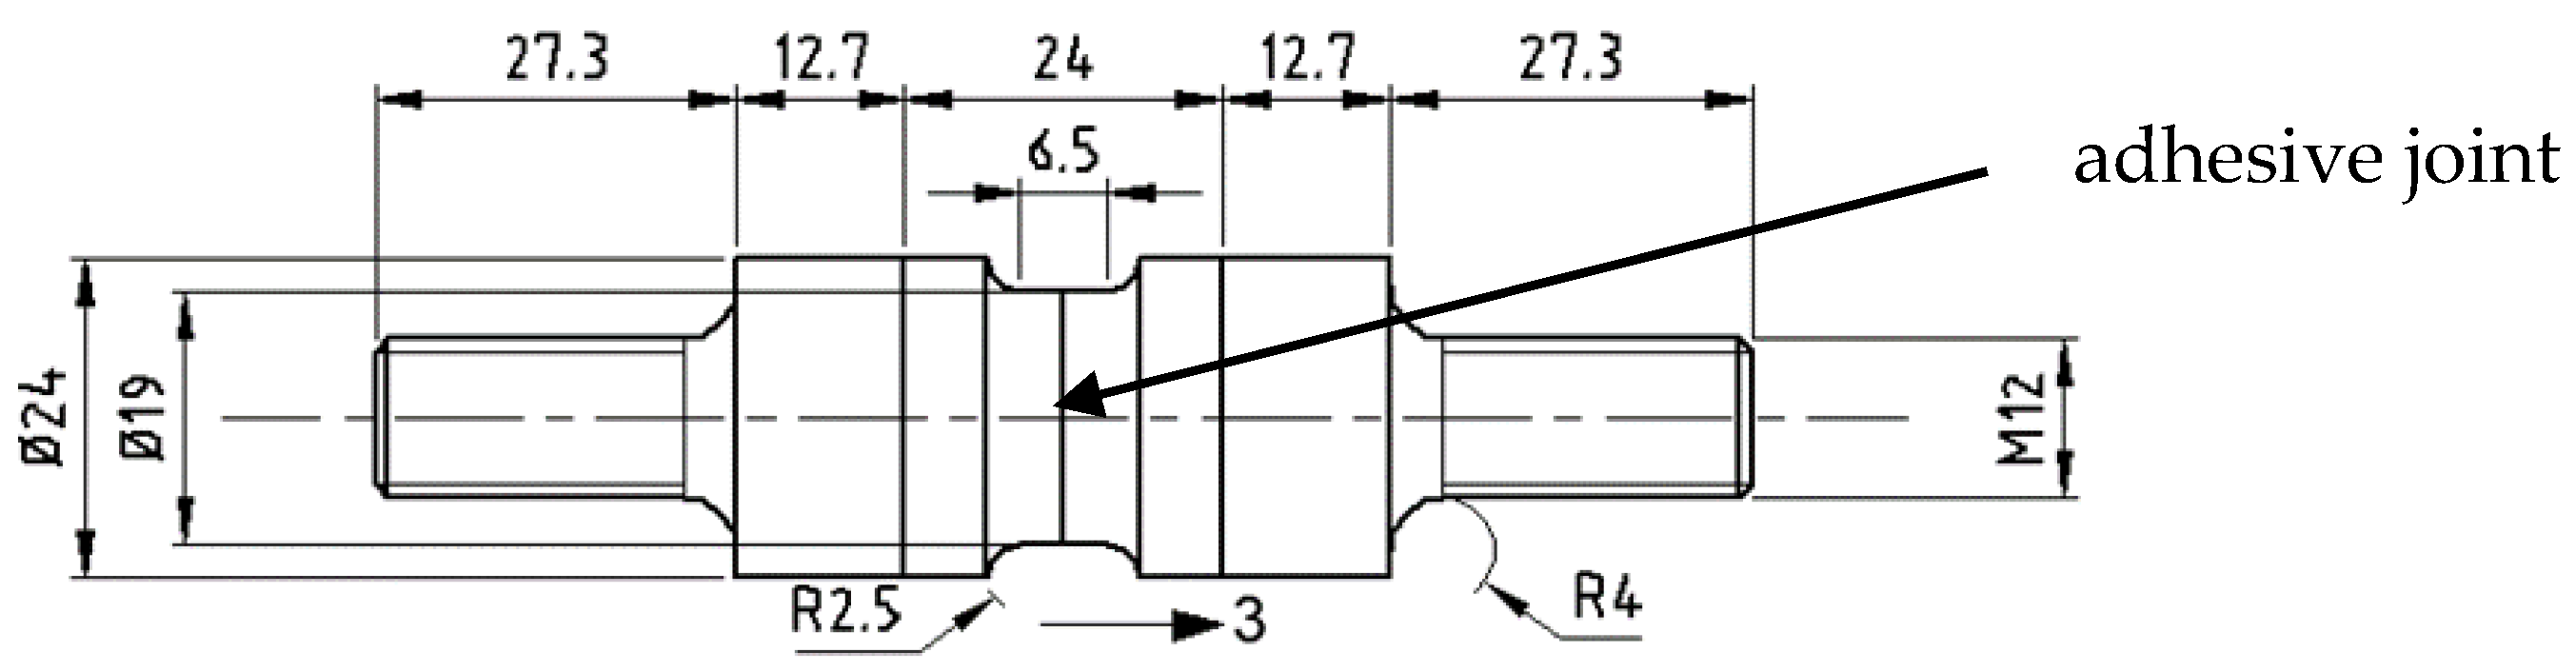
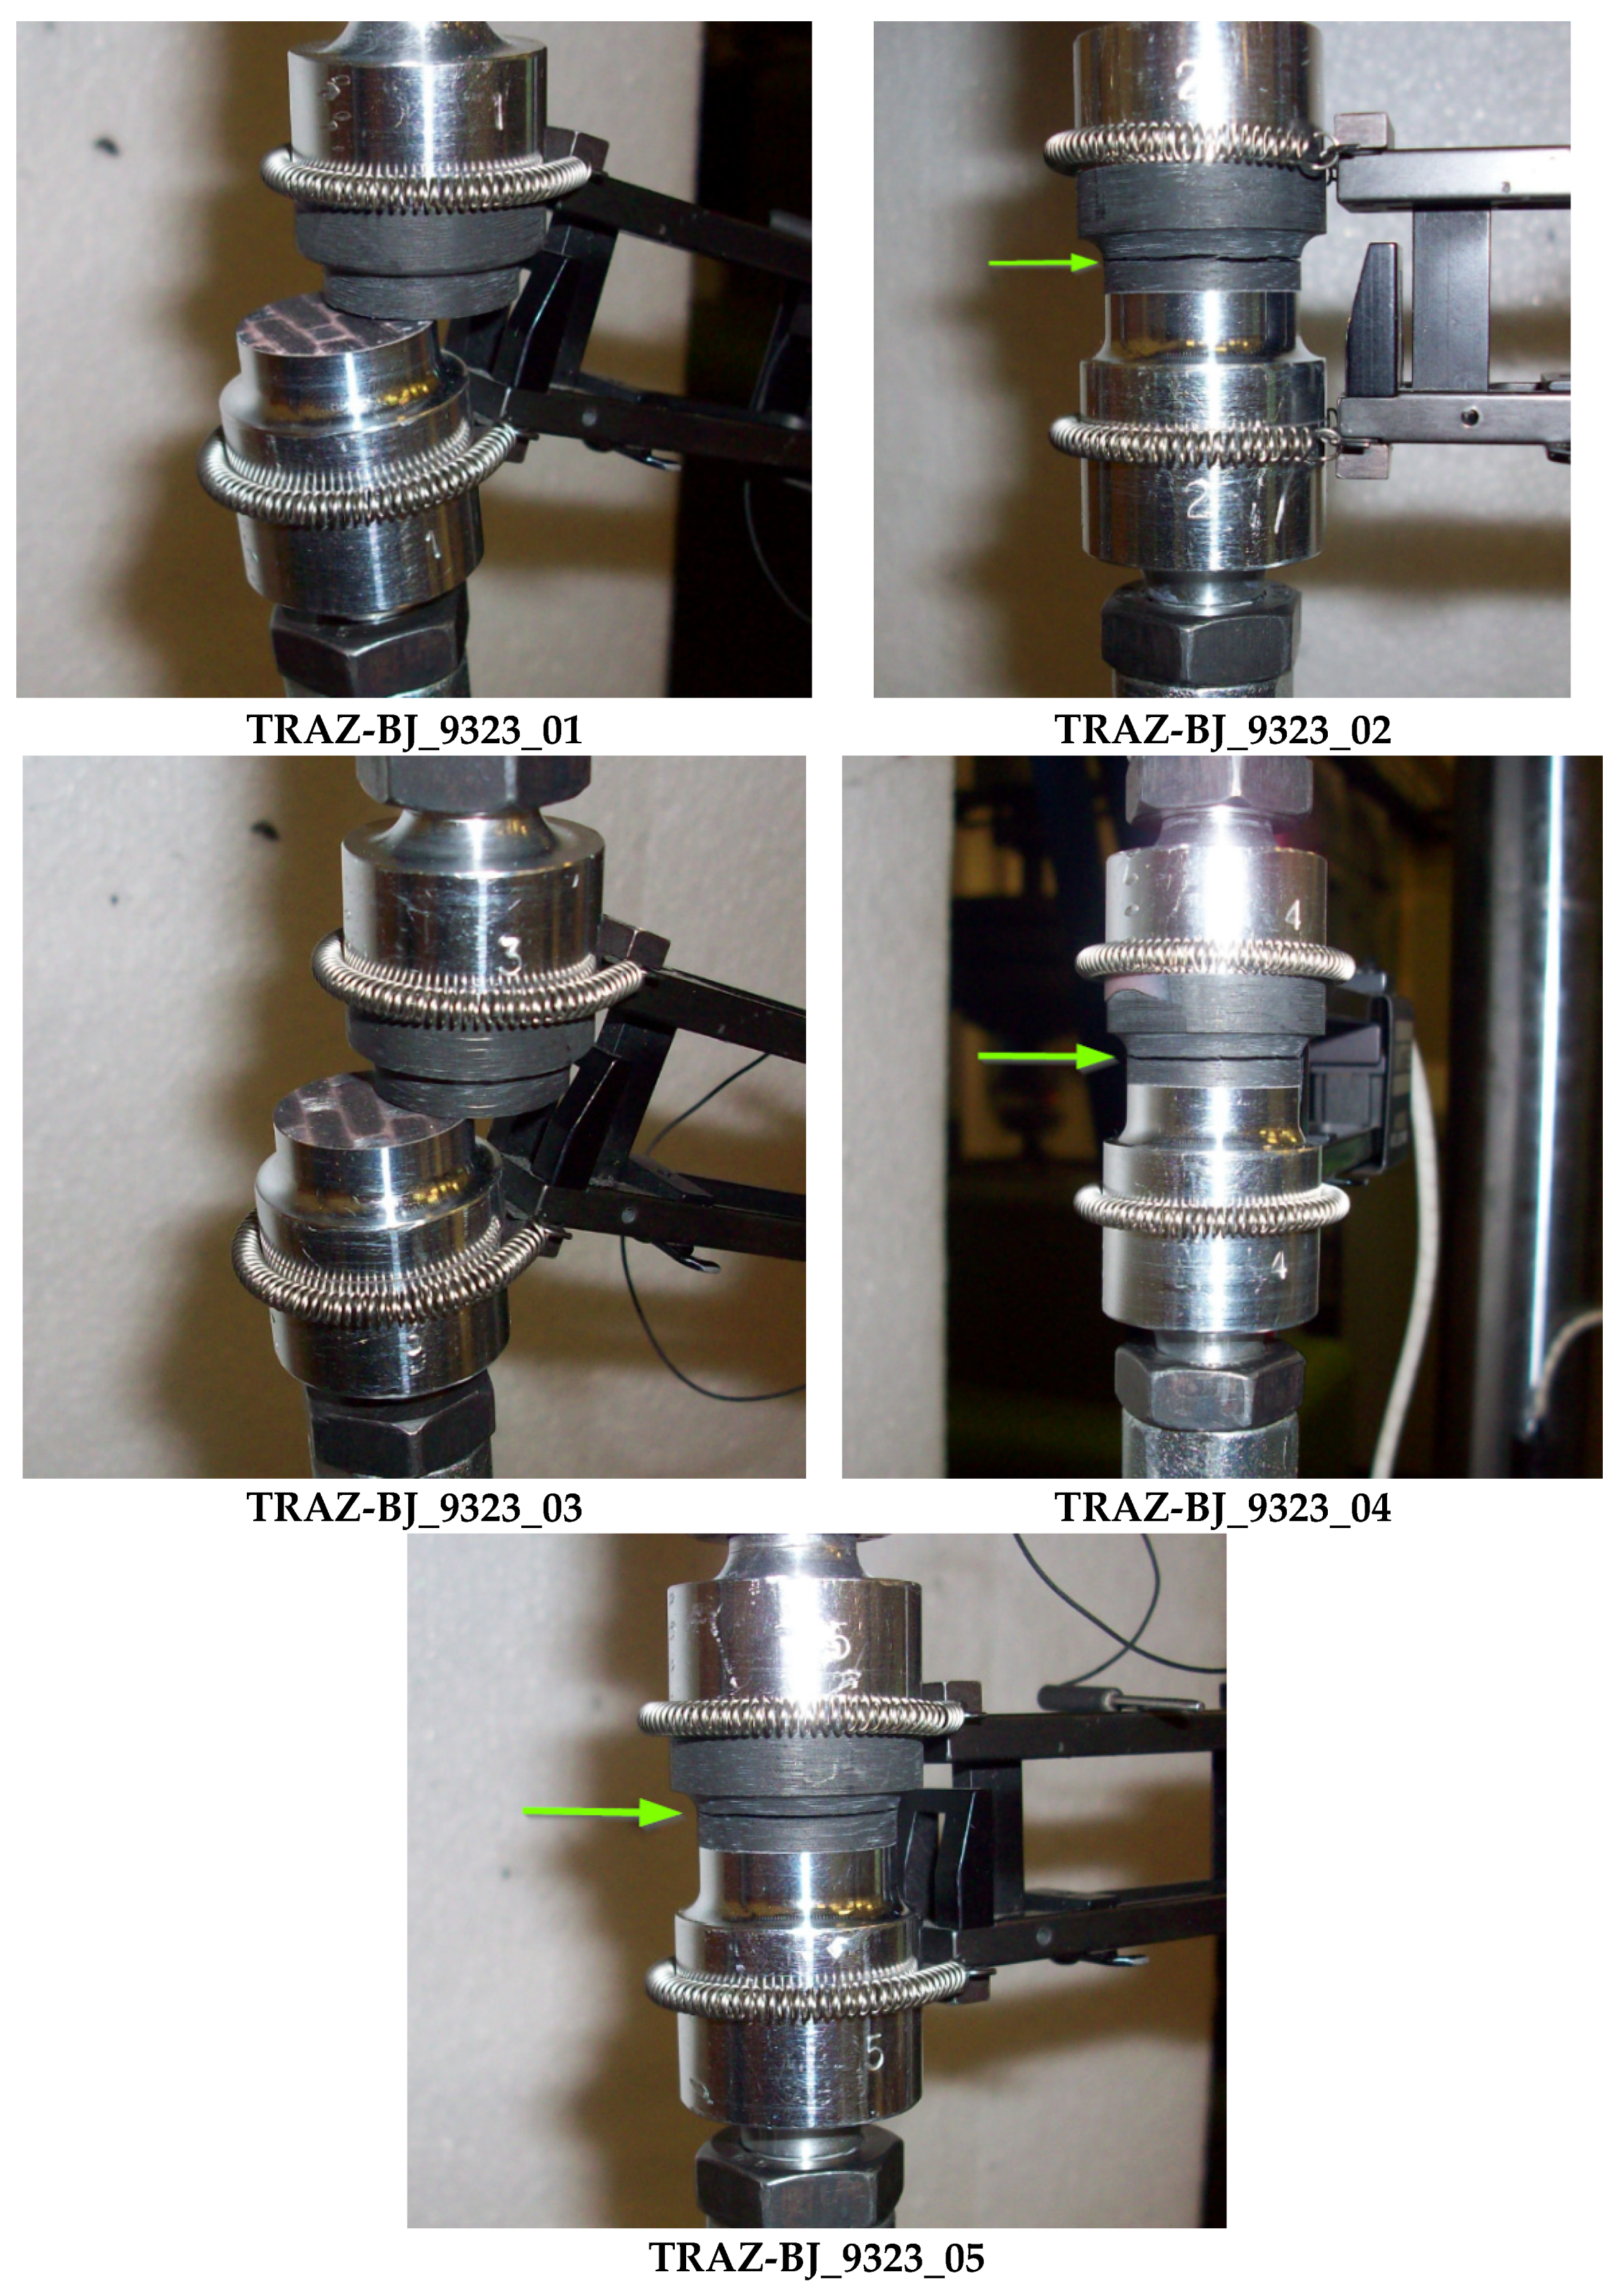
2.2.2. TRAZ-BJ
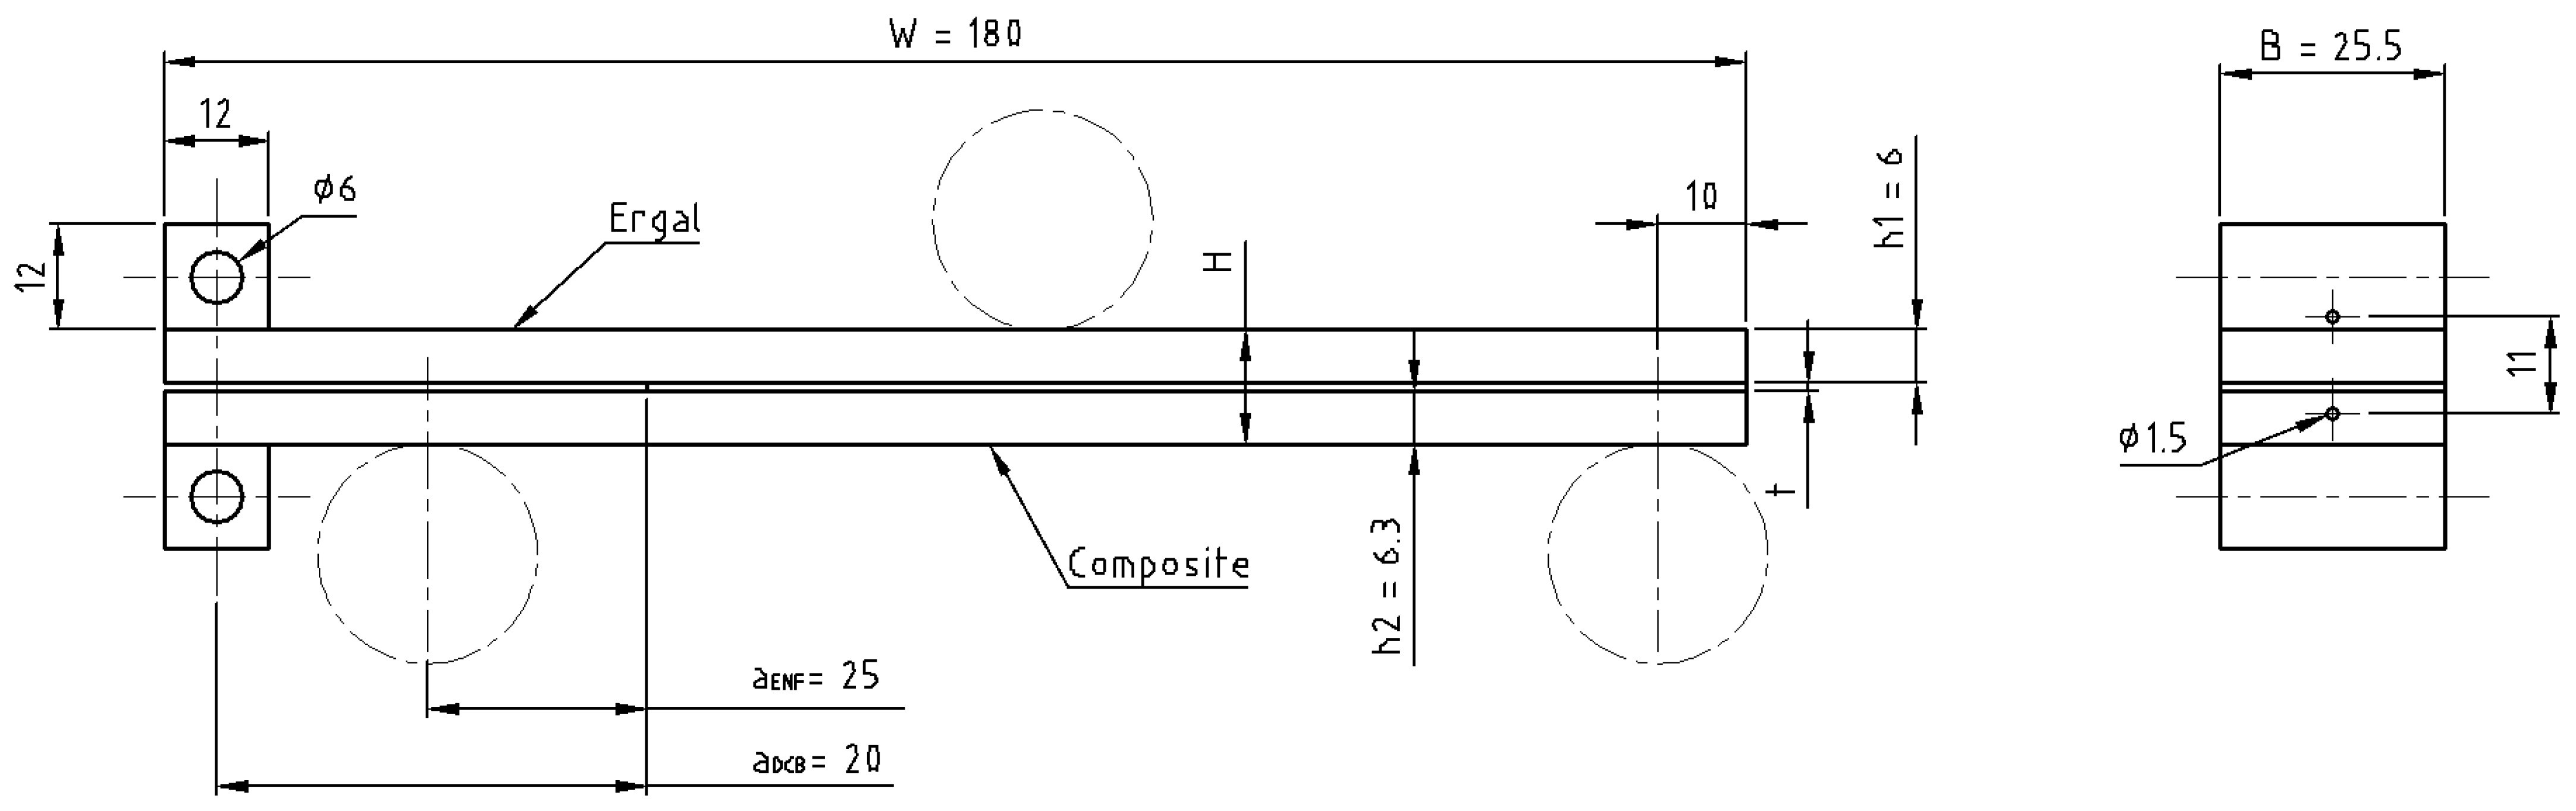
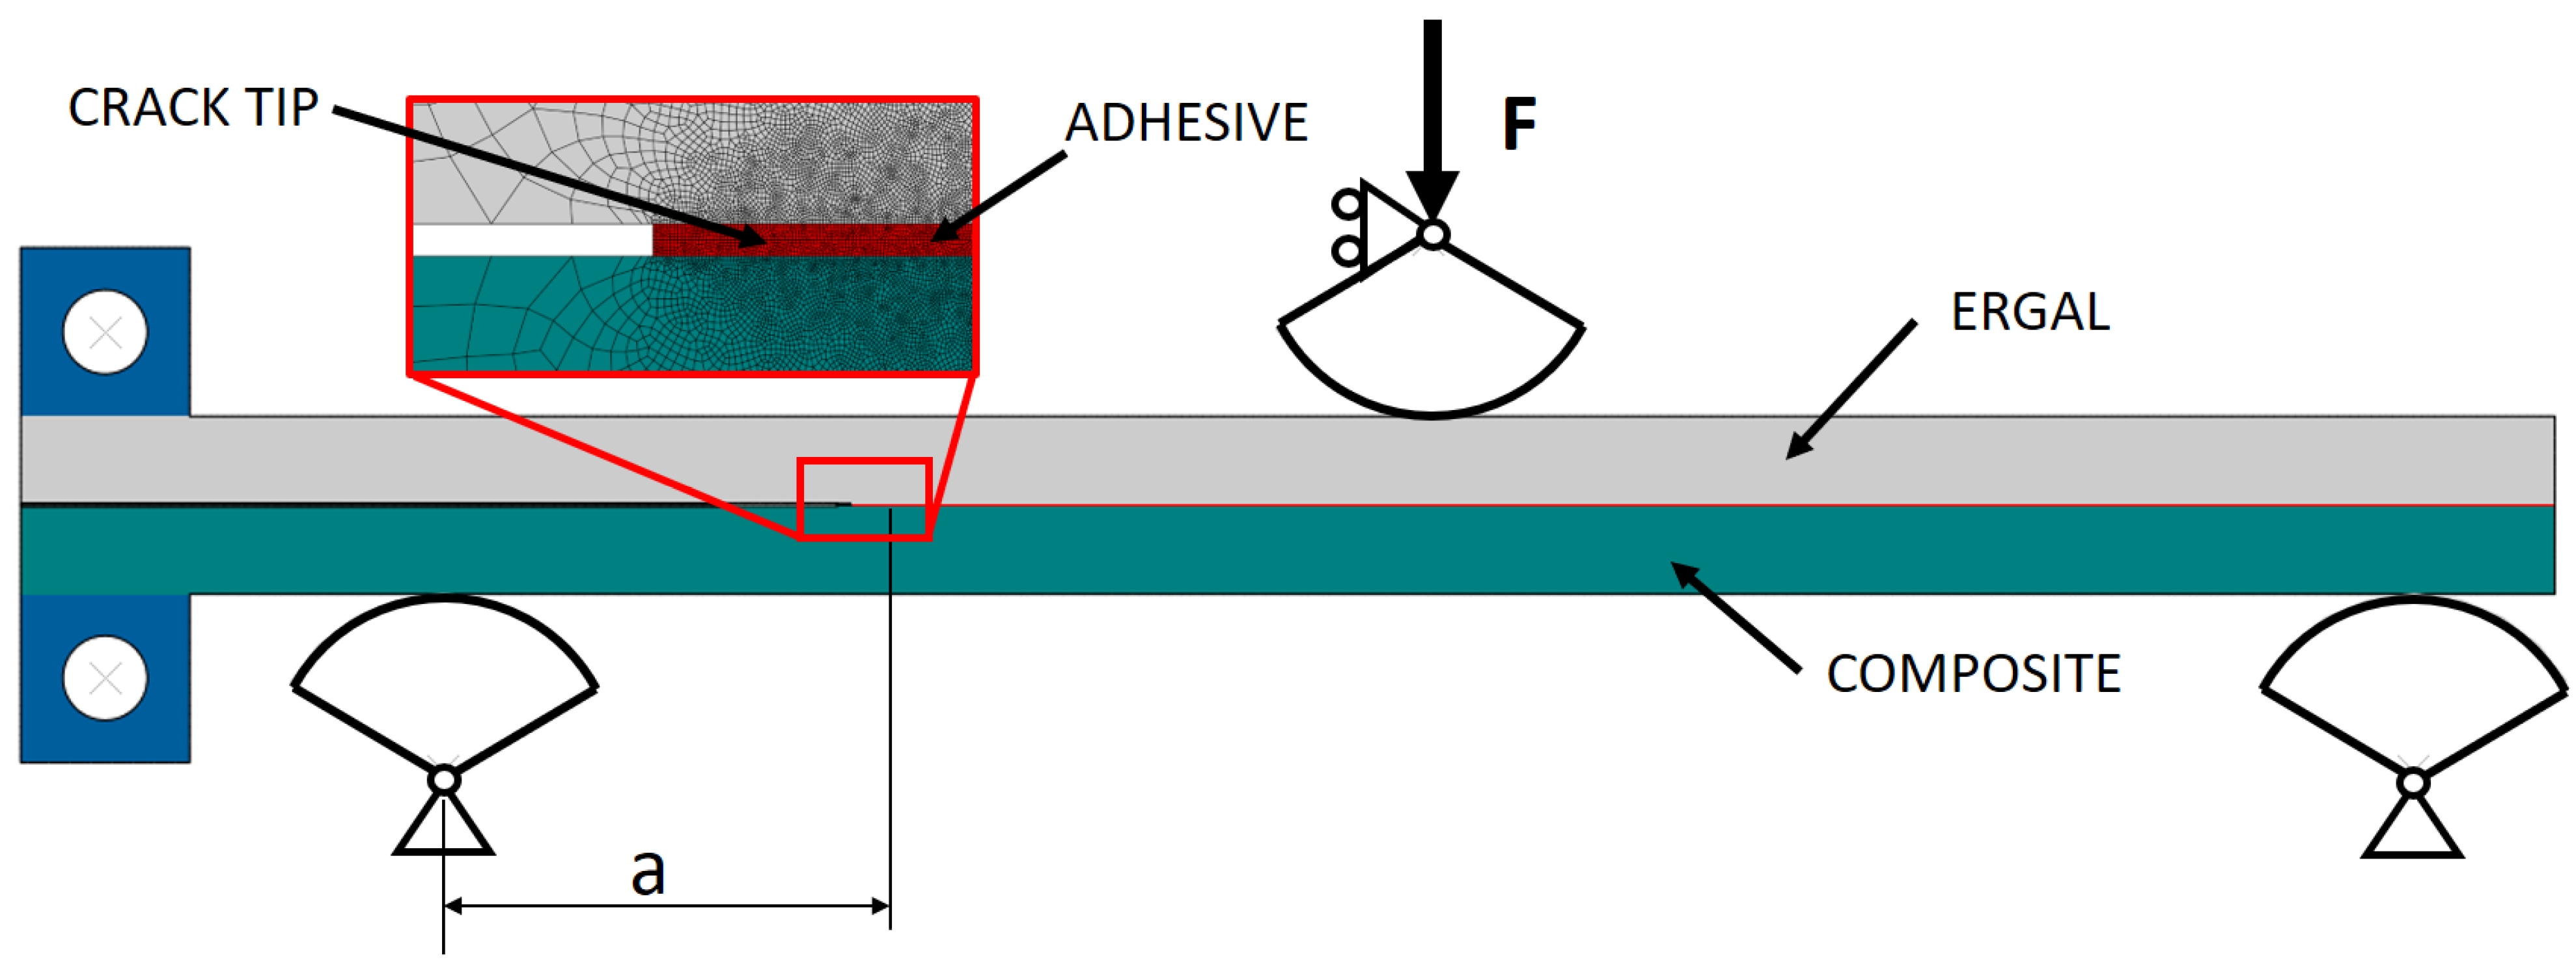
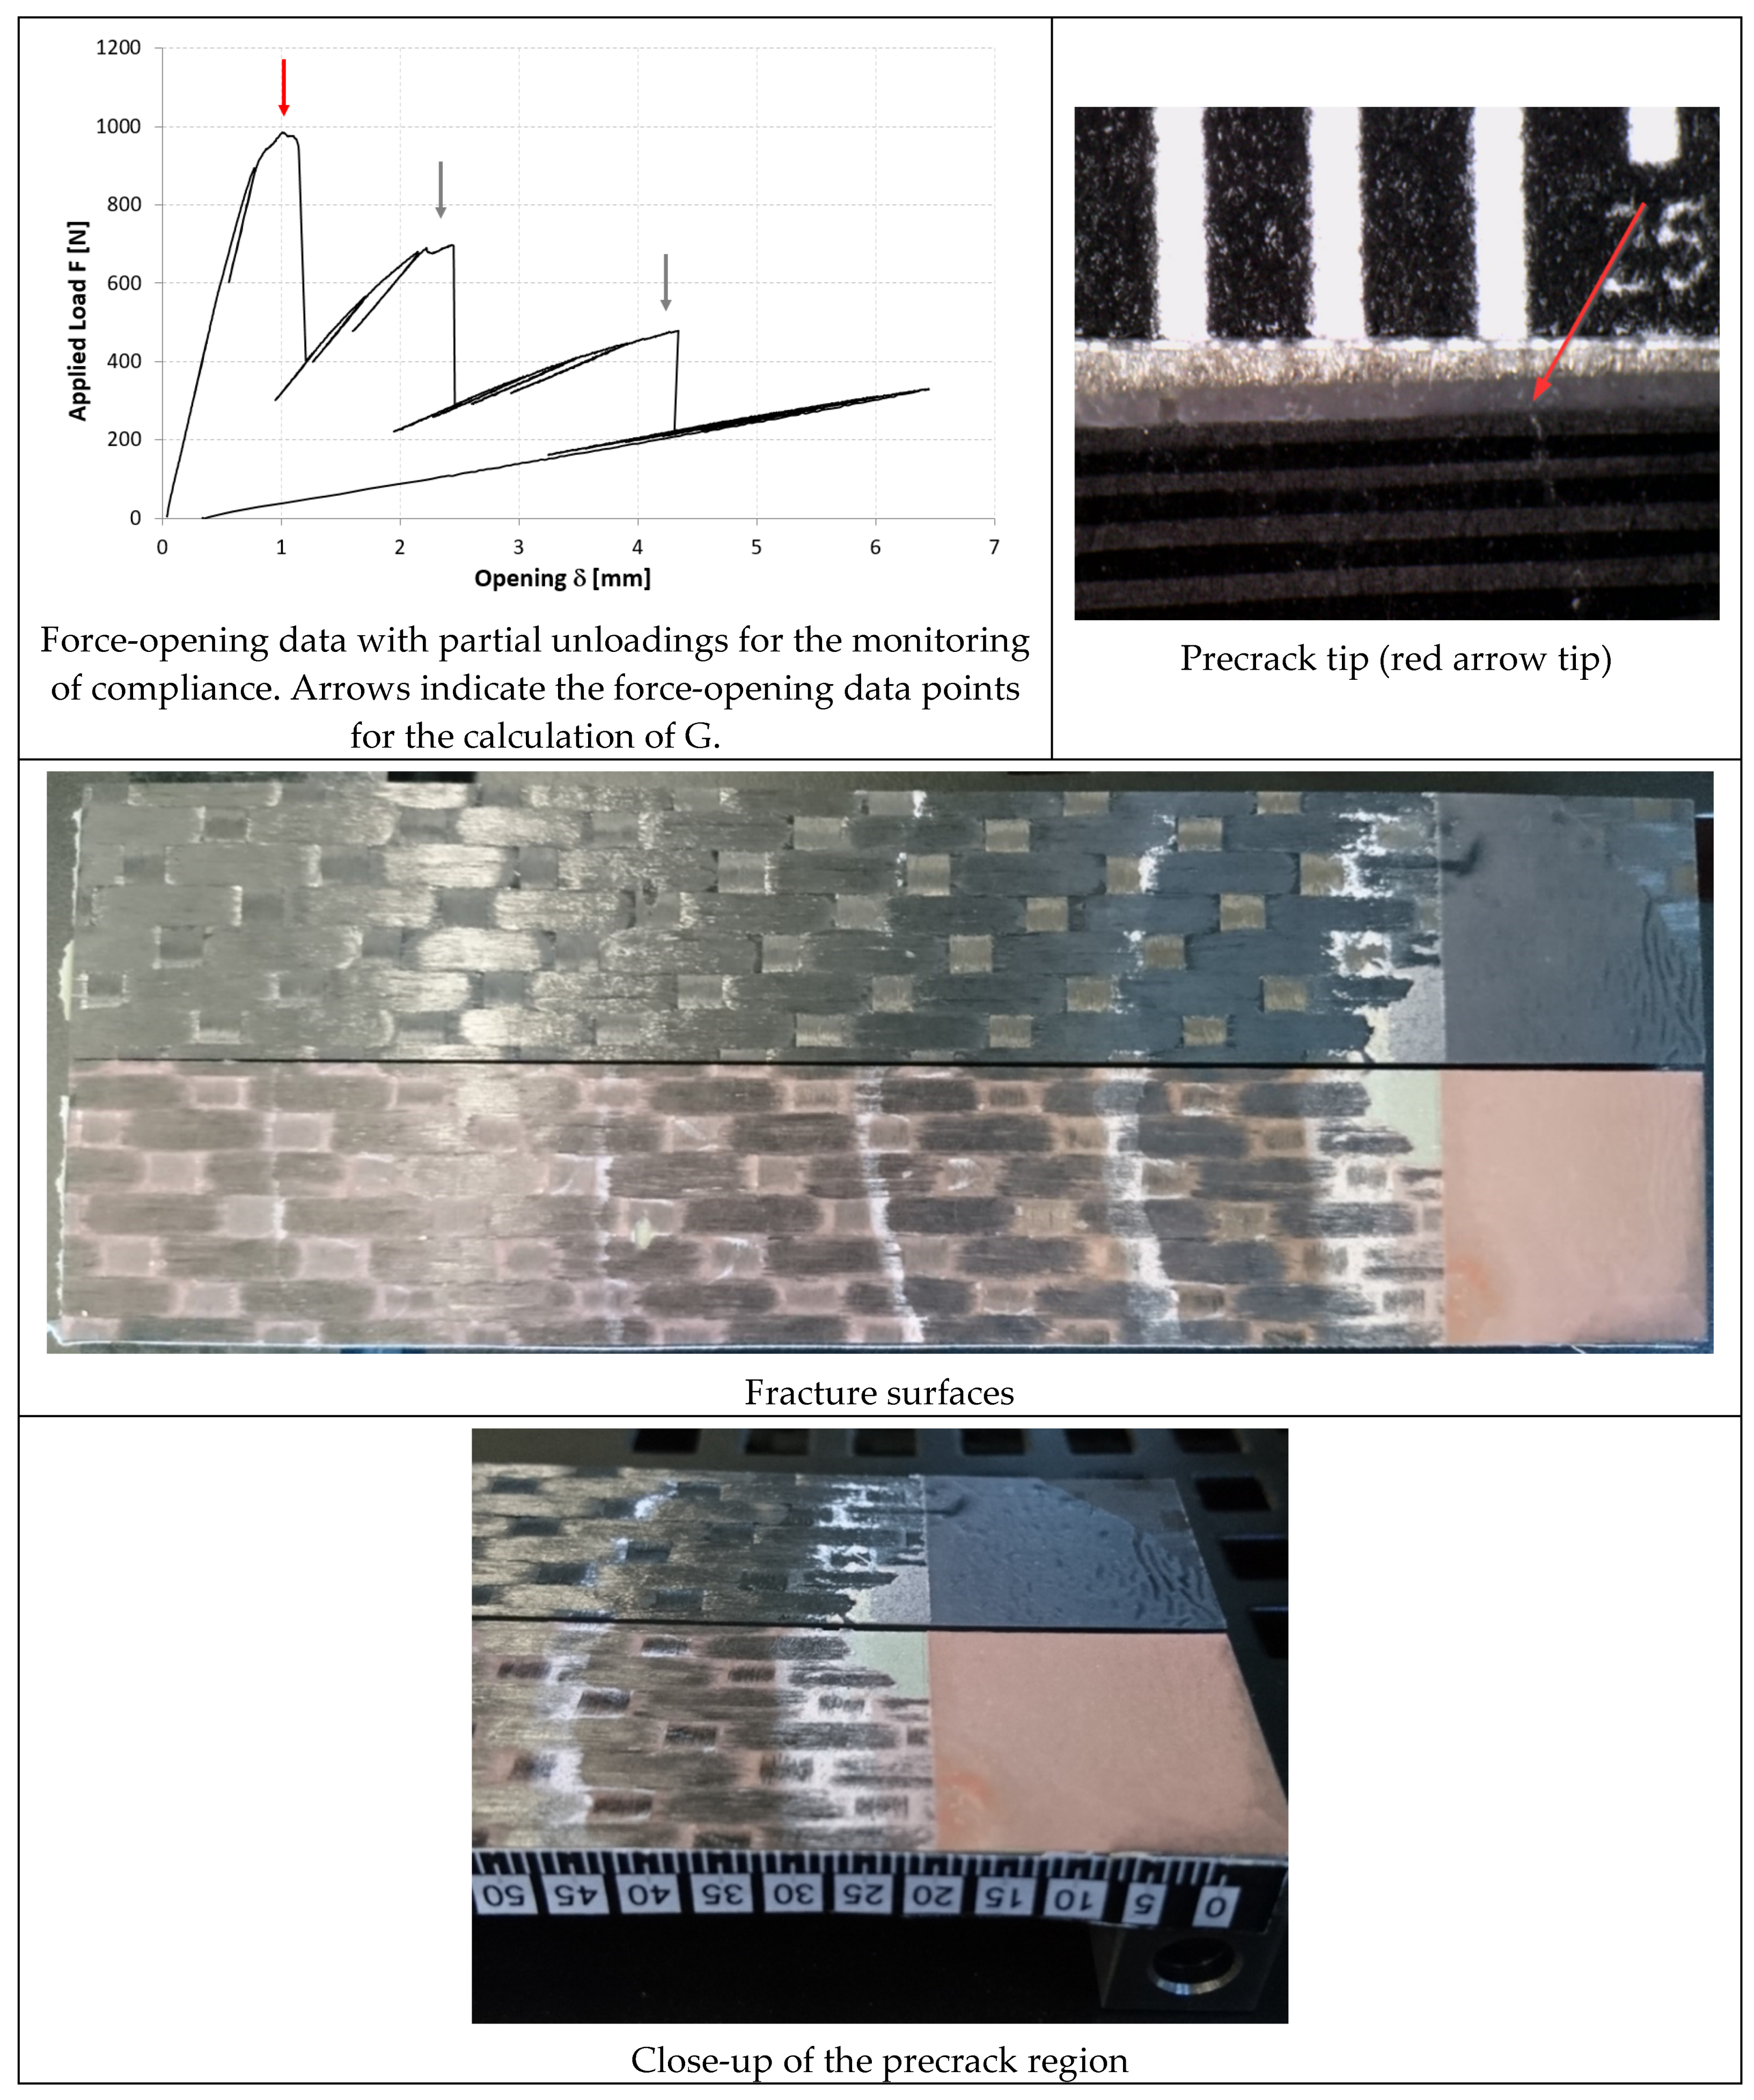
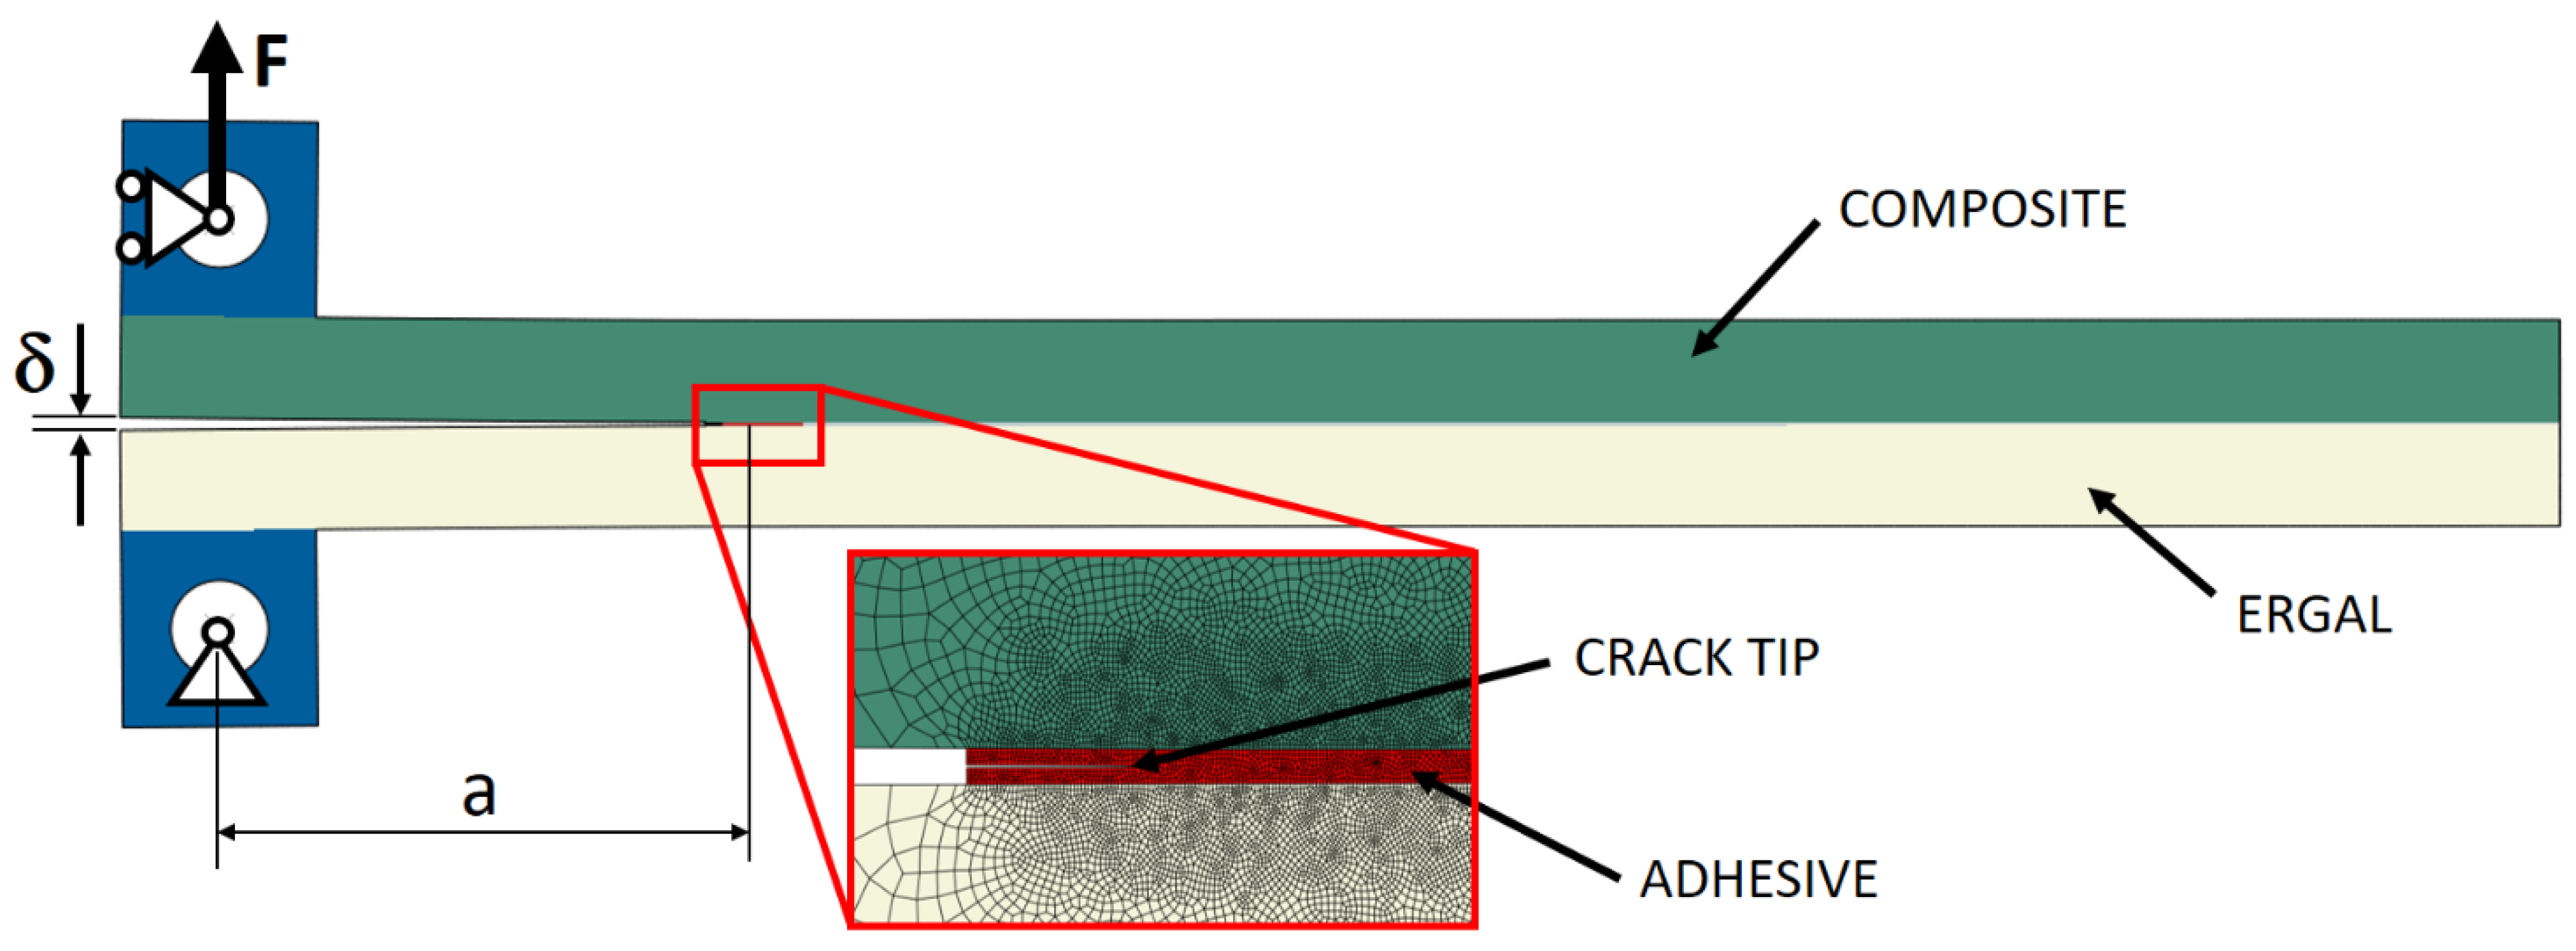
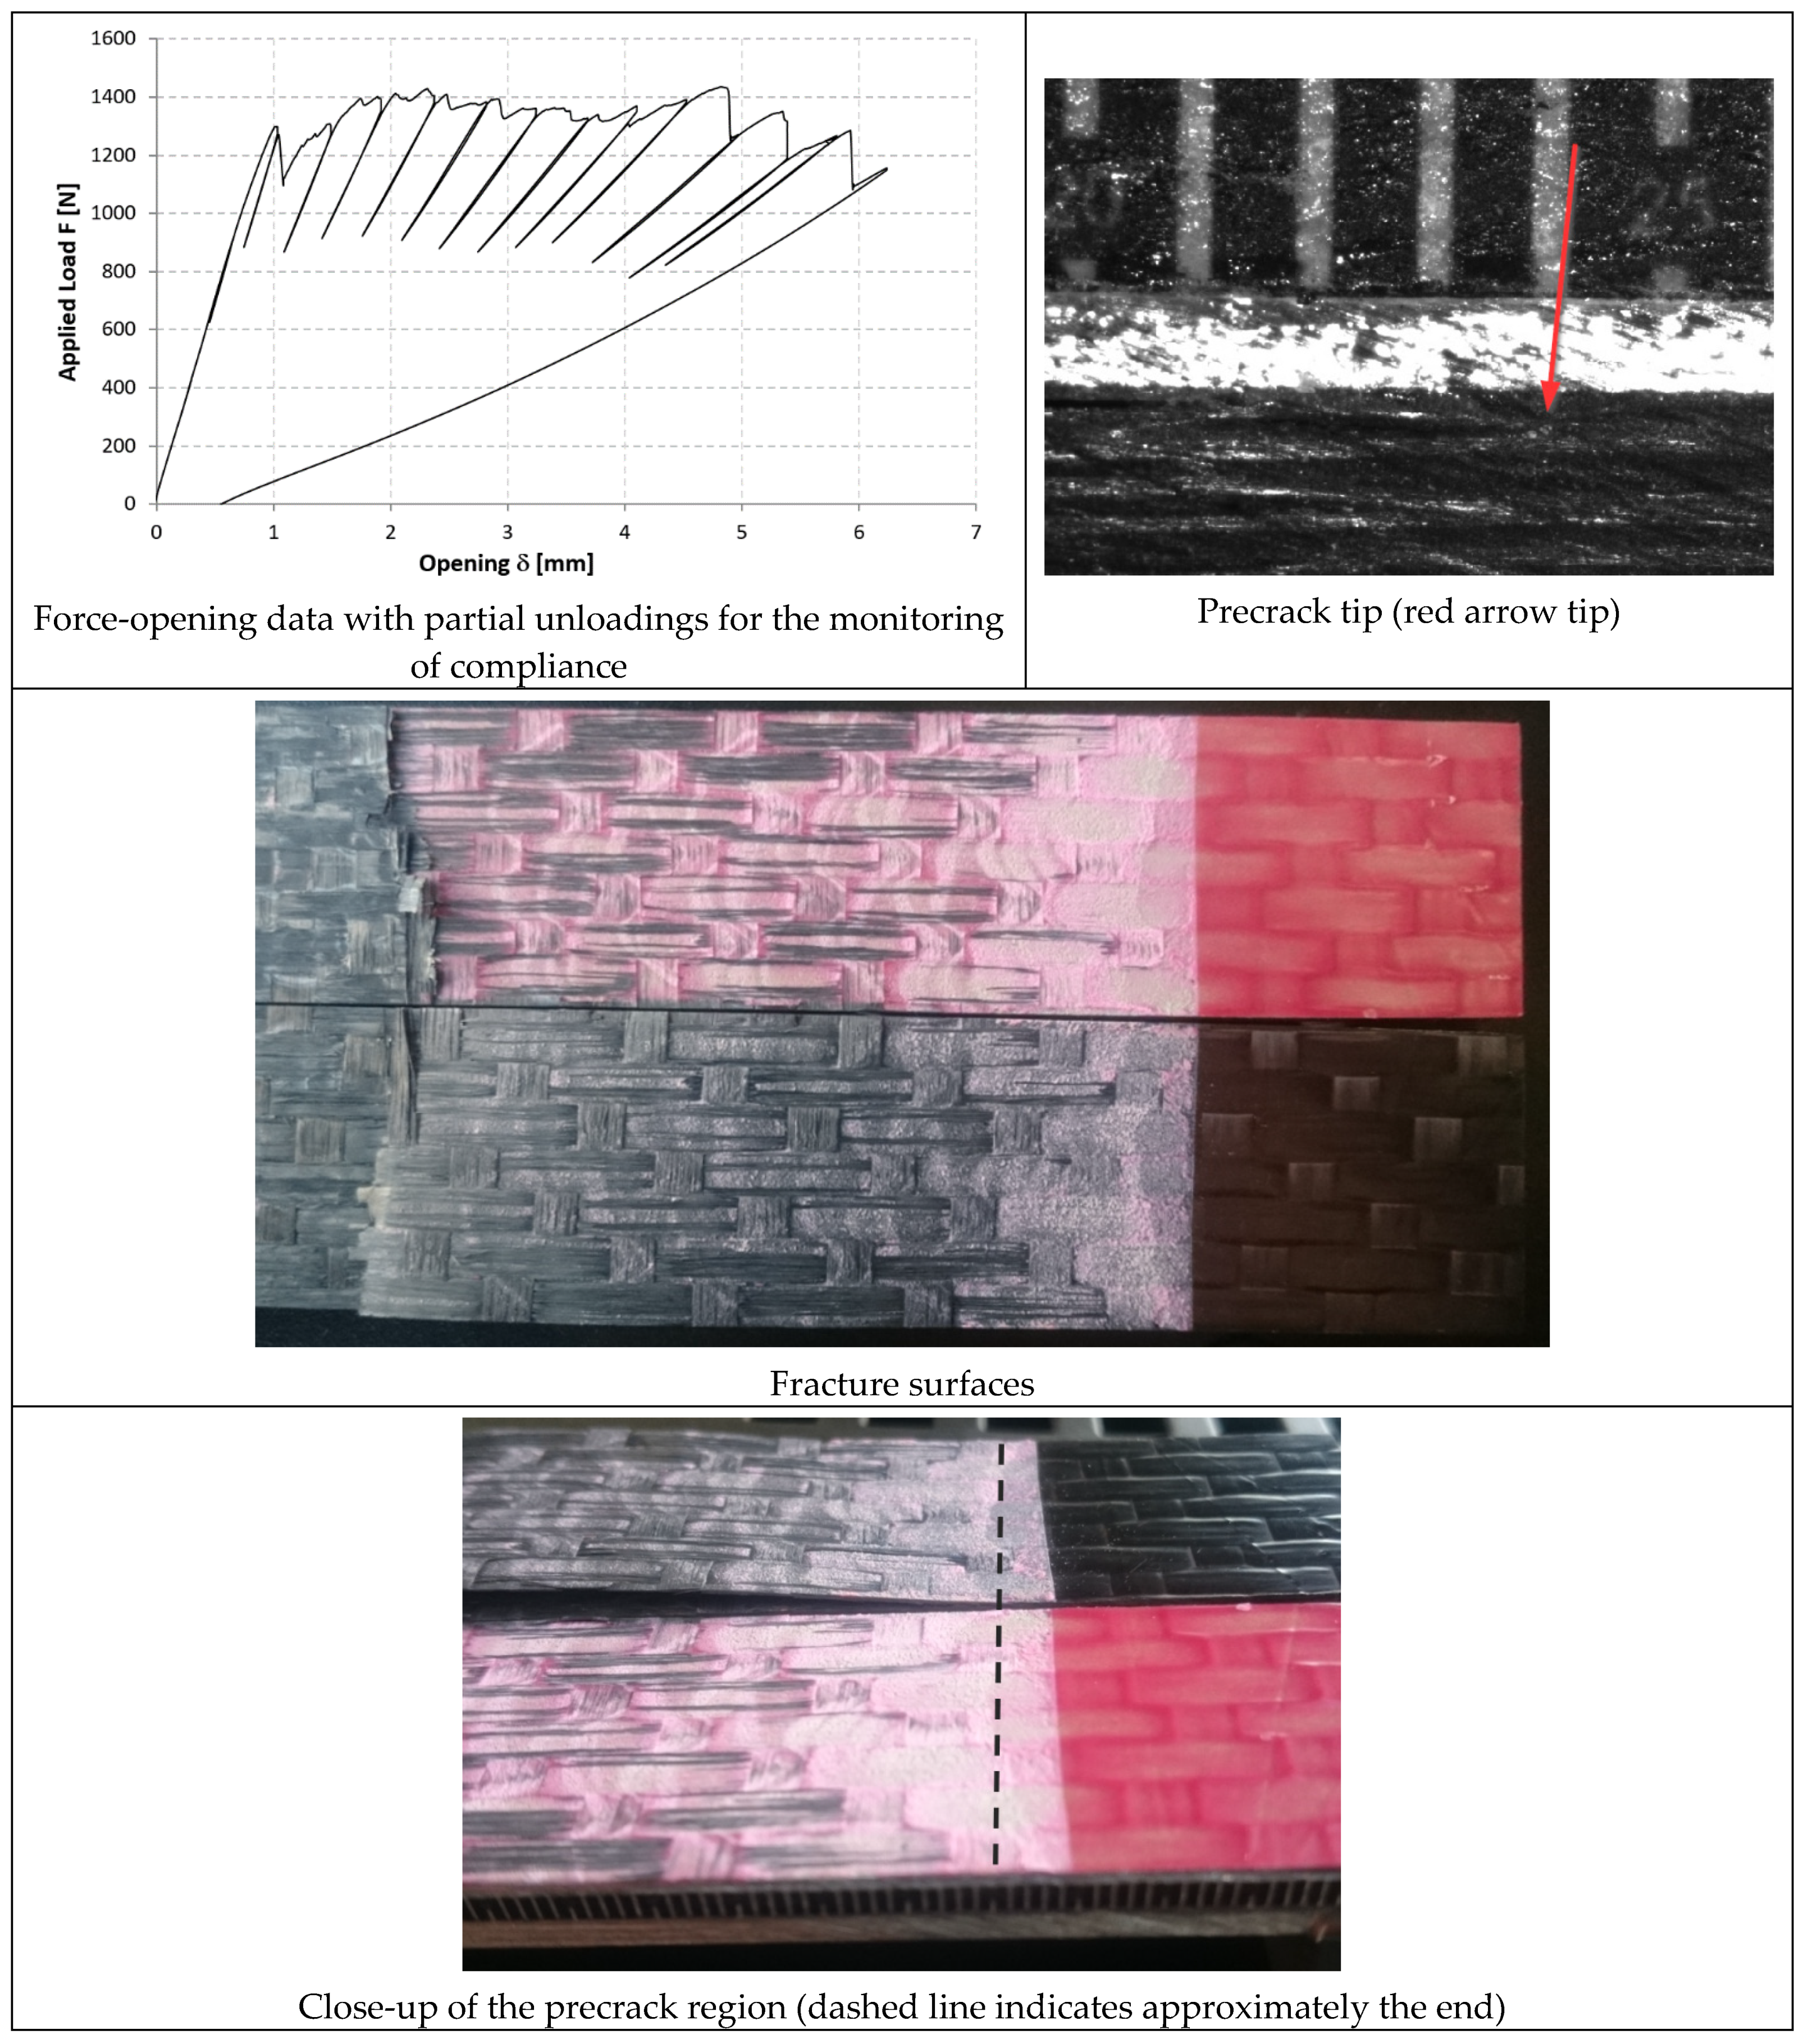
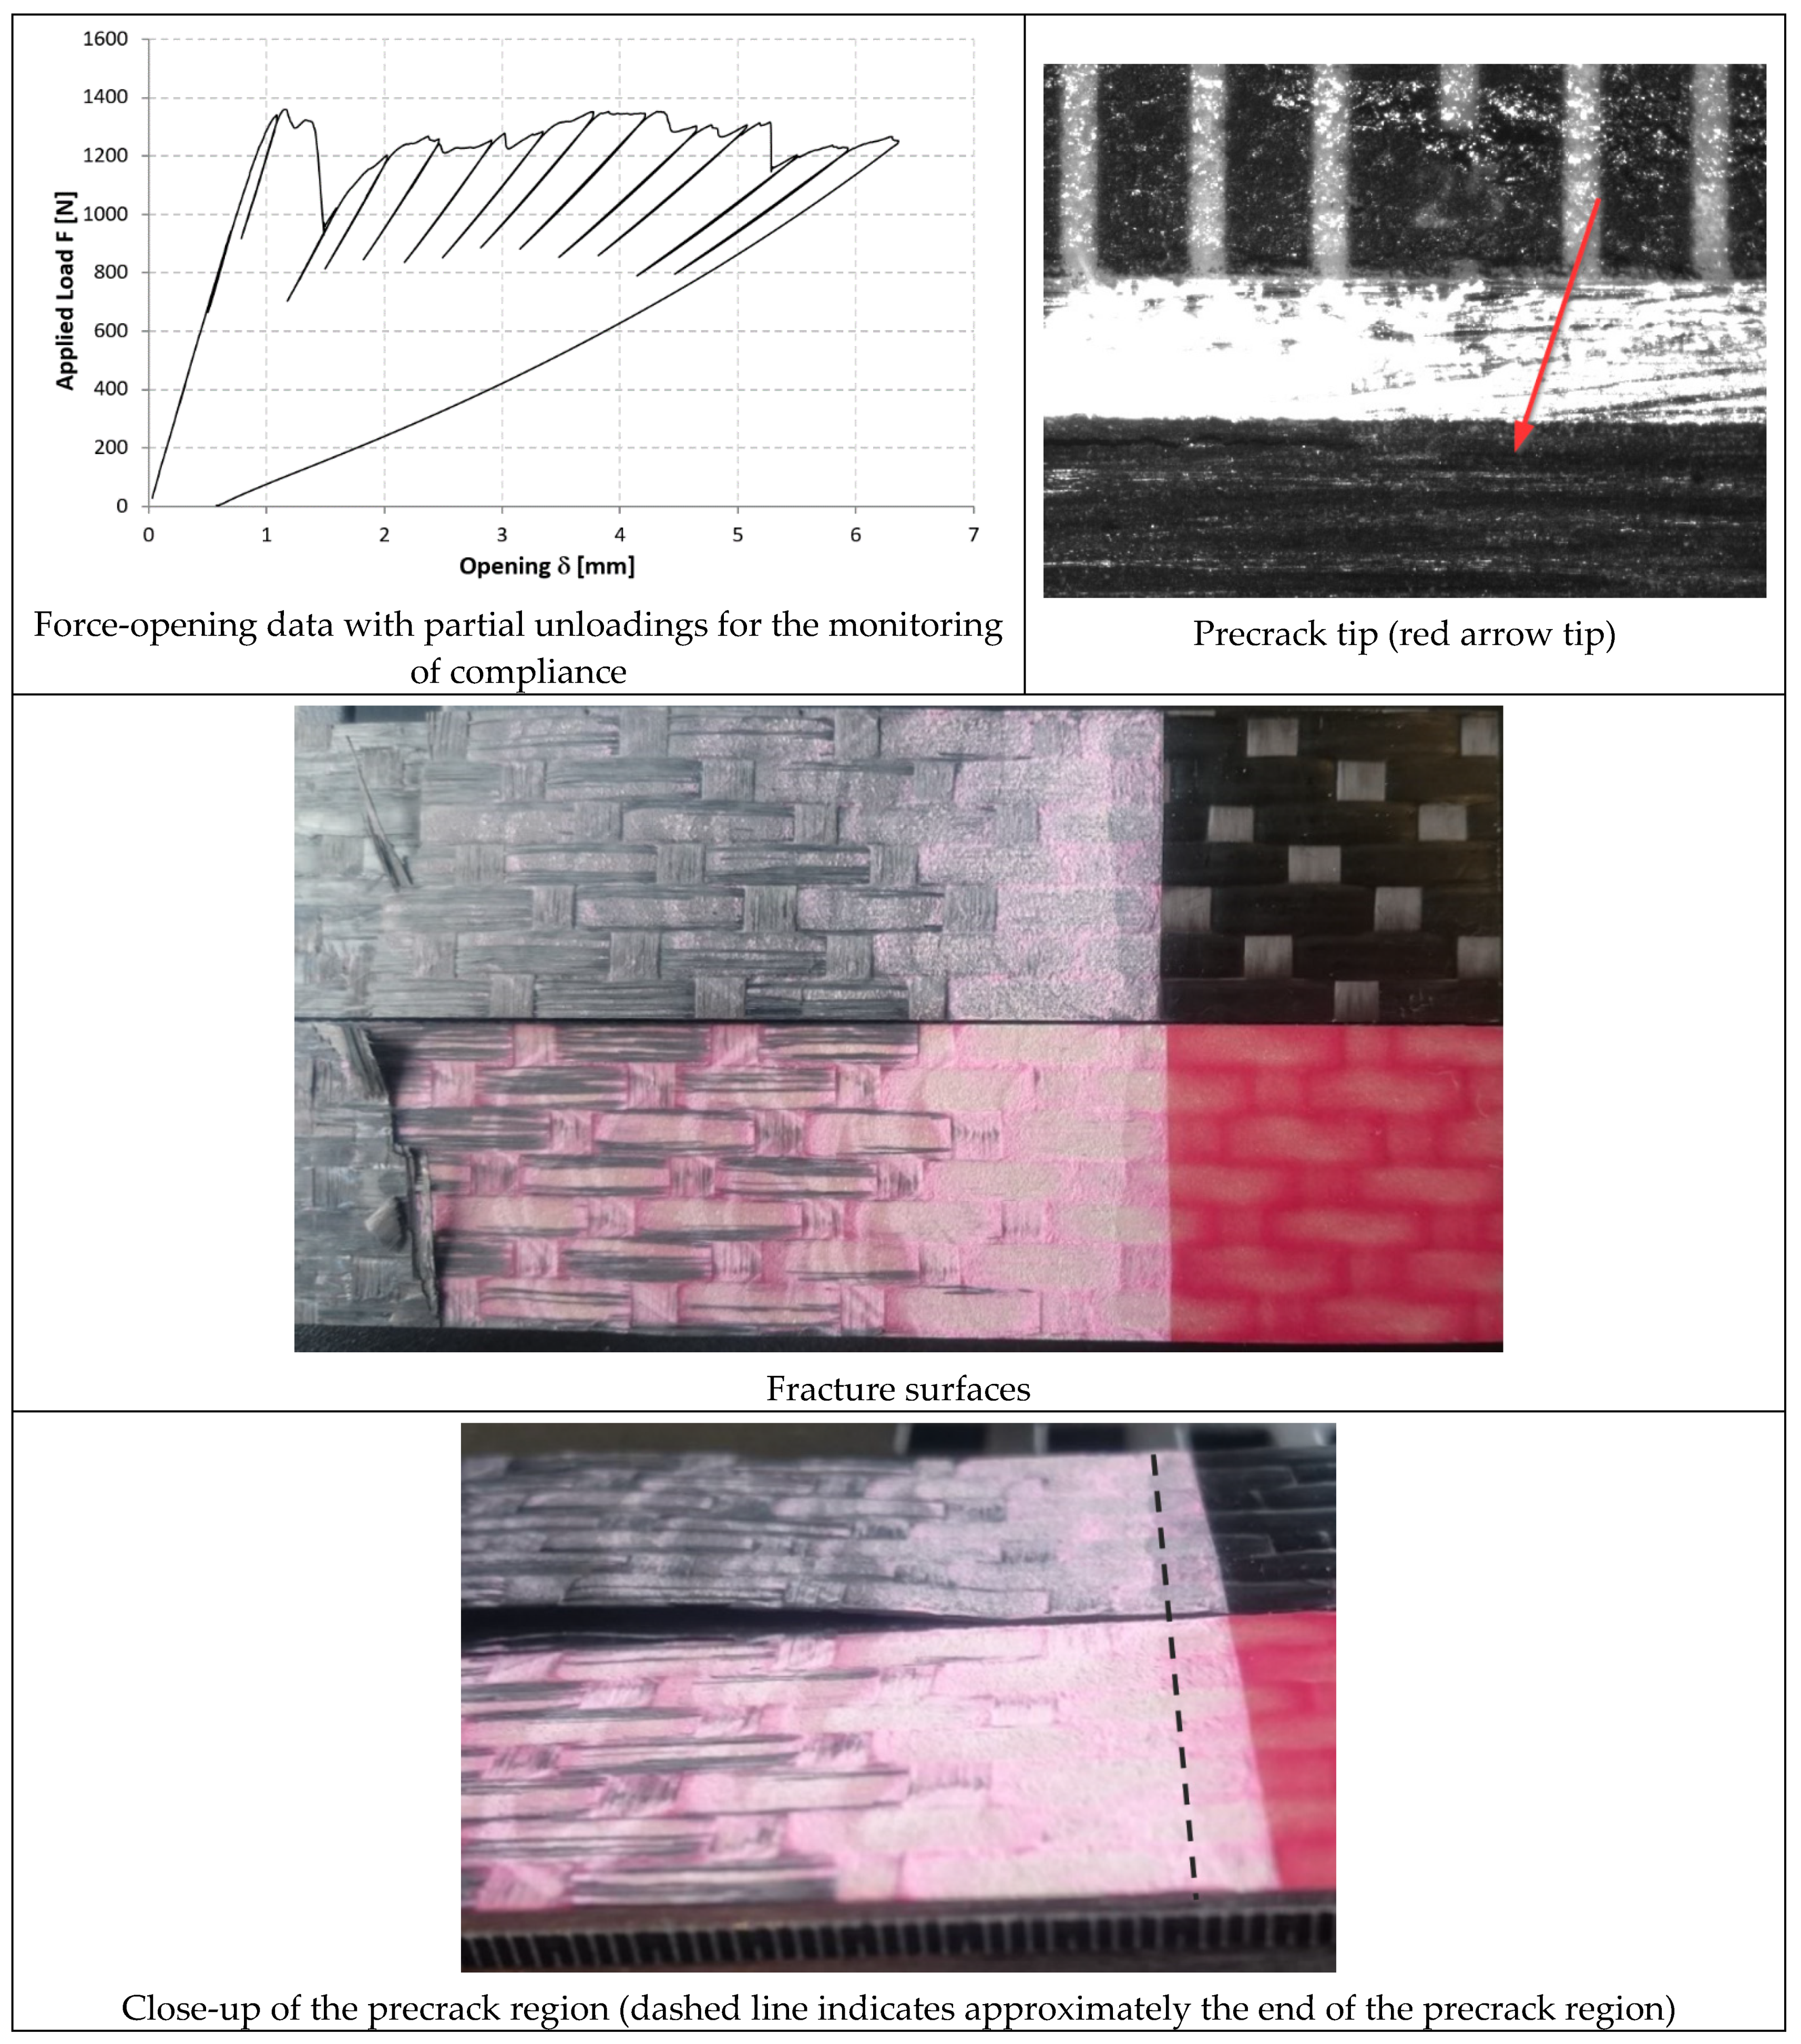
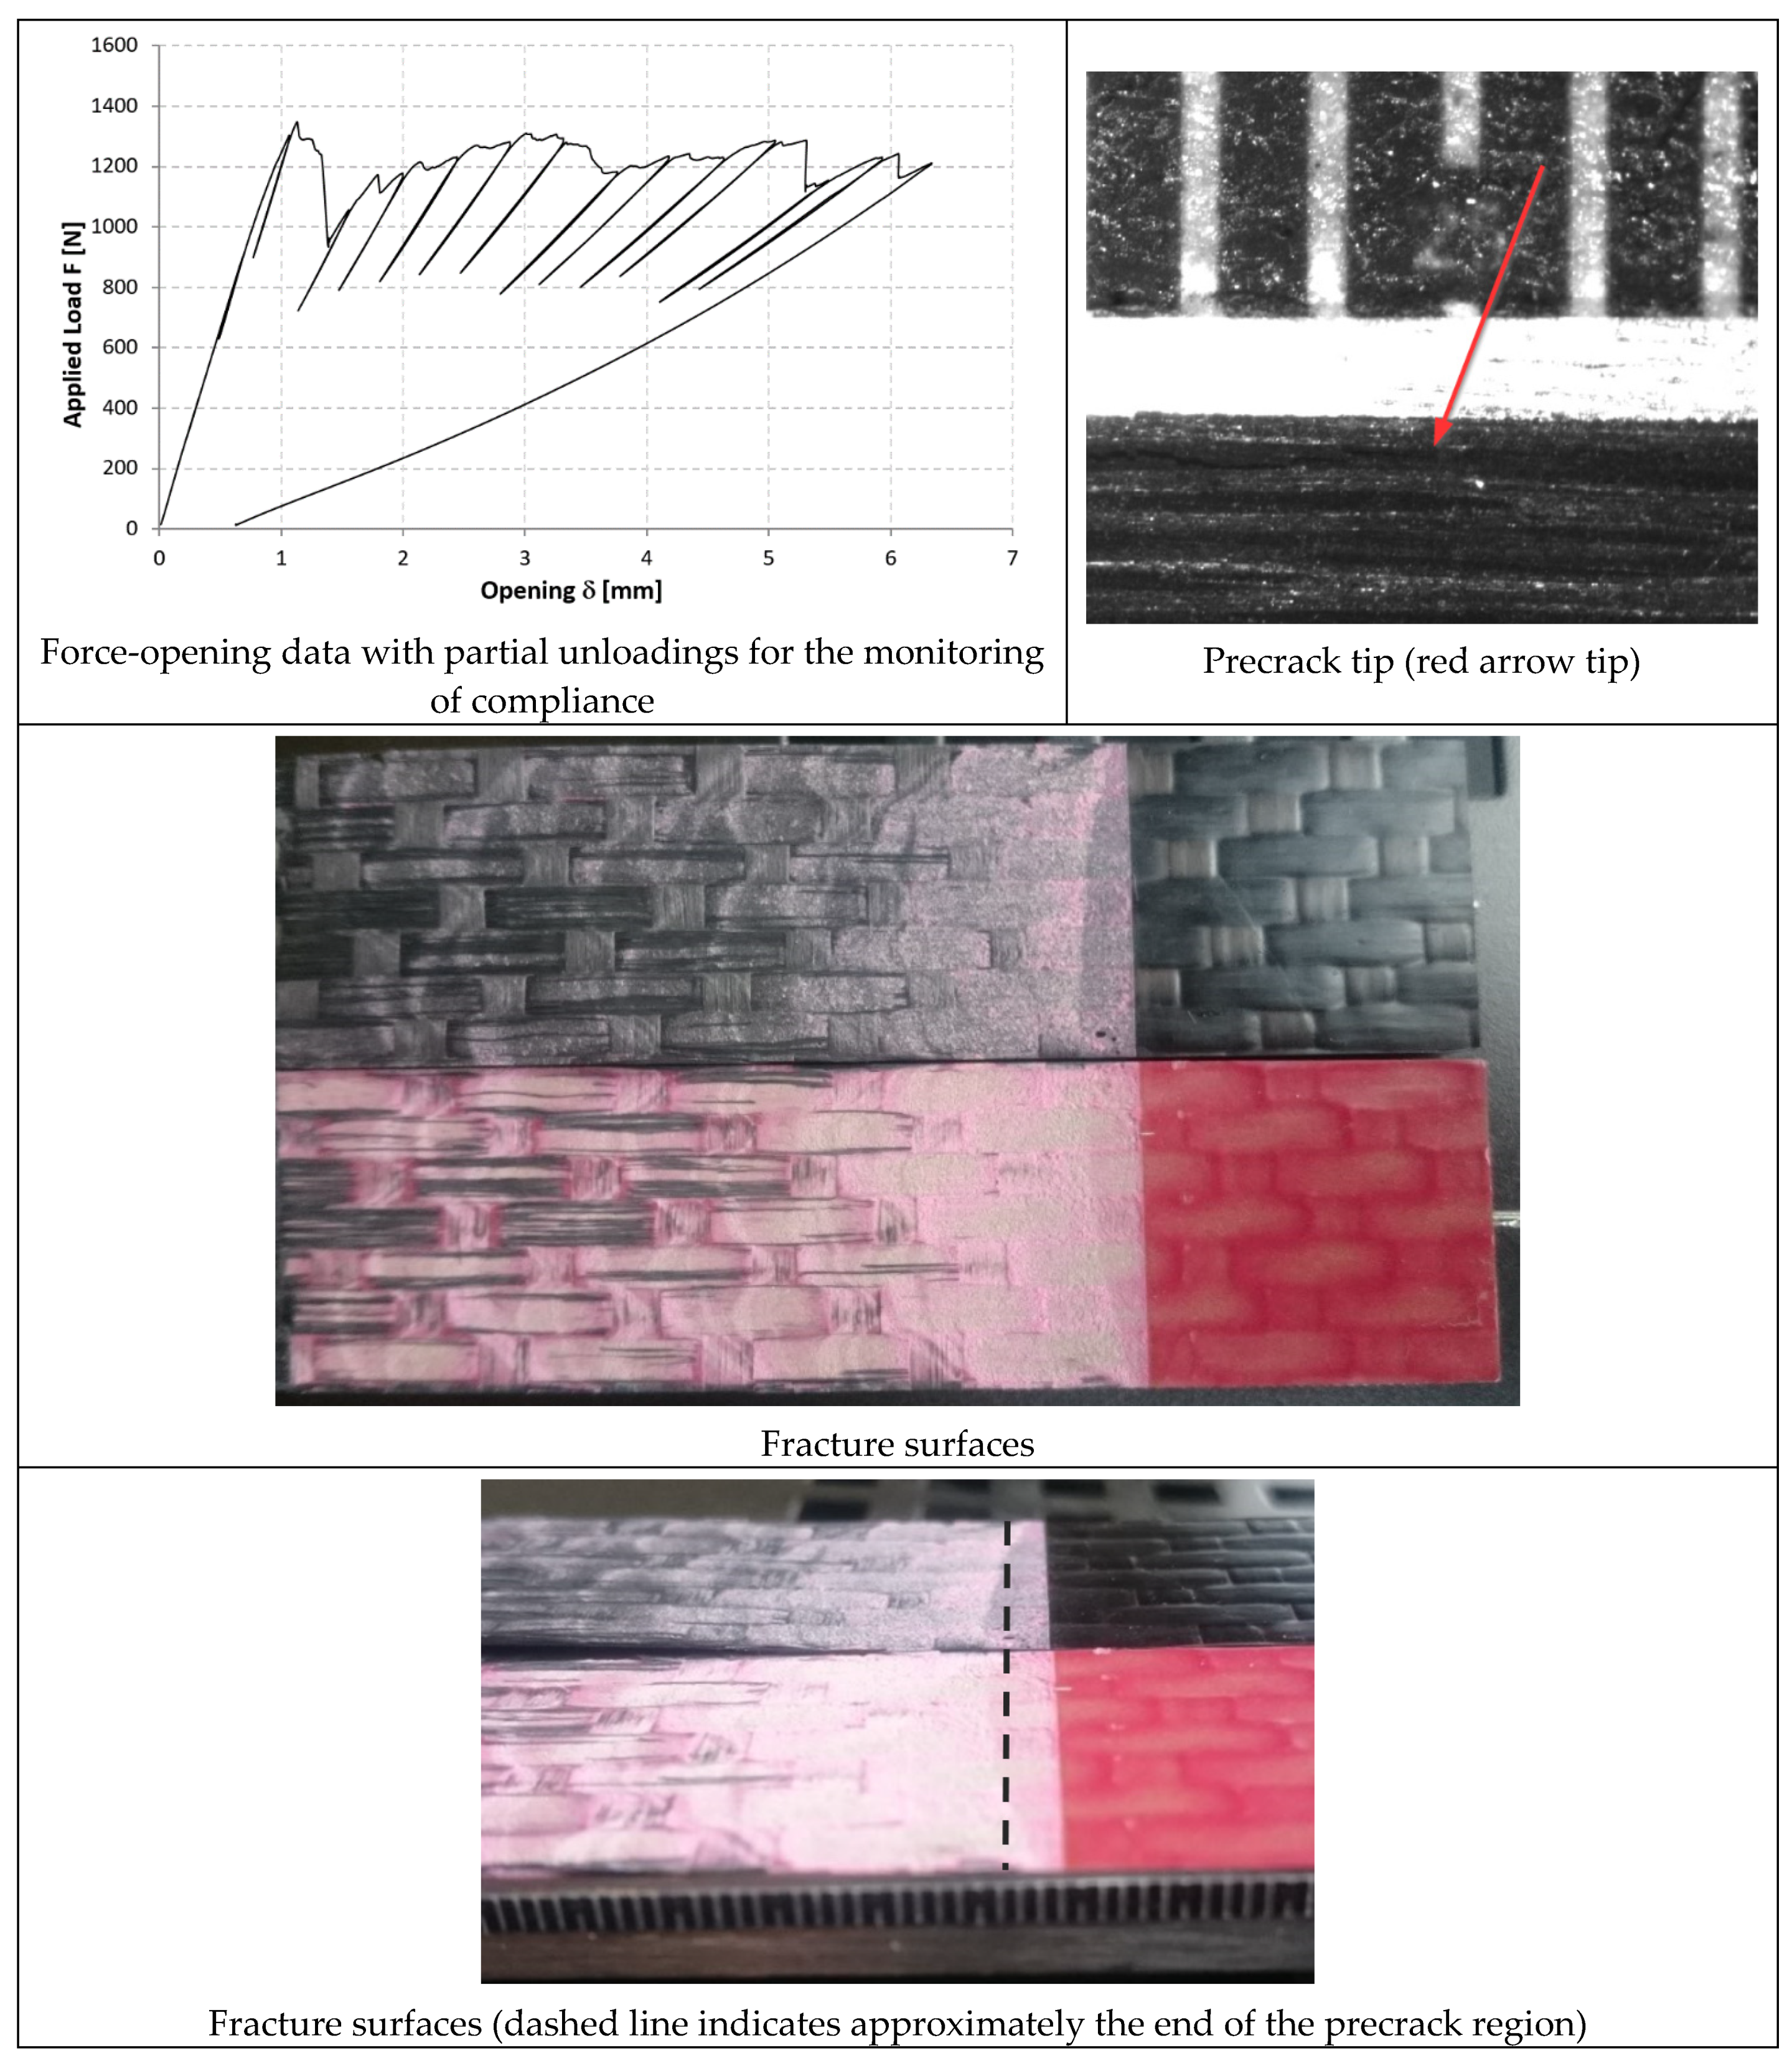
2.2.3. Fracture Toughness Testing and Data Reduction
- (i)
- The crack-length vs. the compliance relationship for the specific joint geometry. In this case, several configurations having different crack lengths were run, and the relationship between the crack length (a) and the joint compliance (δ/F) was obtained. The points were then interpolated with a 5th-order polynomial that allowed the evaluation of the crack length from the experimentally measured compliance at each unloading.
- (ii)
- GI and GII were evaluated by modelling the crack length evaluated at point (i) and the value of force before each unloading. The strain energy release rate was computed as the average of the J-integral output in seven contours surrounding the crack tip.
3. Results
3.1. SLJ
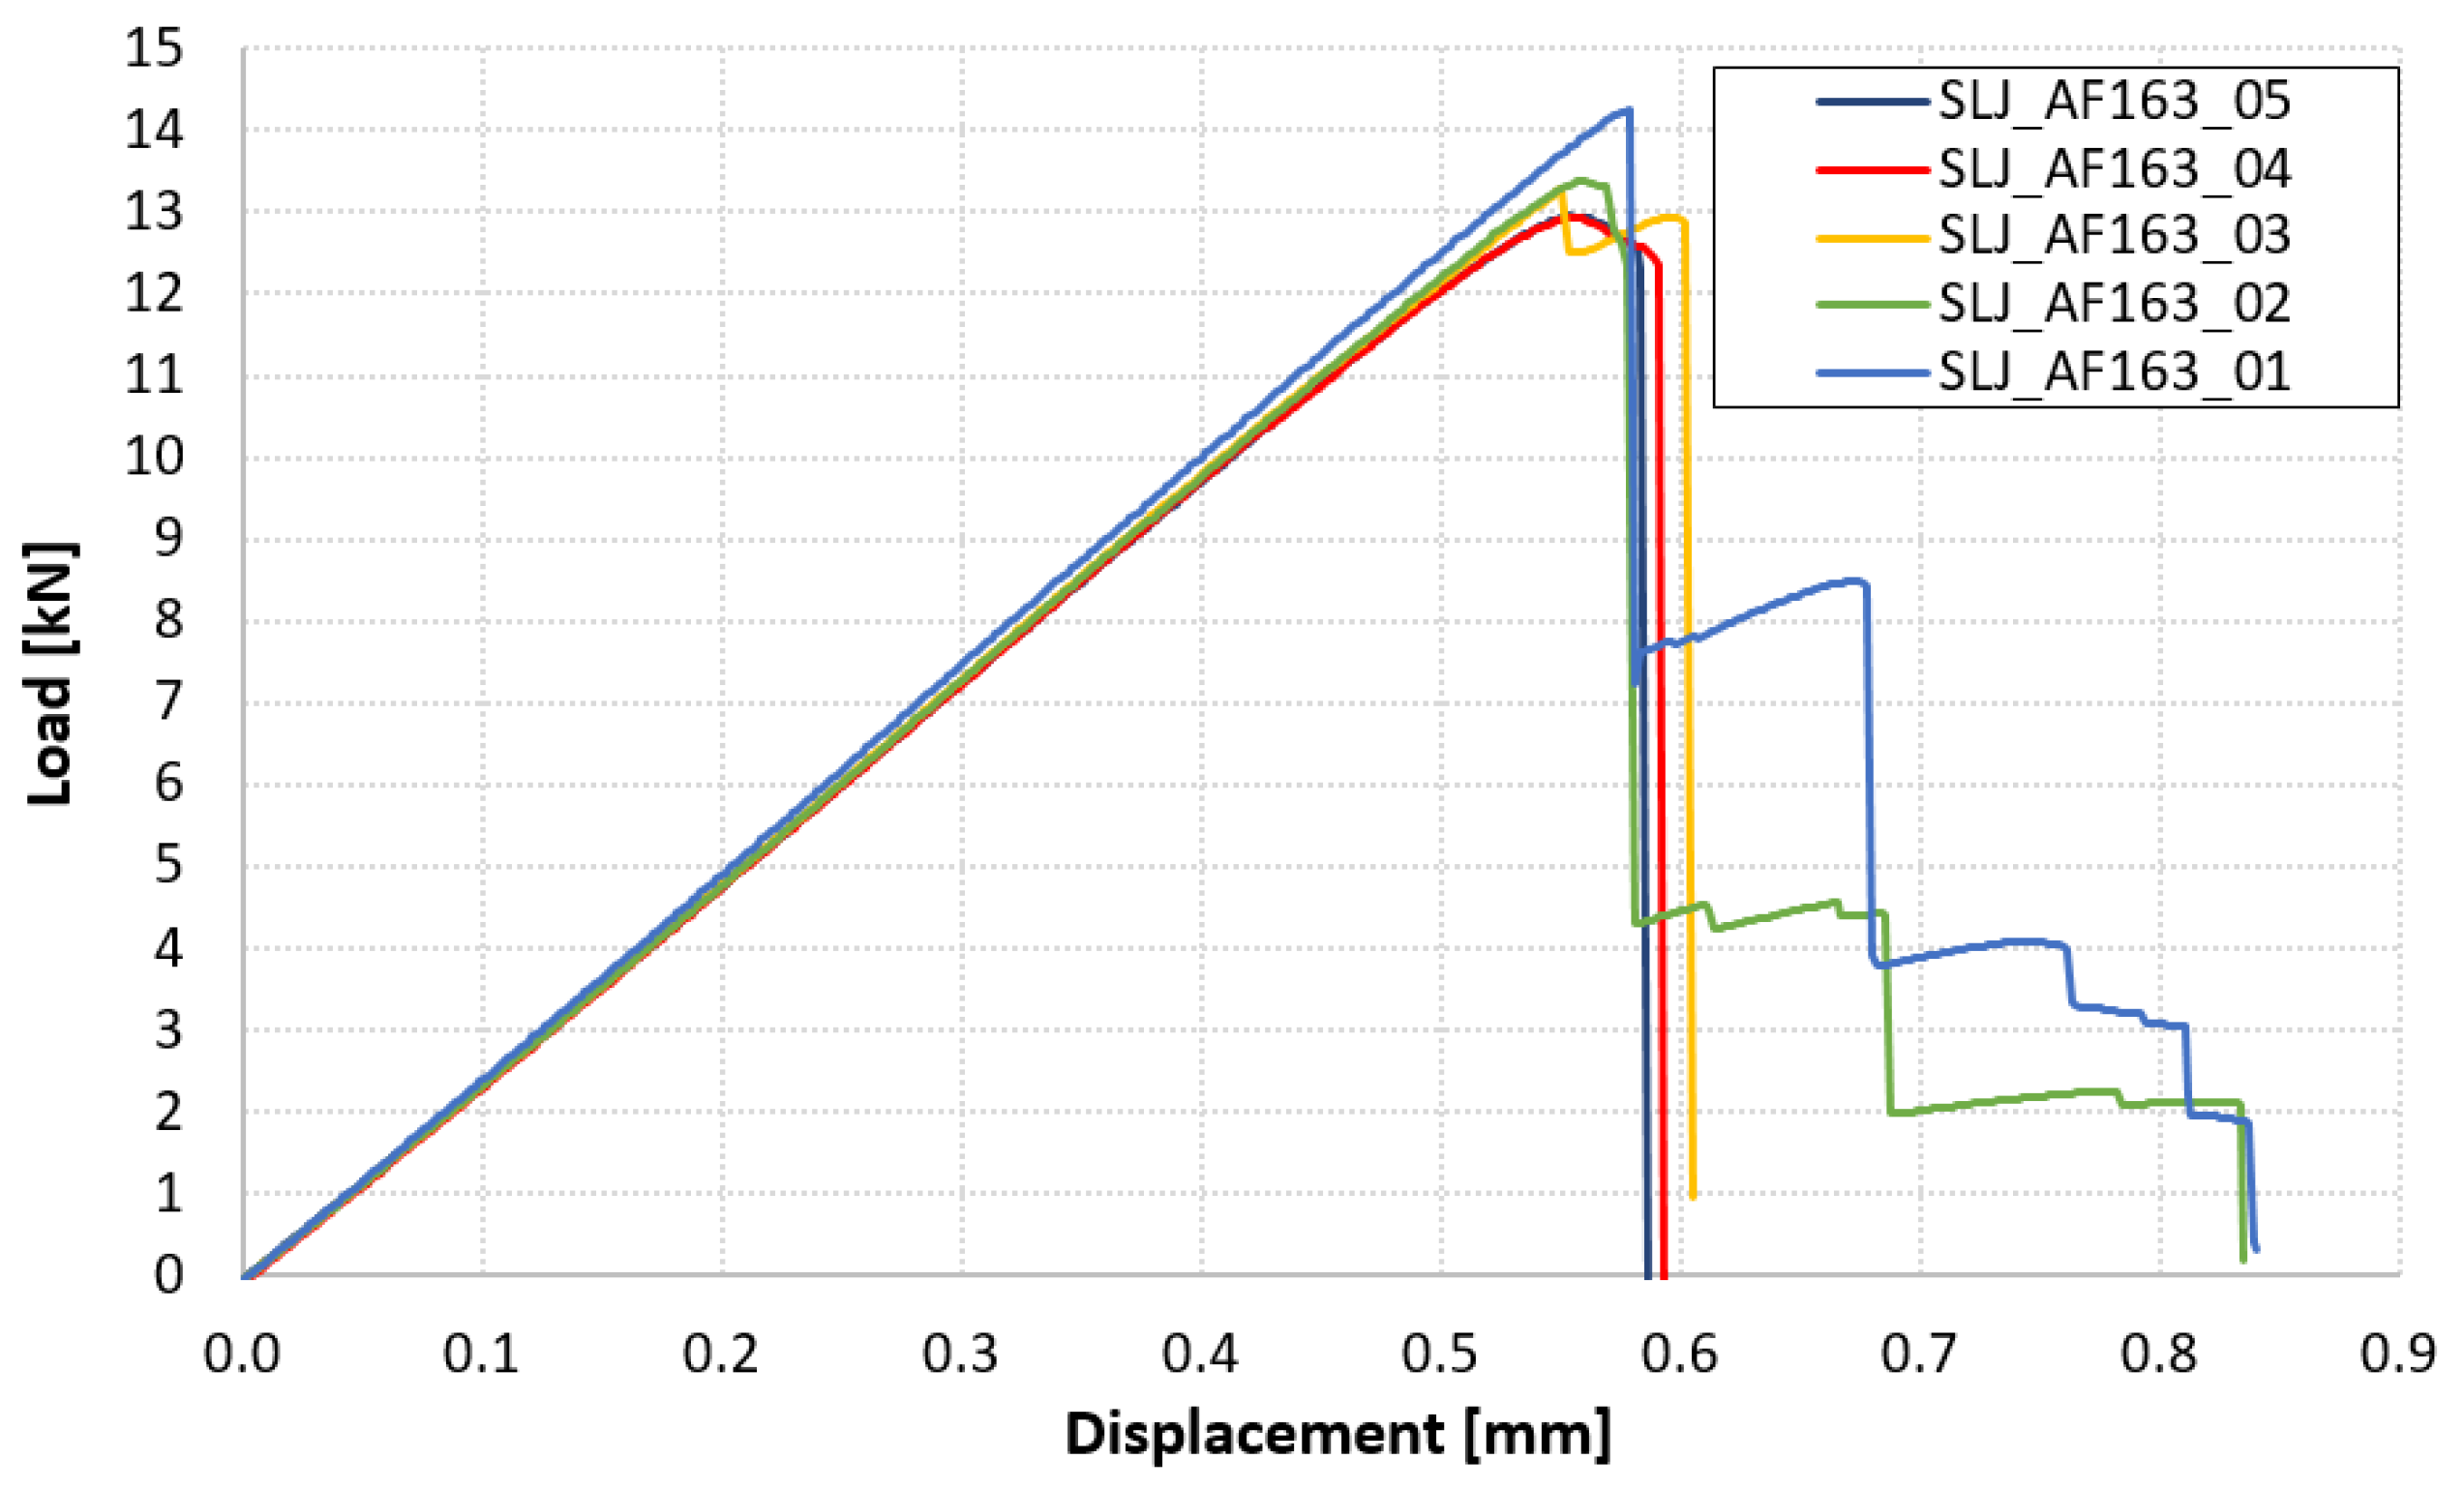
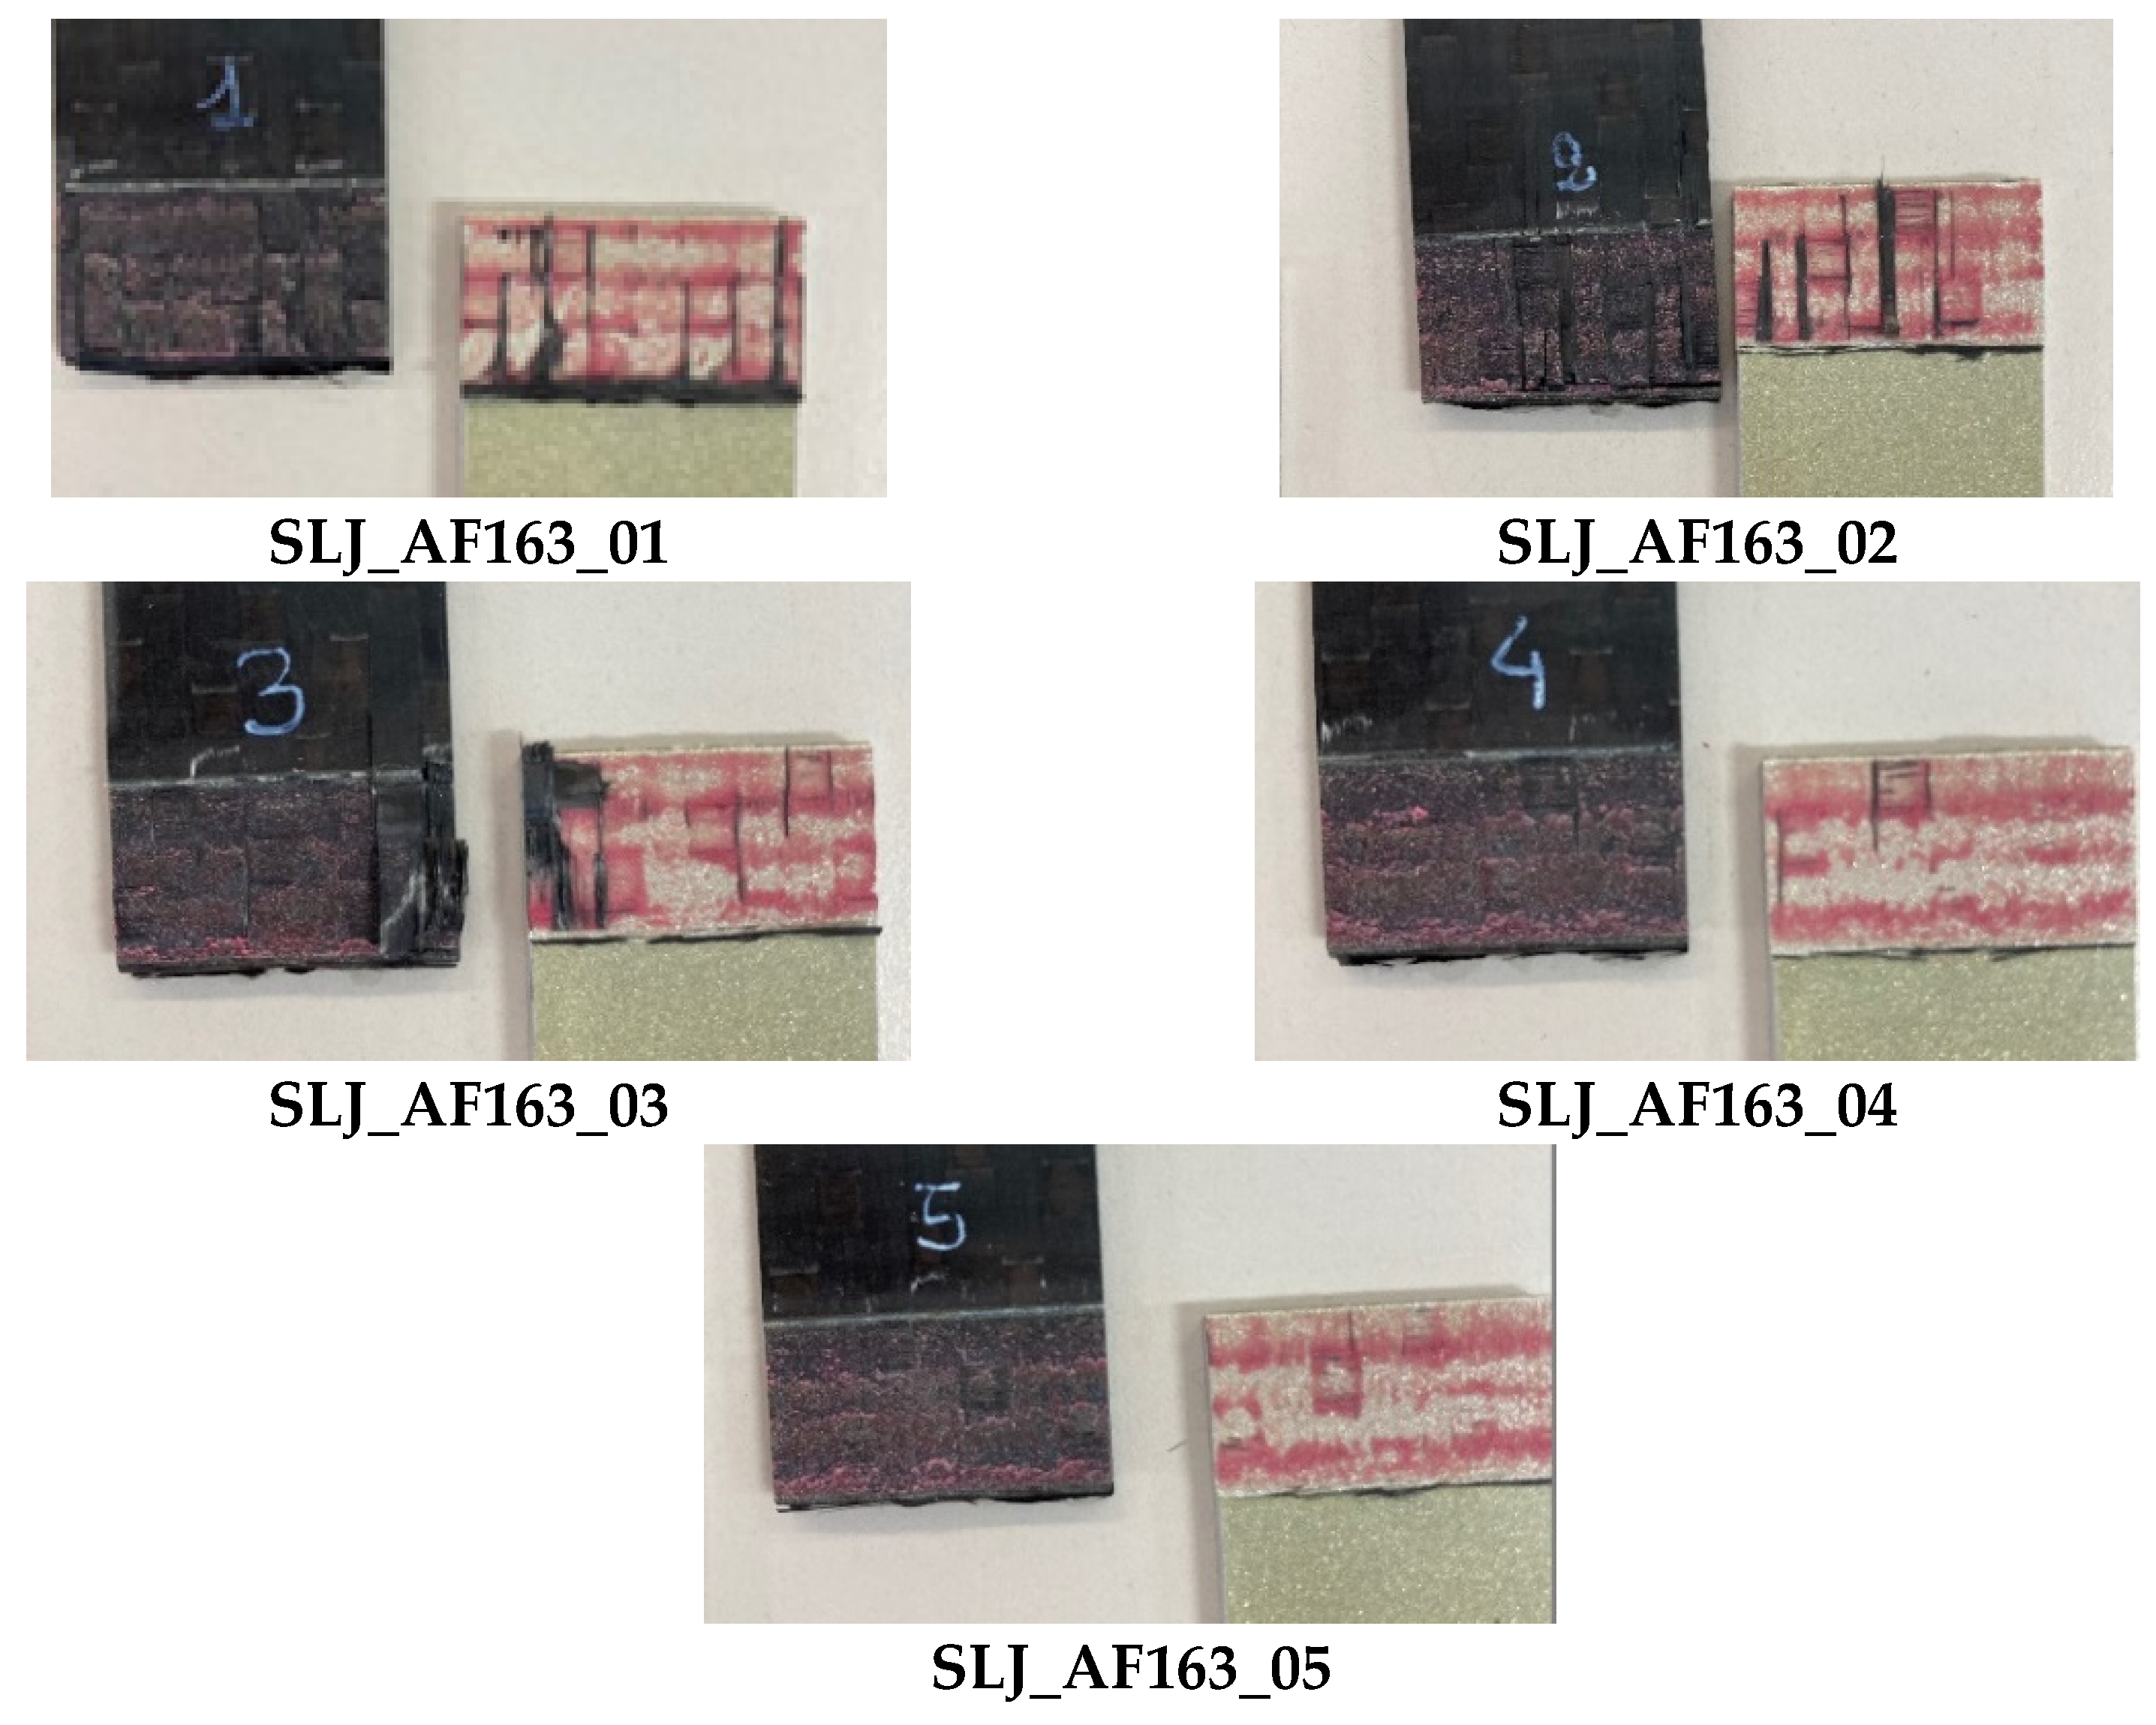
3.1.1. AF163 Adhesive
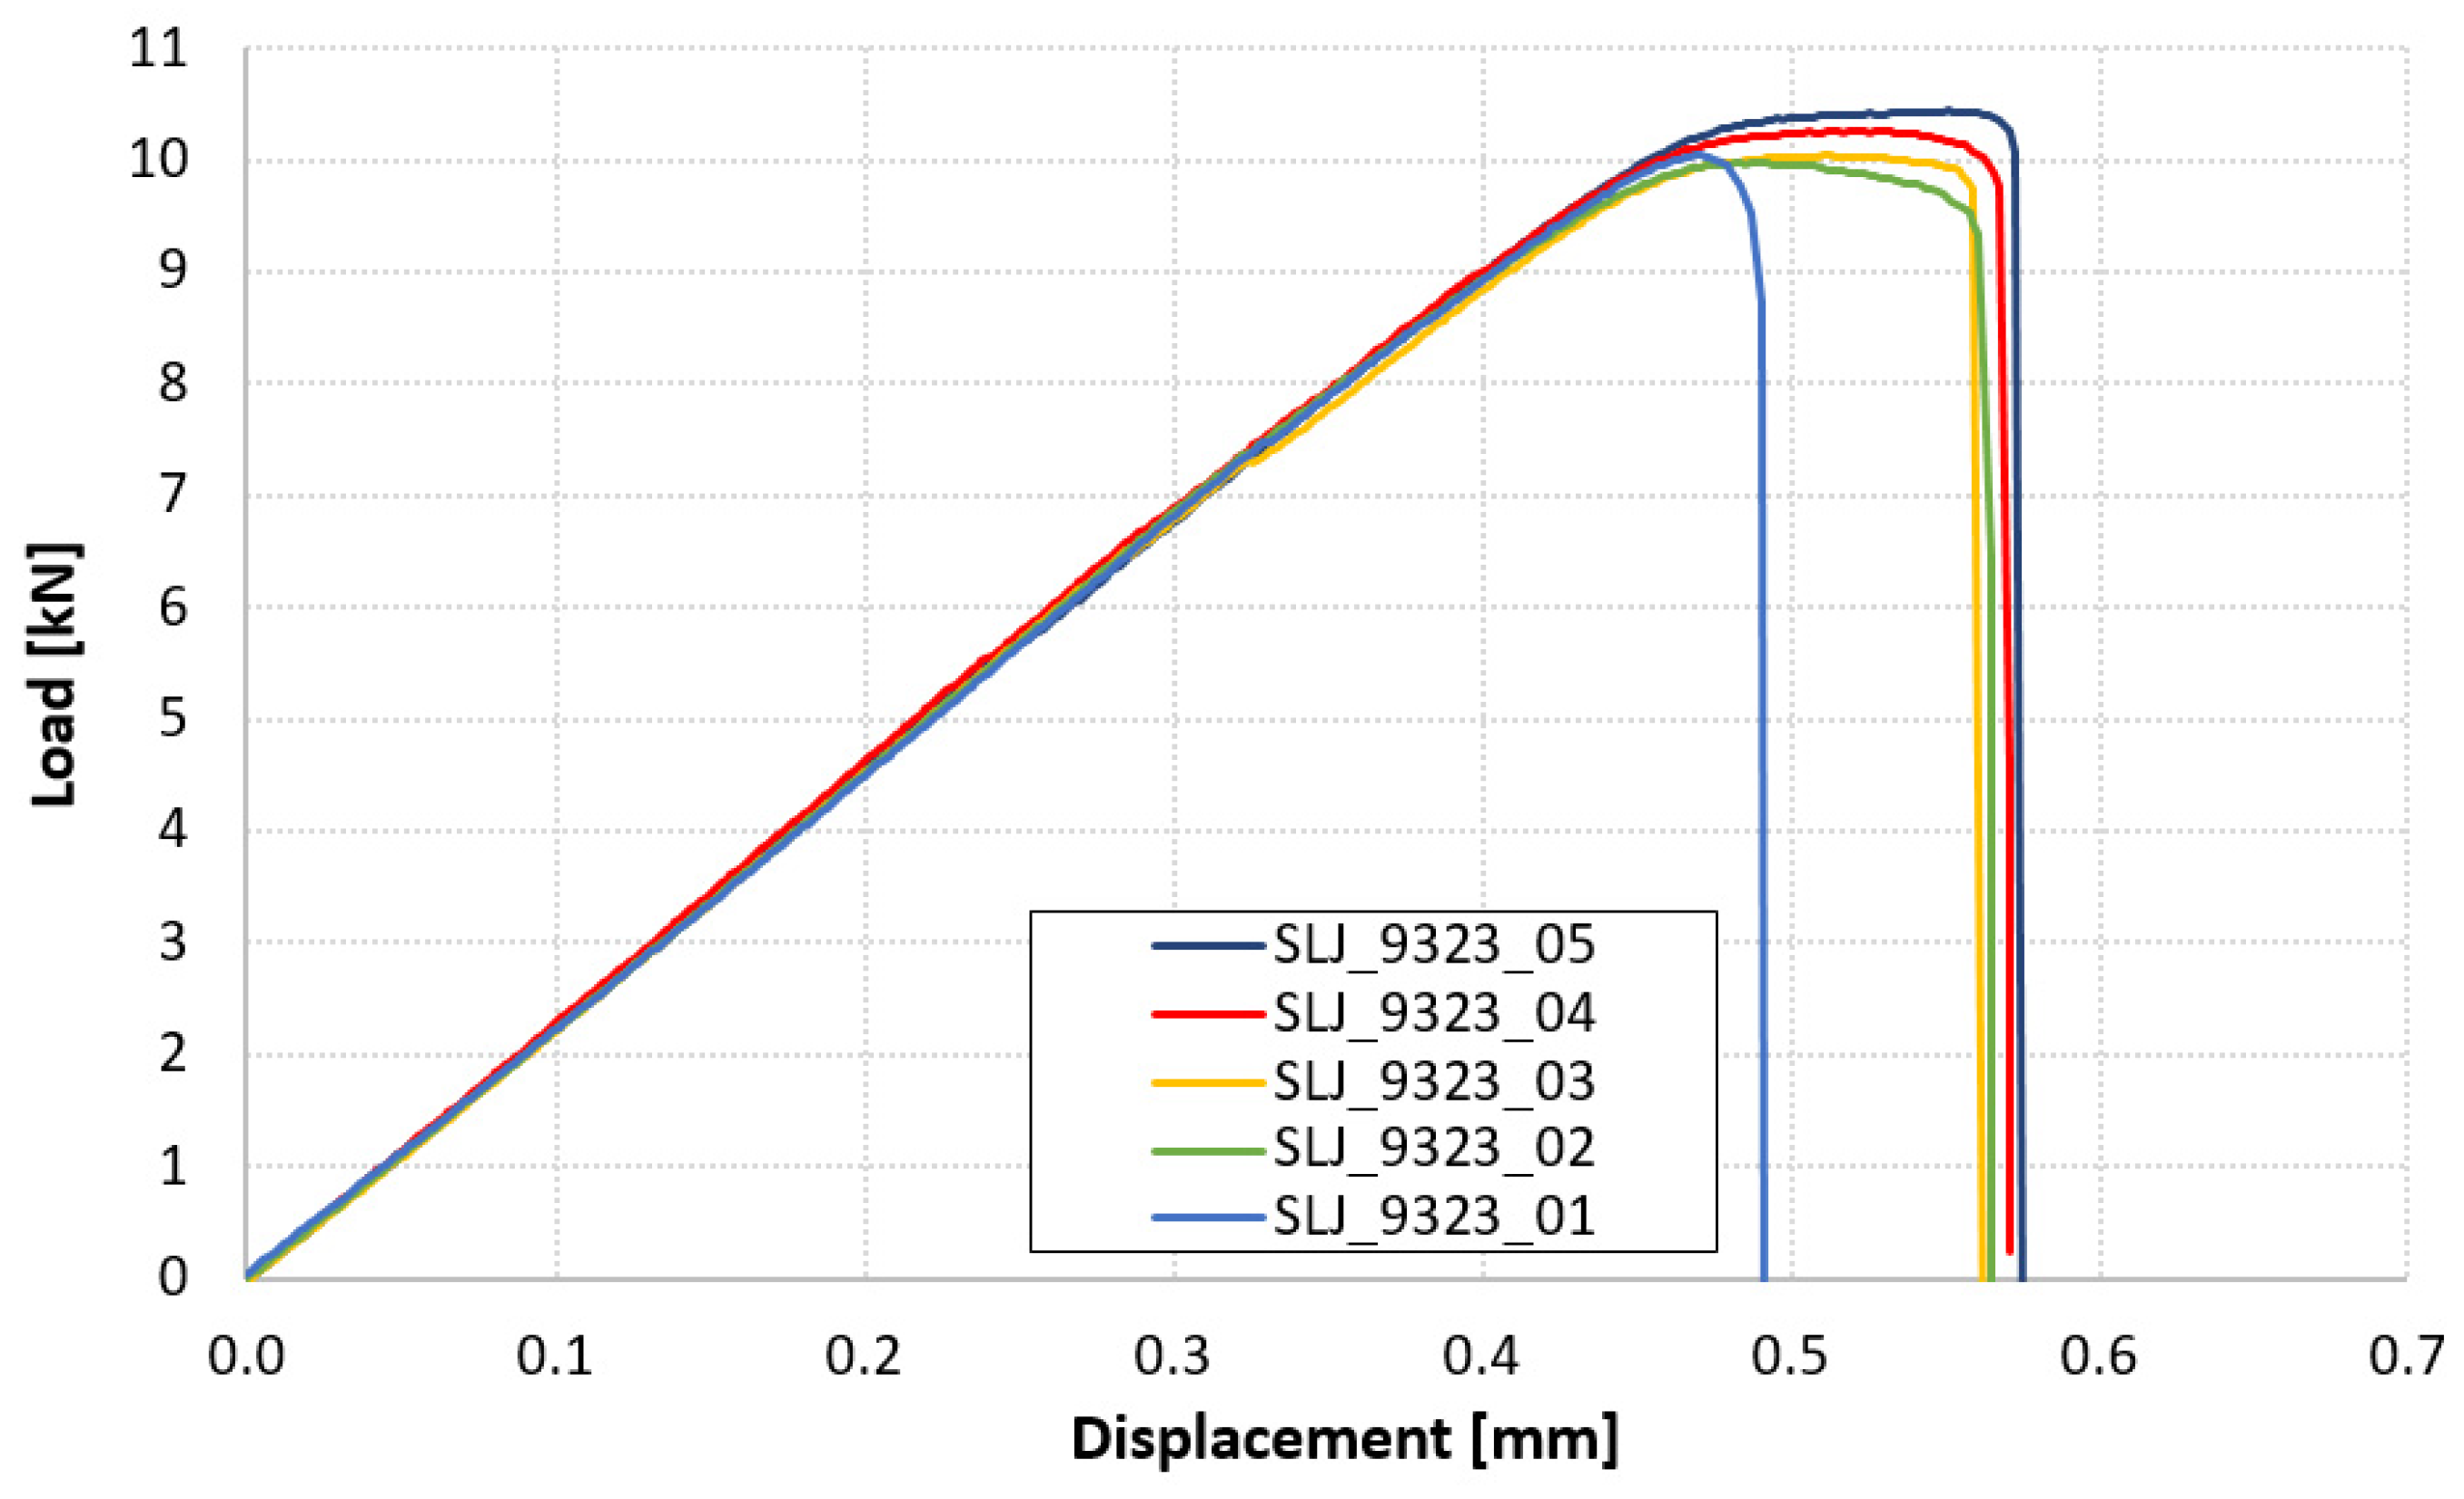
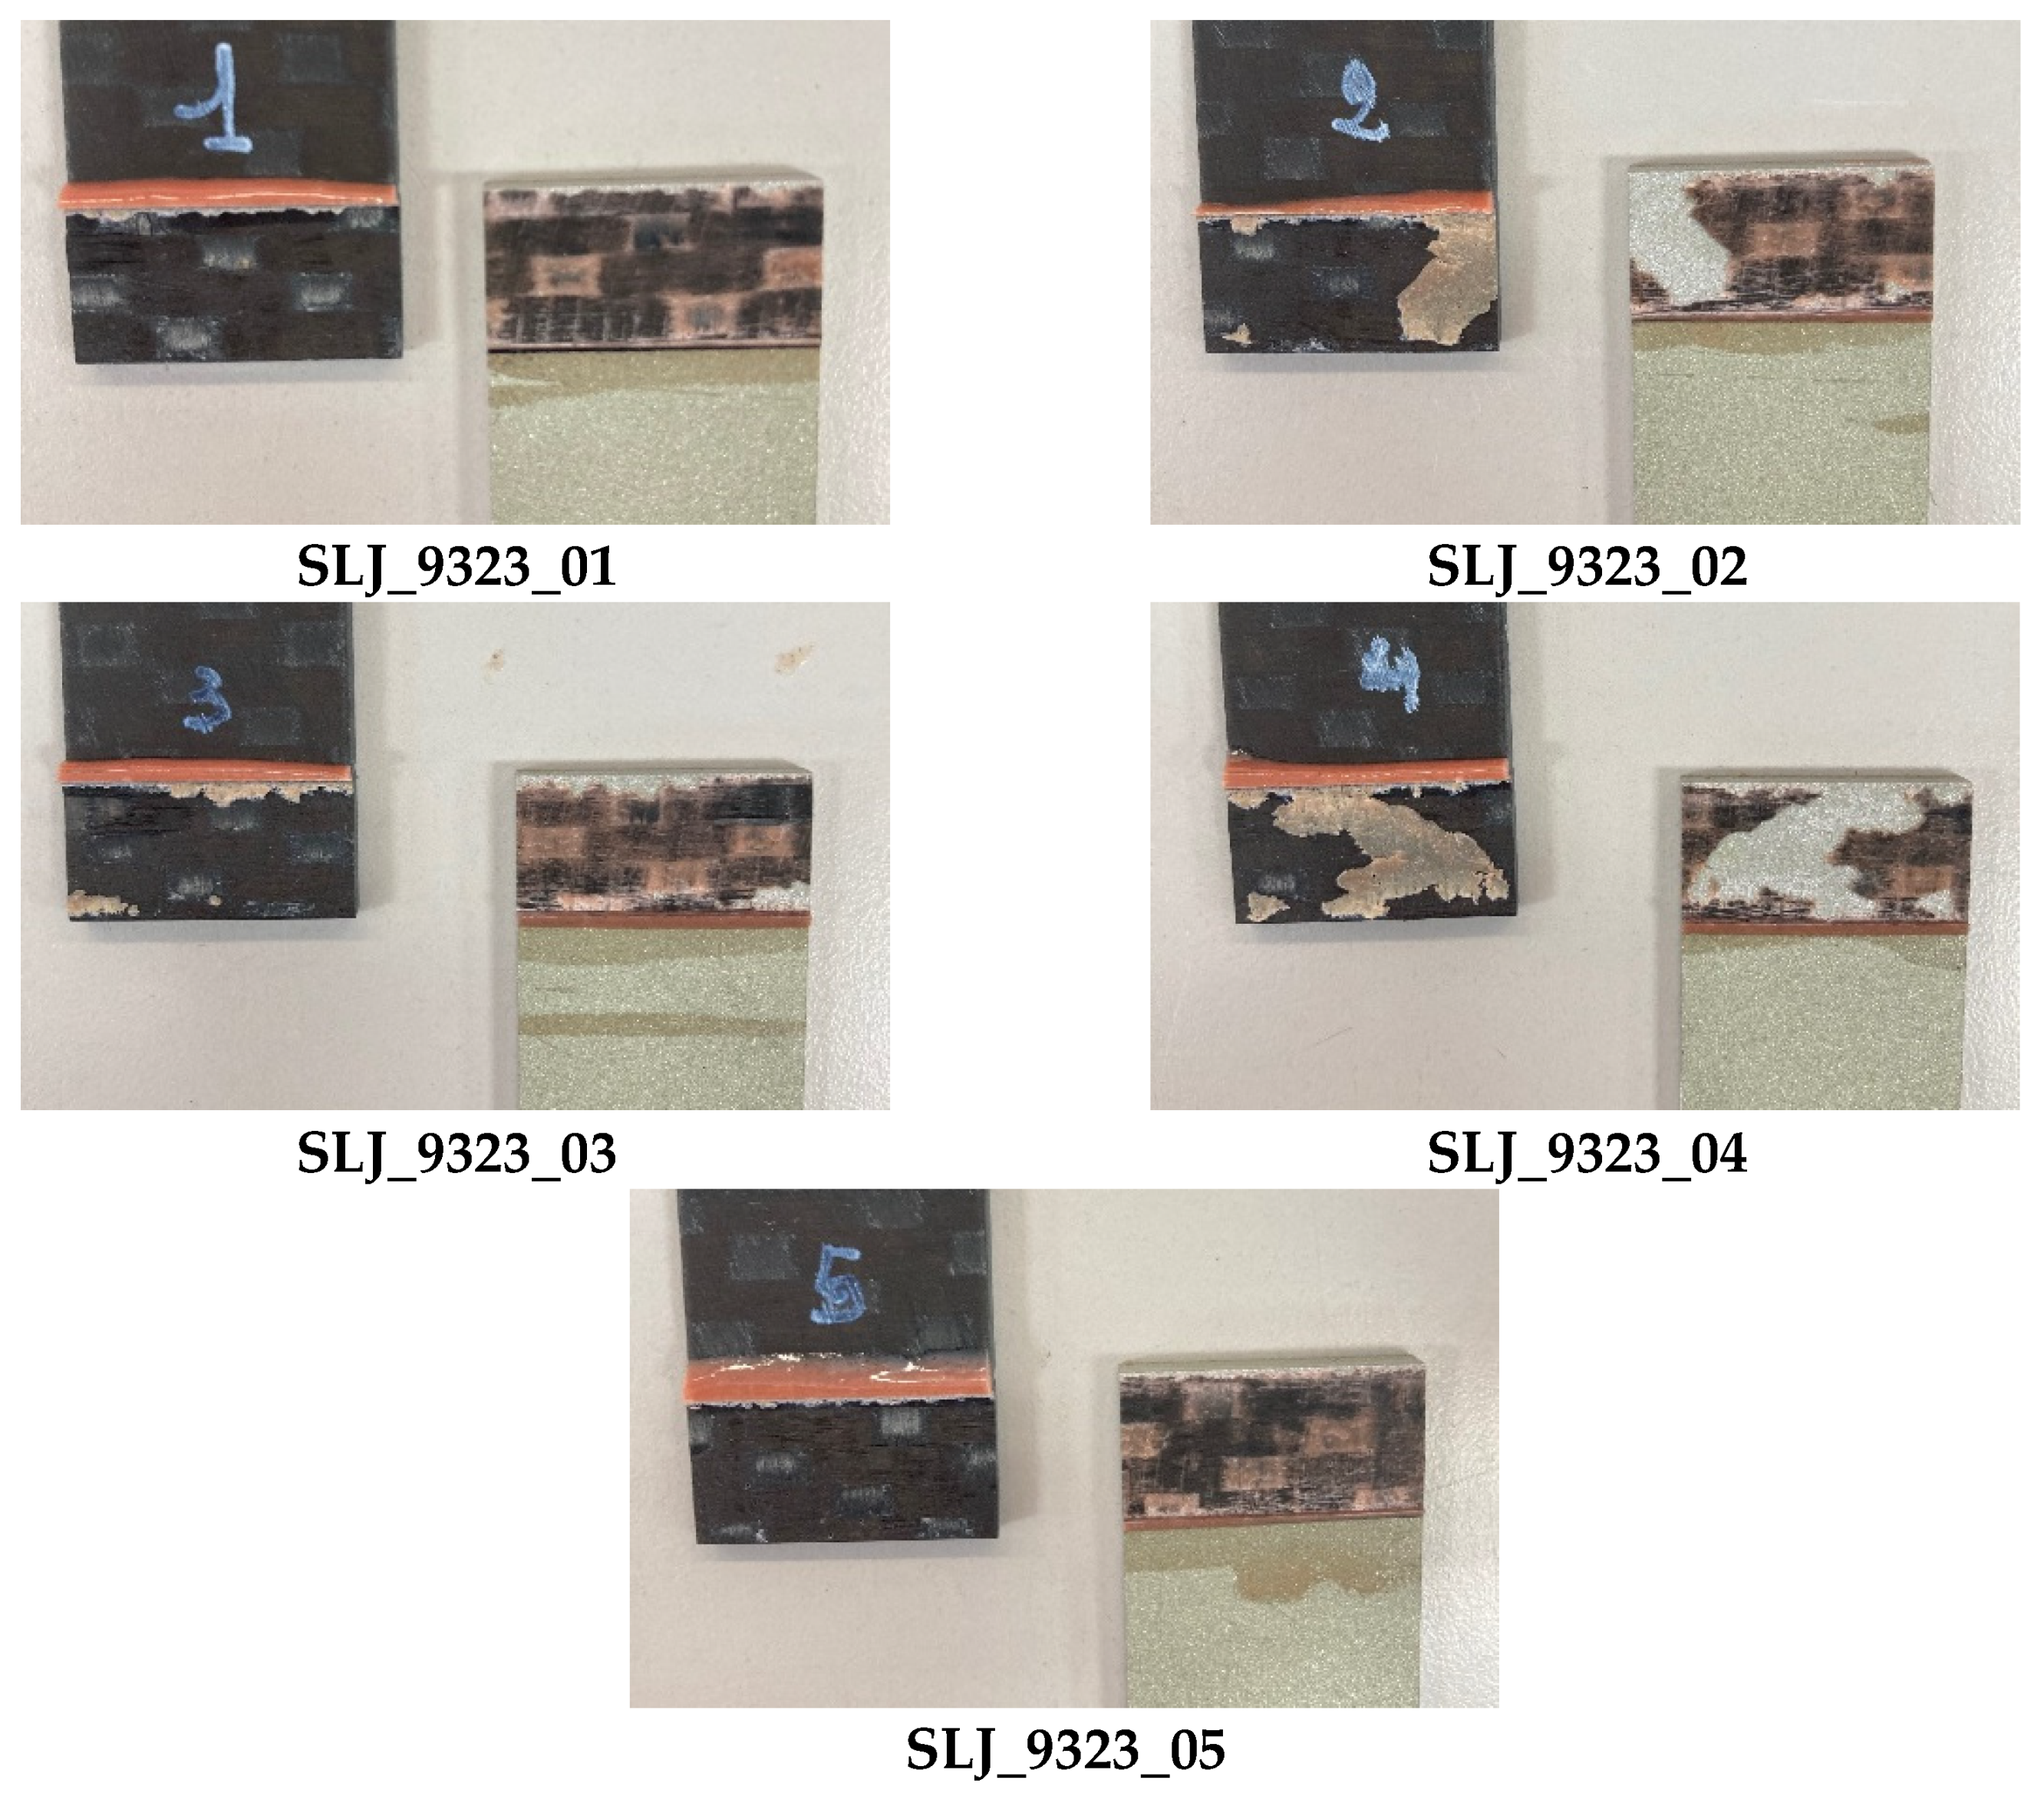
3.1.2. 9323 Adhesive
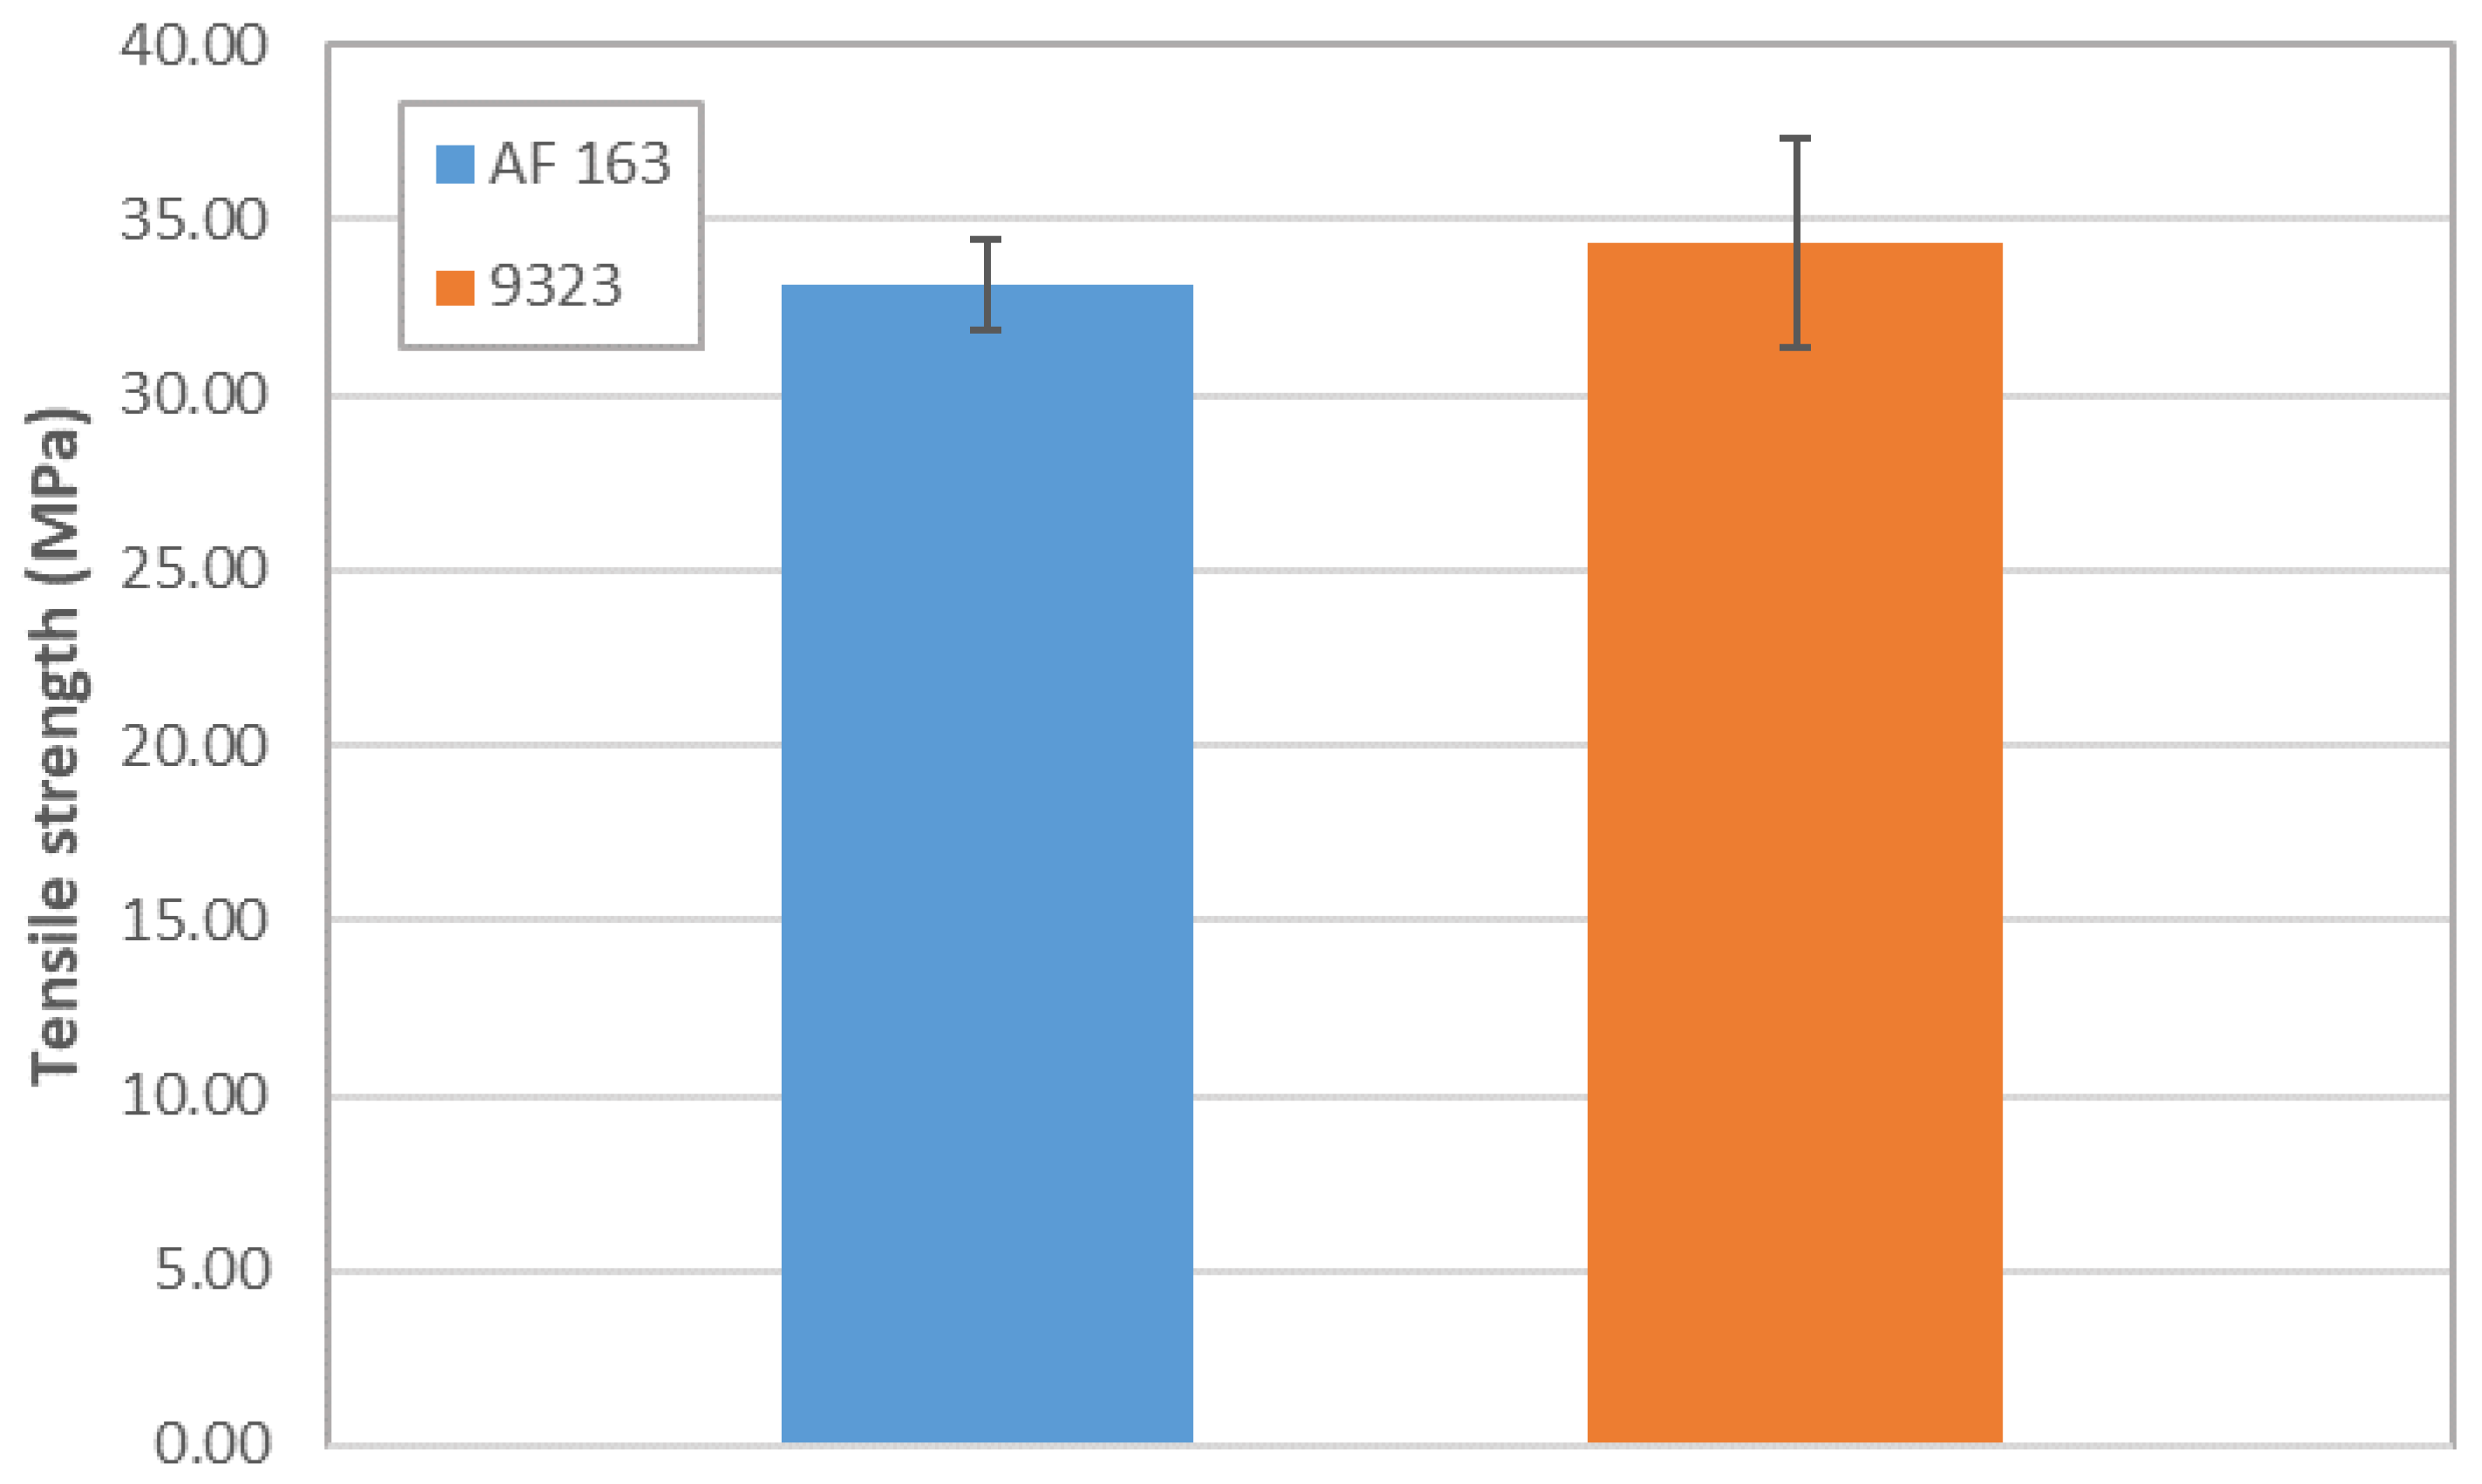
3.2. TRAZ-BJ
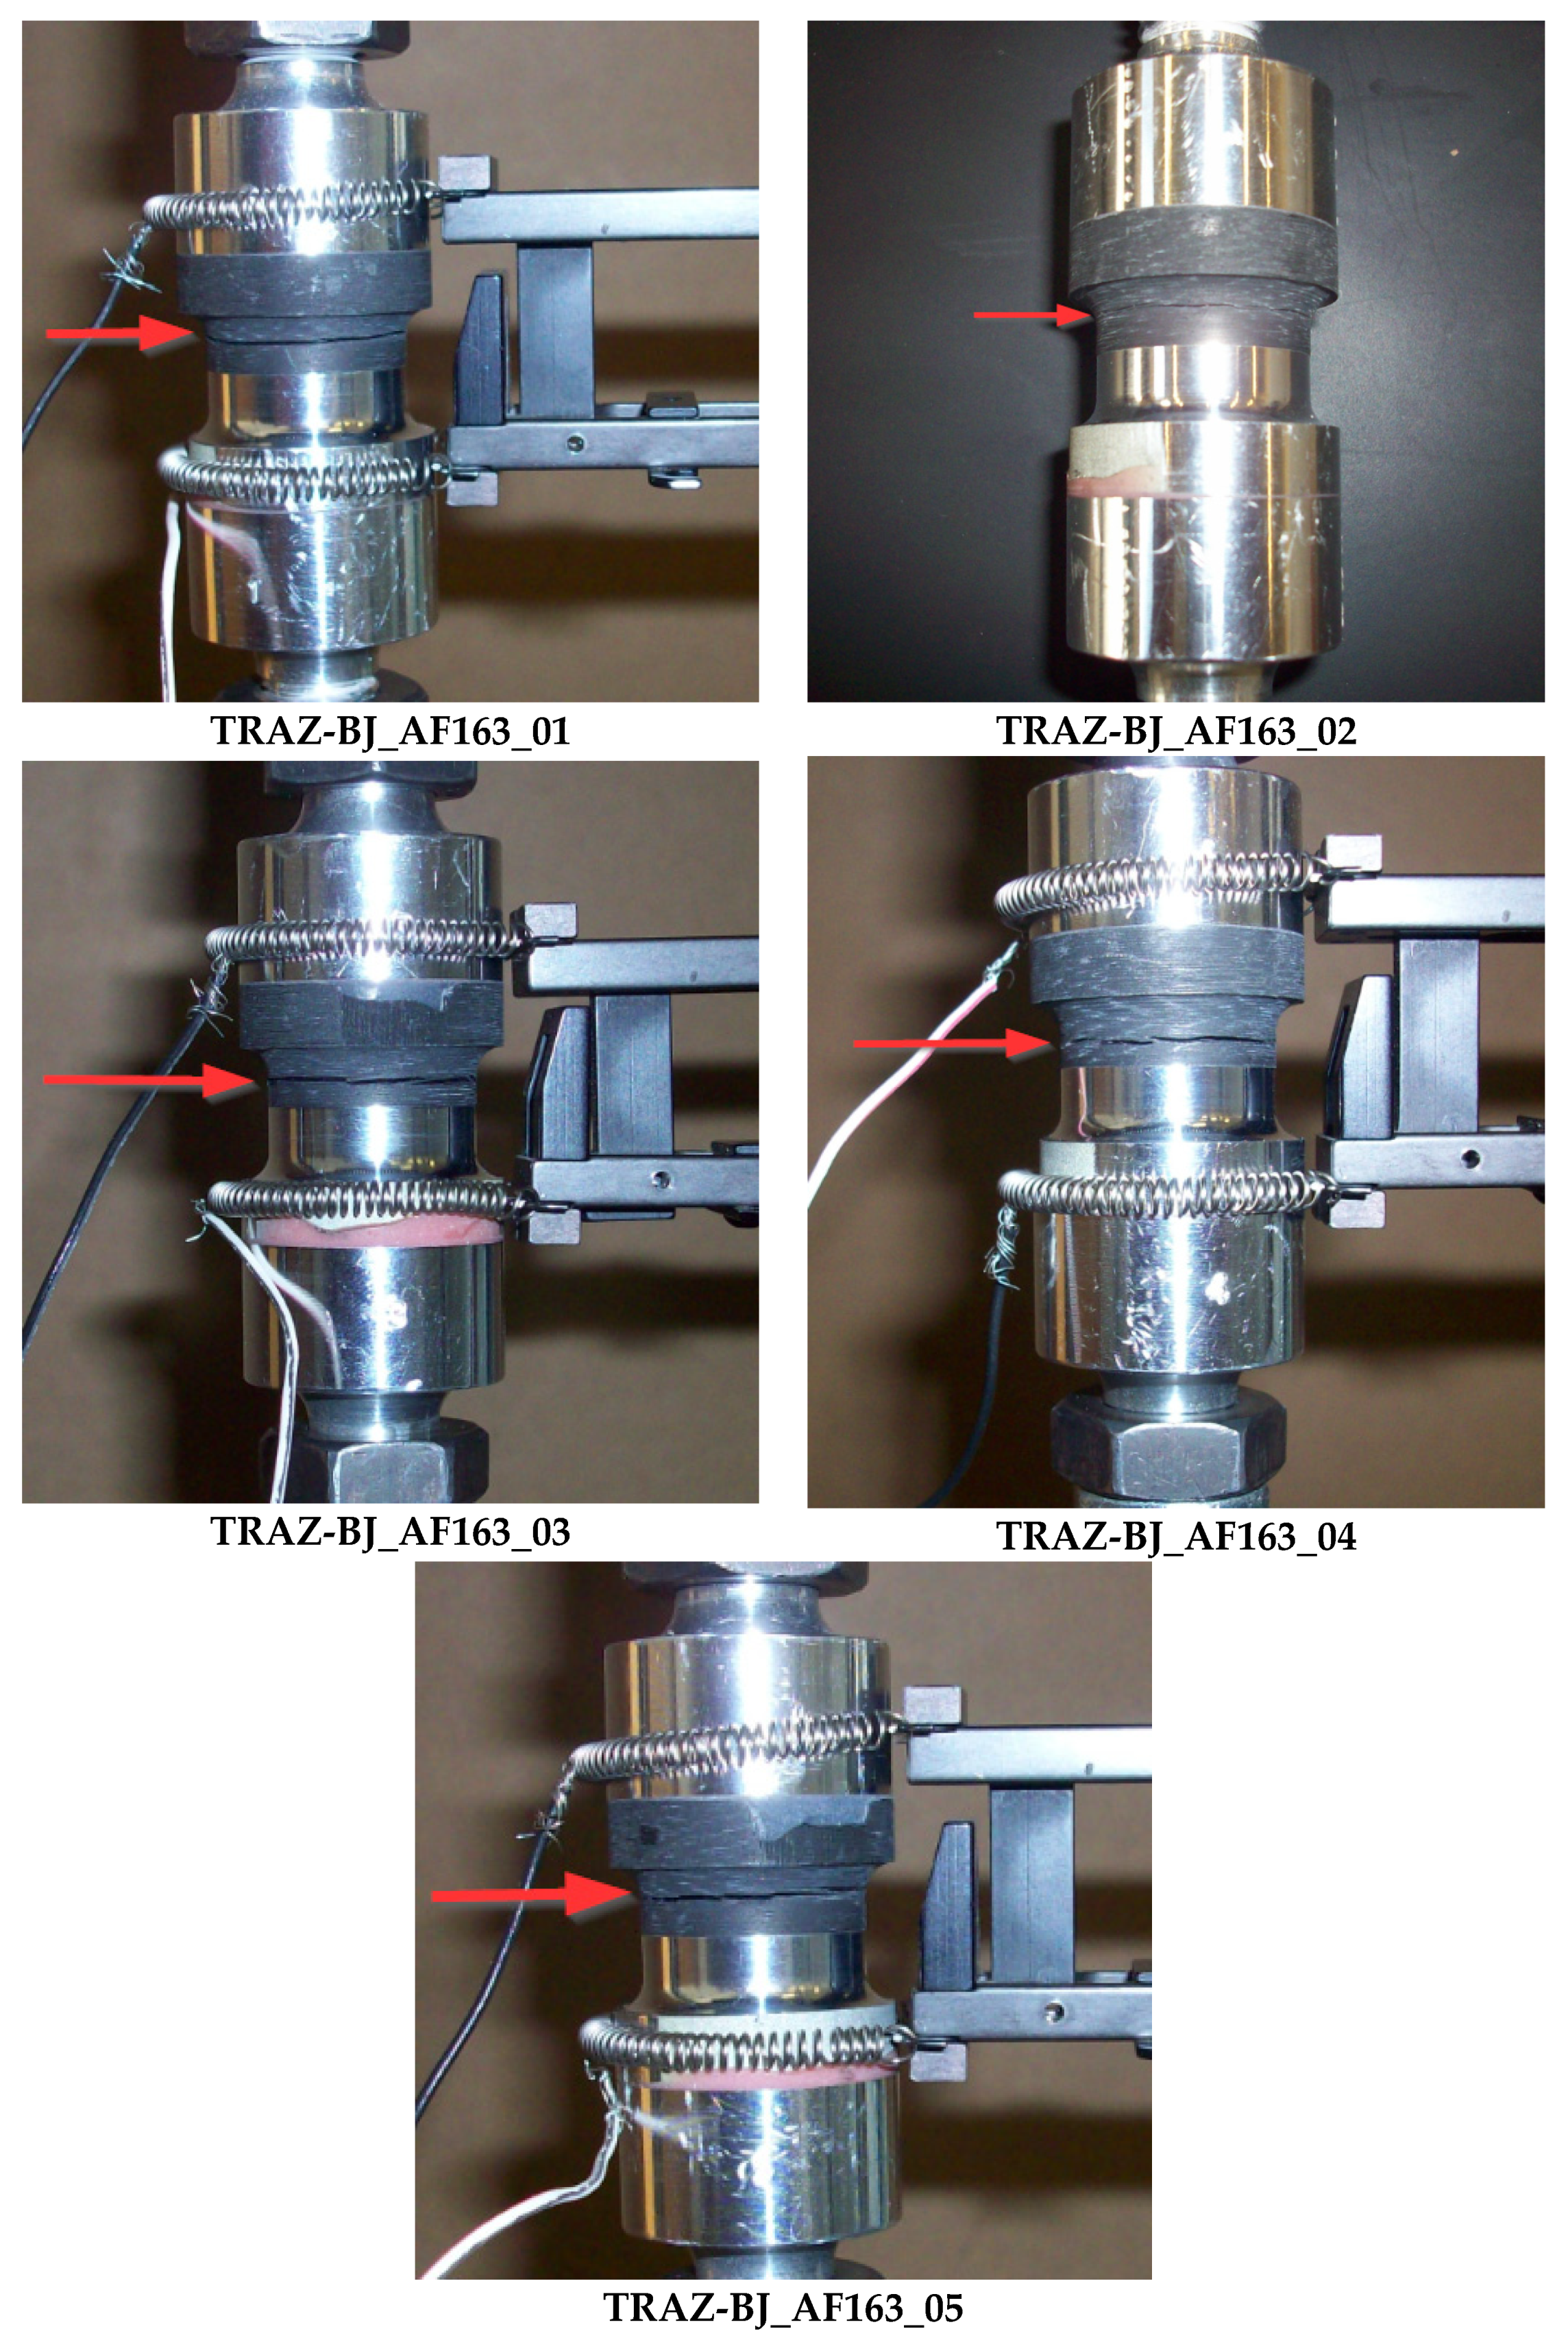
3.2.1. AF163 Adhesive
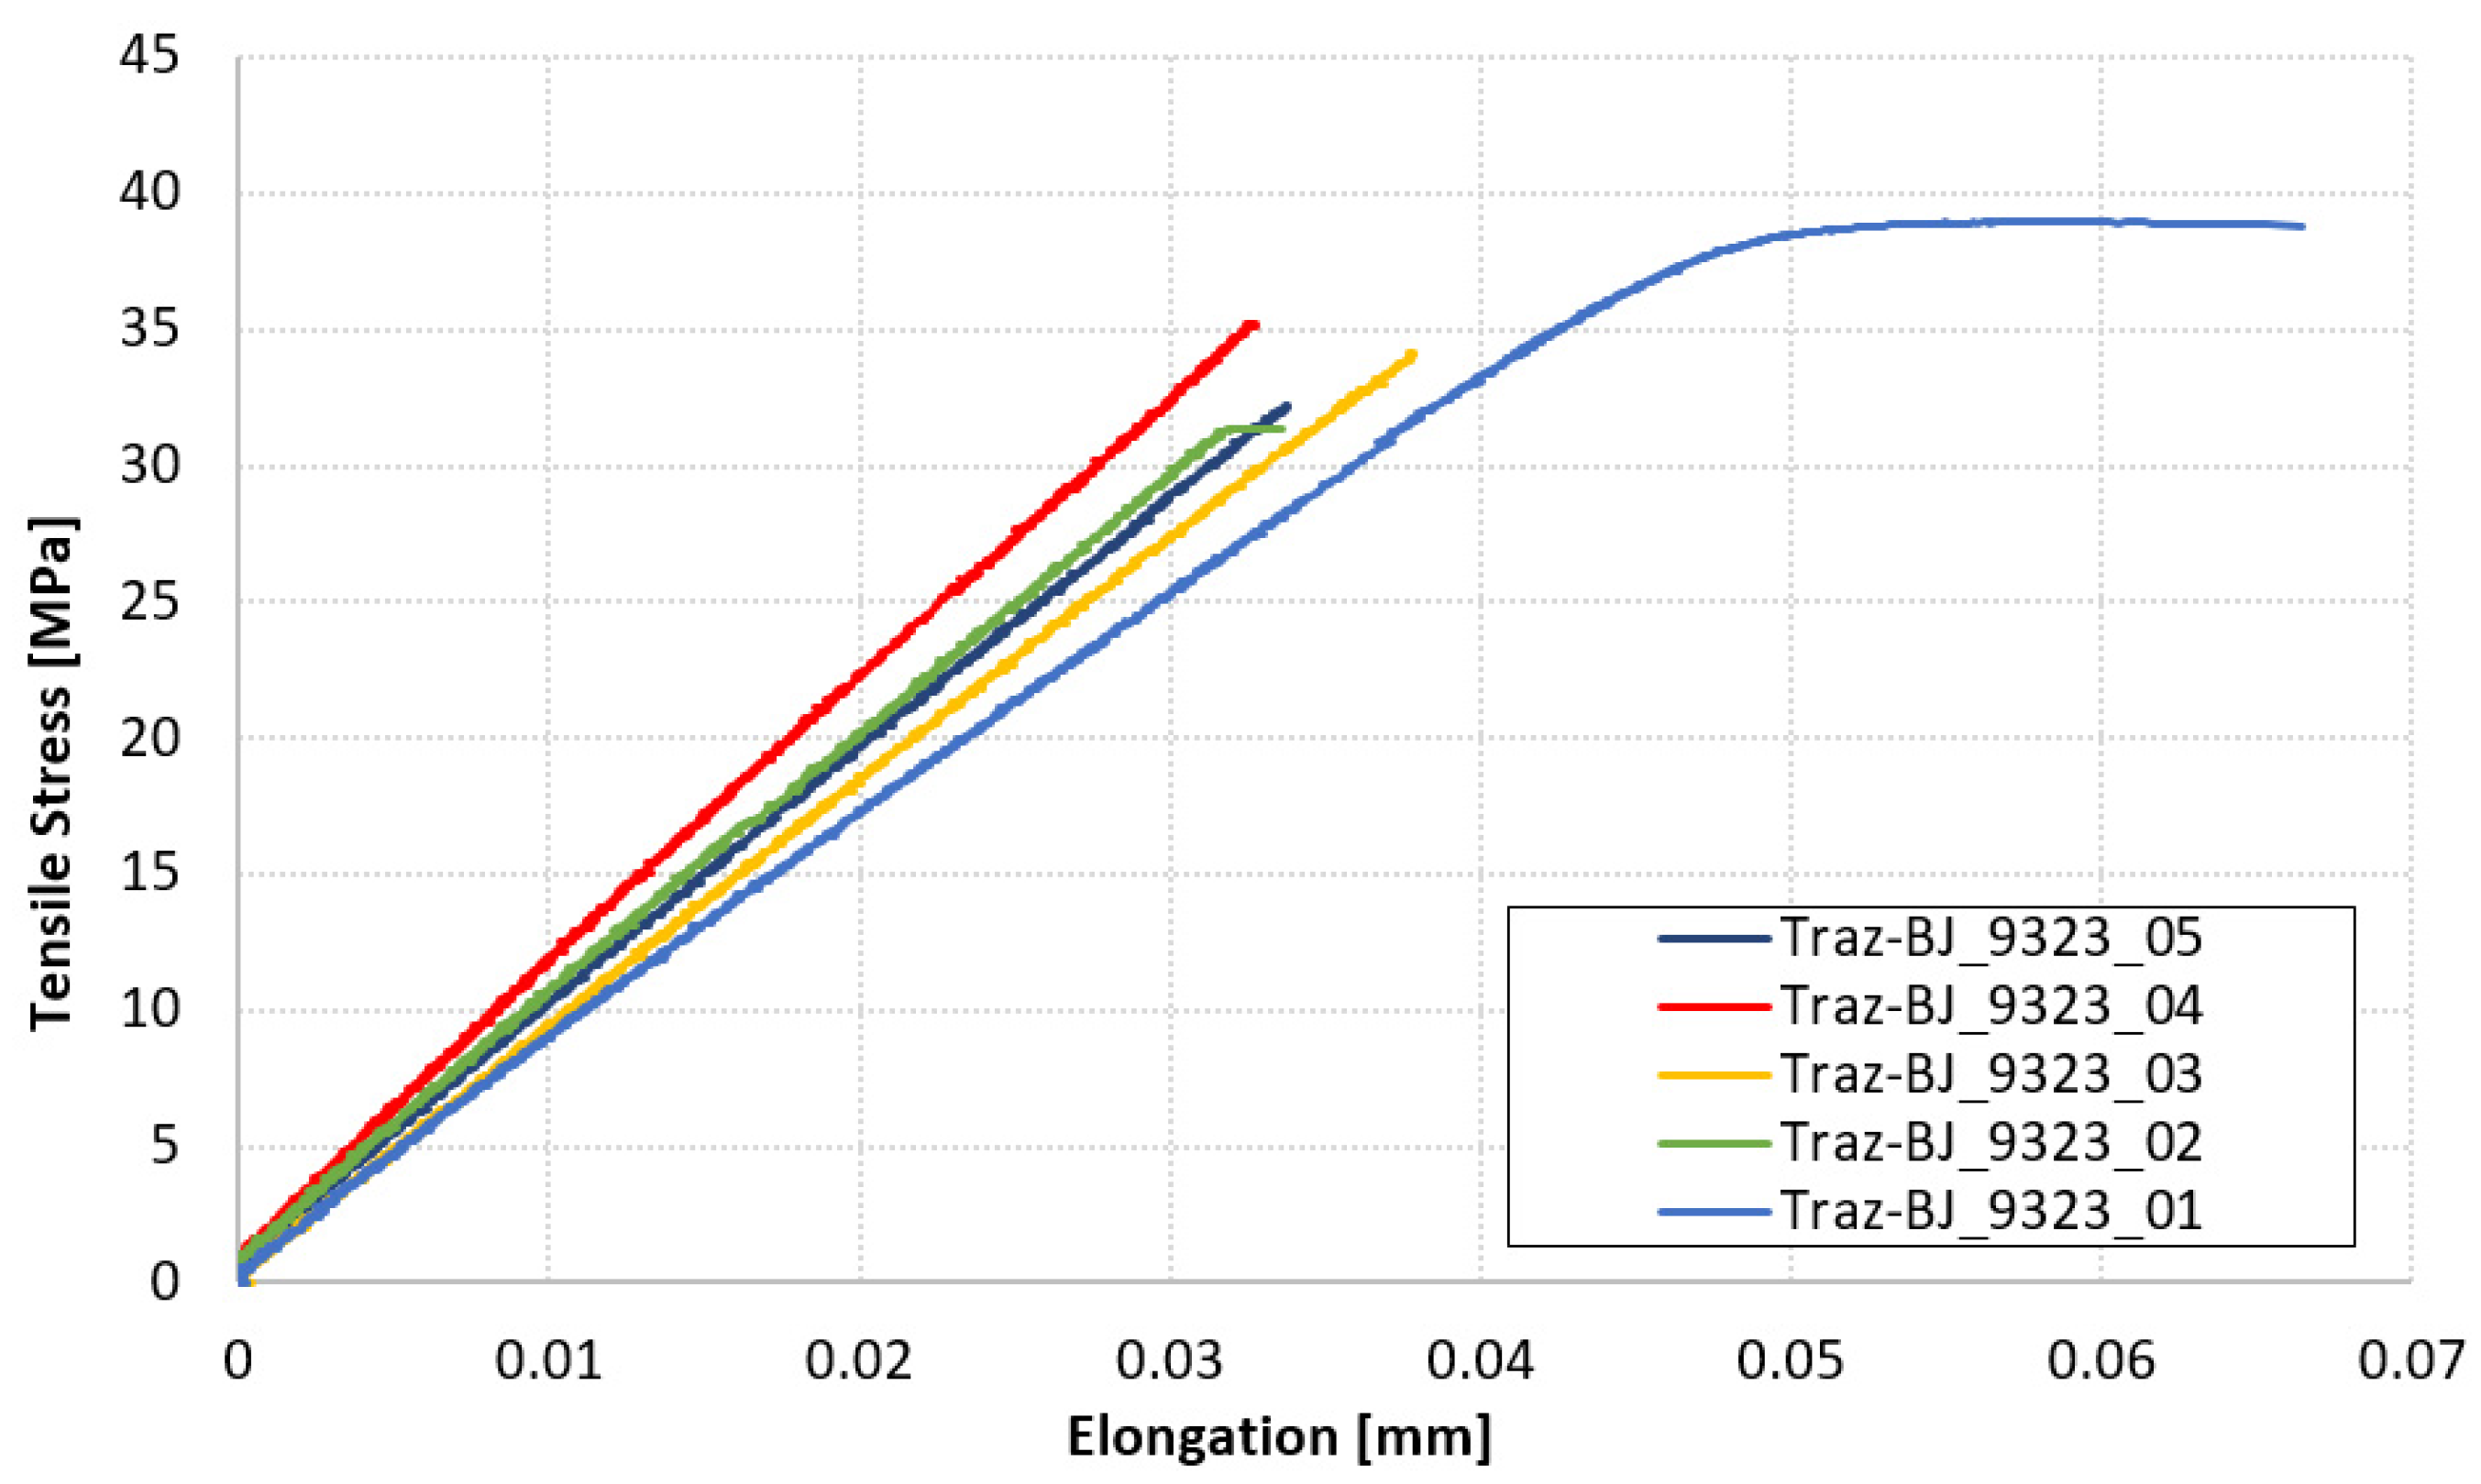
3.2.2. 9323 Adhesive
3.3. DCB
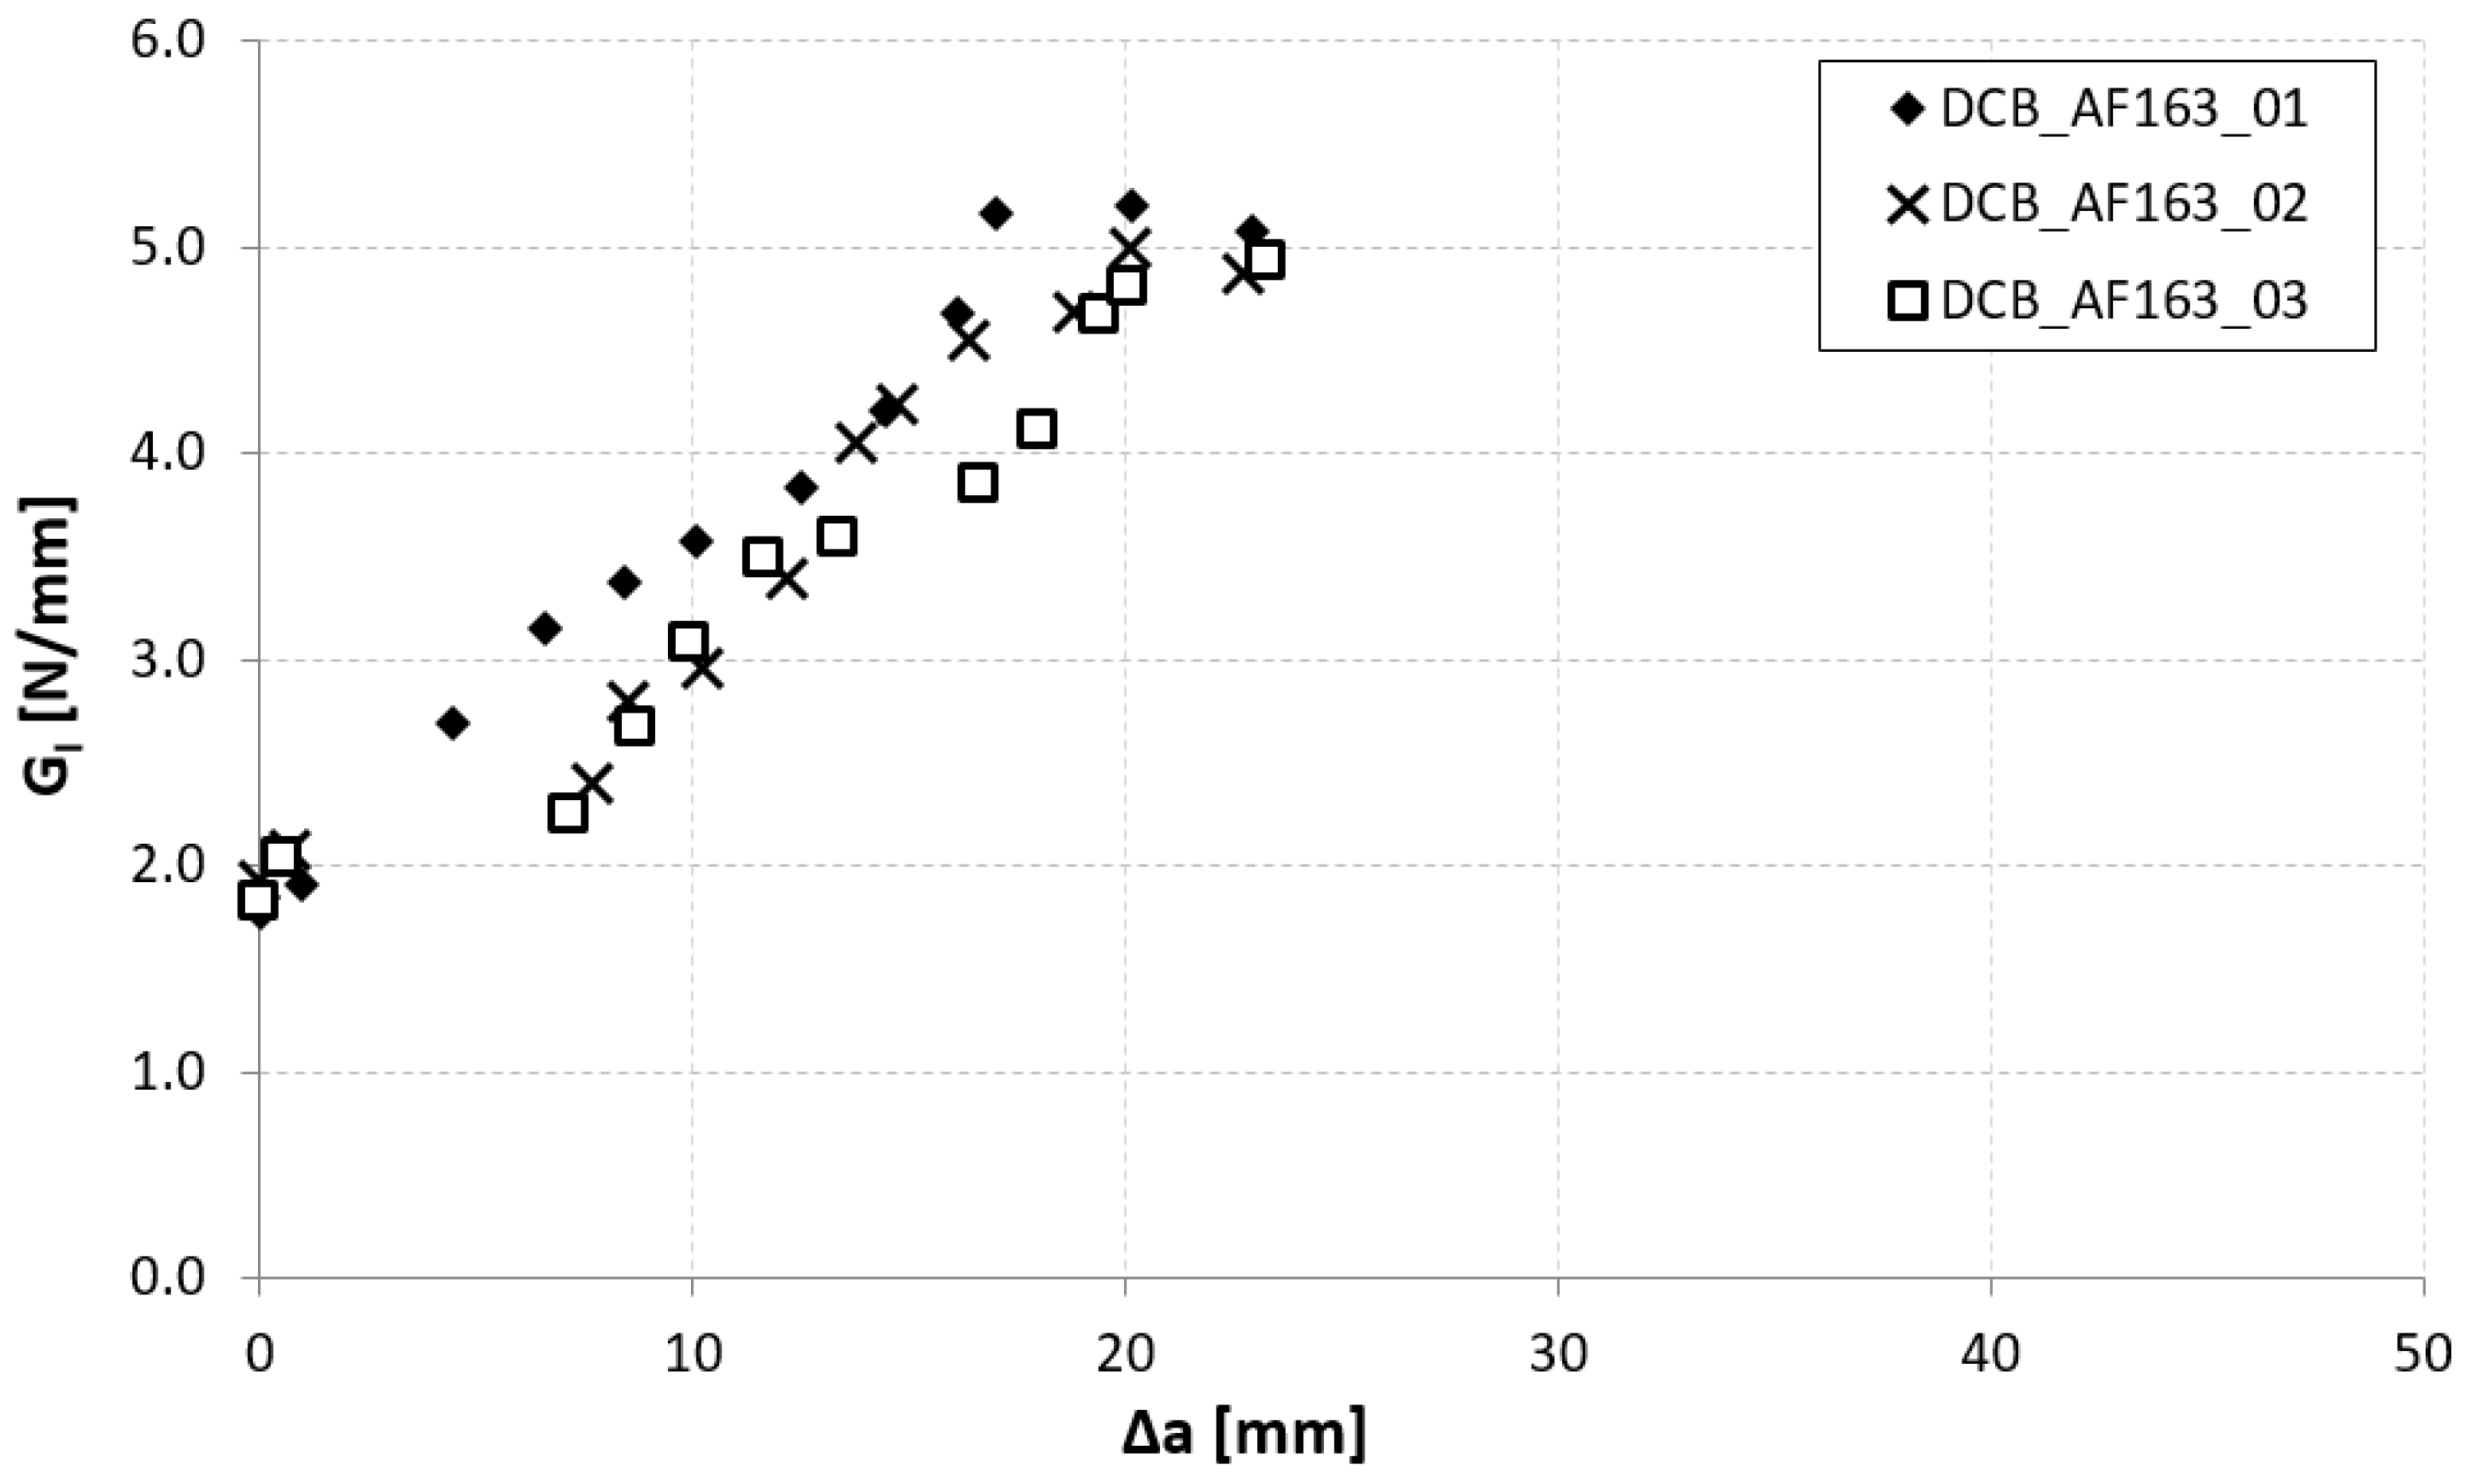
3.3.1. AF163 Adhesive
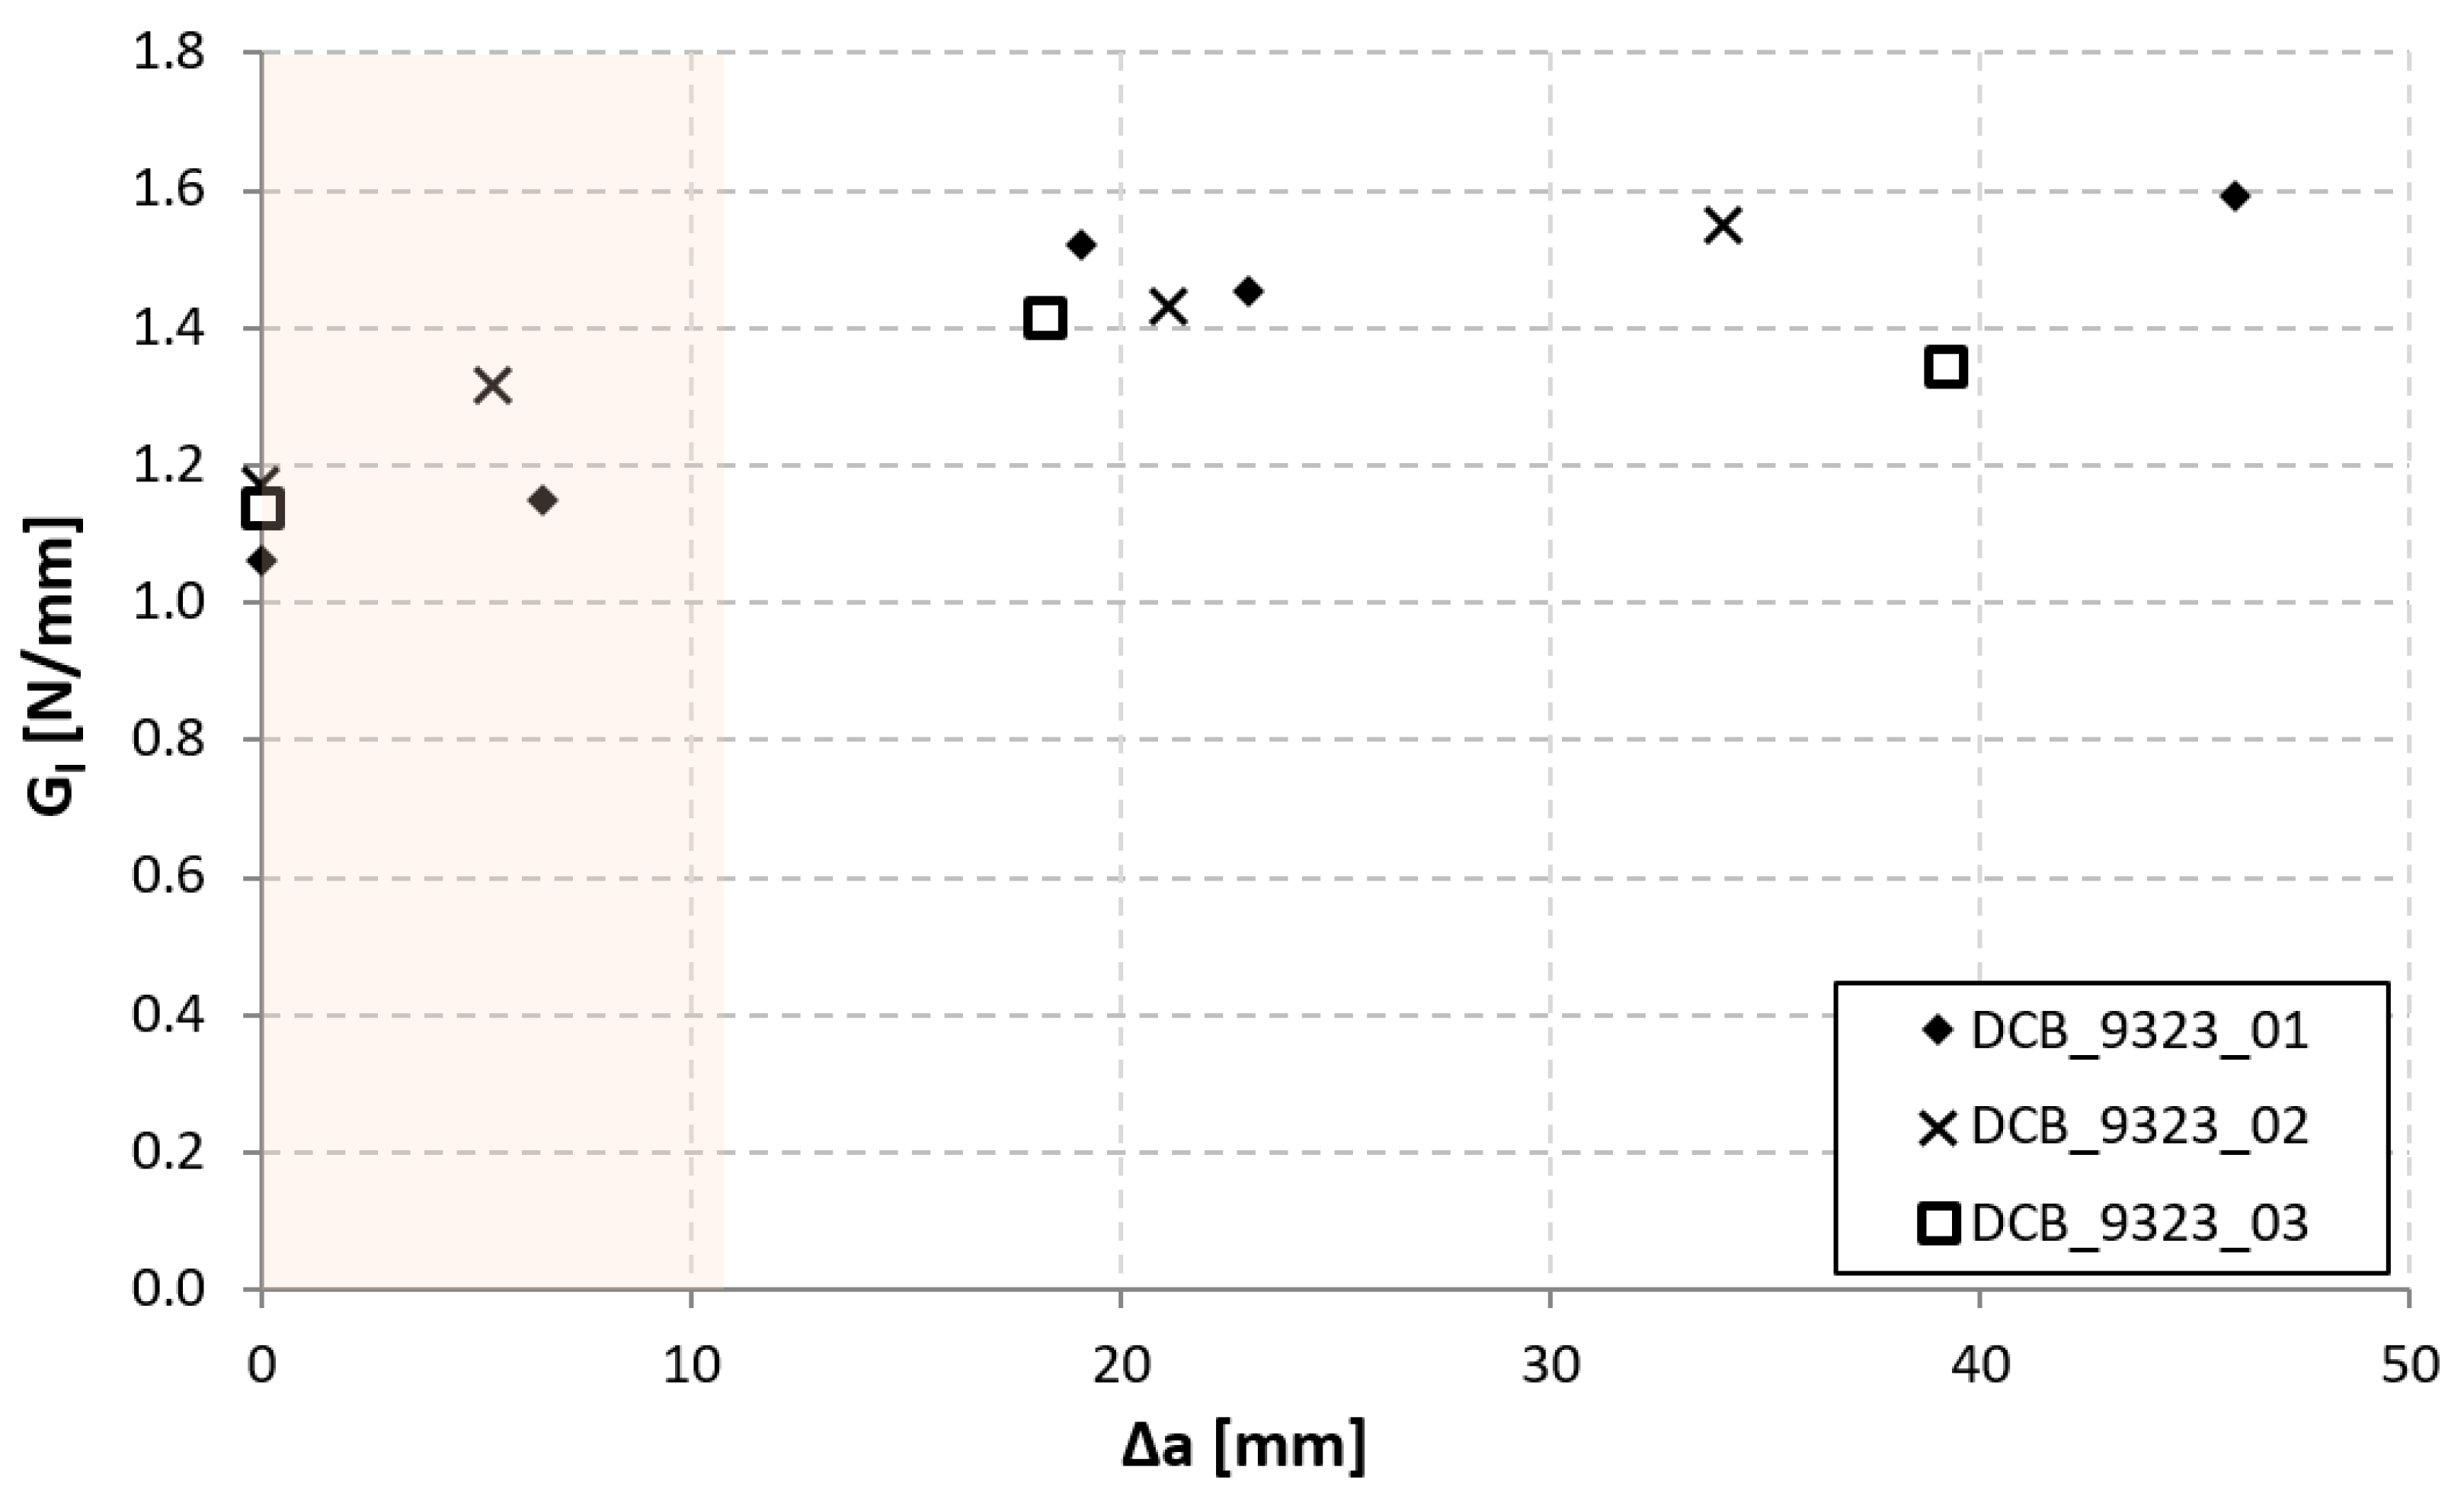
3.3.2. 9323 Adhesive
3.4. ENF
3.4.1. AF163 Adhesive
3.4.2. 9323 Adhesive
4. Discussion
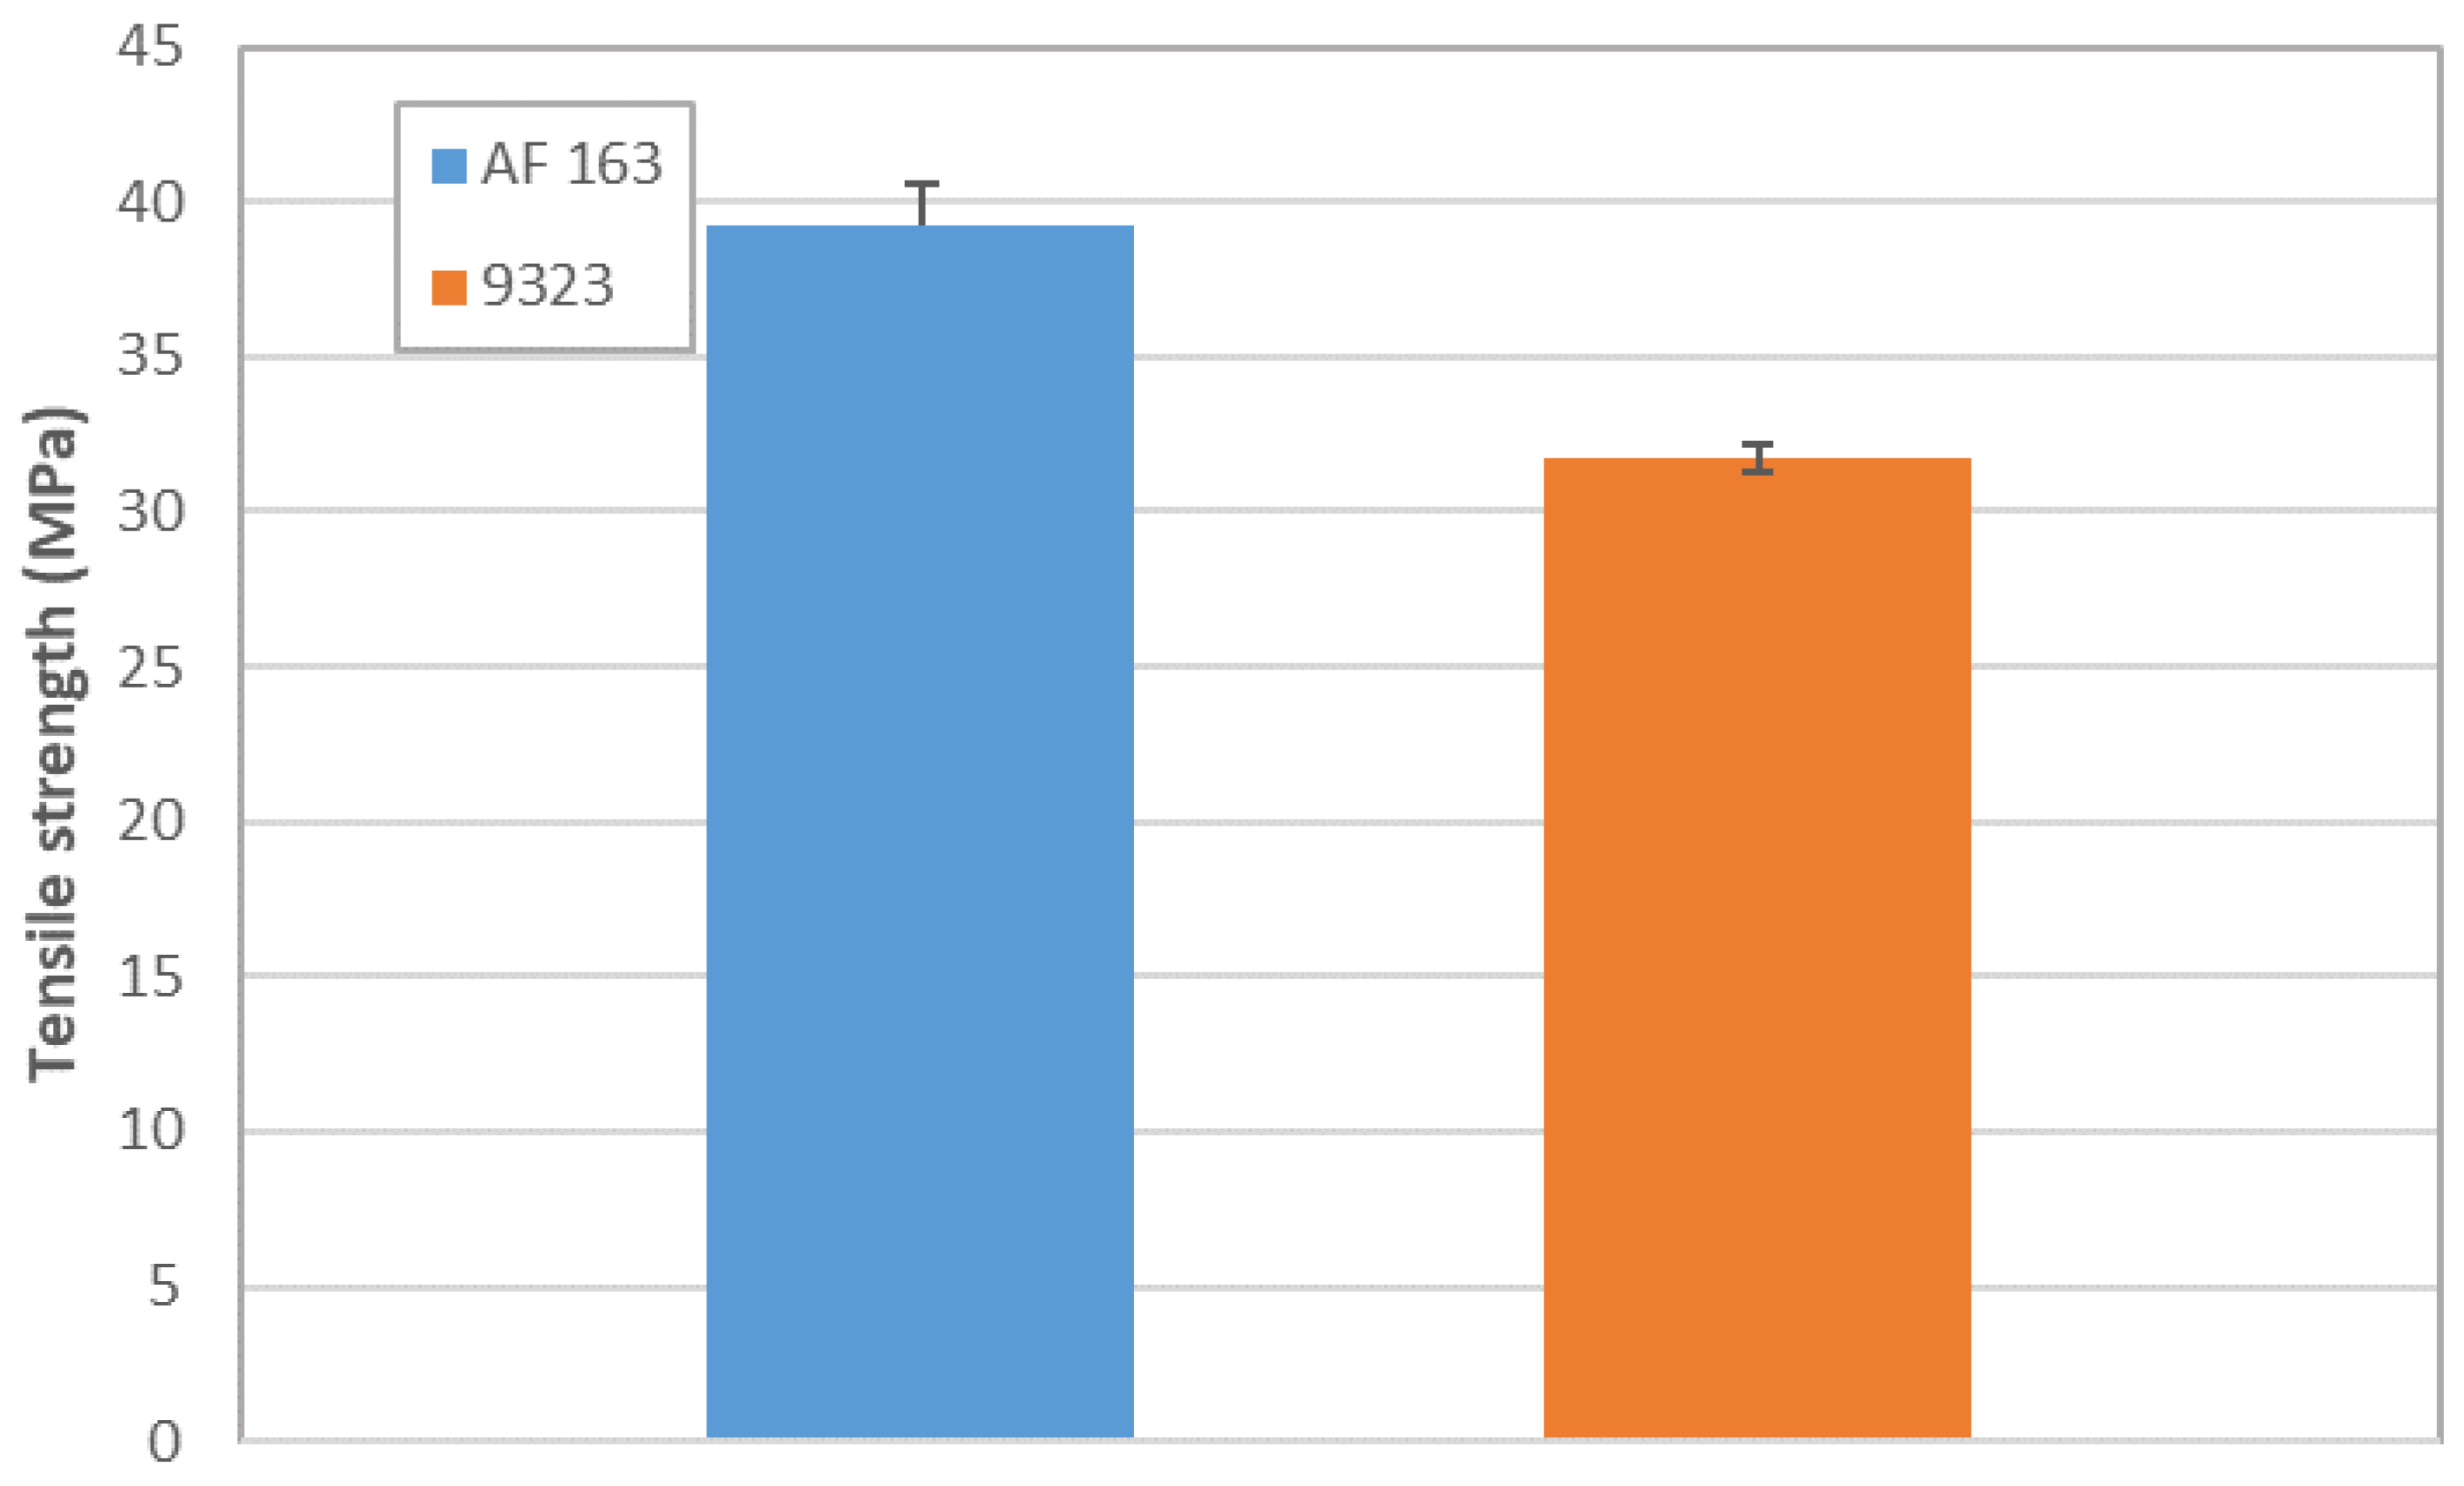
4.1. SLJ Tests
4.2. TRAZ-BJ Tests
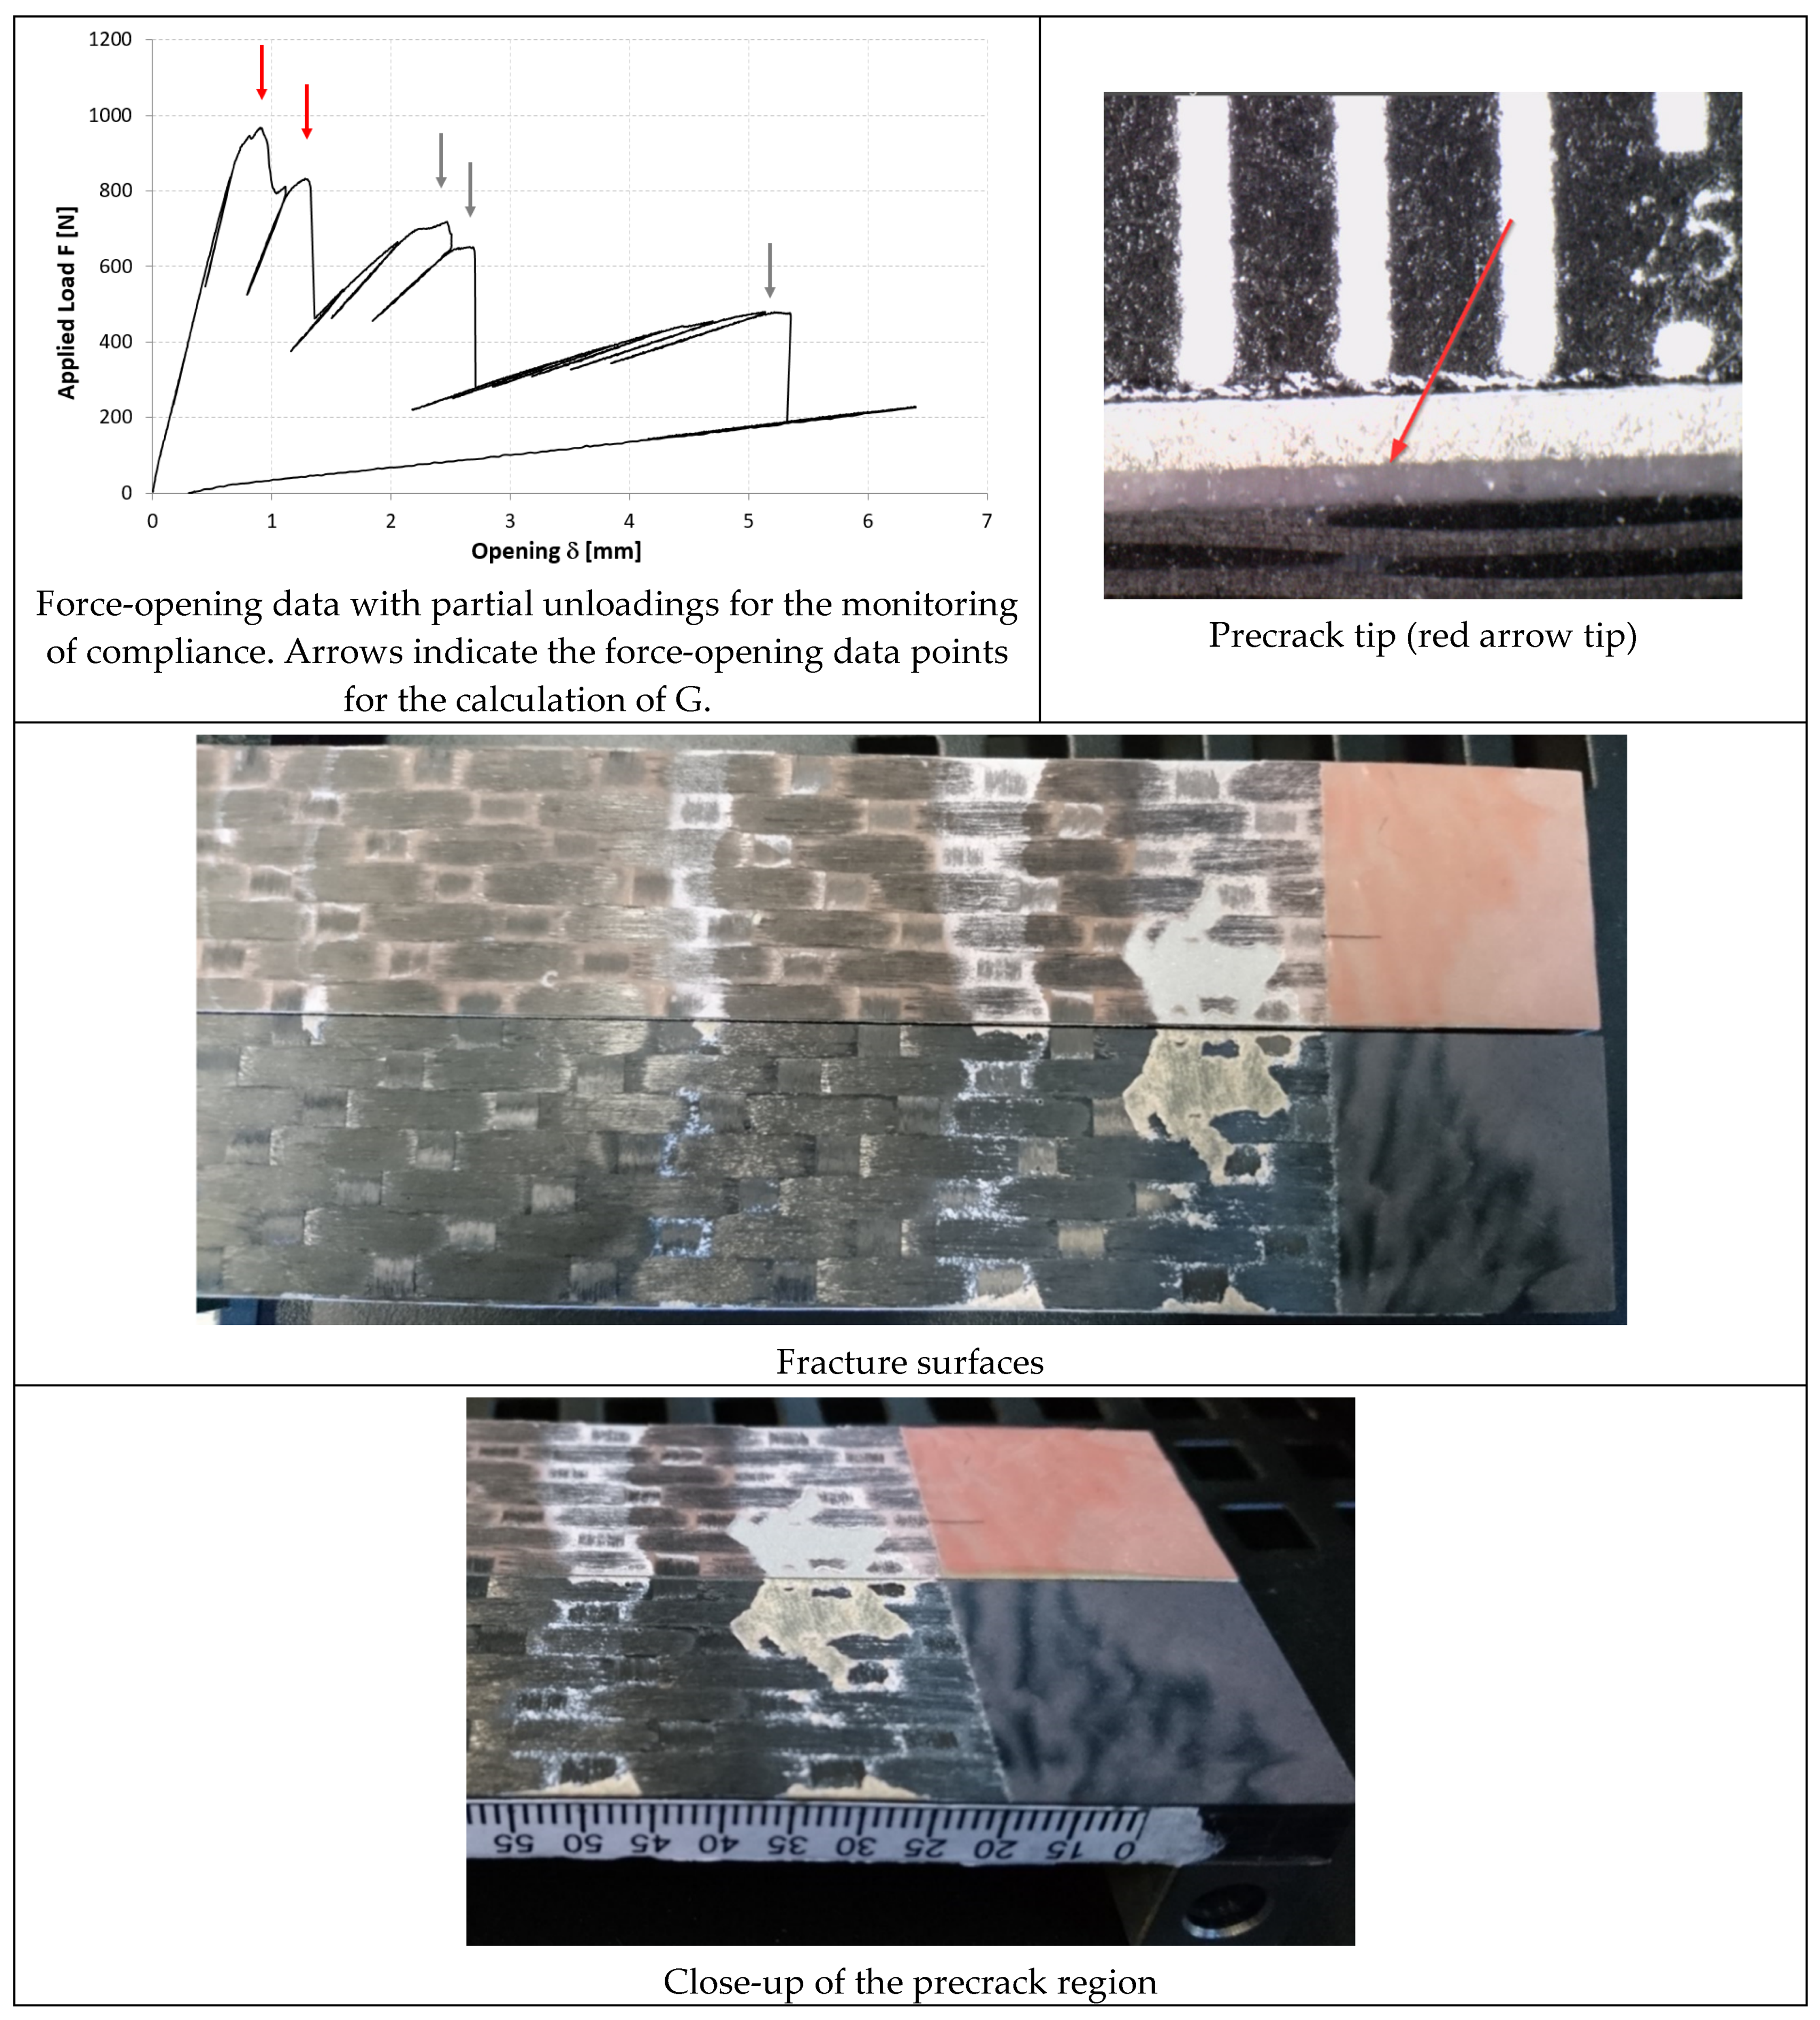
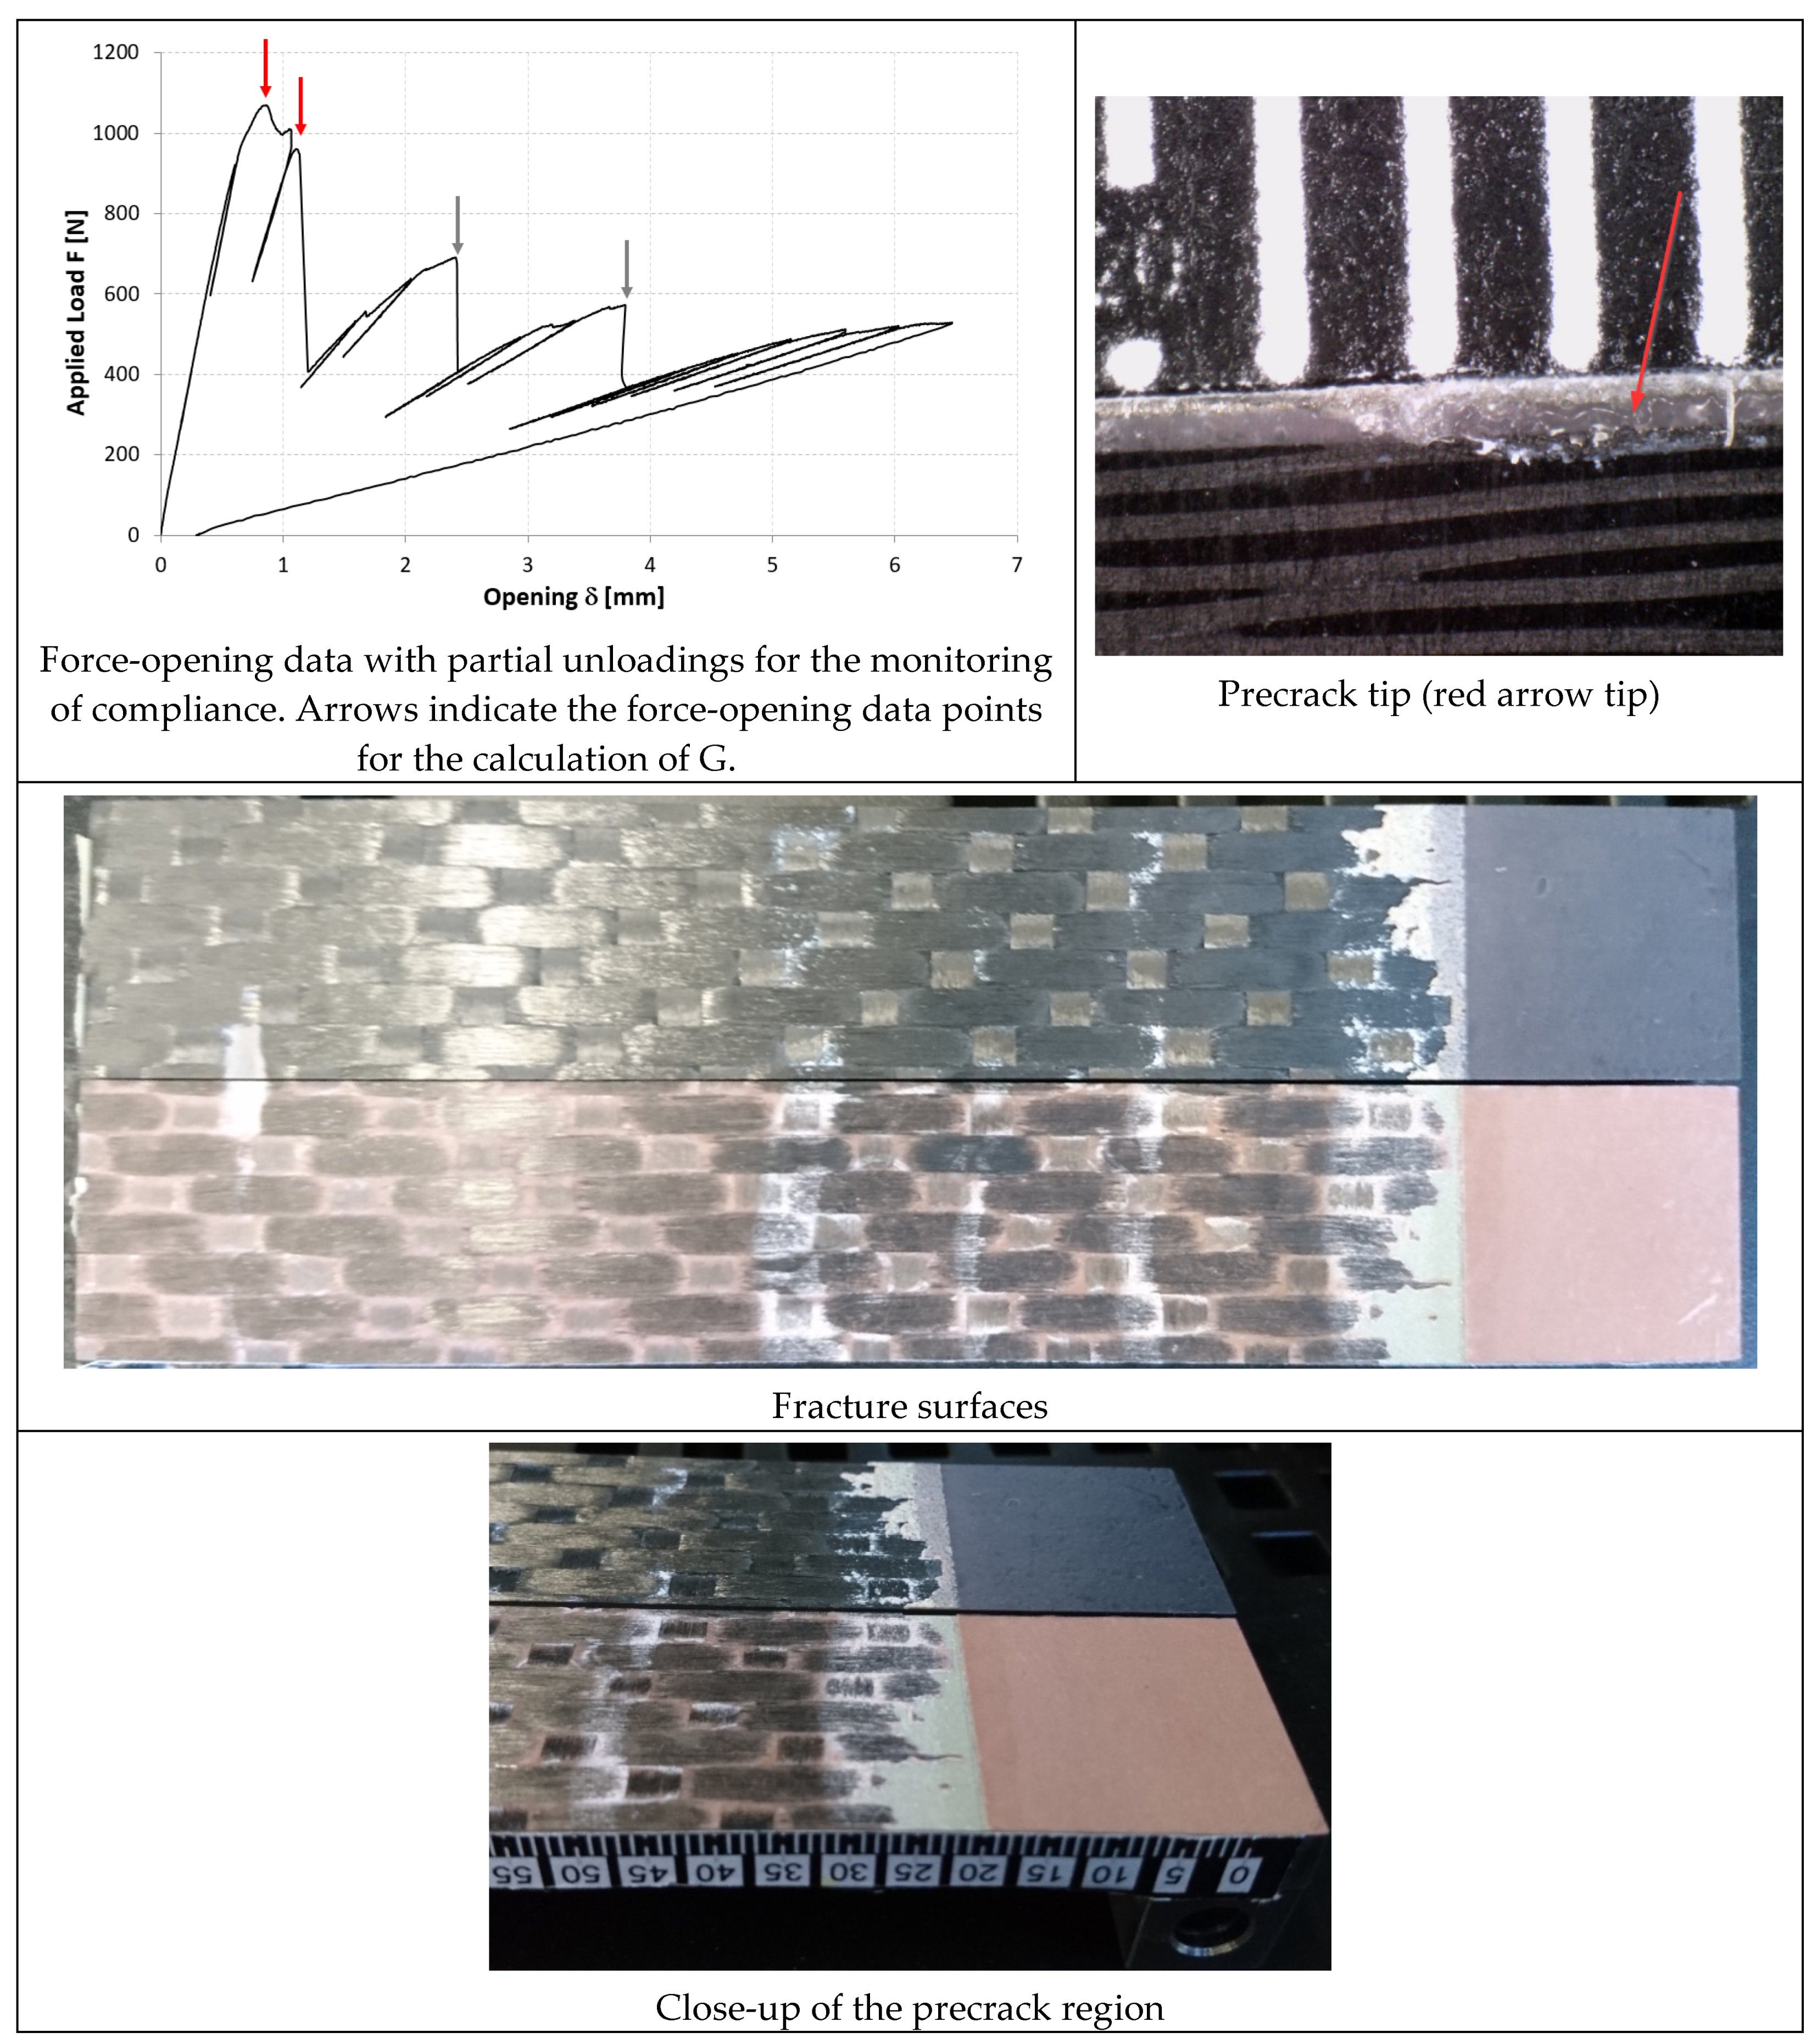
4.3. DCB Tests
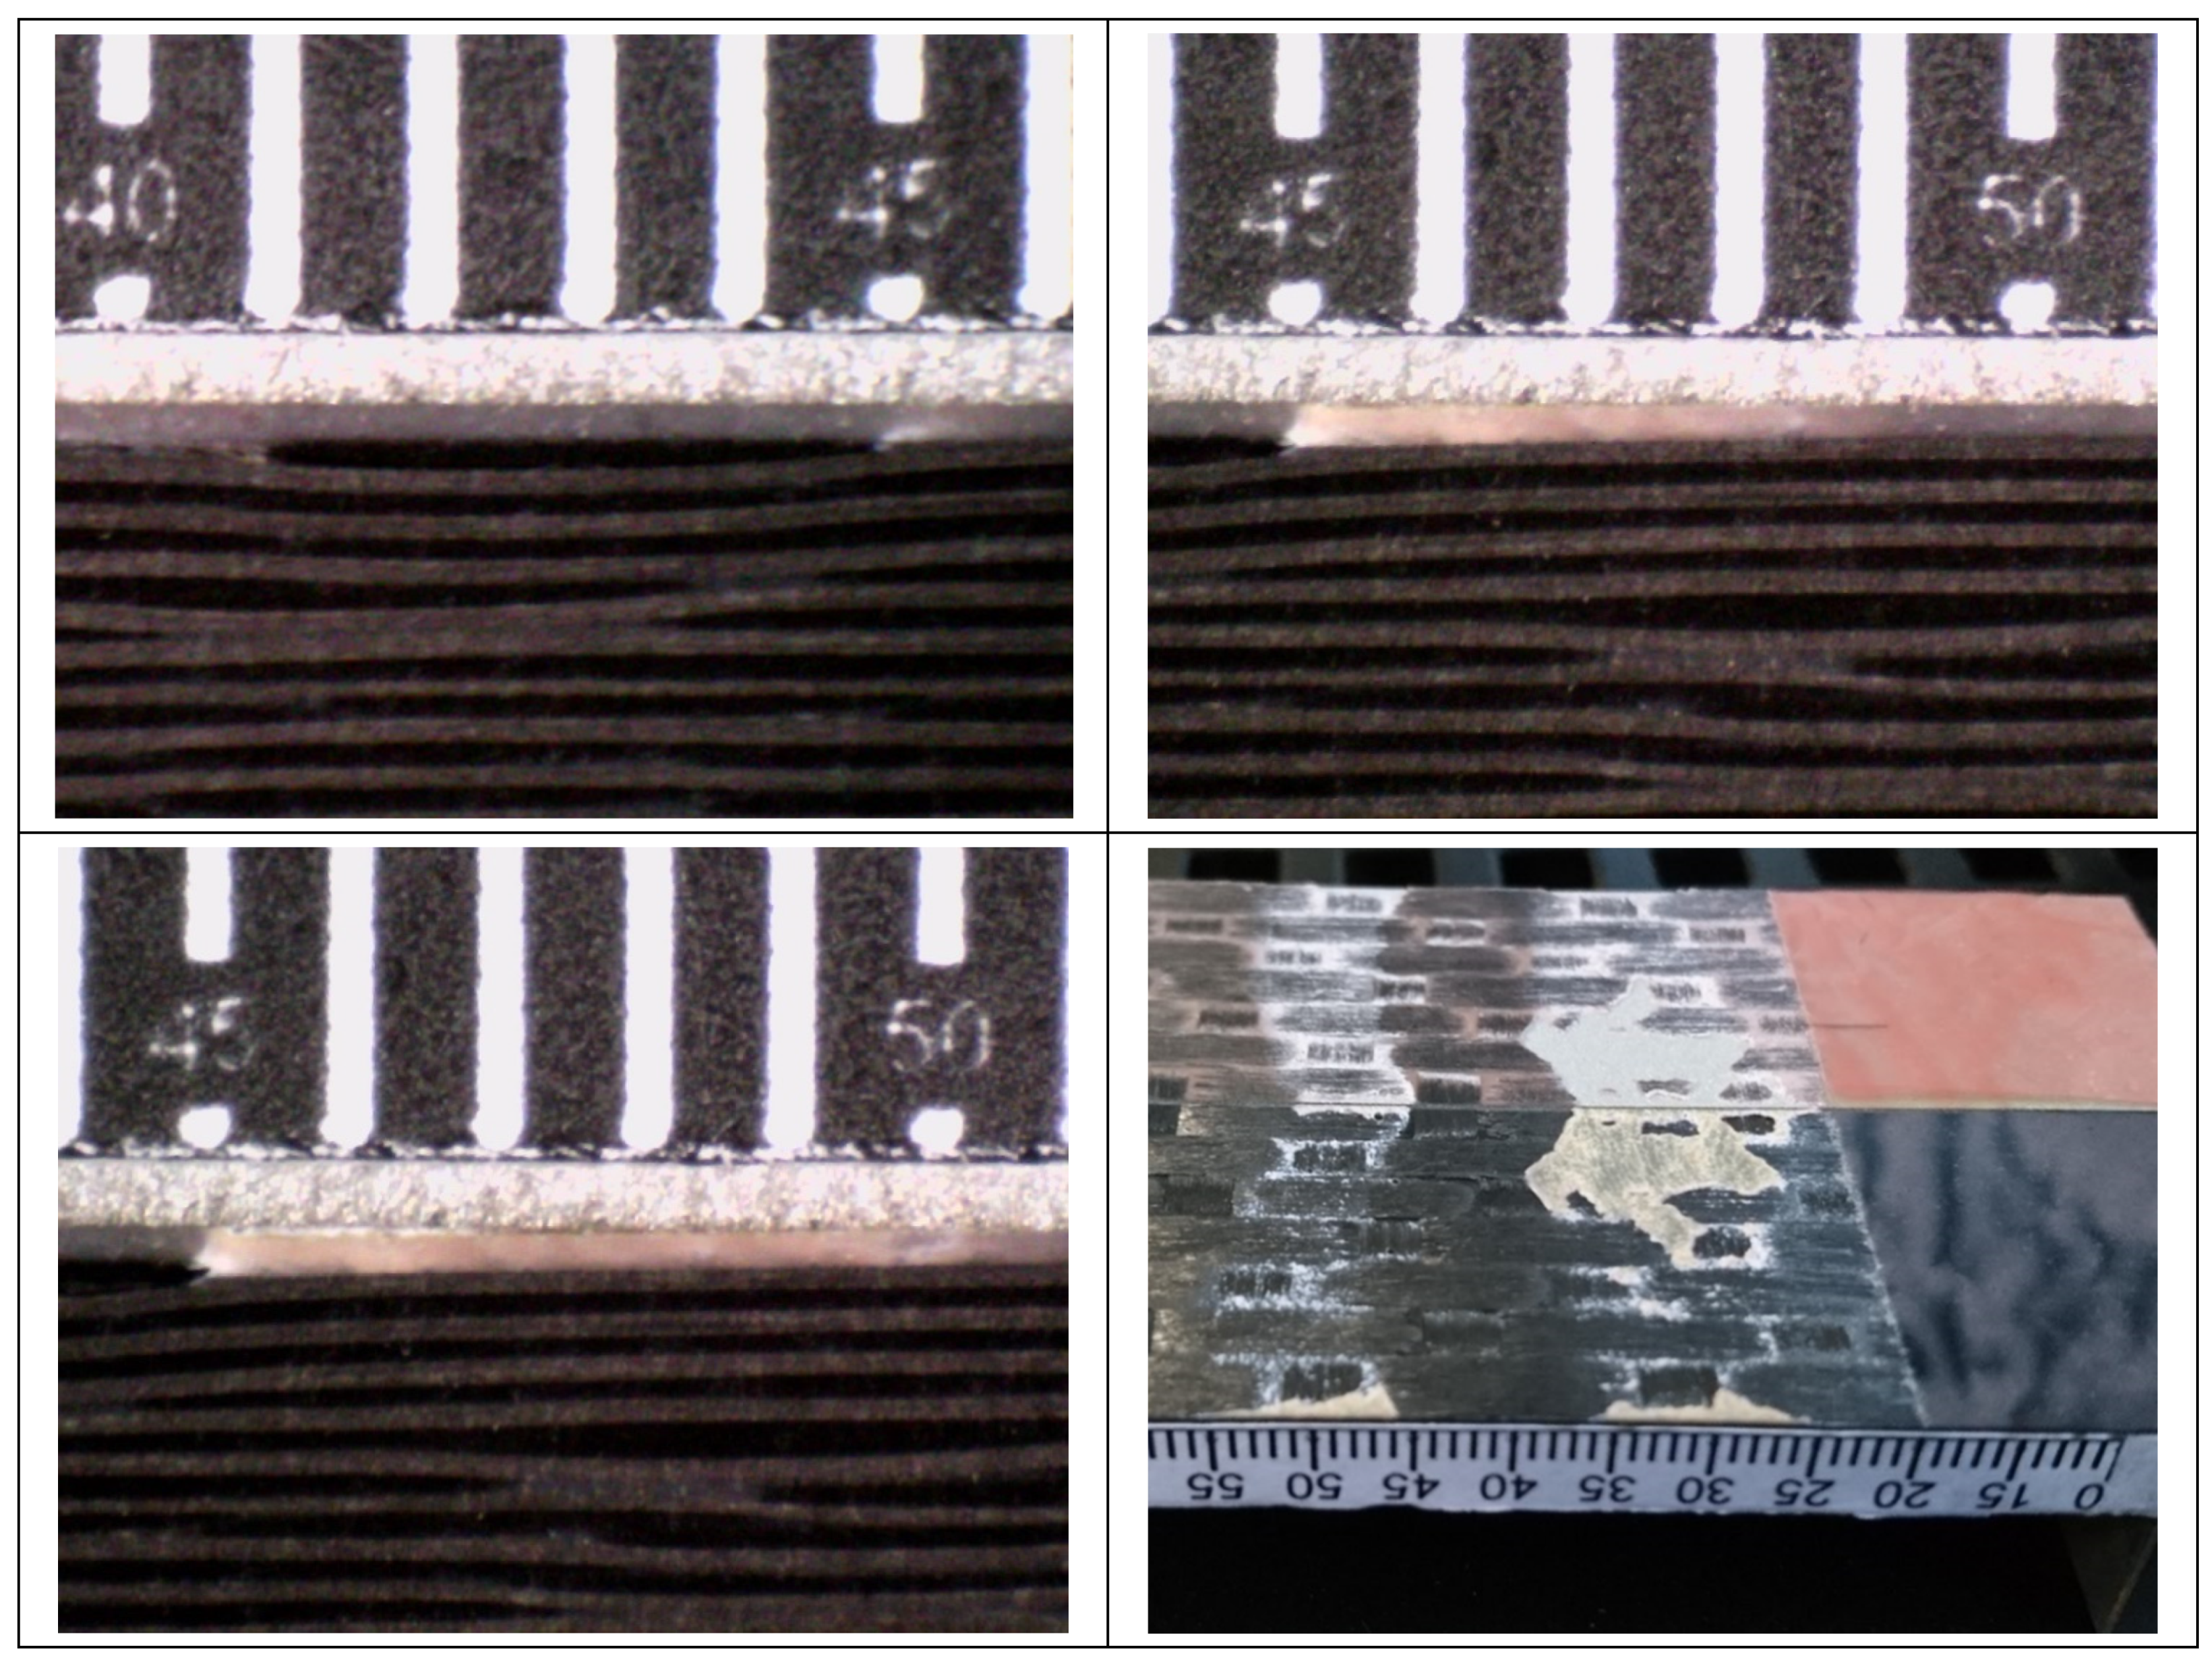
- Precracking seems to have occurred within the adhesive layer, for a few millimeters;
- During the fracture test, the defect initially propagates within the adhesive layer for 1–2 mm (the first couple of crack length measurements) and then jumps to the interface between the adhesive and the composite;
- Subsequently (Figure 28), a delamination crack starts at the first interply close to the adhesive layer, then the main crack and the delamination crack run together until a second delamination crack develops at the second interply from the adhesive layer, which causes a noticeable bridging effect. From this time on, the main crack stops and the two delaminations run in parallel, again with some bridging given by the interposed ply.
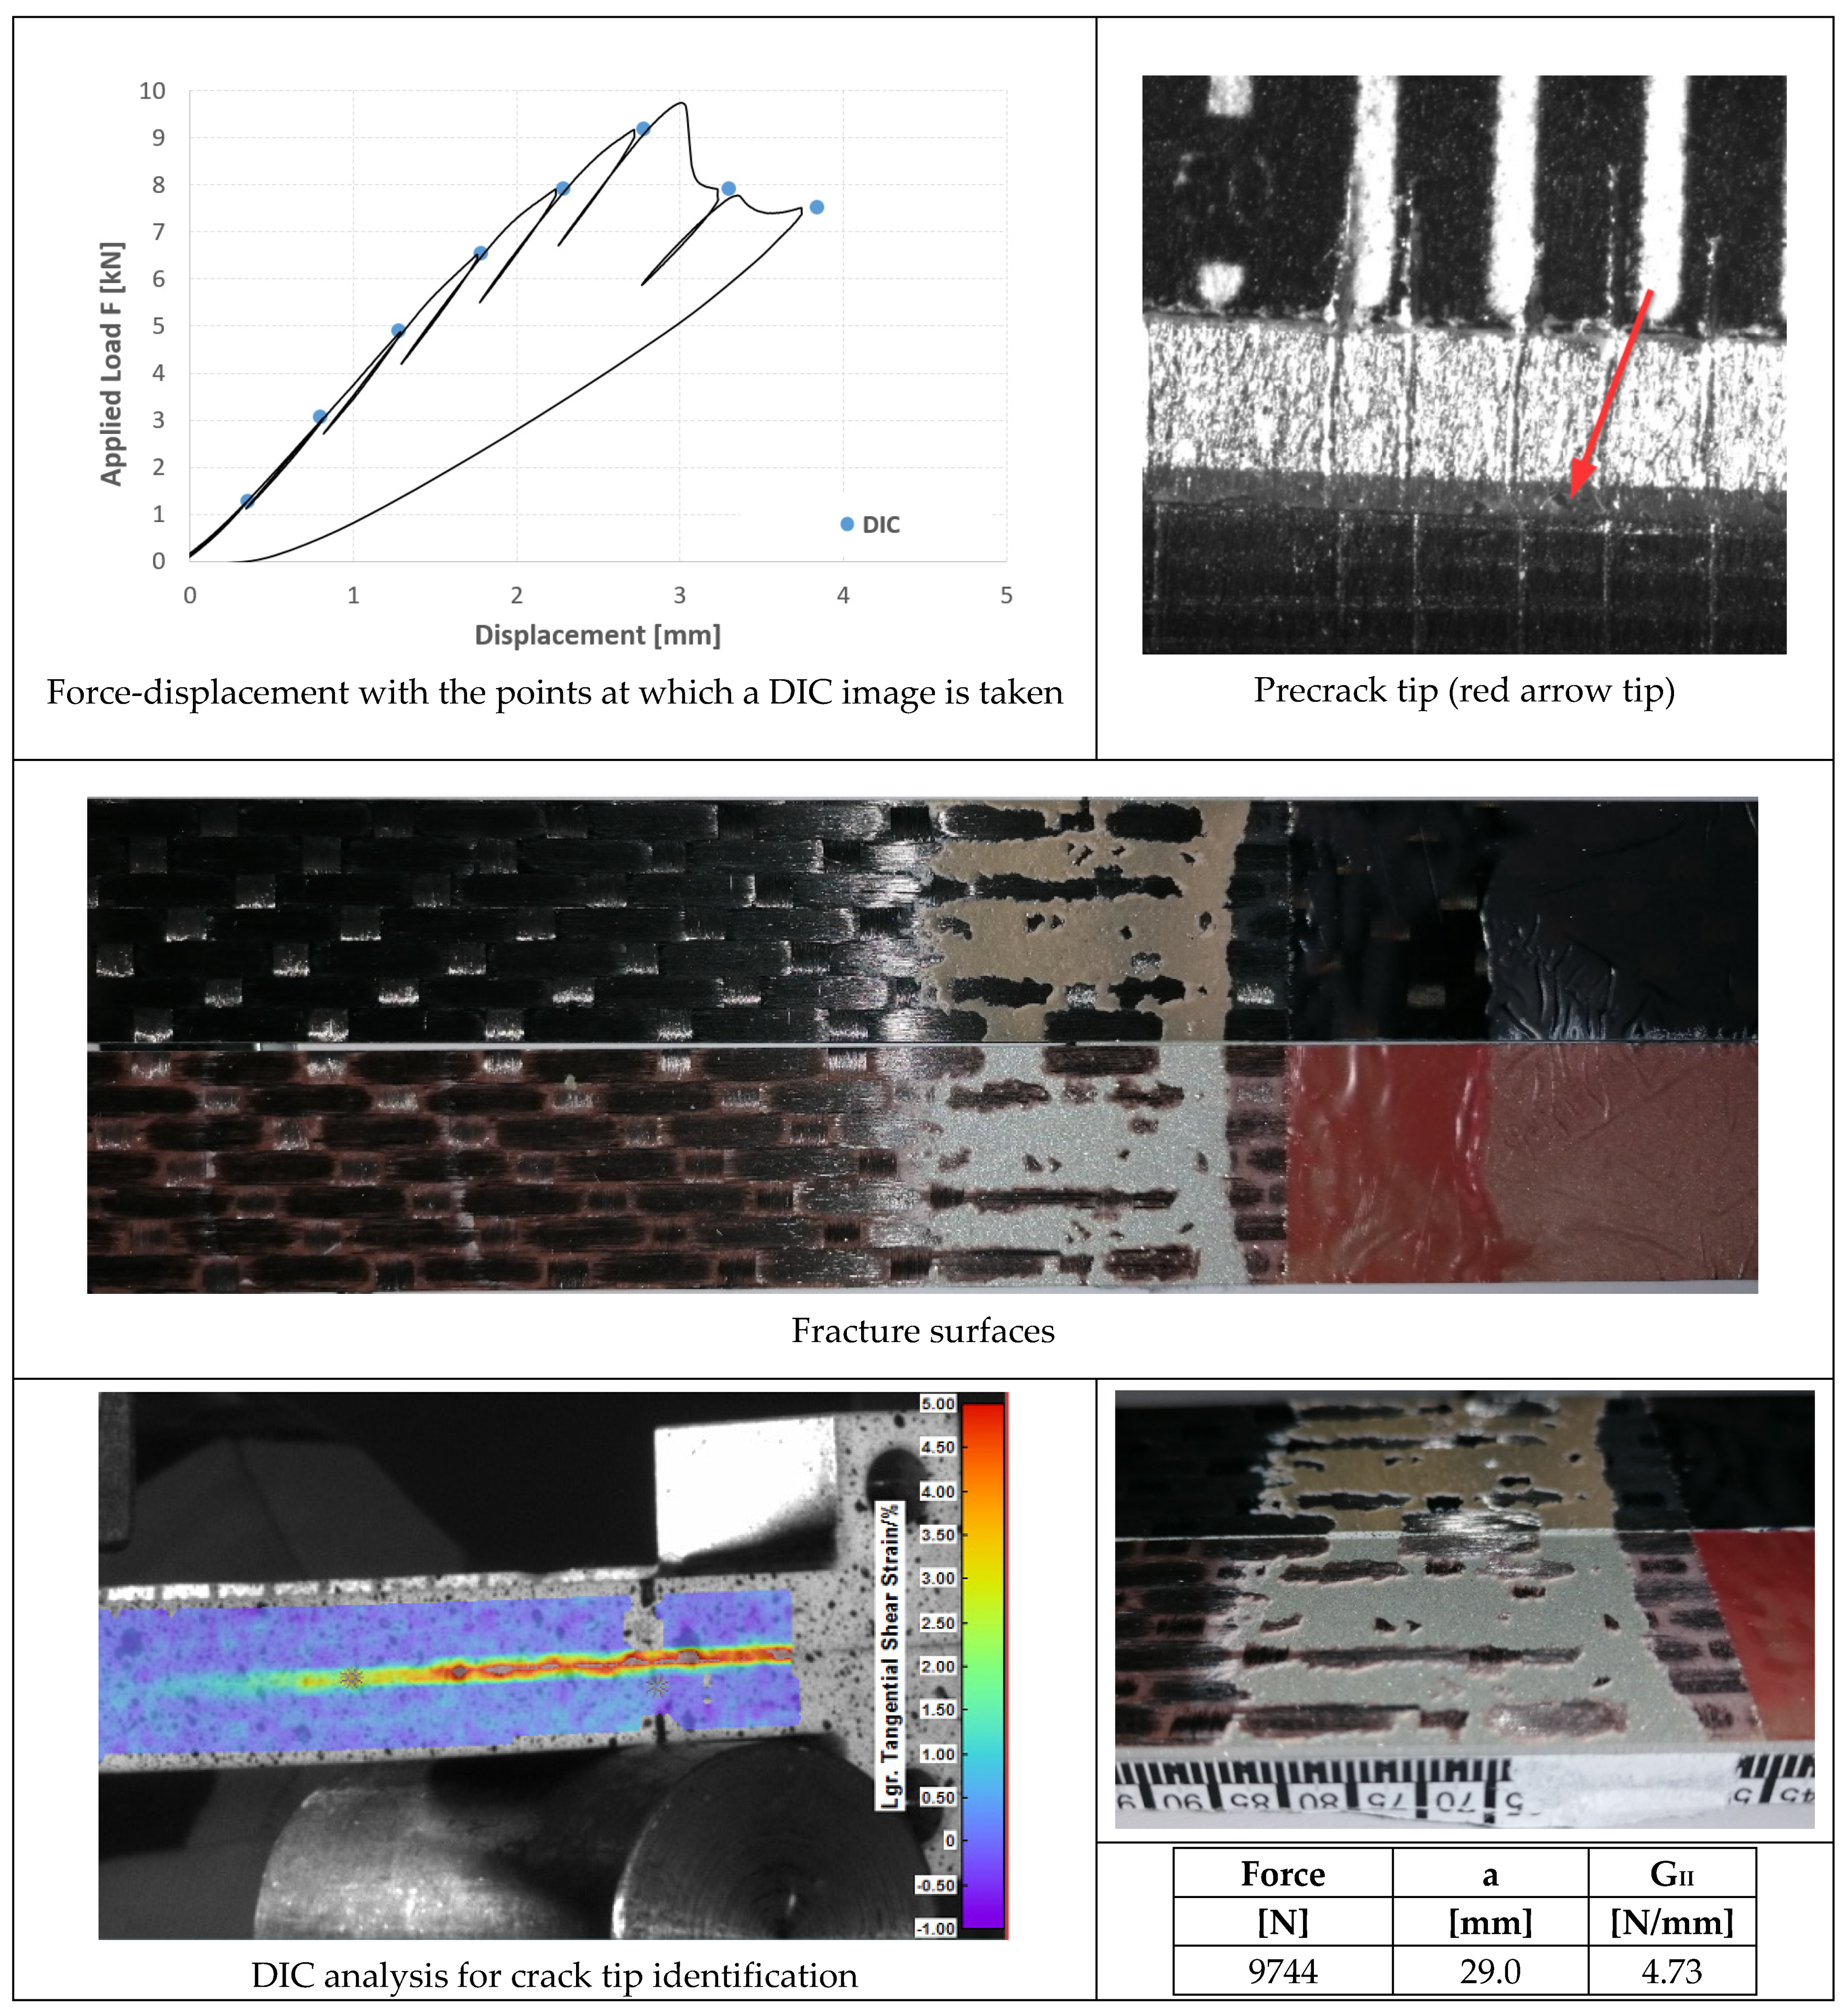
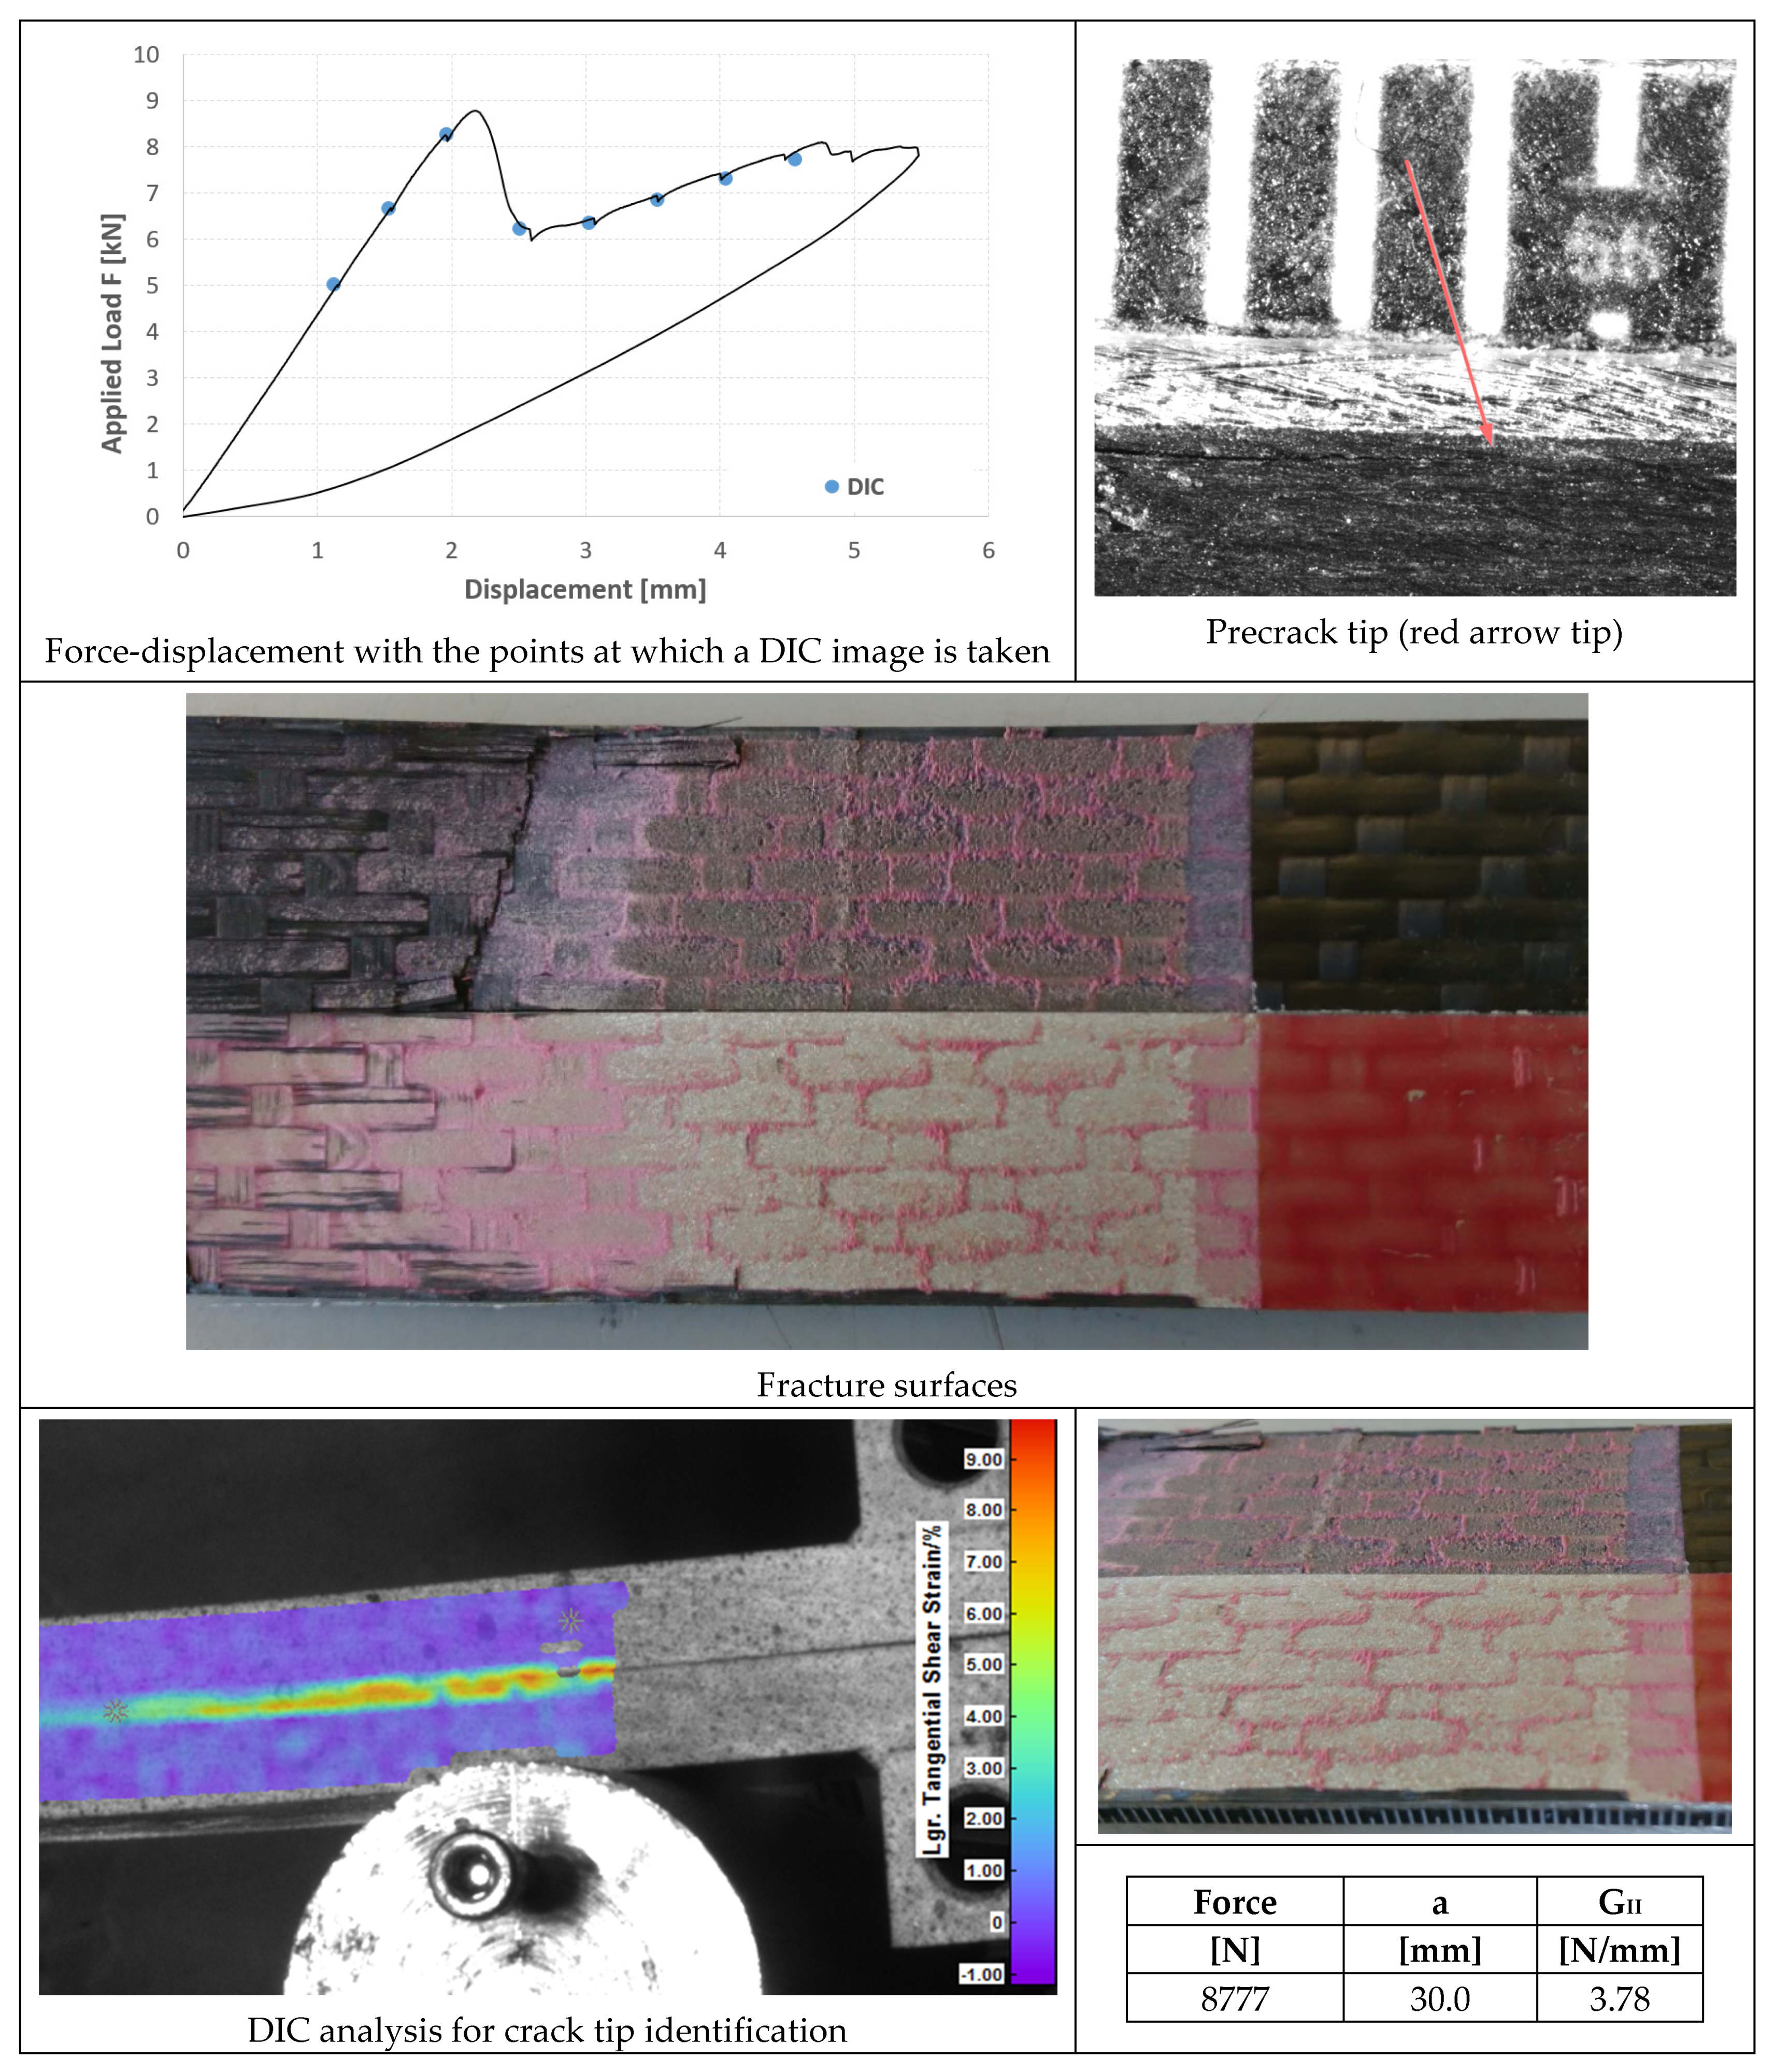
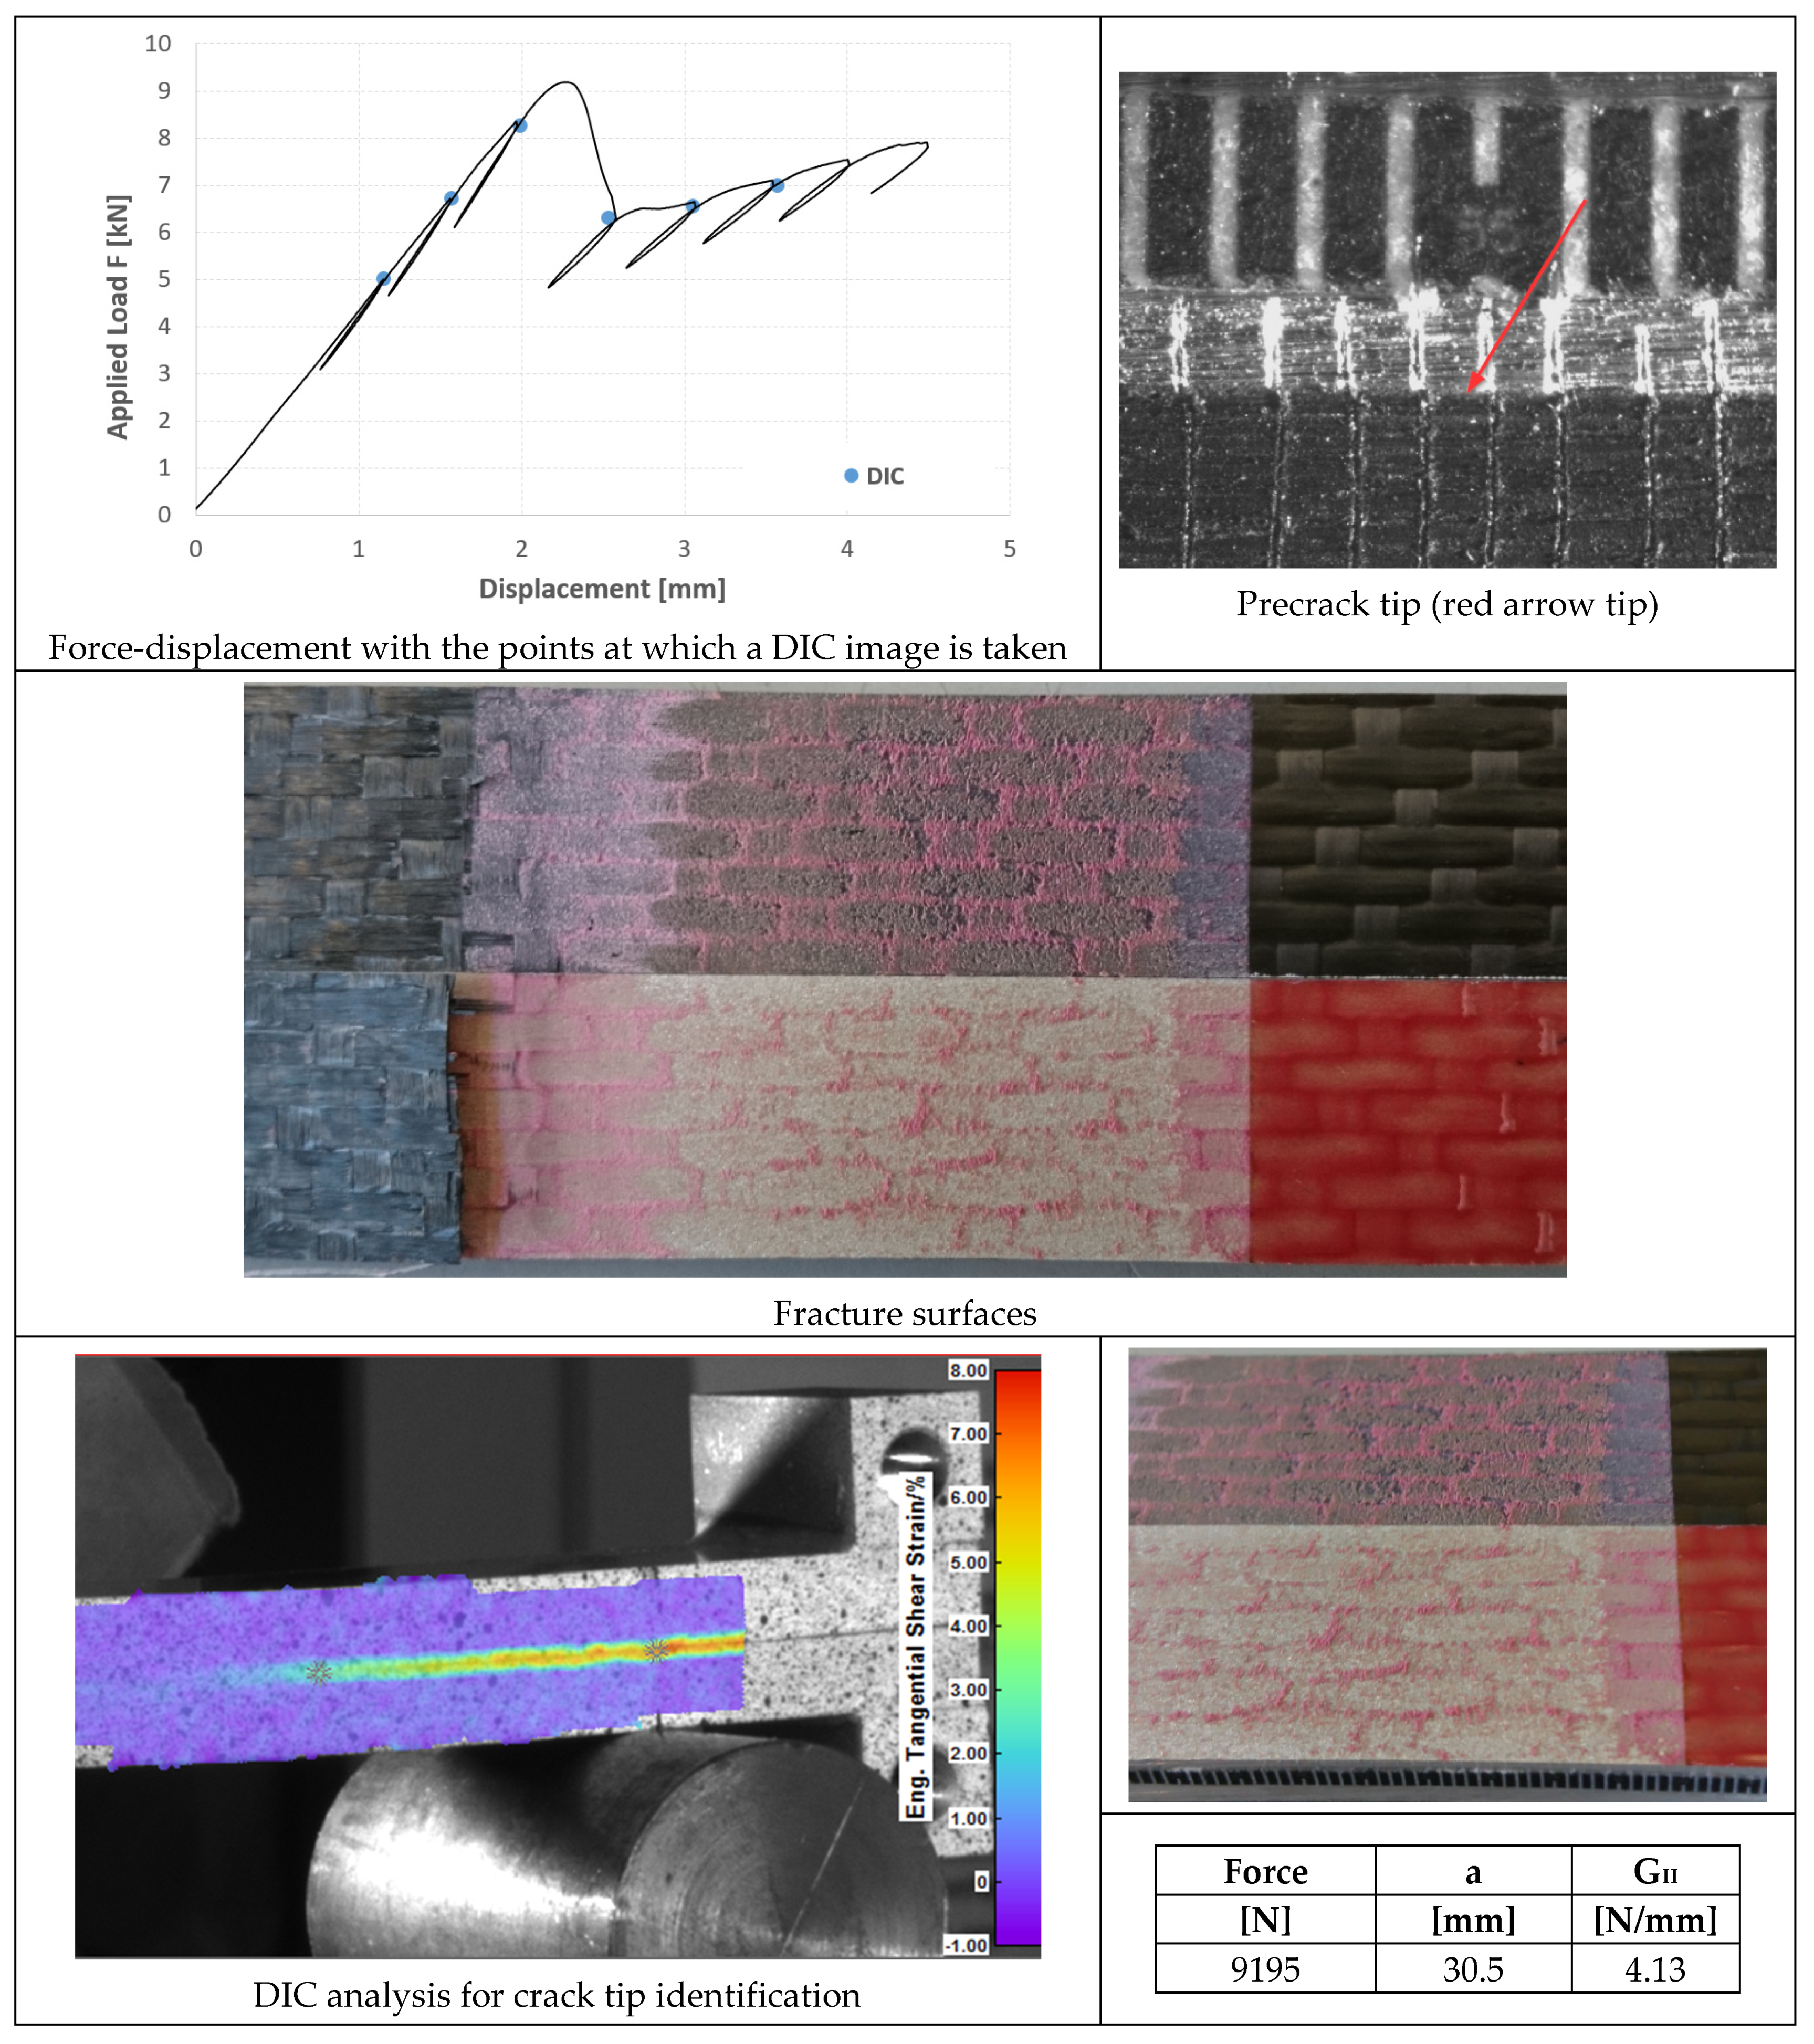
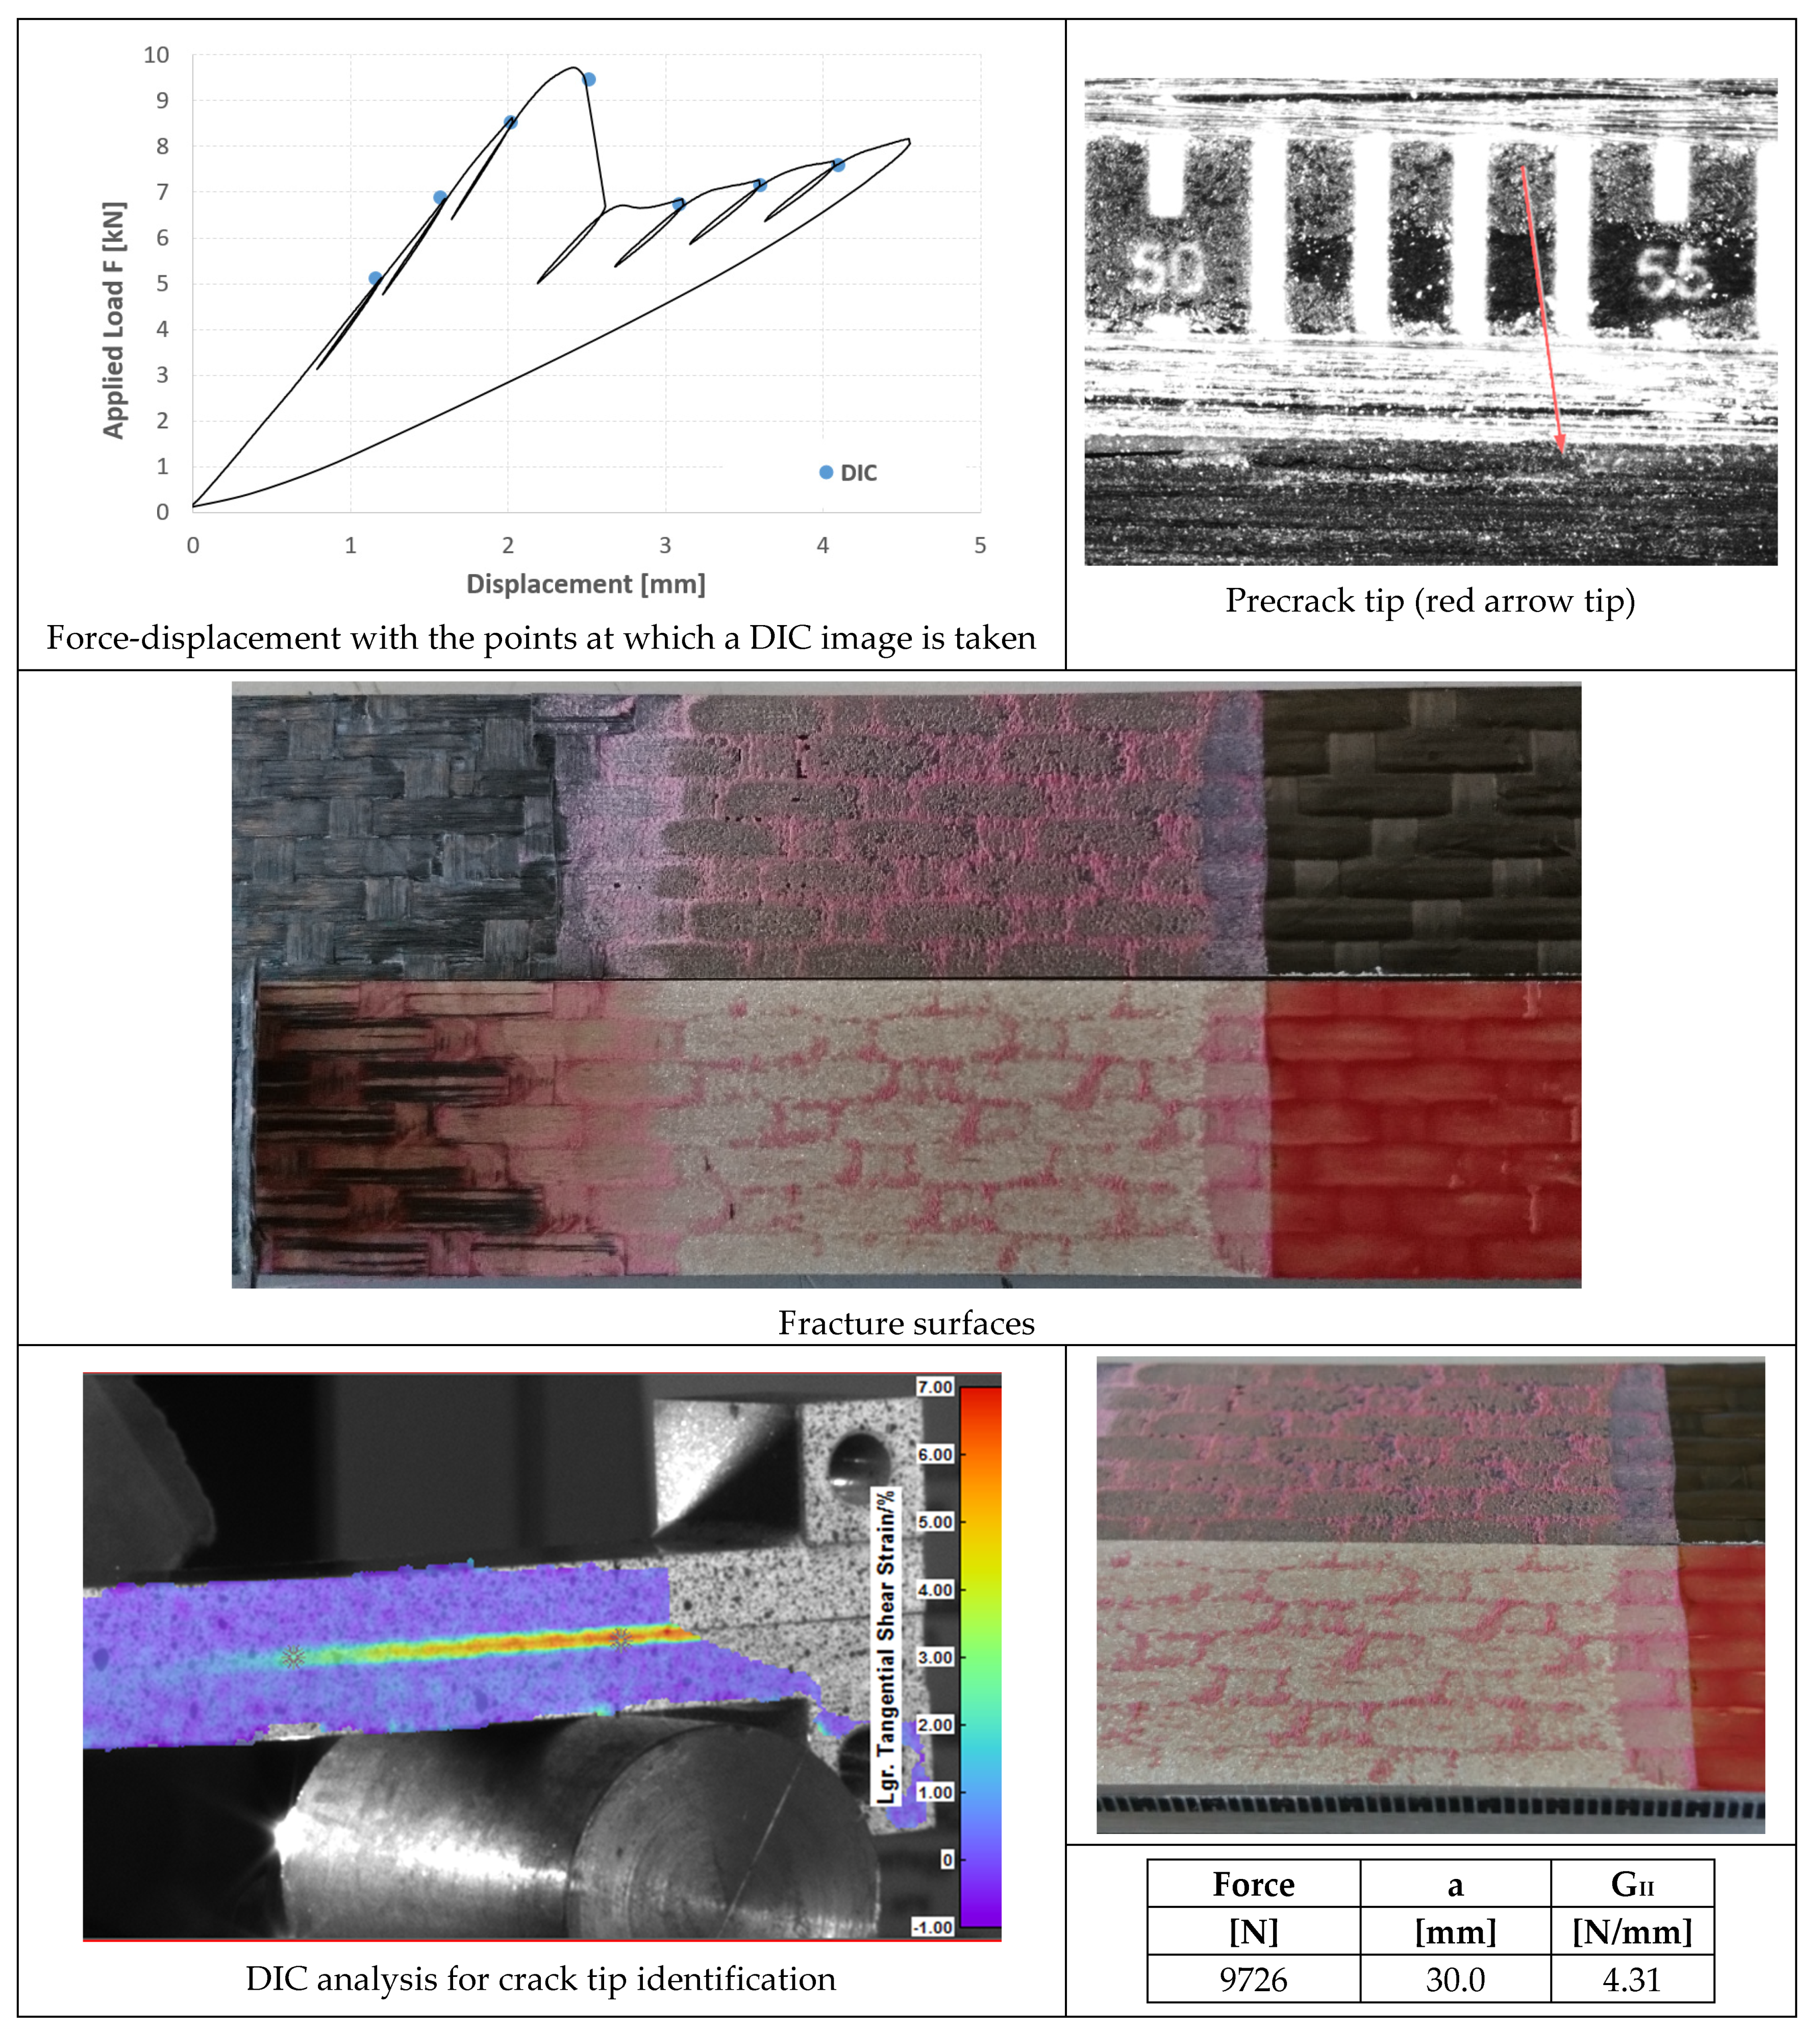
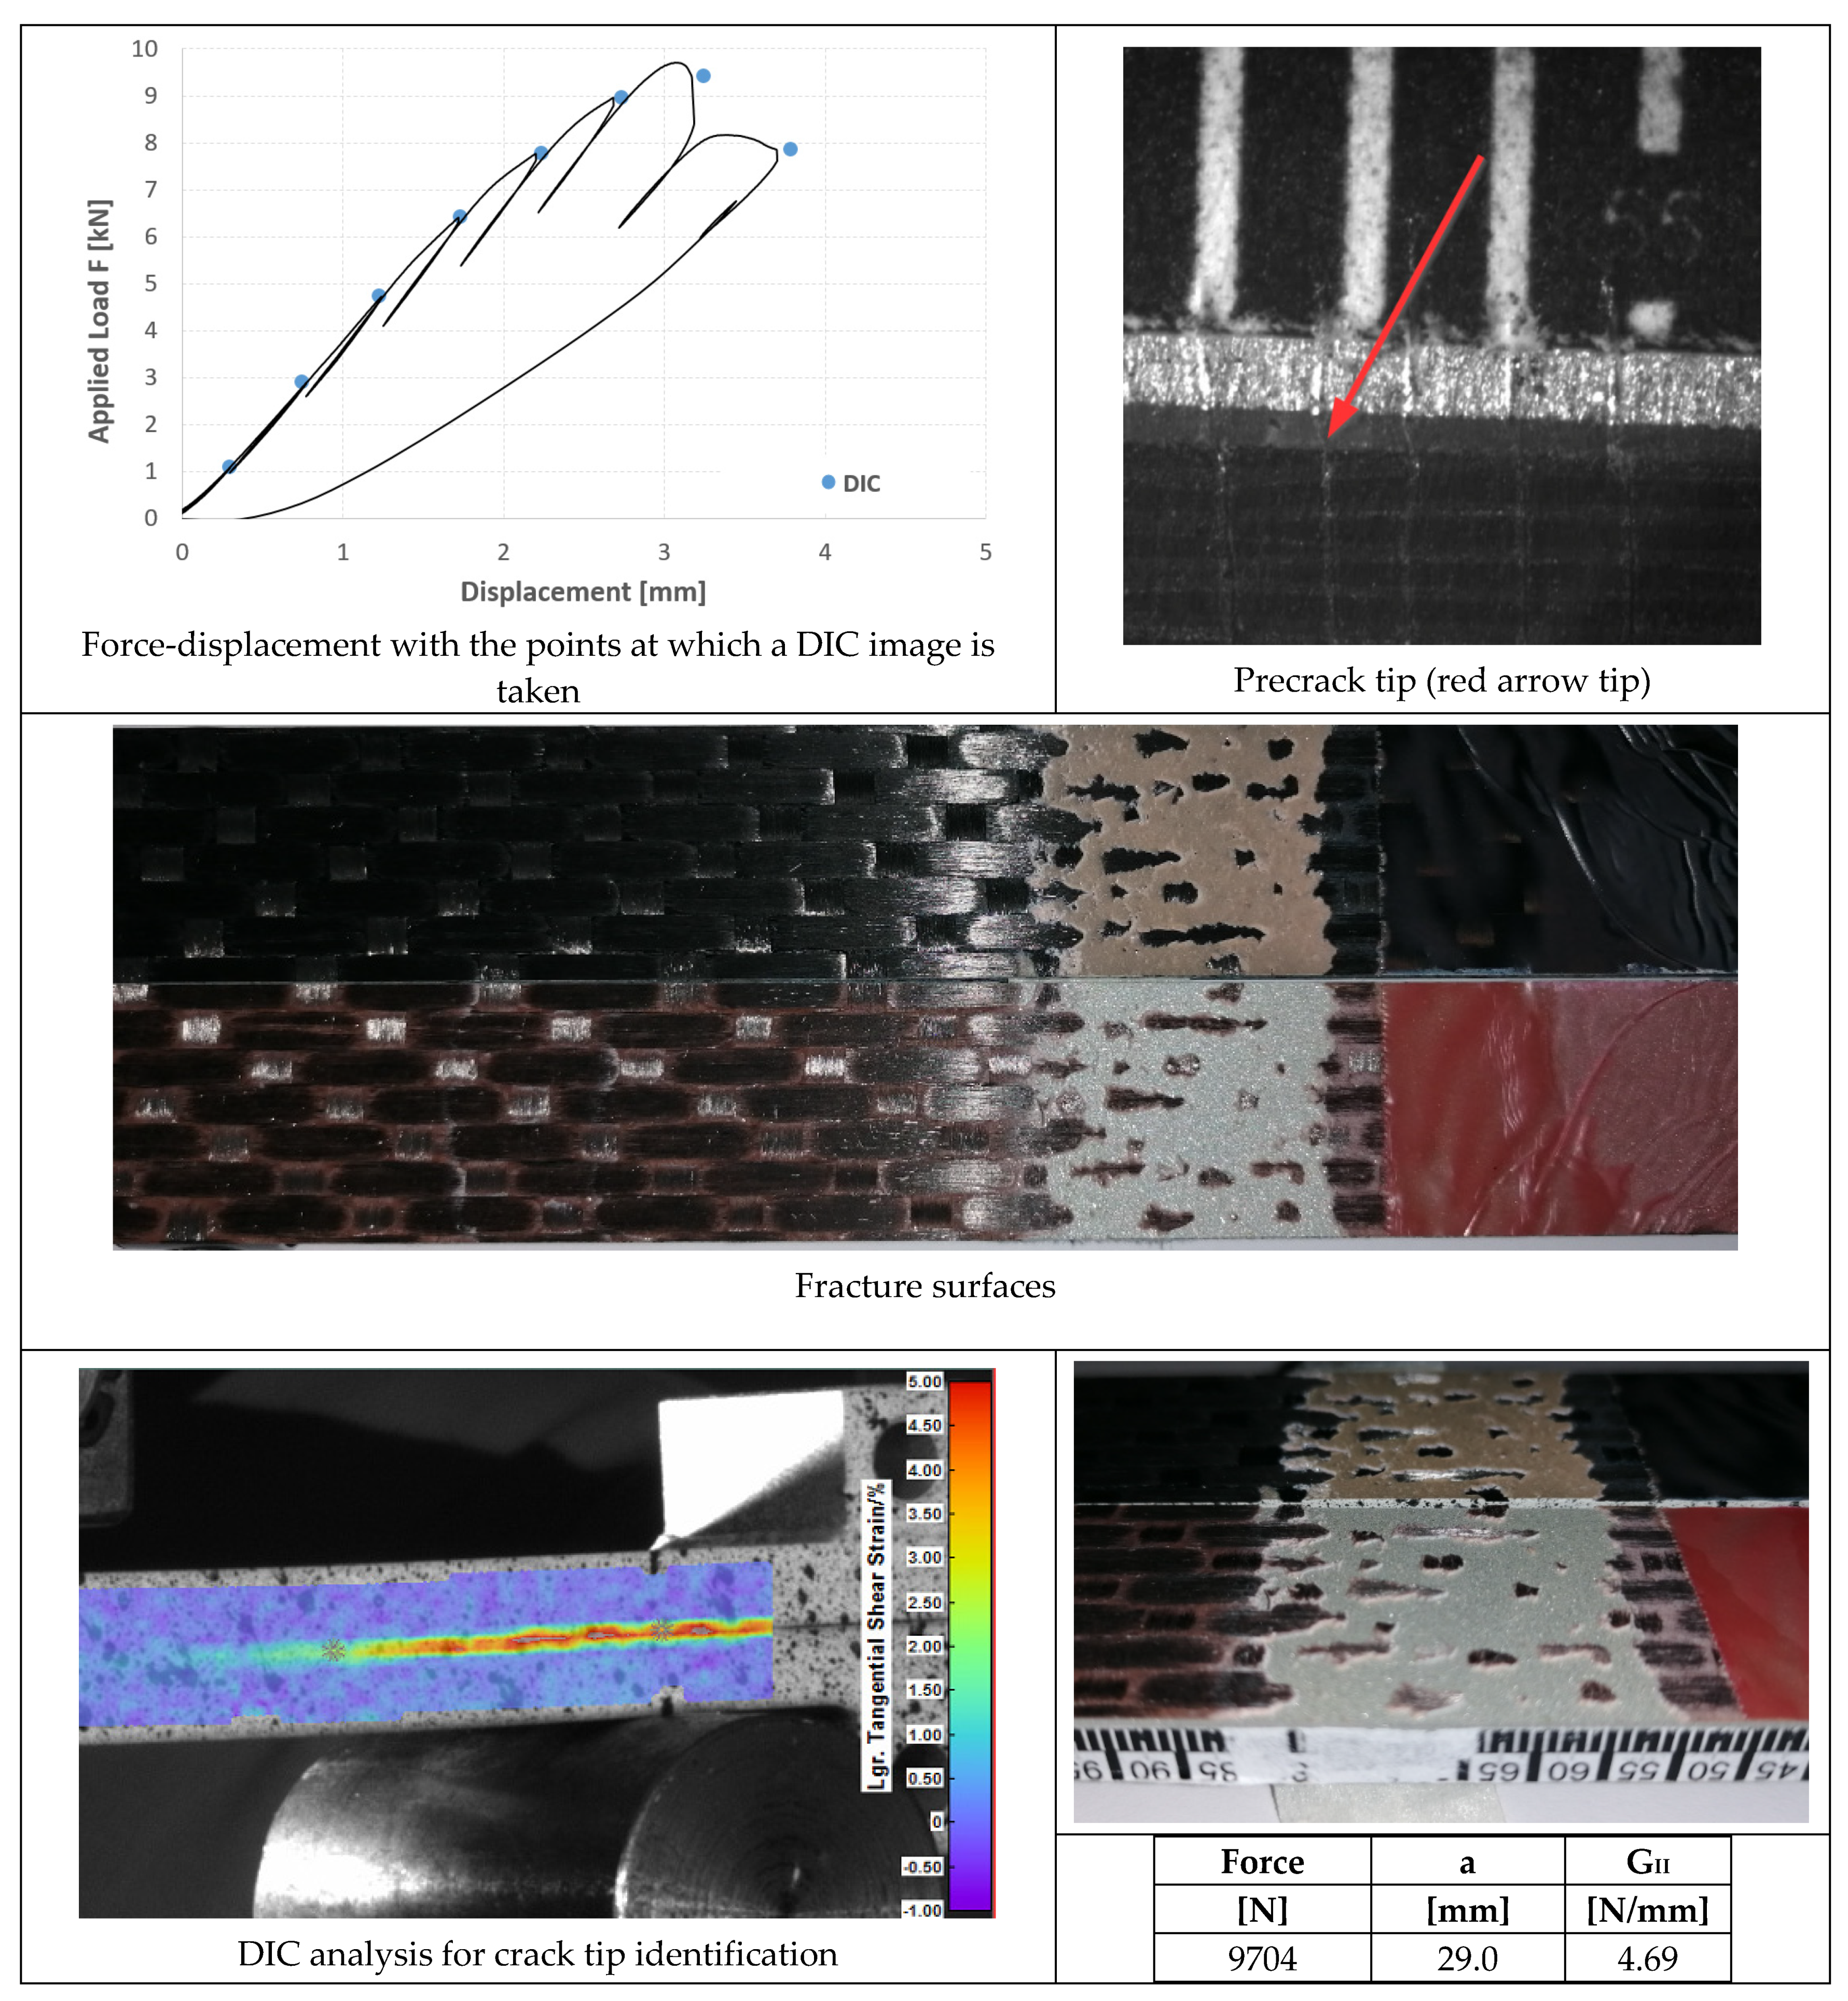
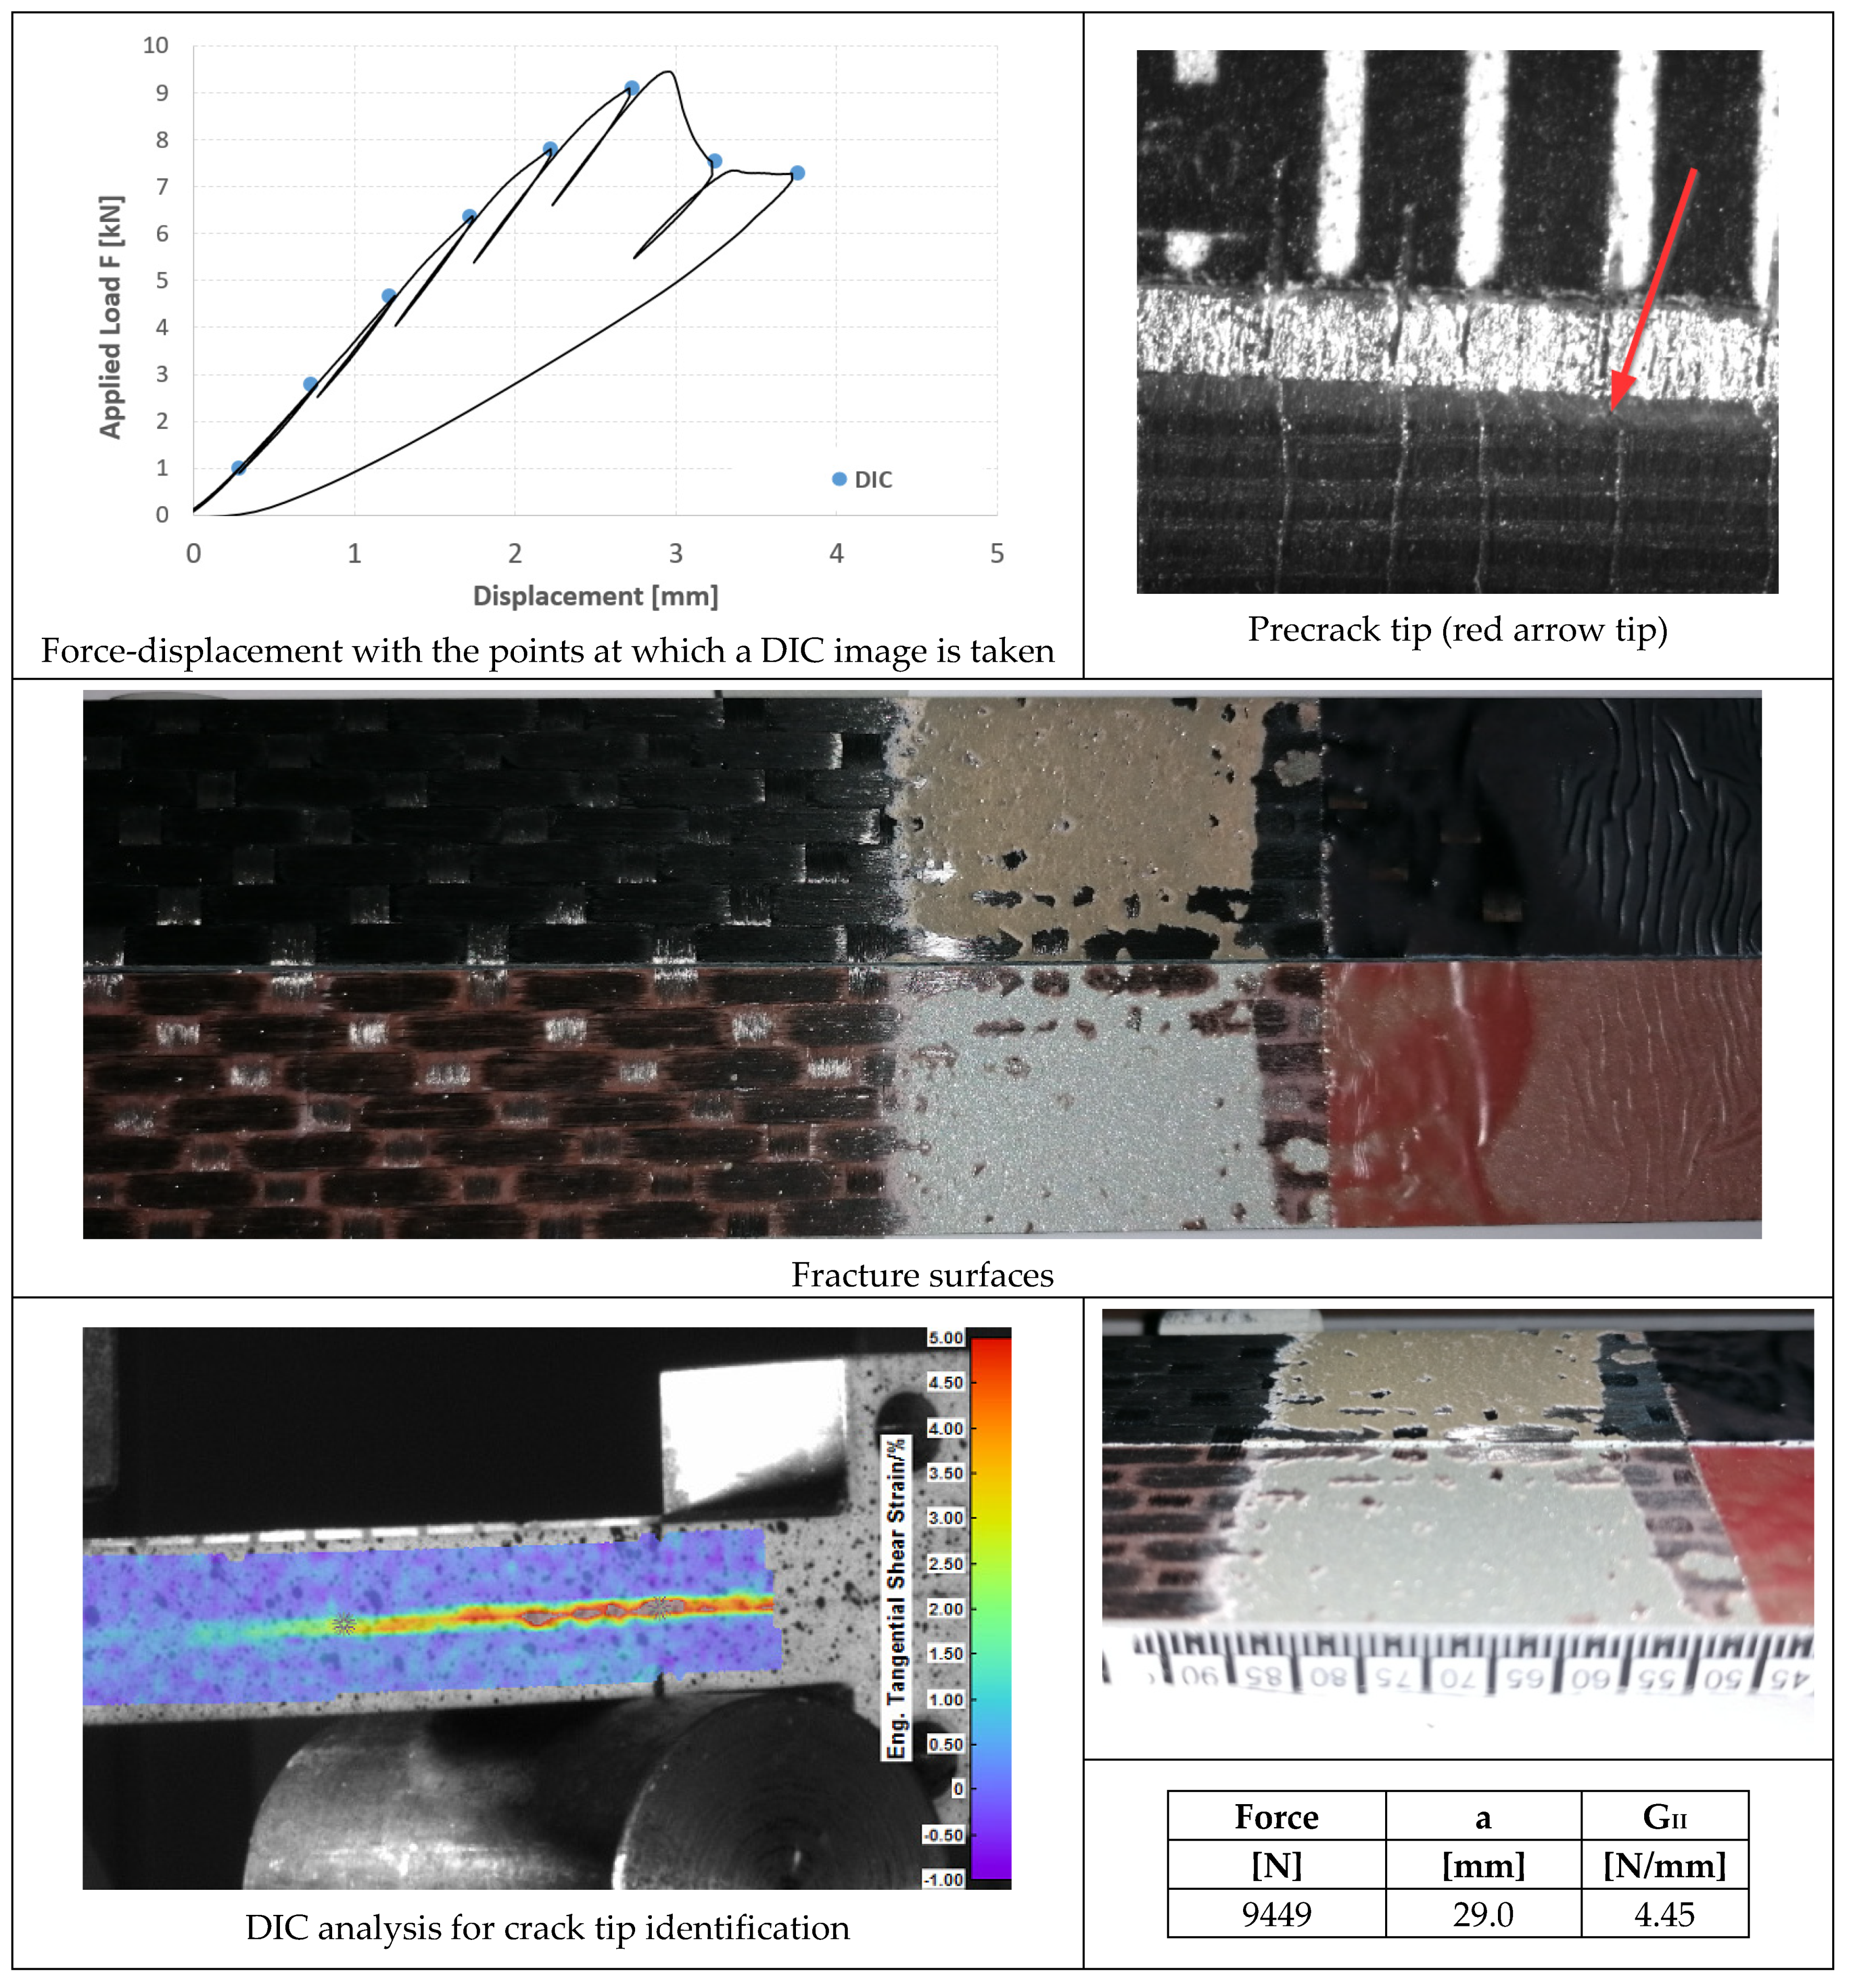
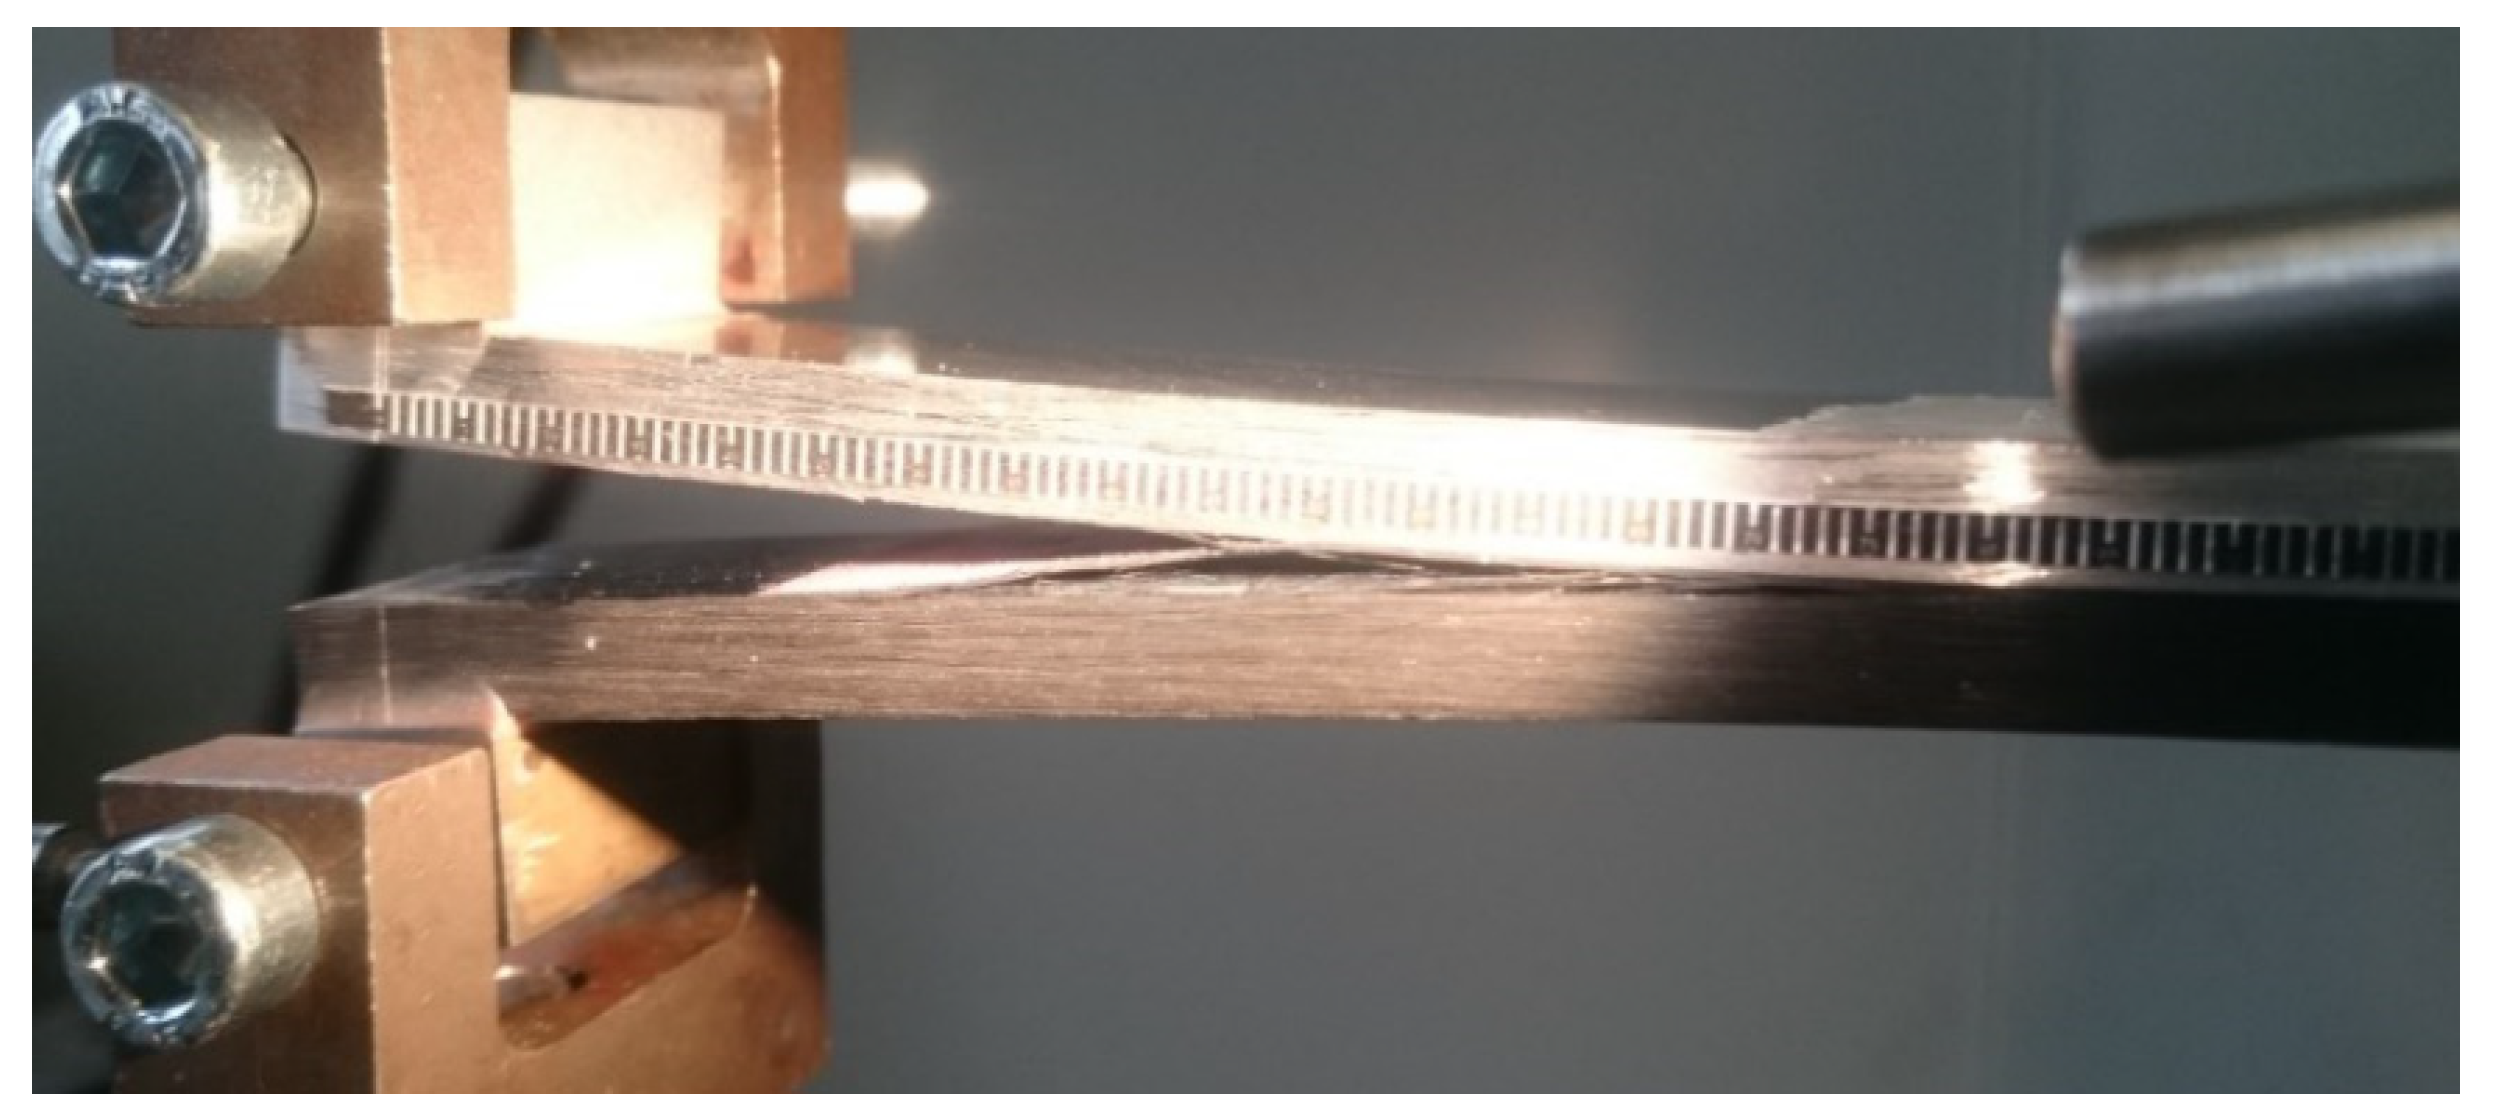
4.4. ENF Tests
- Precracking in Mode I occurs for a few millimeters within the adhesive layer;
- Mode II fracture is predominantly cohesive. The crack appears to run near the interface between aluminum and adhesive, but in any case in the adhesive layer, except for a small strip on the outer side of the surface where the clean aluminum surface can be seen;
- Precracking always takes place at the interface between the adhesive and the composite for a length of around 5 mm;
- Mode II fracture is mainly interfacial between aluminum and adhesive (that is at the opposite interface with respect to the precracking), leaving only a few small areas with some composite ripples;
- It was noted by FEM analysis that in all the tests there was a slight plasticization of the aluminum adherend. Excluding the plastic deformation energy from the FEM evaluation of GIIc in order to obtain the adhesive property and not an apparently higher value, the three tests performed with this adhesive provide an average fracture toughness of 4.62 ± 0.15 N/mm.
5. Conclusions
Author Contributions
Funding
Data Availability Statement
Conflicts of Interest
References
- Camanho, P.P.; Tong, L. Composite Joints and Connections; Woodhead Publishing: Cambridge, UK, 2011. [Google Scholar]
- Vassilopoulos, A.P. Fatigue and Fracture of Adhesively Bonded Composite Joints; Woodhead Publishing: Cambridge, UK, 2015. [Google Scholar]
- Matthews, F.I.; Kilty, P.F.; Godwin, E. Review of the Strength of Joints in Fibre-Reinforced Plastics: Part 2. Adhesively bonded joints. Composites 1982, 13, 29–37. [Google Scholar] [CrossRef]
- Adams, R.D. Strength Predictions for Lap Joints, Especially with Composite Adherends. A Review. J. Adhes. 1989, 30, 219–242. [Google Scholar] [CrossRef]
- Teixeira de Freitas, S.; Sinke, J. Adhesion properties of bonded composite-to-Aluminium joints using peel tests. J. Adhes. 2014, 90, 511–525. [Google Scholar] [CrossRef]
- Teixeira de Freitas, S.; Sinke, J. Failure analysis of adhesively-bonded skin-to-stiffener joints: Metal–metal vs. composite–metal. Eng. Fail. Anal. 2015, 56, 2–13. [Google Scholar] [CrossRef]
- Bak, B.L.; Sarrado, C.; Turon, A.; Costa, J. Delamination Under Fatigue Loads in Composite Laminates: A Review on the Observed Phenomenology and Computational Methods. Appl. Mech. Rev. 2014, 66, 1–24. [Google Scholar] [CrossRef]
- Cameselle-Molares, A.; Vassilopoulos, A.P.; Renart, J.; Turon, A.; Keller, T. Numerically-based method for fracture characterization of Mode I-dominated two-dimensional delamination in FRP laminates. Comp. Struct. 2019, 214, 143–152. [Google Scholar] [CrossRef]
- Ebadi-Rajoli, J.; Akhavan-Safar, A.; Hosseini-Toudeshky, H.; da Silva, L.F.M. Progressive damage modeling of composite materials subjected to mixed mode cyclic loading using cohesive zone model. Mech. Mat. 2020, 143, 103322. [Google Scholar] [CrossRef]
- Streitferdt, A.; Rudolph, N.; Taha, I. Co-Curing of CFRP-Steel Hybrid Joints Using the Vacuum Assisted Resin Infusion Process. Appl. Compos. Mater. 2017, 24, 1137–1149. [Google Scholar] [CrossRef]
- Kea, L.; Lia, C.; He, J.; Dong, S.; Chen, C.; Jiao, Y. Effects of elevated temperatures on mechanical behavior of epoxy adhesives and CFRP-steel hybrid joints. Comp. Struct. 2020, 235, 111789. [Google Scholar] [CrossRef]
- Sorrentino, L.; Polini, W.; Bellini, C.; Parodo, G. Surface treatment of CFRP: Influence on single lap joint performances. Int. J. Adhes. Adhes. 2018, 85, 225–233. [Google Scholar] [CrossRef]
- Banea, M.D.; Rosioara, M.; Carbas, R.J.C.; da Silva, L.F.M. Multi-material adhesive joints for automotive industry. Comp. B 2018, 151, 71–77. [Google Scholar] [CrossRef]
- Kupski, J.; Teixeira de Freitas, S. Design of adhesively bonded lap joints with laminated CFRP adherends: Review, challenges and new opportunities for aerospace structures. Comp. Struct. 2021. [Google Scholar] [CrossRef]
- Shang, X.; Marques, E.A.S.; Machado, J.J.M.; Carbas, R.J.C.; Jiang, D.; da Silva, L.F.M. Review on techniques to improve the strength of adhesive joints with composite adherends. Comp. B 2019, 177, 107363. [Google Scholar] [CrossRef]
- Moroni, F.; Pirondi, A.; Pernechele, C.; Gaita, A.; Vescovi, L. Comparison of tensile strength and fracture toughness under mode I and II loading of co-cured and co-bonded CFRP joints. Frat. Integrità Strutt. 2019, 47, 294–302. [Google Scholar] [CrossRef]
- Moroni, F.; Pirondi, A.; Pernechele, C.; Vescovi, L.; Collini, L. Influence of material and manufacturing technology on the failure behavior of composite laminate bonded joints. Proc. Struct. Integr. 2019, 18, 516–524. [Google Scholar] [CrossRef]
- Bernasconi, A.; Beretta, S.; Moroni, F.; Pirondi, A. Local Stress Analysis of the Fatigue Behaviour of Adhesively Bonded Thick Composite Laminates. J. Adhes. 2010, 86, 480–500. [Google Scholar] [CrossRef]
- Goland, M.; Reissner, E. The stresses in cemented joints. J. Appl. Mech. 1944, 11, A17–A27. [Google Scholar] [CrossRef]


| Material | Modulus of Elasticity (GPa) | Tensile Strength (MPa) | Yield Strength (MPa) | Lap-Shear Strength (MPa) | |
|---|---|---|---|---|---|
| T1100 | 0° tensile | 89 | 1900 | - | - |
| 90° tensile | 87 | 1740 | - | - | |
| 0° compressive | 76 | 800 | - | - | |
| 90° compressive | 80 | 740 | - | - | |
| 0° Flexural | 75 | 1060 | - | - | |
| 0° ILSS | - | 74 | - | - | |
| 90° ILSS | - | 73 | - | - | |
| Ergal | 72,000 | 545 | 475 | - | |
| AF 163 | 1.1 * | 48 * | - | 48 ** | |
| 9323 | 2.3 * | - | - | 28 *** | |
| Material | Modulus of Elasticity (MPa) | Strength (MPa) | |
|---|---|---|---|
| T1100 laminate | Out-of-plane tensile (ASTM D 7291) | 11,288 ± 285 | 47.1 ± 2.95 |
| Flexural | 62,500 | - | |
| Out-of-plane shear | 19,000 | - | |
| Specimen | Failure Location | τa [MPa] |
|---|---|---|
| SLJ_AF163_01 | TLC | 41.45 |
| SLJ_AF163_02 | TLC | 39.47 |
| SLJ_AF163_03 | TLC | 39.02 |
| SLJ_AF163_04 | TLC | 38.02 |
| SLJ_AF163_05 | TLC | 38.31 |
| Avg. (all) | 39.30 | |
| STD. DEV. (all) | 1.34 |
| Specimen | Failure Location | τa [MPa] |
|---|---|---|
| SLJ_9323_01 | FT | 32.10 |
| SLJ_9323_02 | FT/adhesive | 30.96 |
| SLJ_9323_03 | FT | 31.80 |
| SLJ_9323_04 | FT/adhesive | 31.71 |
| SLJ_9323_05 | FT | 32.10 |
| Avg. (all) | 31.70 | |
| STD. DEV. (all) | 0.47 |
| Specimen | Failure Location | Smax [MPa] |
|---|---|---|
| Traz-BJ_AF163_01 | Composite | 34.35 |
| Traz-BJ_AF163_02 | Composite | 31.27 |
| Traz-BJ_AF163_03 | Composite | 43.27 |
| Traz-BJ_AF163_04 | Composite | 33.64 |
| Traz-BJ_AF163_05 | Composite | 33.38 |
| Avg. (all) | 35.18 | |
| STD. DEV. (all) | 4.17 | |
| Avg. (w/out 03) | 33.16 | |
| STD. DEV. (w/out 03) | 1.15 |
| Spcimen | Failure Location | Smax [MPa] |
|---|---|---|
| Traz-BJ_9323_01 | Composite (1st-2nd ply) | 38.97 |
| Traz-BJ_9323_02 | Composite | 31.37 |
| Traz-BJ_9323_03 | Composite (1st-2nd ply) | 34.11 |
| Traz-BJ_9323_04 | Composite | 35.24 |
| Traz-BJ_9323_05 | Composite | 32.22 |
| AV. (all) | 34.38 | |
| STD. DEV. (all) | 2.98 | |
| AV. (1st–2nd ply) | 36.54 | |
| STD. DEV. (1st–2nd ply) | 2.43 | |
| AV. (Composite) | 32.94 | |
| STD. DEV. (Composite) | 1.66 |
Publisher’s Note: MDPI stays neutral with regard to jurisdictional claims in published maps and institutional affiliations. |
© 2021 by the authors. Licensee MDPI, Basel, Switzerland. This article is an open access article distributed under the terms and conditions of the Creative Commons Attribution (CC BY) license (https://creativecommons.org/licenses/by/4.0/).
Share and Cite
Moroni, F.; Pirondi, A.; Pernechele, C.; Vescovi, L. Comparison of Tensile Strength and Fracture Toughness of Co-Bonded and Cold-Bonded Carbon Fiber Laminate-Aluminum Adhesive Joints. Materials 2021, 14, 3778. https://doi.org/10.3390/ma14143778
Moroni F, Pirondi A, Pernechele C, Vescovi L. Comparison of Tensile Strength and Fracture Toughness of Co-Bonded and Cold-Bonded Carbon Fiber Laminate-Aluminum Adhesive Joints. Materials. 2021; 14(14):3778. https://doi.org/10.3390/ma14143778
Chicago/Turabian StyleMoroni, Fabrizio, Alessandro Pirondi, Chiara Pernechele, and Luca Vescovi. 2021. "Comparison of Tensile Strength and Fracture Toughness of Co-Bonded and Cold-Bonded Carbon Fiber Laminate-Aluminum Adhesive Joints" Materials 14, no. 14: 3778. https://doi.org/10.3390/ma14143778
APA StyleMoroni, F., Pirondi, A., Pernechele, C., & Vescovi, L. (2021). Comparison of Tensile Strength and Fracture Toughness of Co-Bonded and Cold-Bonded Carbon Fiber Laminate-Aluminum Adhesive Joints. Materials, 14(14), 3778. https://doi.org/10.3390/ma14143778