Article

Assessment of Electrical Resistivity and Oxygen Diffusion Coefficient of Cementitious Materials from Microstructure Features

1
School of Civil and Water Engineering, Bengbu University, Bengbu 232008, China
2
College of Civil Engineering and Architecture, Zhejiang University of Water Resources and Electric Power, Hangzhou 310018, China
3
College of Civil Engineering and Architecture, Zhejiang University of Technology, Hangzhou 310034, China
4
Zhejiang University of Technology Engineering Design Group CO. LTD, Hangzhou 310014, China
*
Author to whom correspondence should be addressed.
Materials 2021, 14(12), 3141; https://doi.org/10.3390/ma14123141
Submission received: 6 May 2021 / Revised: 27 May 2021 / Accepted: 4 June 2021 / Published: 8 June 2021
(This article belongs to the Special Issue Sustainable, Self-Healing, and Functional Building Materials)

Abstract

:
A newly proposed modified non-contact electrical resistivity measurement was used to test the resistivity of concrete and cement mortar. The oxygen diffusion coefficients of concrete and mortar were determined by a gas diffusion measurement, and the capillary porosity of concrete and cement mortar was measured by mercury intrusion porosimetry (MIP) measurement. The obtained electrical resistivity and capillary porosity results were verified with other researchers’ data, the measured electrical resistivity results can be estimated by a simple equation from the capillary porosity results. The obtained oxygen diffusion coefficient results were quantitatively correlated with capillary porosity and electrical resistivity measurement results. The proposed equations can be practically used to assess the electrical resistivity and oxygen diffusion coefficient.

1. Introduction

The durability of concrete structures is mainly dependent upon its resistance to ingress of aggressive fluids or gases into the micropores in concrete. In general, cementitious materials are considered as porous composites, the interconnected pore structures are of great importance on their durability performance. The pore structure of cementitious materials determine the ingress of chloride [1,2,3], moisture [4,5], gas [6,7] and other ingredients, which may lead to corrosion of internal steel and thus cause service life reduction [8,9,10,11,12,13]. Therefore, the study on the pore structure of cement-based materials after maturity (28 days) is of great significance to the study of structural degradation mechanisms and the prediction of service life.
The electrical resistivity of cementitious materials is an important durability index since it can be directly related with the chloride transportation performance [1,2] and the microstructure [14] of concrete structures. There are many electrical resistivity measurements have been proposed. The most widely used methods include the Wenner method [15,16] and the method specified in ASTM C1202 [17]. The presence of metallic electrodes and the direct current usage bring two major concerns: (1) the polarization effect resulted from the DC current will influence the measurement results; (2) The poor contact between the metallic electrodes and the material will greatly influence the test [18]. A high frequency alternating current was adopted by some researchers to eliminate the polarization problem [19,20,21]. Nevertheless, the metallic electrodes still can cause the contact issue and the electrolysis of water can release gas which would affect the precision of the measurement [22]. To address the polarization and poor contact issues, Li et al. [22,23,24] developed a contactless cementitious materials’ electrical resistivity measurement apparatus. The device has been successfully applied to study the hydration mechanism under different curing conditions [25,26]. This device is proposed in the principle of transformer without the usage of electrodes [27]. An improvement on the non-contact electrical resistivity measurement has been made by previous researchers [14], the modified non-contact electrical resistivity can be used to measure the electrical resistivity of hardened cementitious materials without the presence of electrodes.
For cementitious materials, the gaseous-effective diffusion coefficient is of great importance to describe diffusion-based properties such as carbonation (diffusion of CO2 [28]), drying (diffusion of moisture [29]) and corrosion ([30]). It is worth noting that most of laboratory studies focus on gas permeability [31]. However, for concrete structures’ service life prediction model, the gas diffusion coefficient is the most relevant input parameter [31]. The determination of oxygen diffusion coefficient of concrete is challenging due to the high airtightness requirement of the measurement apparatus. An innovative gas diffusion measurement setup was proposed recently [32] which can be used to test the oxygen diffusion coefficient based on Fick’s law. In this work, the capillary porosity of concrete and cement mortar was measured by mercury intrusion porosimetry (MIP) method, the electrical resistivity of saturated cement mortar and concrete was determined by the modified non-contact electrical resistivity measurement and the oxygen diffusion coefficient was measured by the oxygen diffusion measurement. The relationship between the microstructure, electrical resistivity and oxygen diffusion coefficient was proposed. Based on the proposed relationships, the electrical resistivity and oxygen diffusion coefficient can be assessed by the microstructure properties.

2. Experimental Program

2.1. Materials and Mixture Design

All tests were carried out using ordinary (ASTM C150 [33] Type I) Portland cement as the only binder. The chemical composition and physical properties of the cement are listed in Table 1. The natural sand was used as fine aggregate with an absorption value of 2.15%, and the saturated surface dry (SSD) specific gravity of the fine aggregate was 2.614. The coarse aggregate used was stone with an absorption value of 1.02% and the SSD specific gravity of coarse aggregate was 2.674. All aggregates were oven dried (OD) before mixing, so the moisture value of aggregates was 0.0%. The details of the mixture proportions are given in Table 2, no chemical admixture was used.

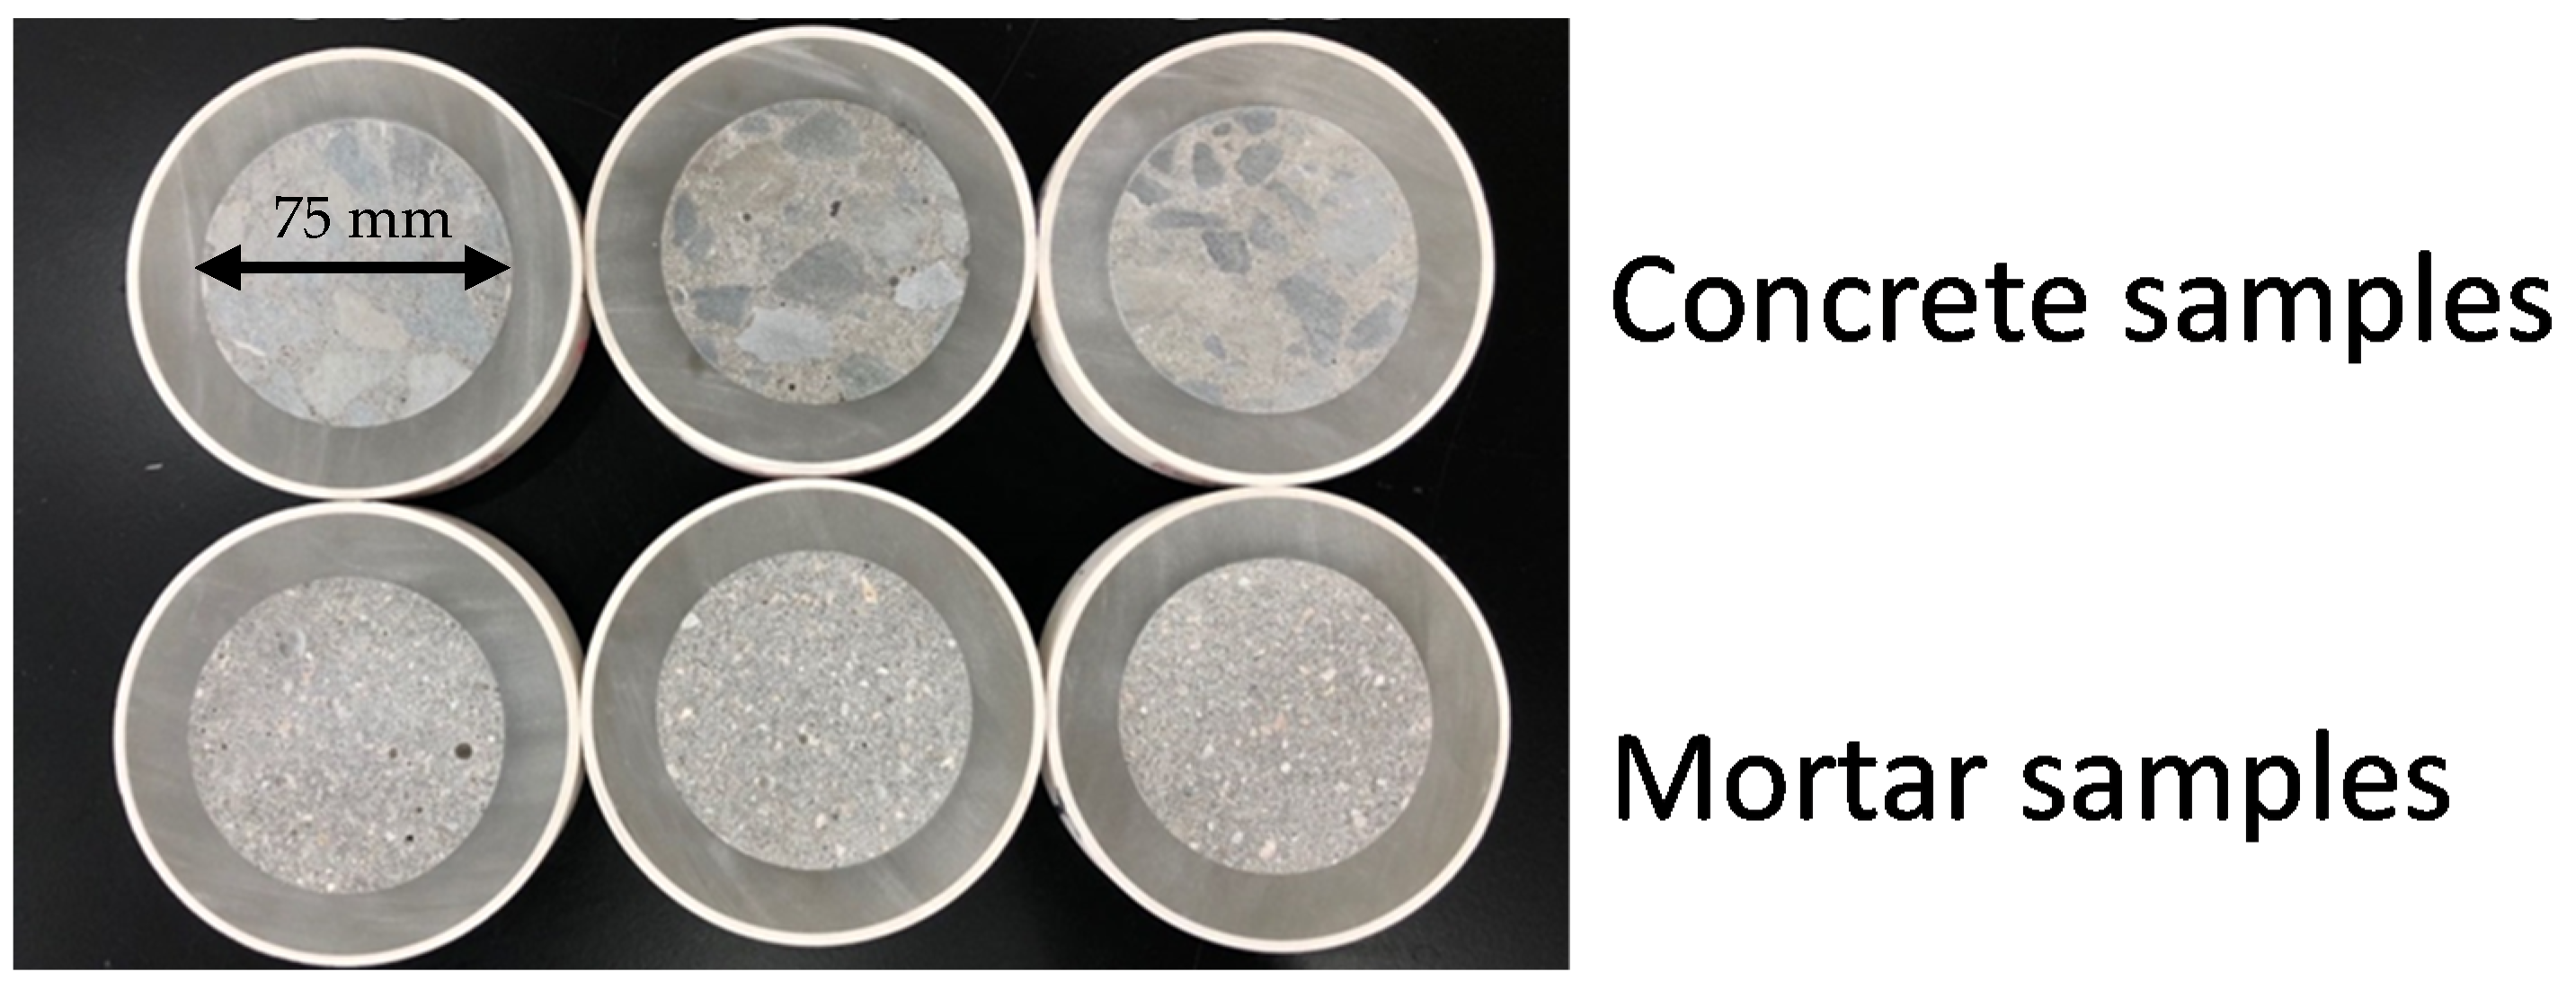
2.2. Sample Preparation

Three duplicates were cast for each mixture with dimensions of 150 mm × 150 mm × 550 mm. The freshly mixed samples were placed in room condition at 23 ± 1 °C. After 24 h, the samples were de-molded and cured at 23 ± 1 °C, 95% relative humidity (RH) for 28 days.
Cylindrical cores with the dimensions of 75 mm (diameter) and 150 mm (height) were drilled out by a core drilling machine from the casted samples. Each mixture was prepared with 3 cylindrical core samples at 28 days age. Then, cylindrical core samples were put in a PVC pipe with the diameter of 110 mm, the gap between core sample and PVC pipe was filled with fast hardening epoxy. When the epoxy was hardened, a slice sample will be cut from the middle portion of the core sample with the thickness of 20 mm. For each mixture, 6 duplicate slice samples were prepared. The air voids inside the cementitious materials can affect the electrical resistivity measurement results if sample is thinner than 10 mm, so the 20 mm thickness samples were used in this work [34]. The slice samples for modified non-contact electrical resistivity measurements are shown in Figure 1.
All slice samples were pre-oven dried at 60 °C for 48 h to completely remove the free water. For each mixture, 3 oven dried slice samples were used for oxygen diffusivity measurement and the lefted 3 slice samples were used for electrical resistivity measurement. Before electrical resistivity measurement, the slice samples were saturated by 3.5% NaCl solution by a vacuum chamber [35].
The remaining of the cylindrical core samples were cut into pieces and oven dried at 60 °C for 48 h. These samples were used for MIP tests. Each mixture was prepared with 3 samples for MIP measurements.

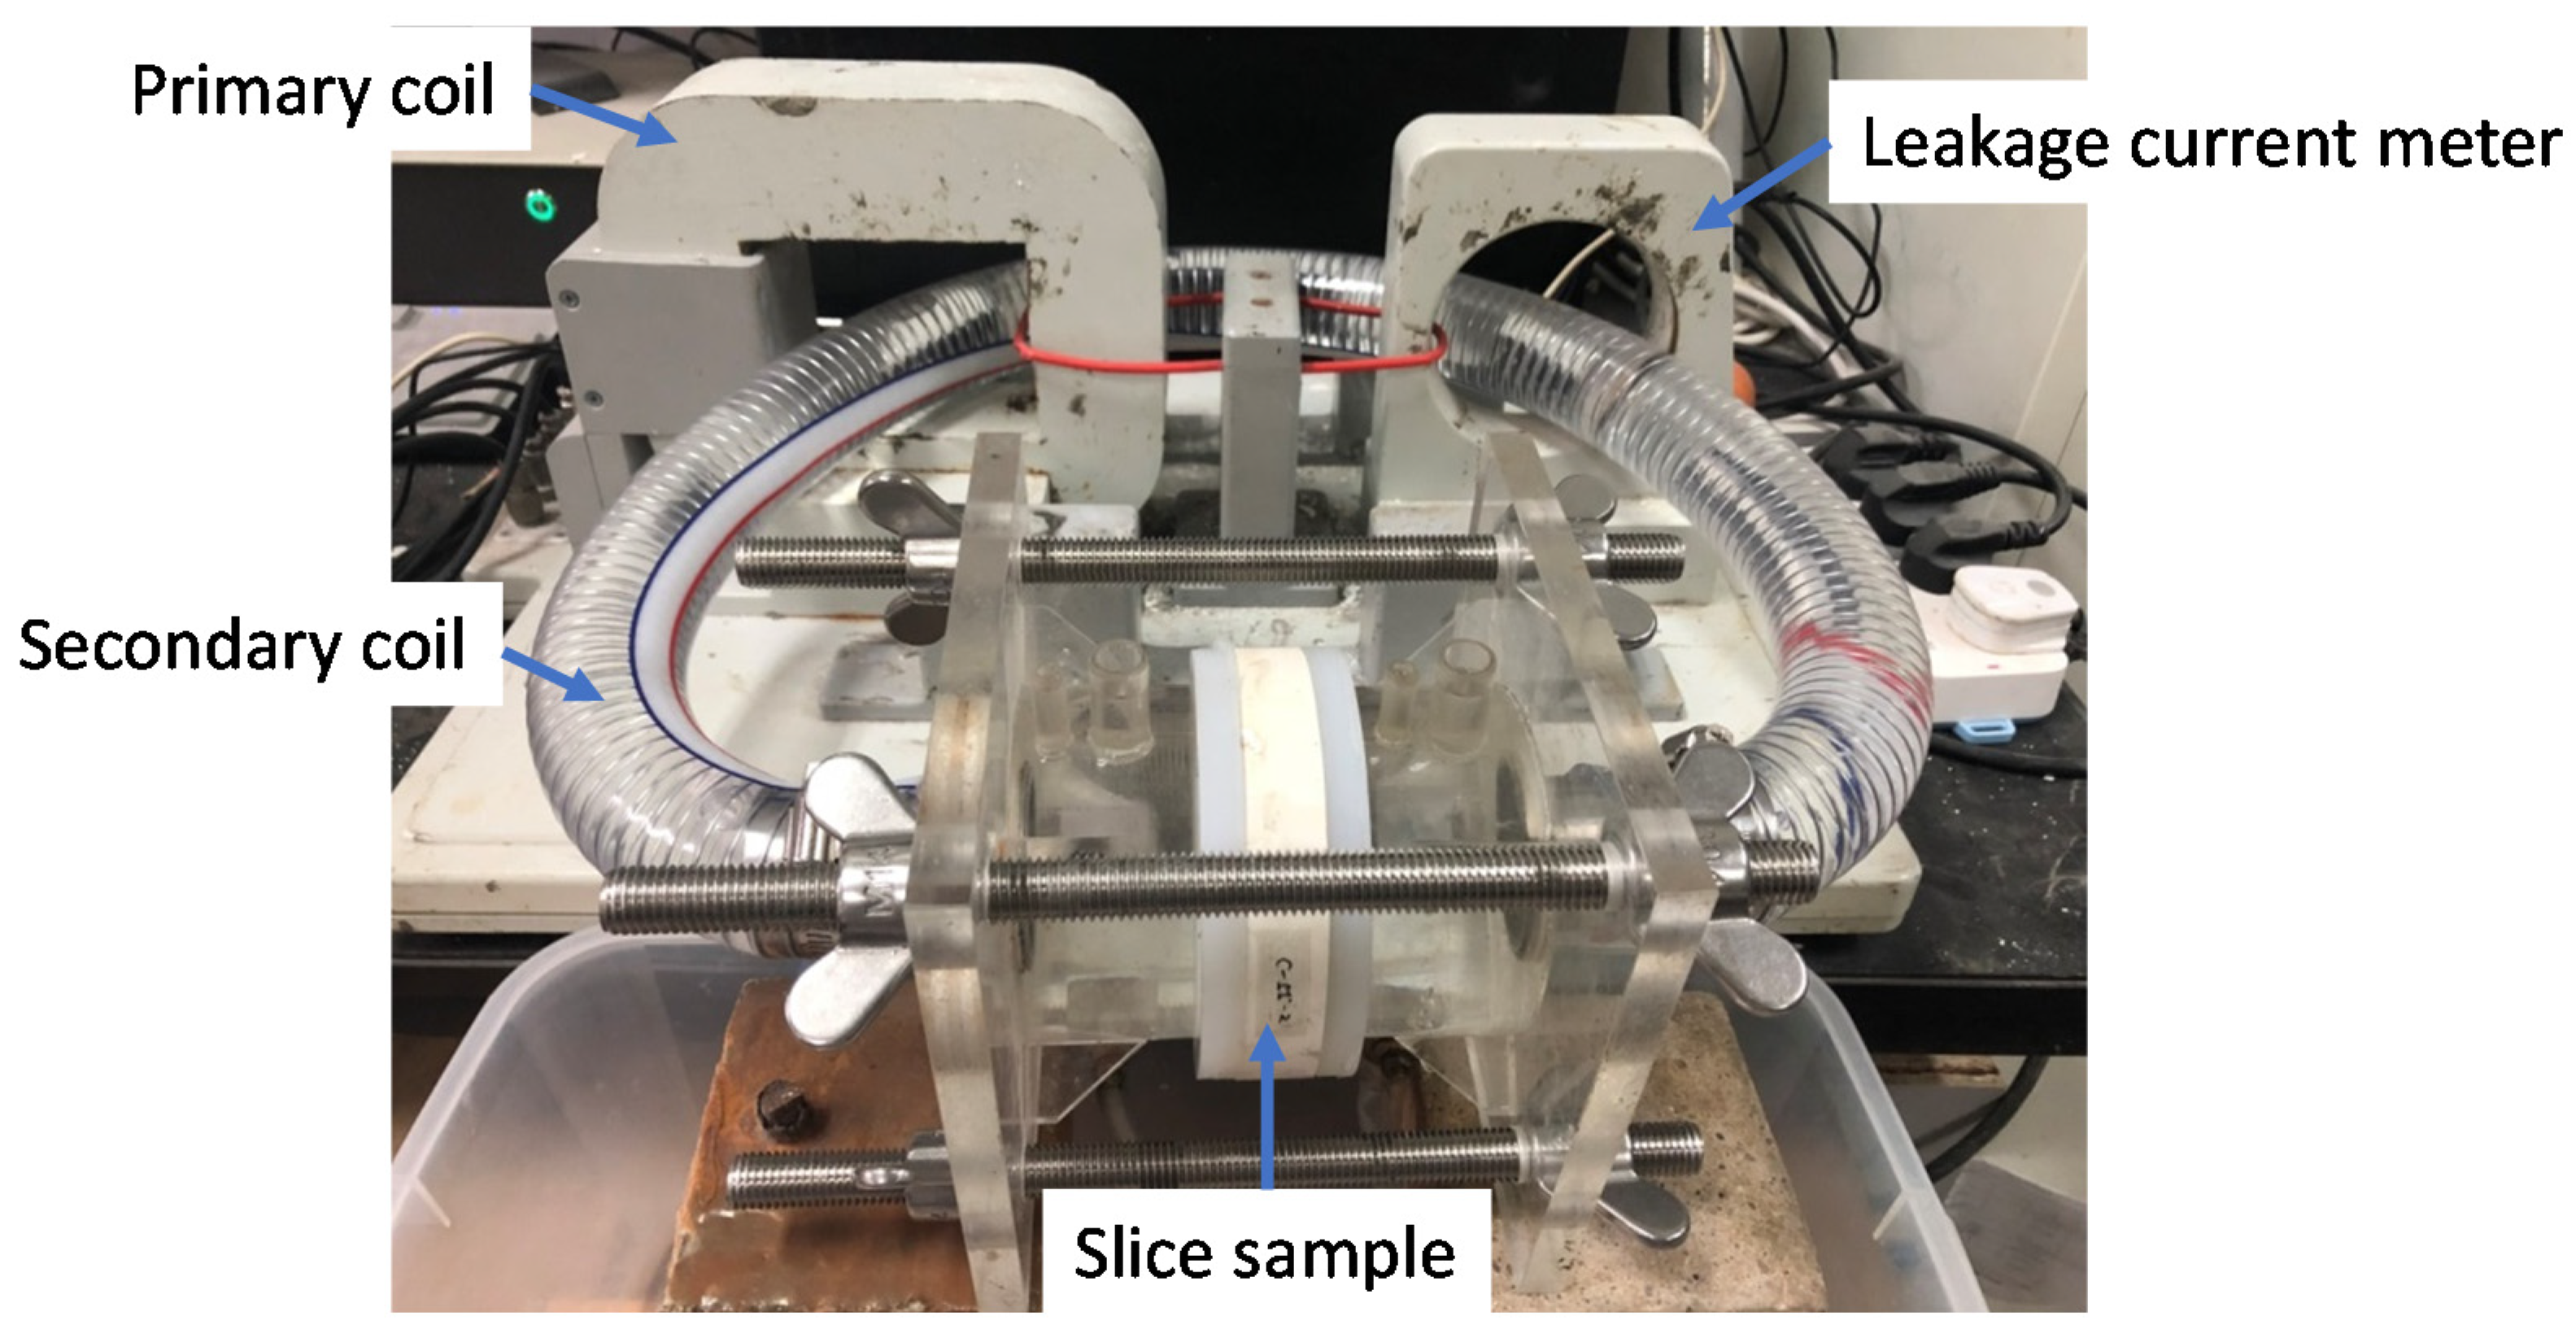
2.3. Modified Non-Contact Electrical Resistivity Measurement

2.3.1. Test Principal

The modified non-contact electrical resistivity measurement setup is presented in Figure 2. The system was composed with a computer, sample platform and mainframe. The computer was used for data collection and the sample platform was consisted with two flanges, solution chamber and solution connecting pipe. During measurement, both sides of the tested sample were clamped by the flanges and fixed with steel bars. The solution chambers were connected by the solution connecting pipe through the transformer core and leakage current meter.
The primary coil of the transformer was composed by a wirewound and the connecting pipe, NaCl solution together with the tested sample were act as the secondary coil of the transformer. During measurement, a 1000 Hz alternating current was applied in to the wirewound coil, then a toroidal current would be generated in secondary coil. The generated toroidal current could be detected and measured by the leakage current meter. The modified non-contact electrical resistivity measurement has been calibrated in [14] by measuring the electrical resistivity of 71.14% KCl solution at 25 °C. The determined electrical resistivity of the solution was 11.626 Ωm, while the quoted value in chemistry handbook [35] was 11.129 Ωm. The relative difference was 4.27%, which indicates the proposed modified non-contact electrical resistivity measurement was highly accurate in determining electrical resistivity. The modified non-contact electrical resistivity measurement has been used to study the pore connectivity [14] and chloride diffusion coefficient [1,2] of cementitious materials.

2.3.2. Test Procedure

Once the measurement was initiated, the computer would automatically record the resistance of the secondary coil at an interval of 10 s and the measurement would be terminated after 2 h. Examples of the recorded resistance results for concrete sample measurements are presented in Figure 3. It is obviously that the recorded electrical resistance results were highly stable during the measurement duration which indicate that slice samples were fully saturated with NaCl solution, and the test was highly stable.
The overall resistance of sample together with 3.5% NaCl solution Ri is the average value of tested, and the resistivity of sample can be calculated based on Ohm’s law in Equation (1):
ρ i = R i R 0 S i / L i = 4 L i ( R i R 0 ) π D i 2
where R0 is the resistance of 3.5% NaCl solution, Li is the thickness of slice sample, Si is the cross-section area of slice sample, Di is the diameter of slice sample.

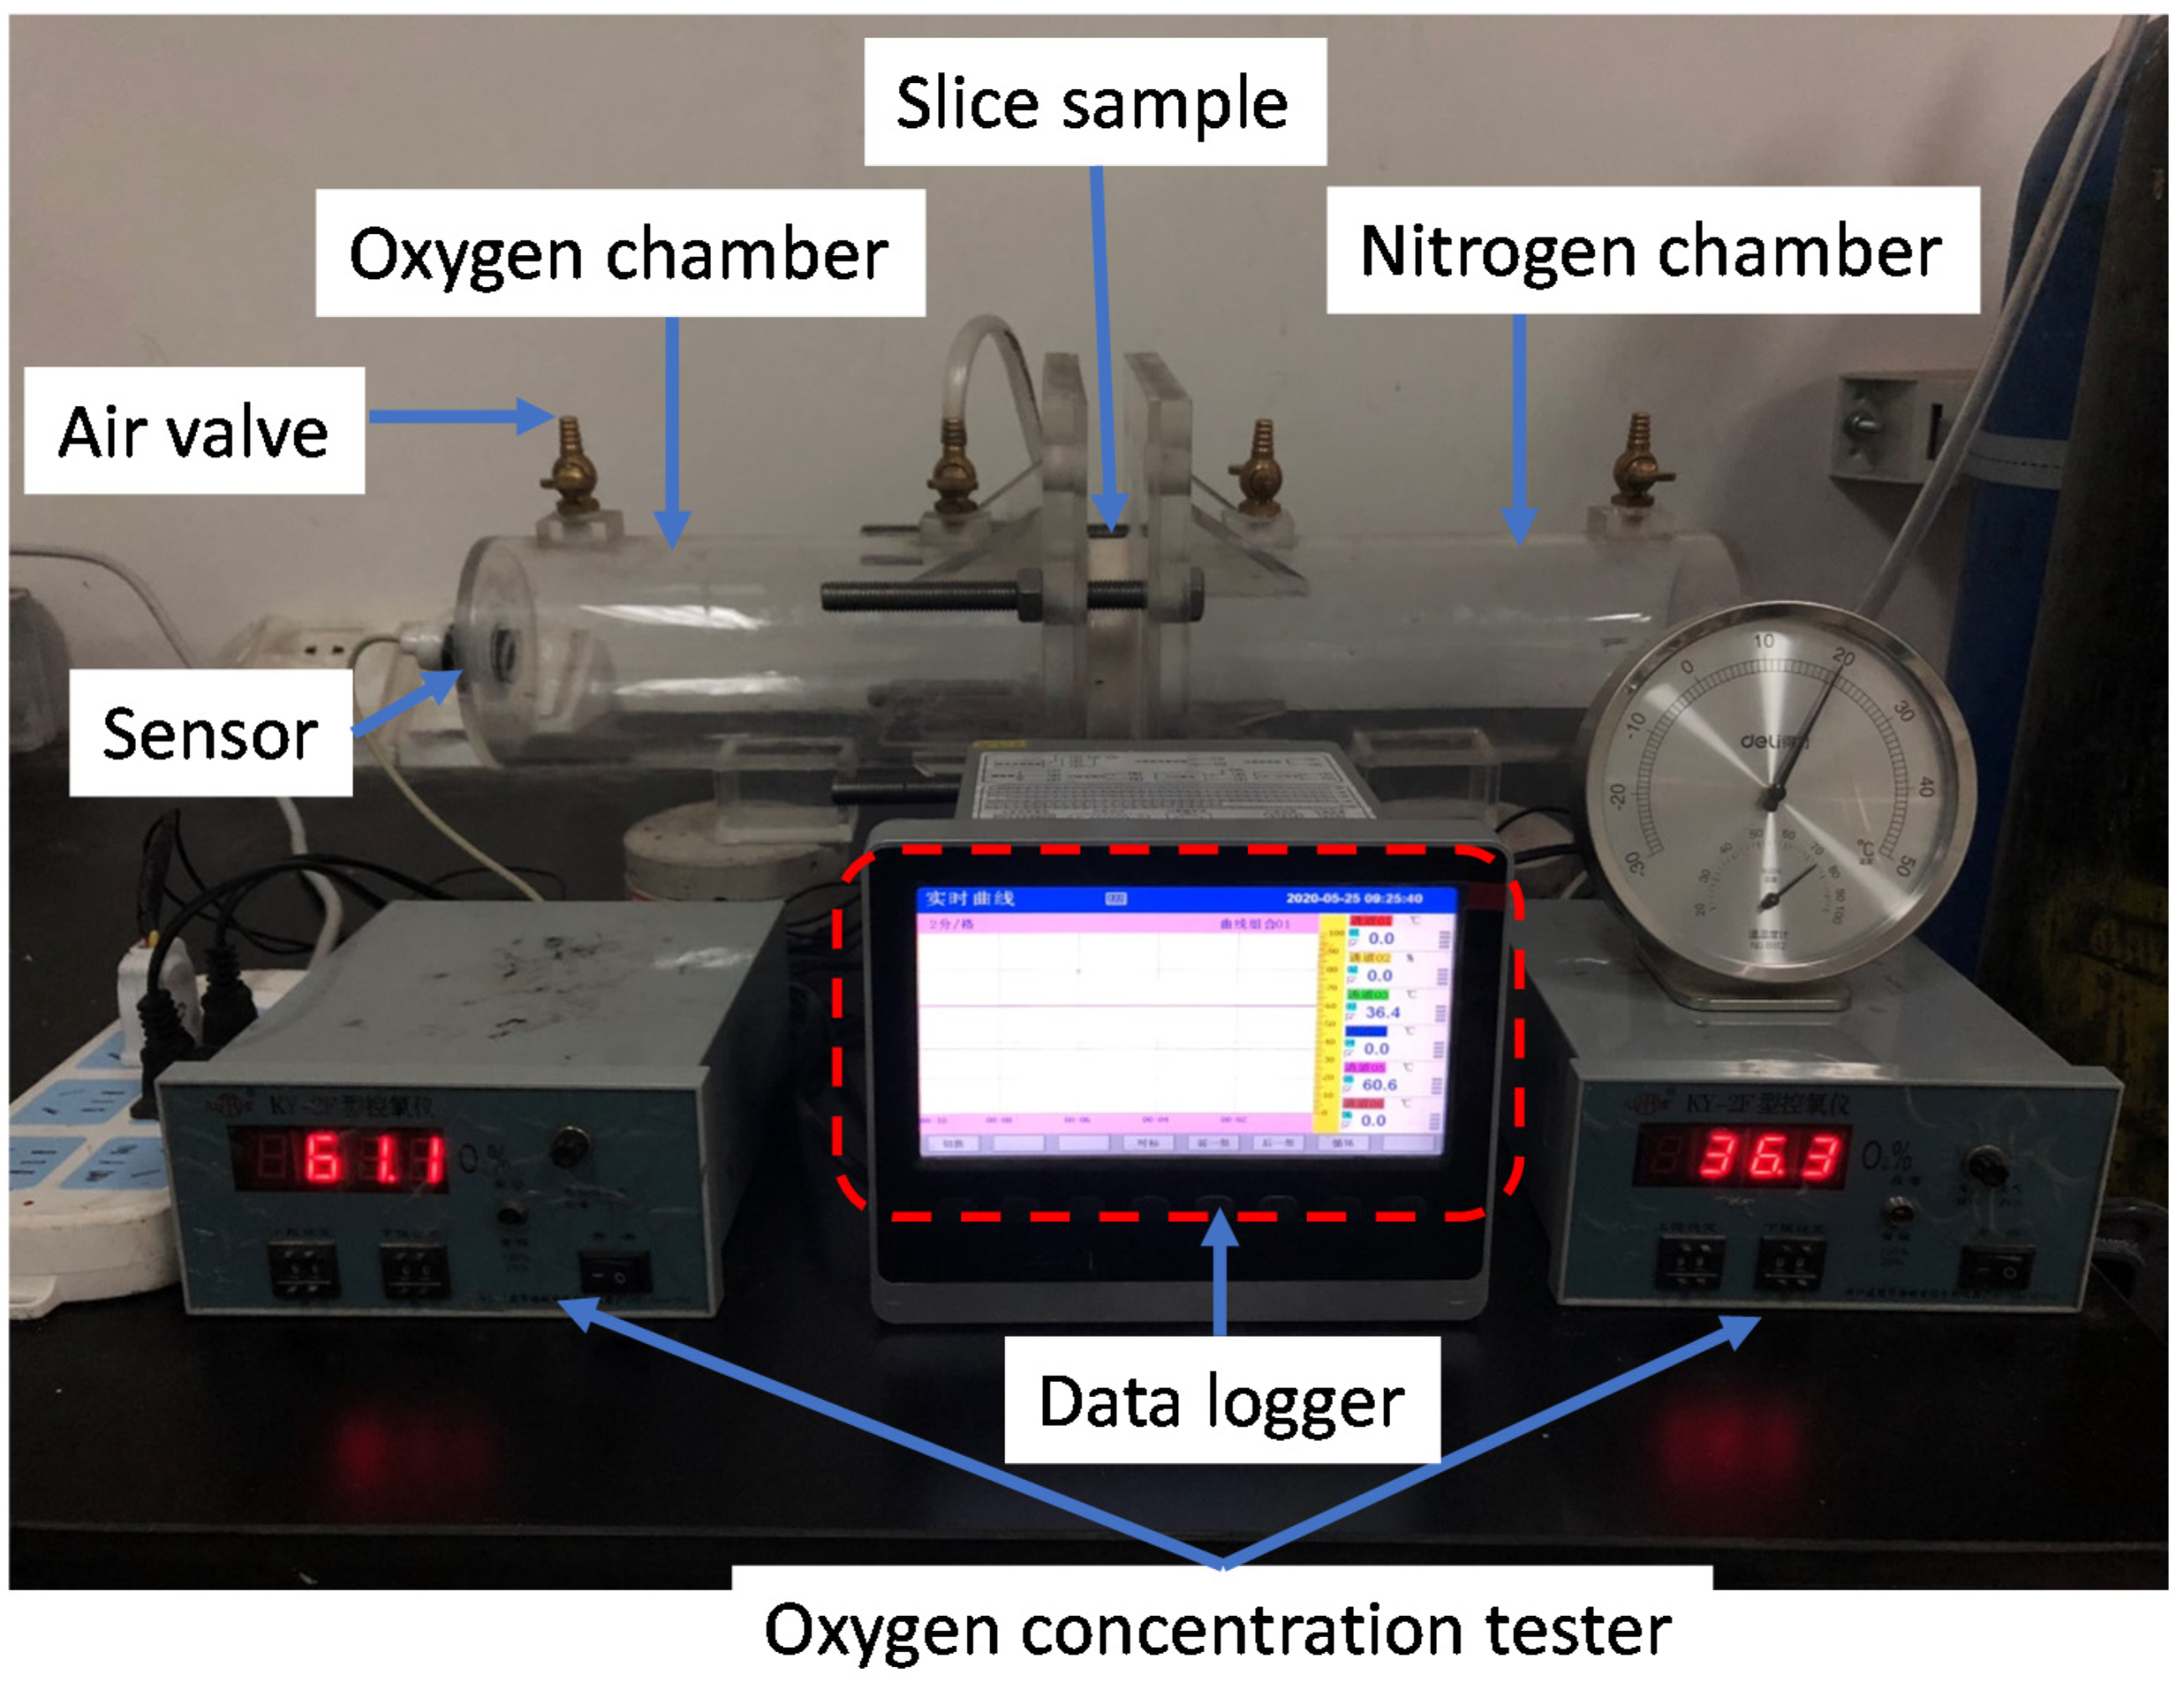
2.4. Oxygen Diffusion Measurement

The oxygen diffusion measurement setup is presented in Figure 4. The tested slice sample was fixed between two air chambers. Before test, both chambers were evacuated into vacuum. Once the measurement initiated, one chamber was filled with pure oxygen and the other chamber was inflated with pure nitrogen simultaneously through the air valve. Once the oxygen concentration in oxygen chamber reaches 95% and nitrogen concentration in nitrogen chamber reaches 95%, the air valves for both chambers were closes. The oxygen concentration sensor will continuously record the oxygen concentration in both chambers.
The oxygen diffusion coefficient (DO) can be calculated by Fick’s law [32] as expressed in Equation (2):
D o = N ( 0 t C L d t ) A
where N denotes the oxygen flux during the test (mol/m2/s), at a given time, C L = C 0 C 1 L , C0 denotes the oxygen concentration in oxygen chamber and C1 represents the oxygen concentration in nitrogen chamber (mol/m3), the oxygen concentration change in terms of diffusion time is presented in Figure 5, L is the slice sample thickness (0.2 m), 0 t C L is the oxygen concentration gradient in integral of time which can be determined by integrating the fitting of C L and time. A is the cross-section area of the slice sample.

2.5. MIP Test

MIP is the most widely adopted measurement for pore structure characterization of porous materials [25,36,37]. This method assumes the pore geometry as cylindrical and the pore size d can be directly derived from the applied pressure P in accordance with Washburn equation [38],
d = 4 γ cos θ P
where γ is the mercury surface tension (0.485 N/m), and θ is the contact angle between pore wall and mercury which can be taken as 130°. The MIP tests were conducted in Zhejiang University of Technology by an AutoPore IV 9510. The minimum and maximum pressures were 1.4 kPa and 414 MPa, which corresponding to the maximum and minimum pore sizes of 890 μm and 3 nm, respectively.

3. Results and Discussion

3.1. Electrical Resistivity and MIP Measurement Results

The electrical resistivity and the porosity results from MIP test are concluded in Table 3. The electrical resistivity and capillary porosity results are the average results of three duplicate samples’ results. The electrical resistivity results decrease with the increasing of design w/c which indicate that the higher w/c composite possesses with more pore channel for ion transportation and pore connectivity is higher. The standard deviation of electrical resistivity measurement results for each mixture is neglectable which indicates the modified non-contact electrical resistivity measurement is highly repeatable. The capillary porosity also decreases with the decreasing of w/c, which is reasonable since the lower w/c mix will leave fewer capillary pores after hydration.
The formation factor, FF, is the ratio between overall electrical resistivity of cementitious material and the pore solution, expressed as Equation (4):
F F = ρ ρ 0
where ρ is the slice sample’s electrical resistivity as measured by the modified non-contact electrical resistivity measurement in this work, ρ0 represent the electrical resistivity of pore solution, in this work, the capillary pores have been saturated with 3.5% NaCl solution, the electrical resistivity was pre-determined as 0.193 Ωm.
The value of FF depends on the pore connectivity of porous materials [39,40]. So, some studies used FF to represent the microstructural properties of porous materials, such as ion permeability and gas transportation [1,41,42]. During the first 7 days of concrete’s age, the value of FF can decrease by two orders of magnitude since fast hydration would result in reduction in porosity and pore connectivity in early age [43,44].
A relationship between formation factor and the capillary porosity has been proposed by previous researcher [14] on account of Archie’s law [39] as shown in Equation (5),
ϕ = 0.859 F F 0.380
The reasonableness of this equation can be verified with the experimental results in this work and other researchers’ work [1,14,22,25,45,46] as presented in Figure 6. It can be seen from Figure 6 that Equation (5) is a valid equation in predicting capillary porosity from the measured electric resistivity results.

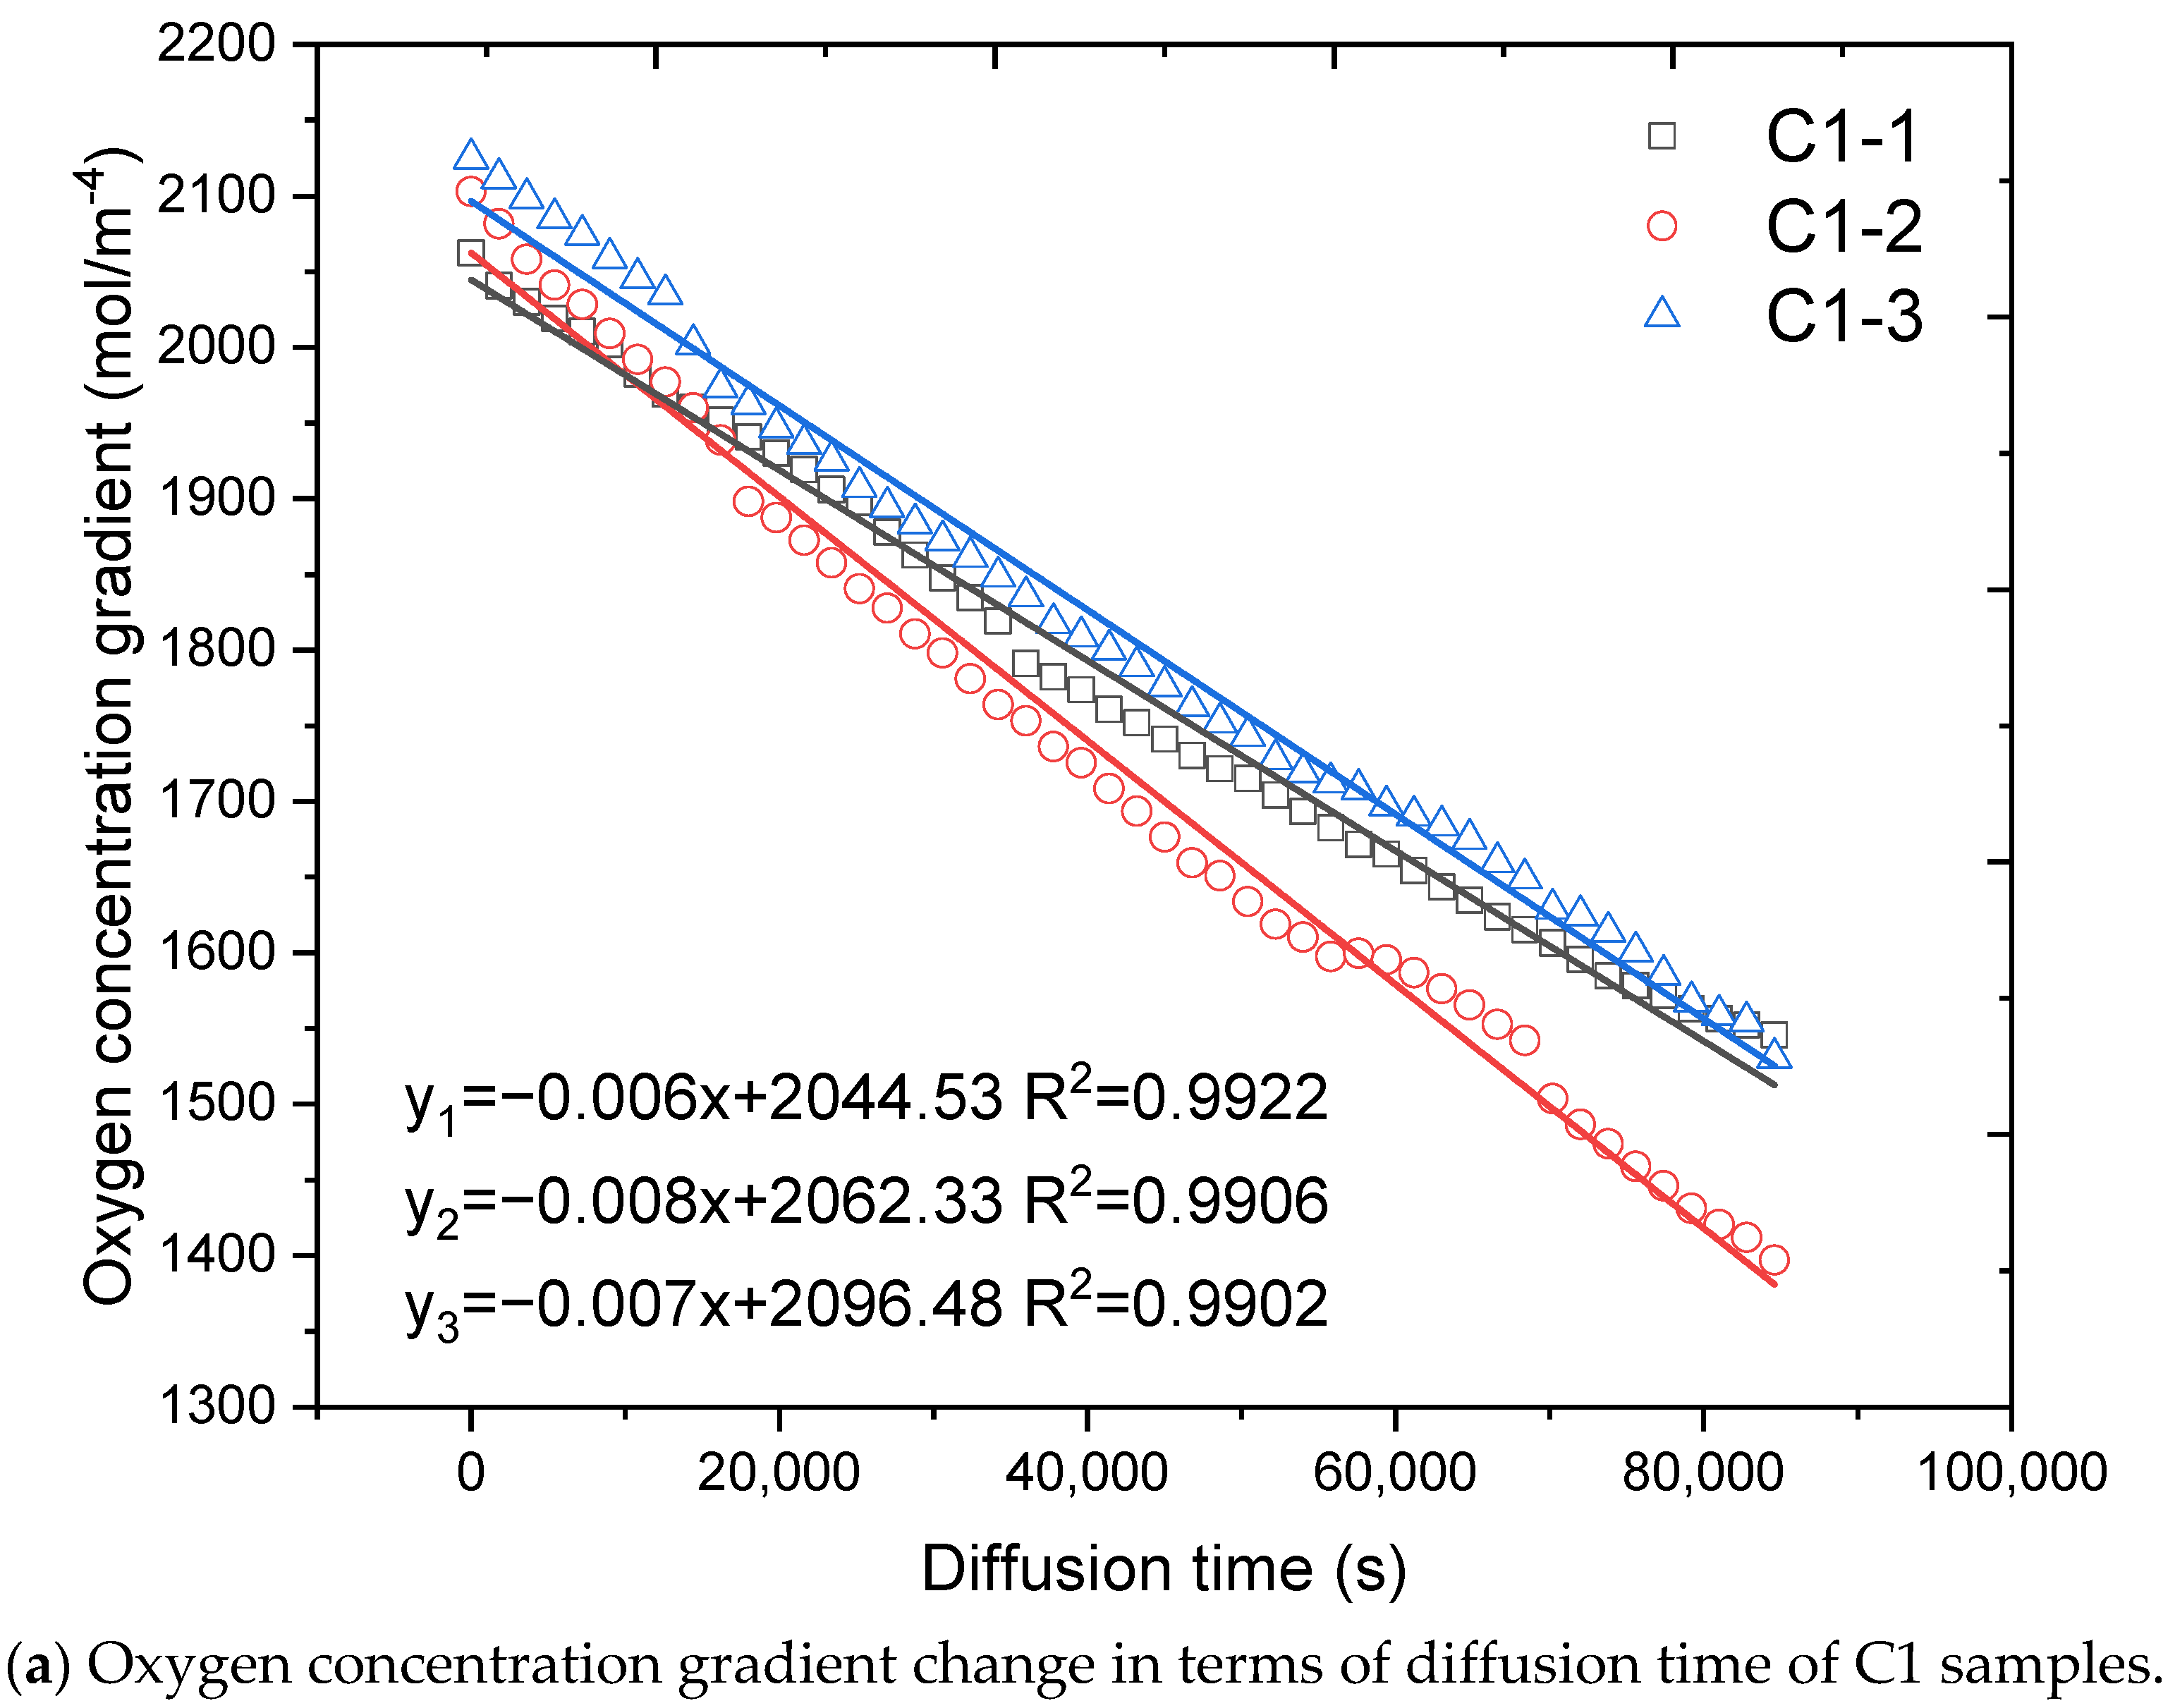
3.2. Oxygen Diffusion Coefficient Determination

The oxygen diffusion coefficient of concrete and cement mortar can be determined from Equation (2) by measuring the oxygen concentration gradient ( C L = C 0 C 1 L ) between two gas chambers in function of diffusion time. The typical oxygen gradient between two chambers for concrete and mortar samples are presented in Figure 7. It can be seen that for each sample, the oxygen concentration gradient continuously decreases in terms of diffusion time. For each mixture, three duplicates’ measurement results are highly stable and repeatable.
It reveals that oxygen concentration gradient displayed linear relationship with diffusion time. Hence, linear fitting model (Equation (6)) was selected to for regression analysis. The linear fitting results for C1 samples and M1 samples are presented in Figure 7. It can be observed that the linear regression model shows good fitting results in this work with all fitting parameters R2 are higher than 0.9.
C L = A t + B
where A and B, are fitting parameters.
The oxygen diffusion coefficients of all samples can be calculated by integral the linear fitting results of oxygen concentration gradient ( C L ) between two gas chambers in terms of diffusion time by Equation (2). The calculated oxygen diffusion coefficients of all samples are concluded in Table 4.
The standard deviation values in Table 4 of all mixtures are low which indicates the adopted oxygen measurement in this work is highly repeatable. The oxygen diffusion coefficient results lay within the range of 10−7 m2/s to 10−8 m2/s as reported by [30]. The oxygen diffusion coefficient results are consistent with expected performance, which is, the higher w/c results in higher oxygen diffusion coefficient.
The oxygen diffusion coefficient results in terms of measured capillary porosity values are presented in Figure 8. A linear relation is obtained between the measured oxygen diffusion coefficient results and the capillary porosity results with the fitting parameter R2 is as high as 0.9927.

3.3. Quantitative Correlation between Porosity, Oxygen Diffusion Coefficient and Electrical Resistivity

The quantitative relations between porosity and oxygen diffusion coefficient, and electrical resistivity can simplify the assessment of gas transportation and ion transportation performance of cementitious materials.
An empirical relationship between diffusion coefficient and electrical resistivity has been proposed by previous researchers [30,47]:
D = n ρ
where D is the diffusion coefficient (×10−4 m2/s), ρ is the electrical resistivity of cementitious material (×10−2 Ωm) and n is a constant dependent on the saturation degree and microstructure of cementitious.
The regression result of the experimental results in this work by Equation (7) is presented in Figure 9. The obtained n value is 257.47, the regression parameter R2 is as high as 0.9787. The obtained n value is very close to the results as reported by other researchers in literatures [30,47,48,49].
In this work, as we discussed before, the electrical resistivity of saturated cementitious materials is greatly influenced by the electrical resistivity value of pore solution. Hence, for a more generalized estimation of oxygen diffusion coefficient from electrical resistivity measurement results, Equation (7) can be modified by taking the electrical resistivity into account as:
D O = n ρ 0 F F
The n value can also be directly derived by multiply the oxygen diffusion coefficient with the electricity resistivity measurement results as:
n = D O F F ρ 0
The calculated n values in terms of measured capillary porosity results are plotted in Figure 10. An empirical equation is obtained to quantitative correlate the n value and capillary porosity with the fitting parameter R2 is as high as 0.9534.
So, the oxygen diffusion coefficient of cementitious materials can be assessed by the measured porosity and electrical resistivity results as expressed in Equation (10):
D O = 7.07 ϕ 2 + 151.19 ϕ 437.22 F F ρ 0

3.4. Practical Application

The calculated oxygen diffusion coefficient results by Equation (10) are verified by the measurement results by Equation (11):
Δ D O = D O , c a l D O , m e a
where ΔDO is the calculated oxygen diffusion coefficient error (×10−8 m2/s), DO,cal and DO,mea represent the calculated oxygen diffusion coefficient by Equation (10) and the measured oxygen diffusion coefficient, respectively.
The calculated oxygen diffusion error distribution is presented as Q-Q plot with 95% confidence level in Figure 11. The error is significantly drawn in normal distribution population at 5% decision level. Thus, Equation (10) can be a practical model to estimate the oxygen diffusion coefficient of cementitious materials from electrical resistivity and microstructure measurement results.

4. Conclusions

In this work, the electrical resistivity values of concrete and cement mortar were measured by a modified non-contact electrical resistivity measurement, the relationship between electrical resistivity, oxygen diffusion coefficient and capillary porosity of cement mortar and concrete was established. The general conclusions can be drawn as:
  • The modified non-contact electrical resistivity measurement can determine the electrical resistivity of cementitious materials, the measurement results is highly stable and repeatable.
  • The universal equation ϕ = 0.859 F F 0.380 can be used to estimate the capillary porosity from the measured electrical resistivity results.
  • The oxygen diffusion coefficient of cementitious materials can be assessed from the measured electrical resistivity results and capillary porosity results by the following equation: D O = 7.07 ϕ 2 + 151.19 ϕ 437.22 F F ρ 0 .
  • The error of oxygen diffusion coefficient determination results by the proposed assessment equation have 95% confidence to drawn within normality distributed population in 5% decision level, the assessment equation can be practically applied to assess the oxygen diffusion coefficient of cementitious materials.

Author Contributions

Conceptualization, R.Z. and R.H.; investigation, Q.L. and J.W.; data curation, K.Z.; methodology, R.H. and C.F.; visualization, R.H.; formal analysis, R.H.; writing—original draft, K.Z. and R.H.; writing—review and editing, R.Z., Q.L., R.H. and K.Z.; project administration, R.H.; funding acquisition, R.Z. and C.F.; validation, K.Z.; resources, R.H. All authors have read and agreed to the published version of the manuscript.

Funding

The financial support from the Key Research Project of Natural Science of Bengbu University(2020ZR03zd), Bengbu University High-level Talent Research Startup Funding Project (BBXY2019KYQD05), National Key R&D Program of China (2019YFB1600700), the Natural Science Foundation of Zhejiang Province (LR21E080002, LZ20E080003) and the National Natural Science Foundation (51978620) are gratefully acknowledged.

Institutional Review Board Statement

Not applicable.

Informed Consent Statement

Not applicable.

Data Availability Statement

The data presented in this study are available on request from the corresponding author.

Conflicts of Interest

The authors declare no conflict of interest.

References

  1. He, R.; Ye, H.; Ma, H.; Fu, C.; Jin, X.; Li, Z. Correlating the Chloride Diffusion Coefficient and Pore Structure of Cement-Based Materials Using Modified Noncontact Electrical Resistivity Measurement. J. Mater. Civ. Eng. 2019, 31, 04019006. [Google Scholar] [CrossRef]
  2. He, R.; Fu, C.; Ma, H.; Ye, H.; Jin, X. Prediction of Effective Chloride Diffusivity of Cement Paste and Mortar from Microstructural Features. J. Mater. Civ. Eng. 2020, 32, 04020211. [Google Scholar] [CrossRef]
  3. Chen, J.; Wang, J.; He, R.; Shu, H.; Fu, C. Experimental Study on Effective Chloride Diffusion Coefficient of Cement Mortar by Different Electrical Accelerated Measurements. Crystals 2021, 11, 240. [Google Scholar] [CrossRef]
  4. Huang, Y.; Ye, H.; Fu, C.; Jin, N. Modeling moisture transport at the surface layer of fatigue-damaged concrete. Constr. Build. Mater. 2017, 151, 196–207. [Google Scholar] [CrossRef]
  5. Zhou, C.; Chen, W.; Wang, W.; Skoczylas, F. Unified determination of relative molecular diffusivity and fluid permeability for partially saturated cement-based materials. Cem. Concr. Res. 2015, 67, 300–309. [Google Scholar] [CrossRef]
  6. Sercombe, J.; Vidal, R.; Gallé, C.; Adenot, F. Experimental study of gas diffusion in cement paste. Cem. Concr. Res. 2007, 37, 579–588. [Google Scholar] [CrossRef] [Green Version]
  7. Gui, Q.; Qin, M.; Li, K. Gas permeability and electrical conductivity of structural concretes: Impact of pore structure and pore saturation. Cem. Concr. Res. 2016, 89, 109–119. [Google Scholar] [CrossRef]
  8. Liu, X.; Zhang, W.; Gu, X.; Ye, Z. Probability distribution model of stress impact factor for corrosion pits of high-strength prestressing wires. Eng. Struct. 2021, 230, 111686. [Google Scholar] [CrossRef]
  9. Fu, C.; Fang, D.; Ye, H.; Huang, L.; Wang, J. Bond degradation of non-uniformly corroded steel rebars in concrete. Eng. Struct. 2021, 226, 111392. [Google Scholar] [CrossRef]
  10. Fu, C.; Huang, J.; Dong, Z.; Yan, W.; Gu, X.L. Experimental and numerical study of an electromagnetic sensor for non-destructive evaluation of steel corrosion in concrete. Sens. Actuators A Phys. 2020, 315, 112371. [Google Scholar] [CrossRef]
  11. Chen, H.; Huang, X.; He, R.; Zhou, Z.; Fu, C.; Wang, J. Mechanical Properties of Polypropylene Fiber Cement Mortar under Different Loading Speeds. Sustainability 2021, 13, 3697. [Google Scholar] [CrossRef]
  12. Chen, H.; Zhou, X.; Li, Q.; He, R.; Huang, X. Dynamic Compressive Strength Tests of Corroded SFRC Exposed to Drying–Wetting Cycles with a 37 mm Diameter SHPB. Materials 2021, 14, 2267. [Google Scholar] [CrossRef] [PubMed]
  13. Liu, X.; Zhang, W.; Gu, X.; Zeng, Y. Degradation of Mechanical Behavior of Corroded Prestressing Wires Subjected to High-Cycle Fatigue Loading. J. Bridge Eng. 2017, 22, 04017004. [Google Scholar] [CrossRef]
  14. He, R.; Ma, H.; Hafiz, R.B.; Fu, C.; Jin, X.; He, J. Determining porosity and pore network connectivity of cement-based materials by a modified non-contact electrical resistivity measurement: Experiment and theory. Mater. Des. 2018, 156, 82–92. [Google Scholar] [CrossRef]
  15. Polder, R.B. Test methods for on site measurement of resistivity of concrete-a RILEM TC-154 technical recommendation. Constr. Build. Mater. 2001, 15, 125–131. [Google Scholar] [CrossRef]
  16. Karhunen, K.; Seppanen, A.; Lehikoinen, A.; Monteiro, P.J.M.; Kaipio, J.P. Electrical Resistance Tomography imaging of concrete. Cem. Concr. Res. 2010, 40, 137–145. [Google Scholar] [CrossRef]
  17. ASTM C1202-12. Standard Test Method for Electrical Indication of Concrete’s Ability to Resist Chloride Ion Penetration; ASTM International: West Conshohocken, PA, USA, 2012. [Google Scholar]
  18. Gowers, K.R.; Millard, S.G. Measurement of concrete resistivity for assessment of corrosion severity of steel using wenner technique. ACI Mater. J. 1999, 96, 536–541. [Google Scholar] [CrossRef]
  19. Neithalath, N.; Weiss, J.; Olek, J. Characterizing Enhanced Porosity Concrete using electrical impedance to predict acoustic and hydraulic performance. Cem. Concr. Res. 2006, 36, 2074–2085. [Google Scholar] [CrossRef]
  20. Snyder, K.A.; Ferraris, C.; Martys, N.S.; Garboczi, E.J. Using Impedance Spectroscopy to Assess the Viability of the Rapid Chloride Test for Determining Concrete Conductivity. J. Res. Natl. Inst. Stand. Technol. 2000, 105, 497–509. [Google Scholar] [CrossRef]
  21. McCarter, W.J.; Starrs, G.; Chrisp, T.M. Electrical conductivity, diffusion, and permeability of Portland cement-based mortars. Cem. Concr. Res. 2000, 30, 1395–1400. [Google Scholar] [CrossRef]
  22. Li, Z.; Wei, X.; Li, W. Preliminary Interpretation of Portland Cement Hydration Process Using Resistivity Measurements. ACI Mater. J. 2003, 100, 253–257. [Google Scholar] [CrossRef]
  23. Xiao, L.; Li, Z. Early-age hydration of fresh concrete monitored by non-contact electrical resistivity measurement. Cem. Concr. Res. 2008, 38, 312–319. [Google Scholar] [CrossRef]
  24. Xiao, L.Z.; Li, Z.J.; Wei, X.S. Selection of superplasticizer in concrete mix design by measuring the early electrical resistivities of pastes. Cem. Concr. Compos. 2007, 29, 350–356. [Google Scholar] [CrossRef]
  25. Zhang, J.; Li, Z. Application of GEM Equation in Microstructure Characterization of Cement-Based Materials. J. Mater. Civ. Eng. 2009, 21, 648–656. [Google Scholar] [CrossRef]
  26. Zhang, W.; Zhang, Y. Apparatus for monitoring the resistivity of the hydration of cement cured at high temperature. Instrum. Sci. Technol. 2017, 45, 151–162. [Google Scholar] [CrossRef]
  27. Li, Z.; Li, W. Contactless, Transformer-Based Measurement of the Resistivity of Materials. U.S. Patent 6639401B2, 28 October 2003. [Google Scholar]
  28. Thiery, M.; Villain, G.; Dangla, P.; Platret, G. Investigation of the carbonation front shape on cementitious materials: Effects of the chemical kinetics. Cem. Concr. Res. 2007, 37, 1047–1058. [Google Scholar] [CrossRef]
  29. Jiang, Z.; Huang, Q.; Xi, Y.; Gu, X.; Zhang, W. Experimental Study of Diffusivity of the Interfacial Transition Zone between Cement Paste and Aggregate. J. Mater. Civ. Eng. 2016, 28, 04016109. [Google Scholar] [CrossRef]
  30. Linares-Alemparte, P.; Andrade, C.; Baza, D. Porosity and electrical resistivity-based empirical calculation of the oxygen diffusion coefficient in concrete. Constr. Build. Mater. 2019, 198, 710–717. [Google Scholar] [CrossRef]
  31. Hamami, A.A.; Turcry, P.; Aït-Mokhtar, A. Influence of mix proportions on microstructure and gas permeability of cement pastes and mortars. Cem. Concr. Res. 2012, 42, 490–498. [Google Scholar] [CrossRef]
  32. Fu, C.; Ling, Y.; Wang, K. An innovation study on chloride and oxygen diffusions in simulated interfacial transition zone of cementitious material. Cem. Concr. Compos. 2020, 110, 103585. [Google Scholar] [CrossRef]
  33. ASTM C150/C150M-20. Standard Specification for Portland Cement; ASTM International: West Conshohocken, PA, USA, 2020. [Google Scholar]
  34. MacDonald, K.A.; Northwood, D.O. Experimental measurements of chloride ion diffusion rates using a two-compartment diffusion cell: Effects of material and test variables. Cem. Concr. Res. 1995, 25, 1407–1416. [Google Scholar] [CrossRef]
  35. Xiao, L.; Ren, Z.; Shi, W.; Wei, X. Experimental study on chloride permeability in concrete by non-contact electrical resistivity measurement and RCM. Constr. Build. Mater. 2016, 123, 27–34. [Google Scholar] [CrossRef]
  36. Zeng, Q.; Li, K.; Fen-Chong, T.; Dangla, P. Pore structure characterization of cement pastes blended with high-volume fly-ash. Cem. Concr. Res. 2012, 42, 194–204. [Google Scholar] [CrossRef]
  37. Diamond, S. Mercury porosimetry: An inappropriate method for the measurement of pore size distributions in cement-based material. Cem. Concr. Res. 2000, 30, 1517–1525. [Google Scholar] [CrossRef]
  38. Washburn, E.W. Note on a Method of Determining the Distribution of Pore Sizes in a Porous Material. Proc. Natl. Acad. Sci. USA 1921, 7, 115–116. [Google Scholar] [CrossRef] [PubMed] [Green Version]
  39. Archie, G.E. The Electrical Resistivity Log as an Aid in Determining Some Reservoir Characteristics. Trans. AIME 1942, 146, 54–62. [Google Scholar] [CrossRef]
  40. Spragg, R.; Villani, C.; Weiss, J. Electrical Properties of Cementitious Systems: Formation Factor Determination and the Influence of Conditioning Procedures. Adv. Civ. Eng. Mater. 2016, 5, 124–148. [Google Scholar] [CrossRef]
  41. Bernabé, Y.; Zamora, M.; Li, M.; Maineult, A.; Tang, Y.B. Pore connectivity, permeability, and electrical formation factor: A new model and comparison to experimental data. J. Geophys. Res. Solid Earth 2011, 116. [Google Scholar] [CrossRef]
  42. Tumidajski, P.J. Relationship between resistivity, diffusivity and microstructural descriptors for mortars with silica fume. Cem. Concr. Res. 2005, 35, 1262–1268. [Google Scholar] [CrossRef]
  43. Christensen, B.J.; Coverdale, T.; Olson, R.A.; Ford, S.J.; Garboczi, E.J.; Jennings, H.M.; Mason, T.O. Impedance Spectroscopy of Hydrating Cement-Based Materials: Measurement, Interpretation, and Application. J. Am. Ceram. Soc. 1994, 77, 2789–2804. [Google Scholar] [CrossRef]
  44. Zhang, J. Microstructure Study of Cementitious Materials Using Resistivity Measurement. Ph.D. Thesis, Hong Kong University of Science and Technology, Hong Kong, China, 2008. [Google Scholar]
  45. Tumidajski, P.J. Electrical conductivity of Portland cement mortars. Cem. Concr. Res. 1996, 26, 529–534. [Google Scholar] [CrossRef]
  46. Tumidajski, P.J.; Schumacher, A.S.; Perron, S.; Gu, P.; Beaudoin, J.J. On the relationship between porosity and electrical resistivity in cementitious systems. Cem. Concr. Res. 1996, 26, 539–544. [Google Scholar] [CrossRef]
  47. Andrade, C. Calculation of chloride diffusion coefficients in concrete from ionic migration measurements. Cem. Concr. Res. 1993, 23, 724–742. [Google Scholar] [CrossRef]
  48. Sanchez, J.; Andrade, C.; Torres, J.; Rebolledo, N.; Fullea, J. Determination of reinforced concrete durability with on-site resistivity measurements. Mater. Struct. Constr. 2017. [Google Scholar] [CrossRef]
  49. Castellote, M.; Andrade, C.; Alonso, C. Measurement of the steady and non-steady-state chloride diffusion coefficients in a migration test by means of monitoring the conductivity in the anolyte chamber. Comparison with natural diffusion tests. Cem. Concr. Res. 2001. [Google Scholar] [CrossRef]
Figure 1. Slice samples.
Materials 14 03141 g001
Figure 2. The modified non-contact electrical resistivity measurement setup.
Materials 14 03141 g002
Figure 3. The stability of the measurement (C1 to C5 denote the concrete samples).
Materials 14 03141 g003
Figure 4. Oxygen diffusion measurement setup.
Materials 14 03141 g004
Figure 5. Oxygen volume fraction change in terms of diffusion time in two gas chambers.
Materials 14 03141 g005
Figure 6. The reasonableness verification of Equation (5).
Materials 14 03141 g006
Figure 7. Typical Oxygen concentration gradient change in terms of diffusion time.
Materials 14 03141 g007aMaterials 14 03141 g007b
Figure 8. Oxygen diffusion coefficient results in terms of capillary porosity values.
Materials 14 03141 g008
Figure 9. Oxygen diffusion coefficient in terms of electrical resistivity.
Materials 14 03141 g009
Figure 10. Calculated n value in terms of capillary porosity.
Materials 14 03141 g010
Figure 11. Q-Q plot of calculated oxygen diffusion coefficient error.
Materials 14 03141 g011
Table 1. Chemical composition (% by mass) and fineness of the cement.
CaOSiO2Al2O3Fe2O3MgOSO3LoIFineness (m2/kg)
62.9119.555.222.742.943.222.25409
Table 2. SSD mixture proportions of cement mortar and concrete (kg/m3).
Mixture IDDesign w/cCementMixing WaterFine Agg.Coarse Agg.
C10.393351308601165
C20.423351418491150
C30.453351518381135
C40.483351618261119
C50.513351718151104
M10.396862681372/
M20.426722821345/
M30.456592971318/
M40.486463101293/
M50.516333231267/
Table 3. Electrical resistivity and capillary porosity measurement results.
Mixture IDElectrical Resistivity (Ωm)Standard Dev.Capillary Porosity (%)Standard Dev.
C1145.29002.50806.67330.0208
C2113.18332.50077.68670.0208
C388.07671.39918.37000.0200
C474.93672.20188.89000.0361
C563.87673.06089.45330.0551
M164.14511.08979.30670.0513
M243.36332.084310.94670.1050
M335.48671.346611.82000.0800
M429.16001.055312.78670.1457
M522.26330.415314.13000.1212
Table 4. Oxygen diffusion coefficient results of all mixtures.
Mixture IDOxygen Diffusion Coefficient (DO × 10−8 m2/s)Standard Dev.
C1 (w/c = 0.39)1.820.1529
C2 (w/c = 0.42)2.560.5427
C3 (w/c = 0.45)3.810.8214
C4 (w/c = 0.48)4.580.7027
C5 (w/c = 0.51)5.720.5784
M1 (w/c = 0.39)5.740.4612
M2 (w/c = 0.42)8.540.3594
M3 (w/c = 0.45)10.210.5594
M4 (w/c = 0.48)11.390.3249
M5 (w/c = 0.51)13.070.4421
Publisher’s Note: MDPI stays neutral with regard to jurisdictional claims in published maps and institutional affiliations.

