
Mechanical Strength and Hydration Characteristics of Cement Mixture with Highly Concentrated Hydrogen Nanobubble Water

 , ,
, , 
Abstract
1. Introduction
2. Experimental Details
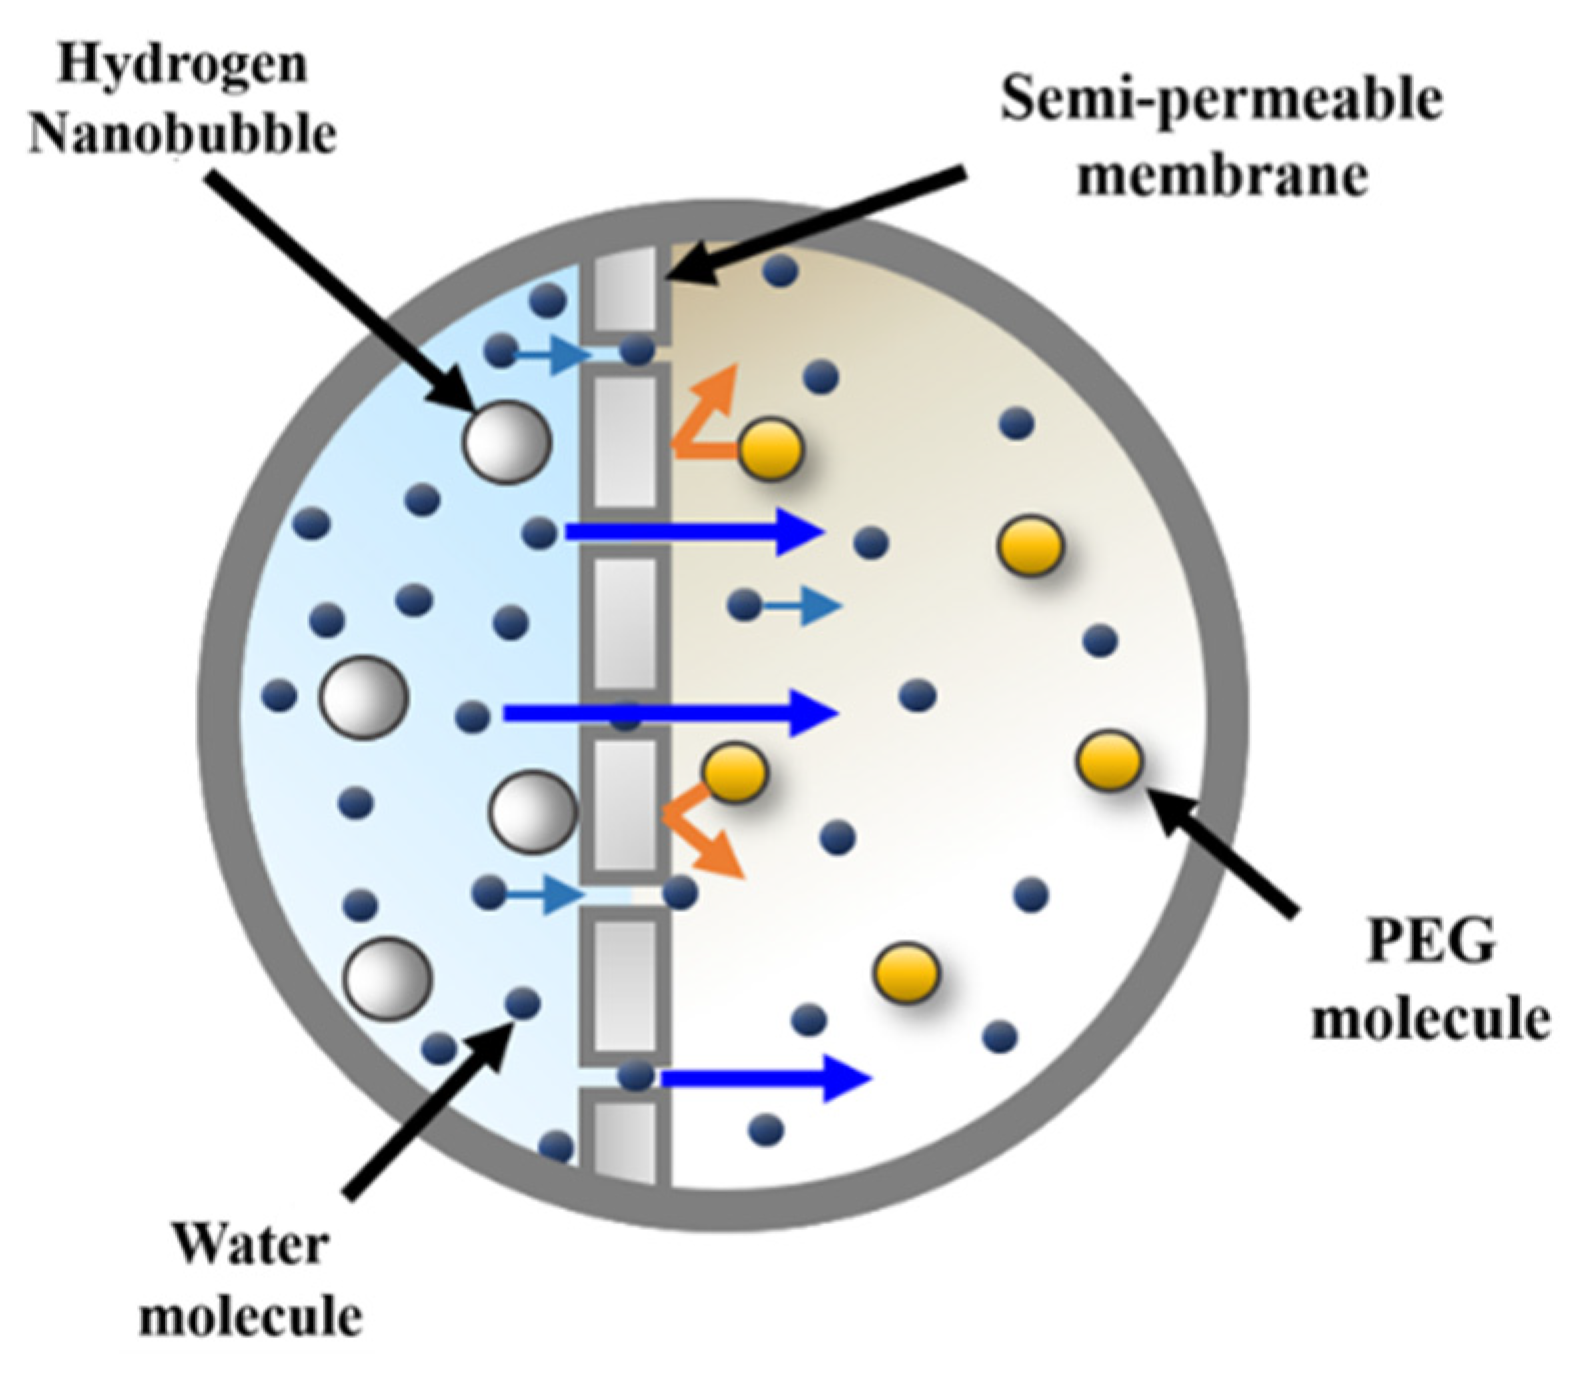
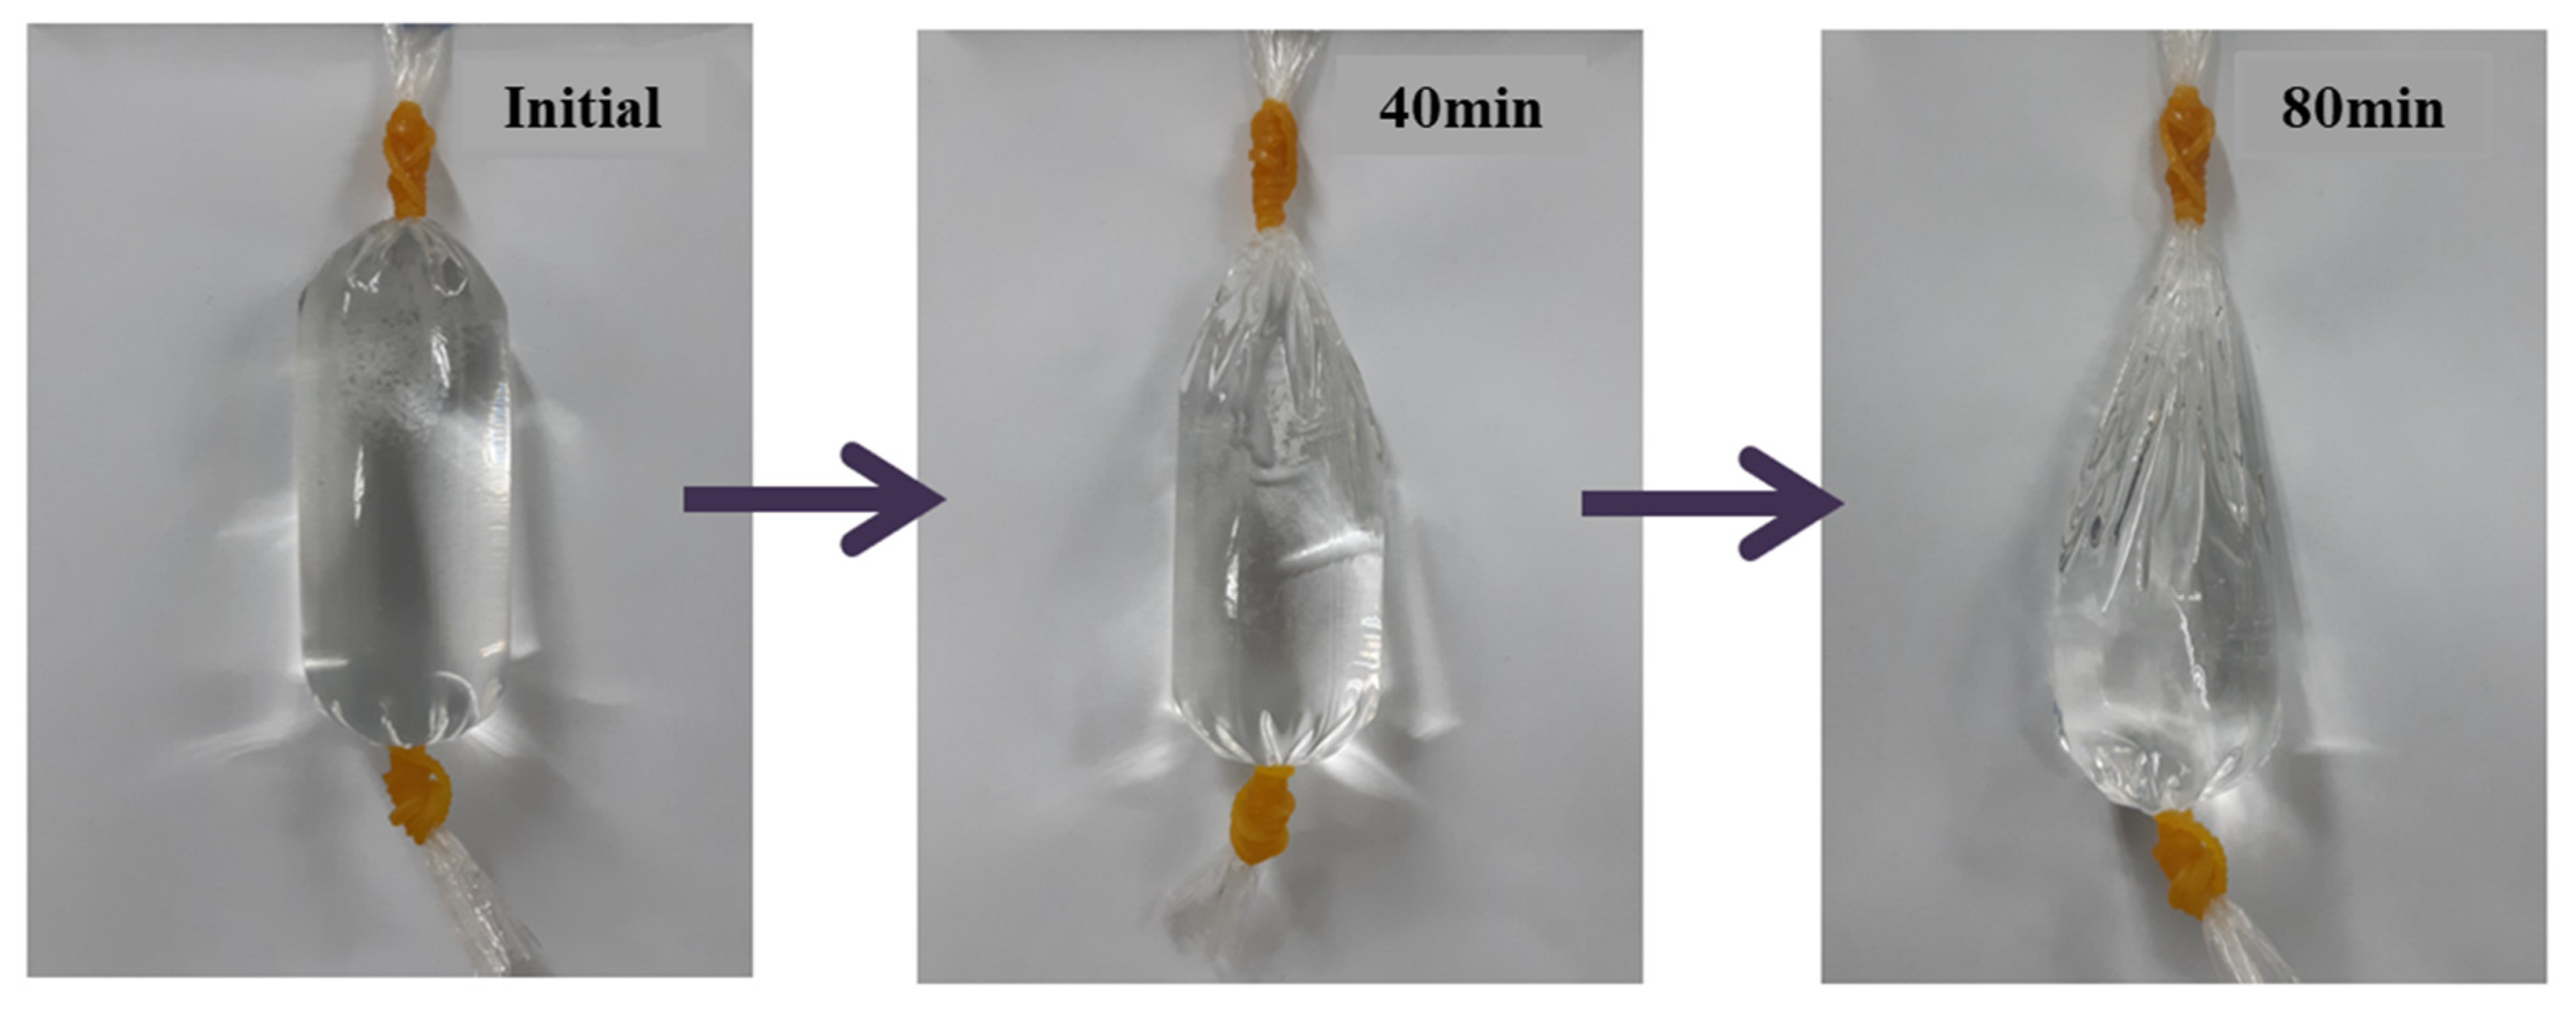
2.1. Synthesizing the HNBW
2.2. Experimental Method and Conditions
3. Results and Discussion
3.1. Mechanical Strength Test
3.2. Mineralogical and Thermal Analyses
3.2.1. XRD Test
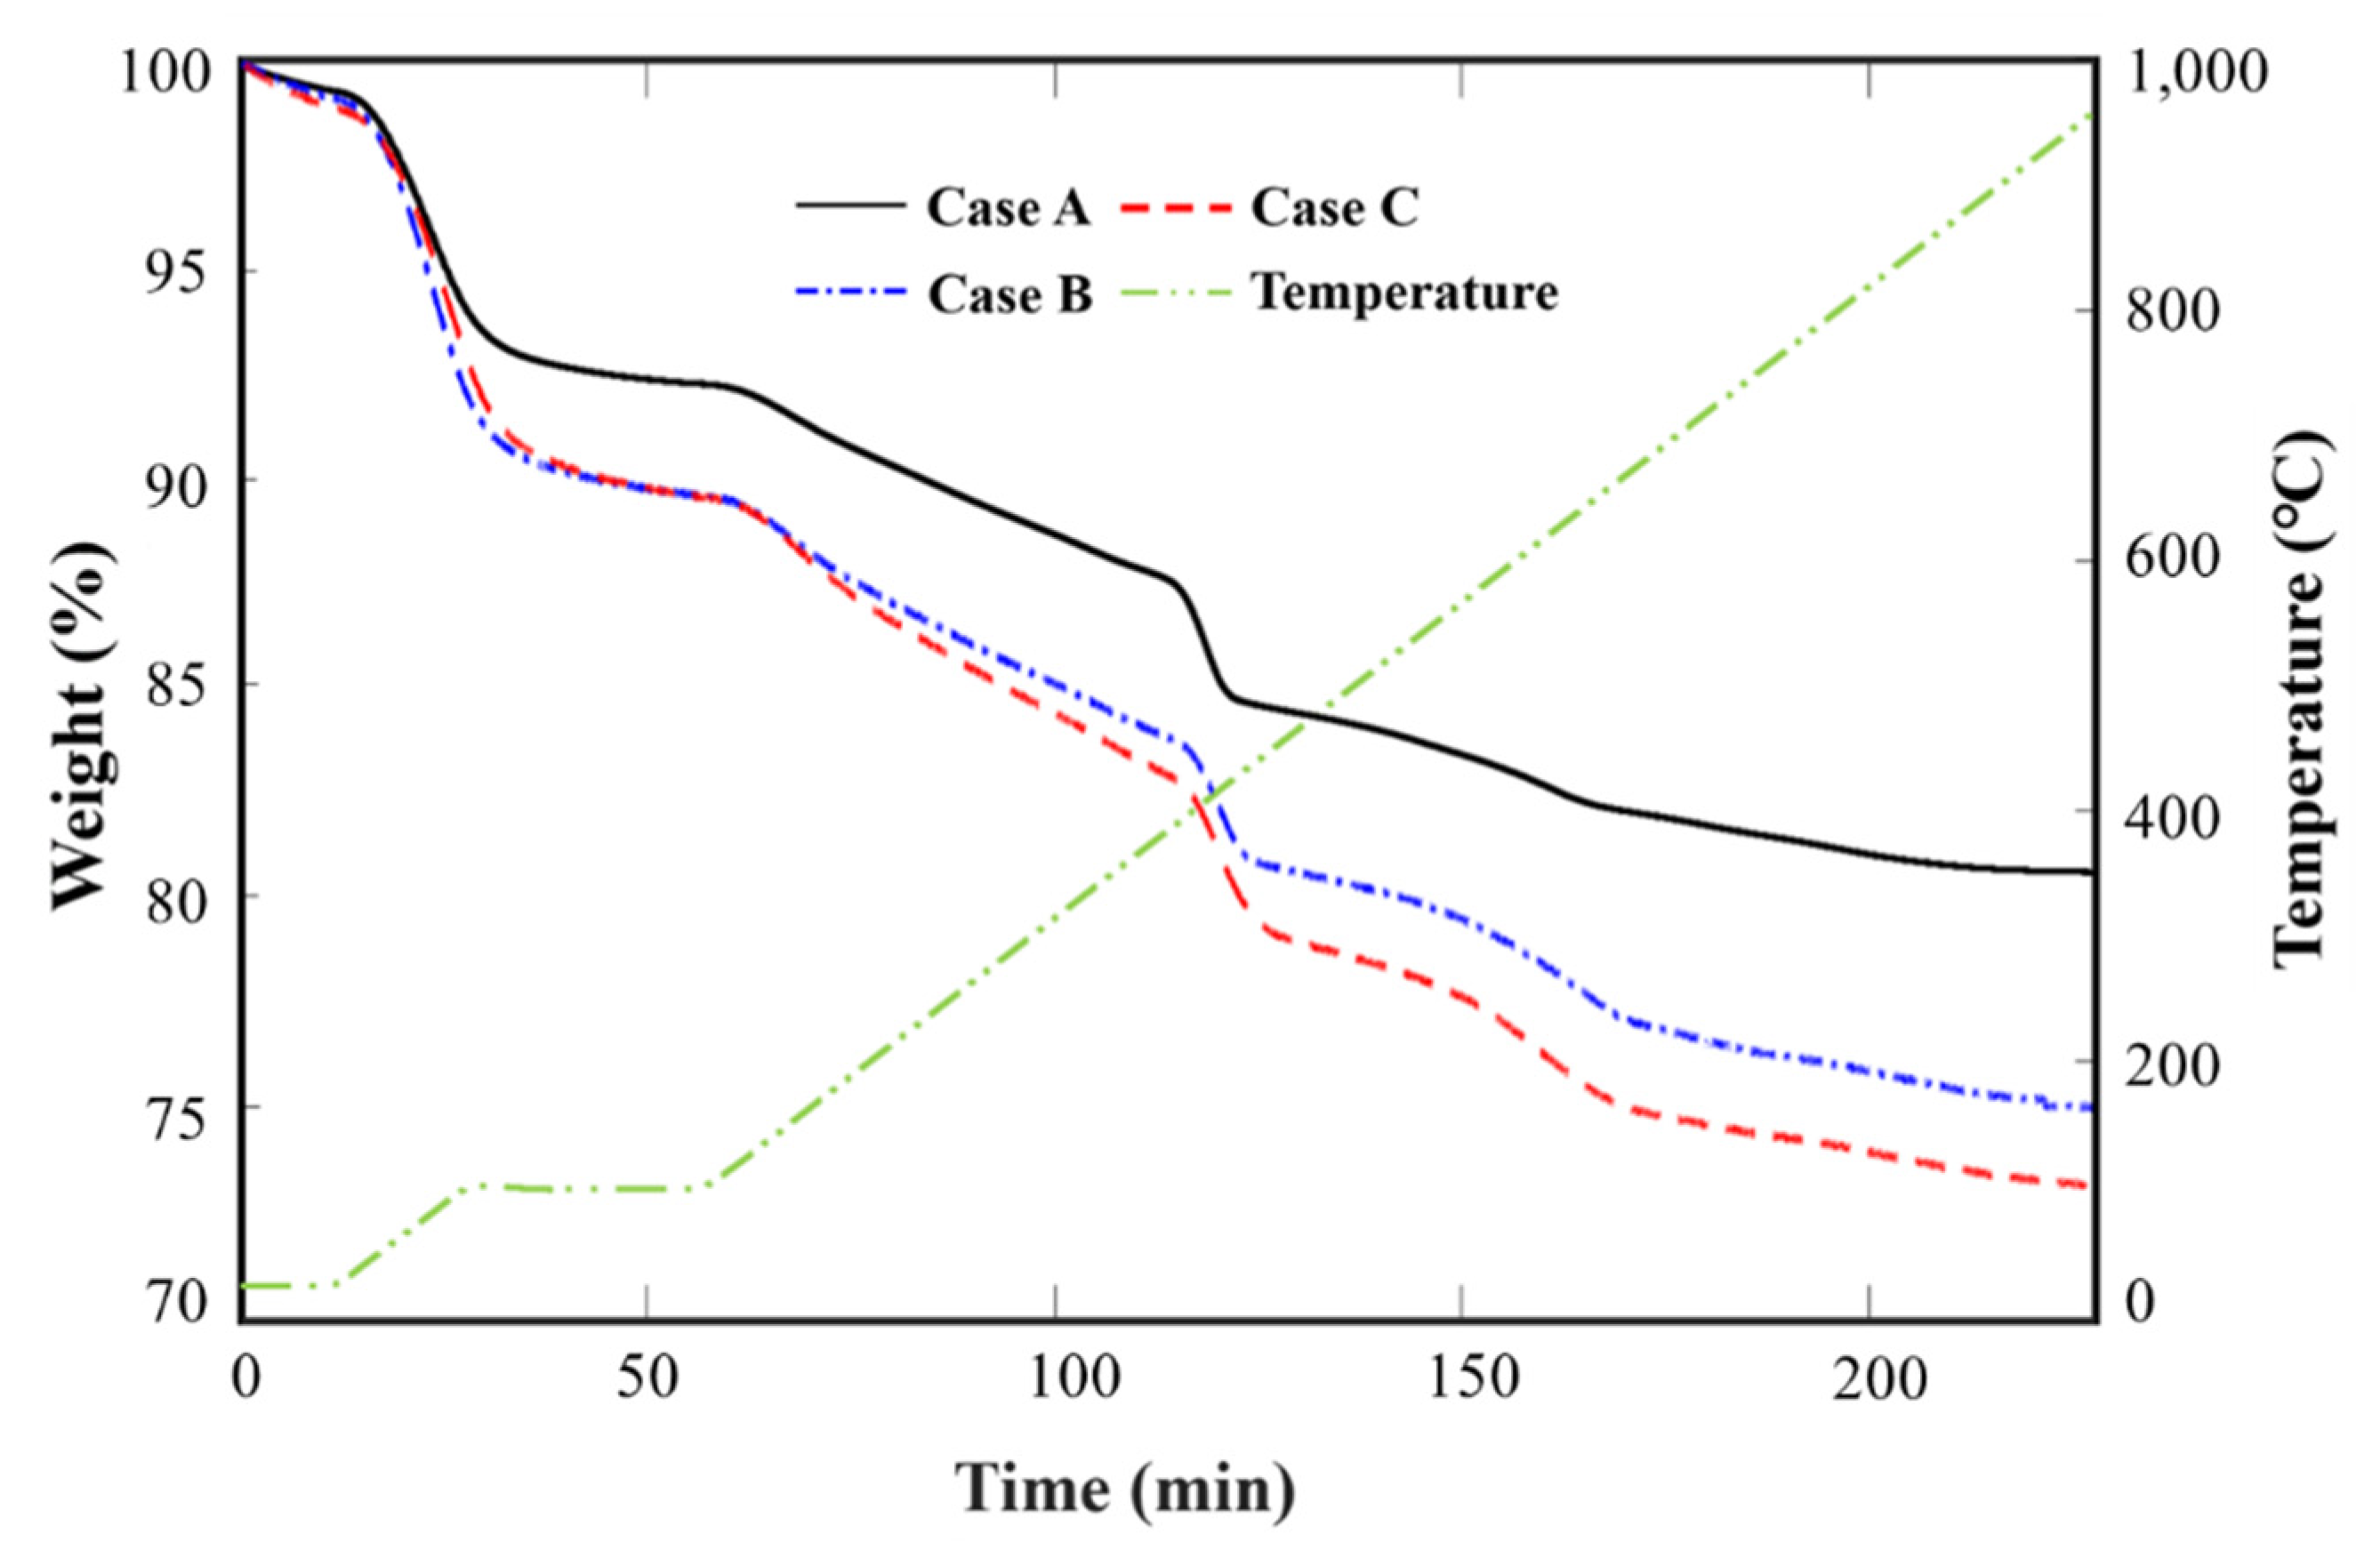
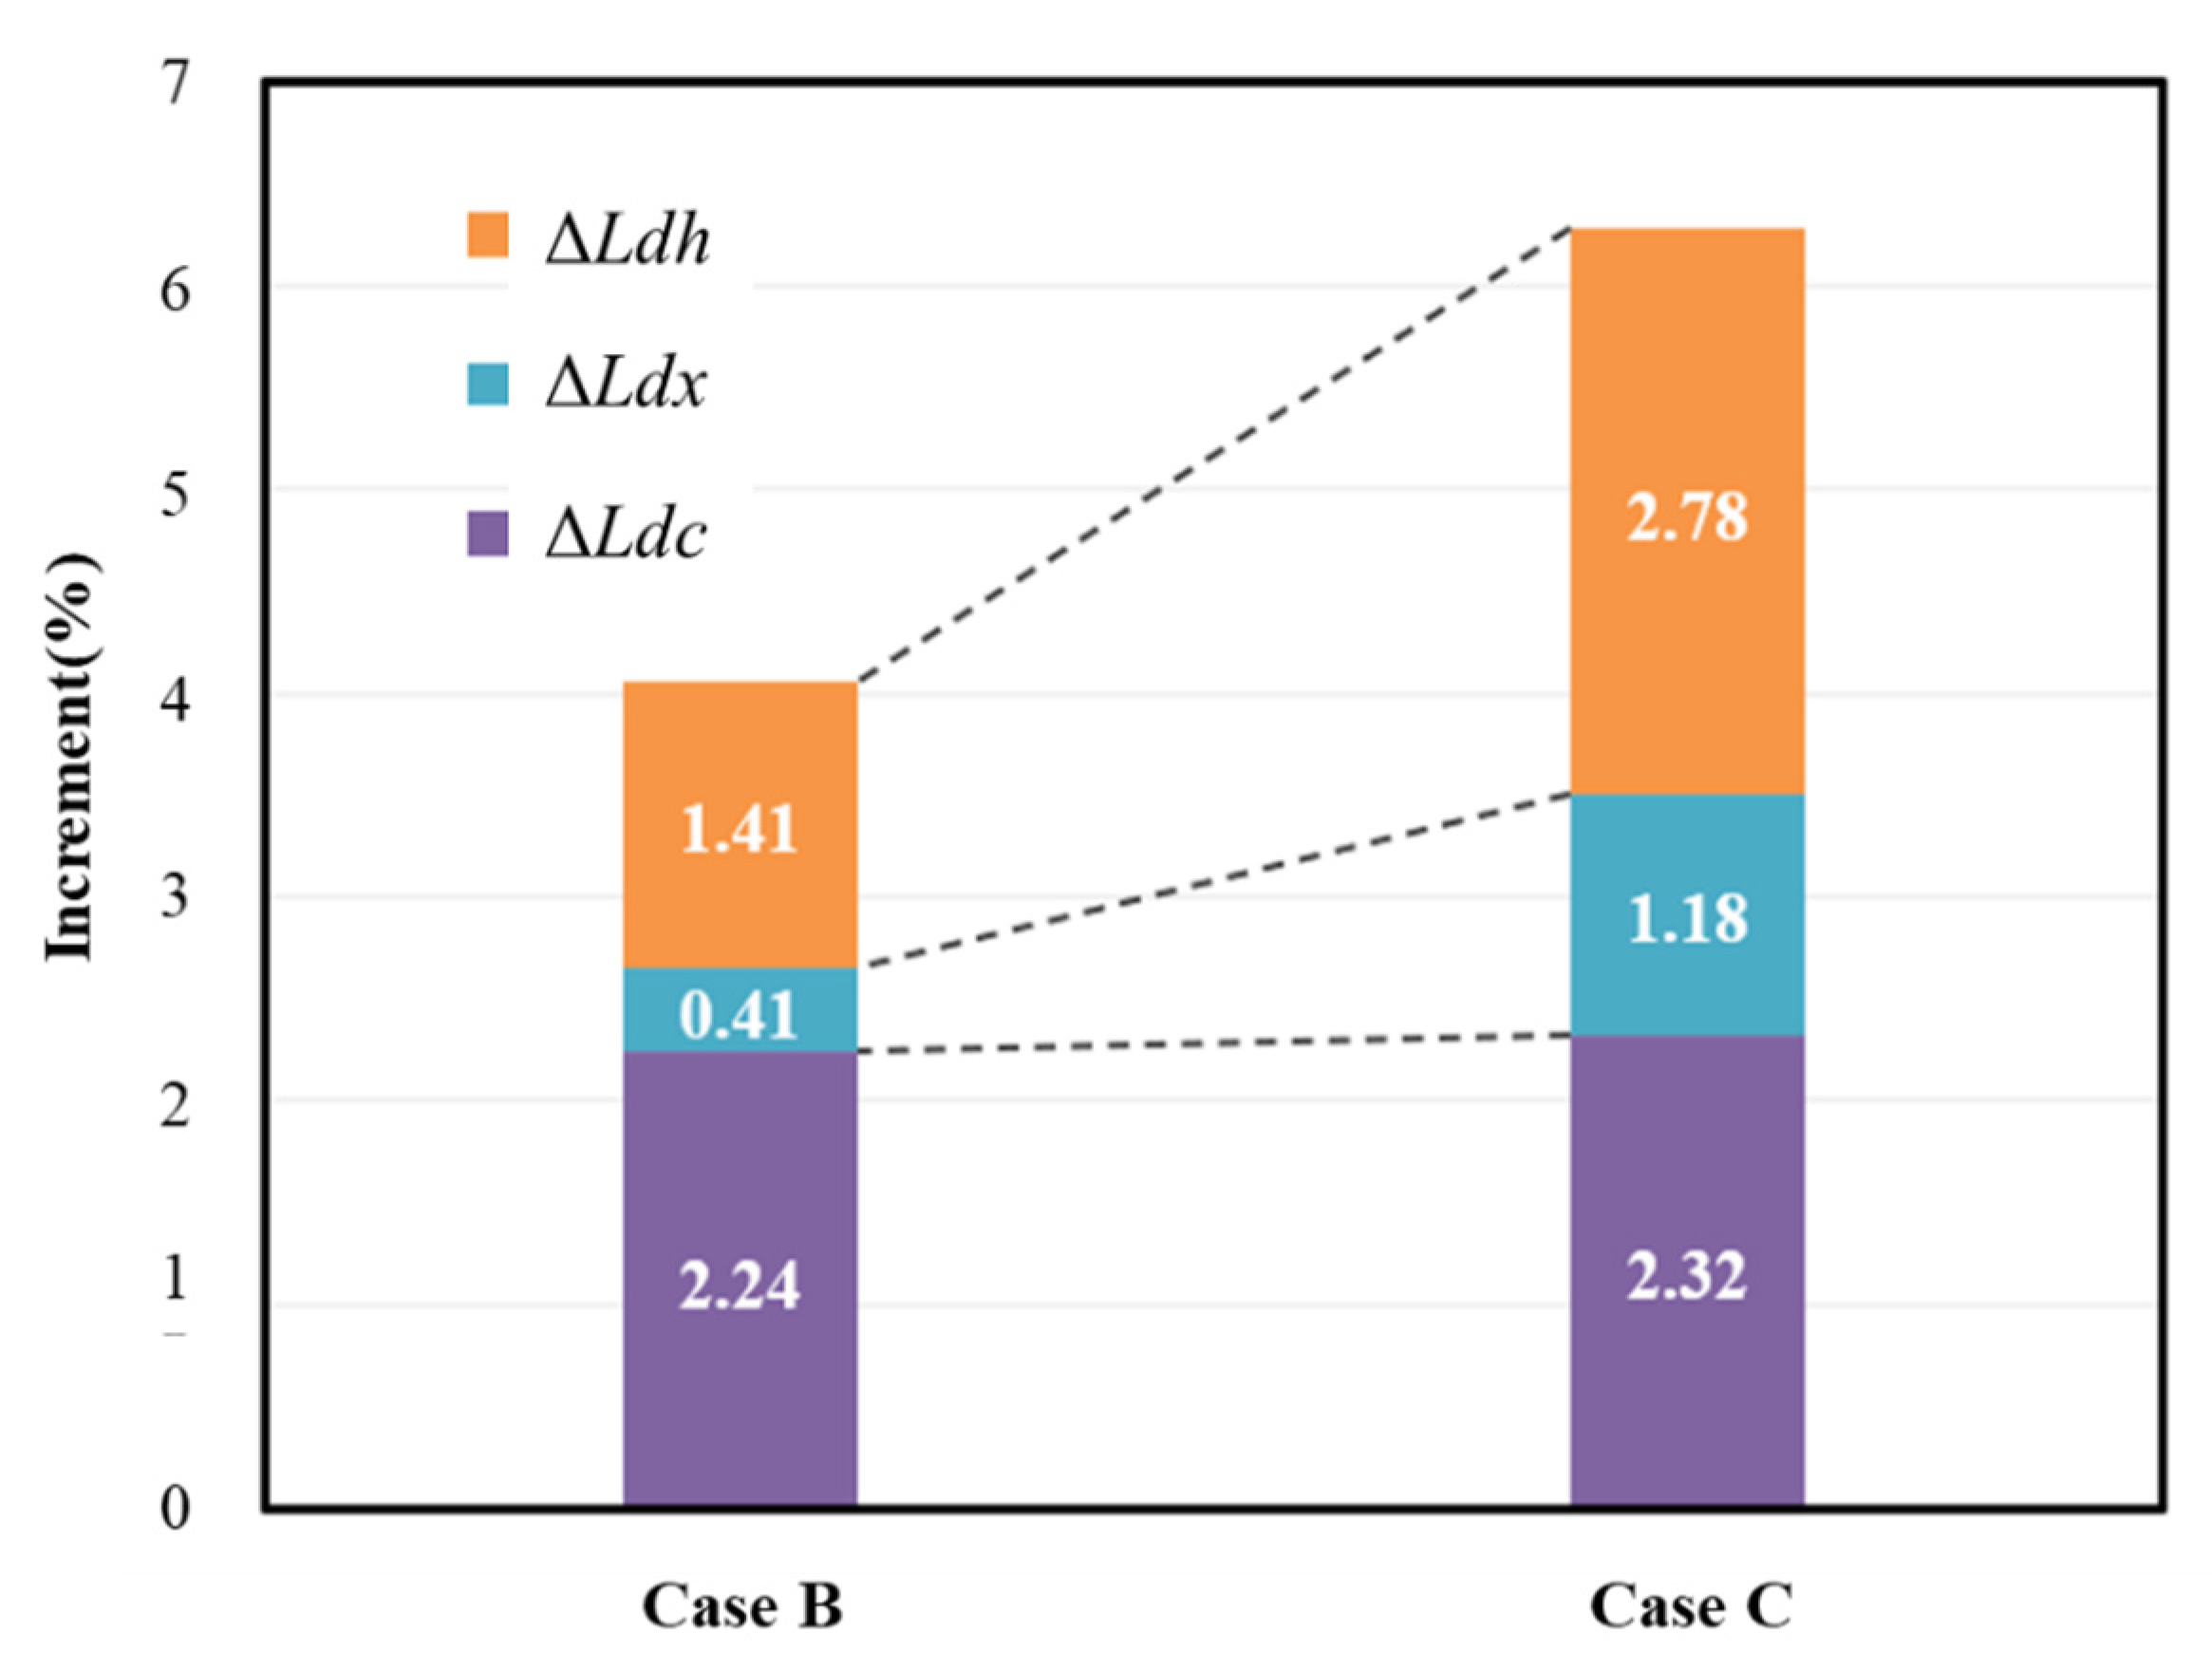
3.2.2. TGA Test
Methodology
Test Results
Discussion
3.3. Microstructural Analyses
4. Conclusions
Author Contributions
Funding
Data Availability Statement
Conflicts of Interest
References
- Marinković, S.; Dragaš, J.; Ignjatović, I.; Tošić, N. Environmental assessment of green concretes for structural use. J. Clean. Prod. 2017, 154, 633–649. [Google Scholar] [CrossRef]
- Flatt, R.J.; Roussel, N.; Cheeseman, C.R. Concrete: An eco material that needs to be improved. J. Eur. Ceram. Soc. 2012, 32, 2787–2798. [Google Scholar] [CrossRef]
- Radonjanin, V.; Malešev, M.; Marinković, S.; Al Malty, A.E.S. Green recycled aggregate concrete. Constr. Build. Mater. 2013, 47, 1503–1511. [Google Scholar] [CrossRef]
- Olivier, J.G.; Schure, K.M.; Peters, J.A.H.W. Trends in Global CO2 and Total Greenhouse Gas Emissions; PBL Netherlands Environmental Assessment Agency: The Hague, The Netherlands, 2017; p. 5.
- Guo, Z.; Jiang, T.; Zhang, J.; Kong, X.; Chen, C.; Lehman, D.E. Mechanical and durability properties of sustainable self-compacting concrete with recycled concrete aggregate and fly ash, slag and silica fume. Constr. Build. Mater. 2020, 231, 117115. [Google Scholar] [CrossRef]
- Sabet, F.A.; Libre, N.A.; Shekarchi, M. Mechanical and durability properties of self consolidating high performance concrete incorporating natural zeolite, silica fume and fly ash. Constr. Build. Mater. 2013, 44, 175–184. [Google Scholar] [CrossRef]
- Nasution, A.; Imran, I.; Abdullah, M. Improvement of Concrete Durability by Nanomaterials. Procedia Eng. 2015, 125, 608–612. [Google Scholar] [CrossRef]
- Norhasri, M.M.; Hamidah, M.; Fadzil, A.M. Applications of using nano material in concrete: A review. Constr. Build. Mater. 2017, 133, 91–97. [Google Scholar] [CrossRef]
- Kim, Y.-H.; Park, Y.; Bae, S.; Kim, S.Y.; Han, J.-G. Compressive Strength Evaluation of Ordinary Portland Cement Mortar Blended with Hydrogen Nano-Bubble Water and Graphene. J. Nanosci. Nanotechnol. 2020, 20, 647–652. [Google Scholar] [CrossRef]
- Zadeh, P.M.; Saghravani, S.F.; Asadollahfardi, G. Mechanical and durability properties of concrete containing zeolite mixed with meta-kaolin and micro-nano bubbles of water. Struct. Concr. 2019, 20, 786–797. [Google Scholar] [CrossRef]
- Han, J.G.; Lee, S.H.; Na, J.J.; Hong, G.G.; Lee, J.H.; Kim, J.M. Effect of Nano-bubble water for the compressive strength of cement mortar using in pile foundation. In Proceedings of the Korean Soc Civil Engineering 2012, Gwangju, Korea, 24–26 October 2012; pp. 1090–1093. [Google Scholar]
- Alheshibri, M.; Qian, J.; Jehannin, M.; Craig, V.S.J. A History of Nanobubbles. Langmuir 2016, 32, 11086–11100. [Google Scholar] [CrossRef]
- Agarwal, A.; Ng, W.J.; Liu, Y. Principle and applications of microbubble and nanobubble technology for water treatment. Chemosphere 2011, 84, 1175–1180. [Google Scholar] [CrossRef]
- Nirmalkar, N.; Pacek, A.W.; Barigou, M. On the Existence and Stability of Bulk Nanobubbles. Langmuir 2018, 34, 10964–10973. [Google Scholar] [CrossRef] [PubMed]
- Ebina, K.; Shi, K.; Hirao, M.; Hashimoto, J.; Kawato, Y.; Kaneshiro, S.; Morimoto, T.; Koizumi, K.; Yoshikawa, H. Oxygen and Air Nanobubble Water Solution Promote the Growth of Plants, Fishes, and Mice. PLoS ONE 2013, 8, e65339. [Google Scholar] [CrossRef]
- Ushikubo, F.Y.; Furukawa, T.; Nakagawa, R.; Enari, M.; Makino, Y.; Kawagoe, Y.; Shiina, T.; Oshita, S. Evidence of the existence and the stability of nano-bubbles in water. Colloids Surfaces A Physicochem. Eng. Asp. 2010, 361, 31–37. [Google Scholar] [CrossRef]
- Takahashi, M. ζ Potential of Microbubbles in Aqueous Solutions: Electrical Properties of the Gas−Water Interface. J. Phys. Chem. B 2005, 109, 21858–21864. [Google Scholar] [CrossRef] [PubMed]
- Oh, S.H.; Kim, J.-M. Generation and Stability of Bulk Nanobubbles. Langmuir 2017, 33, 3818–3823. [Google Scholar] [CrossRef] [PubMed]
- Batagoda, J.H.; Hewage, S.D.A.; Meegoda, J.N. Nano-ozone bubbles for drinking water treatment. J. Environ. Eng. Sci. 2019, 14, 57–66. [Google Scholar] [CrossRef]
- German, S.R.; Chen, Q.; Edwards, M.A.; White, H.S. Electrochemical Measurement of Hydrogen and Nitrogen Nanobubble Lifetimes at Pt Nanoelectrodes. J. Electrochem. Soc. 2016, 163, H3160–H3166. [Google Scholar] [CrossRef]
- Nakashima, S.; Spiers, C.; Mercury, L.; Fenter, P.; Hochella, M.F., Jr. Physicochemistry of Water in Geological and Biological Systems—Structures and Properties of Thin Aqueous Films; Universal Academy Press, Inc.: Tokyo, Japan, 2004; pp. 2–5. [Google Scholar]
- Ohgaki, K.; Khanh, N.Q.; Joden, Y.; Tsuji, A.; Nakagawa, T. Physicochemical approach to nanobubble solutions. Chem. Eng. Sci. 2010, 65, 1296–1300. [Google Scholar] [CrossRef]
- Weijs, J.H.; Seddon, J.R.T.; Lohse, D. Diffusive Shielding Stabilizes Bulk Nanobubble Clusters. ChemPhysChem 2012, 13, 2197–2204. [Google Scholar] [CrossRef]
- Azevedo, A.; Etchepare, R.; Calgaroto, S.; Rubio, J. Aqueous dispersions of nanobubbles: Generation, properties and features. Miner. Eng. 2016, 94, 29–37. [Google Scholar] [CrossRef]
- Yang, J.; Duan, J.; Fornasiero, D.; Ralston, J. Very Small Bubble Formation at the Solid−Water Interface. J. Phys. Chem. B 2003, 107, 6139–6147. [Google Scholar] [CrossRef]
- Zhang, X.H.; Maeda, N.; Craig, V.S.J. Physical Properties of Nanobubbles on Hydrophobic Surfaces in Water and Aqueous Solutions. Langmuir 2006, 22, 5025–5035. [Google Scholar] [CrossRef] [PubMed]
- Ushida, A.; Hasegawa, T.; Takahashi, N.; Nakajima, T.; Murao, S.; Narumi, T.; Uchiyama, H. Effect of Mixed Nanobubble and Microbubble Liquids on the Washing Rate of Cloth in an Alternating Flow. J. Surfactants Deterg. 2012, 15, 695–702. [Google Scholar] [CrossRef]
- Kim, D.; Han, J. Remediation of Copper Contaminated Soils Using Water Containing Hydrogen Nanobubbles. Appl. Sci. 2020, 10, 2185. [Google Scholar] [CrossRef]
- Chan, C.U.; Arora, M.; Ohl, C.-D. Coalescence, Growth, and Stability of Surface-Attached Nanobubbles. Langmuir 2015, 31, 7041–7046. [Google Scholar] [CrossRef]
- Cavalli, R.; Argenziano, M.; Vigna, E.; Giustetto, P.; Torres, E.; Aime, S.; Terreno, E. Preparation and in vitro characterization of chitosan nanobubbles as theranostic agents. Colloids Surfaces B Biointerfaces 2015, 129, 39–46. [Google Scholar] [CrossRef]
- Hampton, M.; Nguyen, A. Nanobubbles and the nanobubble bridging capillary force. Adv. Colloid Interface Sci. 2010, 154, 30–55. [Google Scholar] [CrossRef]
- Liu, S.; Kawagoe, Y.; Makino, Y.; Oshita, S. Effects of nanobubbles on the physicochemical properties of water: The basis for peculiar properties of water containing nanobubbles. Chem. Eng. Sci. 2013, 93, 250–256. [Google Scholar] [CrossRef]
- Sobhy, A.; Tao, D. Nanobubble column flotation of fine coal particles and associated fundamentals. Int. J. Miner. Process. 2013, 124, 109–116. [Google Scholar] [CrossRef]
- Jeong, S.-H.; Kim, D.-C.; Han, J.-G. The Fundamental Study on th e Soil Remediation for Copper Contaminated Soil using Nanobubble Water. J. Korean Geosynth. Soc. 2017, 16, 31–39. [Google Scholar] [CrossRef][Green Version]
- Chung, A. University Industry Academic Cooperation Foundation. Apparatus for High Concentratining Nanobubbles and Highly Concentratining Method of Nanobubbles. Korea Patent No. 10-1732414, 18 October 2016. [Google Scholar]
- Kim, W.K.; Park, Y.S.; Kim, J.; Jeon, S.W.; Lee, Y.K.; Han, J.G. An Experimental Study for Verifying the Compressive Strength Promotion Effect of Cement Mortar by Using Highly Concentrated Hydrogen Nano-Bubble Water. In Proceedings of the 2019 KSCE Convention Conference, Pyeong Chang, Korea, 16–18 October 2019; pp. 964–965. [Google Scholar]
- ISO. 679. Cement-Test Methods-Determination of Strength; ISO: Geneva, Switzerland, 2009. [Google Scholar]
- ASTM C109/C109M-20b. Standard Test Method for Compressive Strength of Hydraulic Cement Mortars (Using 2-in. or [50-mm] Cube Specimens); ASTM International: West Conshohocken, PA, USA, 2020. [Google Scholar]
- Gupta, A.K.; Banerjee, P.; Mishra, A.; Satish, P. Pradip Effect of alcohol and polyglycol ether frothers on foam stability, bubble size and coal flotation. Int. J. Miner. Process. 2007, 82, 126–137. [Google Scholar] [CrossRef]
- Yoon, R.H.; Luttrell, G.H. The Effect of Bubble Size on Fine Particle Flotation. Miner. Process. Extr. Met. Rev. 1989, 5, 101–122. [Google Scholar] [CrossRef]
- Yoon, R.-H. Microbubble flotation. Miner. Eng. 1993, 6, 619–630. [Google Scholar] [CrossRef]
- Yang, Q. Stability of Air Bubbles in Fresh Concrete. Master’s Thesis, Chalmers University of Technology, Göteborg, Sweden, 2012. [Google Scholar]
- Feng, Y.; Zhang, Q.; Chen, Q.; Wang, D.; Guo, H.; Liu, L.; Yang, Q. Hydration and strength development in blended cement with ultrafine granulated copper slag. PLoS ONE 2019, 14, e0215677. [Google Scholar] [CrossRef]
- Smit, B.; Reimer, J.A.; Oldenburg, C.M.; Bourg, I.C. Introduction to Carbon Capture and Sequestration; Imperial College Press: London, UK, 2014. [Google Scholar] [CrossRef]
- Holder, C.F.; Schaak, R.E. Tutorial on Powder X-ray Diffraction for Characterizing Nanoscale Materials. ACS Nano 2019, 13, 7359–7365. [Google Scholar] [CrossRef] [PubMed]
- Mounanga, P. Experimental study of the behavior of cement pastes at very young age: Hydration, shrinkage, thermophysical properties. Adv. Cem. Res. 2003, 16, 95–103. [Google Scholar] [CrossRef][Green Version]
- Deboucha, W.; Leklou, N.; Khelidj, A.; Oudjit, M.N. Hydration development of mineral additives blended cement using thermogravimetric analysis (TGA): Methodology of calculating the degree of hydration. Constr. Build. Mater. 2017, 146, 687–701. [Google Scholar] [CrossRef]
- Bhatty, J.I. Hydration versus strength in a portland cement developed from domestic mineral wastes—A comparative study. Thermochim. Acta 1986, 106, 93–103. [Google Scholar] [CrossRef]
- Zhang, J.; Scherer, G.W. Comparison of methods for arresting hydration of cement. Cem. Concr. Res. 2011, 41, 1024–1036. [Google Scholar] [CrossRef]
- Hošková, Š.; Tichá, P.; Demo, P. Determination of Ca2+ ions at early stage of hydrating cement paste. Ceram.-Silik 2009, 53, 76–80. [Google Scholar]
- Kim, W.-K.; Kim, Y.-H.; Hong, G.; Kim, J.-M.; Han, J.-G.; Lee, J.-Y. Effect of Hydrogen Nanobubbles on the Mechanical Strength and Watertightness of Cement Mixtures. Materials 2021, 14, 1823. [Google Scholar] [CrossRef] [PubMed]


| Properties | Initial | HNBW (40) | HNBW (80) |
|---|---|---|---|
| Osmosis duration (min) | 40 | 80 | |
| Concentration (particles/mL) | HNBW (0.93 × 10⁸) | HNBW (1.36 × 10⁸) | HNBW (2.41 × 10⁸) |
| Mean diameter (nm) | 199.33 | 177.33 | 153.01 |
| Mode diameter (nm) | 179.67 | 146.67 | 135.25 |
| Mixtures | Mixing Ratio (%) | Sample No. | Curing Time (day) | Test Method * | ||
|---|---|---|---|---|---|---|
| Case A | Case B | Case C | ||||
| Cement mortar (ISO 679) | 22.2 | Ordinary Portland cement (OPC) | 3, 7, 28 | ①, ②, ③ | ||
| 66.7 | ISO standard sand | |||||
| 11.1 | Plain water | HNBW (40) | HNBW (80) | |||
| Cement paste (ASTM C 109) | 67.2 | Ordinary Portland cement (OPC) | 7 | ④, ⑤ | ||
| 32.8 | Plain water | HNBW (40) | HNBW (80) | |||
| Curing Days | 3 | 7 | 28 | |
|---|---|---|---|---|
| Sample No. | ||||
| Case A | 5.8 | 6.8 | 8.9 | |
| Case B | 5.9 | 6.9 | 9.1 | |
| Case C | 6.3 | 7.3 | 10.1 | |
| Curing Days | 3 | 7 | 28 | |
|---|---|---|---|---|
| Sample No. | ||||
| Case A | 27.1 | 32.2 | 49.9 | |
| Case B | 27.0 | 33.0 | 53.1 | |
| Case C | 27.3 | 33.1 | 55.5 | |
| Temperature Range (°C) | Region | Decomposition of Cement Hydrates |
|---|---|---|
| 105–440 | Dehydration (Ldh) | C-S-H |
| 440–580 | Dehydroxylation (Ldx) | Ca(OH)2 |
| 580–1000 | Decarbonization (Ldc) | CaCO3 |
| Mixture | M105 ˚C (mg) | M440 ˚C (mg) | M580 ˚C (mg) | M1000 ˚C (mg) |
|---|---|---|---|---|
| Case A | 9.93 | 9.11 | 8.96 | 8.67 |
| Case B | 9.79 | 8.84 | 8.66 | 8.19 |
| Case C | 9.78 | 8.70 | 8.46 | 7.99 |
| Mixture | Ldh (%) | Ldx (%) | Ldc (%) | WB (%) | α (%) |
|---|---|---|---|---|---|
| Case A | 8.27 | 1.58 | 3.23 | 11.17 | 46.56 |
| Case B | 9.68 | 1.99 | 5.47 | 13.91 | 57.97 |
| Case C | 11.08 | 2.76 | 5.55 | 16.12 | 67.17 |
Publisher’s Note: MDPI stays neutral with regard to jurisdictional claims in published maps and institutional affiliations. |
© 2021 by the authors. Licensee MDPI, Basel, Switzerland. This article is an open access article distributed under the terms and conditions of the Creative Commons Attribution (CC BY) license (https://creativecommons.org/licenses/by/4.0/).
Share and Cite
Kim, W.-K.; Hong, G.; Kim, Y.-H.; Kim, J.-M.; Kim, J.; Han, J.-G.; Lee, J.-Y. Mechanical Strength and Hydration Characteristics of Cement Mixture with Highly Concentrated Hydrogen Nanobubble Water. Materials 2021, 14, 2735. https://doi.org/10.3390/ma14112735
Kim W-K, Hong G, Kim Y-H, Kim J-M, Kim J, Han J-G, Lee J-Y. Mechanical Strength and Hydration Characteristics of Cement Mixture with Highly Concentrated Hydrogen Nanobubble Water. Materials. 2021; 14(11):2735. https://doi.org/10.3390/ma14112735
Chicago/Turabian StyleKim, Won-Kyung, Gigwon Hong, Young-Ho Kim, Jong-Min Kim, Jin Kim, Jung-Geun Han, and Jong-Young Lee. 2021. "Mechanical Strength and Hydration Characteristics of Cement Mixture with Highly Concentrated Hydrogen Nanobubble Water" Materials 14, no. 11: 2735. https://doi.org/10.3390/ma14112735
APA StyleKim, W.-K., Hong, G., Kim, Y.-H., Kim, J.-M., Kim, J., Han, J.-G., & Lee, J.-Y. (2021). Mechanical Strength and Hydration Characteristics of Cement Mixture with Highly Concentrated Hydrogen Nanobubble Water. Materials, 14(11), 2735. https://doi.org/10.3390/ma14112735