
Principal Component Analysis as a Statistical Tool for Concrete Mix Design


Abstract
1. Introduction
2. Materials Used, Preparation of Specimens, and Testing Methods
3. Test Results, Analysis, and Discussion
4. Conclusions
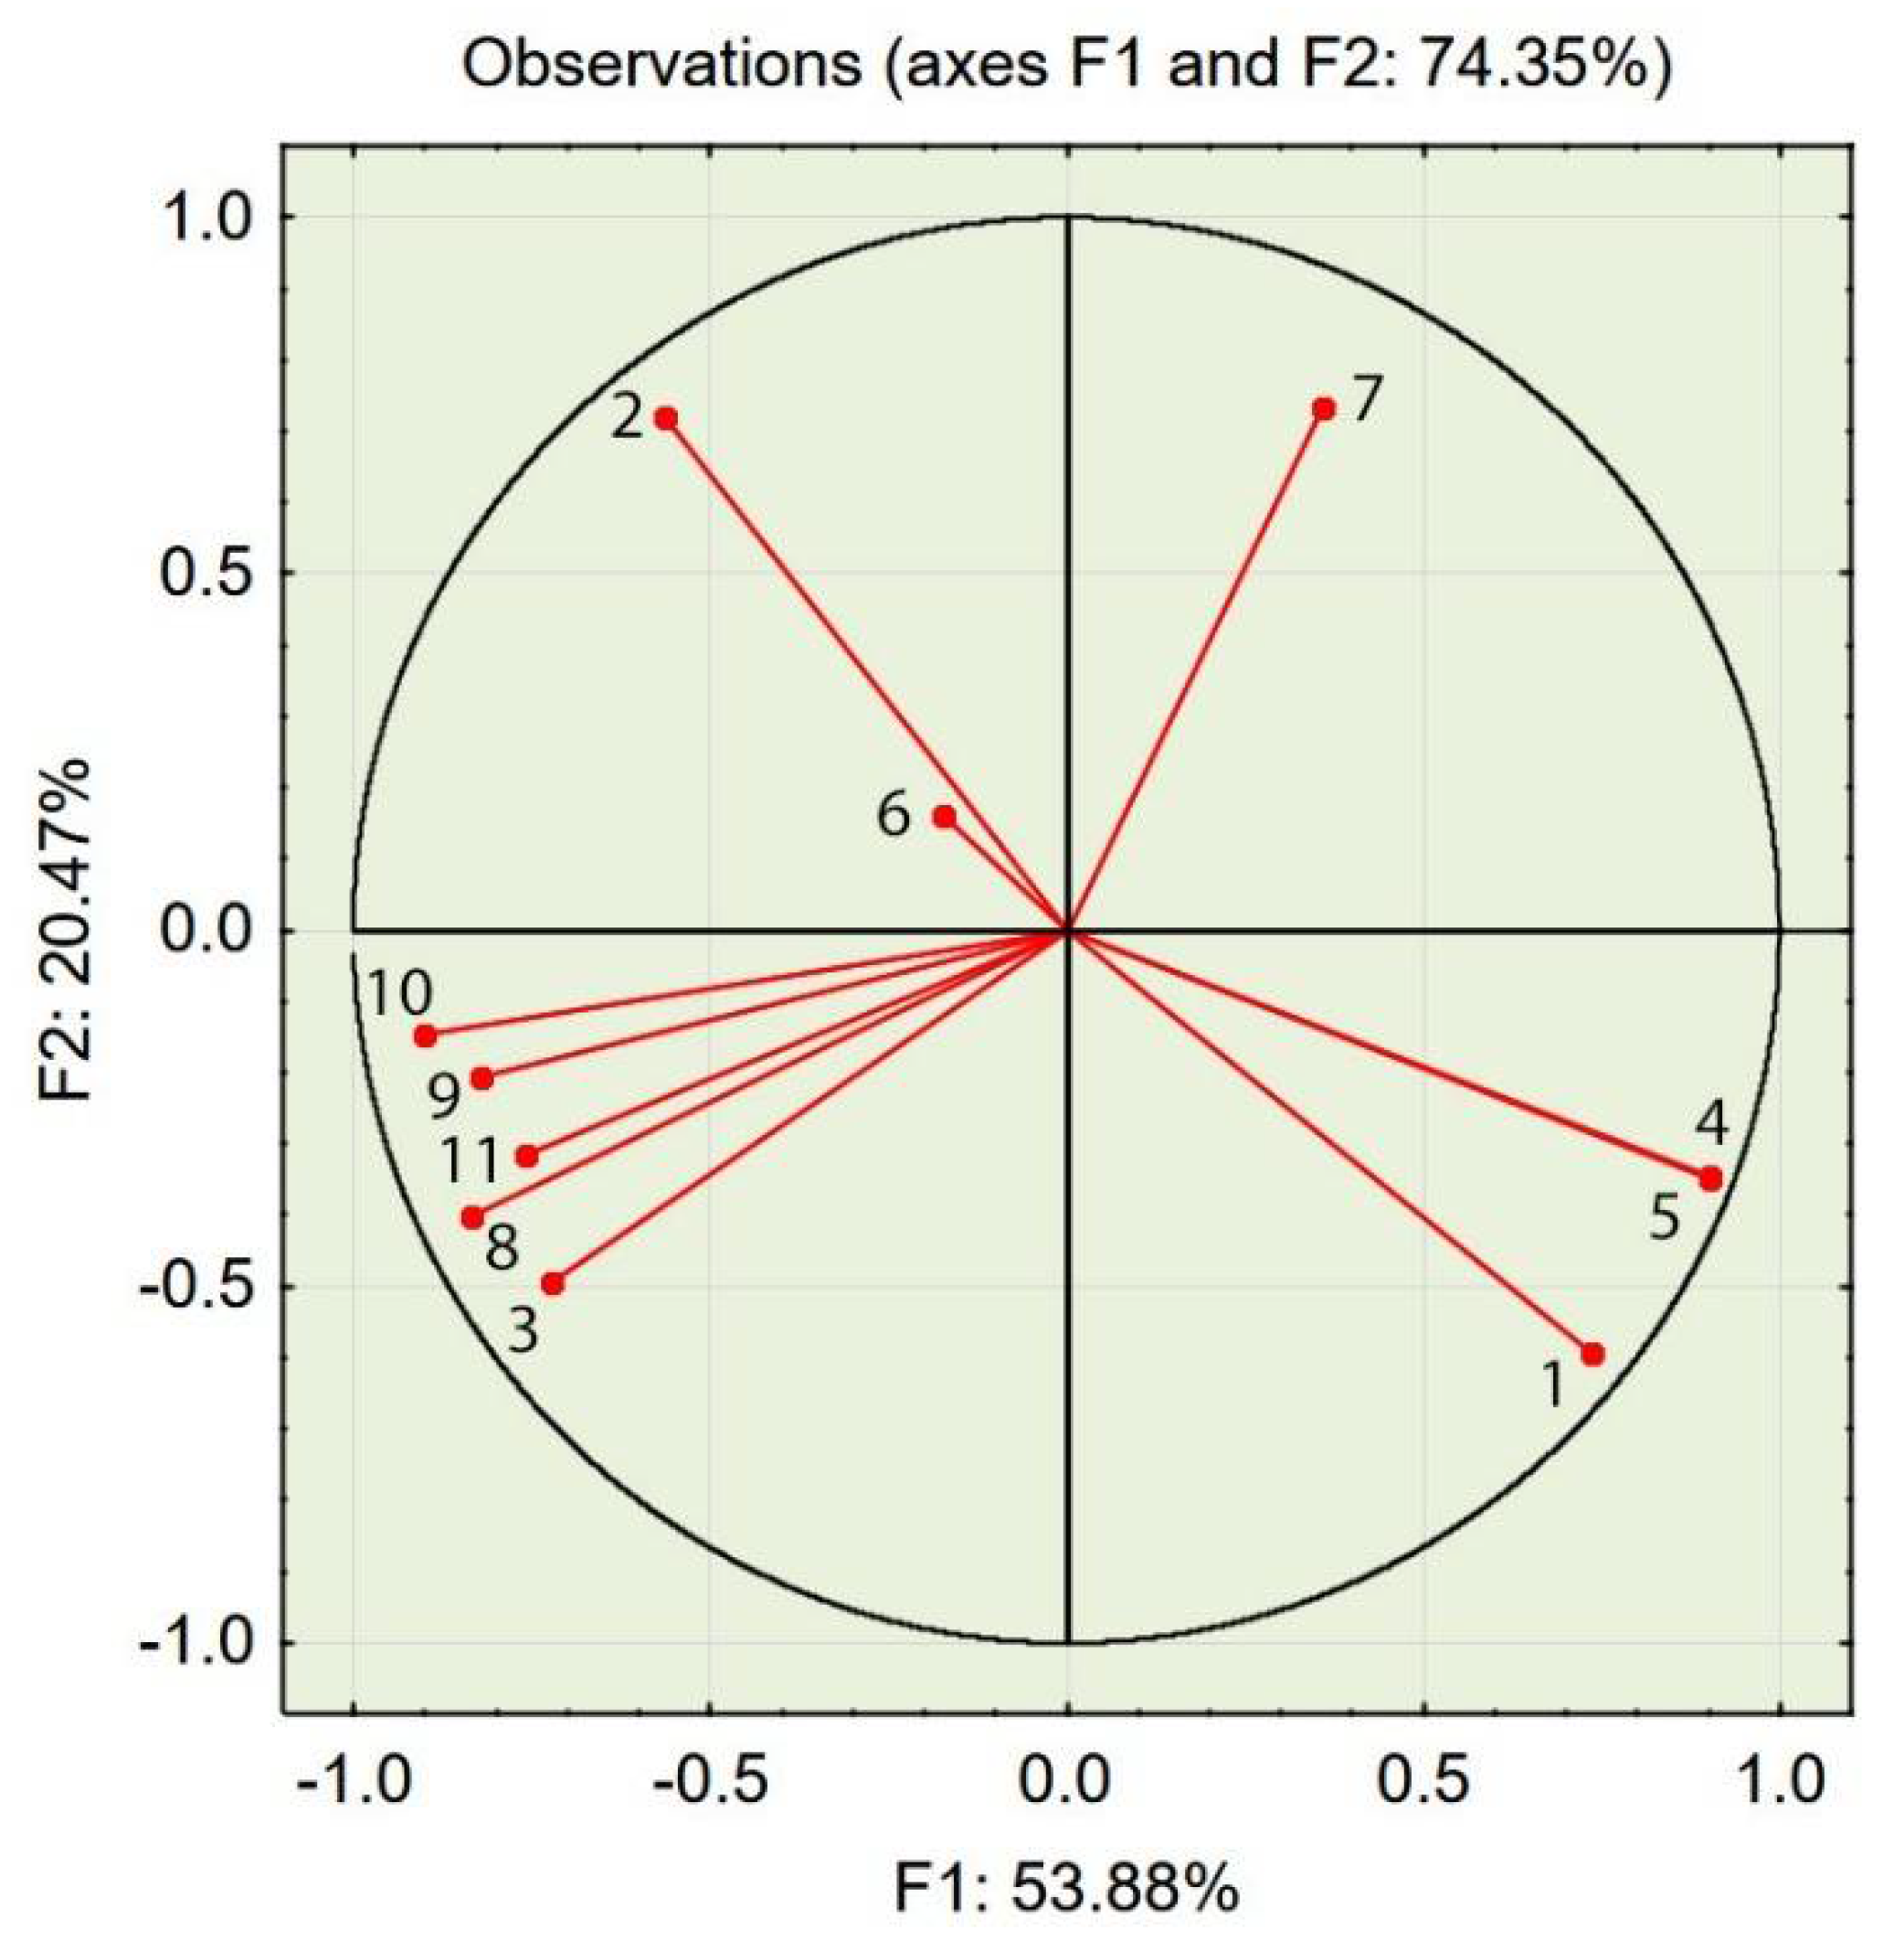
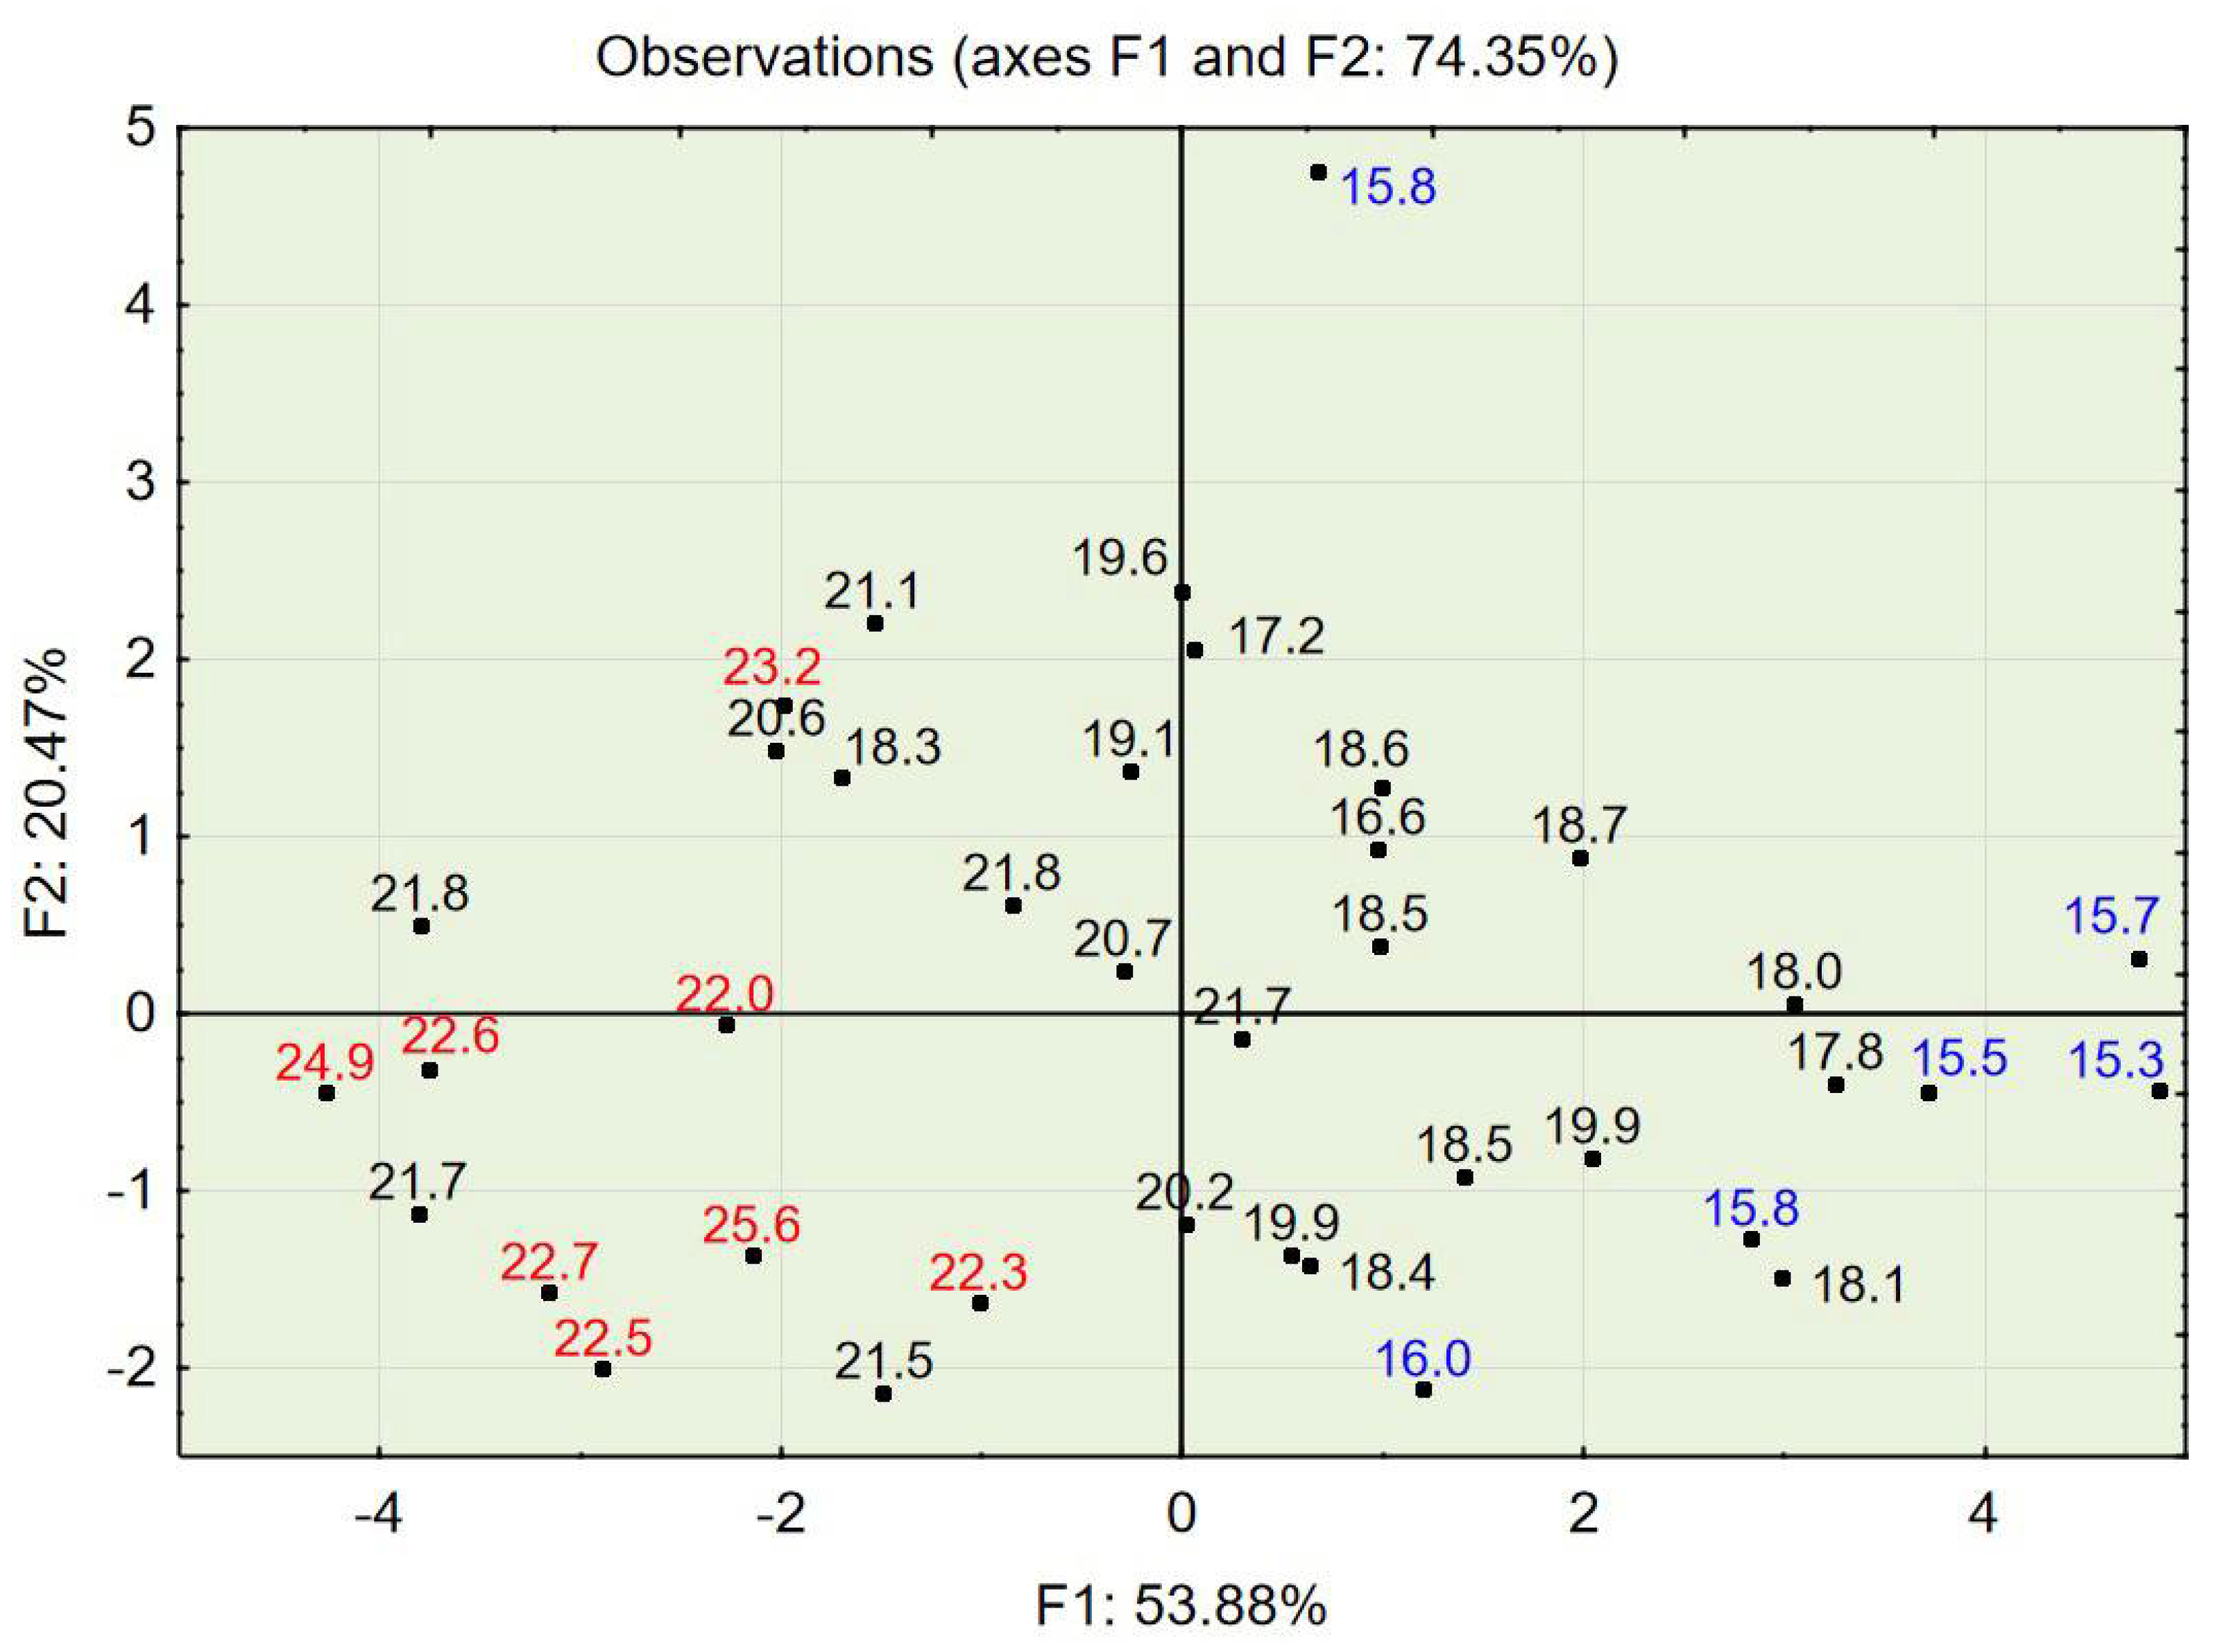
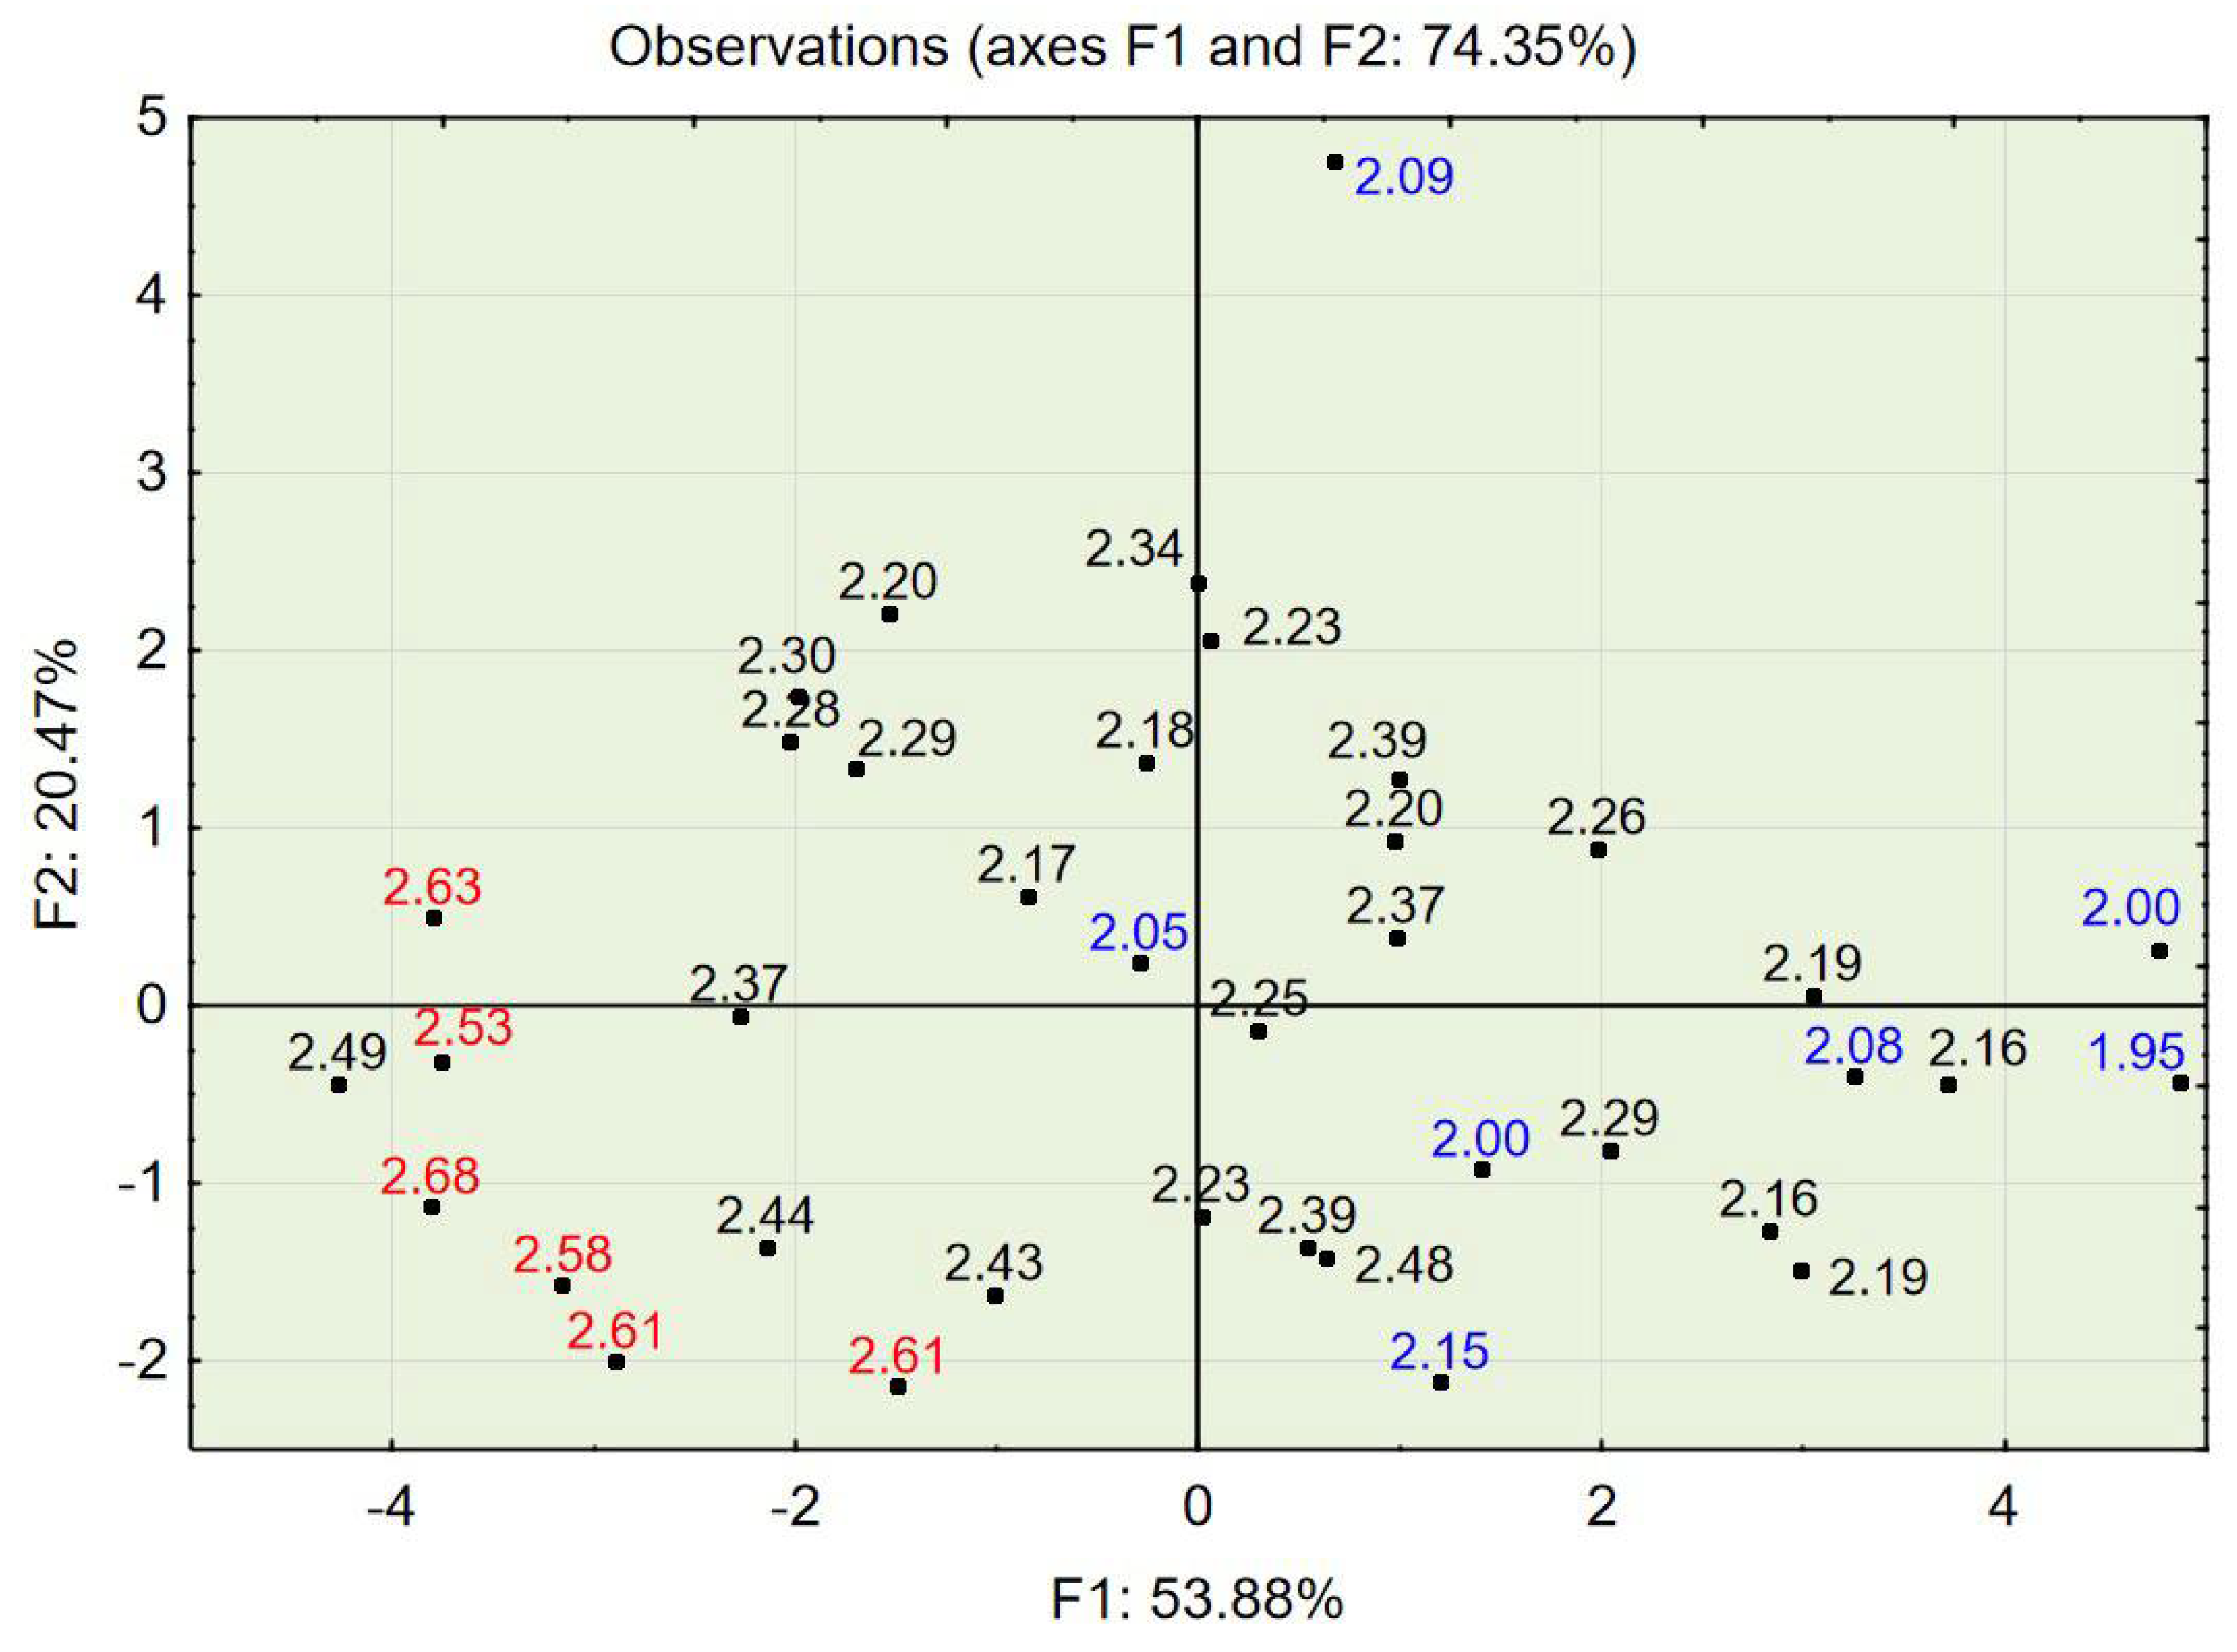
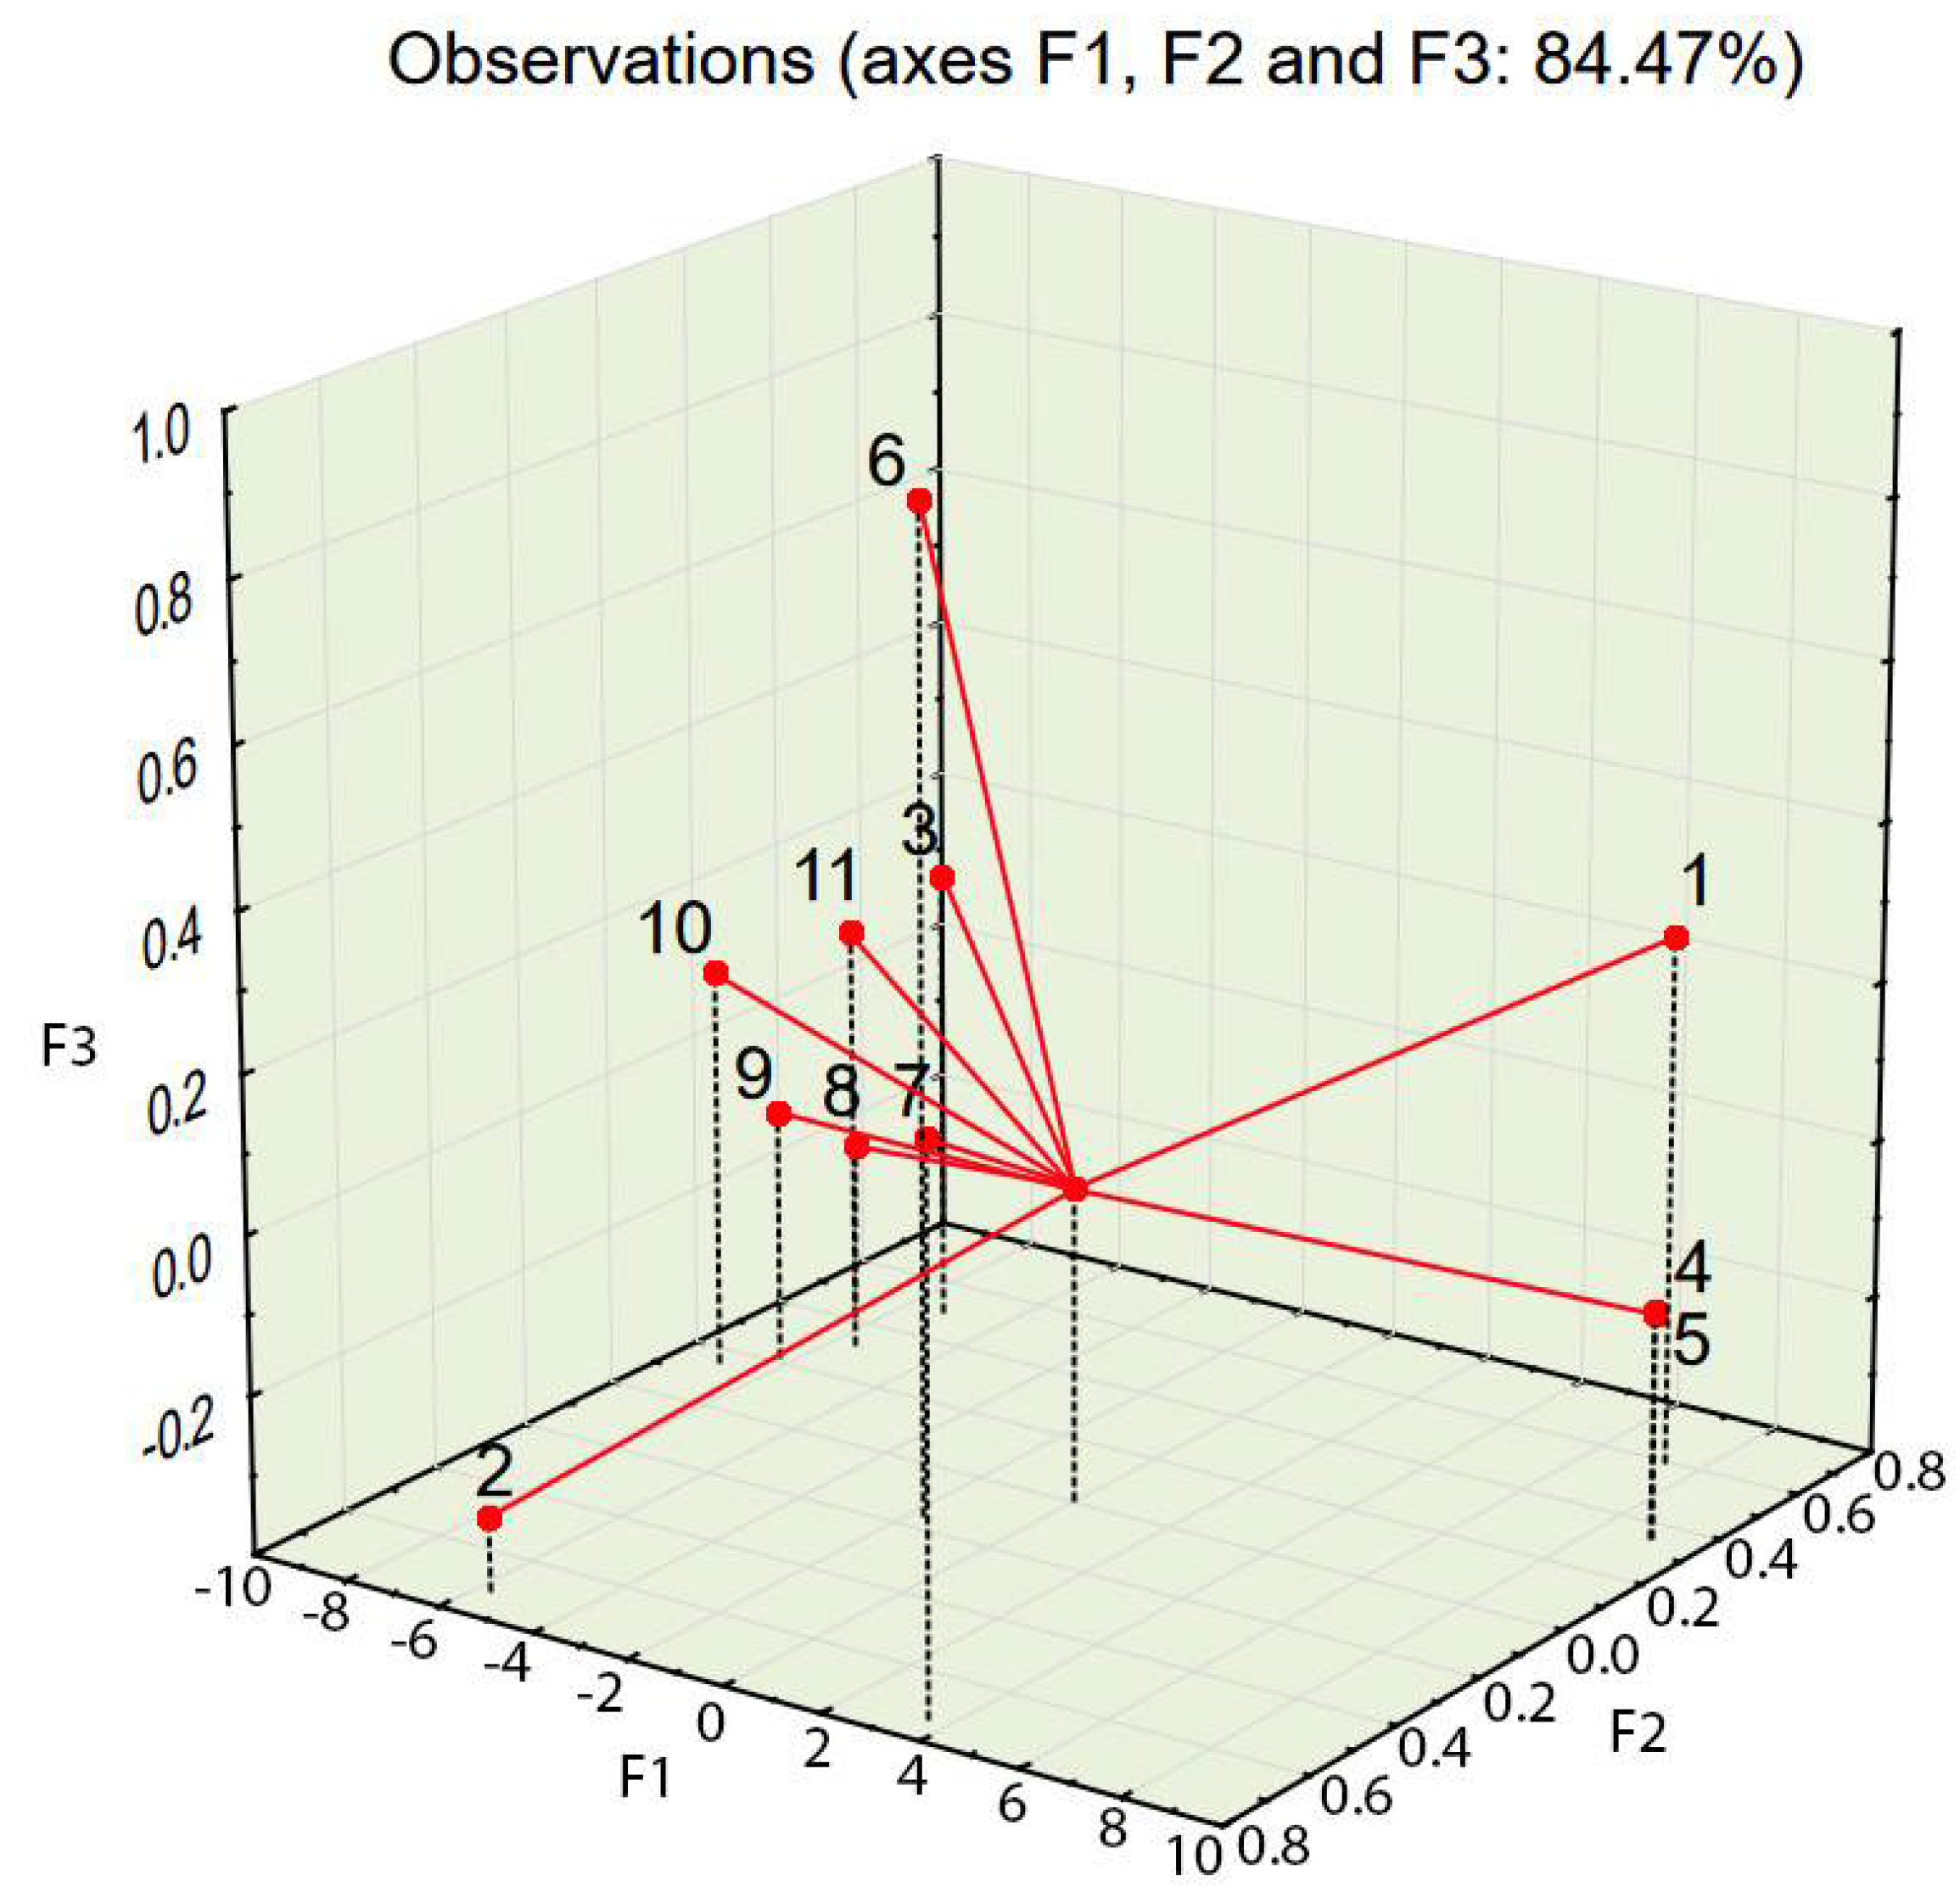
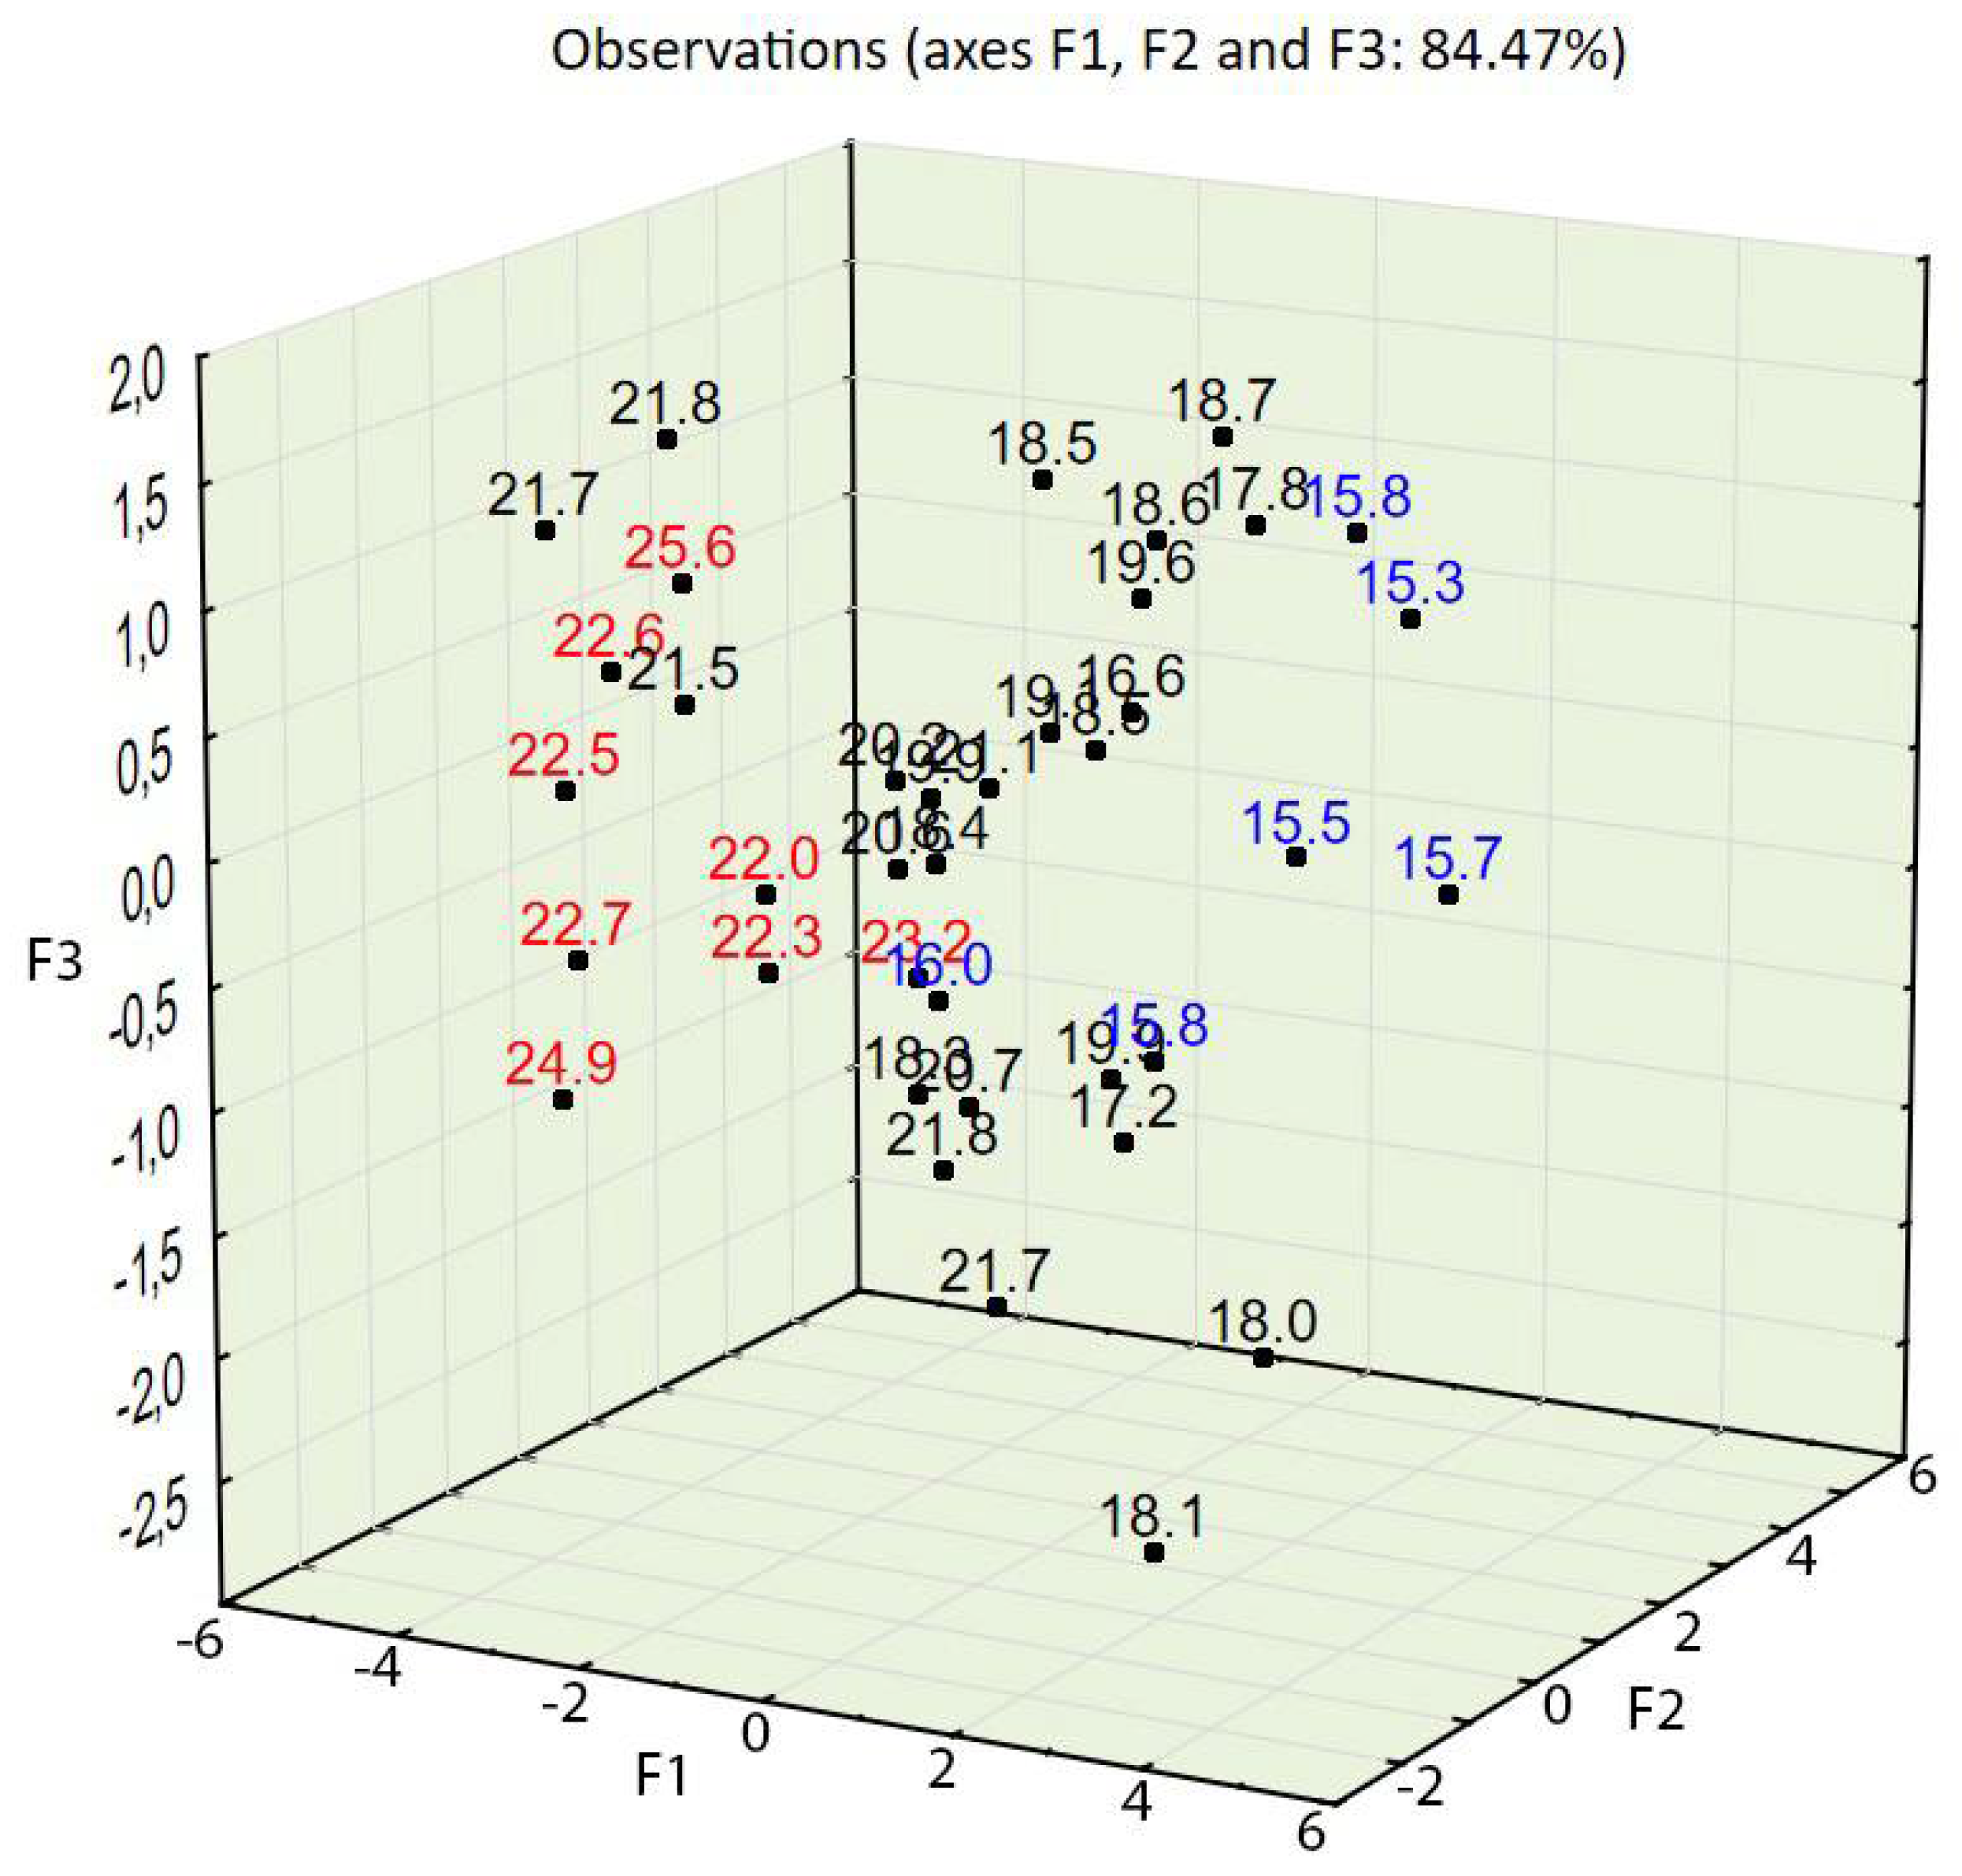
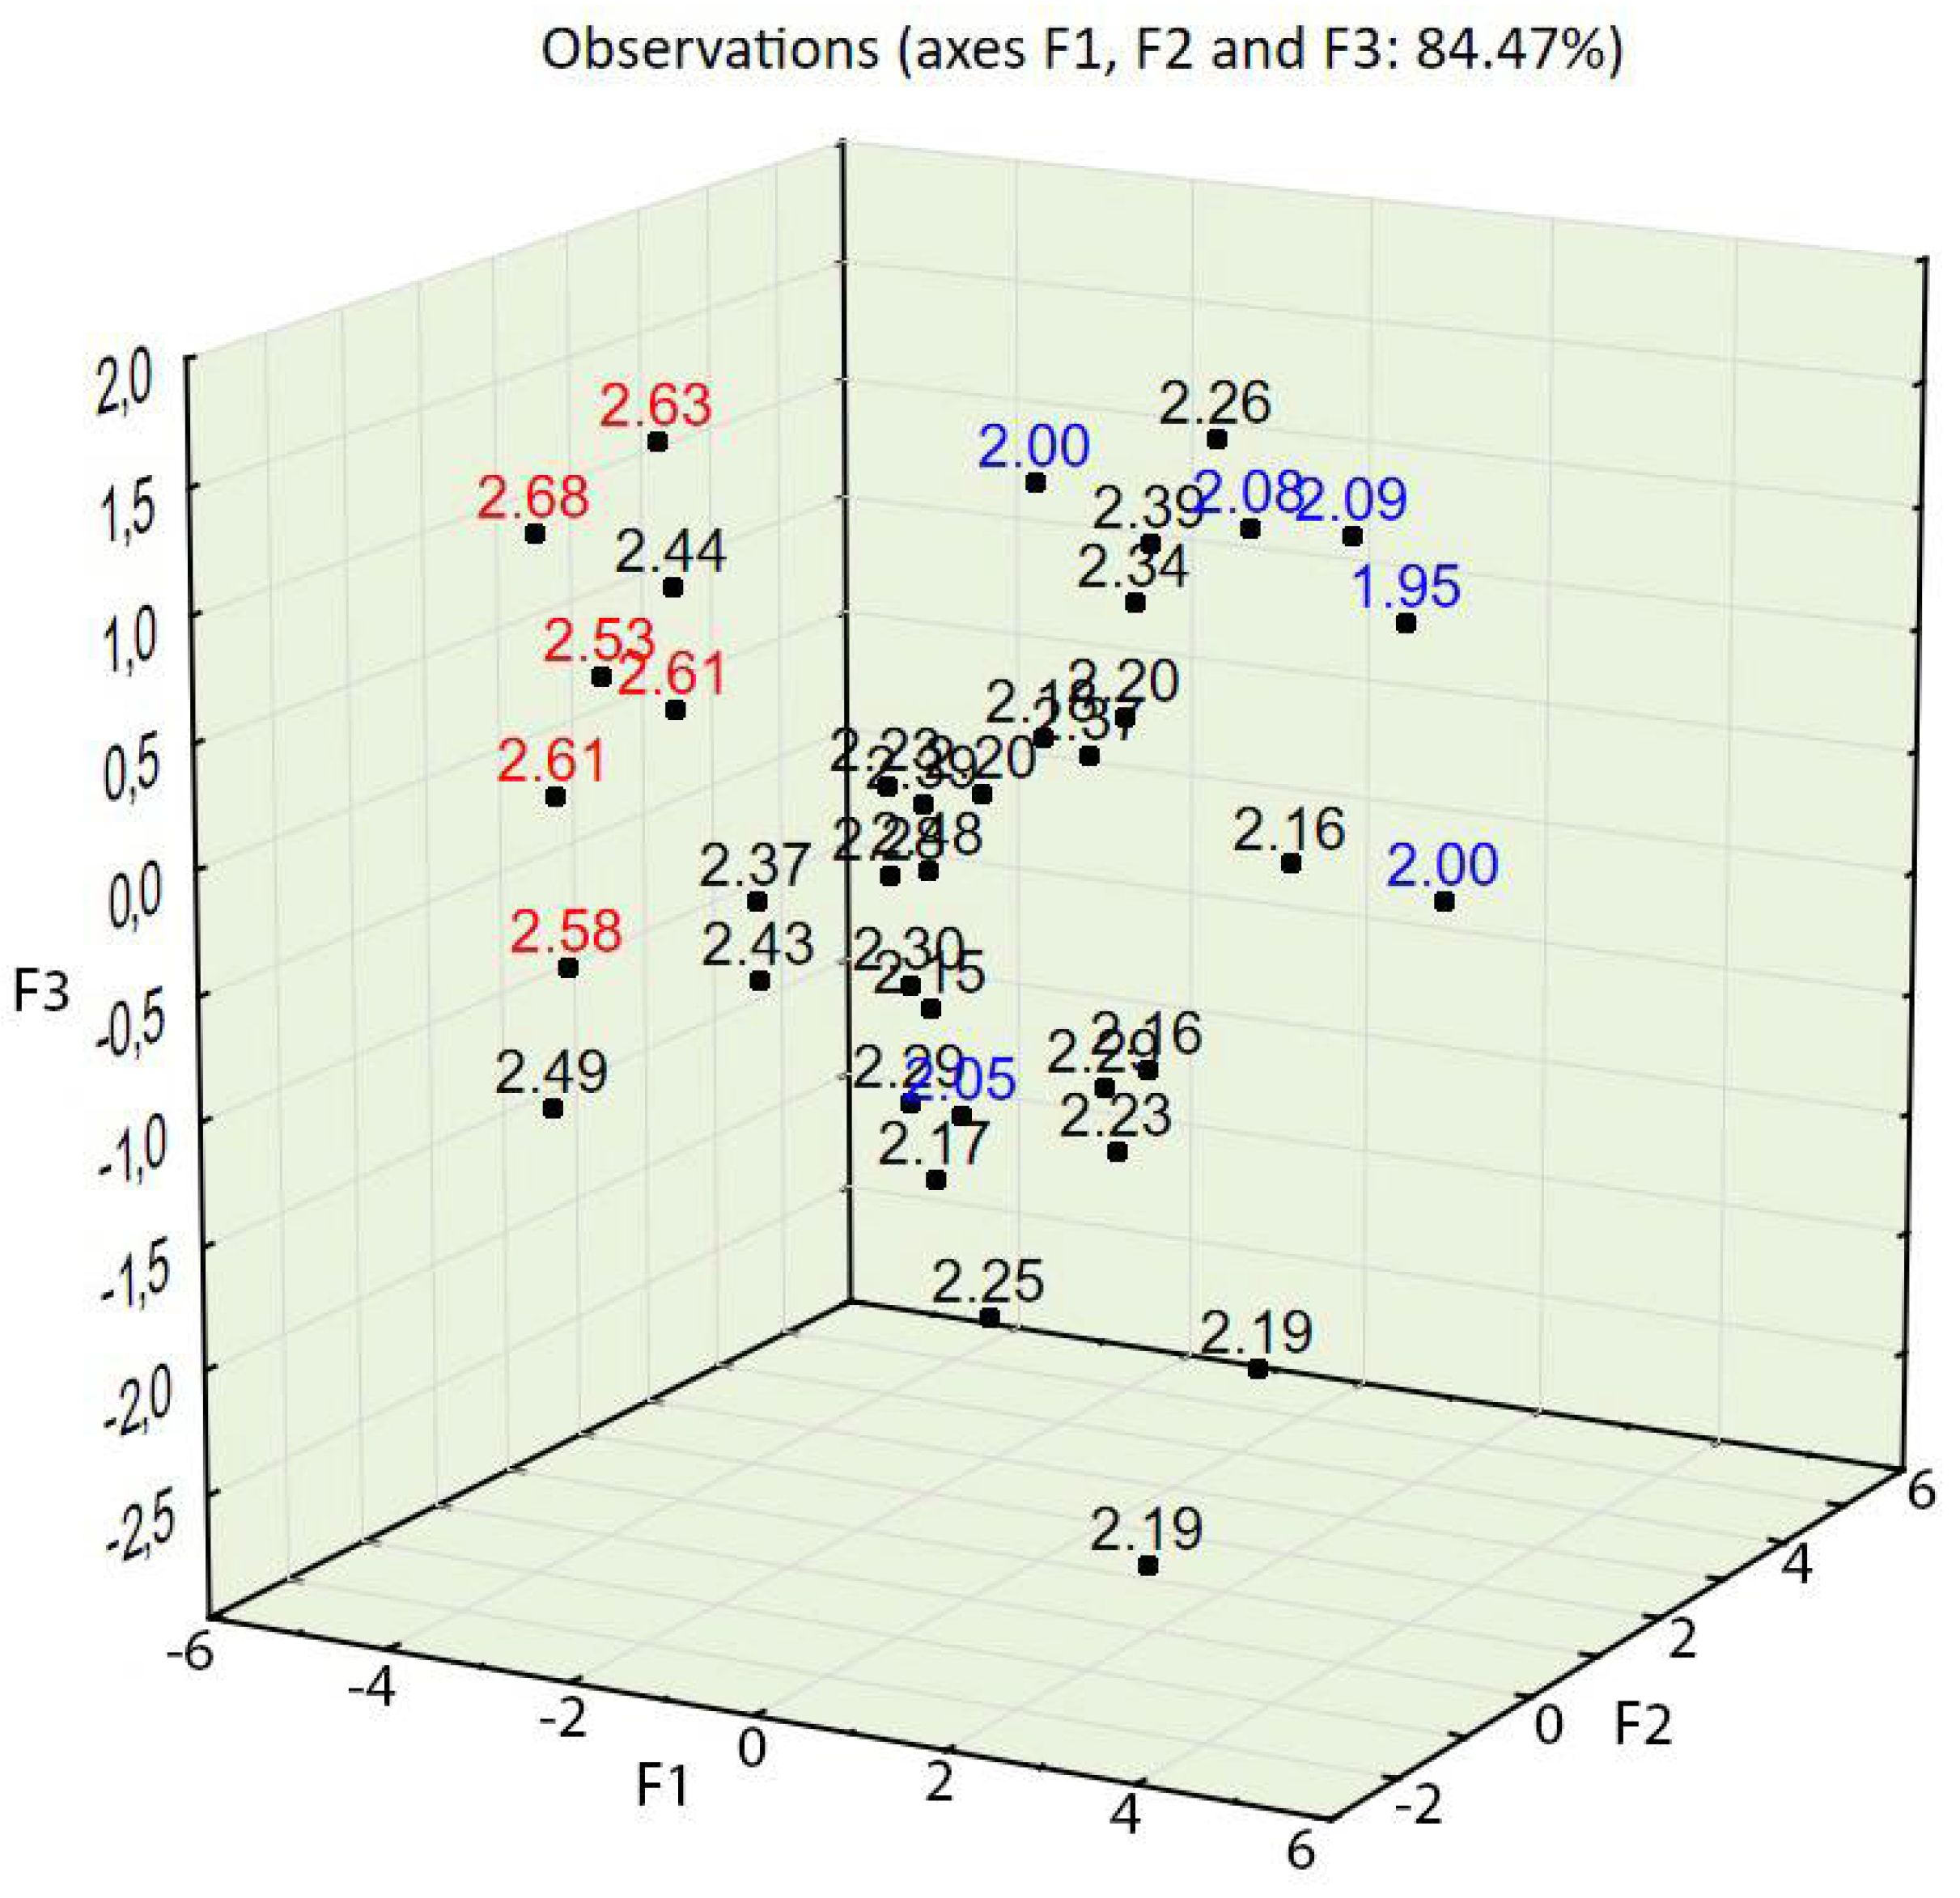
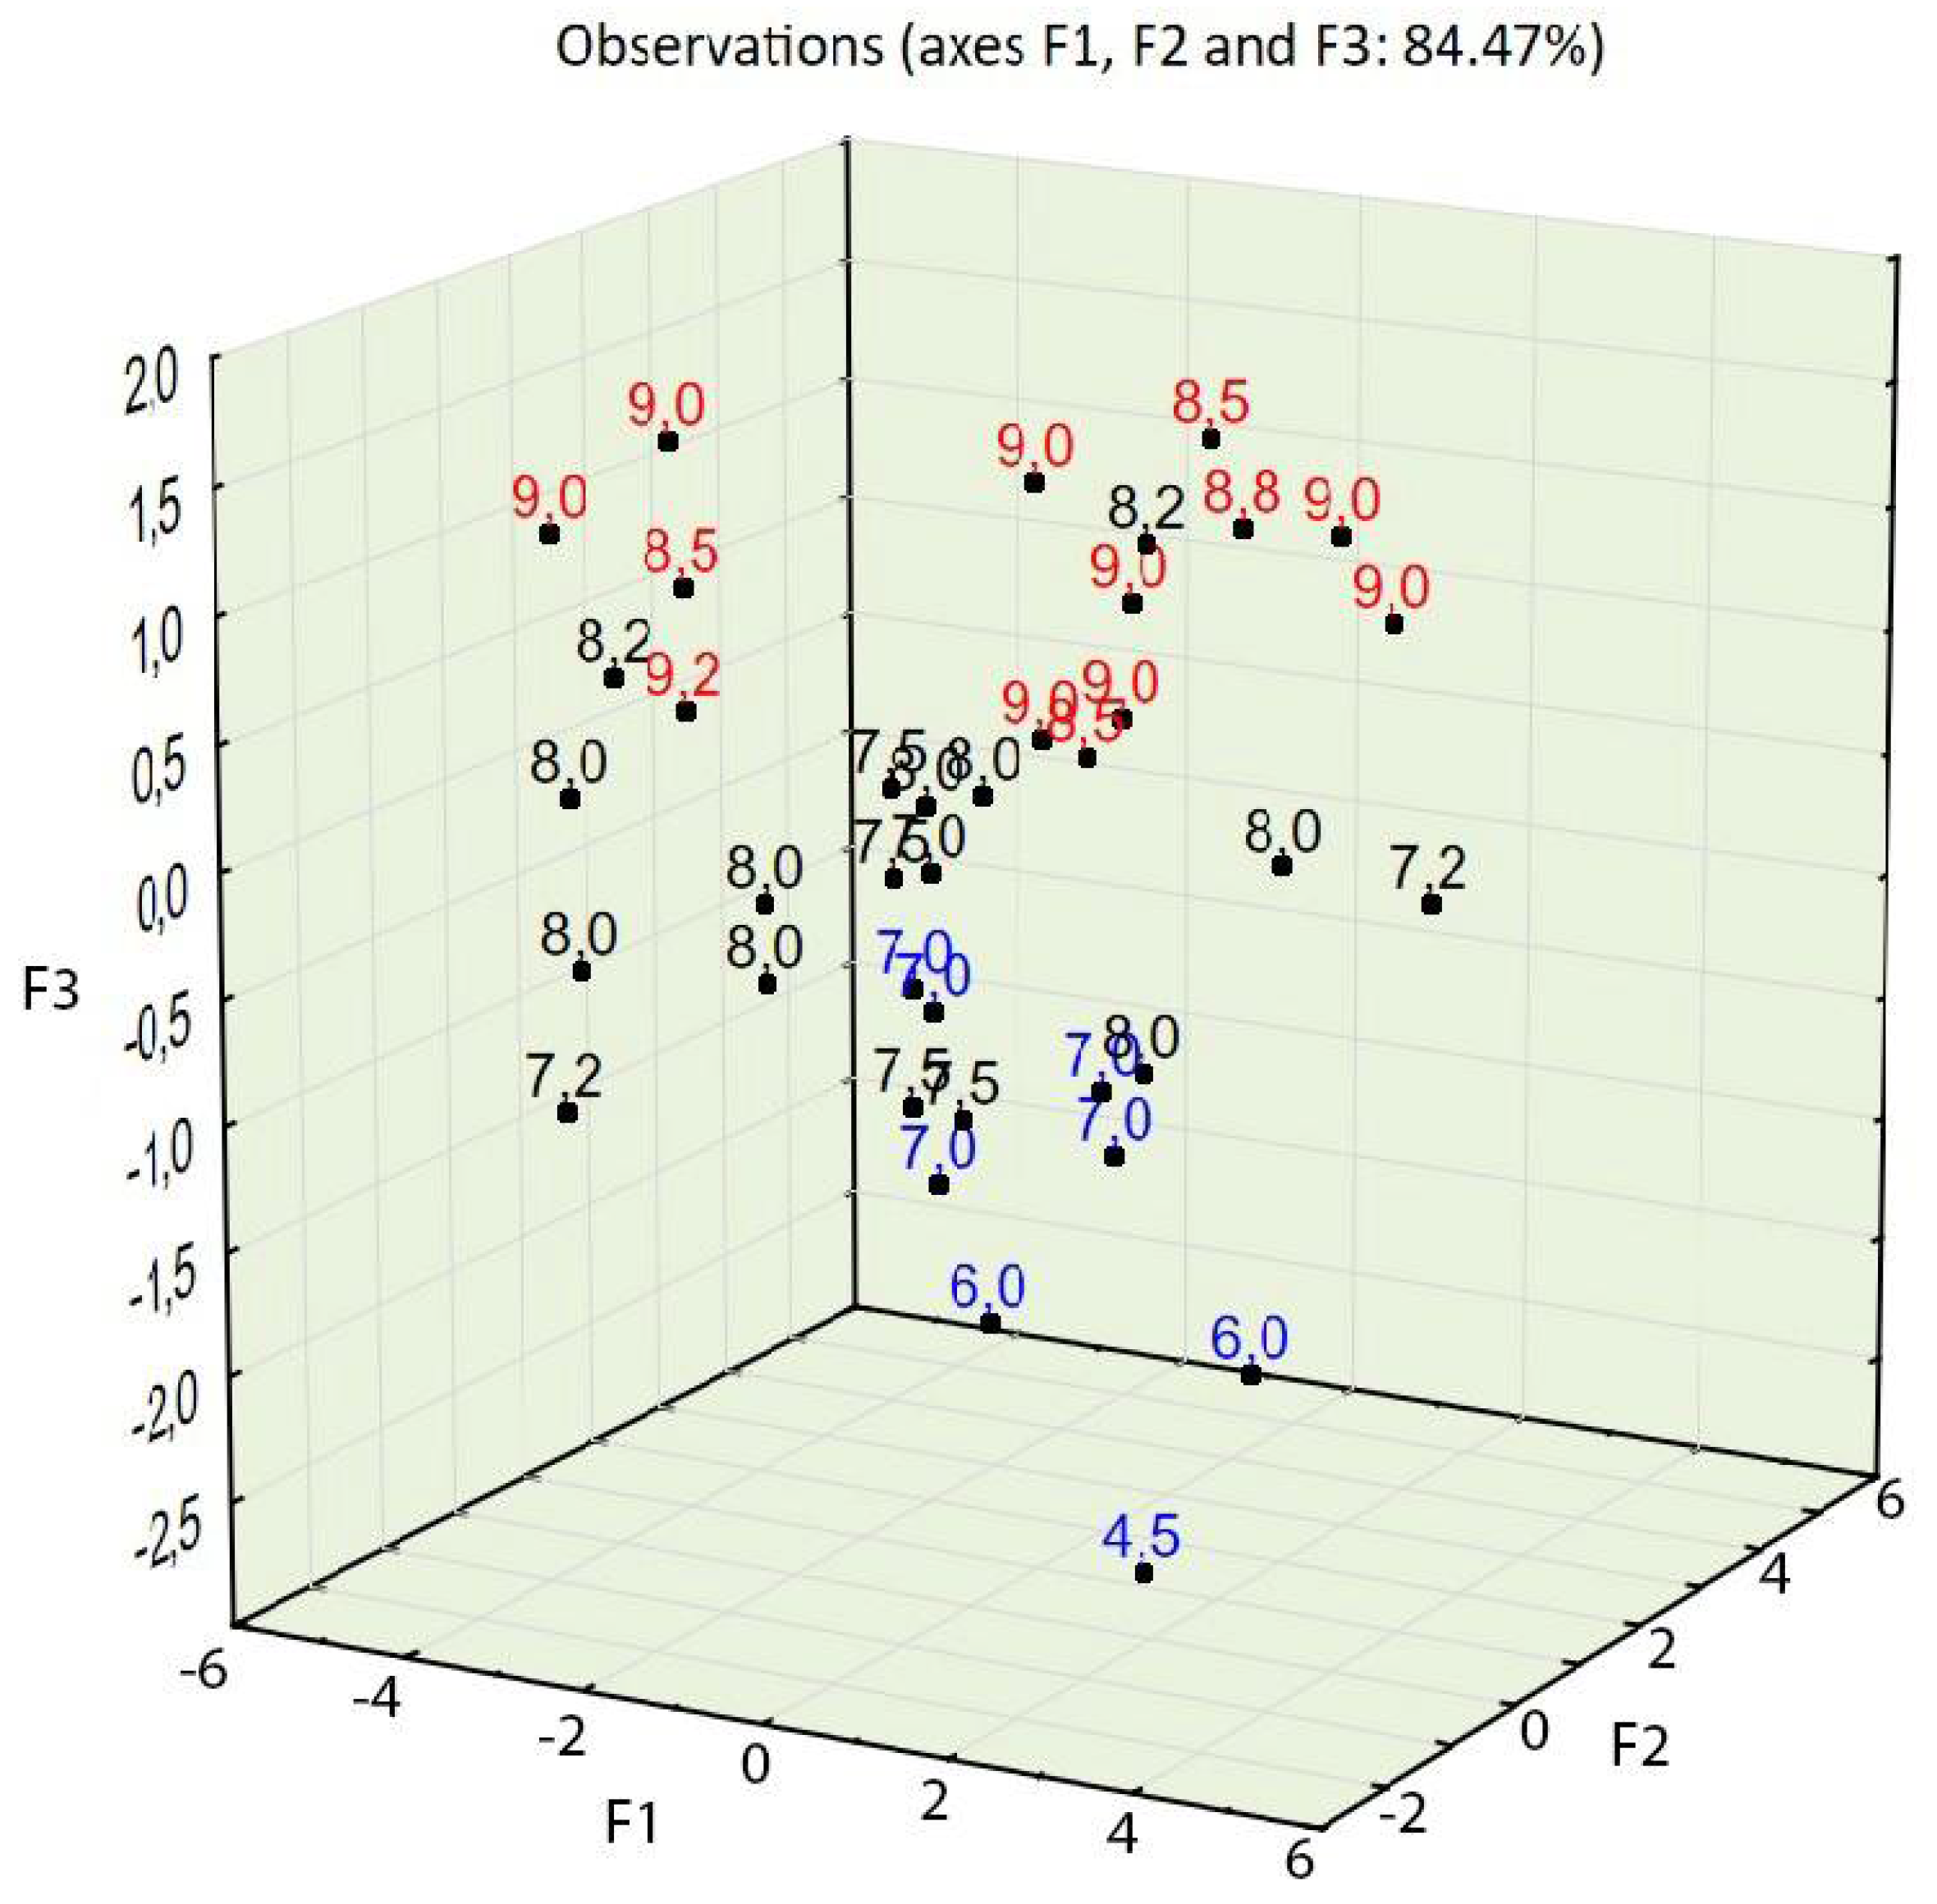
- Clustered cases of certain properties were grouped together; i.e., cases characterized by high compressive and splitting tensile strength were plotted together.
- A dependence between the properties and quantities of certain ingredients in concrete was observed; for instance, a high compressive strength corresponded to a high content of coarse aggregate fractions, and a low compressive strength corresponded to a high content of fine aggregate fractions.
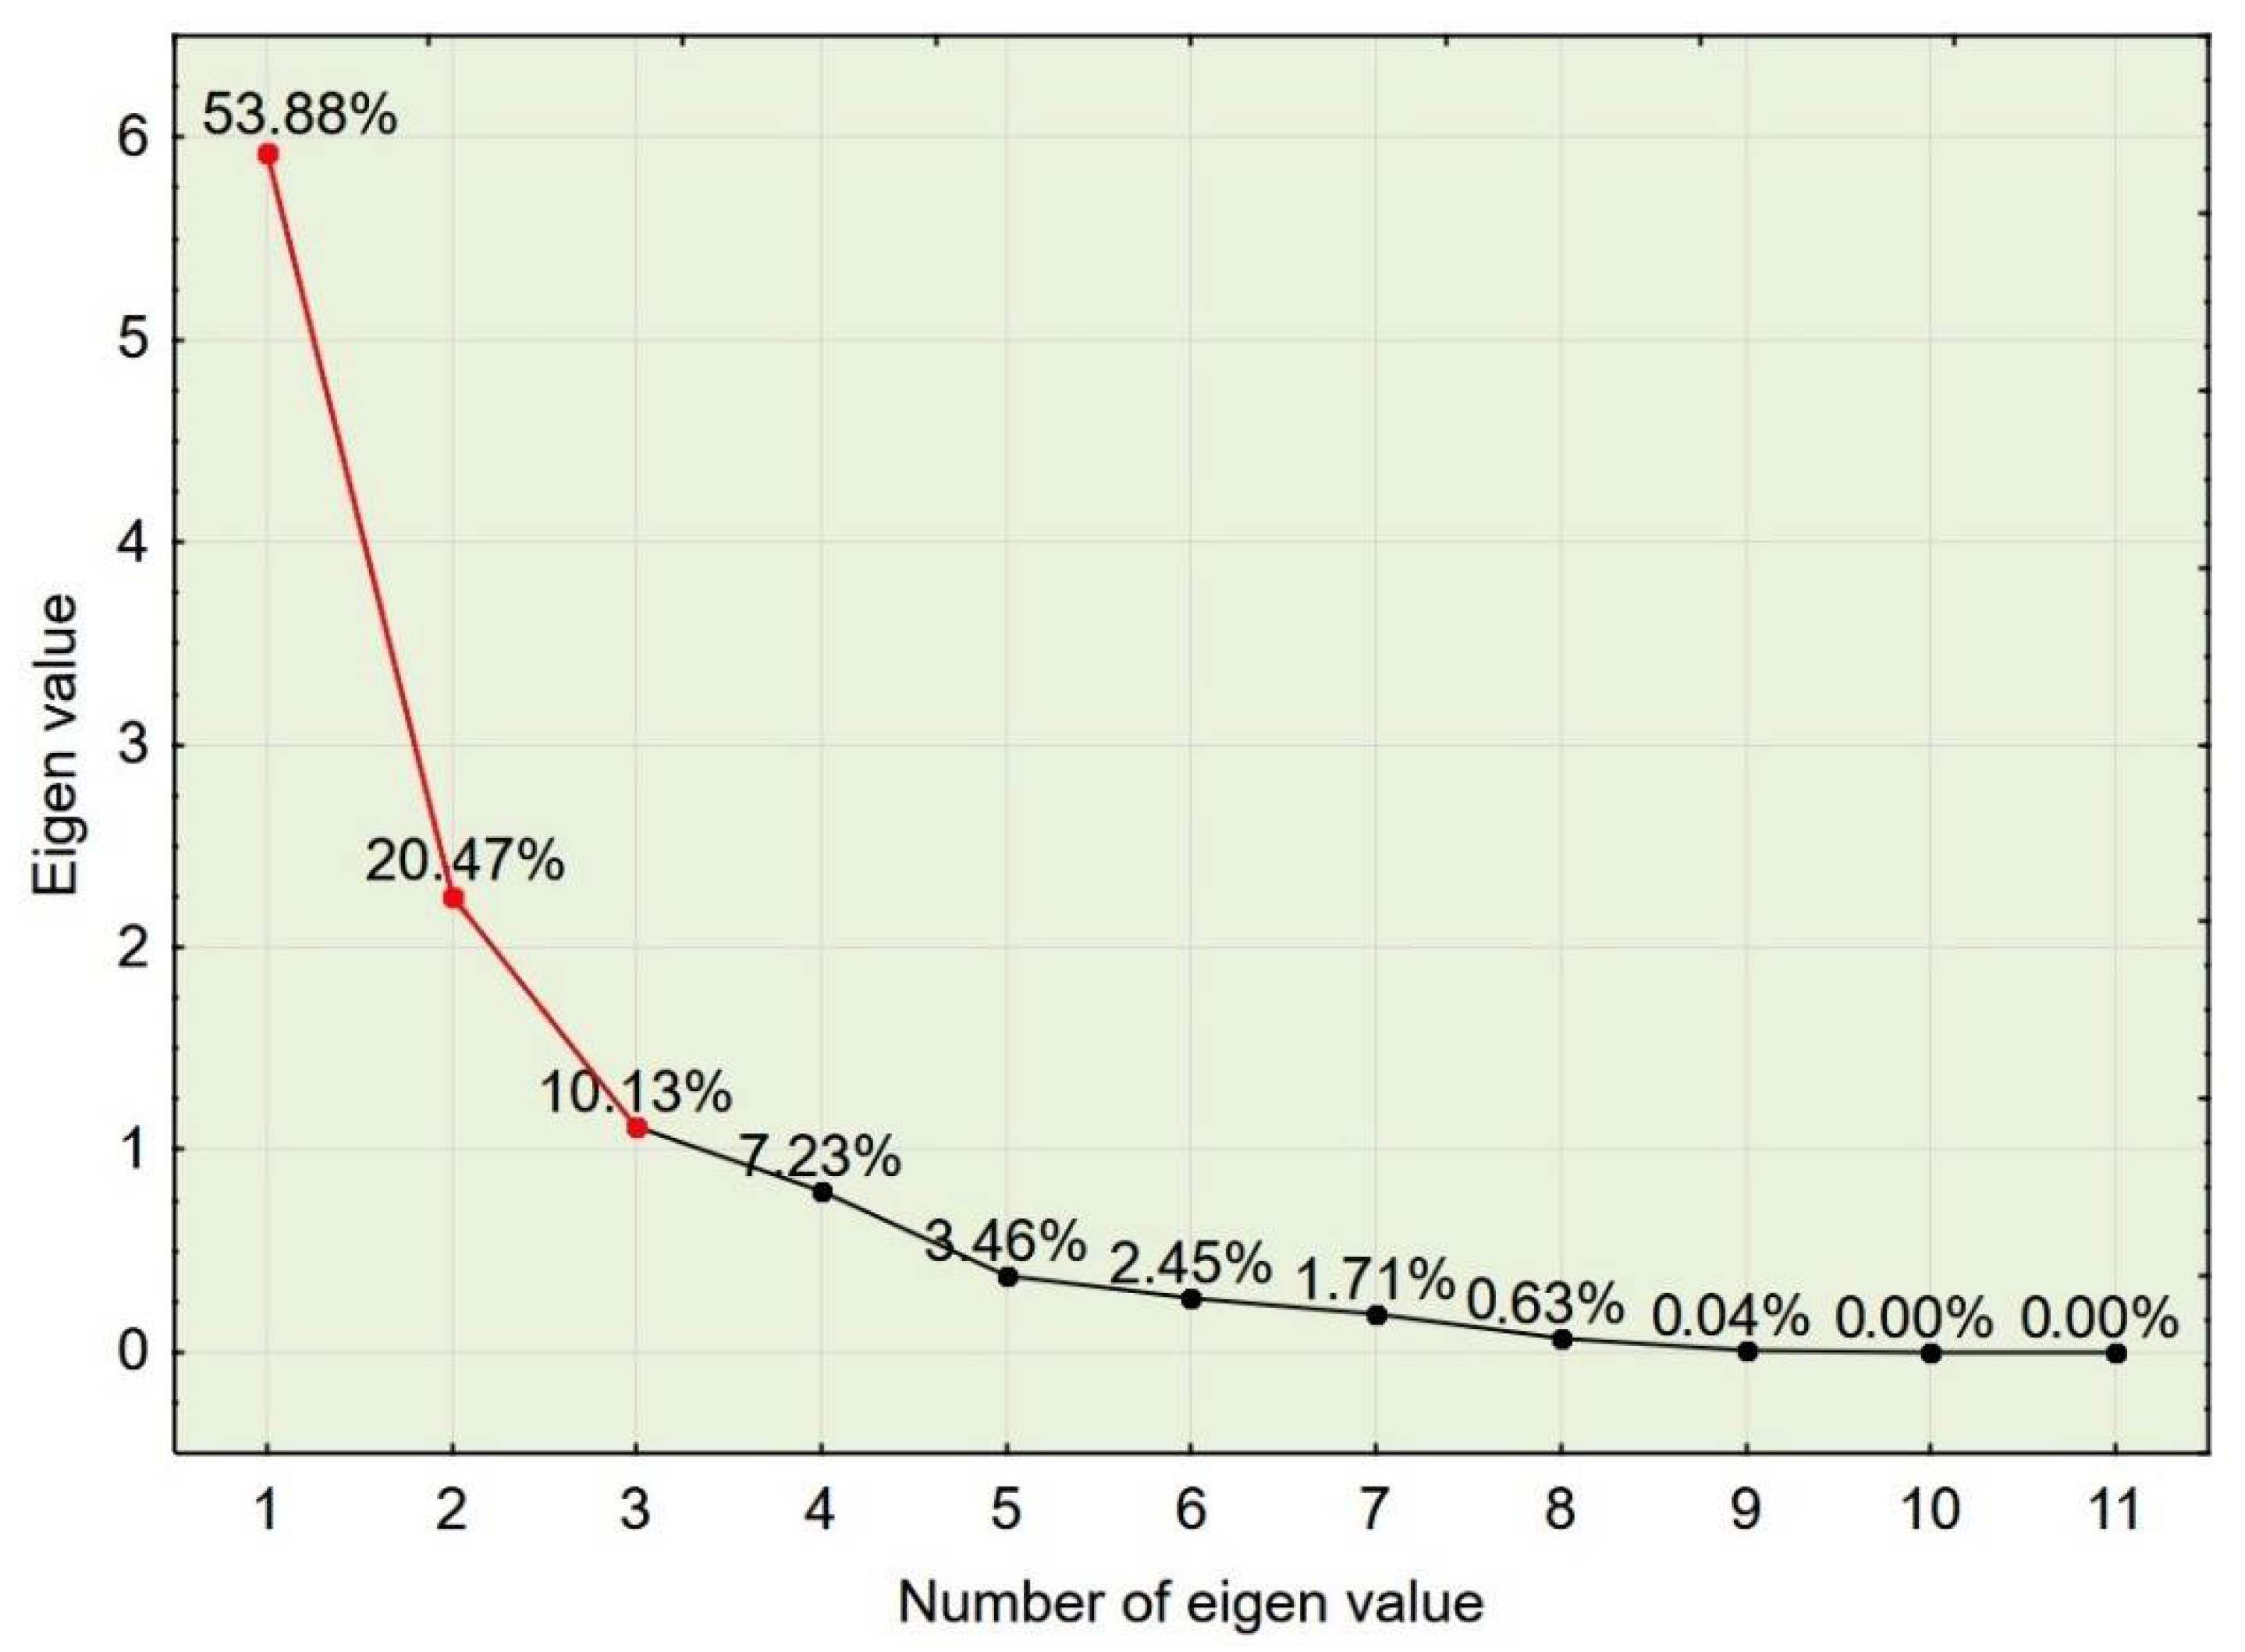
- Noise was reduced in the data, which simplified the interpretation of most of the important factors influencing the model: due to the water/cement ratio being constant in the experiment, these variables were plotted together on the chart; other correlated variables such as mix density and concrete density were plotted close to one another.
- Elements that influenced the model to a large extent were recognized; in factor 1, they were water and cement content and concrete density.
- PCA was found to be useful as an aid for concrete mix design.
- It is also an excellent aid in refining the composition of a concrete mixture with certain properties using a combination of PCA variables and 2D and 3D factors to refine the concrete design process.
- It could also be useful for designing other types of concretes by relying on the test results of these concretes.
Funding
Institutional Review Board Statement
Informed Consent Statement
Data Availability Statement
Conflicts of Interest
References
- Rumman, R.; Bari, M.S.; Manzur, T.; Kamal, M.R.; Noor, M.A. A Durable Concrete Mix Design Approach Using Combined Aggregate Gradation Bands and Rice Husk Ash Based Blended Cement. J. Build. Eng. 2020, 30. [Google Scholar] [CrossRef]
- Chaudhari, S.V.; Chakrabarti, M.A. Modeling of Concrete for Nonlinear Analysis Using Finite Element Code ABAQUS. Int. J. Comput. Appl. 2012, 44. [Google Scholar] [CrossRef]
- Desta, E.; Jun, Z. A Review on Ground Granulated Blast Slag GGBS in Concrete; Institute of Research Engineers and Doctors: Kuala Lumpur, Malaysia, 2018; pp. 5–10. [Google Scholar]
- Kadir, A.A.; Hassan, M.I.H. An Overview of Fly Ash and Bottom Ash Replacement in Self Compaction Concrete. In Key Engineering Materials; Trans Tech Publications Ltd.: Stafa-Zurich, Switzerland, 2014; Volume 594. [Google Scholar]
- Sucharda, O. Identification of Fracture Mechanic Properties of Concrete and Analysis of Shear Capacity of Reinforced Concrete Beams without Transverse Reinforcement. Materials 2020, 13, 2788. [Google Scholar] [CrossRef]
- Robati, M.; McCarthy, T.J.; Kokogiannakis, G. Incorporating Environmental Evaluation and Thermal Properties of Concrete Mix Designs. Constr. Build. Mater. 2016, 128, 422–435. [Google Scholar] [CrossRef]
- Rashid, K.; Farooq, S.; Mahmood, A.; Iftikhar, S.; Ahmad, A. Moving towards Resource Conservation by Automated Prioritization of Concrete Mix Design. Constr. Build. Mater. 2020, 236. [Google Scholar] [CrossRef]
- Tait, M.W.; Cheung, W.M. A Comparative Cradle-to-Gate Life Cycle Assessment of Three Concrete Mix Designs. Int. J. Life Cycle Assess. 2016, 21. [Google Scholar] [CrossRef]
- Flatt, R.J.; Roussel, N.; Cheeseman, C.R. Concrete: An Eco Material That Needs to Be Improved. J. Eur. Ceram. Soc. 2012, 32. [Google Scholar] [CrossRef]
- Bidabadi, M.S.; Akbari, M.; Panahi, O. Optimum Mix Design of Recycled Concrete Based on the Fresh and Hardened Properties of Concrete. J. Build. Eng. 2020, 32. [Google Scholar] [CrossRef]
- Kao, C.Y.; Shen, C.H.; Jan, J.C.; Hung, S.L. A Computer-Aided Approach to Pozzolanic Concrete Mix Design. Adv. Civ. Eng. 2018, 2018. [Google Scholar] [CrossRef]
- Xun, W.; Wu, C.; Leng, X.; Li, J.; Xin, D.; Li, Y. Effect of Functional Superplasticizers on Concrete Strength and Pore Structure. Appl. Sci. 2020, 10, 3496. [Google Scholar] [CrossRef]
- Collepardi, M. The New Concrete; Grafiche Tintoretto: Villorba, Italy, 2010; ISBN 9788890377723. [Google Scholar]
- Powers, T.C. The Properties of Fresh Concrete; Wiley: New York, NY, USA, 1968. [Google Scholar]
- Li, L.G.; Kwan, A.K.H. Concrete Mix Design Based on Water Film Thickness and Paste Film Thickness. Cem. Concr. Compos. 2013, 39, 33–42. [Google Scholar] [CrossRef]
- Valikhani, A.; Jahromi, A.J.; Mantawy, I.M.; Azizinamini, A. Numerical Modelling of Concrete-to-UHPC Bond Strength. Materials 2020, 13, 1379. [Google Scholar] [CrossRef]
- Ziolkowski, P.; Niedostatkiewicz, M. Machine Learning Techniques in Concrete Mix Design. Materials 2019, 12, 1256. [Google Scholar] [CrossRef] [PubMed]
- Hakim Abdelgader, A. Three Equations Method for Normal Concrete Mix Design. Study Civ. Eng. Archit. 2013, 2, 109–113. [Google Scholar]
- Ahmed, M.; Islam, S.; Nazar, S.; Khan, R.A. A Comparative Study of Popular Concrete Mix Design Methods from Qualitative and Cost-Effective Point of View for Extreme Environment. Arab. J. Sci. Eng. 2016, 41. [Google Scholar] [CrossRef]
- Khademi, F.; Jamal, S.M.; Deshpande, N.; Londhe, S. Predicting Strength of Recycled Aggregate Concrete Using Artificial Neural Network, Adaptive Neuro-Fuzzy Inference System and Multiple Linear Regression. Int. J. Sustain. Built Environ. 2016, 5. [Google Scholar] [CrossRef]
- Pieters, C. Statistical Analysis of the Links among Lunar Mare Soil Mineralogy, Chemistry, and Reflectance Spectra. Icarus 2002, 155, 285–298. [Google Scholar] [CrossRef]
- Jolliffe, I.T. Principal Component Analysis, Second Edition. Encycl. Stat. Behav. Sci. 2002, 30. [Google Scholar] [CrossRef]
- Brown, J.D. Choosing the Right Type of Rotation in PCA and EFA. Shiken JALT Test. Eval. SIG Newsl. 2009, 13, 20–25. [Google Scholar]
- Kassambara, A. Practical Guide To Principal Component Methods in R: PCA, M (CA), FAMD, MFA, HCPC, Factoextra; CreateSpace Independent Publishing Platform, 2016. [Google Scholar]
- Kobaka, J.; Katzer, J.; Zarzycki, P.K. Pilbara Craton Soil as a Possible Lunar Soil Simulant for Civil Engineering Applications. Materials 2019, 12, 3871. [Google Scholar] [CrossRef] [PubMed]
- Bjornsson, H.; Fowler, J.; Cohen, L. Practical Statistics for Field Biology. Biometrics 1991, 47. [Google Scholar] [CrossRef]
- Berner, D. Size Correction in Biology: How Reliable Are Approaches Based on (Common) Principal Component Analysis? Oecologia 2011, 166. [Google Scholar] [CrossRef] [PubMed]
- Wang, B.; Jiang, L. Principal Component Analysis Applications in COVID-19 Genome Sequence Studies. Cogn. Comput. 2021. [Google Scholar] [CrossRef] [PubMed]
- Papi, M.; Caracciolo, G. Principal Component Analysis of Personalized Biomolecular Corona Data for Early Disease Detection. Nano Today 2018, 21. [Google Scholar] [CrossRef]
- Koide, T.; Yamamoto, Y.; Fukami, T.; Katori, N.; Okuda, H.; Hiyama, Y. Analysis of Distribution of Ingredients in Commercially Available Clarithromycin Tablets Using Near-Infrared Chemical Imaging with Principal Component Analysis and Partial Least Squares. Chem. Pharm. Bull. 2015, 63. [Google Scholar] [CrossRef] [PubMed]
- Tadić, L.; Bonacci, O.; Brleković, T. An Example of Principal Component Analysis Application on Climate Change Assessment. Theor. Appl. Climatol. 2019, 138, 1049–1062. [Google Scholar] [CrossRef]
- Sen, D.; Erazo, K.; Zhang, W.; Nagarajaiah, S.; Sun, L. On the Effectiveness of Principal Component Analysis for Decoupling Structural Damage and Environmental Effects in Bridge Structures. J. Sound Vib. 2019, 457. [Google Scholar] [CrossRef]
- Siddiqui, F.; Sargent, P.; Montague, G. The Use of PCA and Signal Processing Techniques for Processing Time-Based Construction Settlement Data of Road Embankments. Adv. Eng. Inform. 2020, 46. [Google Scholar] [CrossRef]
- Deepika, M.A.; Gowri, V.T.; Sravana, P. Principal Component Analysis for Concrete Mix by Ranking Method. Int. J. Eng. Technol. 2018, 7, 453–457. [Google Scholar] [CrossRef]
- Boukhatem, B.; Kenai, S.; Hamou, A.T.; Ziou, D.; Ghrici, M. Predicting Concrete Properties Using Neural Networks (NN) with Principal Component Analysis (PCA) Technique. Comput. Concr. 2012, 10, 557–573. [Google Scholar] [CrossRef]
- Katzer, J.; Kobaka, J. Influence of Fine Aggregate Grading on Properties of Cement Composite. Silic. Ind. 2009, 74, 9. [Google Scholar]
- Katzer, J.; Kobaka, J. The Assessment of Fine Aggregate Pit Deposits for Concrete Production. Kuwait J. Sci. Eng. 2006, 33, 165. [Google Scholar]
- Cattell, R.B. The Scree Test for the Number of Factors. Multivar. Behav. Res. 1966, 1, 245–276. [Google Scholar] [CrossRef] [PubMed]


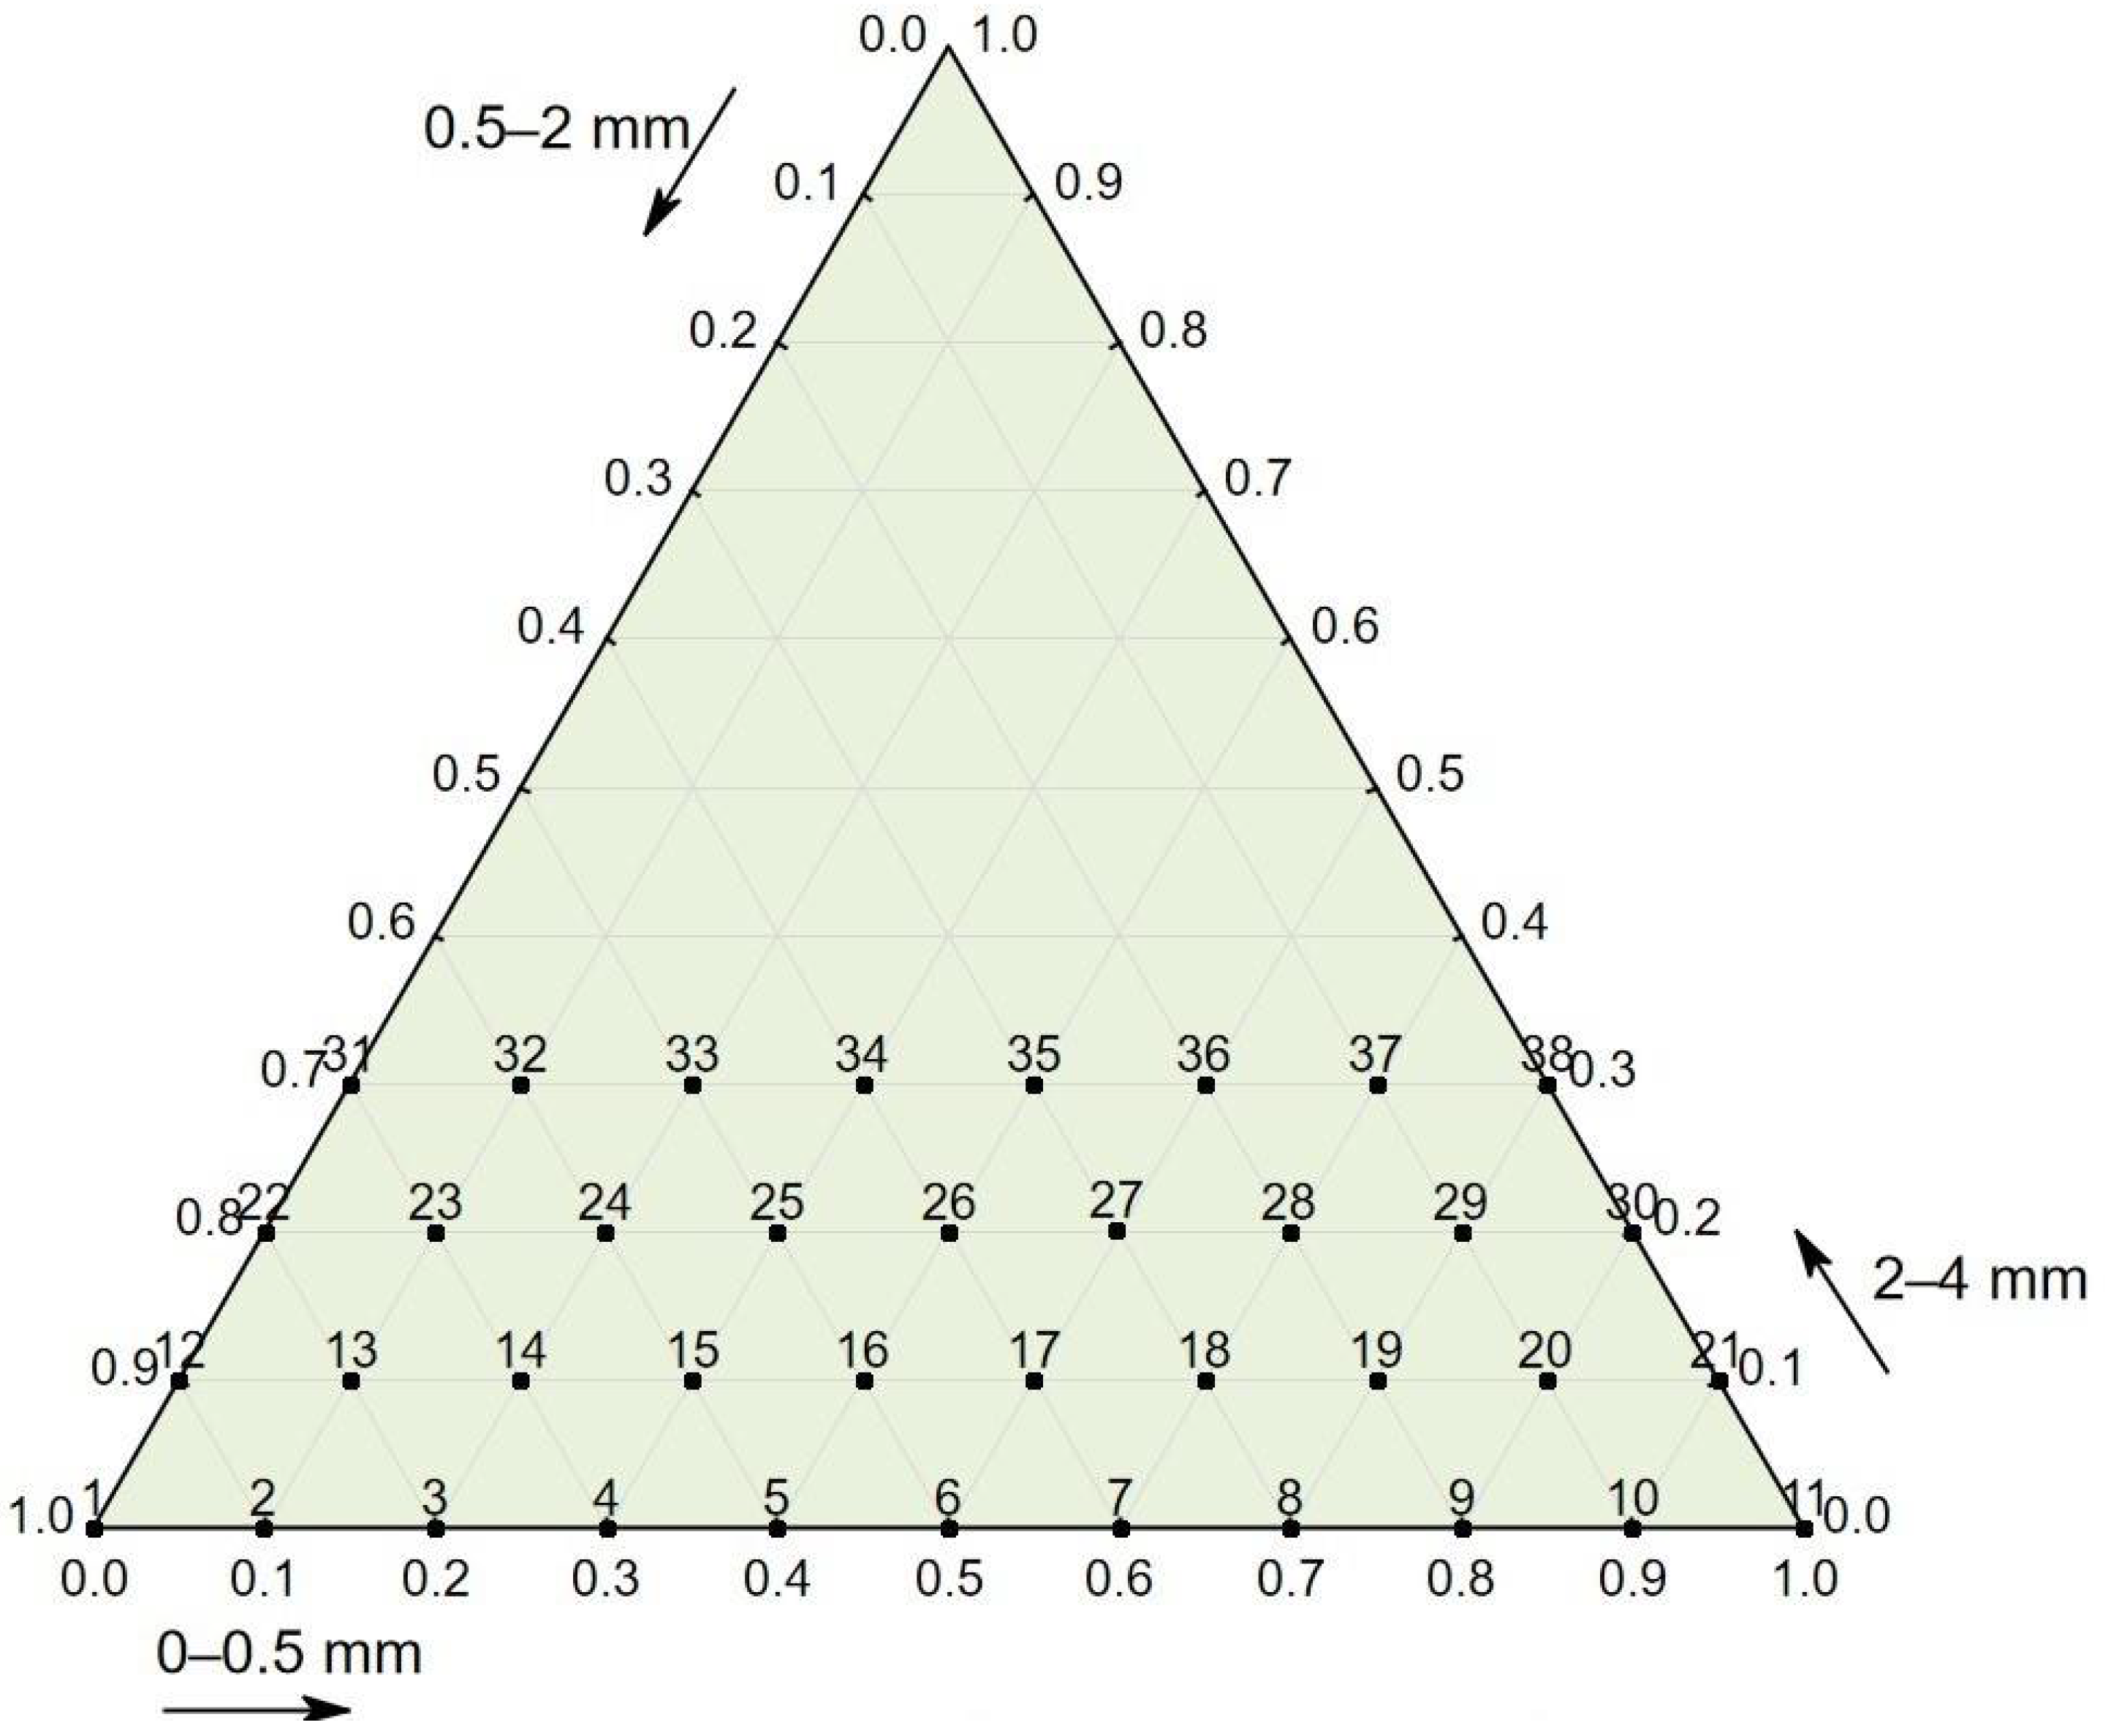
| No. | Aggregate (kg/m3) | Cement (kg/m3) | Water (kg/m3) | No. | Aggregate (kg/m3) | Cement (kg/m3) | Water (kg/m3) | ||||
|---|---|---|---|---|---|---|---|---|---|---|---|
| 0–0.5 (mm) | 0.5–2 (mm) | 2–4 (mm) | 0–0.5 (mm) | 0.5–2 (mm) | 2–4 (mm) | ||||||
| 1 | 0 | 1570 | 0 | 358 | 189 | 20 | 1141 | 143 | 143 | 472 | 248 |
| 2 | 157 | 1417 | 0 | 397 | 209 | 21 | 1279 | 0 | 142 | 457 | 241 |
| 3 | 309 | 1235 | 0 | 394 | 207 | 22 | 0 | 1285 | 321 | 370 | 194 |
| 4 | 480 | 1121 | 0 | 384 | 202 | 23 | 167 | 1167 | 333 | 350 | 184 |
| 5 | 614 | 921 | 0 | 422 | 222 | 24 | 331 | 996 | 331 | 375 | 198 |
| 6 | 755 | 755 | 0 | 429 | 226 | 25 | 512 | 853 | 341 | 376 | 198 |
| 7 | 878 | 585 | 0 | 452 | 238 | 26 | 628 | 628 | 314 | 429 | 226 |
| 8 | 1007 | 432 | 0 | 488 | 257 | 27 | 810 | 491 | 327 | 410 | 216 |
| 9 | 1107 | 277 | 0 | 487 | 256 | 28 | 904 | 302 | 302 | 439 | 231 |
| 10 | 1225 | 136 | 0 | 478 | 251 | 29 | 1065 | 152 | 304 | 425 | 224 |
| 11 | 1362 | 0 | 0 | 492 | 259 | 30 | 1226 | 0 | 306 | 420 | 221 |
| 12 | 0 | 1480 | 164 | 380 | 200 | 31 | 0 | 1209 | 518 | 354 | 186 |
| 13 | 163 | 1303 | 163 | 360 | 190 | 32 | 168 | 1008 | 504 | 346 | 182 |
| 14 | 319 | 1118 | 160 | 398 | 210 | 33 | 344 | 860 | 516 | 341 | 180 |
| 15 | 479 | 958 | 160 | 405 | 213 | 34 | 522 | 696 | 522 | 343 | 181 |
| 16 | 617 | 771 | 154 | 419 | 221 | 35 | 670 | 502 | 502 | 379 | 200 |
| 17 | 751 | 601 | 150 | 403 | 212 | 36 | 817 | 327 | 490 | 378 | 199 |
| 18 | 850 | 425 | 142 | 474 | 249 | 37 | 948 | 158 | 474 | 403 | 212 |
| 19 | 1025 | 293 | 146 | 418 | 220 | 38 | 1084 | 0 | 465 | 431 | 227 |
| Subject of Test | Tested Property | Standard Number | Stage |
|---|---|---|---|
| Fresh concrete mix | Consistency | EN 12350-3:2001 | I |
| Apparent density | EN 12350-6:2011 | ||
| Air content | EN 12350-7:2011 | ||
| Hardened concrete | Apparent density | EN 12390-7:2011 | II |
| Compressive strength | EN 12390-3:2011 | ||
| Splitting tensile strength | EN 12390-6:2011 |
| No. | Consistency | Apparent Density | Air Content | No. | Consistency | Apparent Density | Air Content |
|---|---|---|---|---|---|---|---|
| (-) | (s) | (kg/m3) | (%) | (-) | (s) | (kg/m3) | (%) |
| 1 | 9.0 | 2117 | 9.1 | 20 | 4.5 | 2147 | 5.1 |
| 2 | 7.0 | 2180 | 5.8 | 21 | 8.8 | 2119 | 6.5 |
| 3 | 9.0 | 2145 | 7.2 | 22 | 7.0 | 2170 | 6.9 |
| 4 | 9.0 | 2187 | 4.8 | 23 | 7.5 | 2201 | 6.2 |
| 5 | 9.0 | 2178 | 5.2 | 24 | 8.0 | 2231 | 4.3 |
| 6 | 8.5 | 2165 | 5.5 | 25 | 8.0 | 2280 | 2.5 |
| 7 | 6.0 | 2152 | 5.3 | 26 | 8.0 | 2225 | 3.2 |
| 8 | 8.0 | 2184 | 3.3 | 27 | 9.2 | 2262 | 2.6 |
| 9 | 8.0 | 2127 | 5.5 | 28 | 8.0 | 2178 | 4.7 |
| 10 | 7.2 | 2090 | 7.2 | 29 | 7.0 | 2170 | 5.4 |
| 11 | 9.0 | 2113 | 5.8 | 30 | 9.0 | 2173 | 5.5 |
| 12 | 7.5 | 2224 | 4.5 | 31 | 7.2 | 2267 | 3.6 |
| 13 | 8.0 | 2179 | 6.8 | 32 | 9.0 | 2208 | 6.0 |
| 14 | 7.0 | 2205 | 4.8 | 33 | 8.2 | 2241 | 4.9 |
| 15 | 7.5 | 2215 | 4.2 | 34 | 9.0 | 2264 | 3.9 |
| 16 | 6.0 | 2182 | 5.1 | 35 | 8.0 | 2253 | 3.4 |
| 17 | 8.2 | 2117 | 8 | 36 | 8.5 | 2211 | 5.1 |
| 18 | 7.0 | 2140 | 5.3 | 37 | 7.5 | 2195 | 5.5 |
| 19 | 8.5 | 2102 | 8.2 | 38 | 7.0 | 2207 | 3.8 |
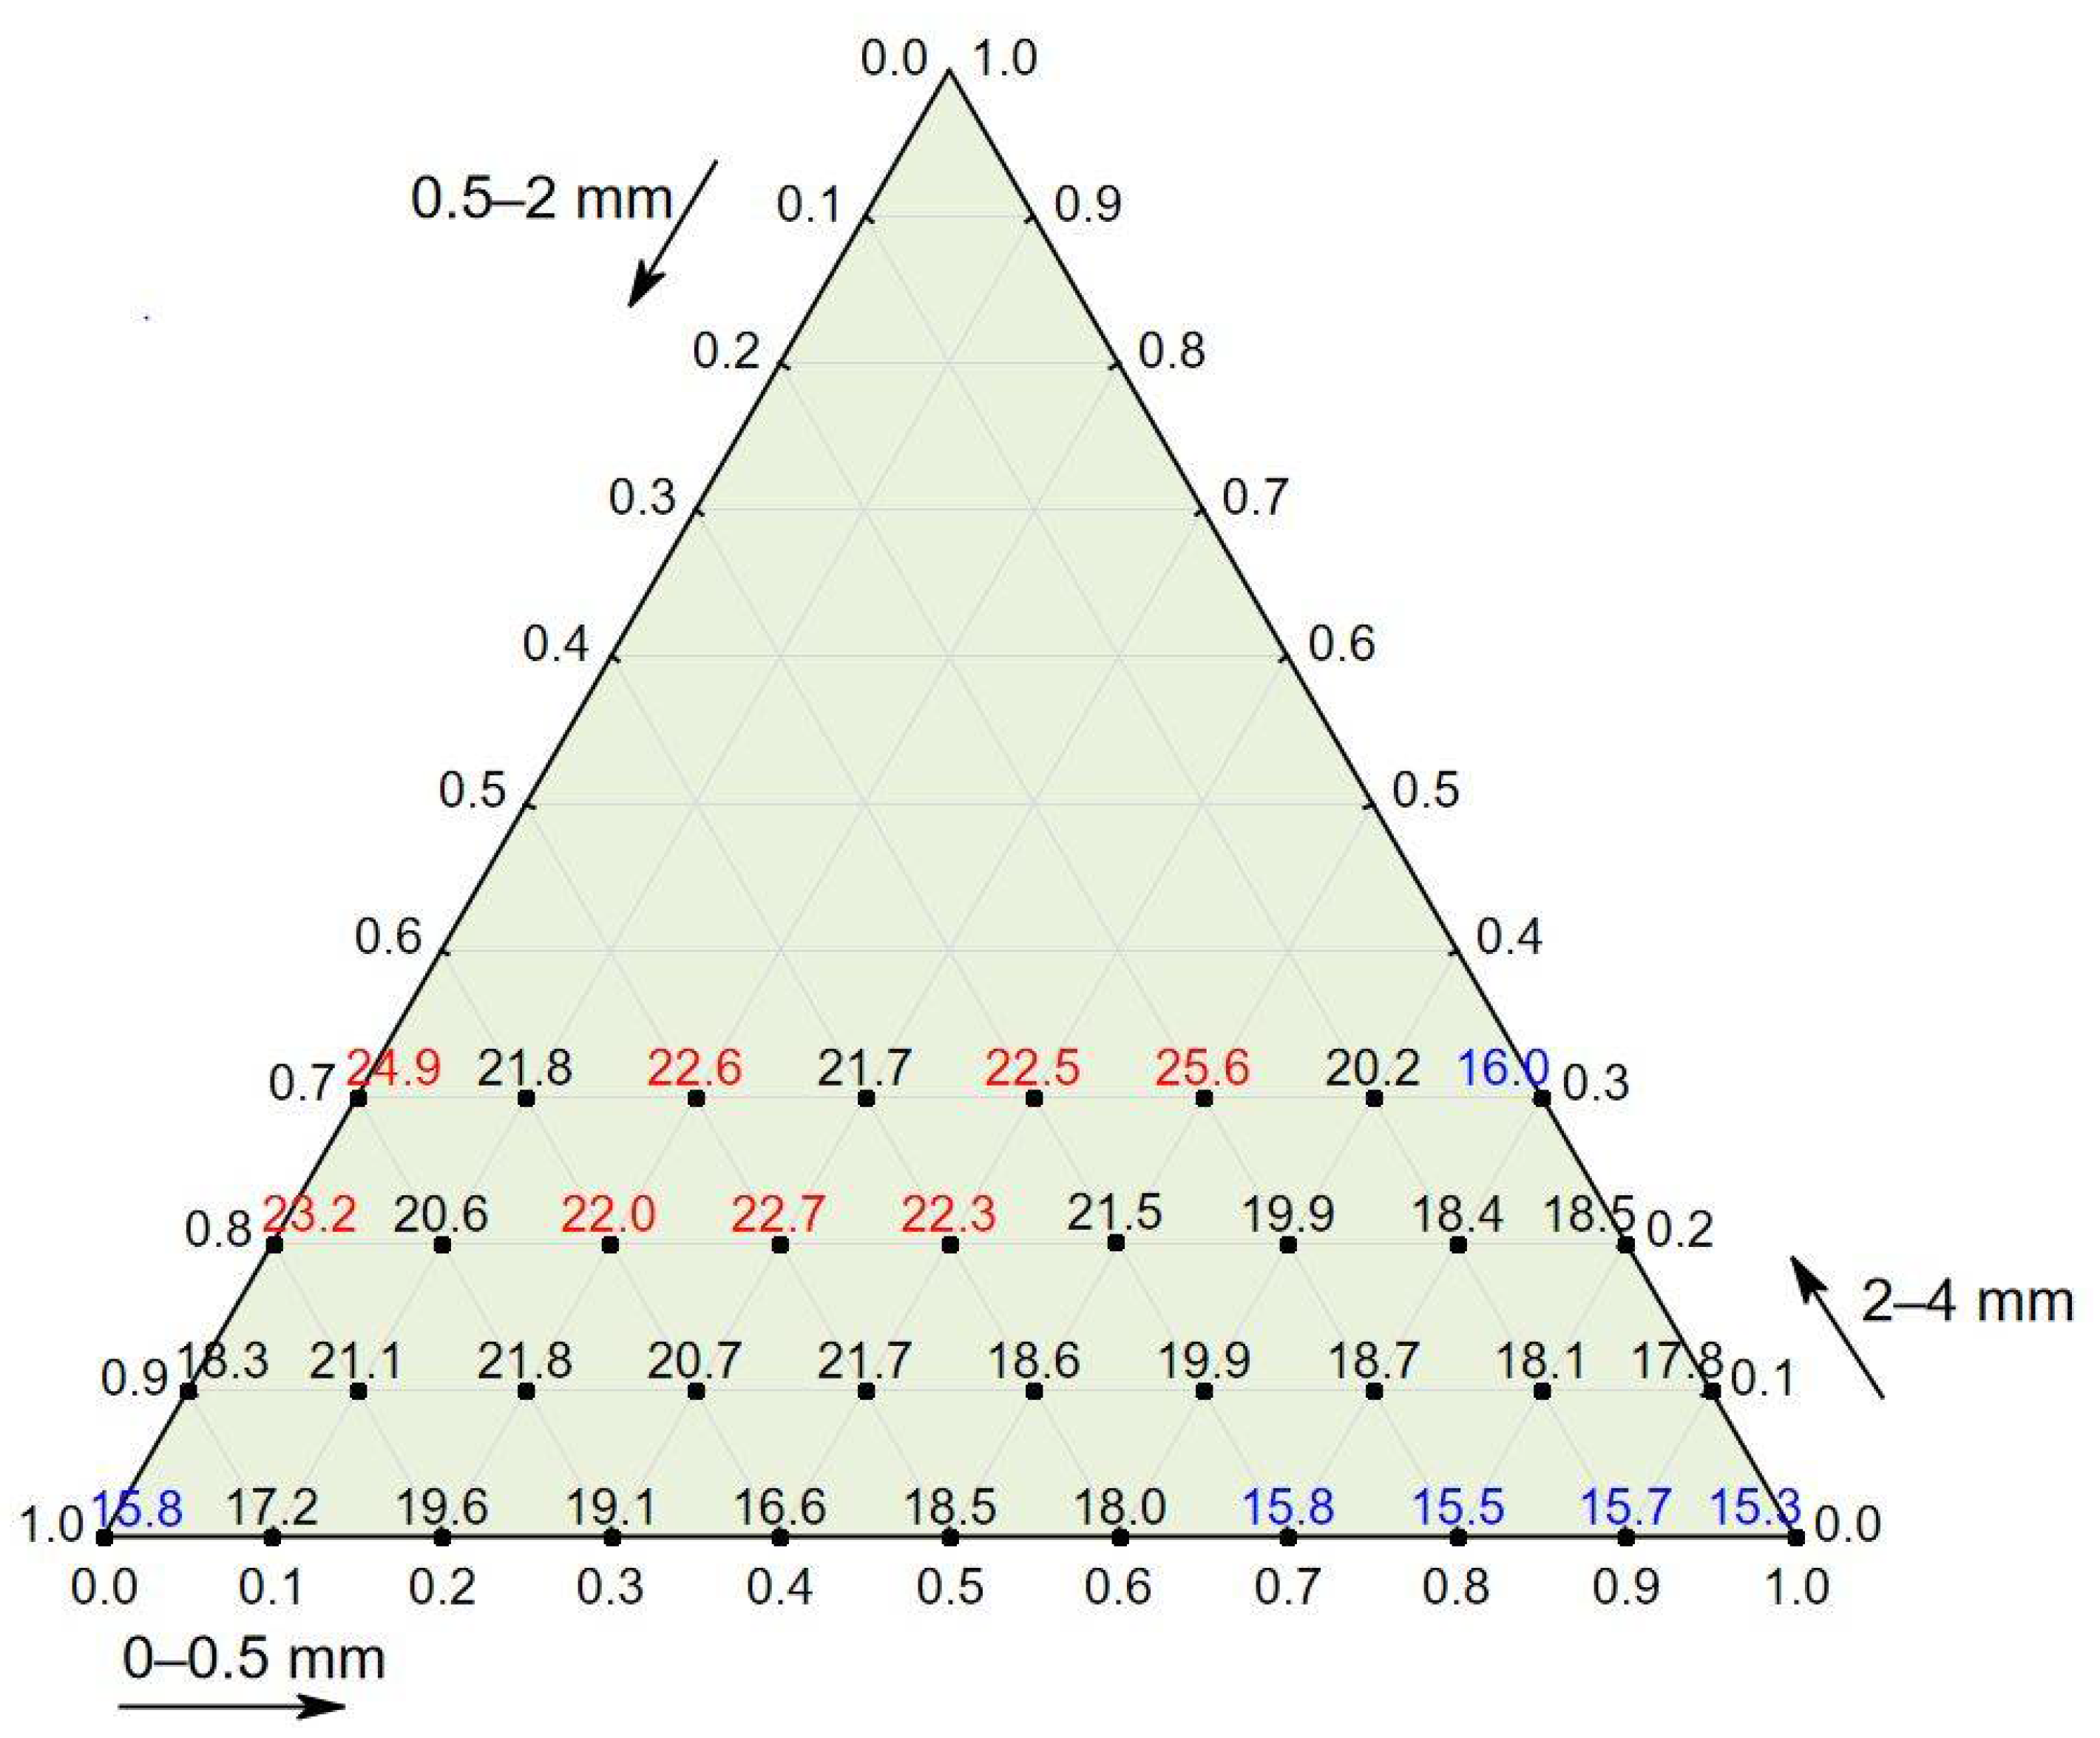
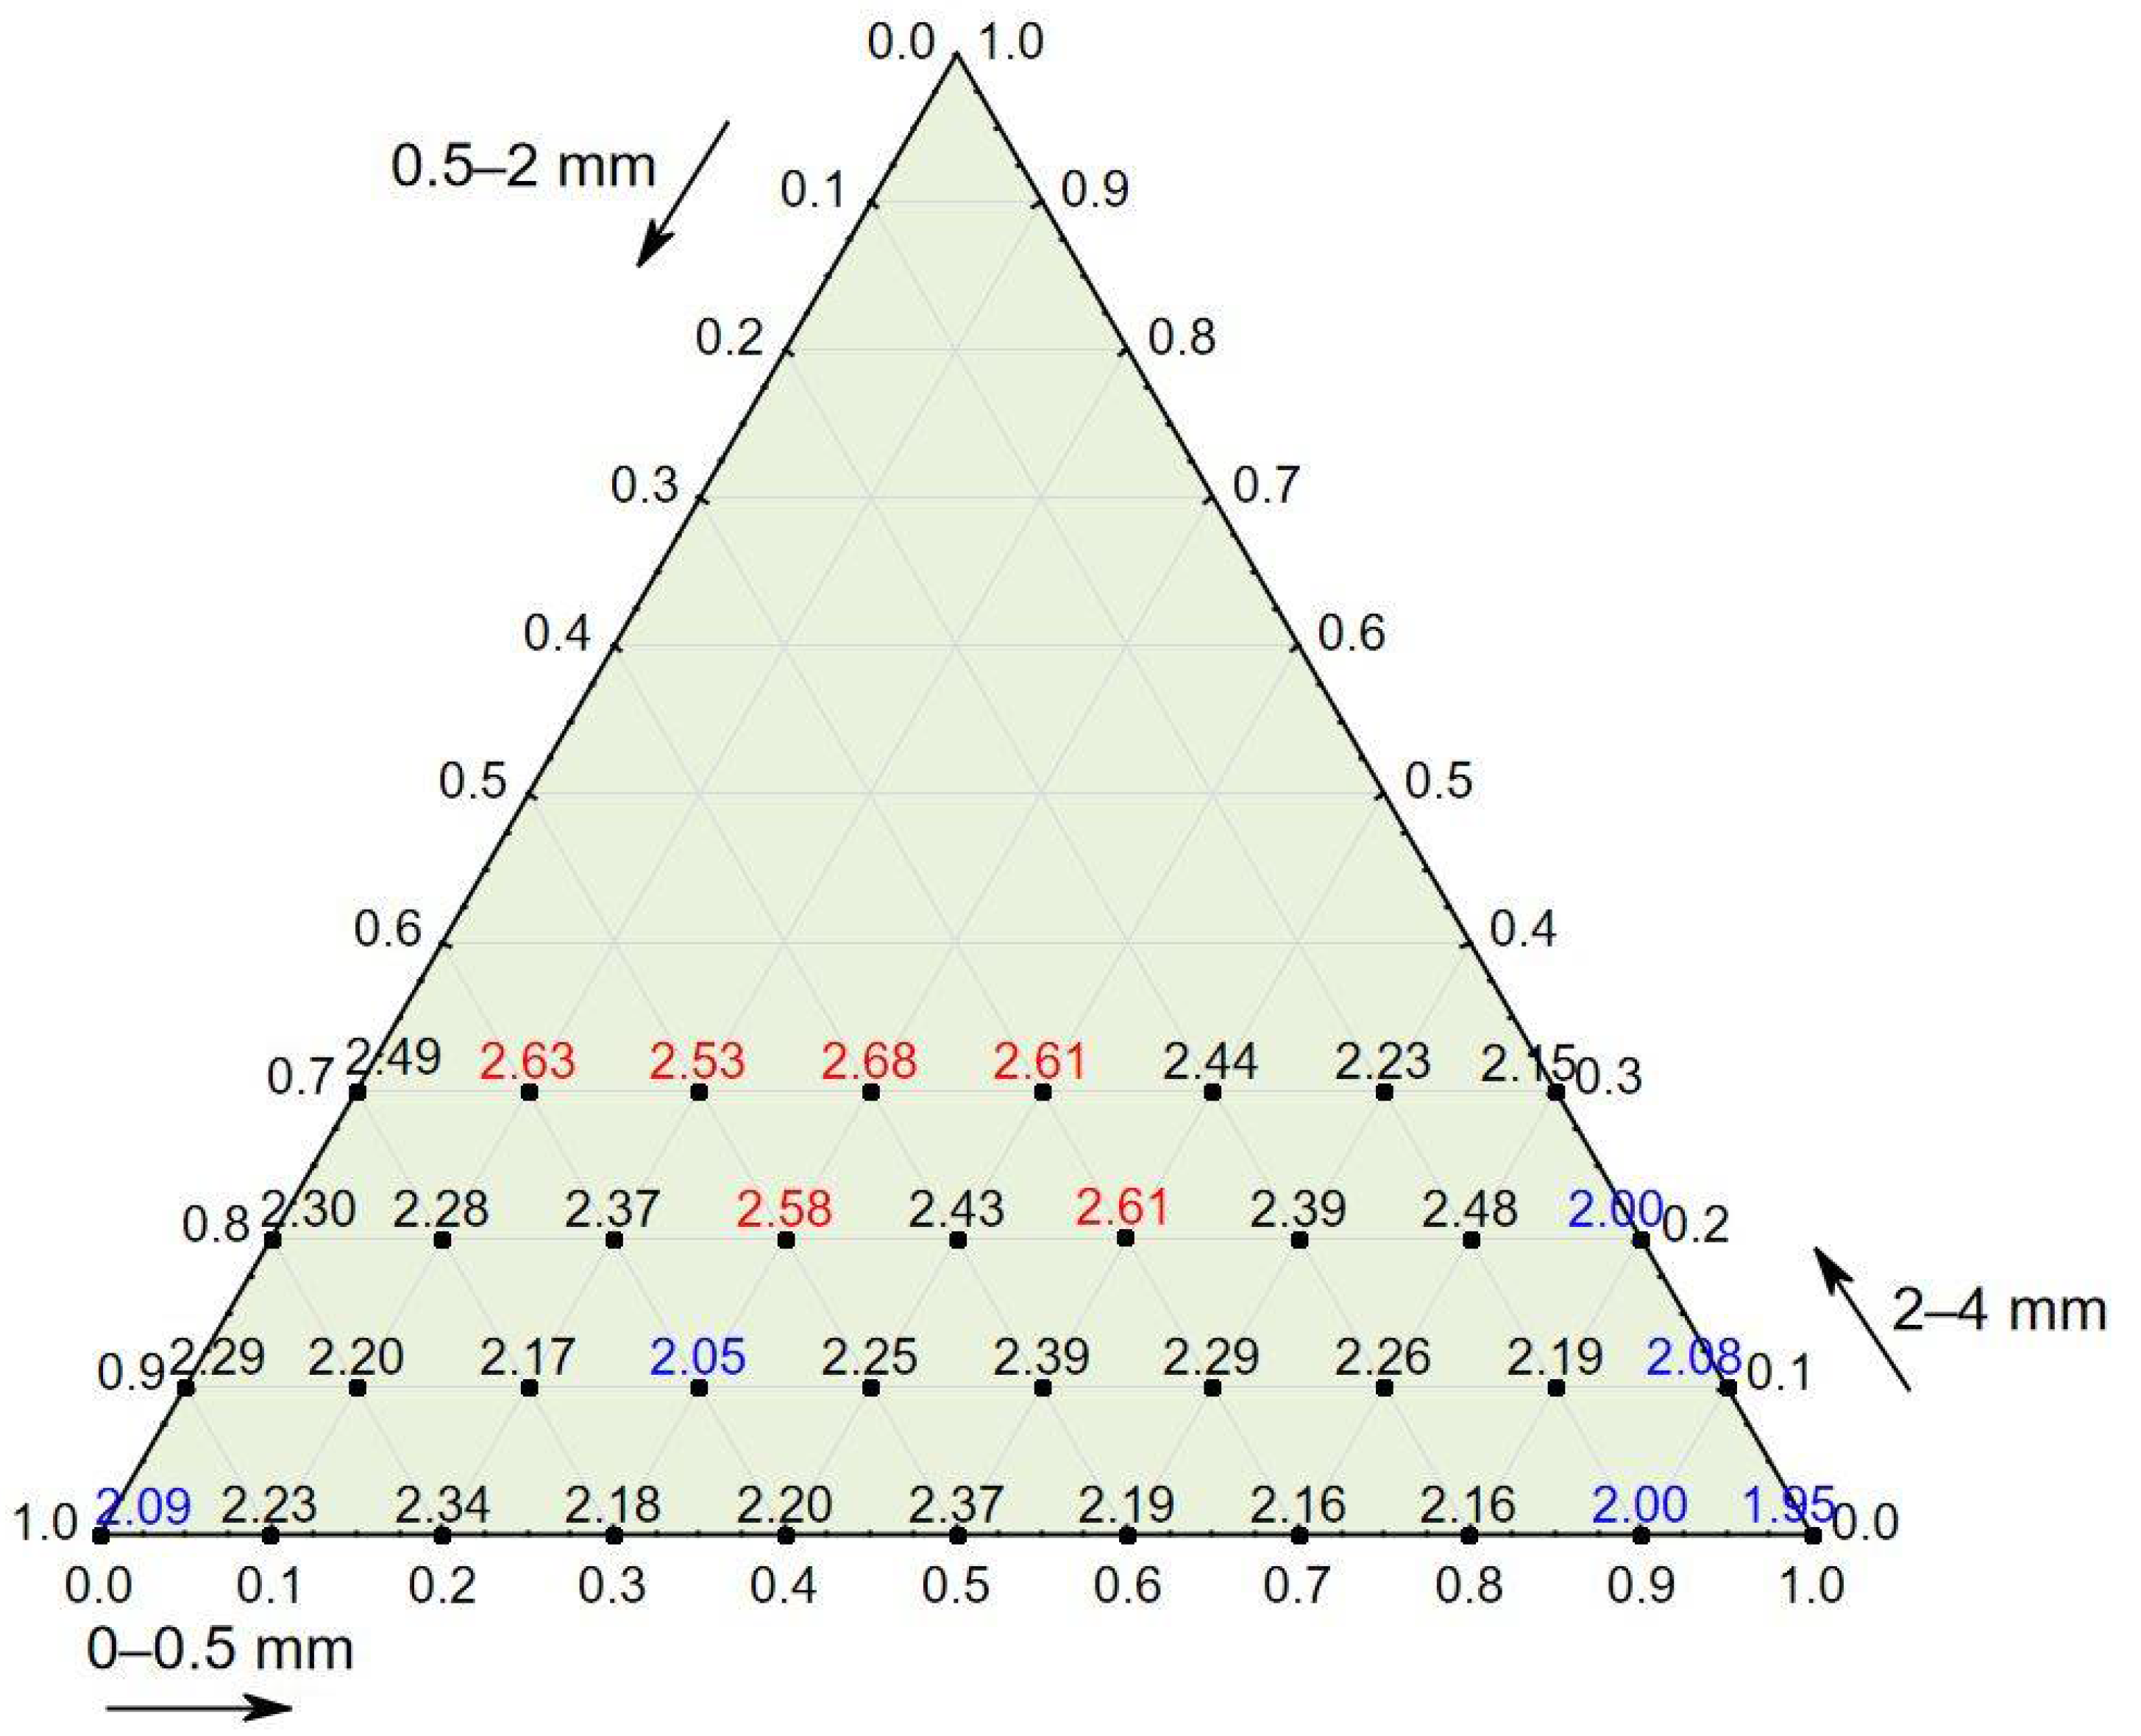
| No. | Apparent Density | Compressive Strength | Splitting Tensile Strength | No. | Apparent Density | Compressive Strength | Splitting Tensile Strength |
|---|---|---|---|---|---|---|---|
| (-) | (kg/m3) | (MPa) | (MPa) | (-) | (kg/m3) | (MPa) | (MPa) |
| 1 | 2058 | 15.8 | 2.09 | 20 | 2080 | 18.1 | 2.19 |
| 2 | 2112 | 17.2 | 2.23 | 21 | 2071 | 17.8 | 2.08 |
| 3 | 2108 | 19.6 | 2.34 | 22 | 2151 | 23.2 | 2.30 |
| 4 | 2116 | 19.1 | 2.18 | 23 | 2141 | 20.6 | 2.28 |
| 5 | 2117 | 16.6 | 2.20 | 24 | 2157 | 22.0 | 2.37 |
| 6 | 2109 | 18.5 | 2.37 | 25 | 2173 | 22.7 | 2.58 |
| 7 | 1996 | 18.0 | 2.19 | 26 | 2144 | 22.3 | 2.43 |
| 8 | 2092 | 15.8 | 2.16 | 27 | 2111 | 21.5 | 2.61 |
| 9 | 2077 | 15.5 | 2.16 | 28 | 2123 | 19.9 | 2.39 |
| 10 | 2036 | 15.7 | 2.00 | 29 | 2136 | 18.4 | 2.48 |
| 11 | 2040 | 15.3 | 1.95 | 30 | 2129 | 18.5 | 2.00 |
| 12 | 2155 | 18.3 | 2.29 | 31 | 2178 | 24.9 | 2.49 |
| 13 | 2158 | 21.1 | 2.20 | 32 | 2217 | 21.8 | 2.63 |
| 14 | 2135 | 21.8 | 2.17 | 33 | 2200 | 22.6 | 2.53 |
| 15 | 2127 | 20.7 | 2.05 | 34 | 2179 | 21.7 | 2.68 |
| 16 | 2105 | 21.7 | 2.25 | 35 | 2184 | 22.5 | 2.61 |
| 17 | 2100 | 18.6 | 2.39 | 36 | 2154 | 25.6 | 2.44 |
| 18 | 2096 | 19.9 | 2.29 | 37 | 2118 | 20.2 | 2.23 |
| 19 | 2093 | 18.7 | 2.26 | 38 | 2110 | 16.0 | 2.15 |
| Variable Designation | Designation Assignment | Contribution of the Variables (%) | ||
|---|---|---|---|---|
| F1 | F2 | F3 | ||
| 1 | aggregate 0–0.5 mm | 9.2 | 15.7 | 6.5 |
| 2 | aggregate 0.5–2 mm | 5.4 | 23.1 | 8.3 |
| 3 | aggregate 2–4 mm | 8.8 | 10.8 | 2.7 |
| 4 | cement | 13.7 | 5.3 | 1.2 |
| 5 | water | 13.7 | 5.4 | 1.2 |
| 6 | consistency | 0.5 | 1.2 | 66.1 |
| 7 | air content | 2.2 | 23.9 | 8.1 |
| 8 | mix density | 11.7 | 7.2 | 2.6 |
| 9 | compressive strength | 11.4 | 1.9 | 0.5 |
| 10 | concrete density | 13.7 | 1.0 | 1.1 |
| 11 | splitting tensile strength | 9.7 | 4.5 | 1.7 |
Publisher’s Note: MDPI stays neutral with regard to jurisdictional claims in published maps and institutional affiliations. |
© 2021 by the author. Licensee MDPI, Basel, Switzerland. This article is an open access article distributed under the terms and conditions of the Creative Commons Attribution (CC BY) license (https://creativecommons.org/licenses/by/4.0/).
Share and Cite
Kobaka, J. Principal Component Analysis as a Statistical Tool for Concrete Mix Design. Materials 2021, 14, 2668. https://doi.org/10.3390/ma14102668
Kobaka J. Principal Component Analysis as a Statistical Tool for Concrete Mix Design. Materials. 2021; 14(10):2668. https://doi.org/10.3390/ma14102668
Chicago/Turabian StyleKobaka, Janusz. 2021. "Principal Component Analysis as a Statistical Tool for Concrete Mix Design" Materials 14, no. 10: 2668. https://doi.org/10.3390/ma14102668
APA StyleKobaka, J. (2021). Principal Component Analysis as a Statistical Tool for Concrete Mix Design. Materials, 14(10), 2668. https://doi.org/10.3390/ma14102668