Investigation on the Micro Deformation Mechanism of Asphalt Mixtures under High Temperatures Based on a Self-Developed Laboratory Test


Abstract
1. Introduction
- A more practical rutting tester is developed considering the shortcomings of existing testers.
- A two-dimensional RSCT virtual test is built based on the discrete element method, and the validity of the virtual test is verified.
- The microscopic response of the numerical model is analyzed to study the formation mechanism of rutting, and the corresponding guidance is obtained.
2. Materials
2.1. Asphalt
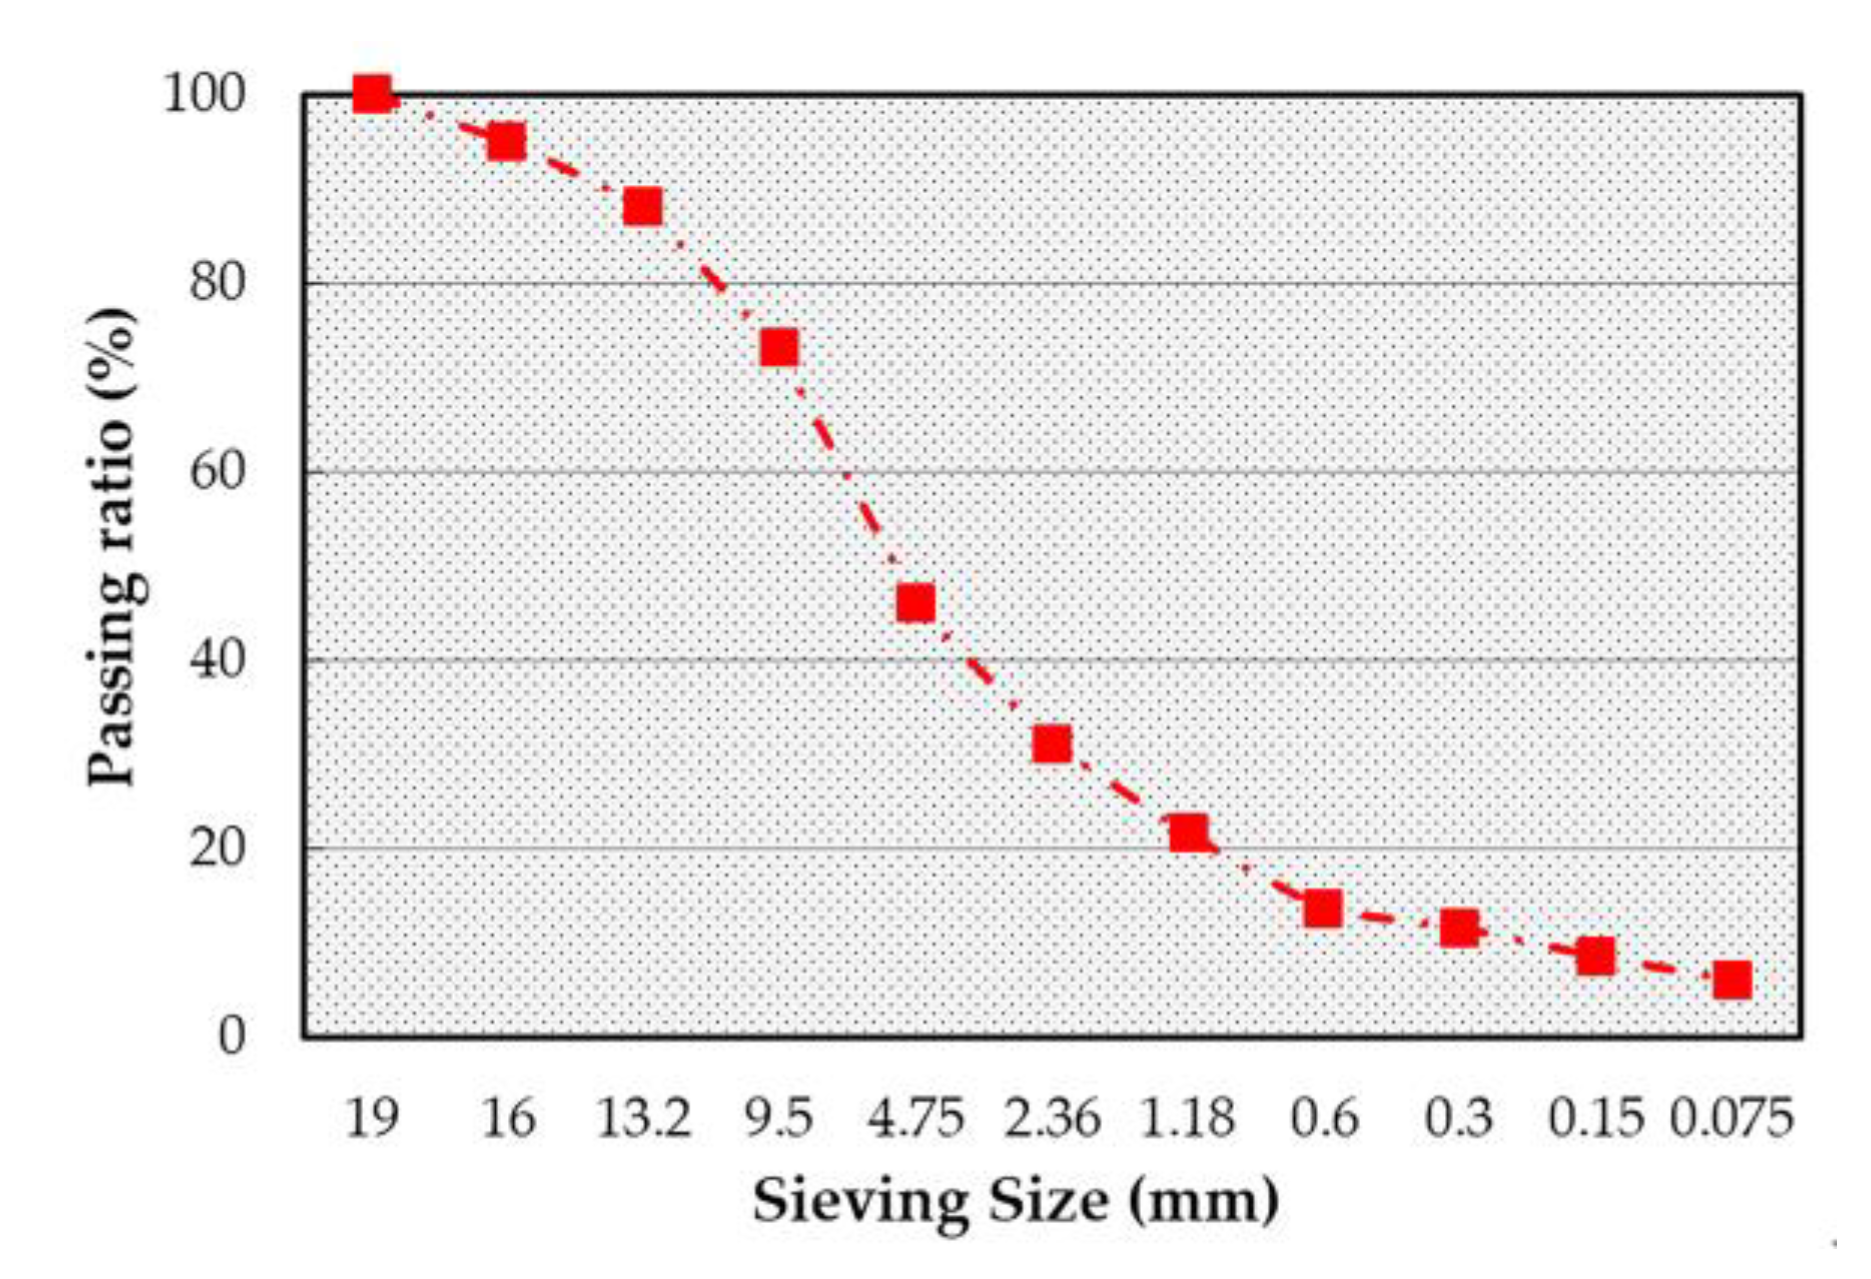
2.2. Aggregate
2.3. Preparation of Specimens
2.3.1. Preparation of Asphalt Mixture
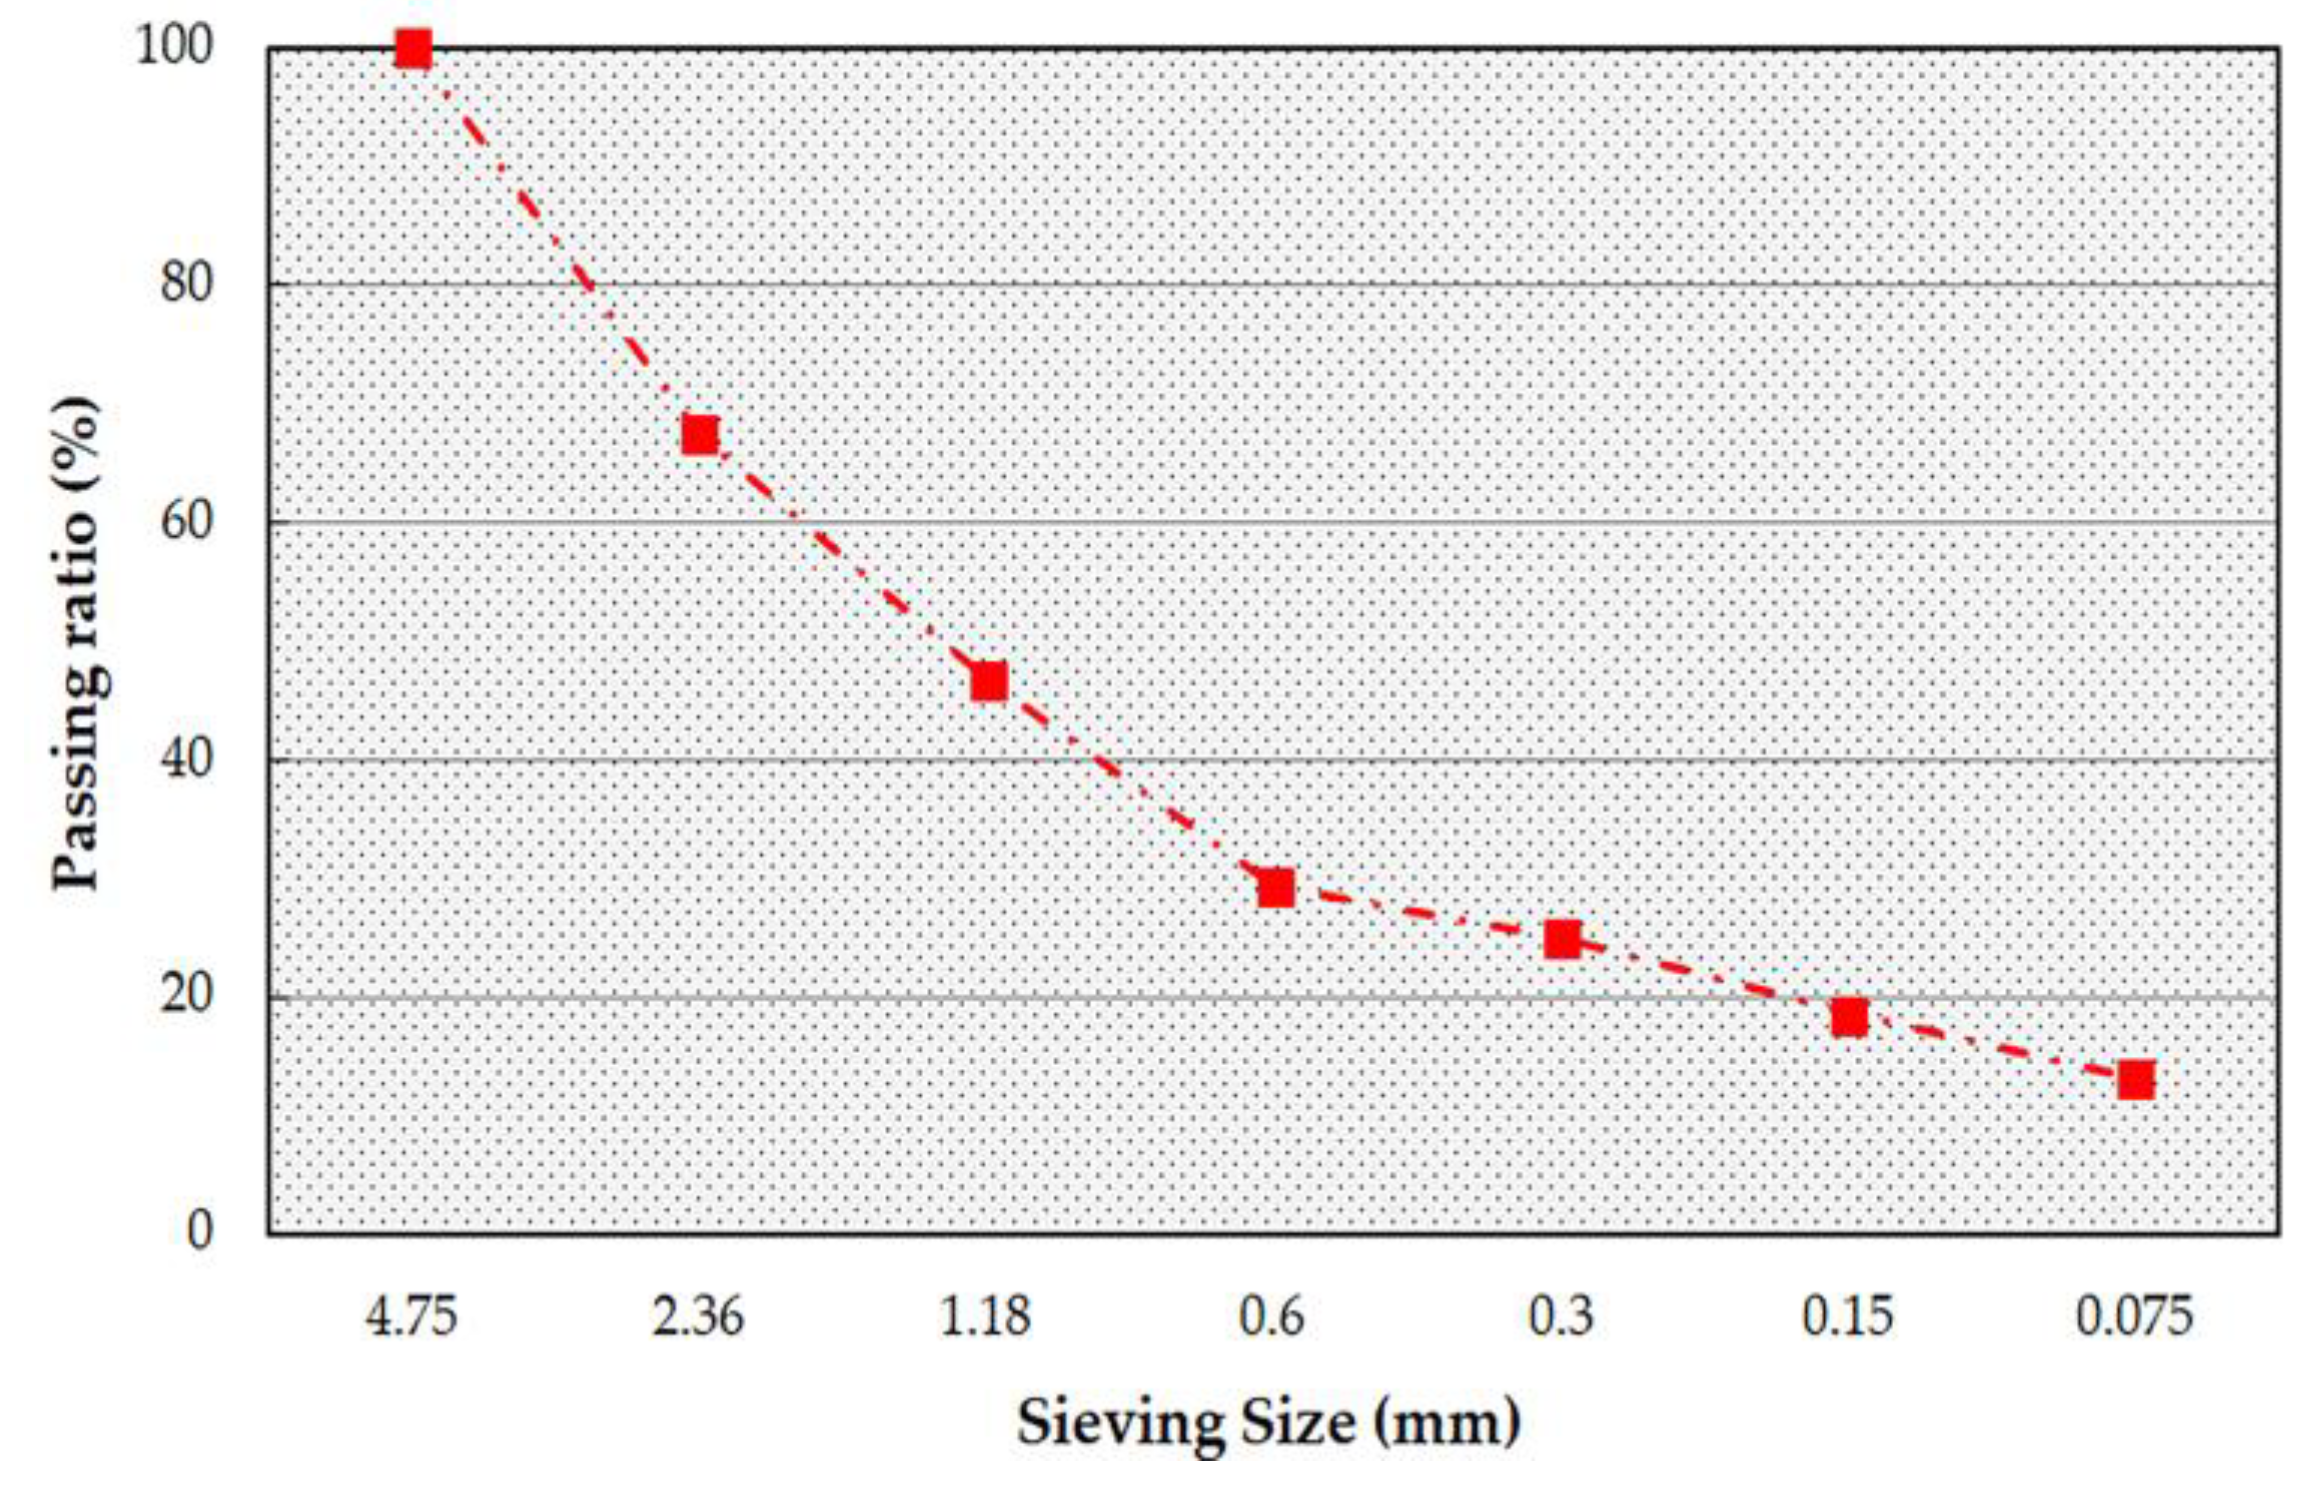
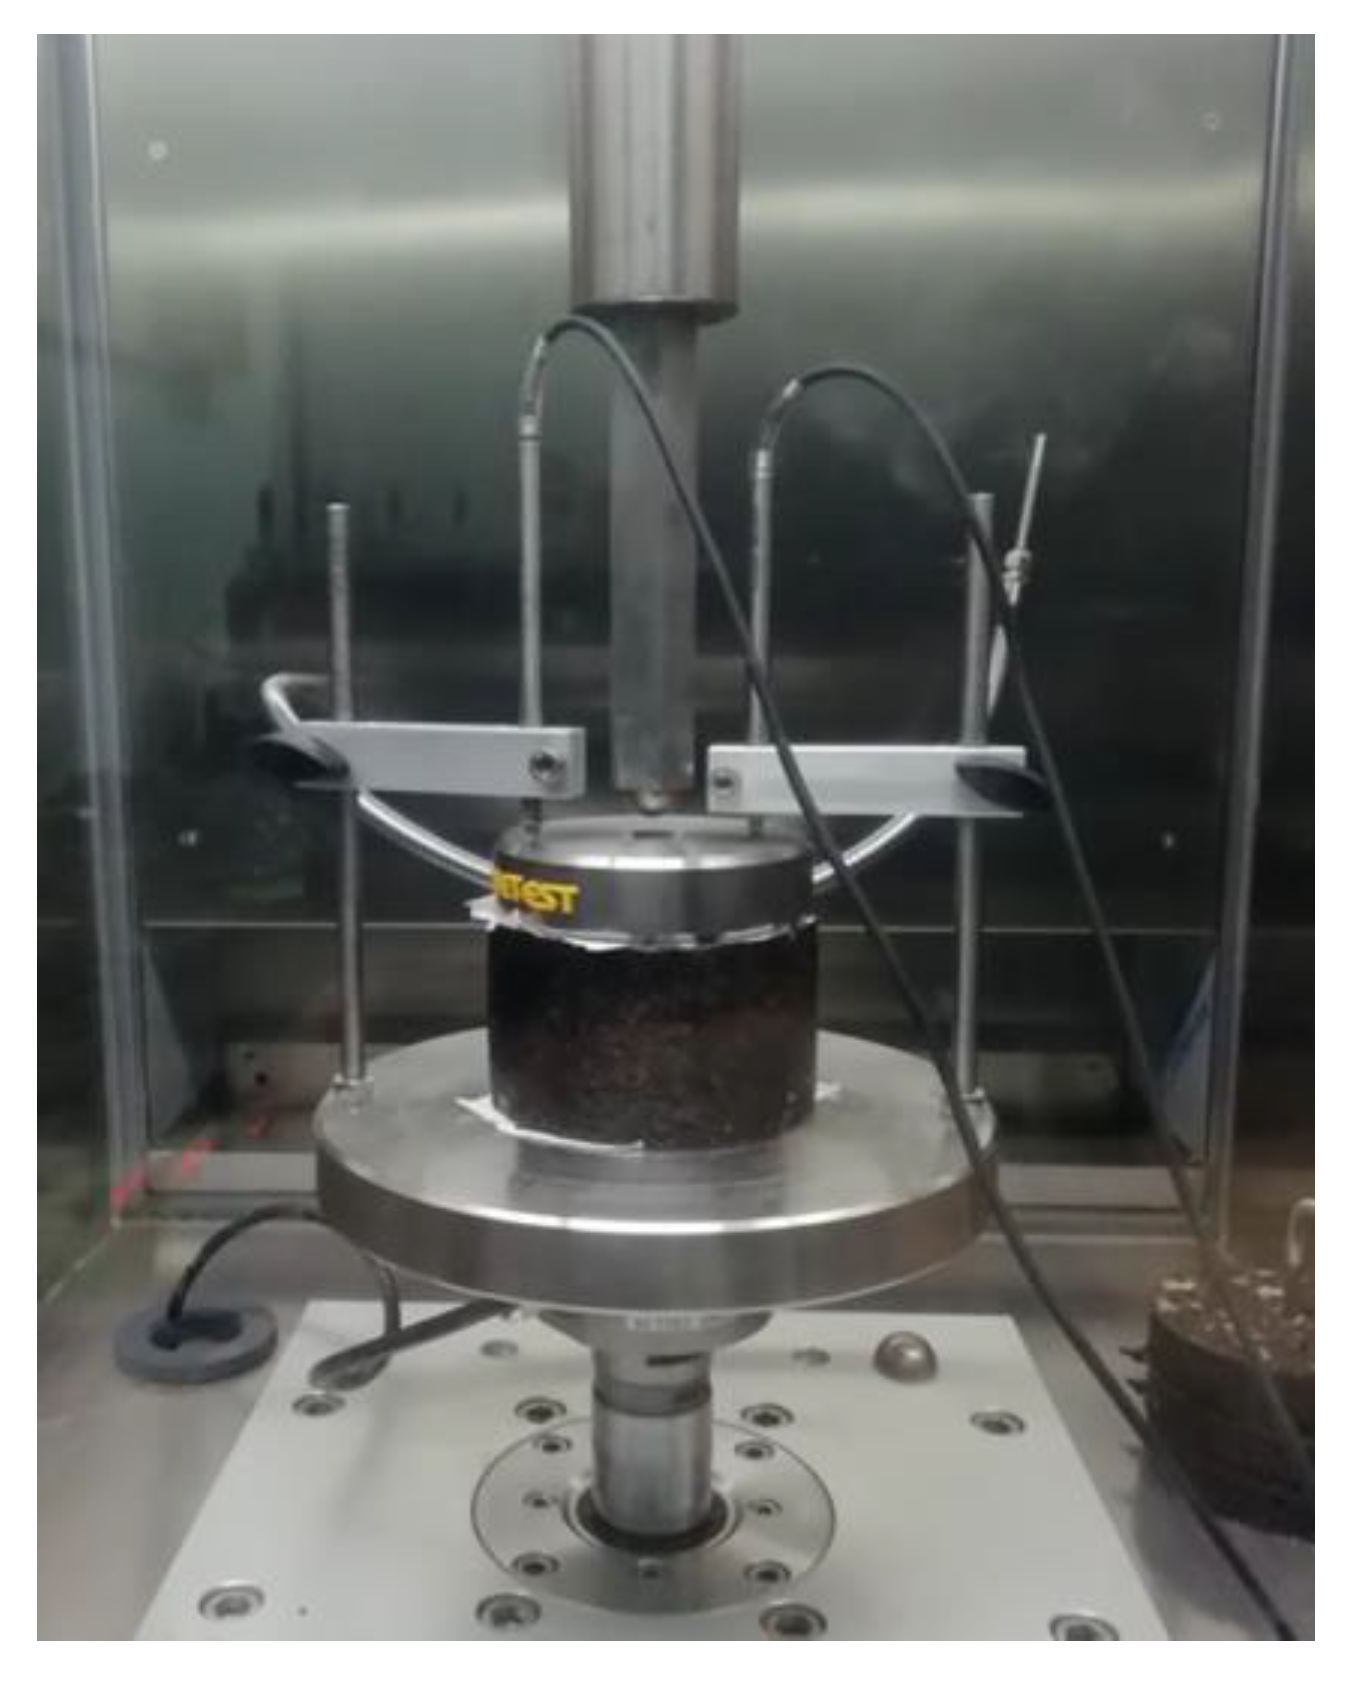
2.3.2. Preparation of Asphalt Mastic
3. Methods
3.1. The Wheel Tracking Test
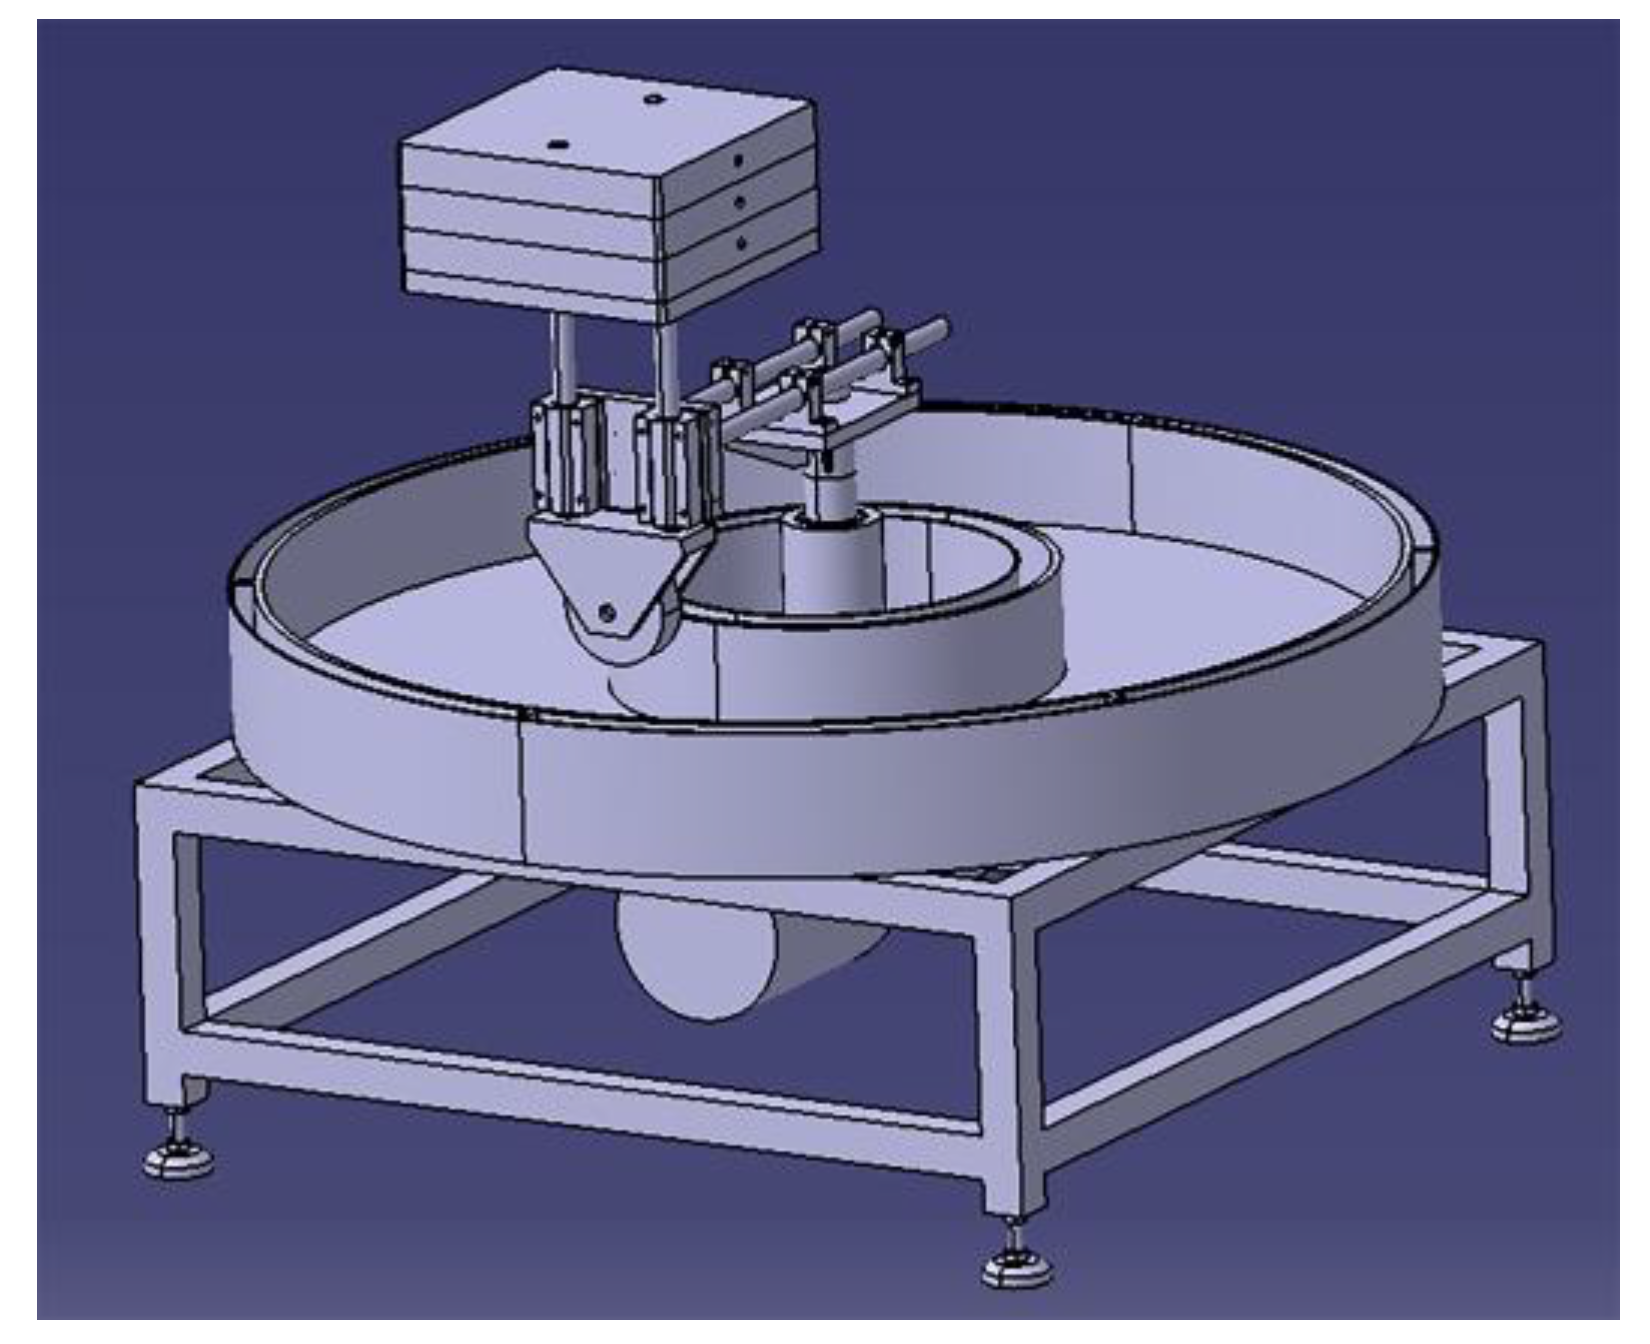
3.2. The Reduced Scale Circular Track Test
3.2.1. Compositions of the Tester
3.2.2. Parameters of the Tester
3.2.3. Test Procedure
- The resistance wire in the surrounding ring is heated to ensure a temperature of 120 °C.
- The asphalt mixture, mixed according to JTG E20-2011, is evenly placed in the disc and tamped. Subsequently, the width of the test wheel is adjusted to the same width as the specimen and the asphalt mixture is compacted with a 65 kg load 50 times.
- The test wheel is adjusted to a wheel with a width of 5 cm. The temperature is controlled at 60 °C by an environmental simulation system and held for 5 h. Finally, the test is carried out after the load is adjusted to 70 kg.
3.3. Numerical Simulation Test
3.3.1. Basic Assumptions
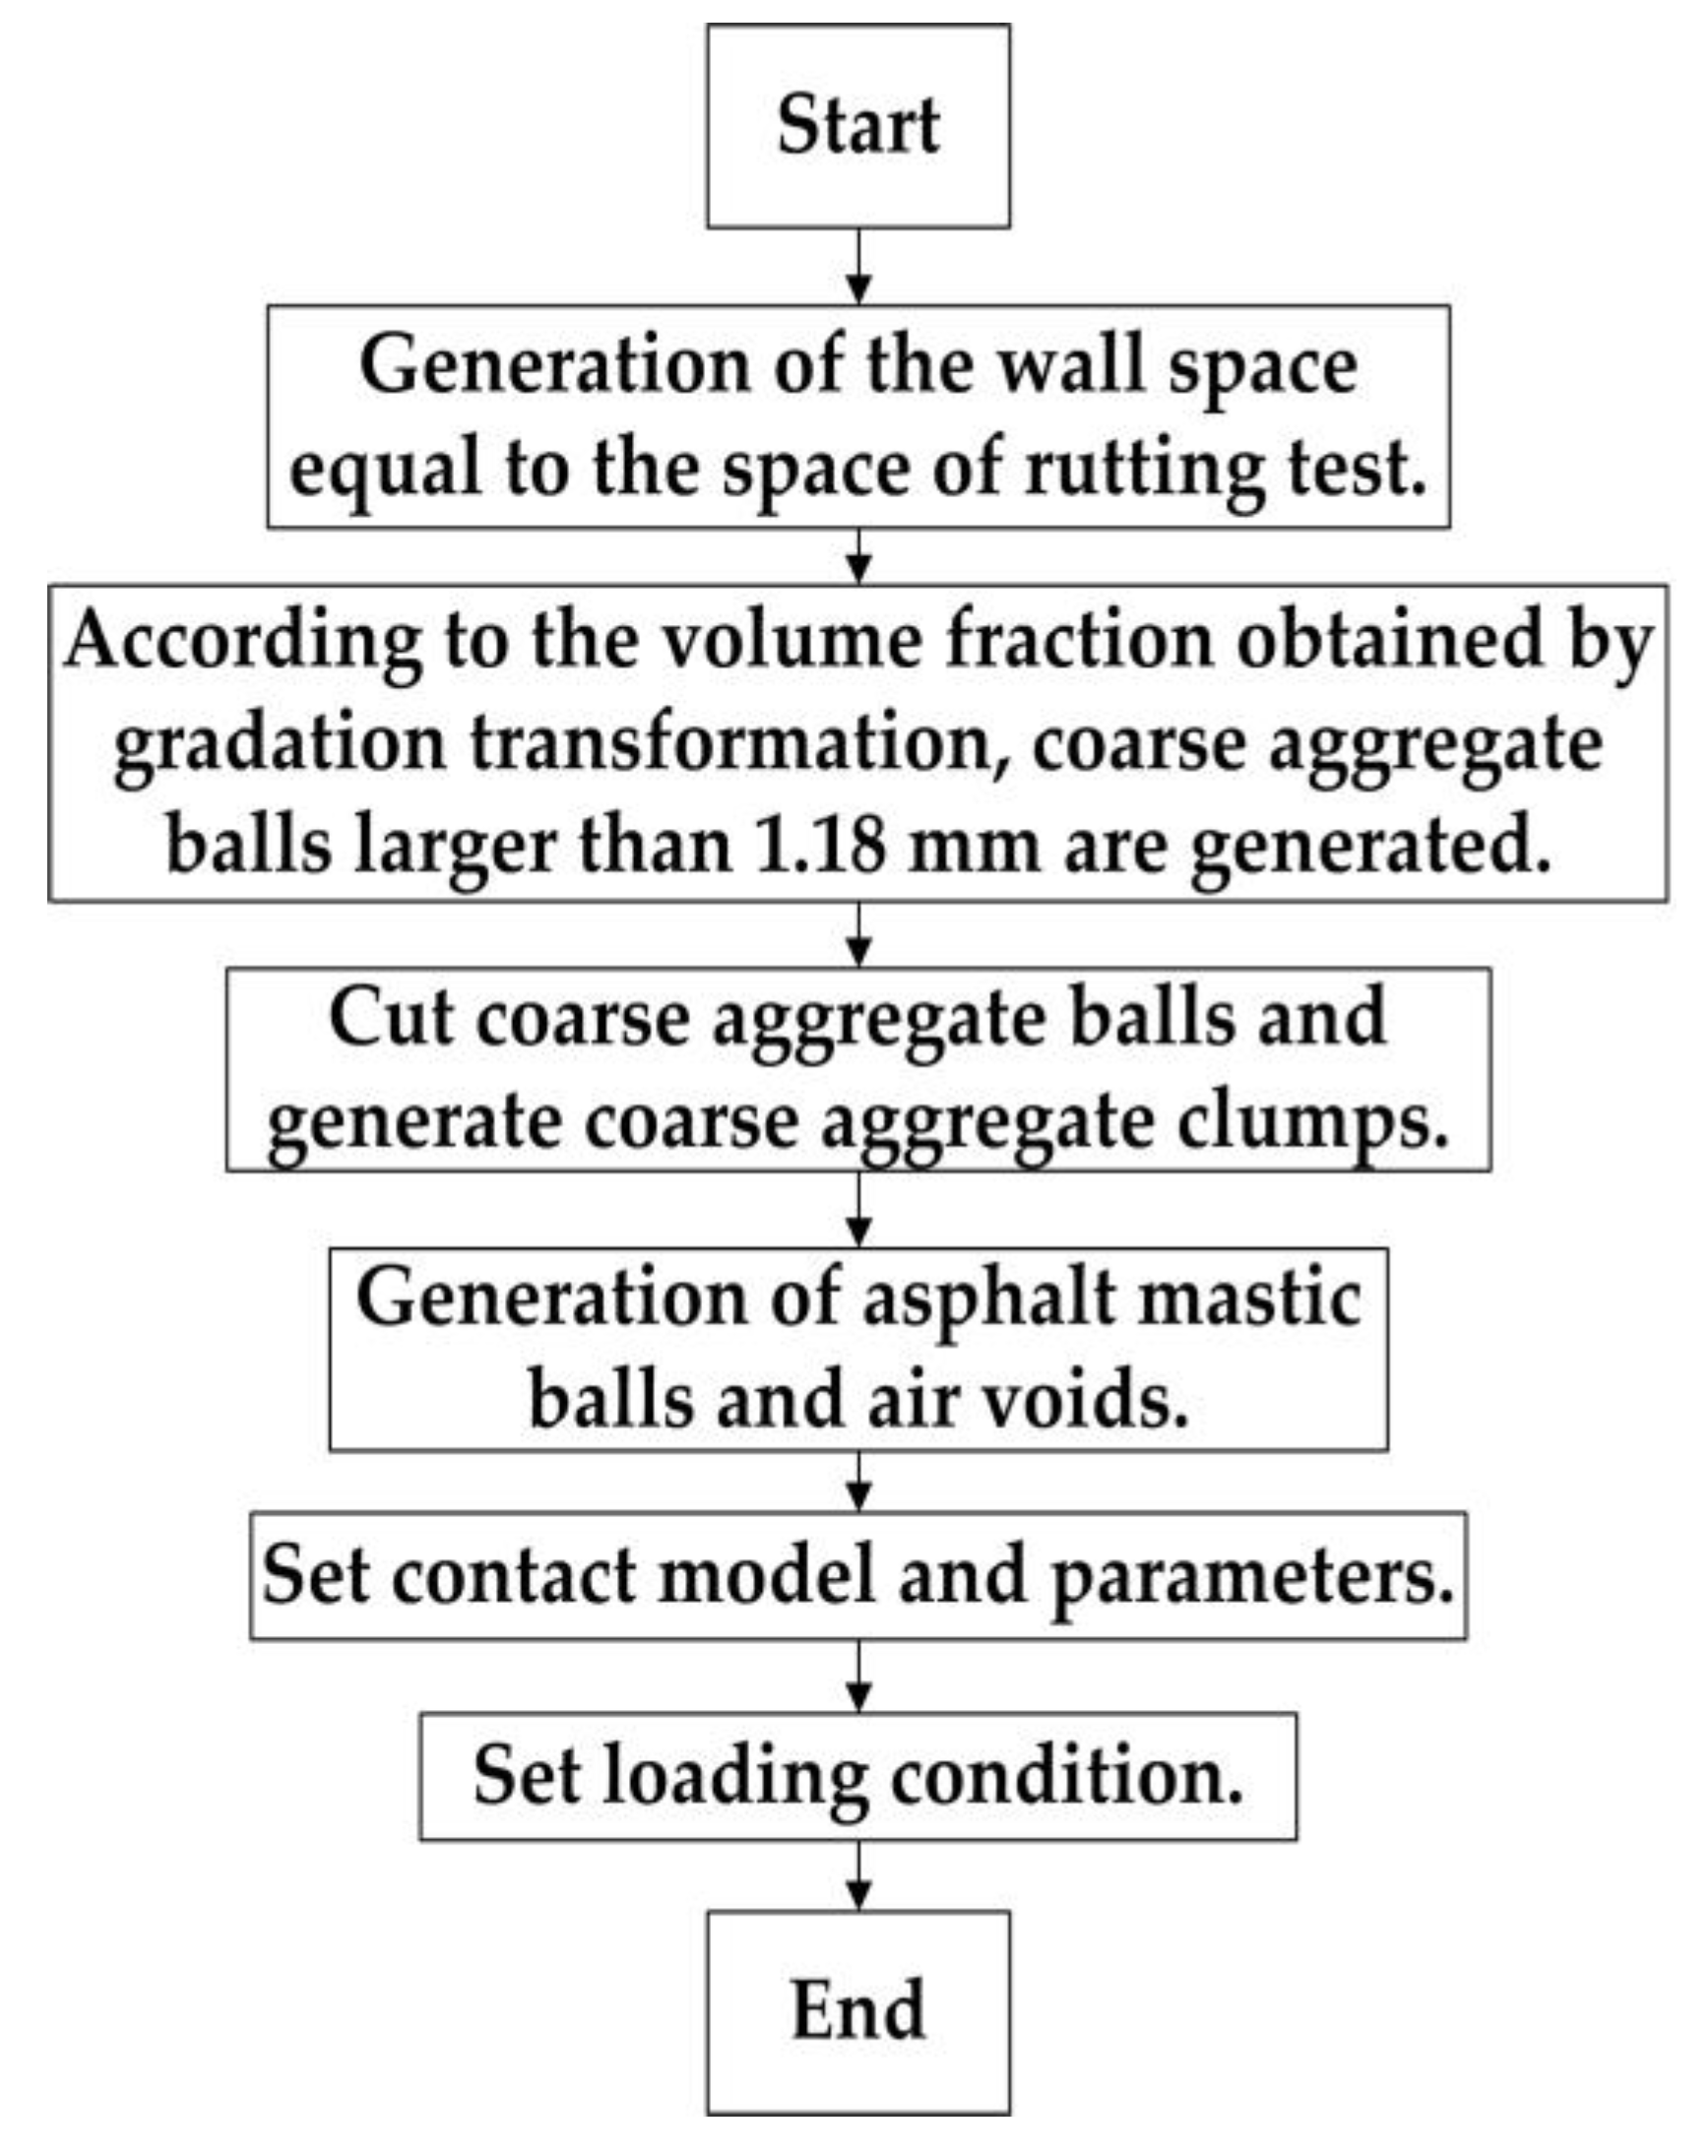
- The shape of the coarse aggregate is assumed to be an irregular pentagon. In this paper, an irregular pentahedron’s aggregate clump is composed of several original round particles using FISH codes.
- The distribution of the coarse aggregate is random.
- Due to the fact that the coarse aggregate will not deform when subjected to loading, the coarse aggregate is assumed to be a homogeneous material with sufficient strength and stiffness.
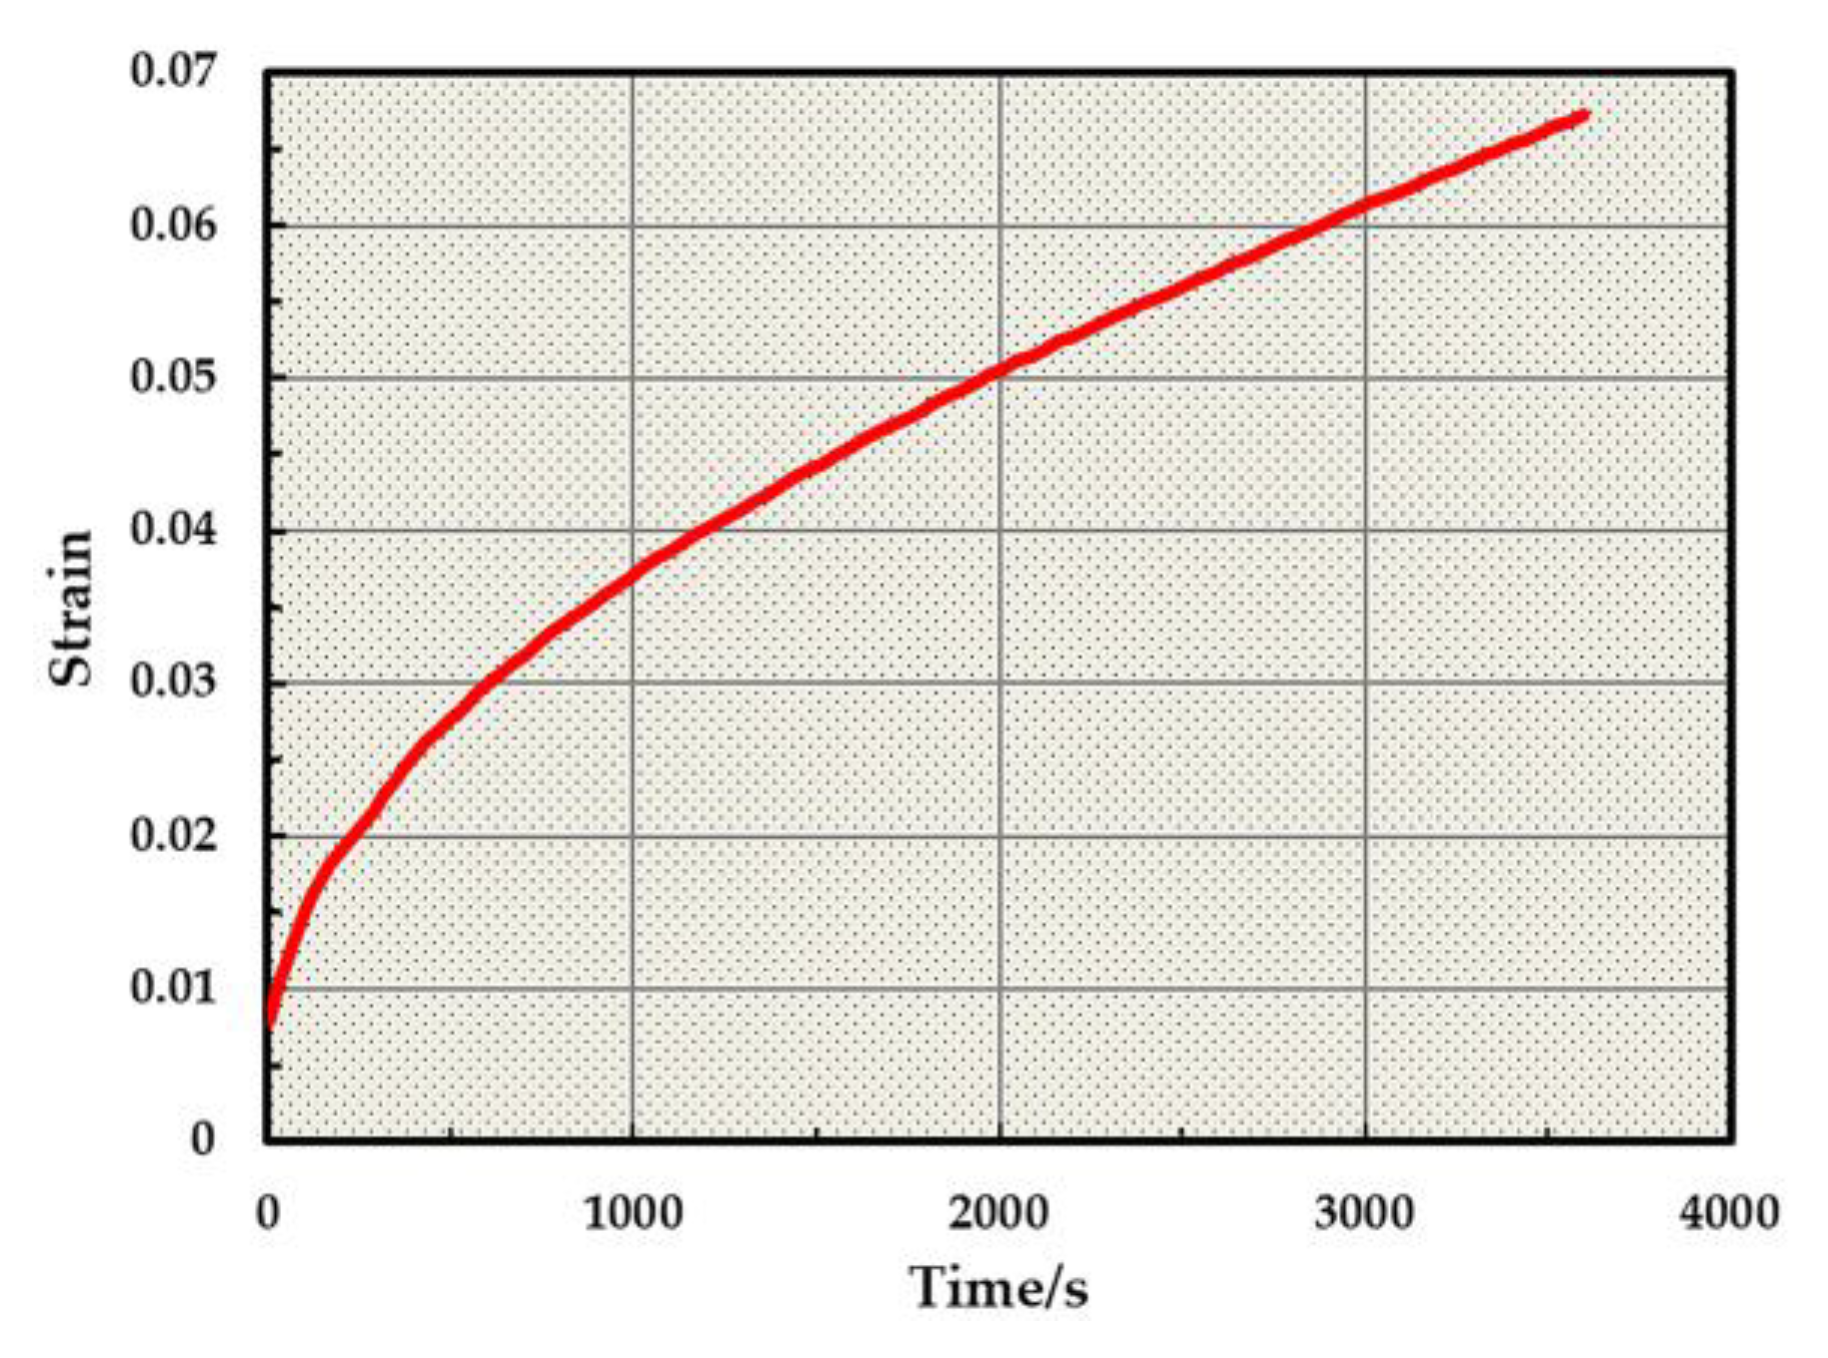
- Due to its recoverable capacity under high temperatures, the plastic deformation of asphalt mastic is very small, which can be ignored. Asphalt mastic has both elasticity and viscosity under high temperatures. It is unreasonable to treat asphalt mastic as a single elastic or viscous body. Therefore, asphalt mastic is assumed to be a homogeneous viscoelastic material. The Burgers model was utilized to describe the properties of asphalt mastic. The parameters would then be obtained using the dynamic creep test.
3.3.2. Contact Models
- The contact model of coarse aggregate particles is set up as a linear contact model.
- The contact between the asphalt mastic particles and the coarse aggregate particles is set up as a linear contact bond model.
- The contact model of asphalt mastic particles is set up as a Burgers model.
4. Results and Discussion
4.1. The Reduced Scale Circular Track Test
4.2. The Virtual Rutting Test
4.2.1. Preparation
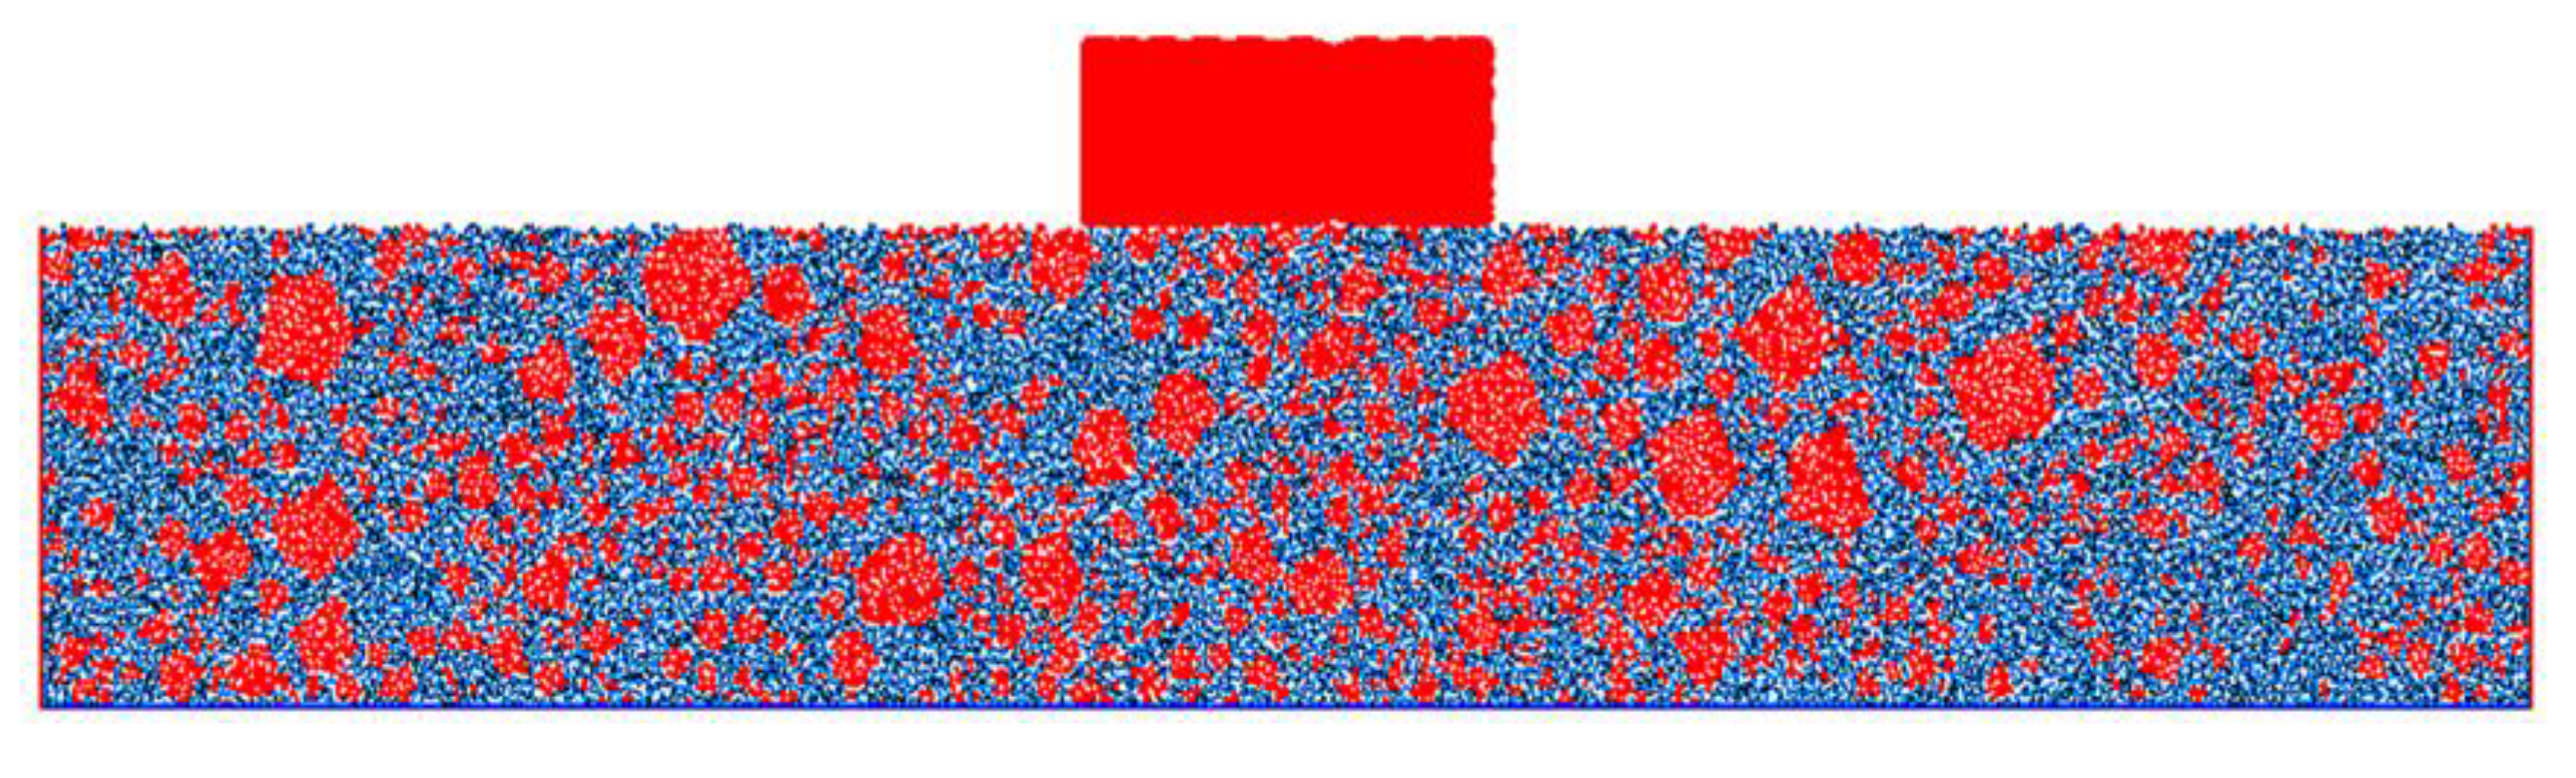
4.2.2. Parameters and establishment of the model
4.2.3. Model Validation
4.2.4. Analysis and Discussion
5. Conclusions
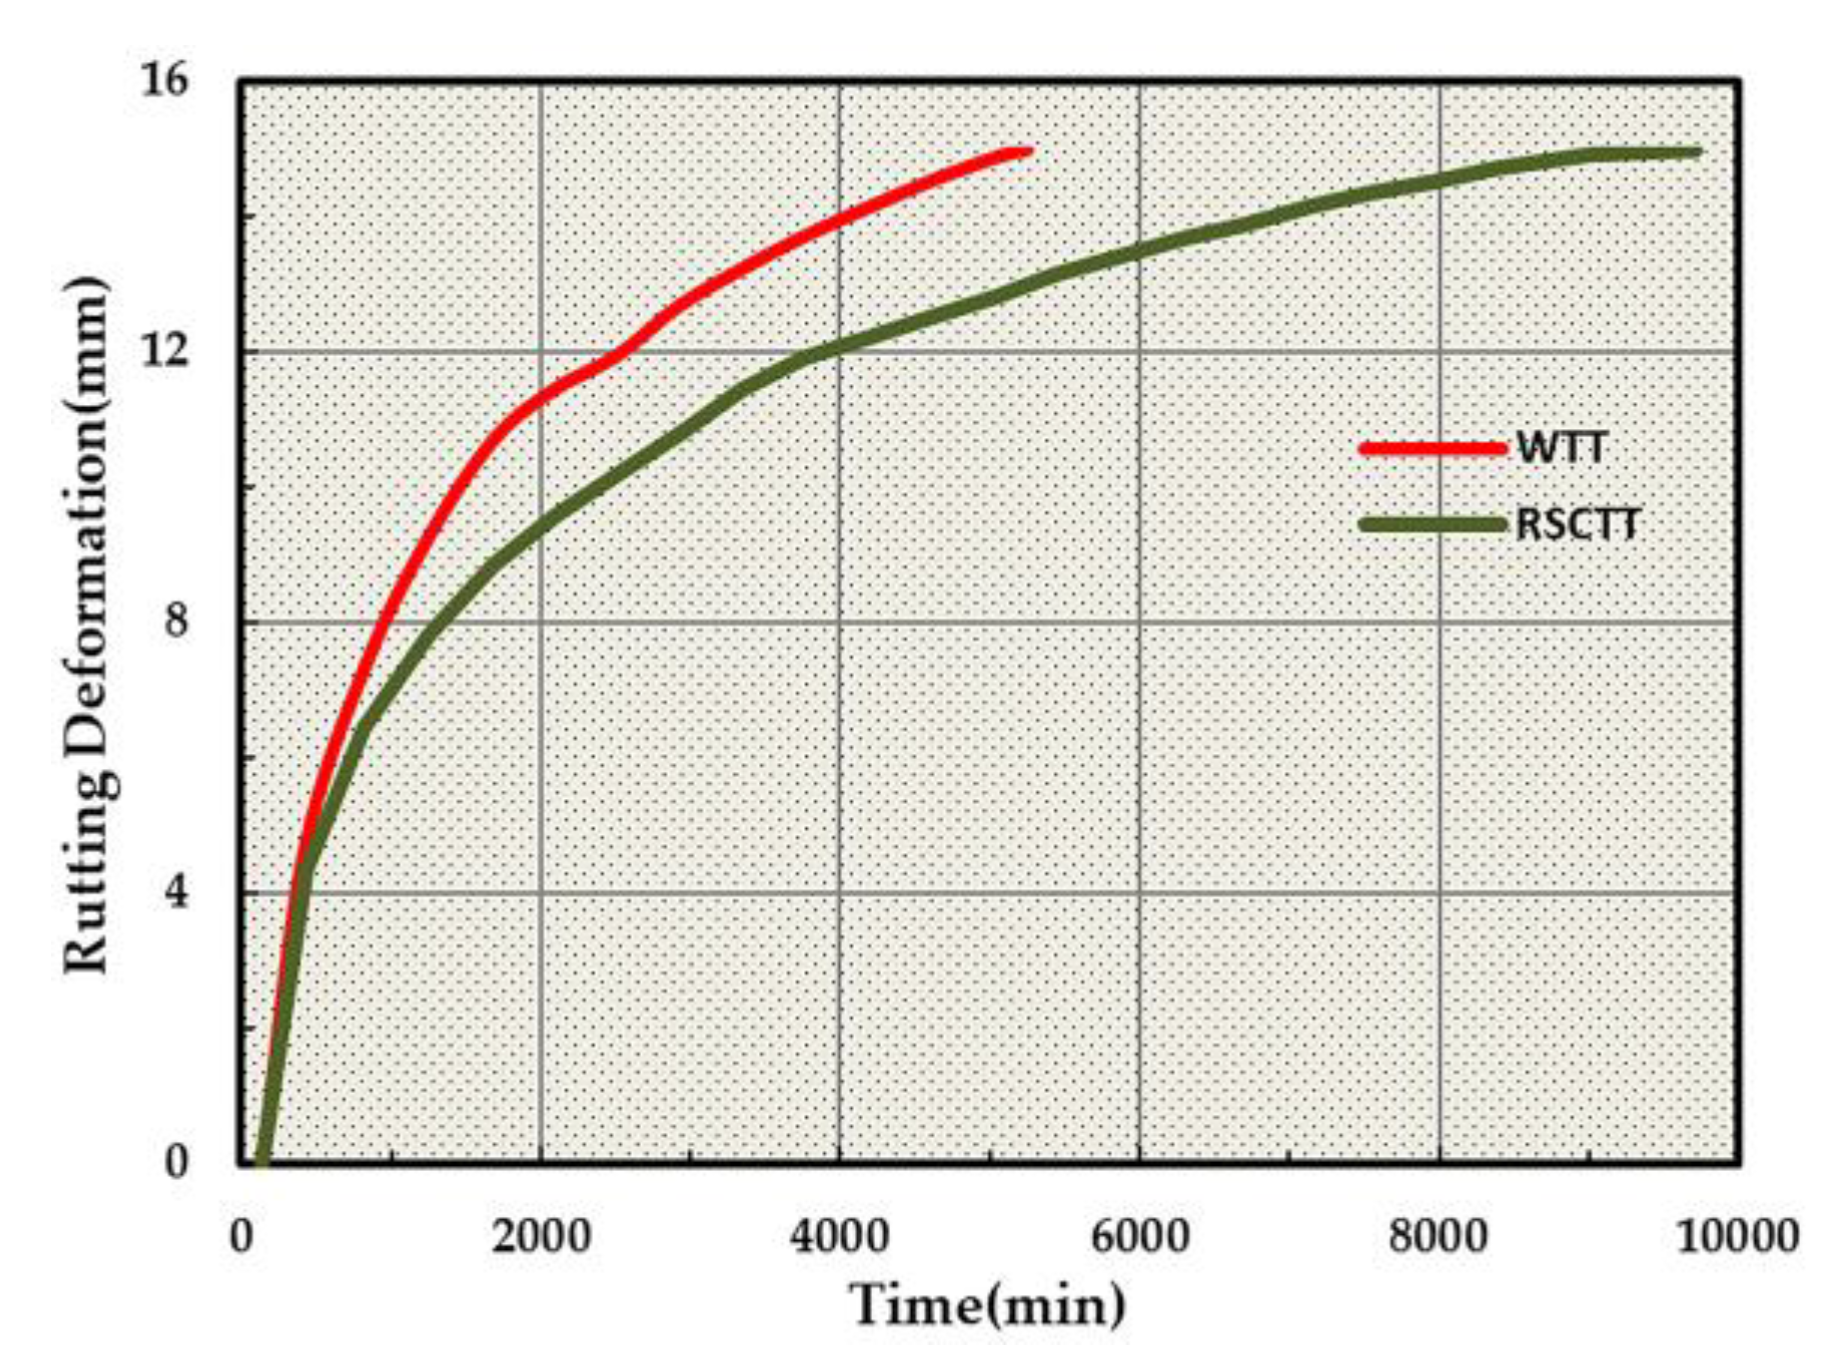
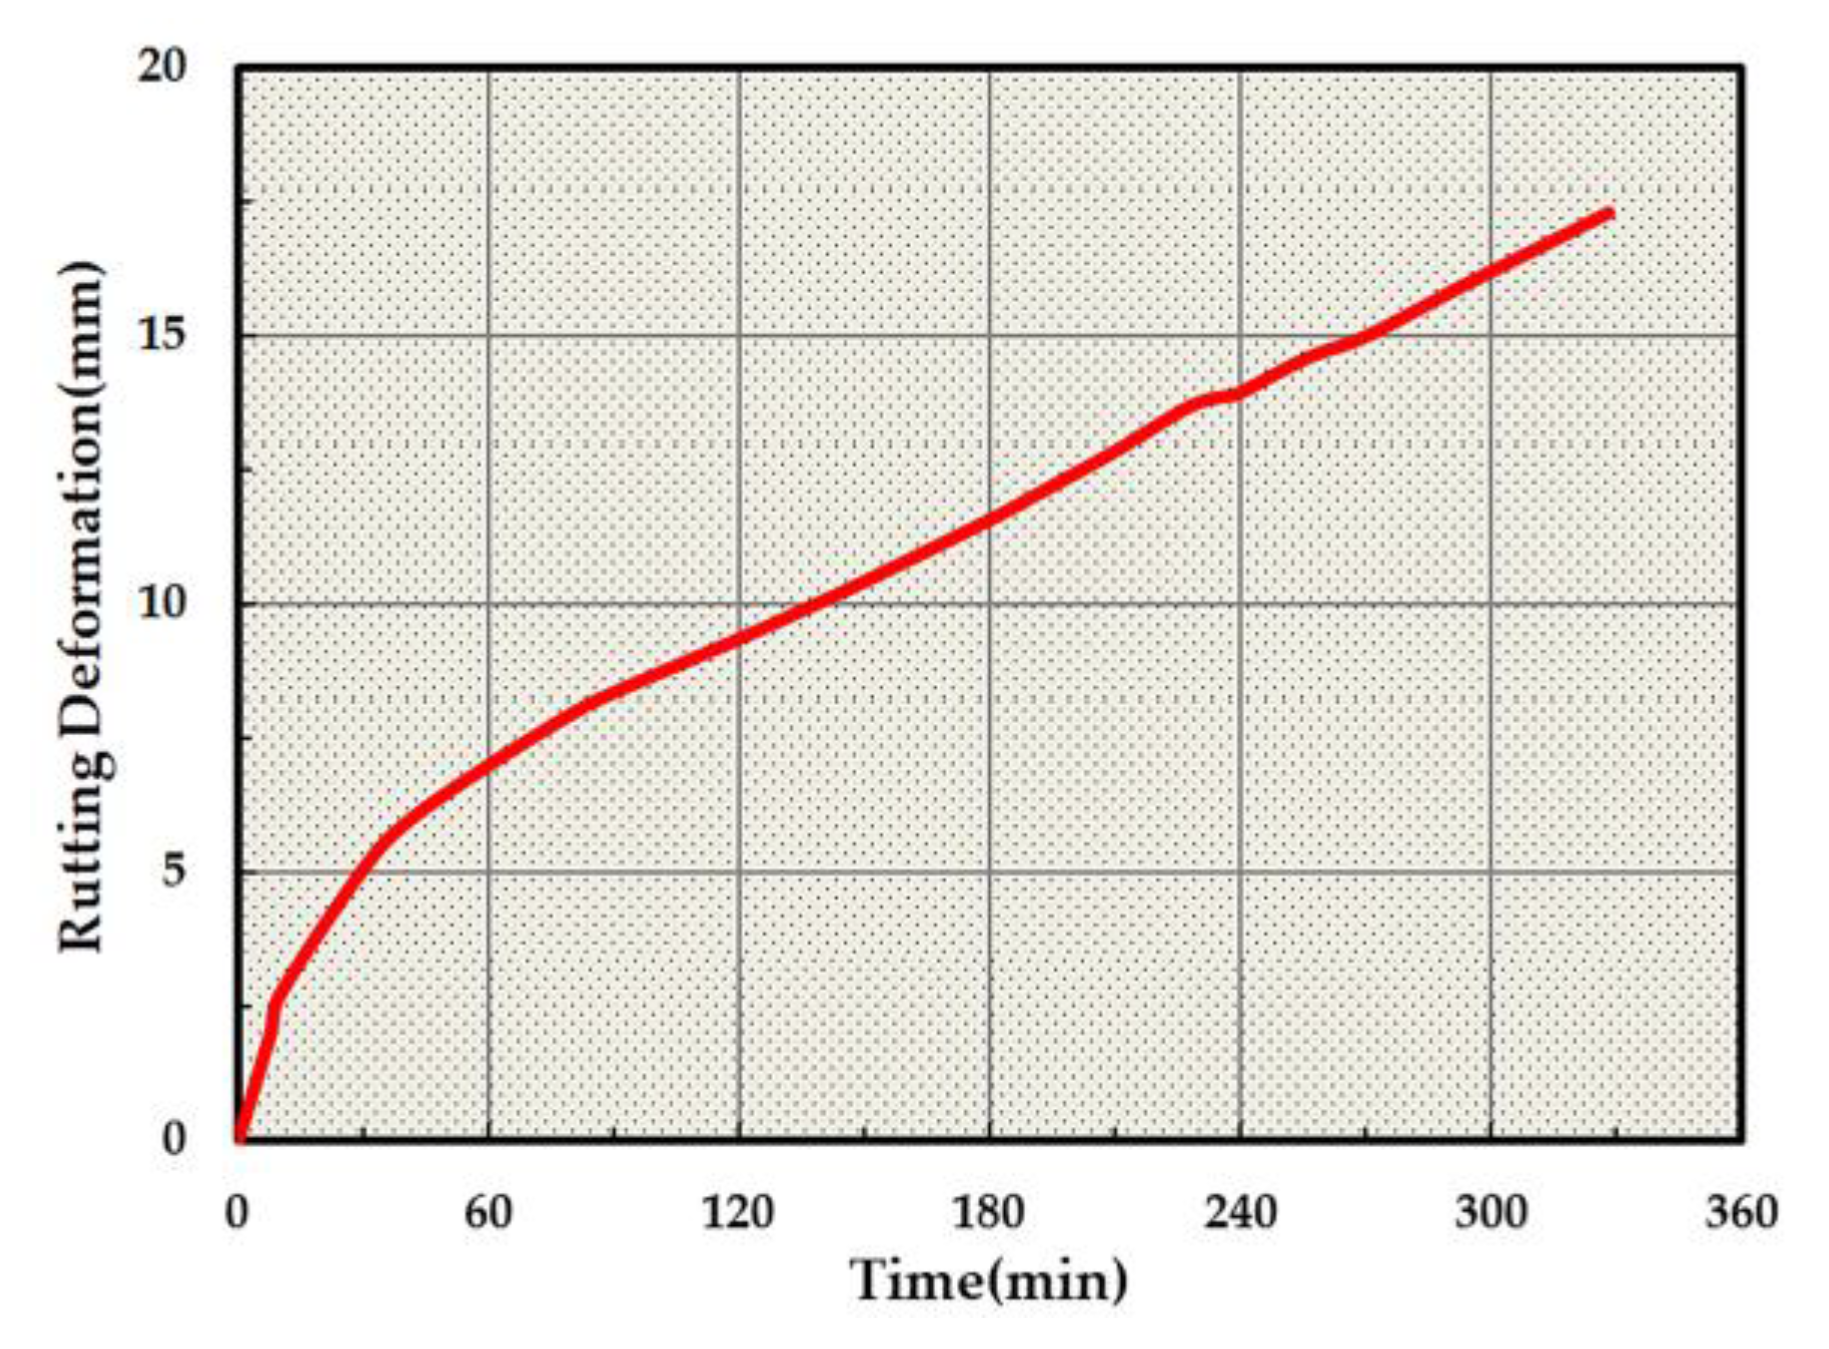
- Compared with the existing laboratory experiments, the RSCT test has a uniform deformation and a low deformation rate, showing a more practical and accurate test method for testing rut performance. The RSCT test can thus be widely used.
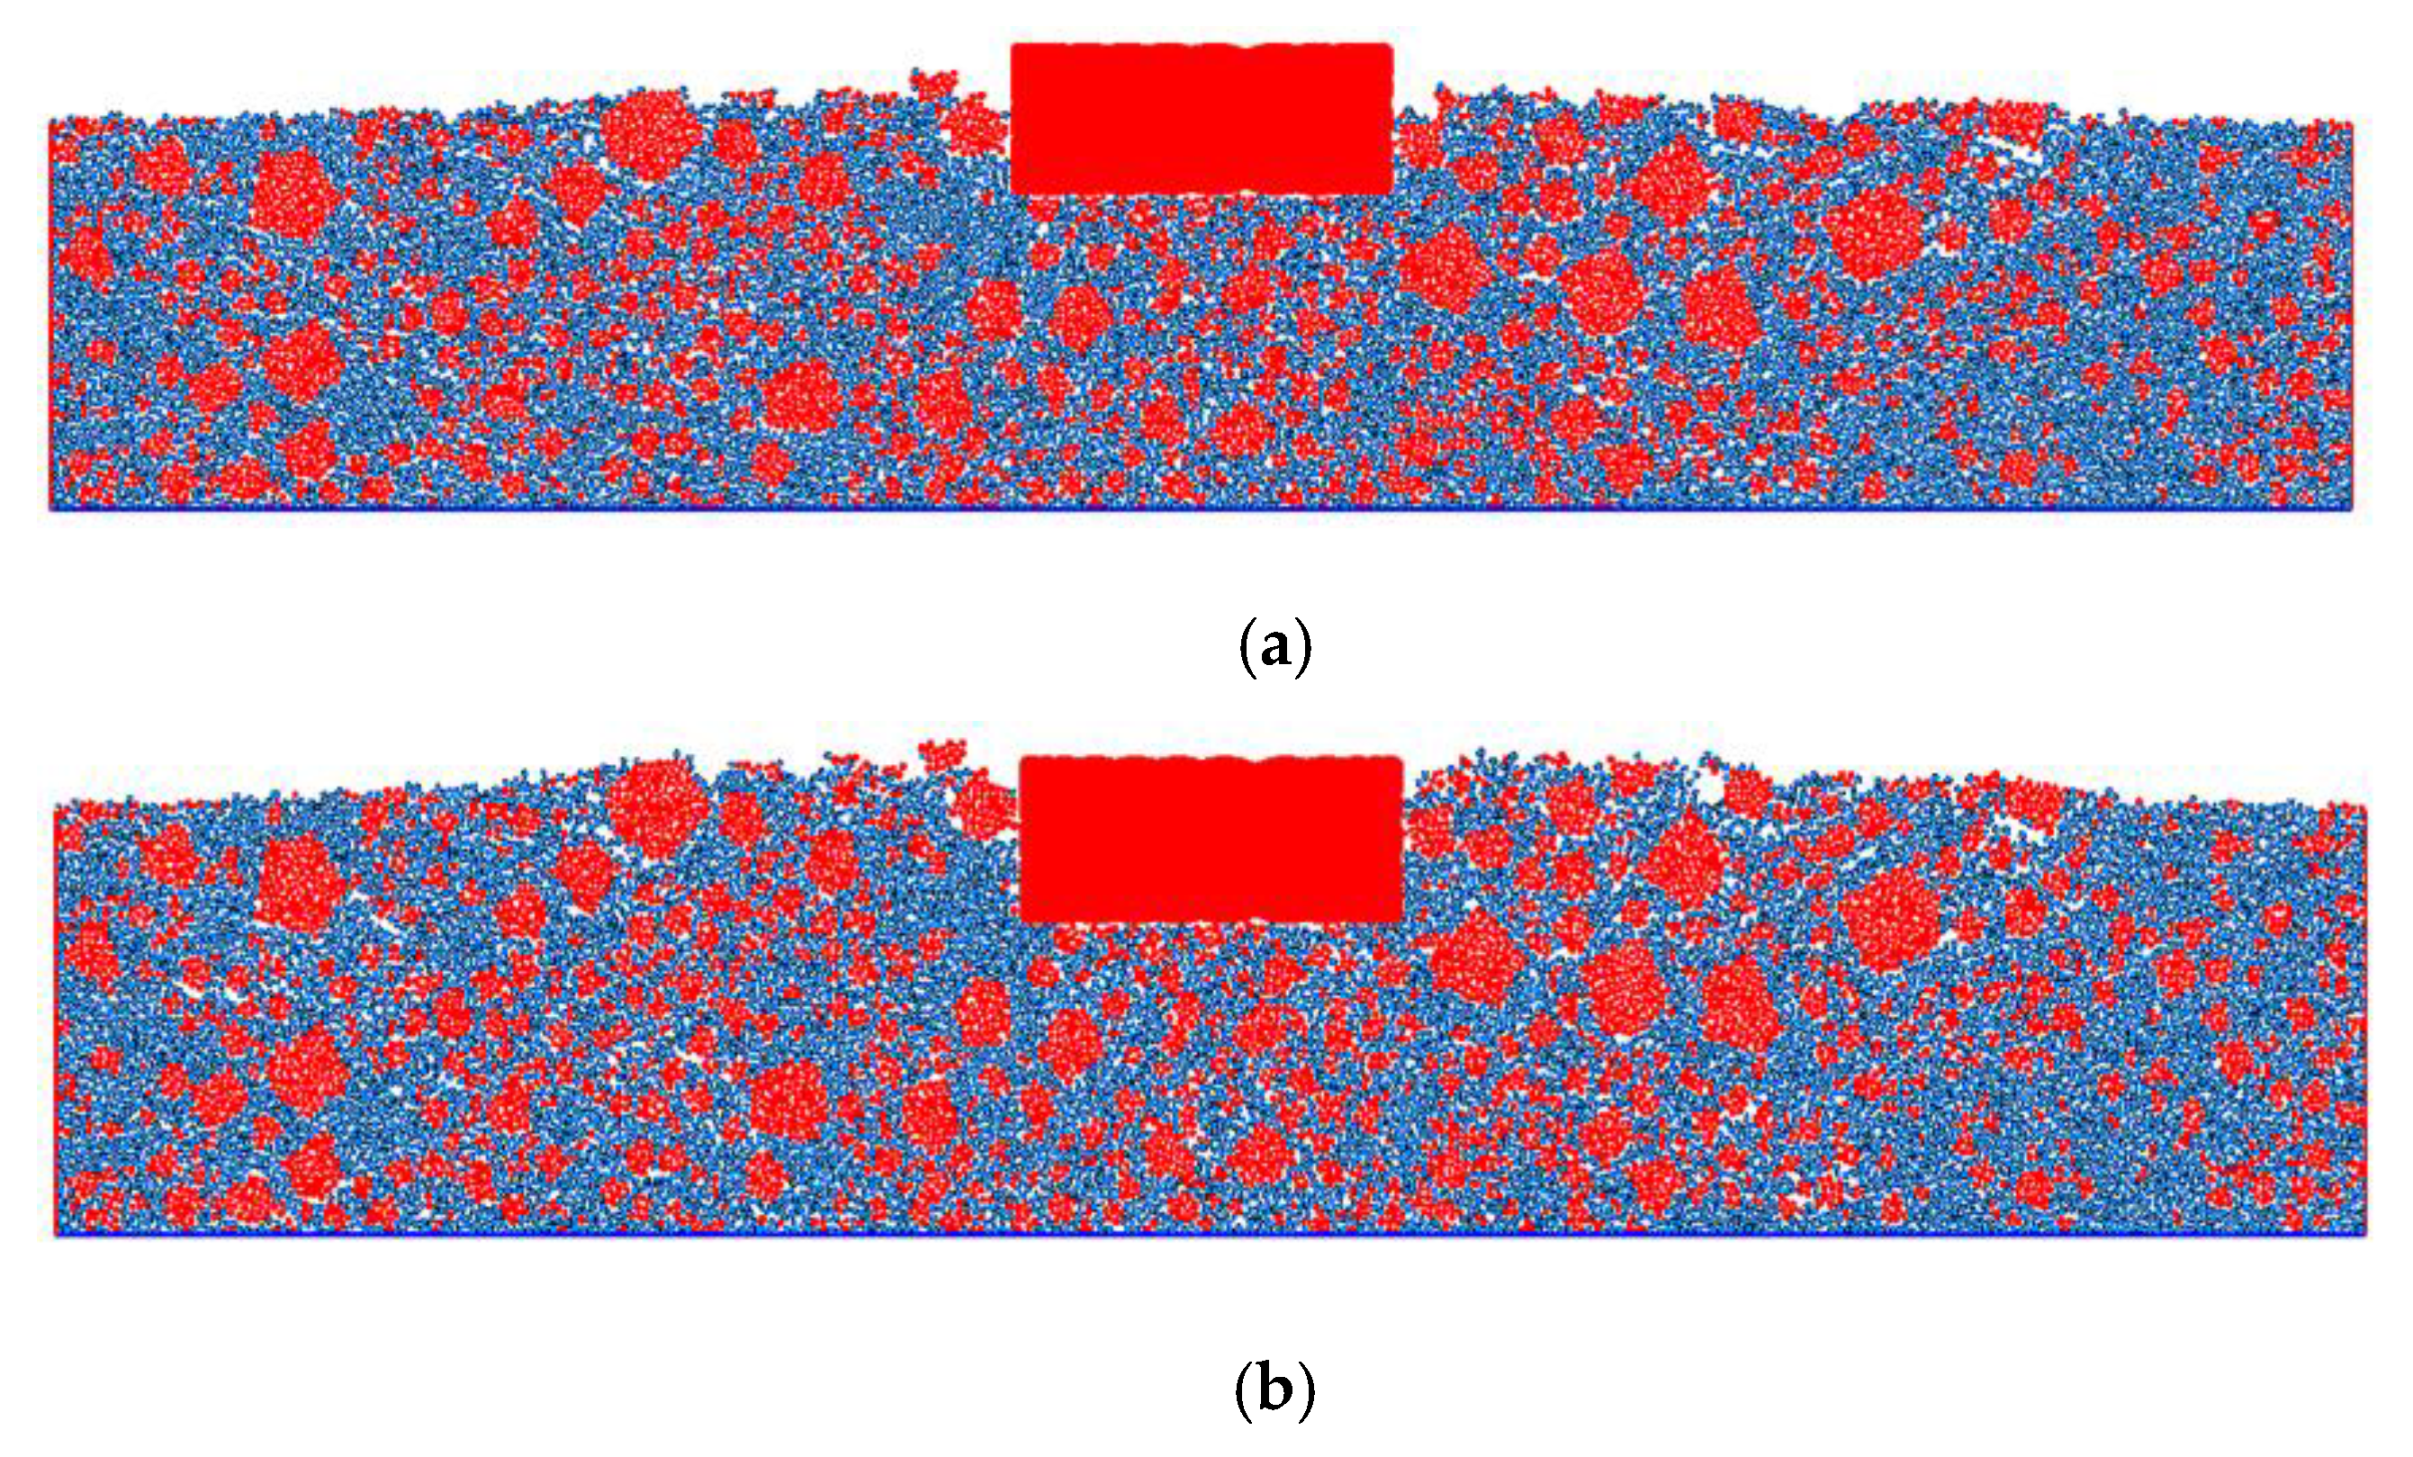
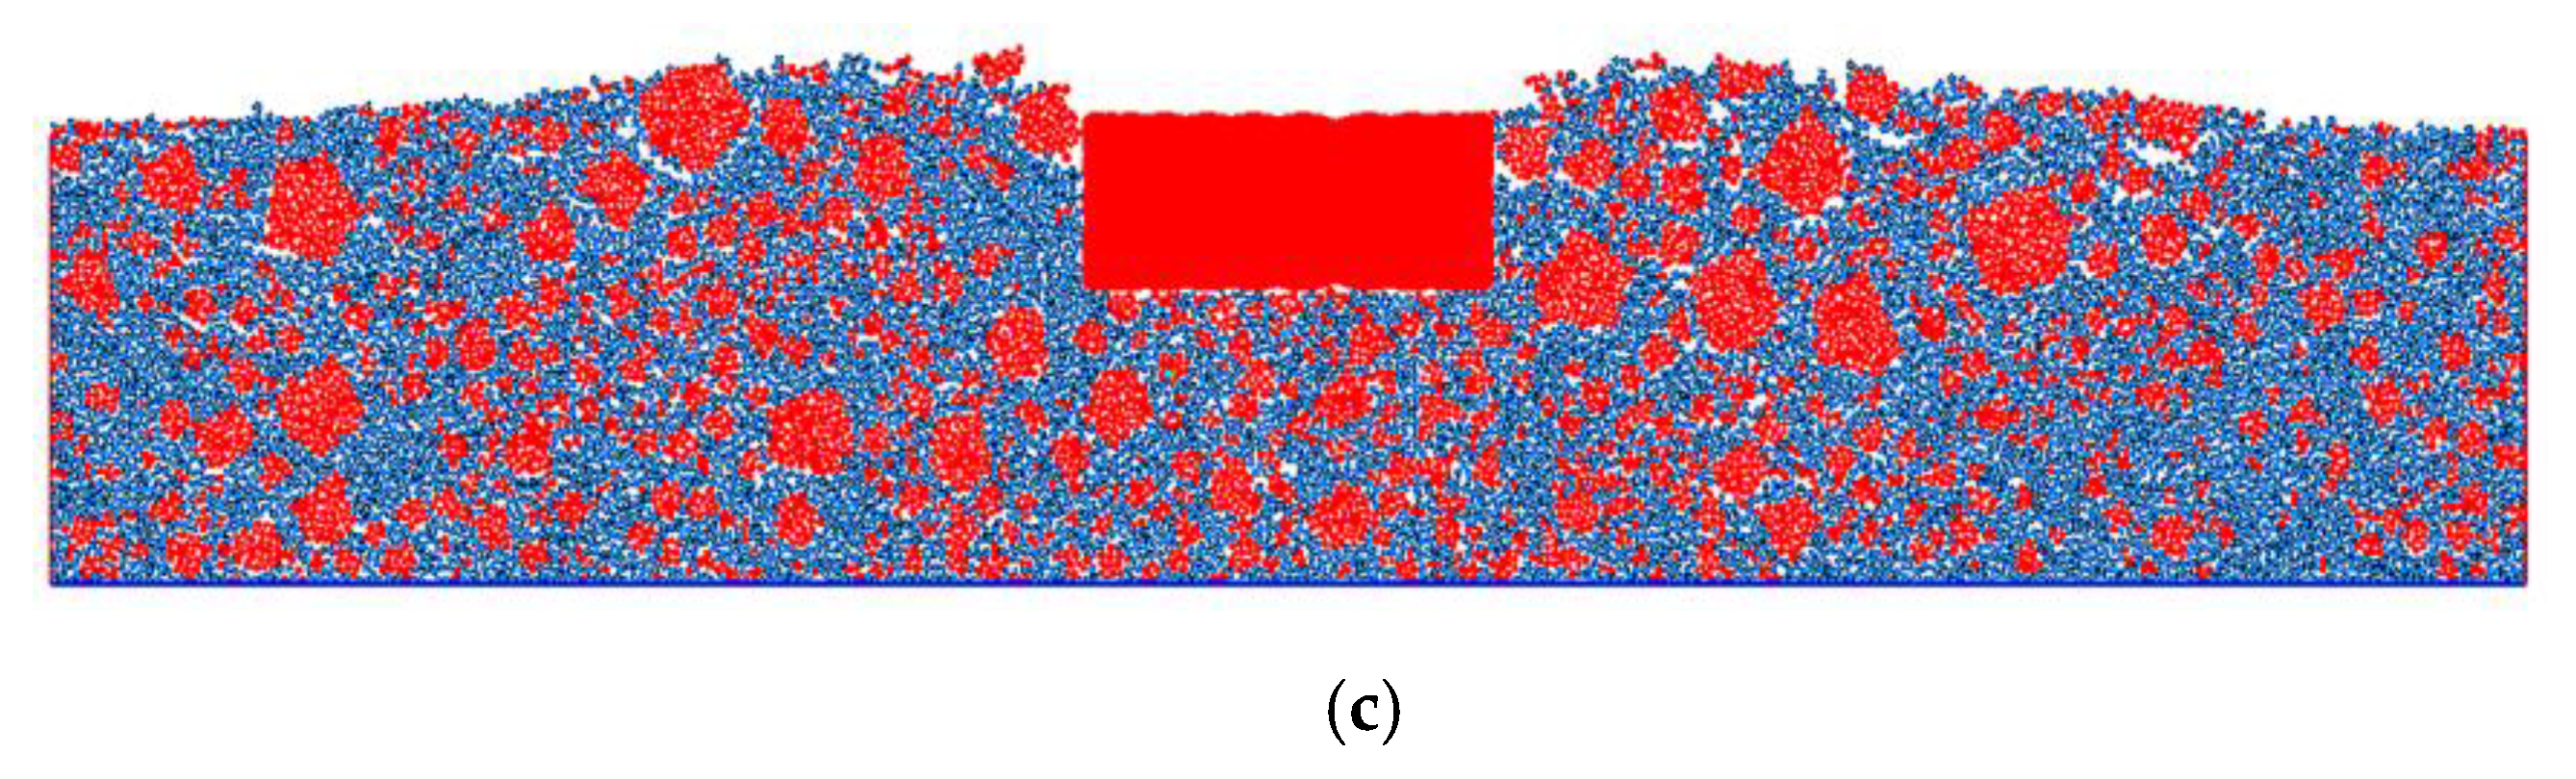
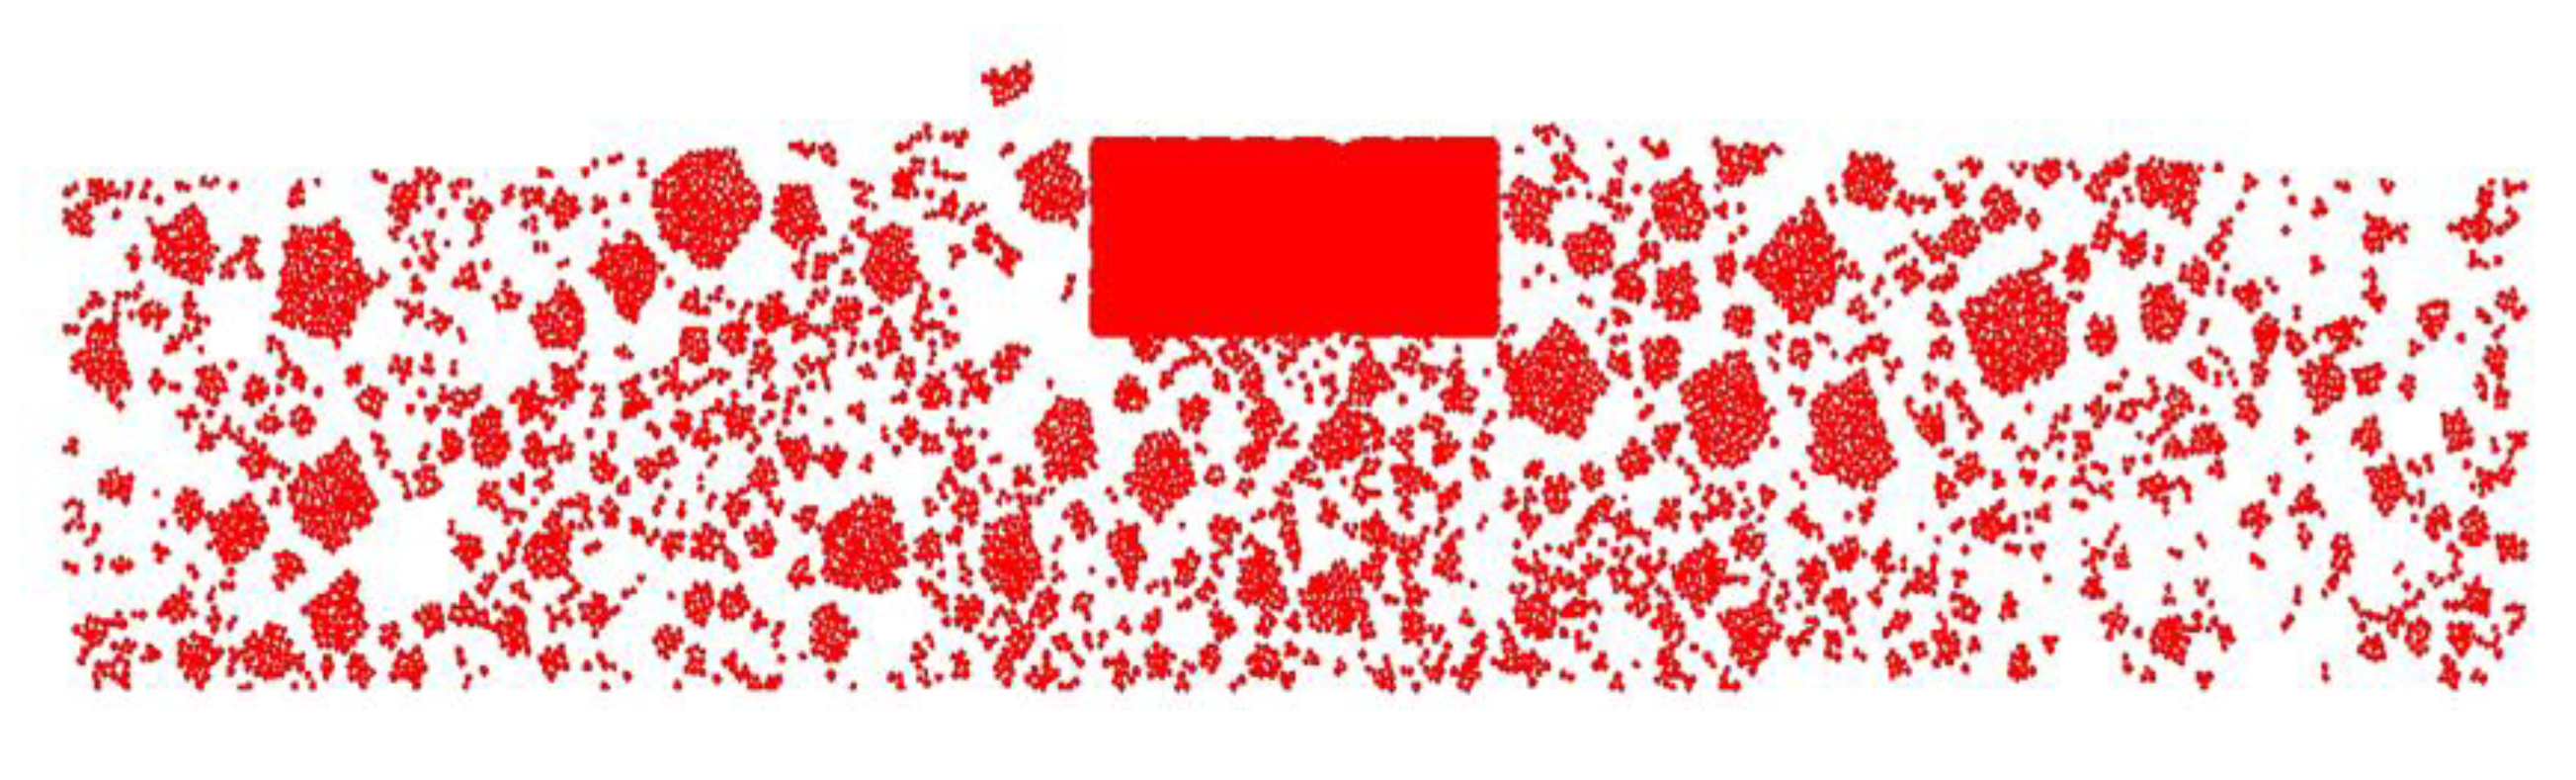
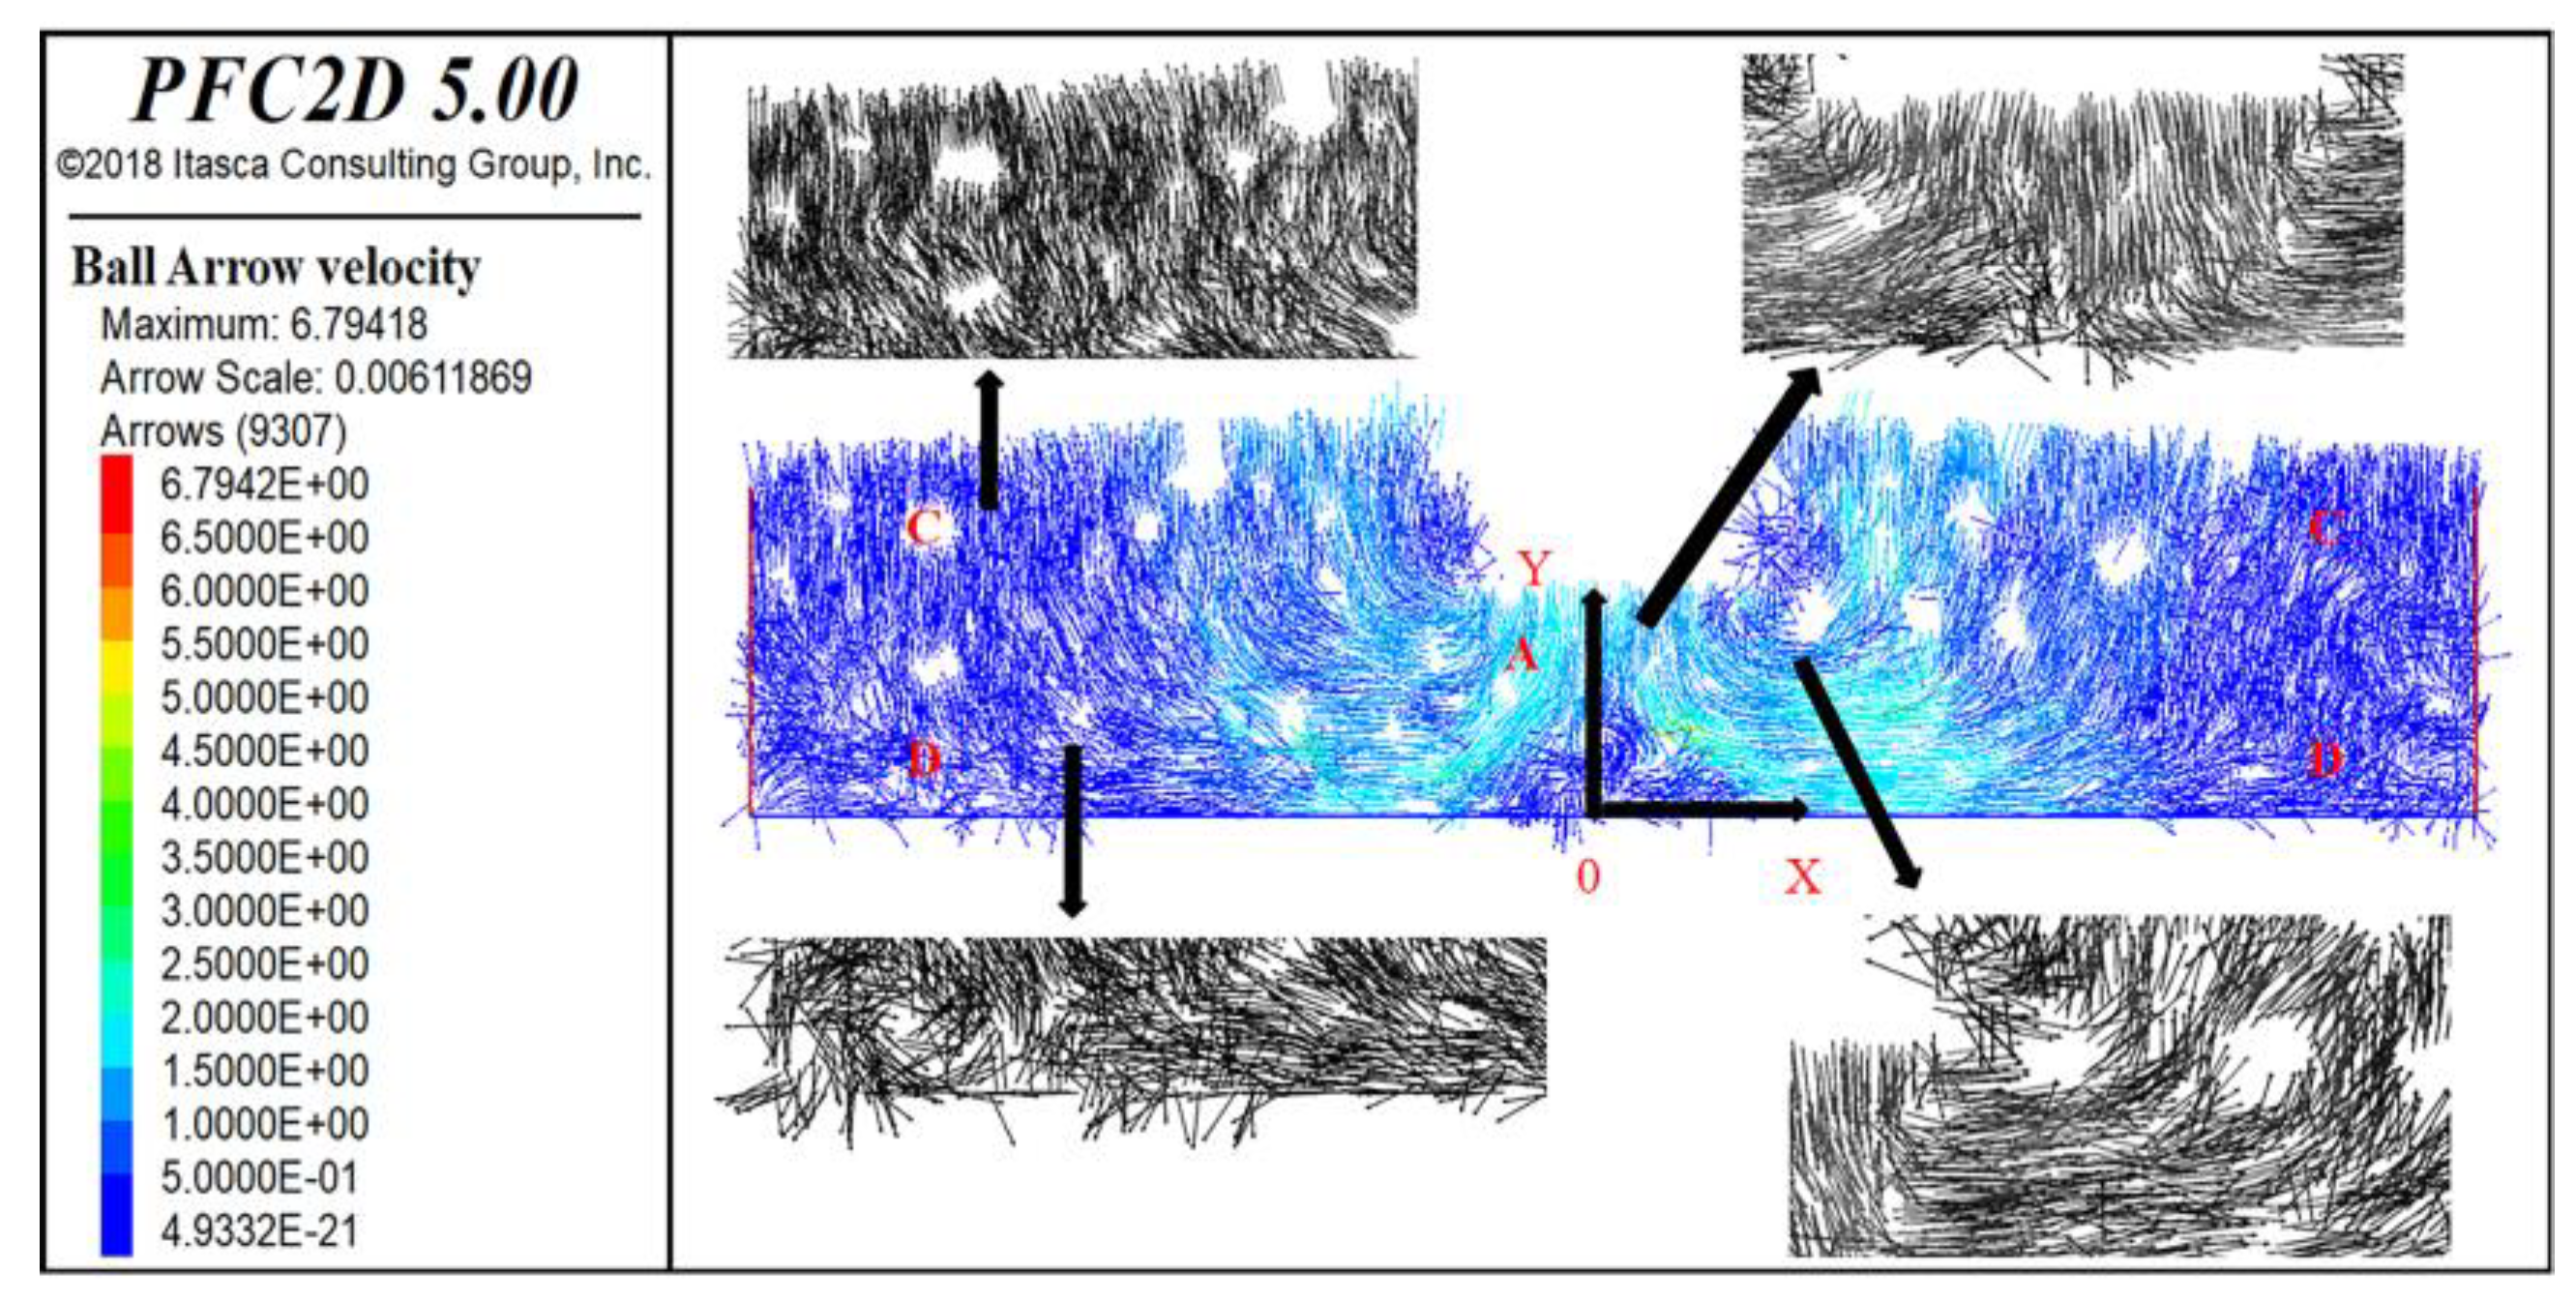
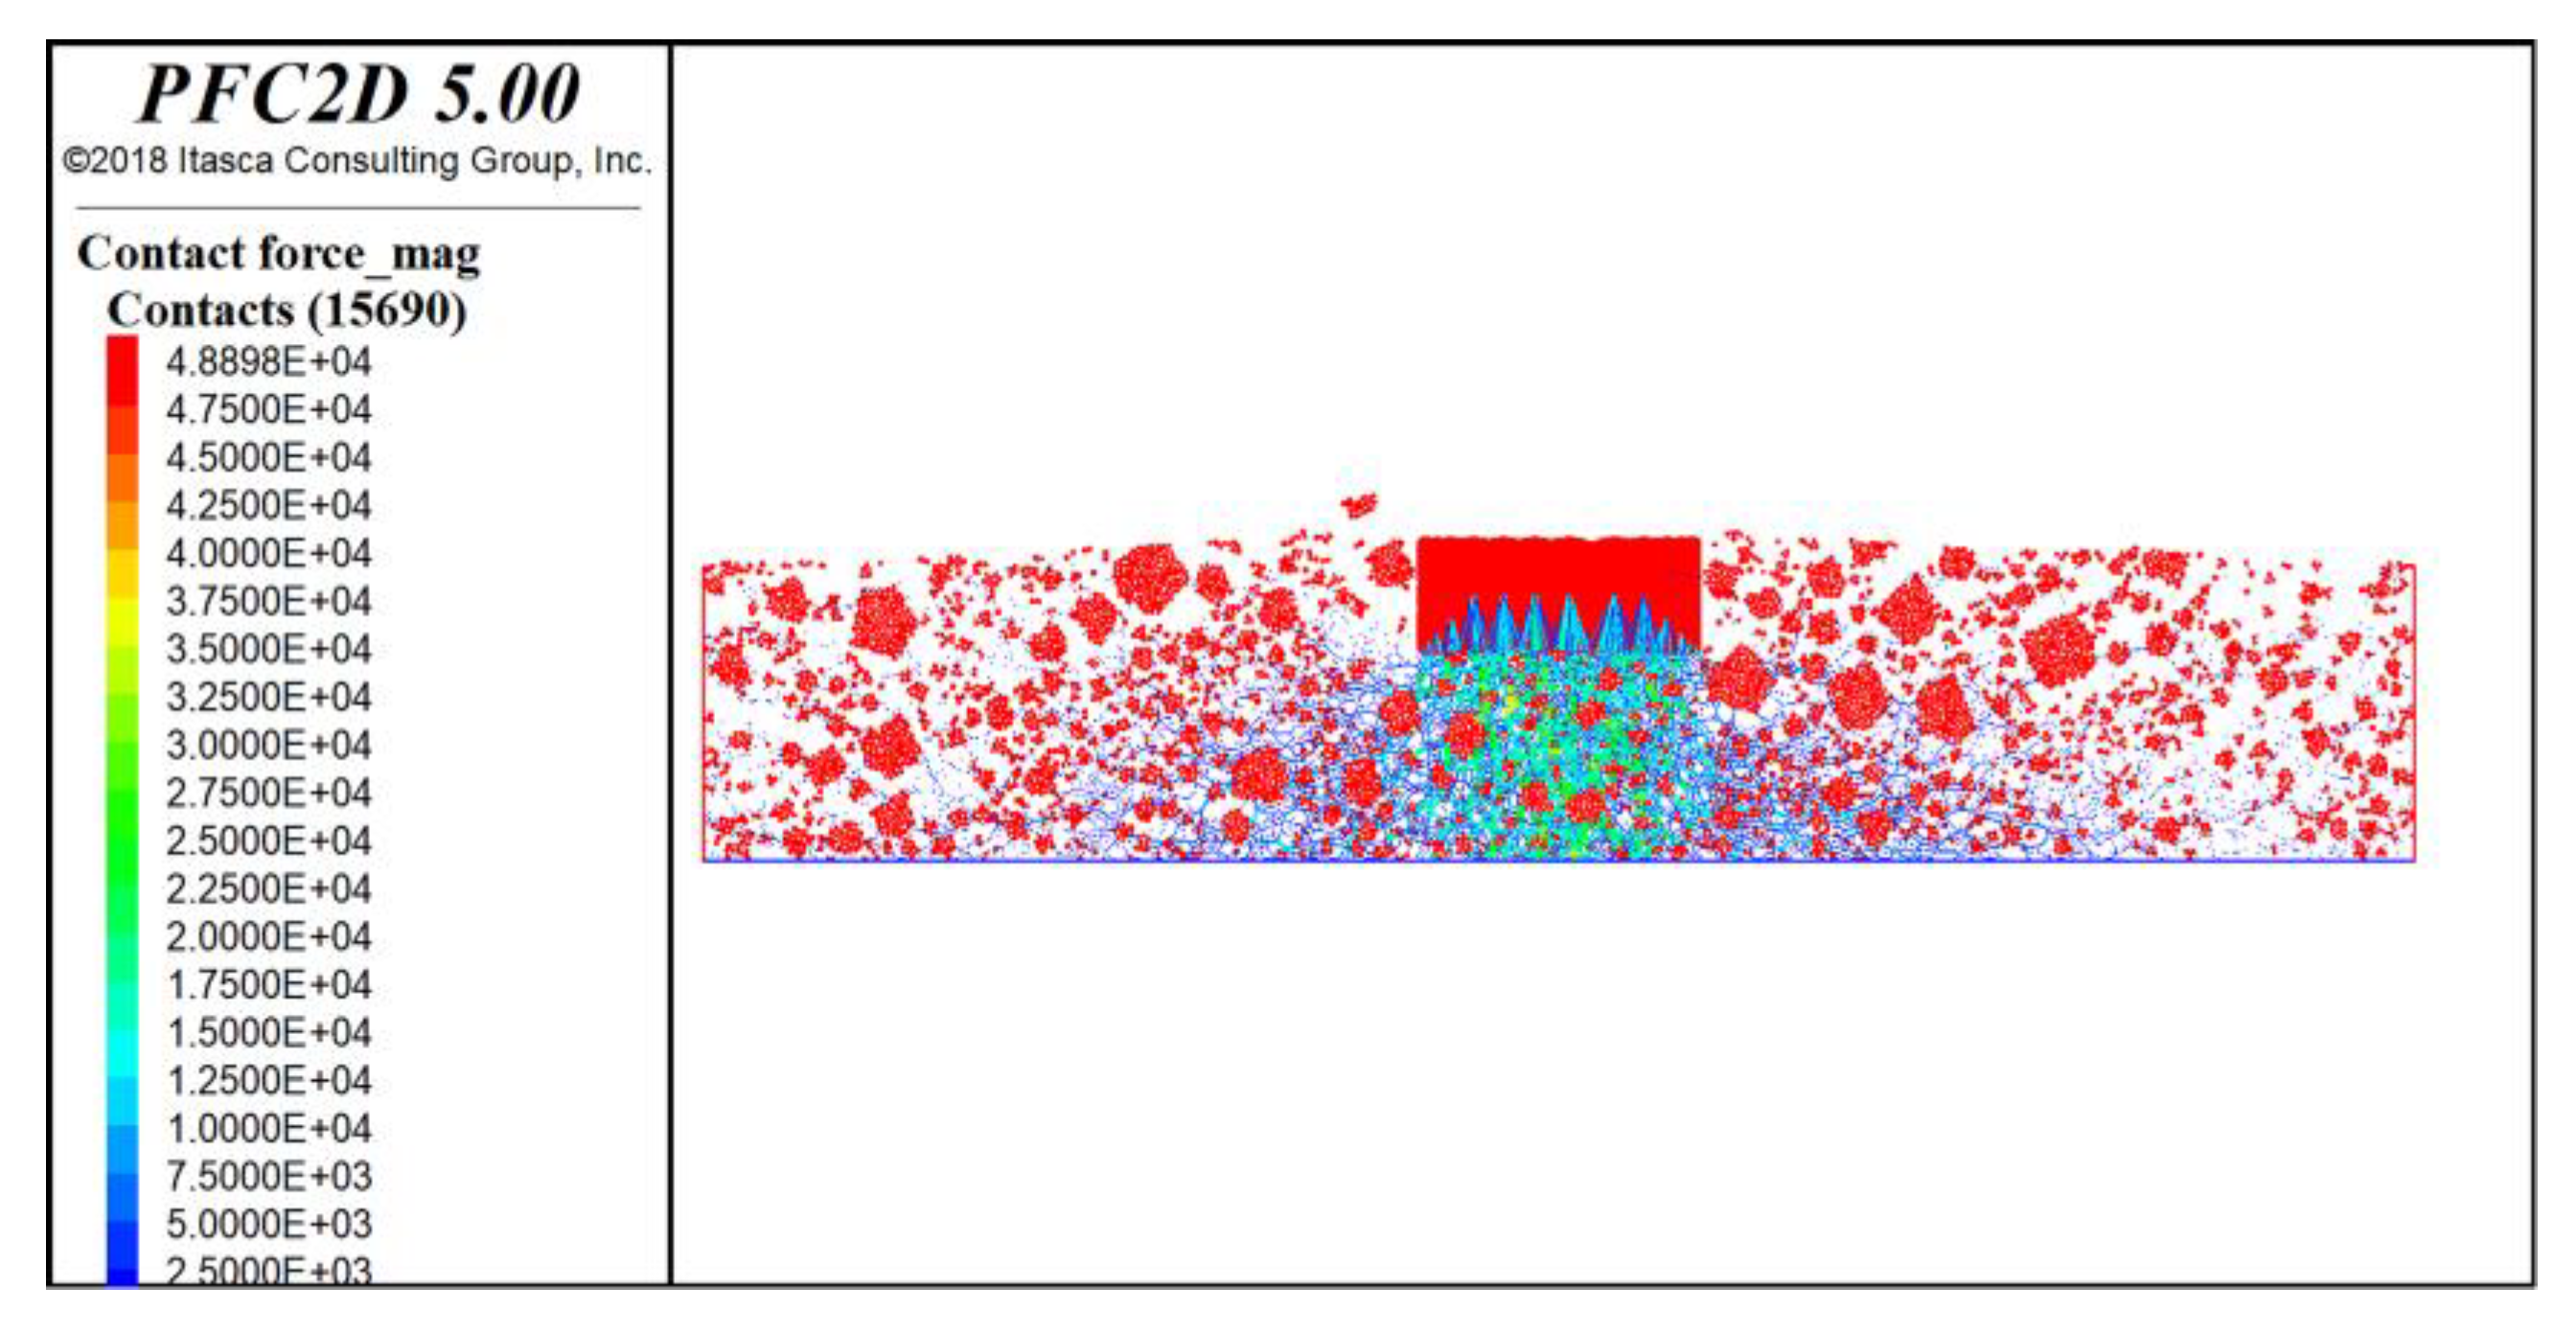
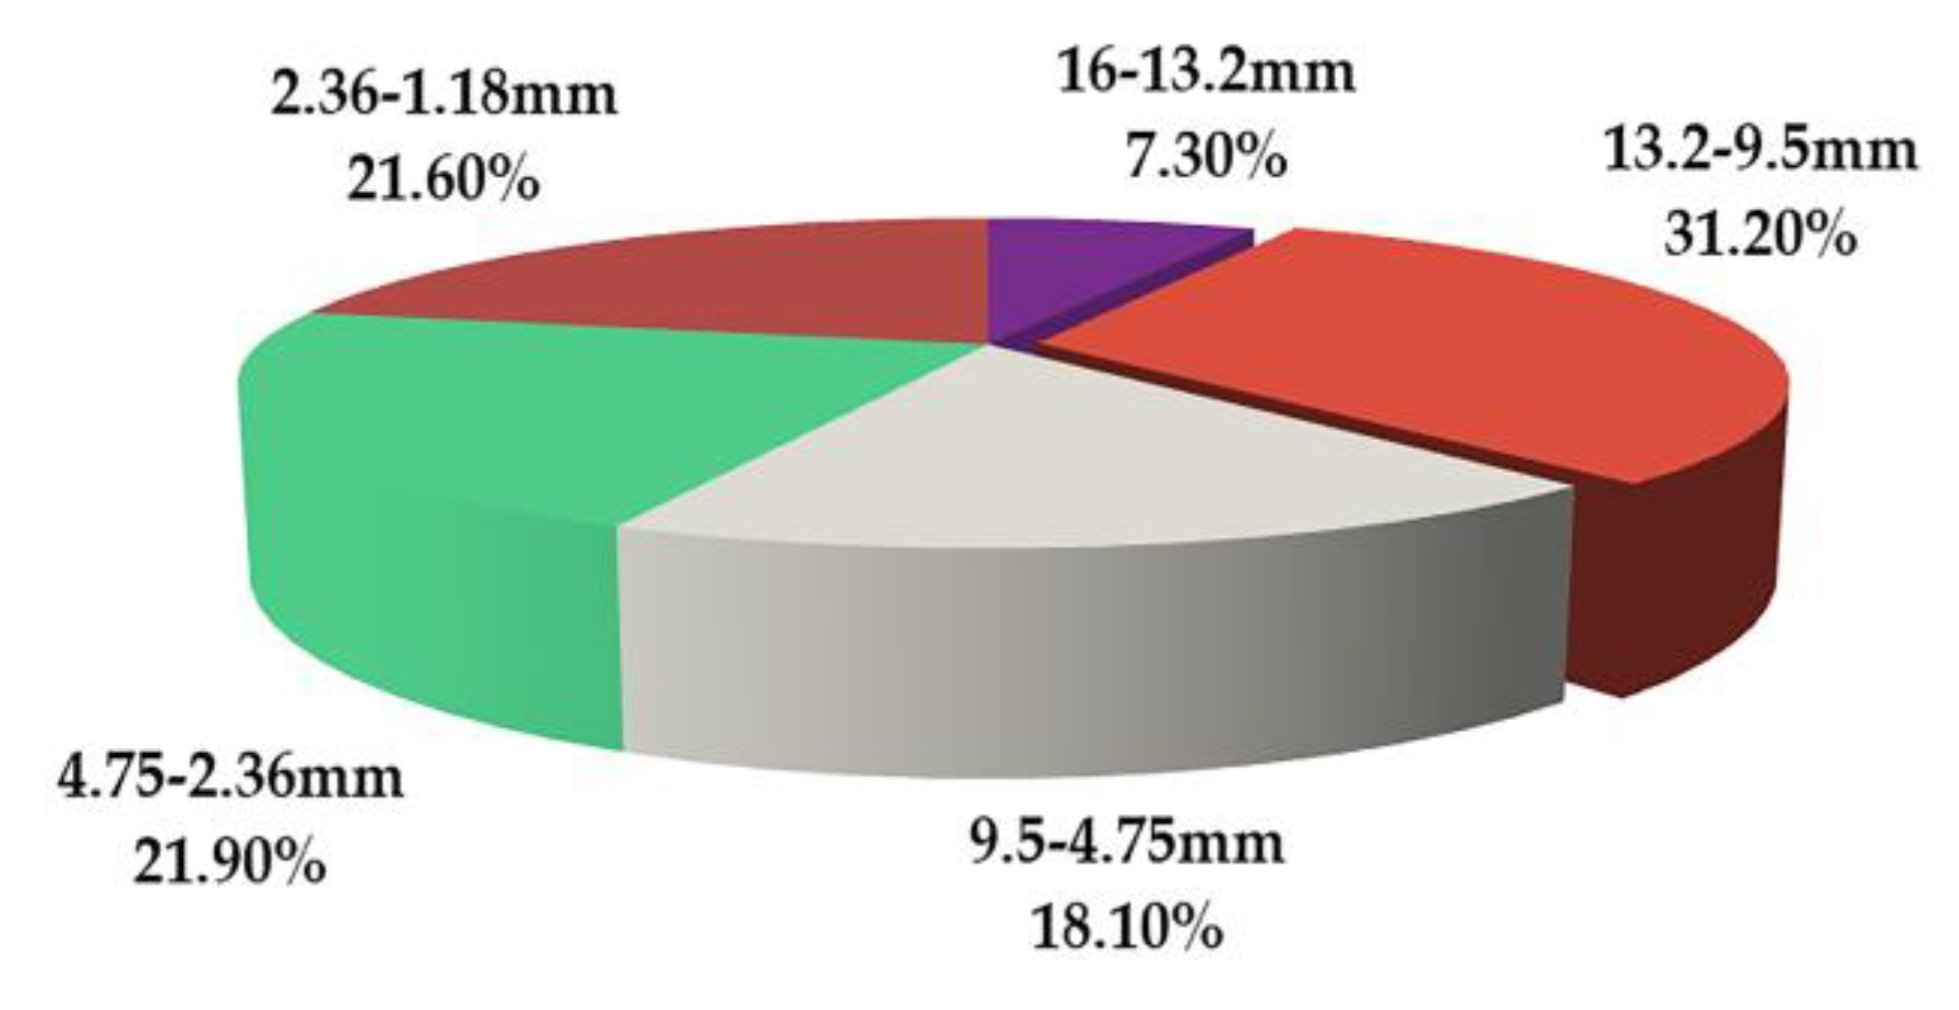
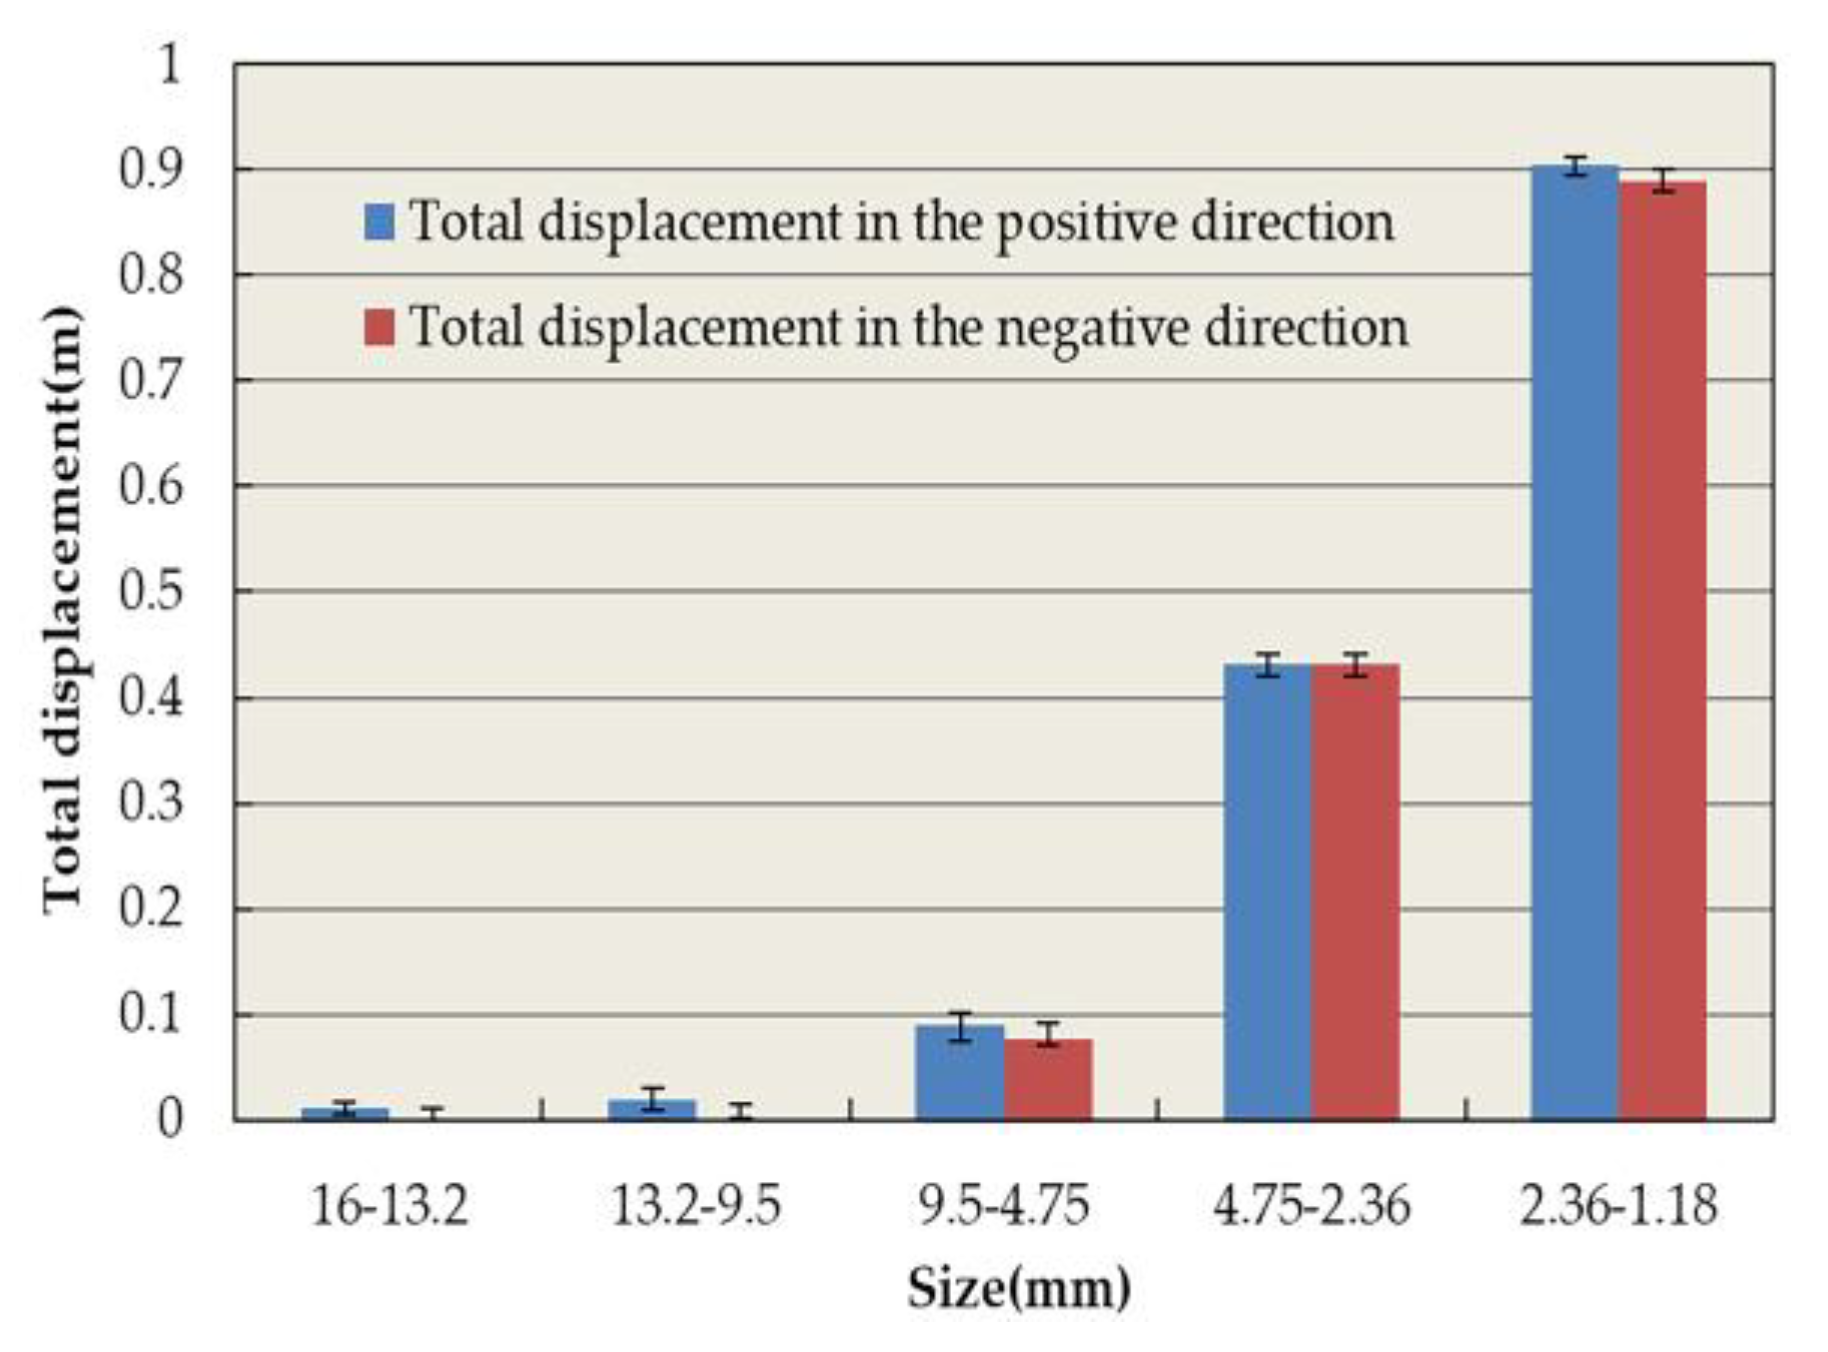
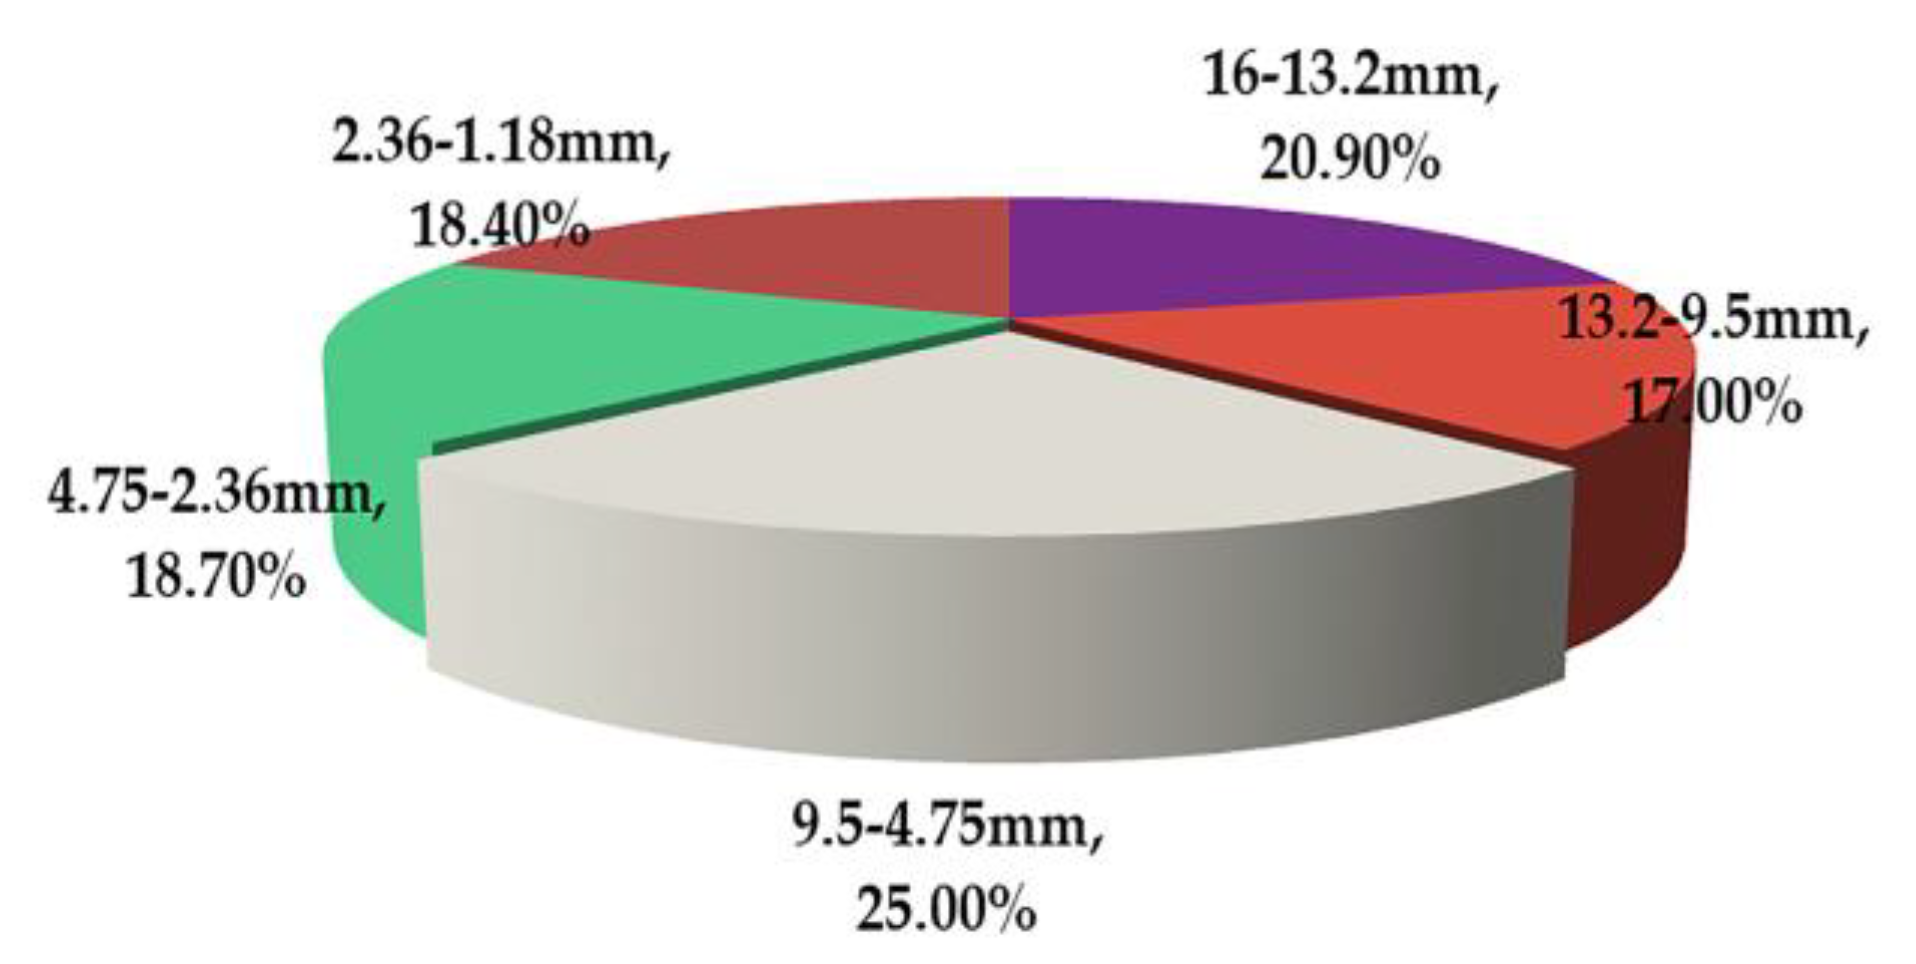
- A virtual numerical simulation test is established according to the RSCT test. The validity of the virtual rutting test using an irregular pentagon as the aggregate shape is verified. The micromechanical responses show that all mixtures within the stress range possessed a tension for displacement. The contact force and displacement of particles in the loading area were the largest and gradually diffused to the surrounding area.
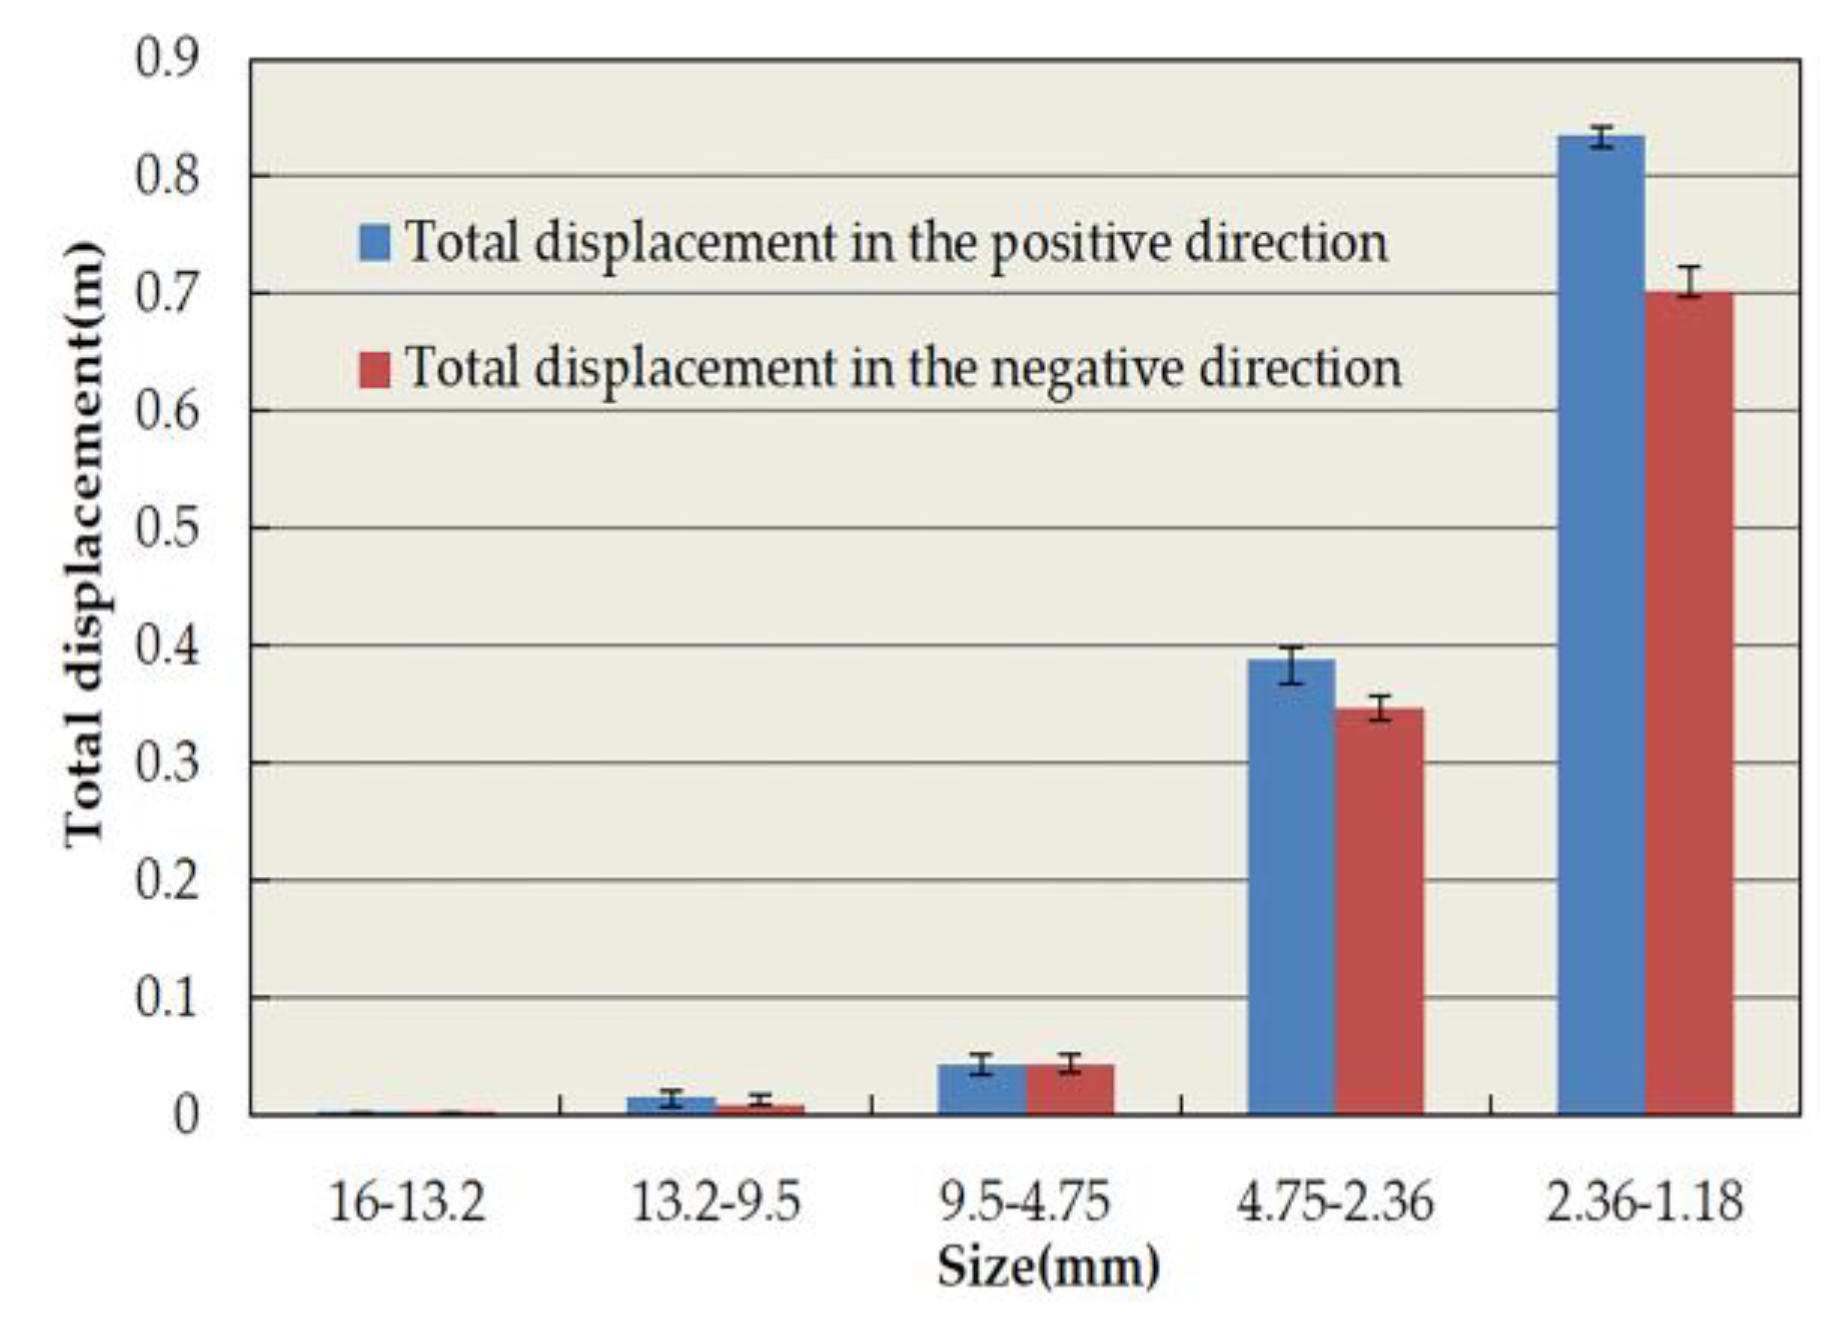
- The asphalt mastic extruded by the displacement of aggregates demonstrated its rheological behavior, mainly resulting in the formation of rutting. The CR index shows that 4.75–9.5 mm aggregates make the largest contribution to rutting deformation. Special attention should be given to these aggregate amounts in the design of mixture grading.
Author Contributions
Funding
Acknowledgments
Conflicts of Interest
References
- Luo, S.; Liu, Z.M.; Yang, X.; Lu, Q.; Yin, J. Construction technology of warm and hot mix epoxy asphalt paving for long-span steel bridge. J. Constr. Eng. Manag. 2019, 145, 04019074. [Google Scholar] [CrossRef]
- Yuan, J.; Wang, J.Y.; Xiao, F.P.; Amirkhanian, S.; Wang, J.; Xu, Z.Z. Impacts of multiple-polymer components on high temperature performance characteristics of airfield modified binders. Constr. Build. Mater. 2017, 134, 694–702. [Google Scholar] [CrossRef]
- Özen, H.; Aksoy, A.; Tayfur, S.; Çelik, F. Laboratory performance comparison of the elastomer-modified asphalt mixtures. Build. Environ. 2008, 43, 1270–1277. [Google Scholar] [CrossRef]
- Pasetto, M.; Nicola, B. Unified approach to fatigue study of high performance recycled asphalt concretes. Mater. Struct. 2017, 50, 113. [Google Scholar] [CrossRef]
- Guo, W.; Guo, X.D.; Chang, M.Y.; Dai, W.T. Evaluating the effect of hydrophobic nanosilica on the viscoelasticity property of asphalt and asphalt mixture. Materials 2018, 11, 2328. [Google Scholar] [CrossRef]
- Mousavinezhad, S.H.; Shafabakhsh, G.H.; Jafari Ani, O. Nano-clay and styrene-butadiene-styrene modified bitumen for improvement of rutting performance in asphalt mixtures containing steel slag aggregates. Constr. Build. Mater. 2019, 226, 793–801. [Google Scholar] [CrossRef]
- Dong, Z.J.; Tan, Y.Q.; Cao, L.P.; Li, S.L. Rutting mechanism analysis of heavy-duty asphalt pavement based on pavement survey, finite element simulation, and instrumentation. J. Test. Eval. 2012, 40, 1228–1237. [Google Scholar] [CrossRef]
- Ghanoon, S.A.; Tanzadeh, J. Laboratory evaluation of nano-silica modification on rutting resistance of asphalt Binder. Constr. Build. Mater. 2019, 223, 1074–1082. [Google Scholar] [CrossRef]
- Du, Y.F.; Chen, J.Q.; Han, Z.; Liu, W.Z. A review on solutions for improving rutting resistance of asphalt pavement and test methods. Constr. Build. Mater. 2018, 168, 893–905. [Google Scholar] [CrossRef]
- Vargas-Nordcbeck, A.; Timm, D.H. Rutting characterization of warm mix asphalt and high RAP mixtures. Road Mater. Pavement Des. 2012, 13, 1–20. [Google Scholar] [CrossRef]
- Chu, C.Y.; Durango-Cohen, P.L. Incorporating maintenance effectiveness in the estimation of dynamic infrastructure performance models. Comput. Aided Civ. Infrastruct. Eng. 2008, 23, 174–188. [Google Scholar] [CrossRef]
- Rodezno, M.C.; West, R.; Taylor, A. Flow number test and assessment of AASHTO TP 79-13 rutting criteria: Comparison of rutting performance of hot-mix and warm-mix asphalt mixtures. Transp. Res. Rec. 2015, 2507, 100–107. [Google Scholar] [CrossRef]
- Zaumanis, M.; Arraigada, M.; Wyss, S.A.; Zeyer, K.; Cavalli, M.C.; Poulikakos, L.D. Performance-based design of 100% recycled hot-mix asphalt and validation using traffic load simulator. J. Clean. Prod. 2019, 237, 117679. [Google Scholar] [CrossRef]
- Pires, P.M.; Sudo Lutif Teixeira, J.E.; Nepomuceno, D.V.; Furieri, E.C. Laboratory and field evaluation of KR slag–stabilized soil for paving applications. J. Mater. Civ. Eng. 2019, 31, 04019182. [Google Scholar] [CrossRef]
- Huang, Y.C.; Wang, L.B.; Xiong, H.C. Evaluation of pavement response and performance under different scales of APT facilities. Road Mater. Pavement Des. 2017, 18, 159–169. [Google Scholar] [CrossRef]
- Lv, Q.; Huang, W.D.; Sadek, H.; Xiao, F.P.; Yan, C.Q. Investigation of the rutting performance of various modified asphalt mixtures using the Hamburg Wheel-Tracking Device test and Multiple Stress Creep Recovery test. Constr. Build. Mater. 2019, 206, 62–70. [Google Scholar] [CrossRef]
- Dong, N.; Ni, F.; Zhou, L.; Ma, X. Comparison of the Hamburg, indirect tensile, and multi-sequenced repeated load tests for evaluation of HMA rutting resistance. Constr. Build. Mater. 2019, 216, 588–598. [Google Scholar] [CrossRef]
- Morea, F.; Zerbino, R. Wheel tracking test (WTT) conducted under different standards. Study and correlation of test parameters and limits. Mater. Struct. 2015, 48, 4019–4028. [Google Scholar] [CrossRef]
- Mirhosseini, A.F.; Tahami, S.A.; Hoff, I.; Dessouky, S.; Ho, C.H. Performance evaluation of asphalt mixtures containing high-RAP binder content and bio-oil rejuvenator. Constr. Build. Mater. 2019, 227, 116465. [Google Scholar] [CrossRef]
- Chen, J.; Huang, B.; Shu, X.; Hu, C. DEM simulation of laboratory compaction of asphalt mixtures using an open source code. J. Mater. Civ. Eng. 2015, 27, 04014130. [Google Scholar] [CrossRef]
- Huang, K.; Xu, T.; Li, G.; Jiang, R. The feasibility of DEM to analyze the temperature field of asphalt mixture. Constr. Build. Mater. 2016, 106, 592–599. [Google Scholar] [CrossRef]
- Zhang, K.; Muhunthan, B. Numerical investigation of dry and wet mixing processes of asphalt mixtures containing reclaimed asphalt pavement. Road Mater. Pavement Des. 2019, 20, 914–928. [Google Scholar] [CrossRef]
- Itasca Consulting Group. PFC2D Version 4.0; Itasca Consulting Group: Minneapolis, MN, USA, 2008. [Google Scholar]
- Itasca Consulting Group. PFC3D Version 4.0; Itasca Consulting Group: Minneapolis, MN, USA, 2008. [Google Scholar]
- Liu, Y.; Zhou, X.D.; You, Z.P.; Yao, S.; Gong, F.Y.; Wang, H.N. Discrete element modeling of realistic particle shapes in stone-based mixtures through MATLAB-based imaging process. Constr. Build. Mater. 2017, 143, 169–178. [Google Scholar] [CrossRef]
- Li, X.L.; Lv, X.C.; Liu, X.Y.; Ye, J.H. Discrete element analysis of indirect tensile fatigue test of asphalt mixture. Appl. Sci. 2019, 9, 327. [Google Scholar] [CrossRef]
- Papagiannakis, A.T.; Zelelew, H.M.; Mahmoud, E. Simulation of asphalt concrete plastic deformation behavior. J. Mater. Civ. Eng. 2018, 30, 04018025. [Google Scholar] [CrossRef]
- Yong, P.; Wan, L.; Sun, L.J. Three-dimensional discrete element modelling of influence factors of indirect tensile strength of asphalt mixtures. Int. J. Pavement Eng. 2019, 20, 724–733. [Google Scholar]
- Zhou, C.; Zhang, M.; Li, Y.; Lu, J.; Chen, J. Influence of particle shape on aggregate mixture’s performance: DEM results. Road Mater. Pavement Des. 2019, 20, 399–413. [Google Scholar] [CrossRef]
- Guo, W.; Guo, X.D.; Chen, X.; Li, Y.S.; Li, Z.; Dai, W.T. Aggregate-bitumen interface enhancement mechanism of utilization of oil shale waste as fine aggregate in open grade friction course. Coatings 2019, 9, 637. [Google Scholar] [CrossRef]
- Peng, Y.; Bao, J.X. Micromechanical analysis of asphalt-mixture shear strength using the three-dimensional discrete element method. J. Mater. Civ. Eng. 2018, 30, 04018302. [Google Scholar] [CrossRef]
- American Association of State Highway and Transportation Officials. AASHTO Guide for Design of Pavement Structures; AASHTO: Washington, DC, USA, 1993; pp. 94–136. [Google Scholar]
- Wu, W.L.; Tu, Z.X.; Zhu, Z.H.; Zhang, Z.Y.; Lin, Y.J. Effect of gradation segregation on mechanical properties of an asphalt mixture. Appl. Sci. 2019, 9, 308. [Google Scholar] [CrossRef]
- Ma, T.; Zhang, D.Y.; Zhang, Y. Microstructure modeling and virtual test of asphalt mixture based on three-dimensional discrete element method. J. Cent. South. Univ. 2016, 23, 1525–1534. [Google Scholar] [CrossRef]
- Xue, B.; Pei, J.Z.; Zhou, B.C.; Zhang, J.P.; Li, R.; Guo, F.C. Using random heterogeneous DEM model to simulate the SCB fracture behavior of asphalt concrete. Constr. Build. Mater. 2020, 236, 117580. [Google Scholar] [CrossRef]
- Chang, M.Y. Research on Viscoelasticity of Vilane Vilica Modified Asphalt and its Mixture. Master’s Thesis, Jilin University, Changchun, China, 2018. [Google Scholar]
- Cheng, Y.C.; Li, H.; Li, L.D.; Zhang, Y.W.; Wang, H.T.; Bai, Y.S. Viscoelastic properties of asphalt mixtures with different modifiers at different temperatures based on static creep tests. Appl. Sci. 2019, 9, 4246. [Google Scholar] [CrossRef]
- Cheng, Y.C.; Chai, C.; Liang, C.Y.; Chen, Y. Mechanical performance of warm-mixed porous asphalt mixture with steel slag and crumb-eubber-SBS modified bitumen for seasonal frozen regions. Materials 2019, 12, 857. [Google Scholar] [CrossRef]
- You, Z.P.; Buttlar, W.G. Discrete element modeling to predict the modulus of asphalt concrete mixtures. J. Mater. Civ. Eng. 2004, 16, 140–146. [Google Scholar] [CrossRef]
- Liu, Y.; Dai, Q.L.; You, Z.P. Viscoelastic model for discrete element simulation of asphalt mixtures. J. Eng. Mech. 2009, 135, 324–333. [Google Scholar] [CrossRef]
- Jahangiri, B.; Majidifard, H.; Meister, J.; Buttlar, W.G. Performance evaluation of asphalt mixtures with reclaimed asphalt pavement and recycled asphalt shingles in missouri. Transp. Res. Rec. 2019, 2673, 392–403. [Google Scholar] [CrossRef]
- Wu, S.; Zhang, W.; Shen, S.; Muhunthan, B. Field performance of foaming warm mix asphalt pavement. Transp. Res. Rec. 2019, 673, 281–294. [Google Scholar] [CrossRef]
- Xu, O.M.; Wang, Z.J.; Wang, R. Effects of aggregate gradations and binder contents on engineering properties of cement emulsified asphalt mixtures. Constr. Build. Mater. 2017, 135, 632–640. [Google Scholar] [CrossRef]
- Garcia-Gil, L.; Miro, R.; Perez-Jimenez, F.E. Evaluating the role of aggregate gradation on cracking performance of asphalt concrete for thin overlays. Appl. Sci. 2019, 9, 628. [Google Scholar] [CrossRef]
- Liu, H.Y.; Hao, P.W.; Xu, J.Z. Effects of nominal maximum aggregate size on the performance of stone matrix asphalt. Appl. Sci. 2017, 7, 126. [Google Scholar] [CrossRef]
- Xin, J.Y.; Pei, J.Z.; Akiyama, M.; Li, R.; Zhang, J.P.; Shao, L.B. A study on the design method for the material composition of small particle-size asphalt mixture for controlling cracks in asphalt pavement. Appl. Sci. 2019, 9, 1988. [Google Scholar] [CrossRef]
- Zhao, Y.L.; Xu, T.; Huang, X.M.; Li, Z.D. Gradation design of the aggregate skeleton in asphalt mixture. J. Test. Eval. 2012, 40, 1071–1076. [Google Scholar] [CrossRef]
- Shi, L.W.; Wang, D.Y.; Wang, J.F.; Jiang, Z.H.; Liang, H.H.; Qin, X. A new method for designing dense skeleton asphalt mixture based on meso parameter. Adv. Civ. Eng. 2020, 2020, 3841291. [Google Scholar] [CrossRef]
- Chou, X.L.; Chegenizadeh, A.; Nikraz, H. Evaluation of stone mastic asphalt mix by the bailey method design. Aust. Geomech. J. 2016, 51, 105–112. [Google Scholar]
- Fang, M.J.; Park, D.; Singuranayo, J.L.; Chen, H.; Li, Y.G. Aggregate gradation theory, design and its impact on asphalt pavement performance: A review. Int. J. Pavement Eng. 2019, 20, 1408–1424. [Google Scholar] [CrossRef]
- Shi, L.W.; Wang, D.Y.; Xiao, X.; Qin, X. Meso-structural characteristics of asphalt mixture main skeleton based on meso-scale analysis. Constr. Build. Mater. 2020, 232, 117263. [Google Scholar] [CrossRef]


| Technical Parameter | Test Result | Specification Requirements | Test Procedure |
|---|---|---|---|
| 25 °C penetration (0.1 mm) | 61.9 | 60–80 | T 0604-2011 |
| Softening point (°C) | 48.7 | ≥45 | T 0606-2011 |
| 15°C Ductility (cm) | >150 | ≥100 | T 0605-2011 |
| Wax content (%) | 1.9 | ≤2.2 | T 0615-2011 |
| Flash point (°C) | 340 | - | T 0611-2011 |
| Solubility (%) | 99.9 | ≥99.5 | T 0607-2011 |
| Technical Parameter | Test Result | Specification Requirements | Test Procedure |
|---|---|---|---|
| Crushing value (%) | 21.2 | ≤26 | T 0316-2005 |
| Los Angeles abrasion value (%) | 25 | ≤28 | T 0317-2005 |
| Apparent specific gravity (t/m3) | 2.79 | ≥2.6 | T 0304-2005 |
| Elongated particles content (%) | 9.3 | ≤15 | T 0312-2005 |
| Water absorption (%) | 0.61 | ≤2.0 | T 0307-2005 |
| Technical Parameter | Test Result | Specification Requirements | Test Procedure |
|---|---|---|---|
| Apparent specific gravity (t/m3) | 2.71 | ≤2.5 | T 0328-2005 |
| Surface dry specific gravity (t/m3) | 2.6 | - | T 0330-2005 |
| Specific gravity of gross volume (t/m3) | 2.64 | - | T 0328-2005 |
| Mud content (%) | 1.02 | ≤3 | T 0333-2005 |
| Technical Parameter | Test Result | Specification Requirements | Test Procedure | |
|---|---|---|---|---|
| Apparent specific gravity (t/m3) | 2.83 | ≥2.5 | T 0316-2005 | |
| Water absorption (%) | 0.2 | ≤1 | T 0316-2005 | |
| Appearance characteristic | No agglomeration | No agglomeration | T 0316-2005 | |
| Granular composition (%) | <0.6 mm | 100 | 100 | T 0316-2005 |
| <0.15 mm | 98 | 90–100 | ||
| <0.075 mm | 92 | 75–100 | ||
| Position | A | B | C | D |
|---|---|---|---|---|
| Compaction height (mm) | 5.16 | 5.09 | 4.92 | 5.07 |
| Test | Logarithmic Equation y = aln(x) − b | Determination Coefficient R2 |
|---|---|---|
| RSCT test | y = 3.5594ln(x) − 17.478 | 0.9785 |
| WTT | y = 4.136ln(x) − 20.352 | 0.9715 |
| Parameter | E1 (MPa) | E2 (MPa) | η1 (MPa) | η2 (MPa) |
|---|---|---|---|---|
| Value | 4.6581 | 6.5419 | 10.9929 | 2.1164 |
| Parameter | Kkn (Pa·m) | Ckn (Pa·m·s) | Kmn (Pa·m) | Cmn (Pa·m·s) | Kks (Pa·m) | Cks (Pa·m·s) | Kms (Pa·m) | Cms (Pa·m·s) |
|---|---|---|---|---|---|---|---|---|
| Value (E6) | 6.5419 | 0.2116 | 4.6581 | 0.1099 | 2.1806 | 0.0705 | 1.5527 | 0.3664 |
| Parameter | Kn (106 N/m) | Ks (106 N/m) |
|---|---|---|
| Value | 10.1735 | 3.4437 |
| Size (mm) | 16–13.2 | 13.2–9.5 | 9.5–4.75 | 4.75–2.36 | 2.36–1.18 |
|---|---|---|---|---|---|
| Number | 3 | 7 | 42 | 293 | 620 |
© 2020 by the authors. Licensee MDPI, Basel, Switzerland. This article is an open access article distributed under the terms and conditions of the Creative Commons Attribution (CC BY) license (http://creativecommons.org/licenses/by/4.0/).
Share and Cite
Li, J.; Guo, W.; Meng, A.; Han, M.; Tan, Y. Investigation on the Micro Deformation Mechanism of Asphalt Mixtures under High Temperatures Based on a Self-Developed Laboratory Test. Materials 2020, 13, 1791. https://doi.org/10.3390/ma13071791
Li J, Guo W, Meng A, Han M, Tan Y. Investigation on the Micro Deformation Mechanism of Asphalt Mixtures under High Temperatures Based on a Self-Developed Laboratory Test. Materials. 2020; 13(7):1791. https://doi.org/10.3390/ma13071791
Chicago/Turabian StyleLi, Jilu, Wei Guo, Anxin Meng, Meizhao Han, and Yiqiu Tan. 2020. "Investigation on the Micro Deformation Mechanism of Asphalt Mixtures under High Temperatures Based on a Self-Developed Laboratory Test" Materials 13, no. 7: 1791. https://doi.org/10.3390/ma13071791
APA StyleLi, J., Guo, W., Meng, A., Han, M., & Tan, Y. (2020). Investigation on the Micro Deformation Mechanism of Asphalt Mixtures under High Temperatures Based on a Self-Developed Laboratory Test. Materials, 13(7), 1791. https://doi.org/10.3390/ma13071791