Preparation and Photocatalytic Properties of a Bagasse Cellulose-Supported Nano-TiO2 Photocatalytic-Coupled Microbial Carrier

 ,
,
Abstract
:1. Introduction
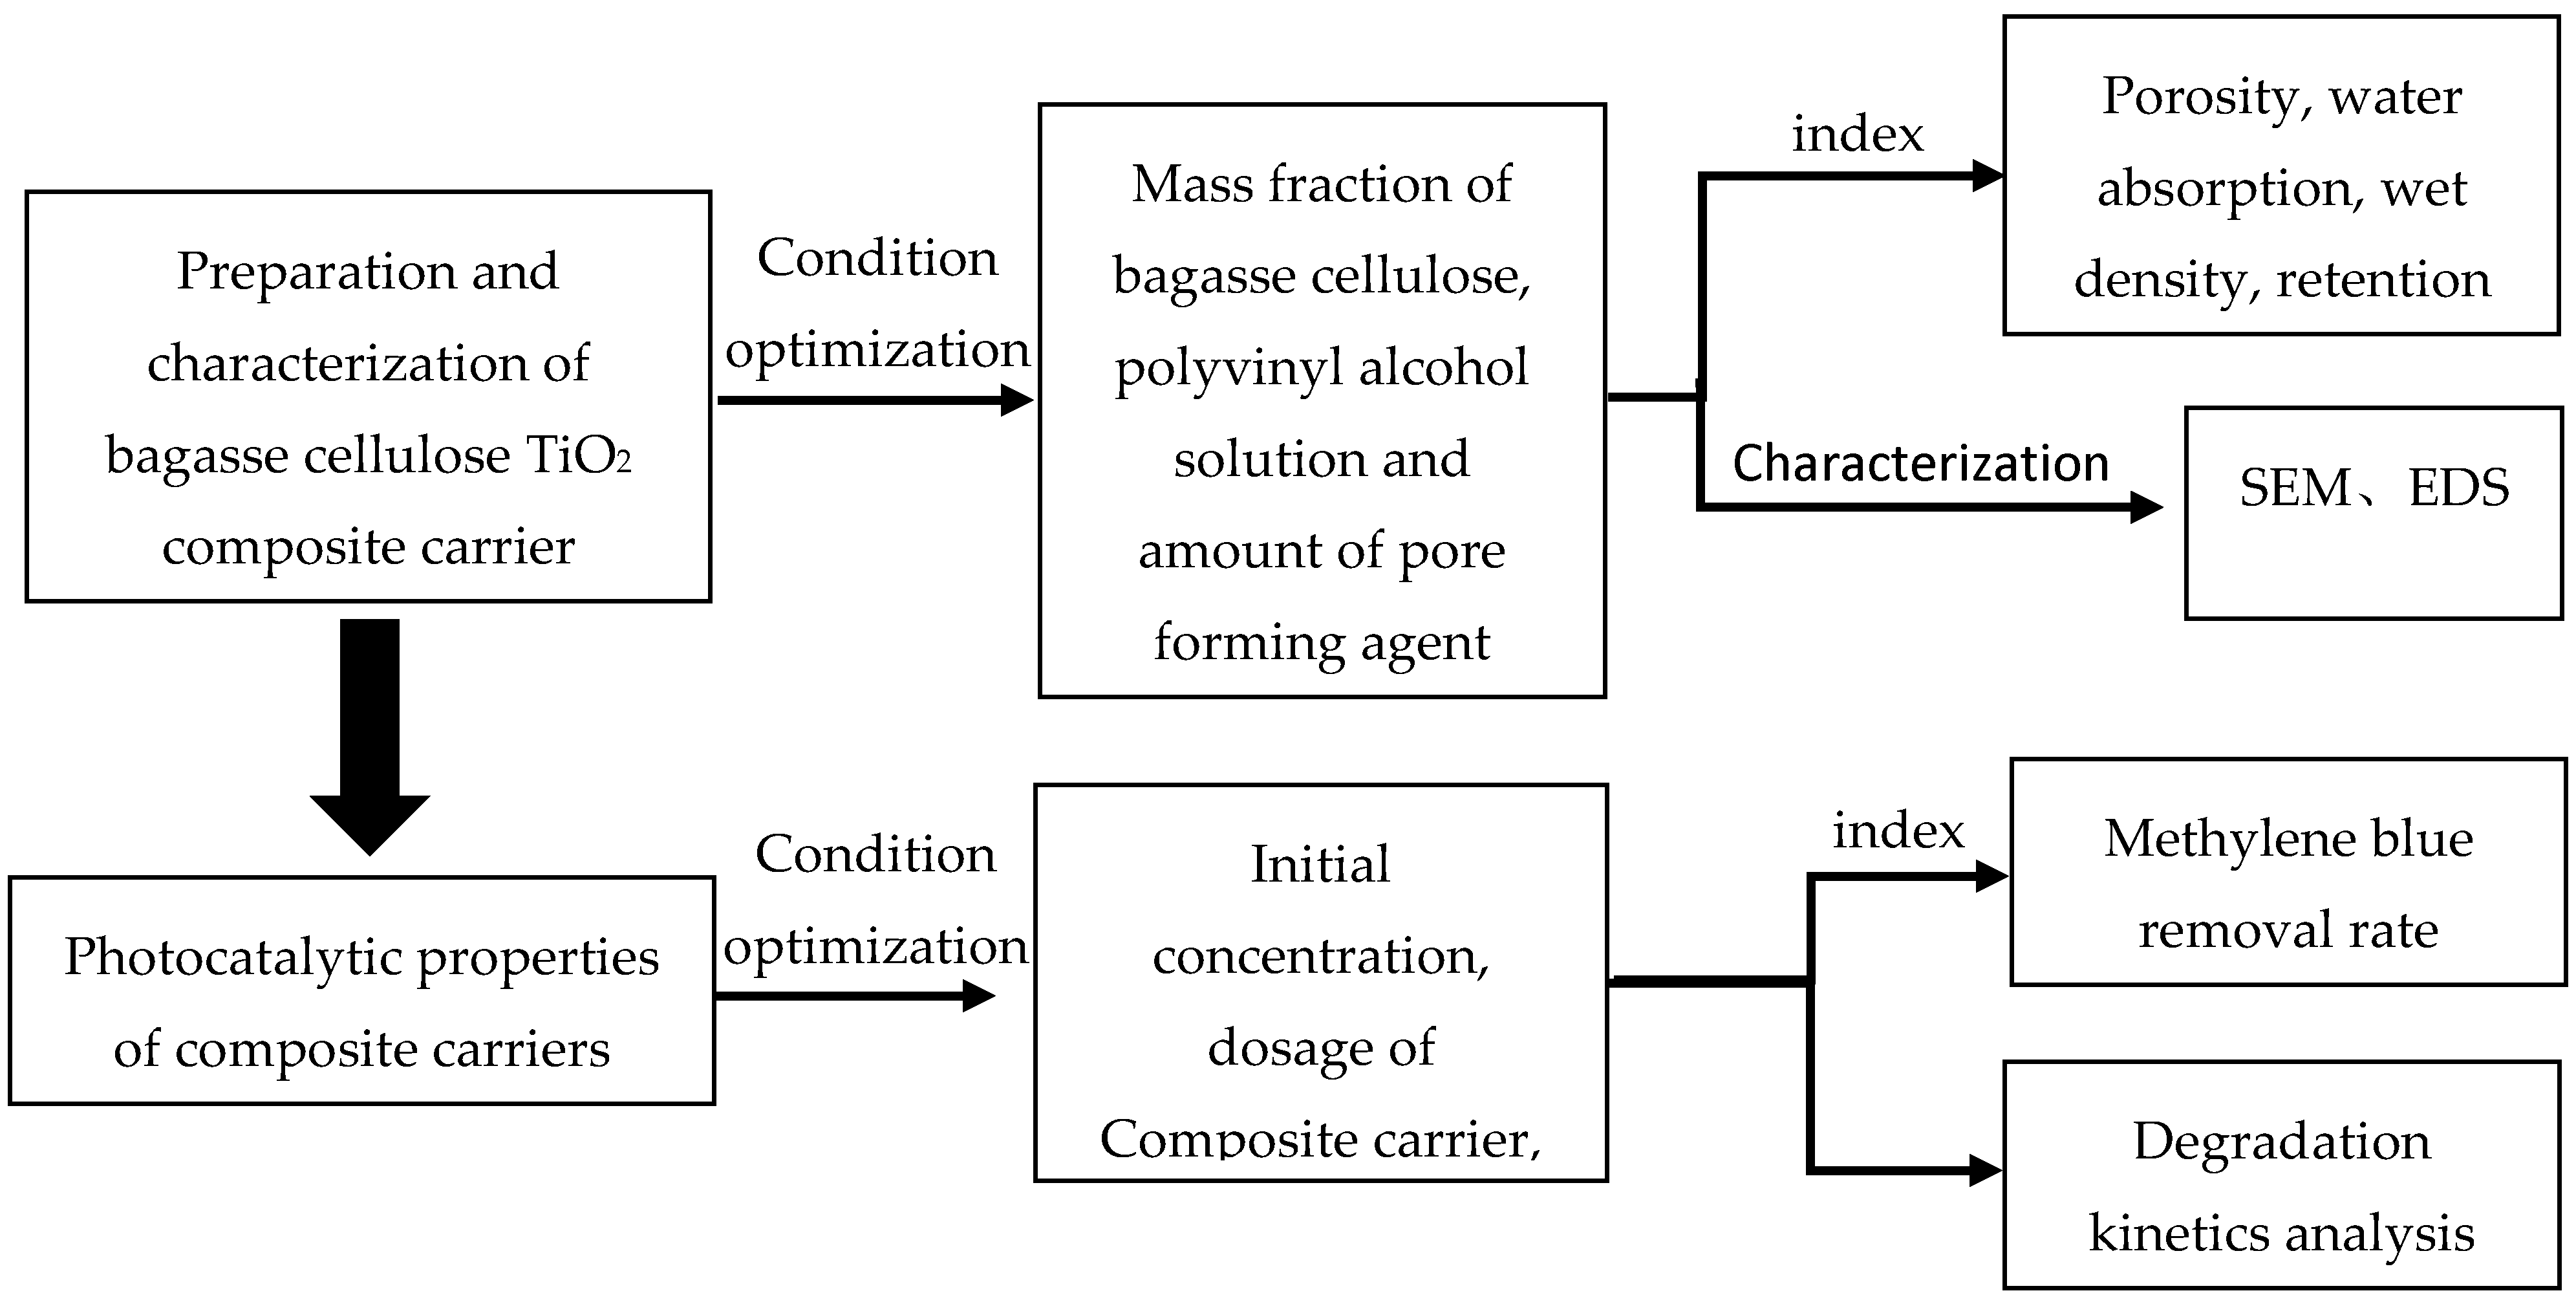
2. Materials and Methods
2.1. Chemicals
2.2. Preparation of Bagasse Cellulose Composite Carrier
2.3. Biofilm Cultivation
2.4. Characterization
2.5. Photocatalytic Activity Test
3. Experimental Results and Analysis
3.1. Influence Analysis of Composite Carrier Performance
3.1.1. Effect of Bagasse Cellulose Mass Fraction
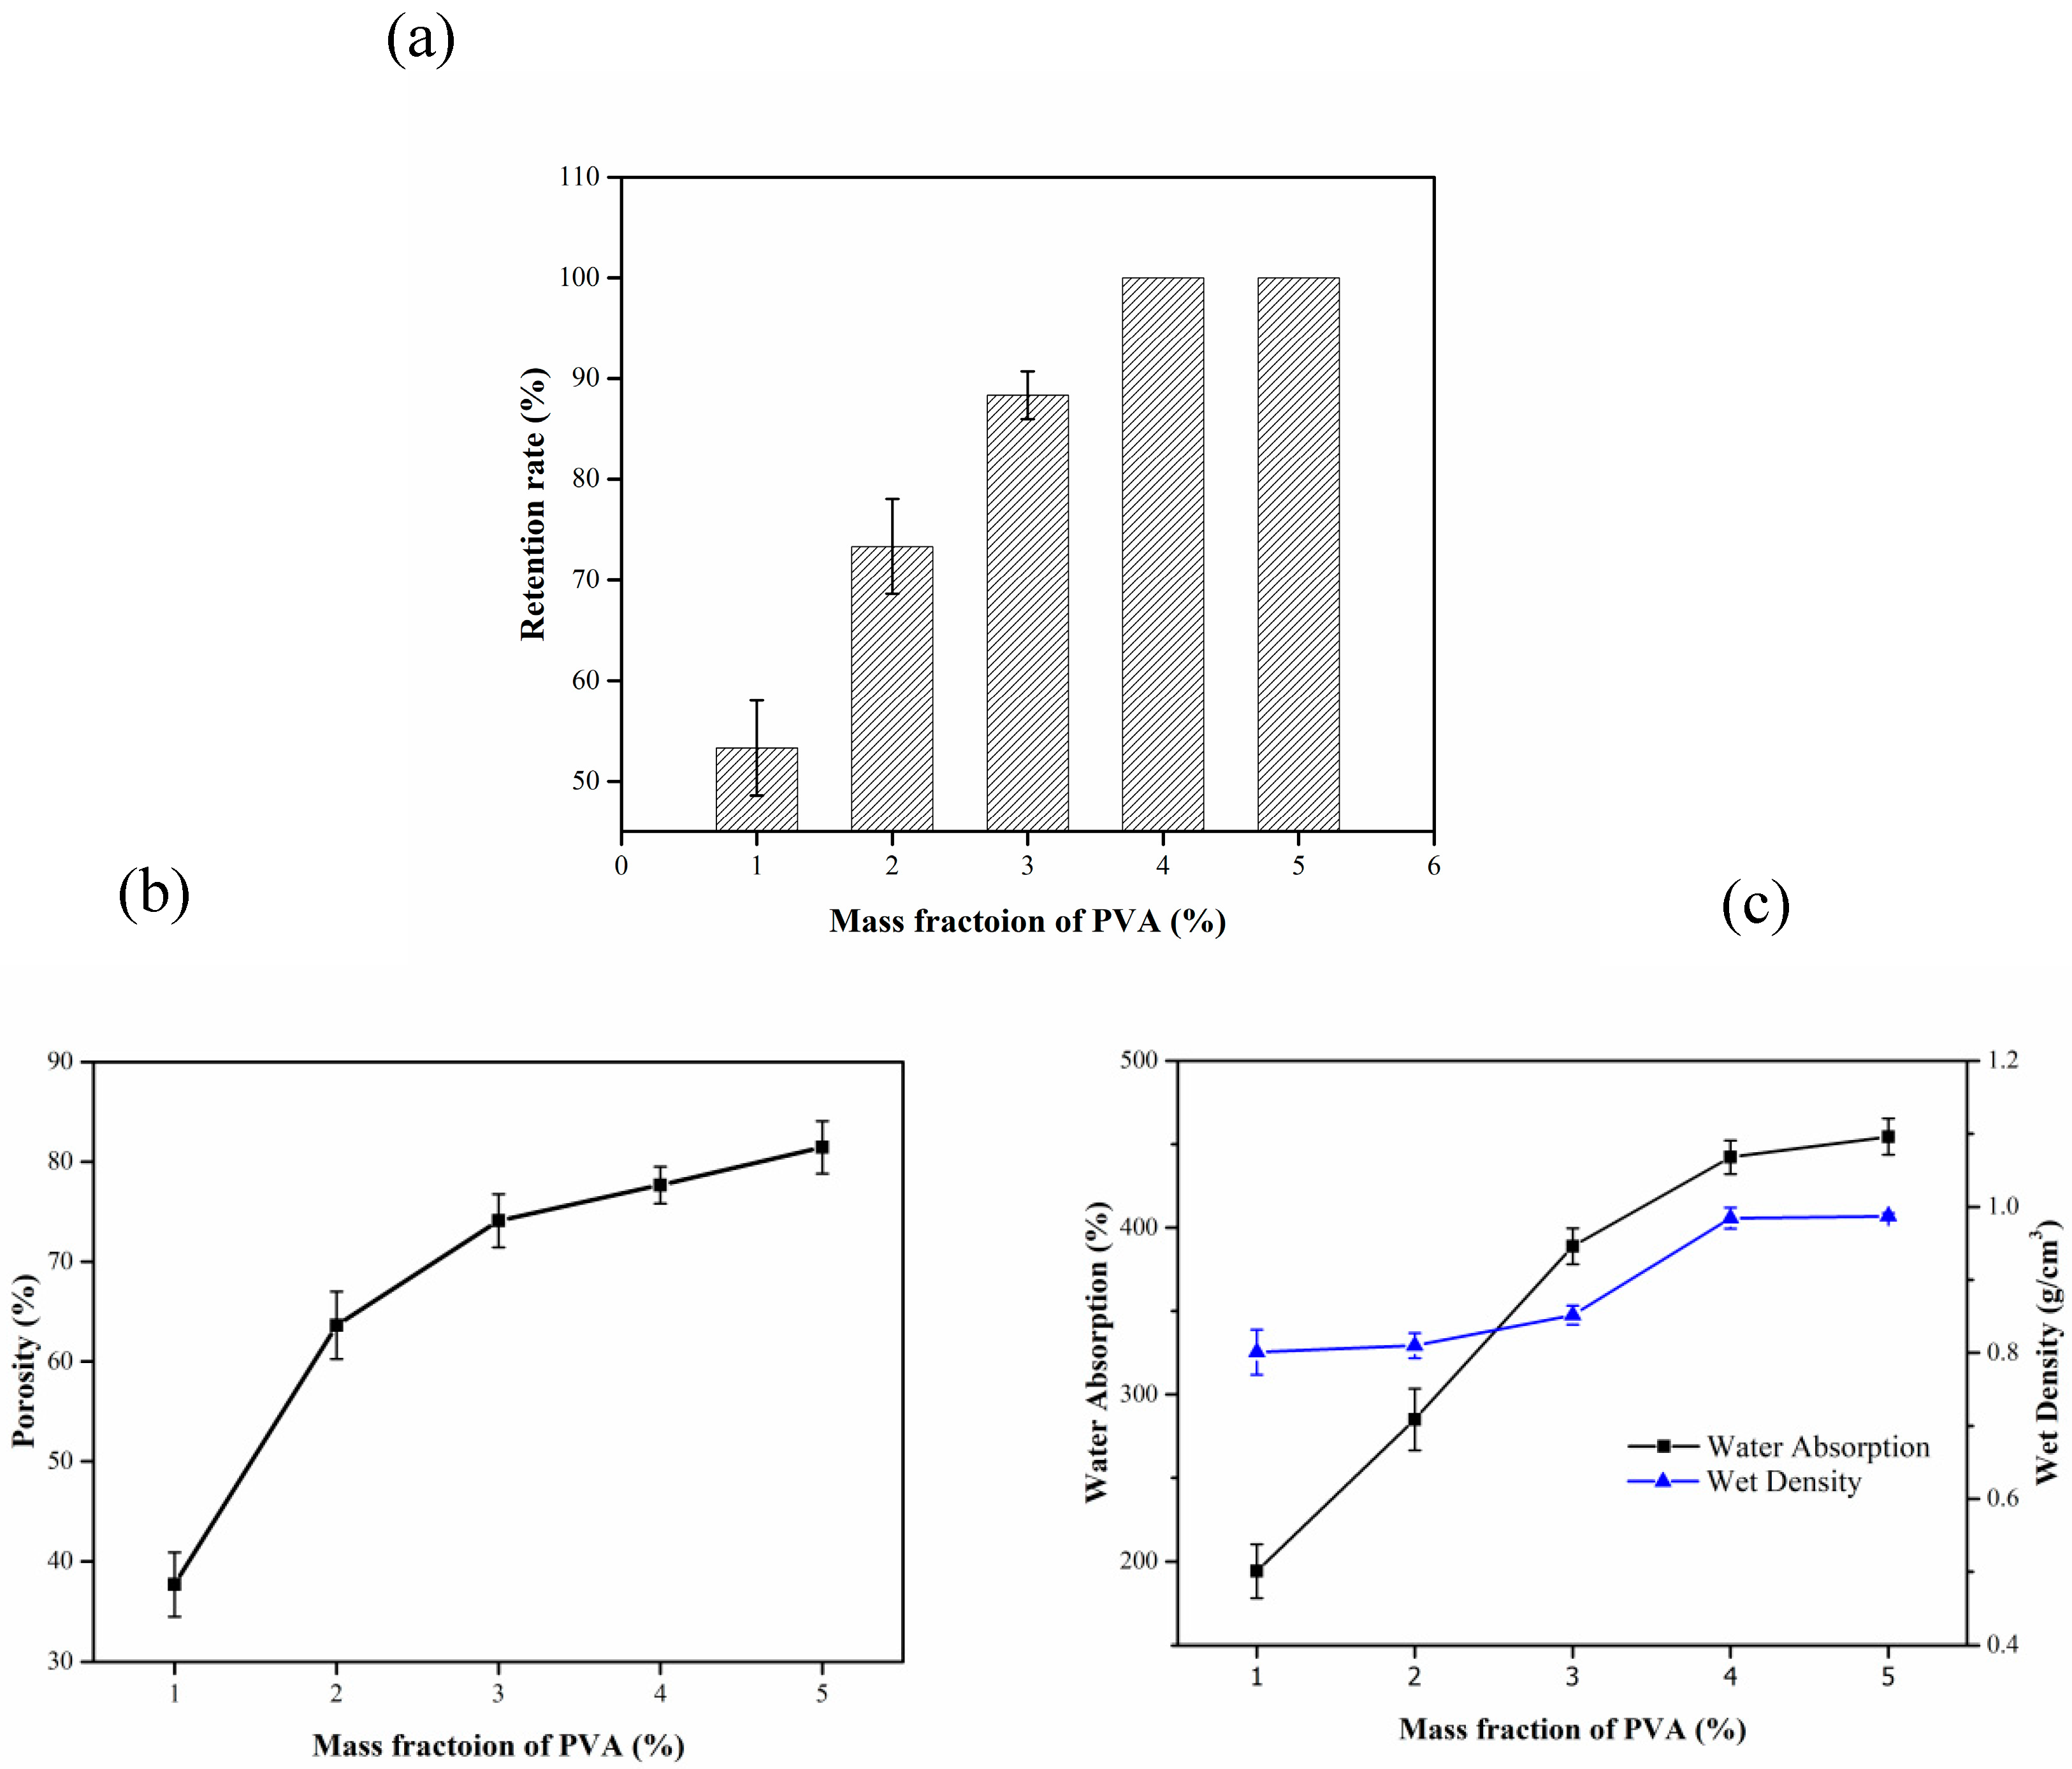
3.1.2. Influence of PVA Solution Mass Fraction
3.1.3. Effect of Pore Forming Agent Dosage
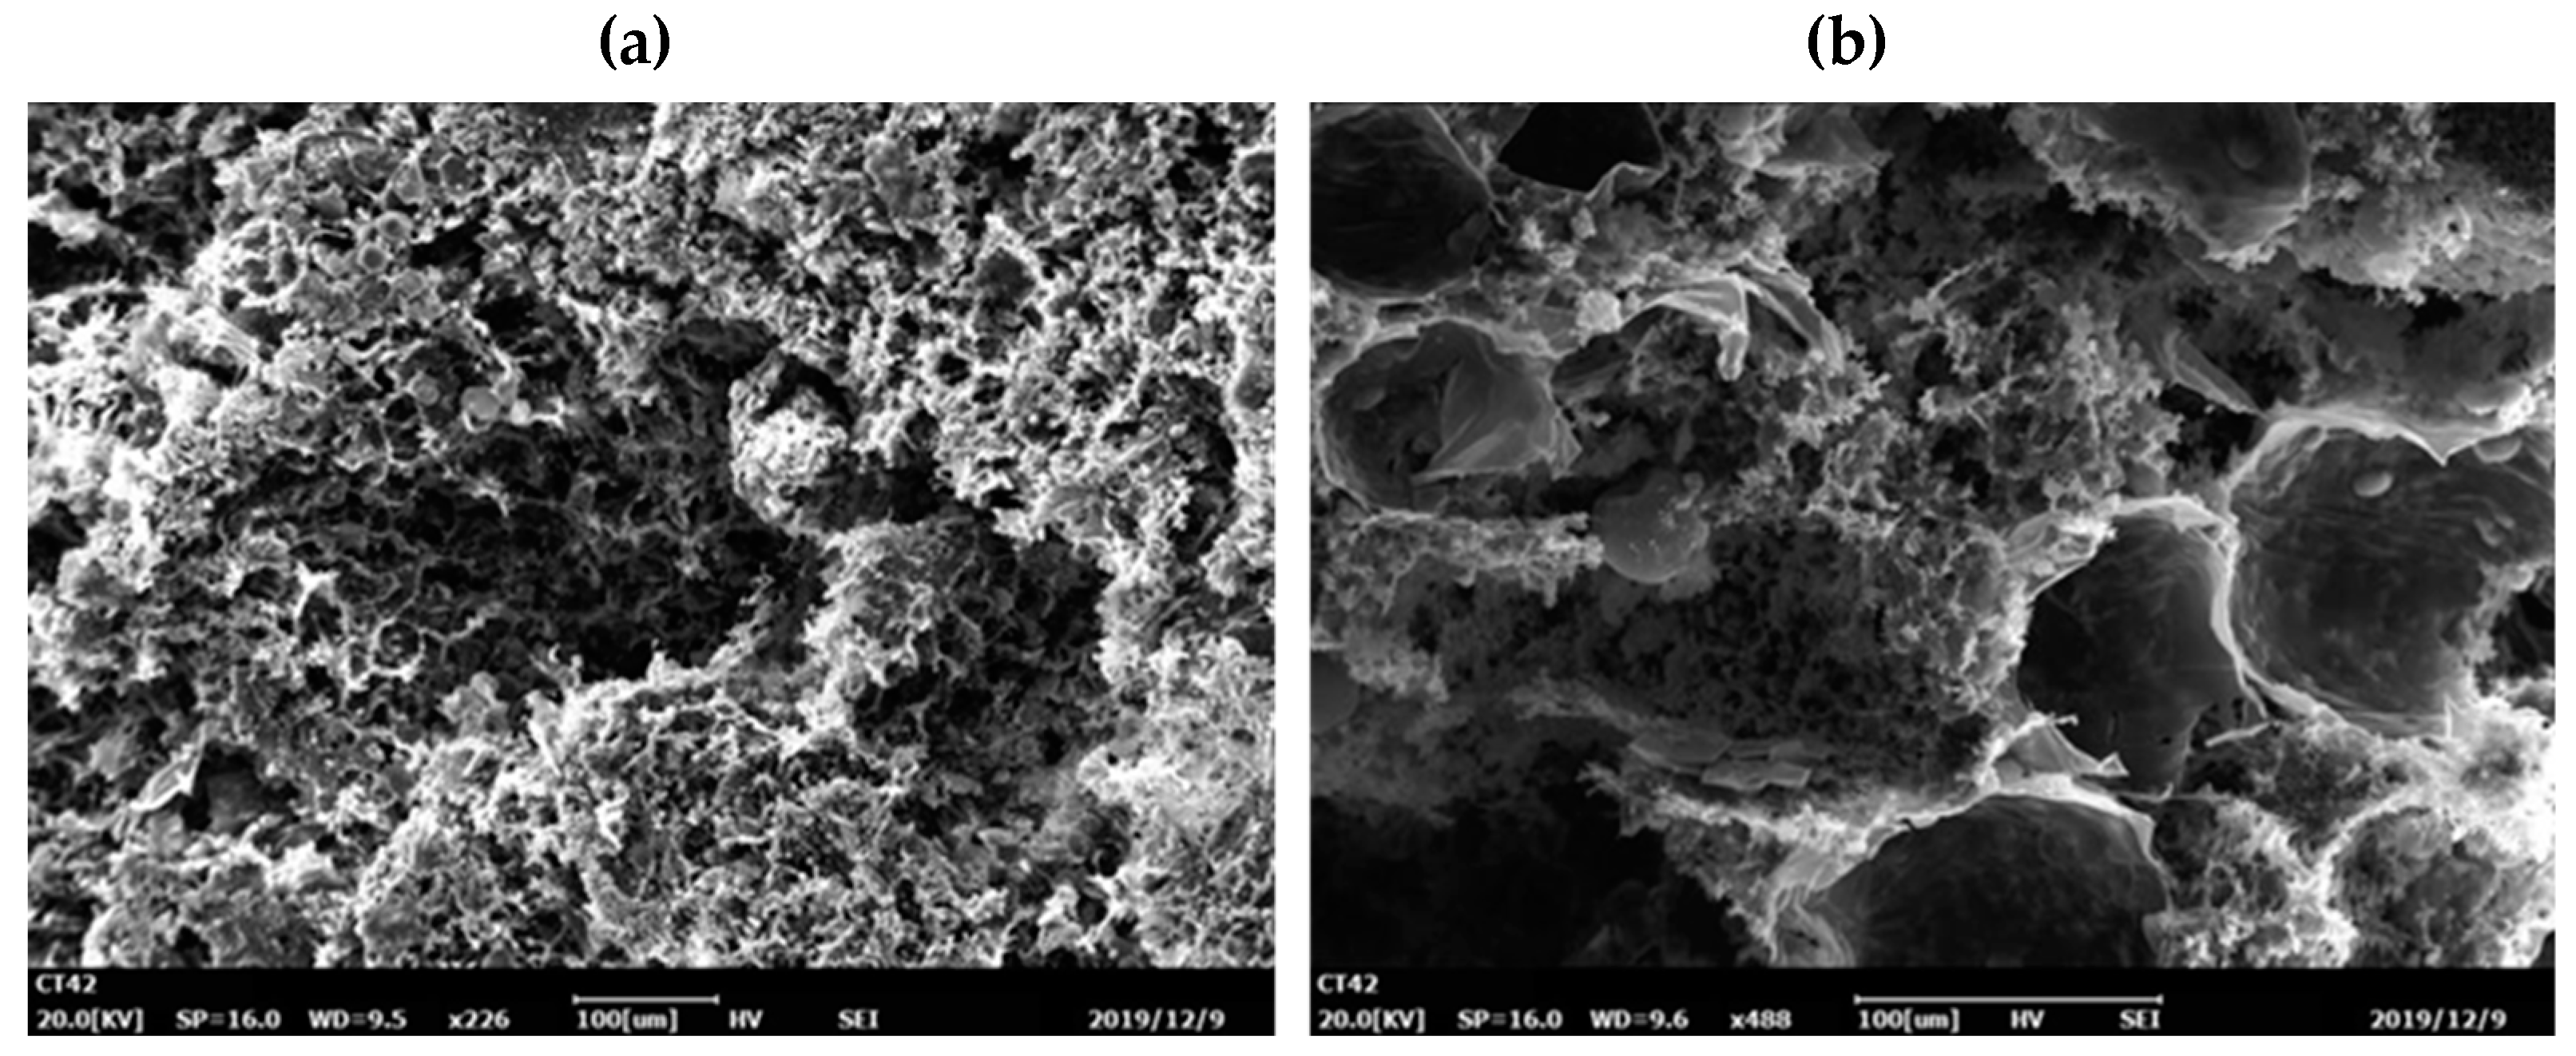
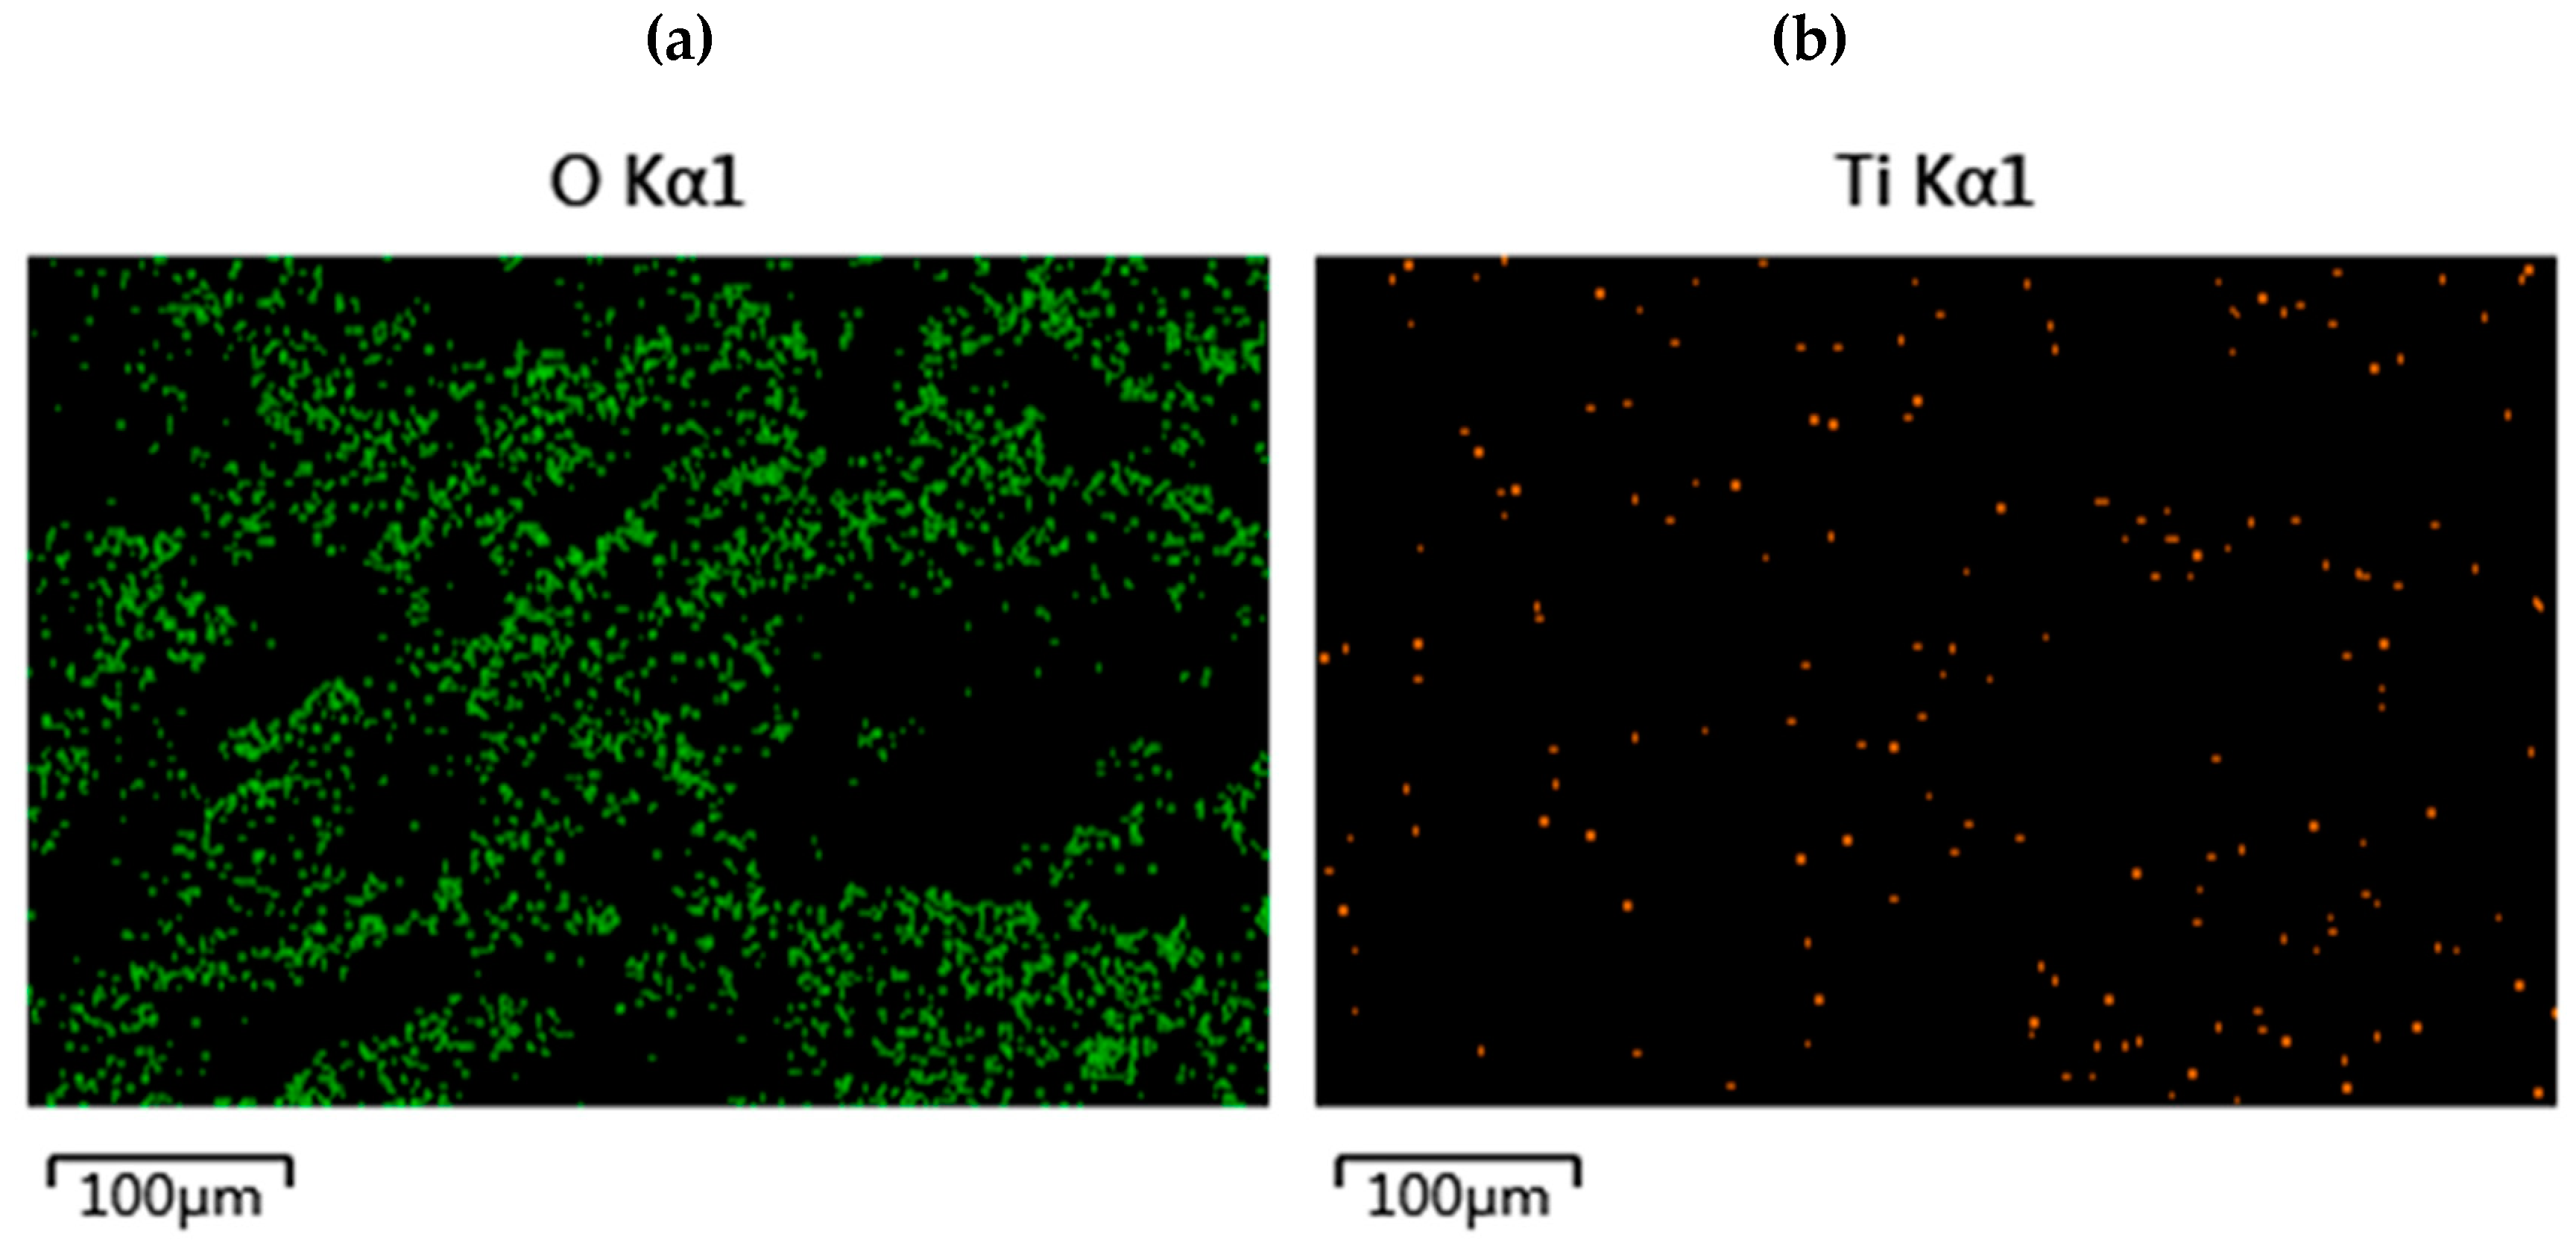
3.2. Characterization
3.3. Analysis of Factors Influencing Photocatalytic Degradation Reaction
4. Conclusions
Author Contributions
Funding
Conflicts of Interest
References
- Li, T. Study on Environmental Assessment of China’s Textile Industry in the Country of Foreign Transfer and Undertaking. Master’s Thesis, Jinan University, Guangzhou, China, 30 June 2017. [Google Scholar]
- Zhao, H. Industrial Agglomeration, Foreign Trade and Energy Efficiency. Ph.D. Thesis, Xiamen University, Xiamen, China, 1 April 2017. [Google Scholar]
- Liu, T.; Zhang, H. Progress in treatment of major pollutants in textile industry. J. Dyeing Finish. Technol. 2016, 38, 61–63. [Google Scholar]
- Bharath, G.; Alhseinat, E.; Ponpandian, N. Development of adsorption and electrosorption techniques for removal of organic and inorganic pollutants from wastewater using novel magnetite/porous graphene-based nanocomposites. Sep. Purif. Technol. 2017, 188, 206–218. [Google Scholar] [CrossRef]
- Paz, A.; Carballo, J.; Pérez, M.J. Biological treatment of model dyes and textile waste waters. Chemosphere 2017, 181, 168–177. [Google Scholar] [CrossRef] [PubMed]
- Ma, X.; Chen, P.; Zhou, M. Tight ultrafiltration ceramic membrane for separation of dyes and mixed salts (both NaCl/Na2SO4) in textile waste water treatment. Ind. Eng. Chem. Res. 2017, 56, 7070–7079. [Google Scholar] [CrossRef]
- Wang, S.; Wu, H.; Yan, Z. Multi Cell Hydrolysis of Printing and Dyeing Waste Water: Membrane Biological Treatment Technology; Science Press: Beijing, China, 2011; pp. 2–5. [Google Scholar]
- Ponnusami, V.; Madhuram, R.; Krithika, V.; Srivastava, N.S. Effects of process variables on kinetics of MB sorption onto untreated guava (Psidium guajava) leaf powder: Statistical analysis. Chem. Eng. J. 2008, 140, 609–613. [Google Scholar] [CrossRef]
- Chen, Y.; Yu, Y.; Xia, Y. Preparation methods and progress of titanium dioxide photocatalytic materials. World Nonferr. Metals 2019, 19, 160–161. [Google Scholar]
- Marsolek, M.D.; Torres, C.I.; Hausner, M.; Rittmann, B.E. Intimate coupling of photocatalysis and biodegradation in a photocatalytic circulating-bed biofilm reactor. Biotechnol. Bioeng. 2008, 101, 83–92. [Google Scholar] [CrossRef]
- Zhang, L. Study on the Integrated Treatment of Refractory Organic Waste Water by Photocatalytic Coupled Microbial Method. Master’s Thesis, Heilongjiang University, Heilongjiang, China, 1 March 2015. [Google Scholar]
- Zhou, D.; Xu, Z.; Dong, S. Intimate coupling of photocatalysis and biodegradation for degrading phenol using different light types: Visible light vs UV light. Environ. Sci. Technol. 2015, 49, 7776–7783. [Google Scholar] [CrossRef]
- Dong, S.; Tian, X. Role of self-assembly coated Er3+: YAlO3/TiO2 in intimate coupling of visible-light-responsive photocatalysis and biodegradation reactions. J. Hazard. Mater. 2016, 302, 386–394. [Google Scholar] [CrossRef] [PubMed]
- Zhang, Y.; Wang, L. Integrated photocatalytic-biological reactor for accelerated phenol mineralization. Appl. Microbiol. Biotechnol. 2010, 86, 1977–1985. [Google Scholar] [CrossRef]
- Li, G.; Park, S.; Kang, D.W. 2,4,5-Trichlorophenol degradation using a novel TiO2-coated biofilm carrier: Roles of adsorption, photocatalysis, and biodegradation. Environ. Sci. Technol. 2011, 45, 8359–8367. [Google Scholar] [CrossRef] [PubMed]
- Wen, D.; Li, G.; Xing, R. 2,4-DNT removal in intimately coupled photobiocatalysis: The roles of adsorption, photolysis, photocatalysis, and biotransformation. Appl. Microbiol. Biotechnol. 2012, 95, 263–272. [Google Scholar] [CrossRef] [PubMed]
- Xiong, H. Effect and Mechanism of Degradation of Tetracycline Waste Water by Visible-Light Photocatalytic Oxidation-Biodegradation Direct Coupling Technology. Ph.D. Thesis, Jilin University, Changchun, China, 1 June 2017. [Google Scholar]
- Li, T. Study on the Behavior and Biological Response of TCH Waste Water Treatment by Direct Coupling Photocatalysis and Biodegradation. Master’s Thesis, Jilin University, Changchun, China, 1 June 2016. [Google Scholar]
- Yu, M.; Wang, J.; Tang, L.; Feng, C.; Liu, H.; Zhang, H.; Peng, B.; Chen, Z.; Xie, Q. Intimate coupling of photocatalysis and biodegradation for wastewater treatment: Mechanisms, recent advances and environmental applications. Water Res. 2020, 175, 115673. [Google Scholar] [CrossRef] [PubMed]
- Li, G.; Park, S.; Rittmann, B.E. Degradation of reactive dyes in a photocatalytic circulating-bed biofilm reactor. Biotechnol. Bioeng. 2012, 109, 884–893. [Google Scholar] [CrossRef] [PubMed]
- Din, R.; Zhao, F. Simultaneous degradation of pollutants by photocatalysis coupled with microorganism. Progress Chem. 2017, 29, 1154–1158. [Google Scholar]
- Ge, M.; Du, M.; Zheng, L. A maleic anhydride grafted sugarcane bagasse adsorbent and its performance on the removal of MB from related waste water. Mater. Chem. Phys. 2017, 192, 147–155. [Google Scholar] [CrossRef]
- Yu, J.X.; Xiong, W.L.; Zhu, J. Removal of Congo red from aqueous solution by adsorption onto different amine compounds modified sugarcane bagasse. Clean Technol. Environ. Policy 2017, 19, 517–525. [Google Scholar] [CrossRef]
- Pei, Y.; Wu, X.; Xu, G. Tannin-immobilized cellulose microspheres as effective adsorbents for removing cationic dye (MB) from aqueous solution. J. Chem. Technol. Biotechnol. 2017, 92, 1276–1284. [Google Scholar] [CrossRef]
- Liu, J.; Chen, S.; Ding, J. Sugarcane bagasse as support for immobilization of Bacillus pumilus HZ−2 and its use in bioremediation of mesotrione-contaminated soils. Appl. Microbiol. Biotechnol. 2015, 99, 10839–10851. [Google Scholar] [CrossRef]
- Li, L. Preparation and Properties of Bamboo Cellulose Carrier Immobilized Enzyme. Master’s Thesis, Suzhou University of Science and Technology, Suzhou, China, 1 June 2014. [Google Scholar]
- Wang, C. Preparation, Structure and Performance Control of Biodegradable Polyurethane. Ph.D. Thesis, Beijing University of Science and Technology, Beijing, China, 4 January 2017. [Google Scholar]
- Liu, M.; Zhao, Y.; Liu, T. Preparation of polyvinylidene fluoride/nano silica/ultra high molecular weight polyethylene lithium battery composite membrane. Polymer Mater. Sci. Eng. 2016, 32, 112–115. [Google Scholar]
- Li, X.; Ye, L. Preparation and structure and properties of polyvinyl alcohol gel for sewage treatment. Environ. Chem. 2010, 29, 305–309. [Google Scholar]
- Kong, X. Study on Cellulose-Based Controllable Degradable Fillers for Water Treatment. Master’s Thesis, Tianjin University, Tianjin, China, 1 February 2004. [Google Scholar]
- Li, Y. Study on the Preparation and Properties of Polyvinyl Alcohol/Cellulose Composites. Master’s Thesis, Jiangnan University, Wuxi, China, 1 June 2016. [Google Scholar]
- Xiong, J.H.; Guo, S.C.; Zhao, T.Y.; Liang, Y.N.; Liang, J.X.; Wang, S.F.; Zhu, H.X.; Zhang, L.M.; Zhao, J.R.; Chen, G.N. Degradation of MB by intimate coupling photocatalysis and biodegradation with bagasse cellulose composite carrier. Cellulose 2020, 27, 3391–3404. [Google Scholar] [CrossRef]
- Wu, C.H.; Chern, J.M. Kinetics of photocatalytic decomposition of MB. Ind. Eng. Chem. Res. 2006, 45, 6450–6457. [Google Scholar] [CrossRef]
- Kim, M.S.; Hong, K.M.; Chung, J.G. Removal of Cu (II) from aqueous solutions by adsorption process with anatase-type titanium dioxide. Water Res. 2003, 37, 3524–3529. [Google Scholar] [CrossRef]


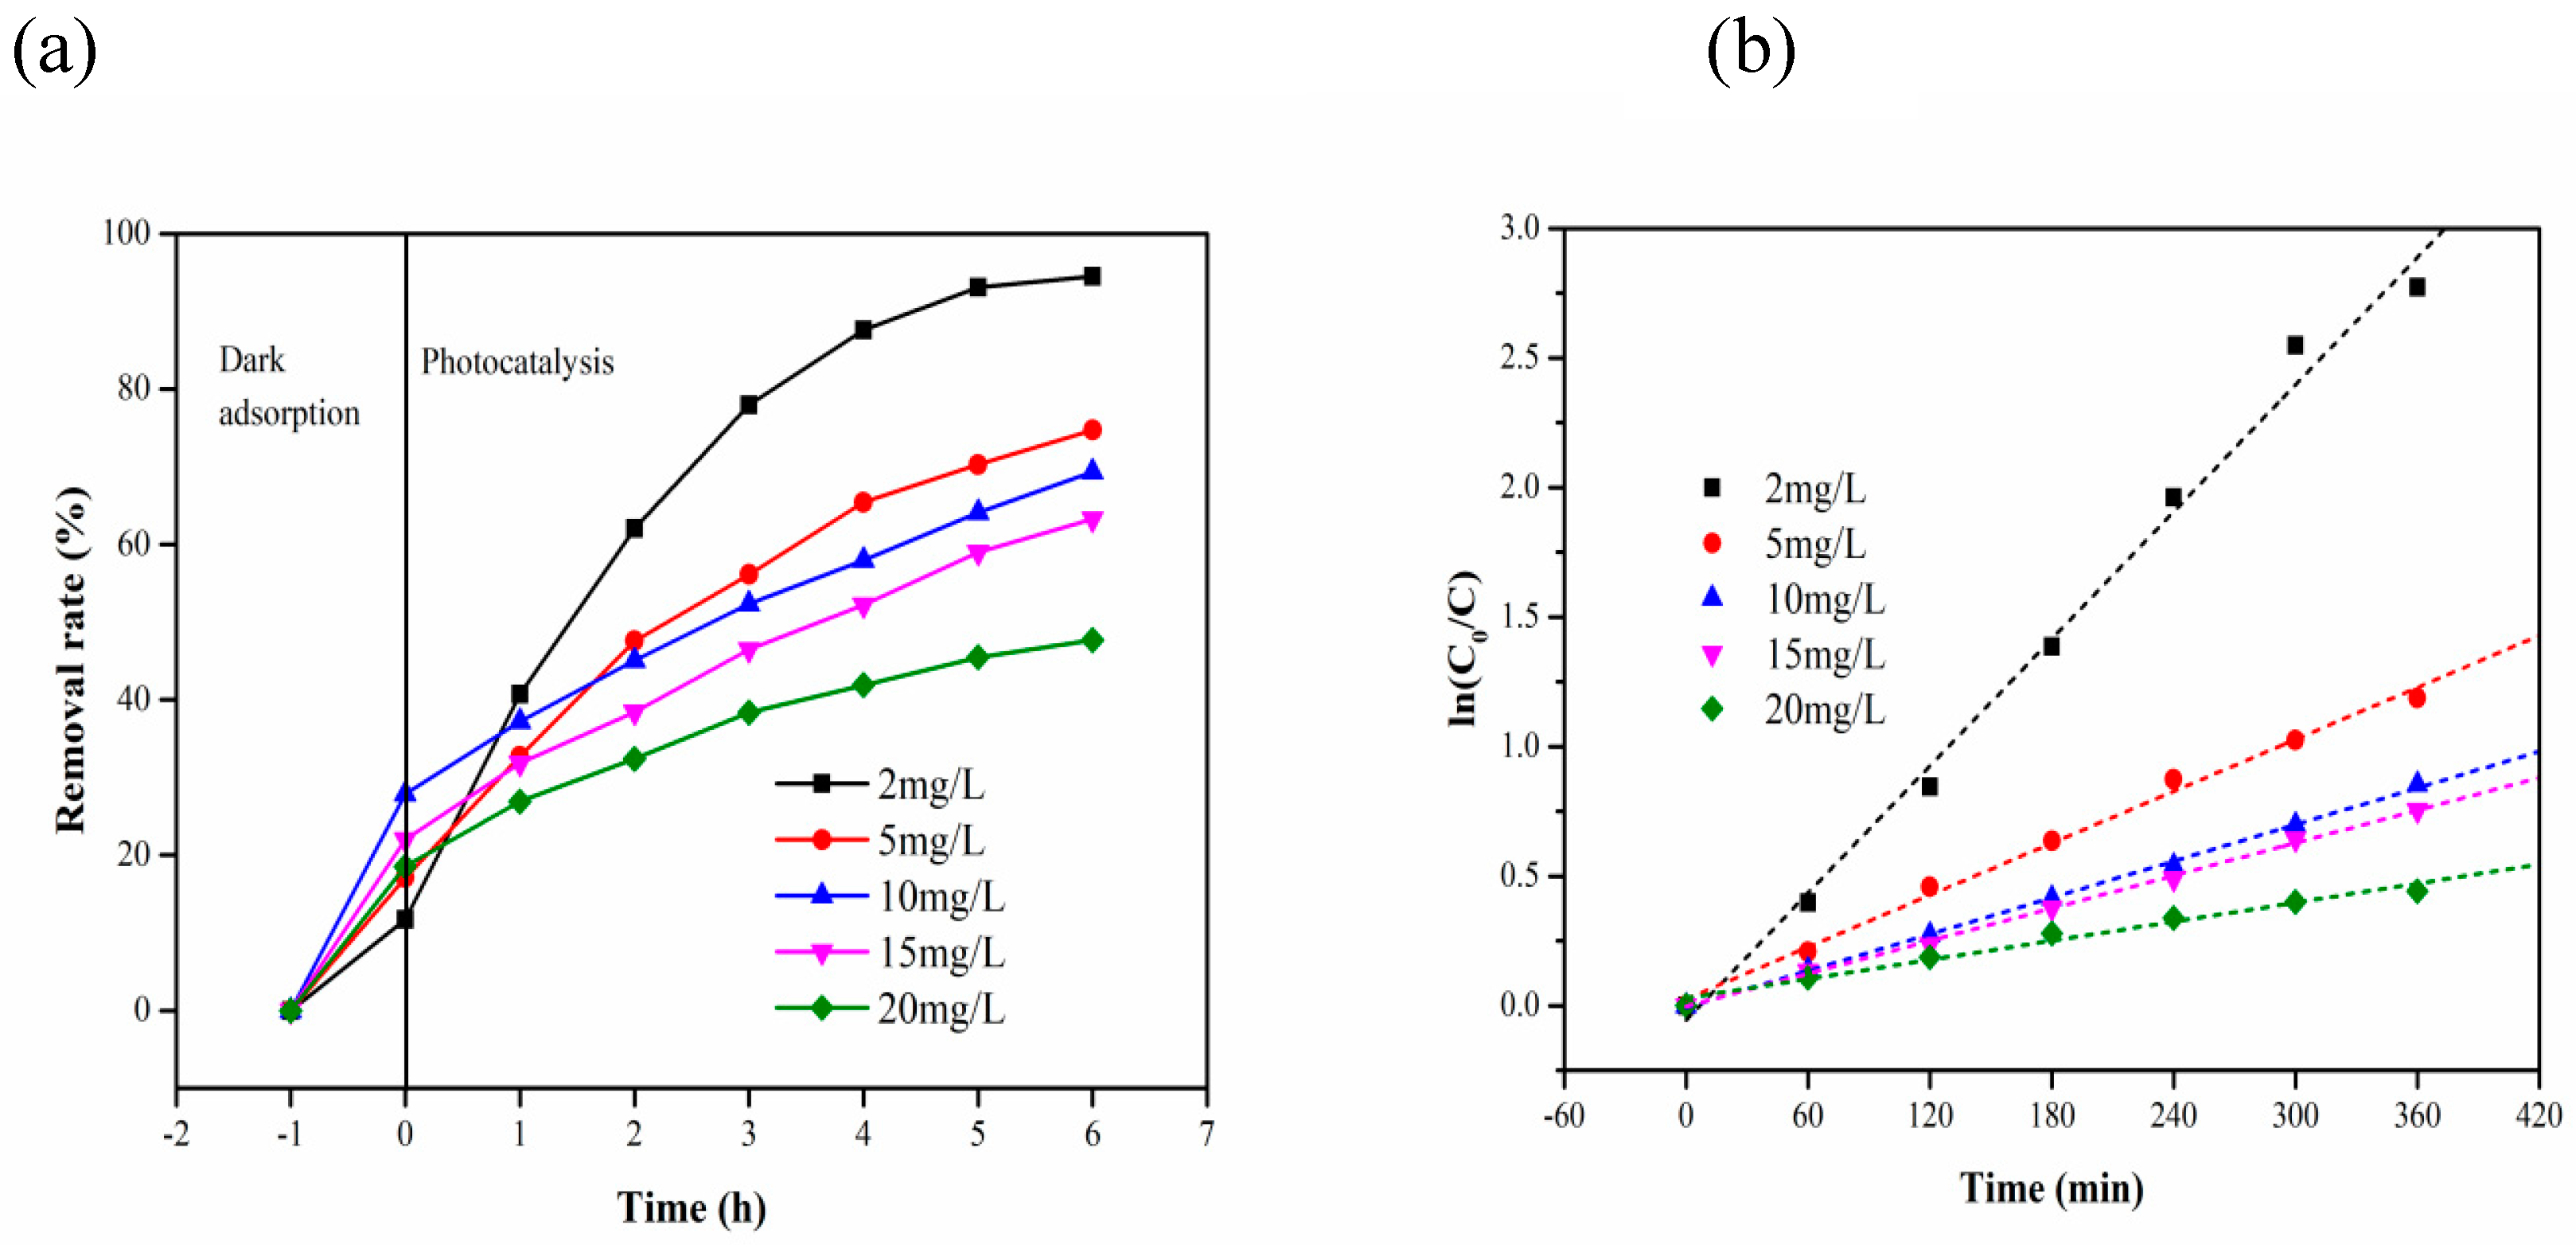
| Time (h) Initial Concentration (mg/L) | 2 | 5 | 10 | 15 | 20 |
|---|---|---|---|---|---|
| −1 | 0 | 0 | 0 | 0 | 0 |
| 0 | 11.72414 | 17.10037 | 27.87879 | 22.02532 | 18.54083 |
| 2 | 40.68966 | 32.71375 | 37.21212 | 31.81435 | 26.90763 |
| 3 | 62.06897 | 47.58364 | 45.09091 | 38.39662 | 32.39625 |
| 4 | 77.93103 | 56.13383 | 52.36364 | 46.49789 | 38.35341 |
| 5 | 87.58621 | 65.42751 | 57.93939 | 52.23629 | 41.90094 |
| 6 | 93.10345 | 70.26022 | 64.12121 | 58.98734 | 45.44846 |
| 7 | 94.48276 | 74.72119 | 69.33333 | 63.29114 | 47.6573 |
| Initial Concentrations | Kinetic Equation | k(min−1) | R2 |
|---|---|---|---|
| 2 mg/L | In(C0/C) = 0.00818 t − 0.0559 | 8.18 × 10⁻³ | 0.9962 |
| 5 mg/L | In(C0/C) = 0.00334 t + 0.02598 | 3.34 × 10⁻³ | 0.9974 |
| 10 mg/L | In(C0/C) = 0.00235 t − 0.00641 | 2.35 × 10⁻³ | 0.9994 |
| 15 mg/L | In(C0/C) = 0.0021 t − 0.00228 | 2.1 × 10⁻³ | 0.9993 |
| 20 mg/L | In(C0/C) = 0.00123 t + 0.02958 | 1.23 × 10⁻³ | 0.9908 |
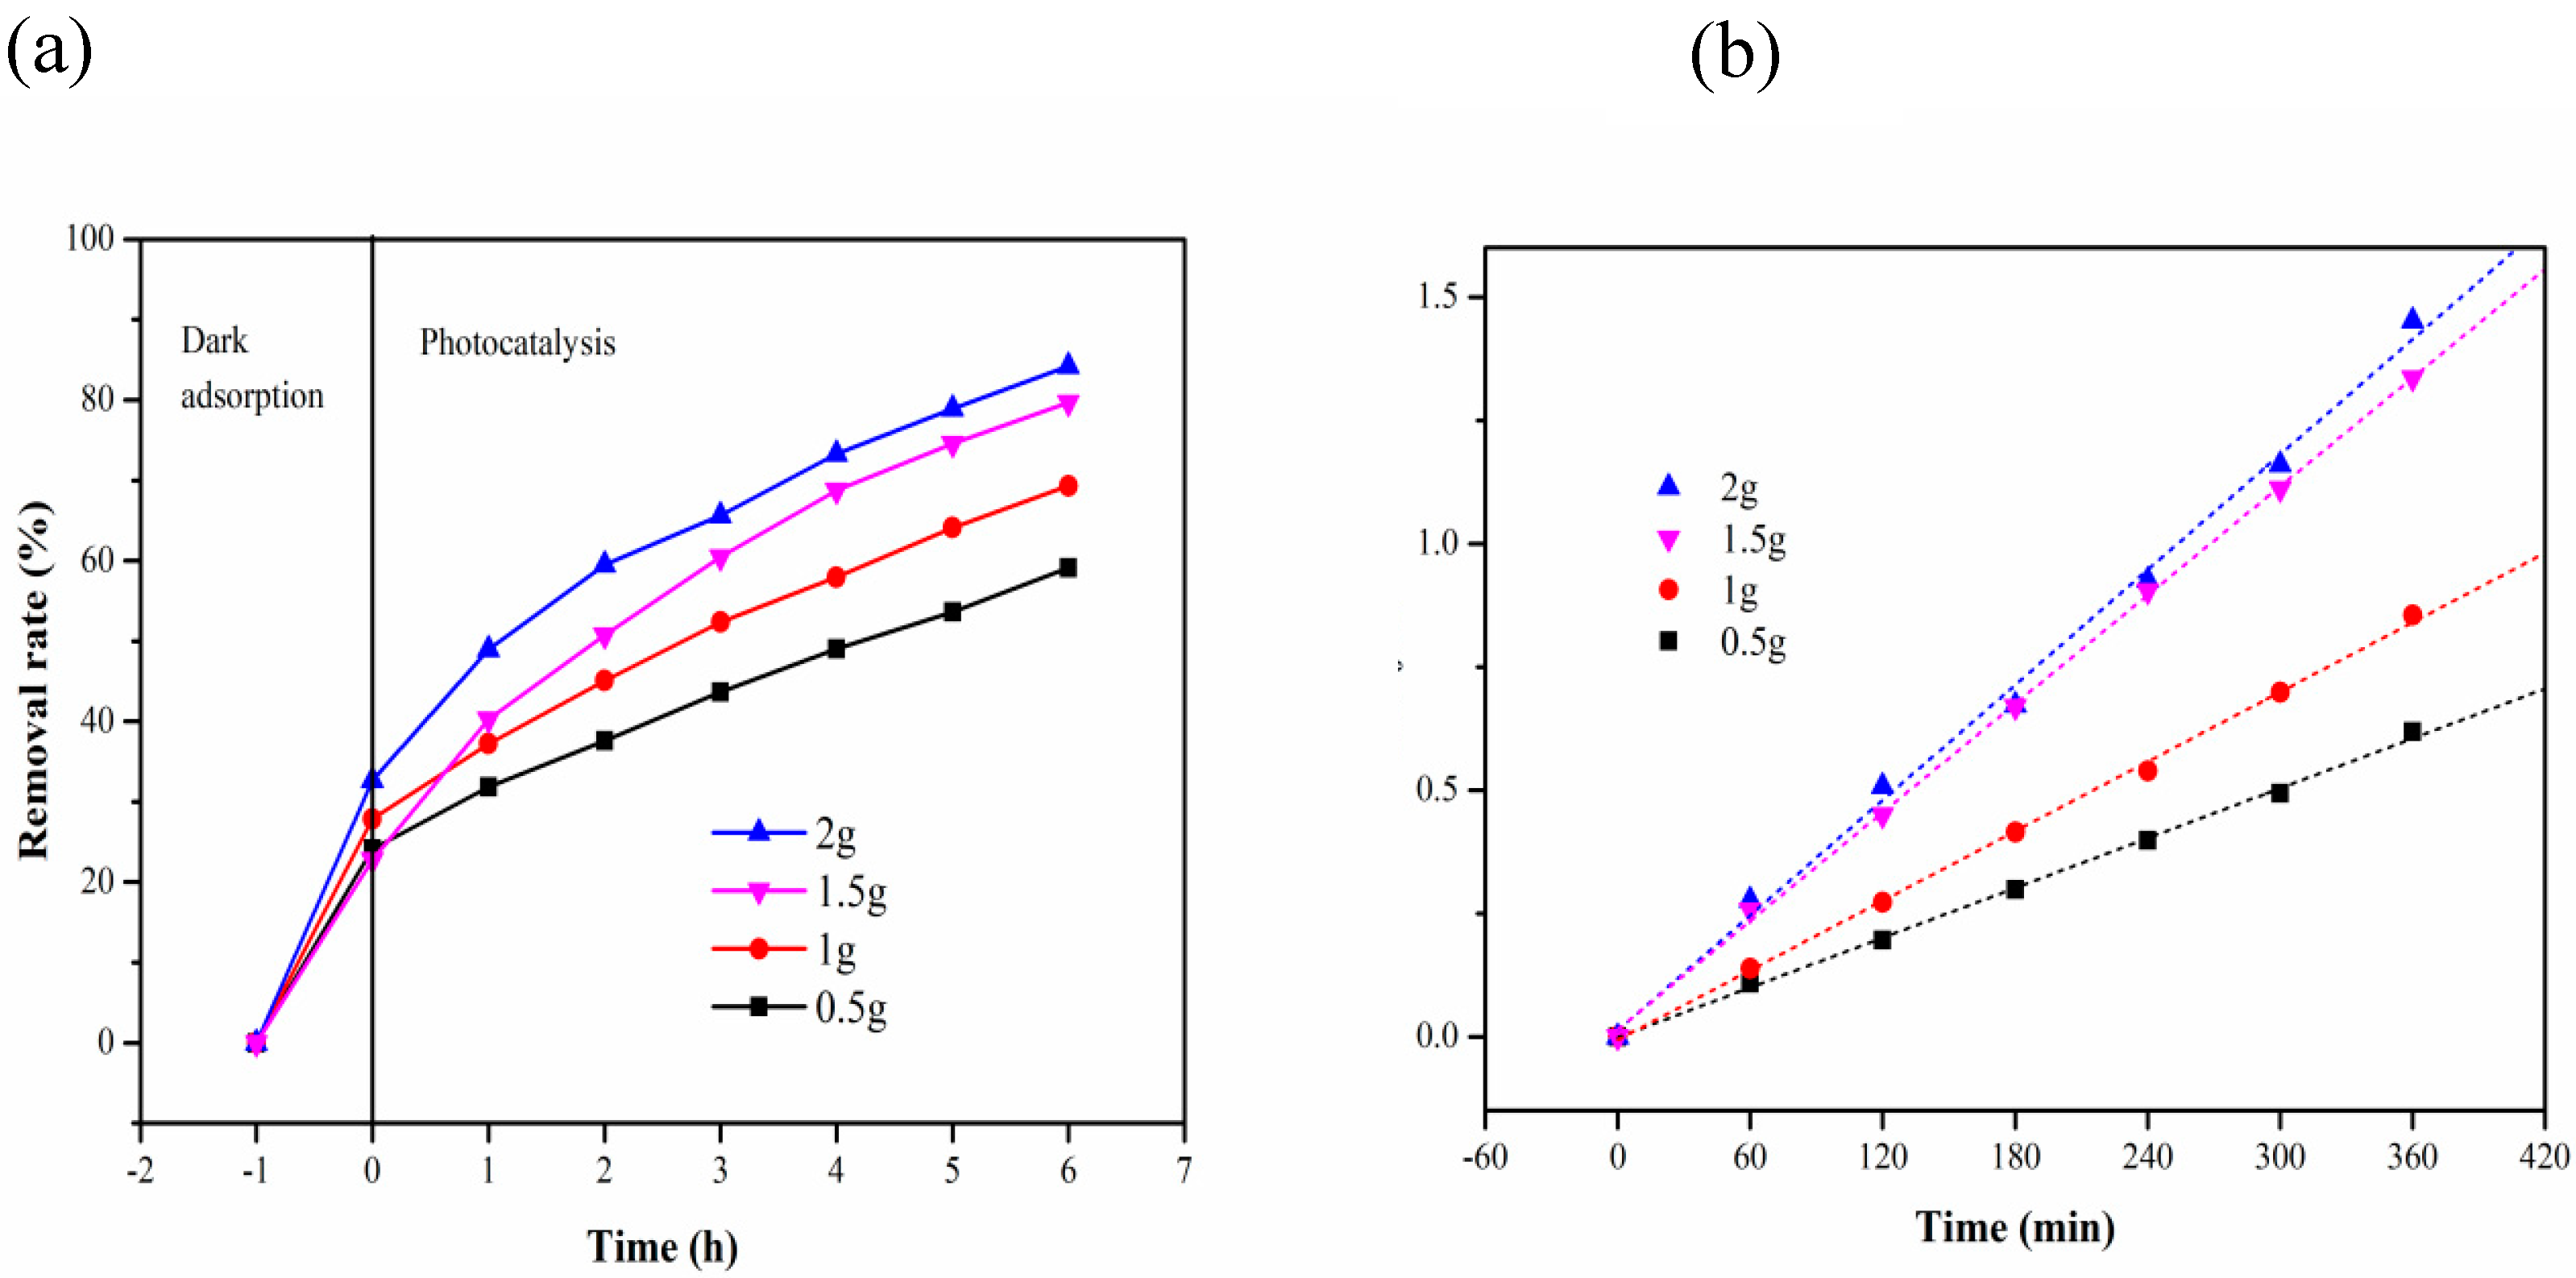
| Time (h) Carrie Dosage (g) | 0.5 | 1 | 1.5 | 2 |
|---|---|---|---|---|
| −1 | 0 | 0 | 0 | 0 |
| 0 | 24.09 | 27.88 | 22.74939 | 32.68 |
| 2 | 31.87 | 37.21 | 40.26764 | 48.96 |
| 3 | 37.59 | 45.09 | 50.72993 | 59.51 |
| 4 | 43.67 | 52.36 | 60.46229 | 65.63 |
| 5 | 49.03 | 57.94 | 68.73479 | 73.31 |
| 6 | 53.65 | 64.12 | 74.57421 | 78.91 |
| 7 | 59.12 | 69.33 | 79.6837 | 84.24 |
| Carrier Addition | Kinetic Equation | k (min−1) | R2 |
|---|---|---|---|
| 0.5 g | In(C0/C) = 0.00168 t − 0.00131 | 1.68 × 10⁻³ | 0.9982 |
| 1 g | In(C0/C) = 0.00235 t − 0.00641 | 2.35 × 10⁻³ | 0.9986 |
| 1.5 g | In(C0/C) = 0.00367 t + 0.01439 | 3.67 × 10⁻³ | 0.9992 |
| 2 g | In(C0/C) = 0.00389 t + 0.014274 | 3.89 × 10⁻³ | 0.9954 |
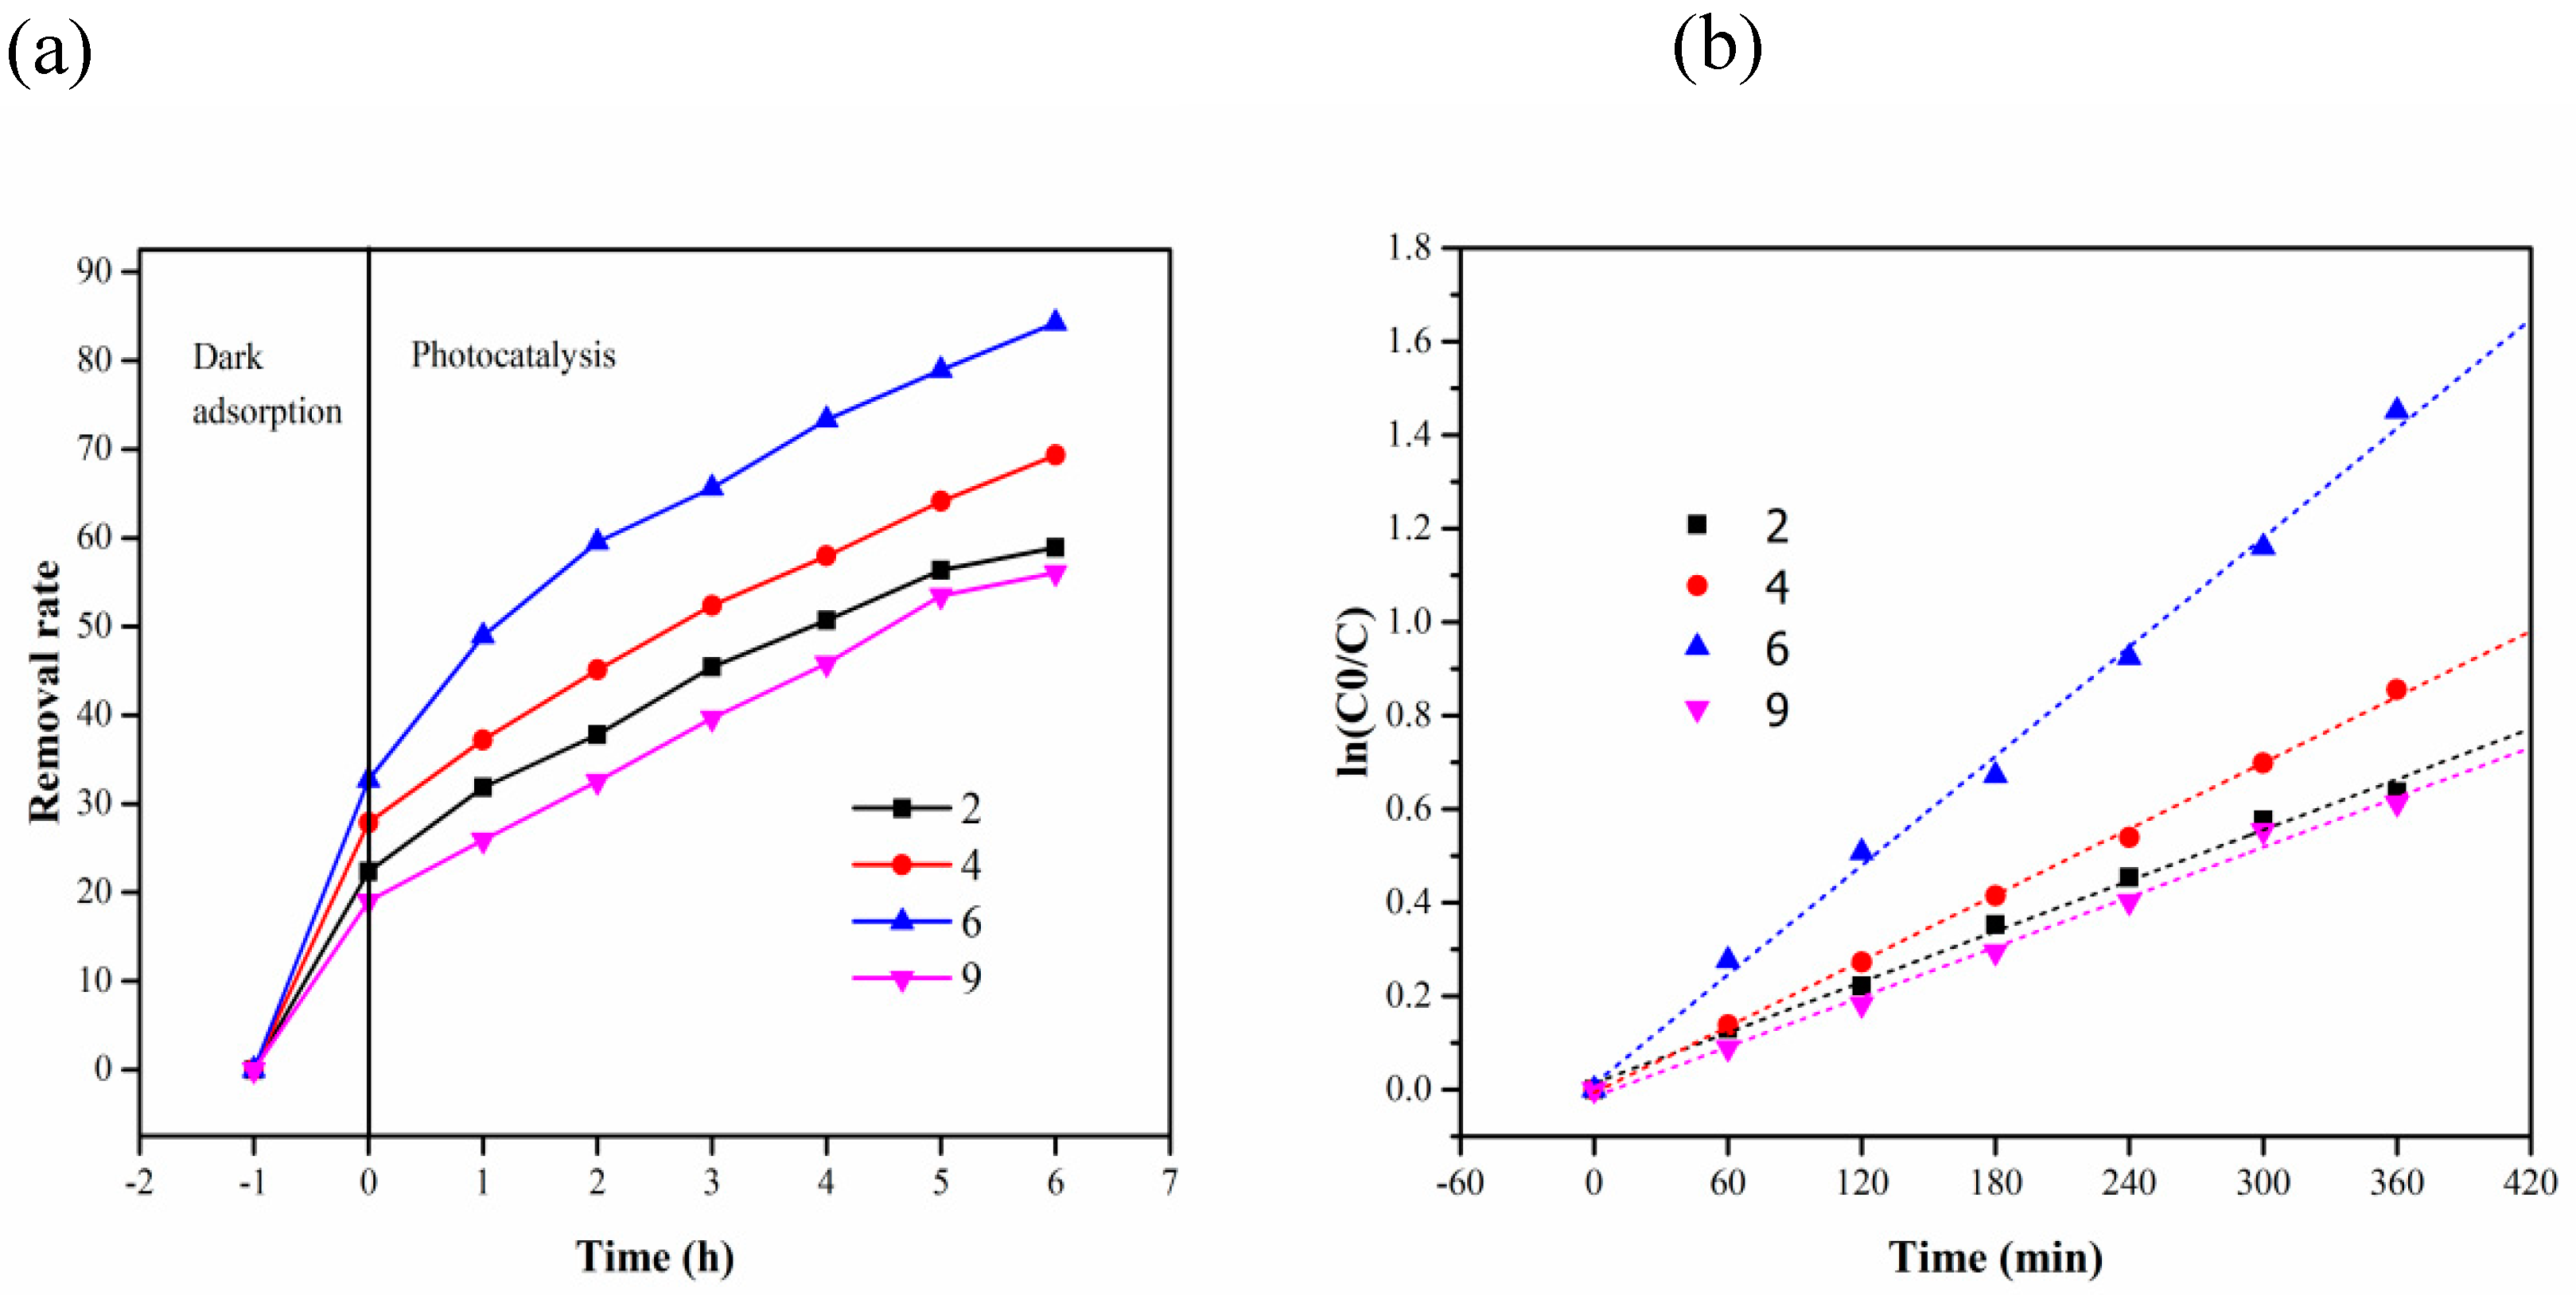
| Time (h) pH | 2 | 4 | 6 | 9 |
|---|---|---|---|---|
| −1 | 0 | 0 | 0 | 0 |
| 0 | 22.33129 | 27.87879 | 32.68229 | 18.97507 |
| 2 | 31.82822 | 37.21212 | 48.95833 | 25.90028 |
| 3 | 37.80429 | 45.09091 | 59.50521 | 32.54848 |
| 4 | 45.44785 | 52.36364 | 65.625 | 39.65928 |
| 5 | 50.69325 | 57.93939 | 73.30729 | 45.84488 |
| 6 | 56.35583 | 64.12121 | 78.90625 | 53.4626 |
| 7 | 58.89571 | 69.33333 | 84.24479 | 56.09418 |
| pH | Kinetic Equation | k (min−1) | R2 |
|---|---|---|---|
| 2 | In(C0/C) = 0.00181 t + 0.01402 | 1.81 × 10⁻³ | 0.9935 |
| 4 | In(C0/C) = 0.00227 t − 0.00641 | 2.27 × 10⁻³ | 0.9916 |
| 6 | In(C0/C) = 0.00398 t + 0.01274 | 3.98 × 10⁻³ | 0.9925 |
| 9 | In(C0/C) = 0.00178 t − 0.01478 | 1.78 × 10⁻³ | 0.9922 |
© 2020 by the authors. Licensee MDPI, Basel, Switzerland. This article is an open access article distributed under the terms and conditions of the Creative Commons Attribution (CC BY) license (http://creativecommons.org/licenses/by/4.0/).
Share and Cite
Xiong, J.; Liang, Y.; Cheng, H.; Guo, S.; Jiao, C.; Zhu, H.; Wang, S.; Liang, J.; Yang, Q.; Chen, G. Preparation and Photocatalytic Properties of a Bagasse Cellulose-Supported Nano-TiO2 Photocatalytic-Coupled Microbial Carrier. Materials 2020, 13, 1645. https://doi.org/10.3390/ma13071645
Xiong J, Liang Y, Cheng H, Guo S, Jiao C, Zhu H, Wang S, Liang J, Yang Q, Chen G. Preparation and Photocatalytic Properties of a Bagasse Cellulose-Supported Nano-TiO2 Photocatalytic-Coupled Microbial Carrier. Materials. 2020; 13(7):1645. https://doi.org/10.3390/ma13071645
Chicago/Turabian StyleXiong, Jianhua, Yinna Liang, Hao Cheng, Shuocheng Guo, Chunlin Jiao, Hongxiang Zhu, Shuangfei Wang, Jiaxiang Liang, Qifeng Yang, and Guoning Chen. 2020. "Preparation and Photocatalytic Properties of a Bagasse Cellulose-Supported Nano-TiO2 Photocatalytic-Coupled Microbial Carrier" Materials 13, no. 7: 1645. https://doi.org/10.3390/ma13071645
APA StyleXiong, J., Liang, Y., Cheng, H., Guo, S., Jiao, C., Zhu, H., Wang, S., Liang, J., Yang, Q., & Chen, G. (2020). Preparation and Photocatalytic Properties of a Bagasse Cellulose-Supported Nano-TiO2 Photocatalytic-Coupled Microbial Carrier. Materials, 13(7), 1645. https://doi.org/10.3390/ma13071645