Article

Determination of an Objective Criterion for the Assessment of the Feasibility of an Instrumented Indentation Test on Rough Surfaces

by
Julie Marteau
1,*,
Abdeljalil Jourani
1 and
Maxence Bigerelle
2
1
Laboratoire Roberval FRE-CNRS 2012, Centre de Recherches de Royallieu, Sorbonne Université, Université de Technologie de Compiègne, 60200 Compiègne, France
2
Laboratoire d’Automatique, de Mécanique et d’Informatique industrielle et Humaine (LAMIH) UMR-CNRS 8201, Université Polytechnique des Hauts de France, Le Mont Houy, 59313 Valenciennes, France
*
Author to whom correspondence should be addressed.
Materials 2020, 13(7), 1589; https://doi.org/10.3390/ma13071589
Submission received: 29 February 2020 / Revised: 23 March 2020 / Accepted: 26 March 2020 / Published: 30 March 2020
(This article belongs to the Special Issue Tribology: Friction and Wear of Engineering Materials)

Abstract

:
The influence of roughness on the results of indentation testing was investigated using a semianalytical model. This model used simulated surfaces that were described using three standard roughness parameters: the root-mean-square deviation Sq, the wavelength (or cut-off of Gaussian high-pass filter), and the fractal dimension. It was shown that Sq had the largest effect on the determination of the macrohardness, while the surface wavelength and fractal dimension had negligible effects at the scale of investigation. The error of determination of the macrohardness rose with the increase of the ratio Sq/hmax where hmax was the maximum indentation depth: Sq/hmax ratios lower than 0.02 were required to obtain a systematic error of the macrohardness lower than 5%, whatever the examined material mechanical properties (in elasticity and plasticity).

1. Introduction

Instrumented indentation testing is a widely used technique for the determination of mechanical properties. However, smooth surfaces are required to avoid the introduction of uncertainties in the determination of the contact area [1]. The need for smooth surfaces can be an issue for different reasons:
(i)
If the investigation of the material properties of a given component is required, then surface preparation may not be wished for to avoid affecting the surface properties or to avoid deteriorating the component.
(ii)
It is impossible to have a surface free of any roughness: whatever the surface preparation, there is always residual roughness that may impact the very small scales.
The impact of roughness on the indentation results was investigated by several authors. Walter et al. [2] used finite element simulation to examine the influence of roughness on the scattering of indentation curves and on the computation of Young’s modulus using the Oliver–Pharr method [3]. Similarly, Li et al. [4] analyzed the effect of roughness on the determination of hardness using finite element simulation. Wei et al. [5] developed a new model for the examination of microcontact to assess the impact of surface roughness on the contact force and the contact area. Qasmi et al. [6] tested several materials presenting different surface morphologies to quantify the influence of the value of the root-mean-square roughness parameter on the computed Young’s modulus and hardness values. Similarly, Jiang et al. [7] coupled finite element methods with atomic methods to assess the effect of roughness on the computation of Young’s modulus and hardness on thin films of single-crystal copper. They found that neglecting roughness effects required indentation depths much larger than the characteristic size of surface roughness. According to the International Standard ISO 14577-1 [8], the arithmetic average roughness Ra should be less than 5% of the maximum indentation depth. Thus, some experimenters use larger loads to rule out roughness influence: as an example, Wai et al. [9] showed that higher loads were needed in order to test rougher polymer samples. Other experimenters developed methods in order to determine mechanical properties despite non-negligible roughness. Arivuoli et al. [10] measured profiles before and after indentation to measure hardness at shallow depths of indentation. Kim et al. [11] proposed to analytically separate the work required to flatten the surface from the one required to deform the flattened surface. Souza et al. [12] corrected the tip-surface contact using a methodology based on the contact stiffness observation. Chicot et al. [13] proposed a methodology based on the correction of the loading curve using Proportional Specimen Resistance [14]. As for Bobji et al. [15], they presented a method that separated roughness from material property gradient but this method can only be used when respecting a defined geometry and when the indentation depth is larger than thrice the root-mean-square roughness.
The aim of this paper is to provide an objective criterion for assessing the feasibility of an instrumented indentation test on rough surfaces. This criterion will reflect the disturbances caused by the material morphology and will indicate if the results of the indentation test are appropriate for the determination of mechanical properties.

2. Materials and Methods

To assess the effect of roughness on the indentation curves and the resulting macrohardness, a semianalytical model of contact was applied on surfaces obtained with the Weierstrass function. This choice can be explained by several elements:
-
Surface roughness being stochastic, a large number of numerical simulations were required to obtain representative results. A semianalytical model was used to simulate numerous indentation tests on rough surfaces to get a high number of computations with low computation time.
-
Experimentally, it is impossible to change the morphology of a surface without impacting the subsurface properties. The use of the Weierstrass function was preferred to examine the influence of the characteristic parameters of the surface (e.g., amplitude, wavelength) independently of any material property changes. Inversely, the characteristic parameters of the surface can be modified without altering the mechanical properties of the surface.
-
This methodology avoided the introduction of any measurement noises or experimental artifacts.
As for the resulting macrohardness, it was computed using a methodology based on the minimization of the discrepancies between the shapes of the experimental loading curves and the shapes of the curves predicted by Kick’s law [16,17].

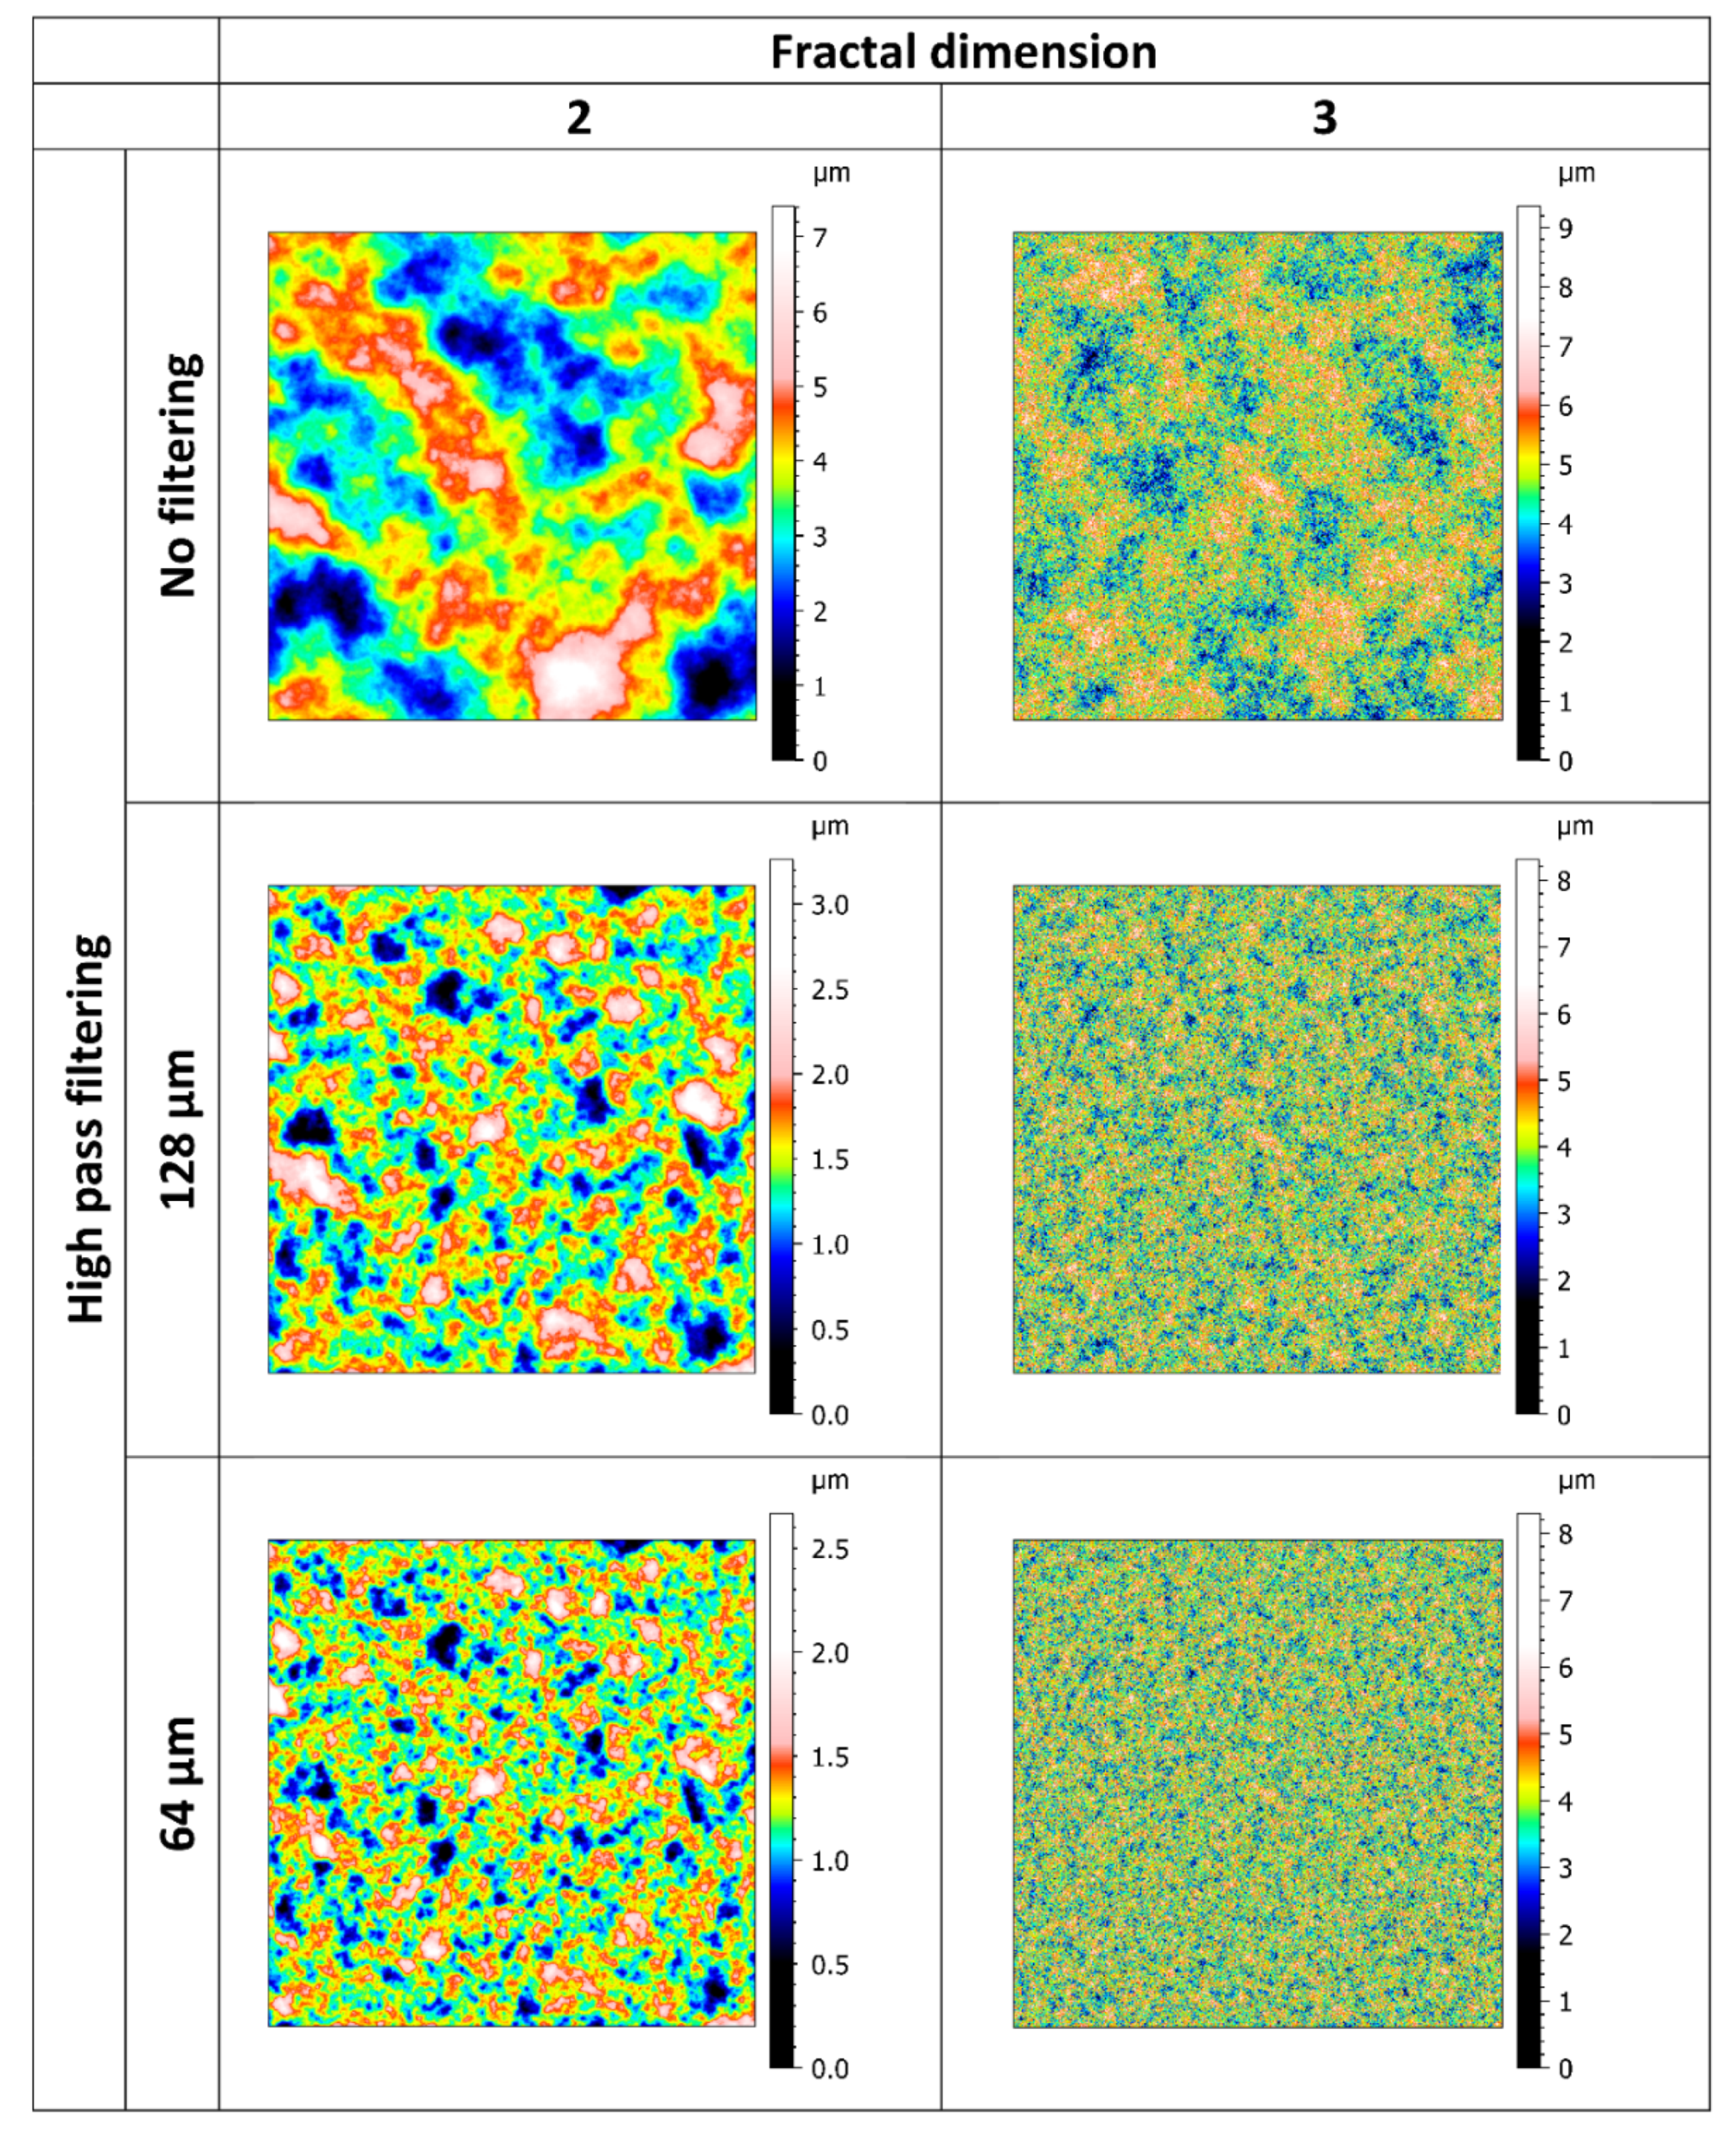
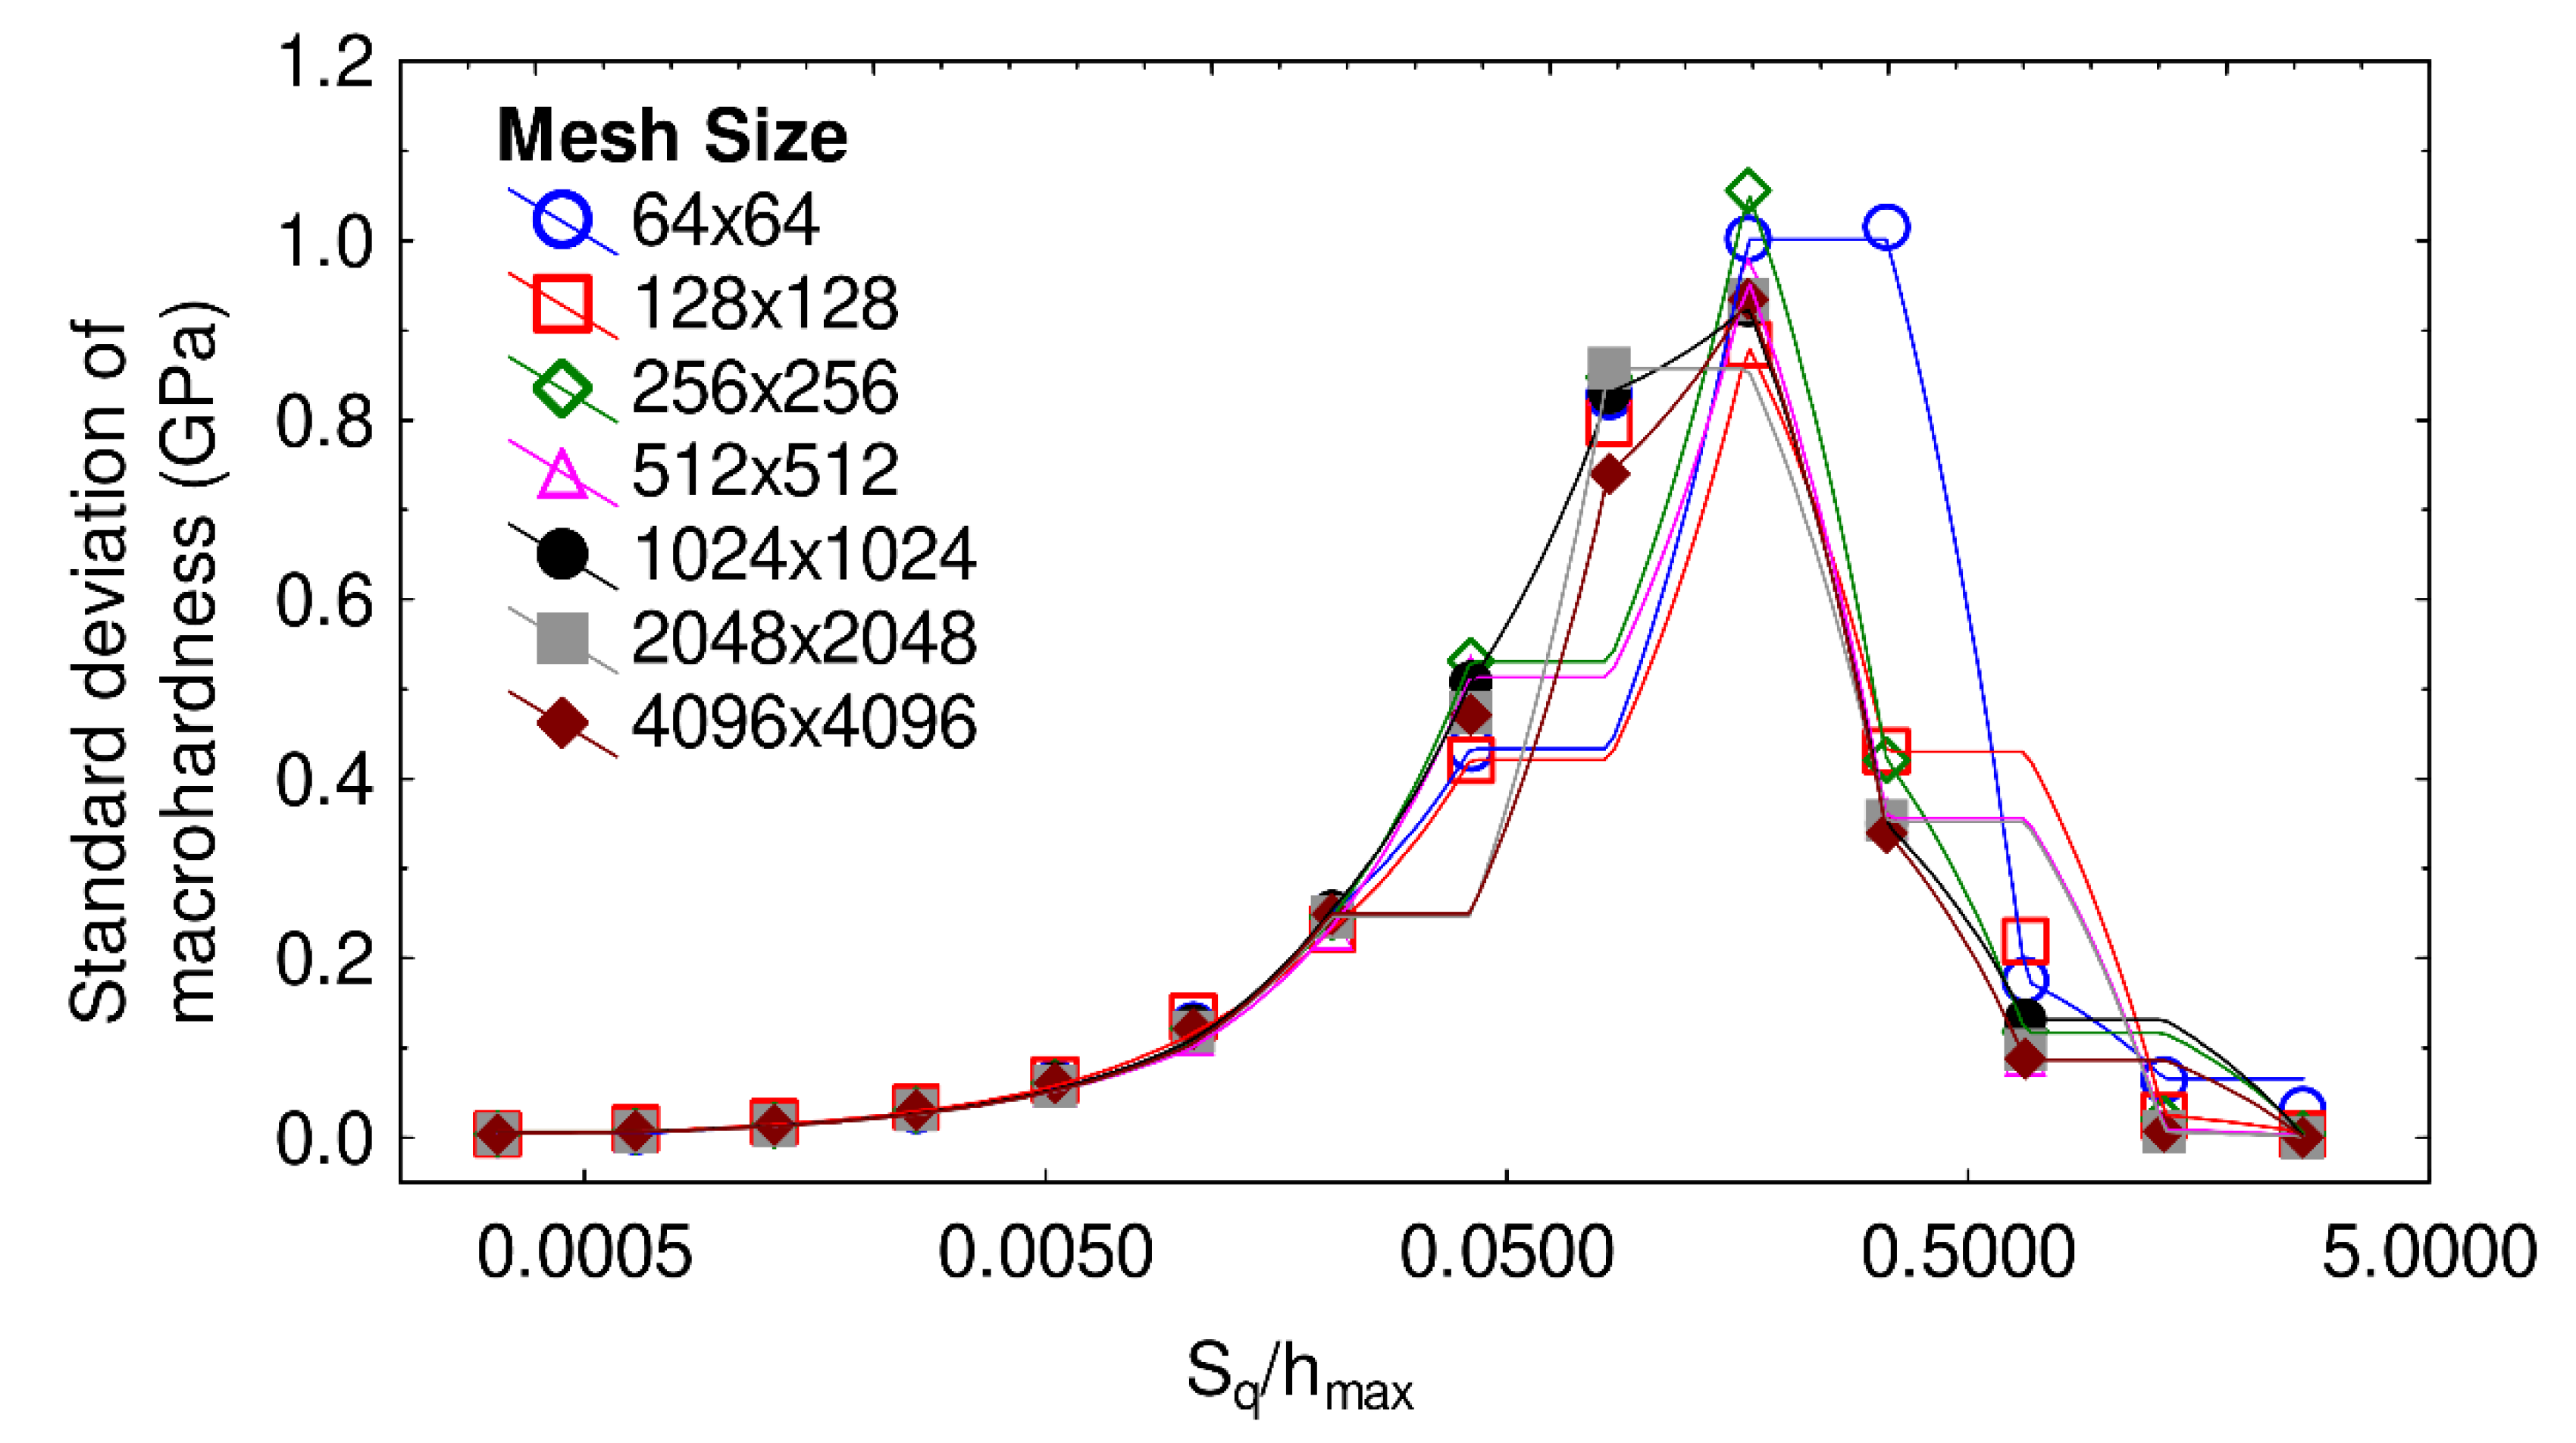
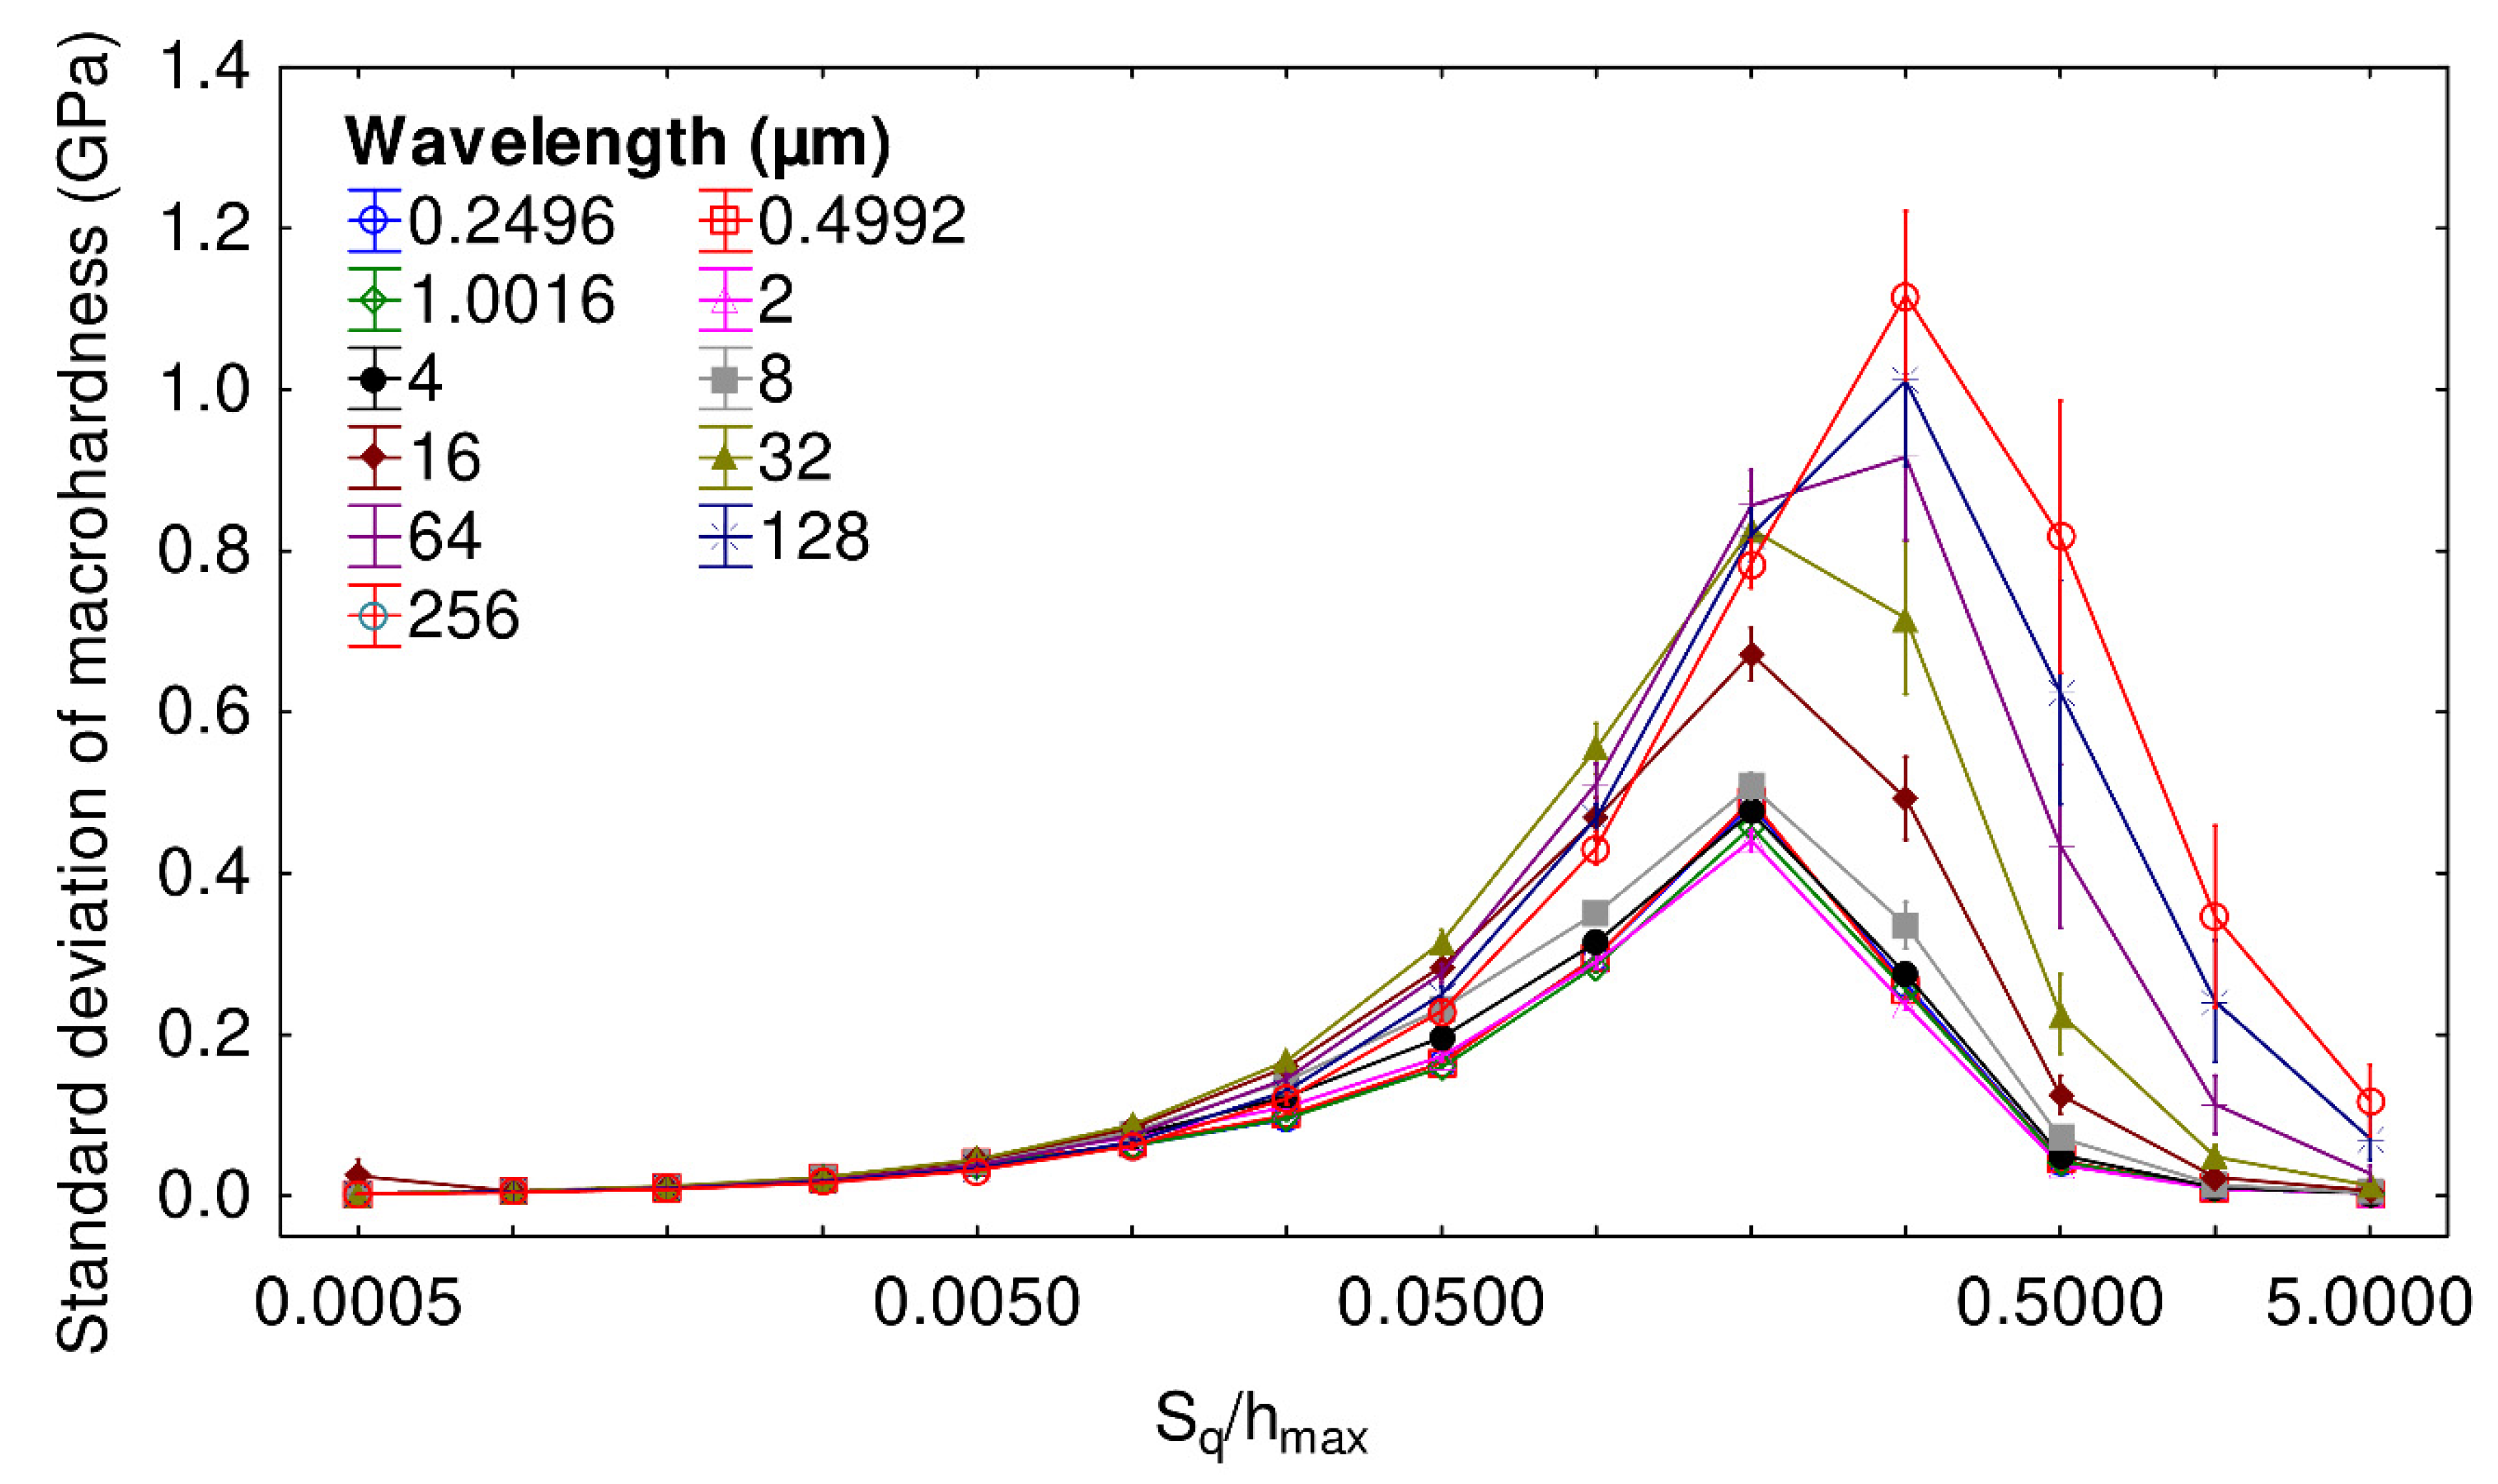
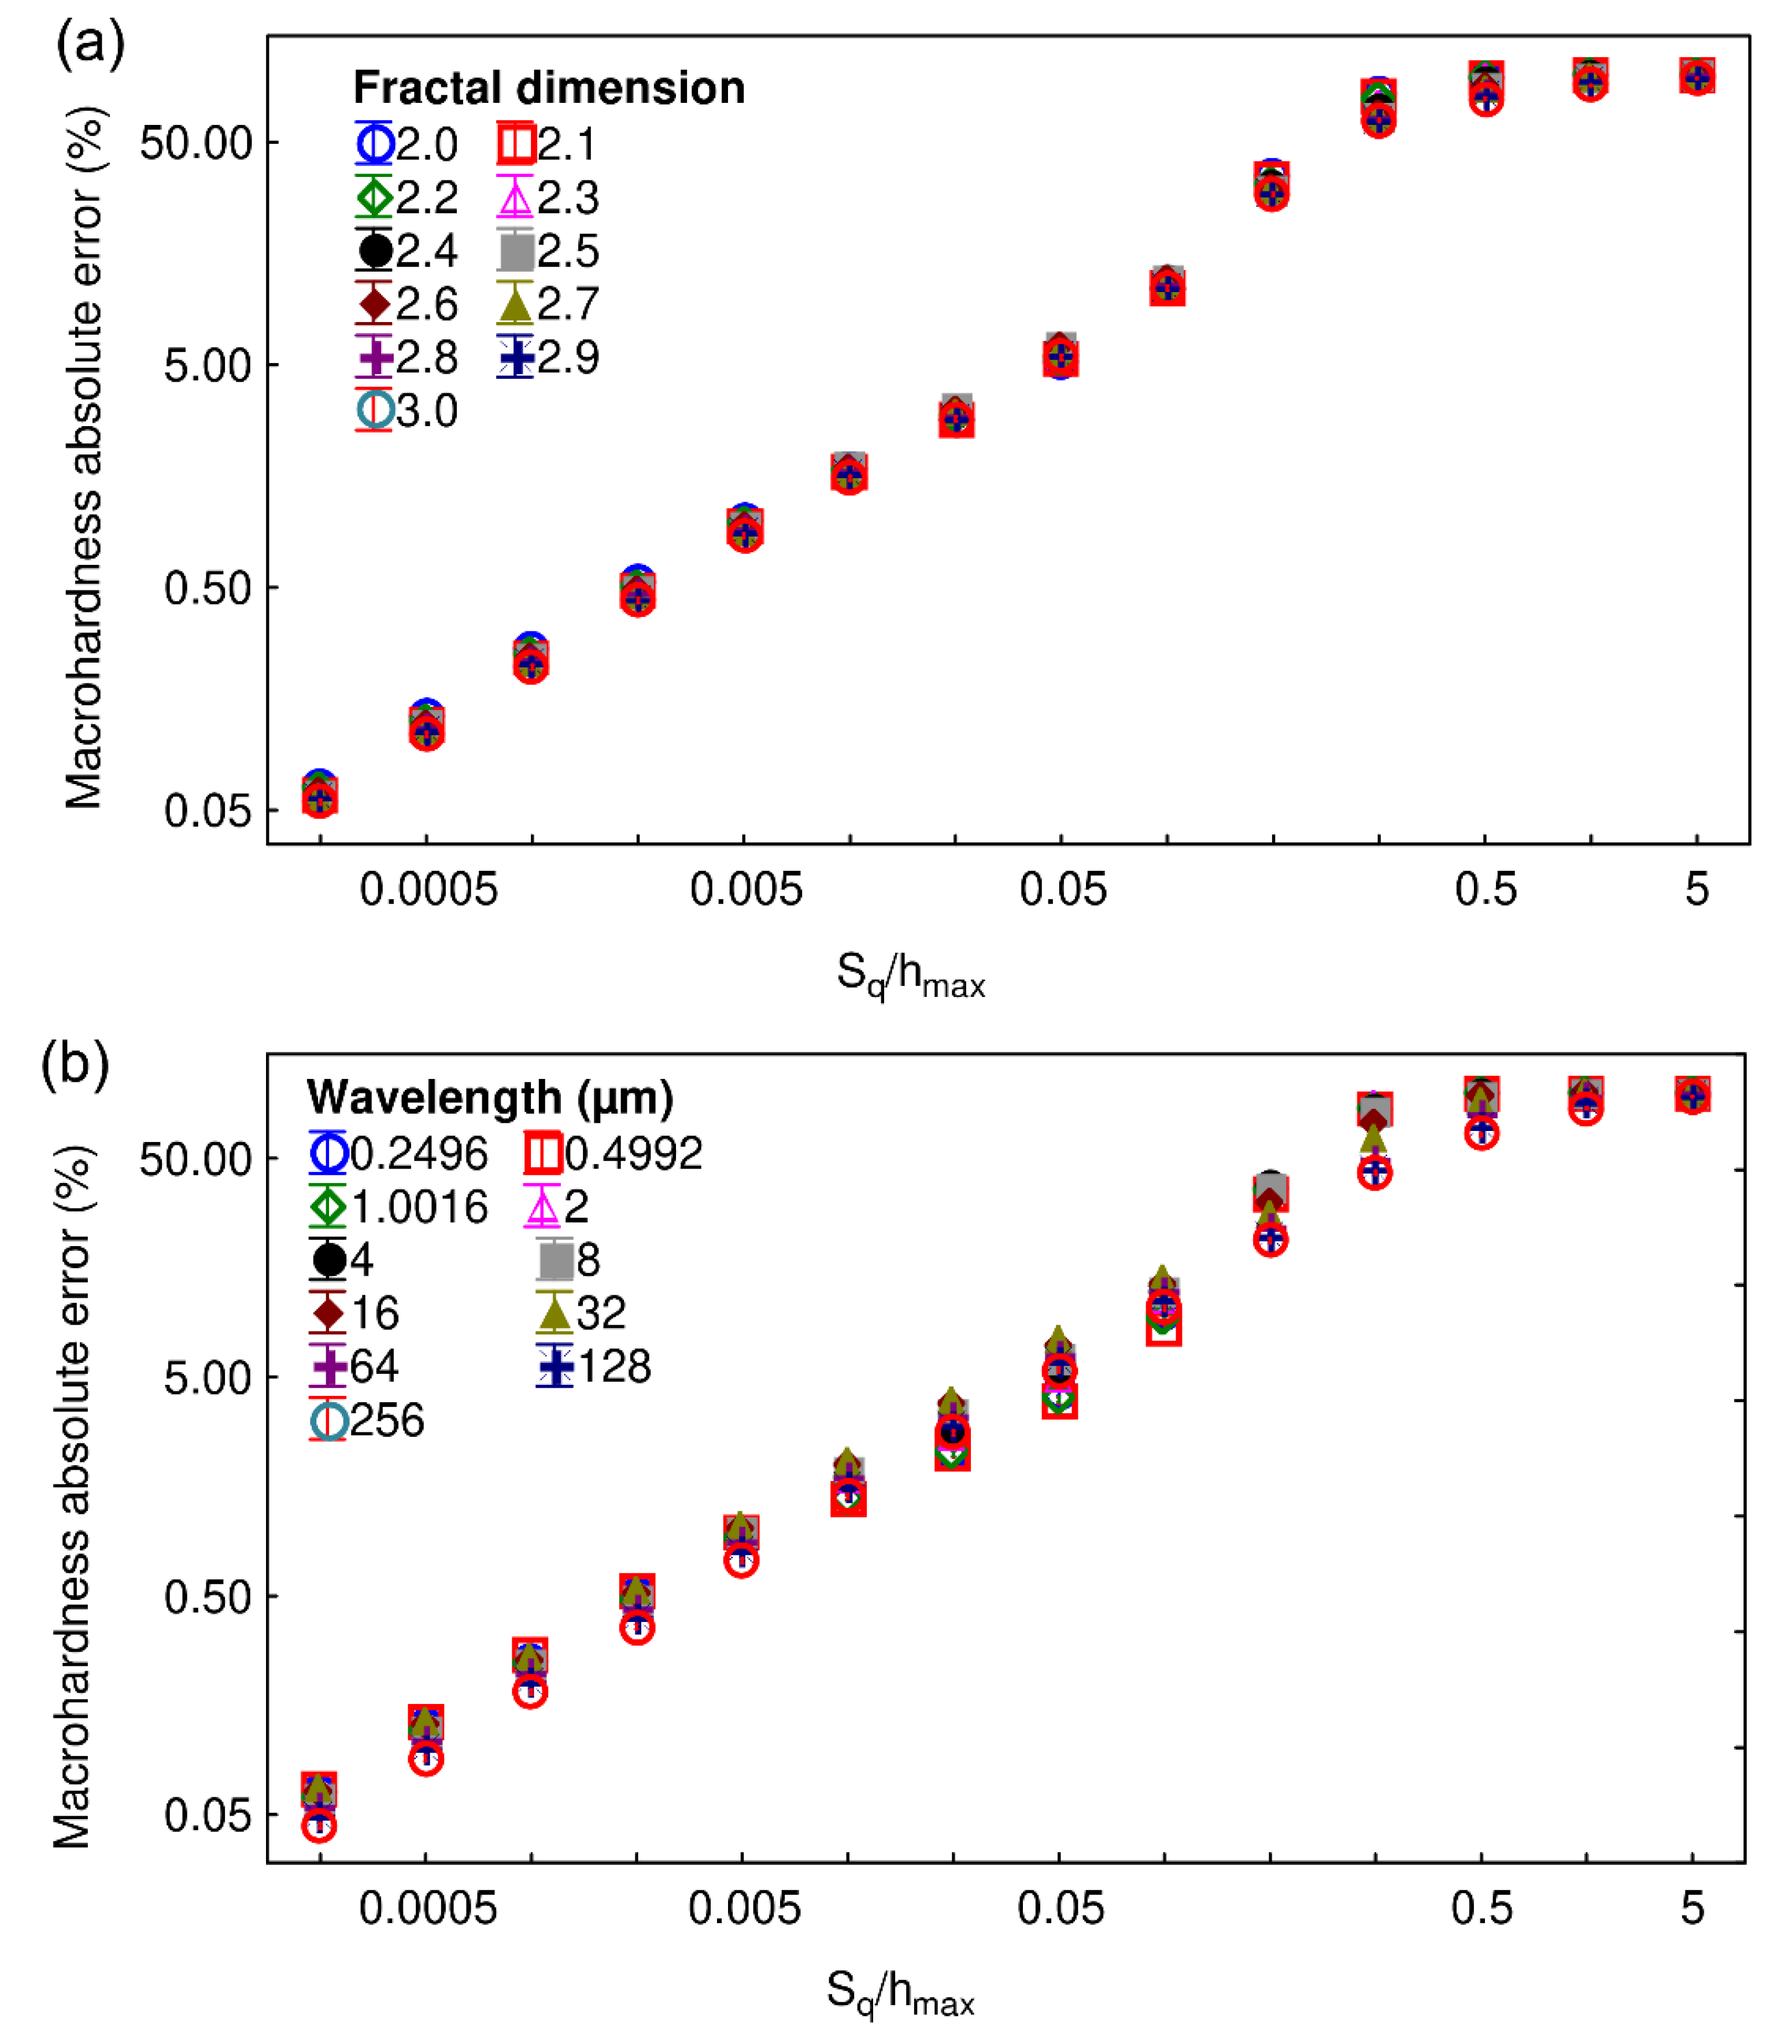
2.1. Surface Characteristics

The modified Weierstrass function was used to simulate the surfaces. Three-dimensional fractal Weierstrass surfaces W were defined as
W ( x , y ) = A   n 1 = 0 n 2 = 0 a n 1 n 2 γ n 1 + n 2 2 [ γ 2 n 1 + γ 2 n 2 ] H + 1 2 cos ( 2 π γ n 1 x + ϕ n 1 n 2 ) cos ( 2 π γ n 2 y + Ψ n 1 n 2 ) ,
where A is a scaling coefficient, an1,n2 is a normal random number, H is the Hölder exponent (H belongs to [0,1]), and γ is the frequency of the function with γ > 1. ϕn1,n2 and ψn1,n2 are stochastic phases of uniform density defined in [0,2π].
The created surfaces were characterized by three parameters:
-
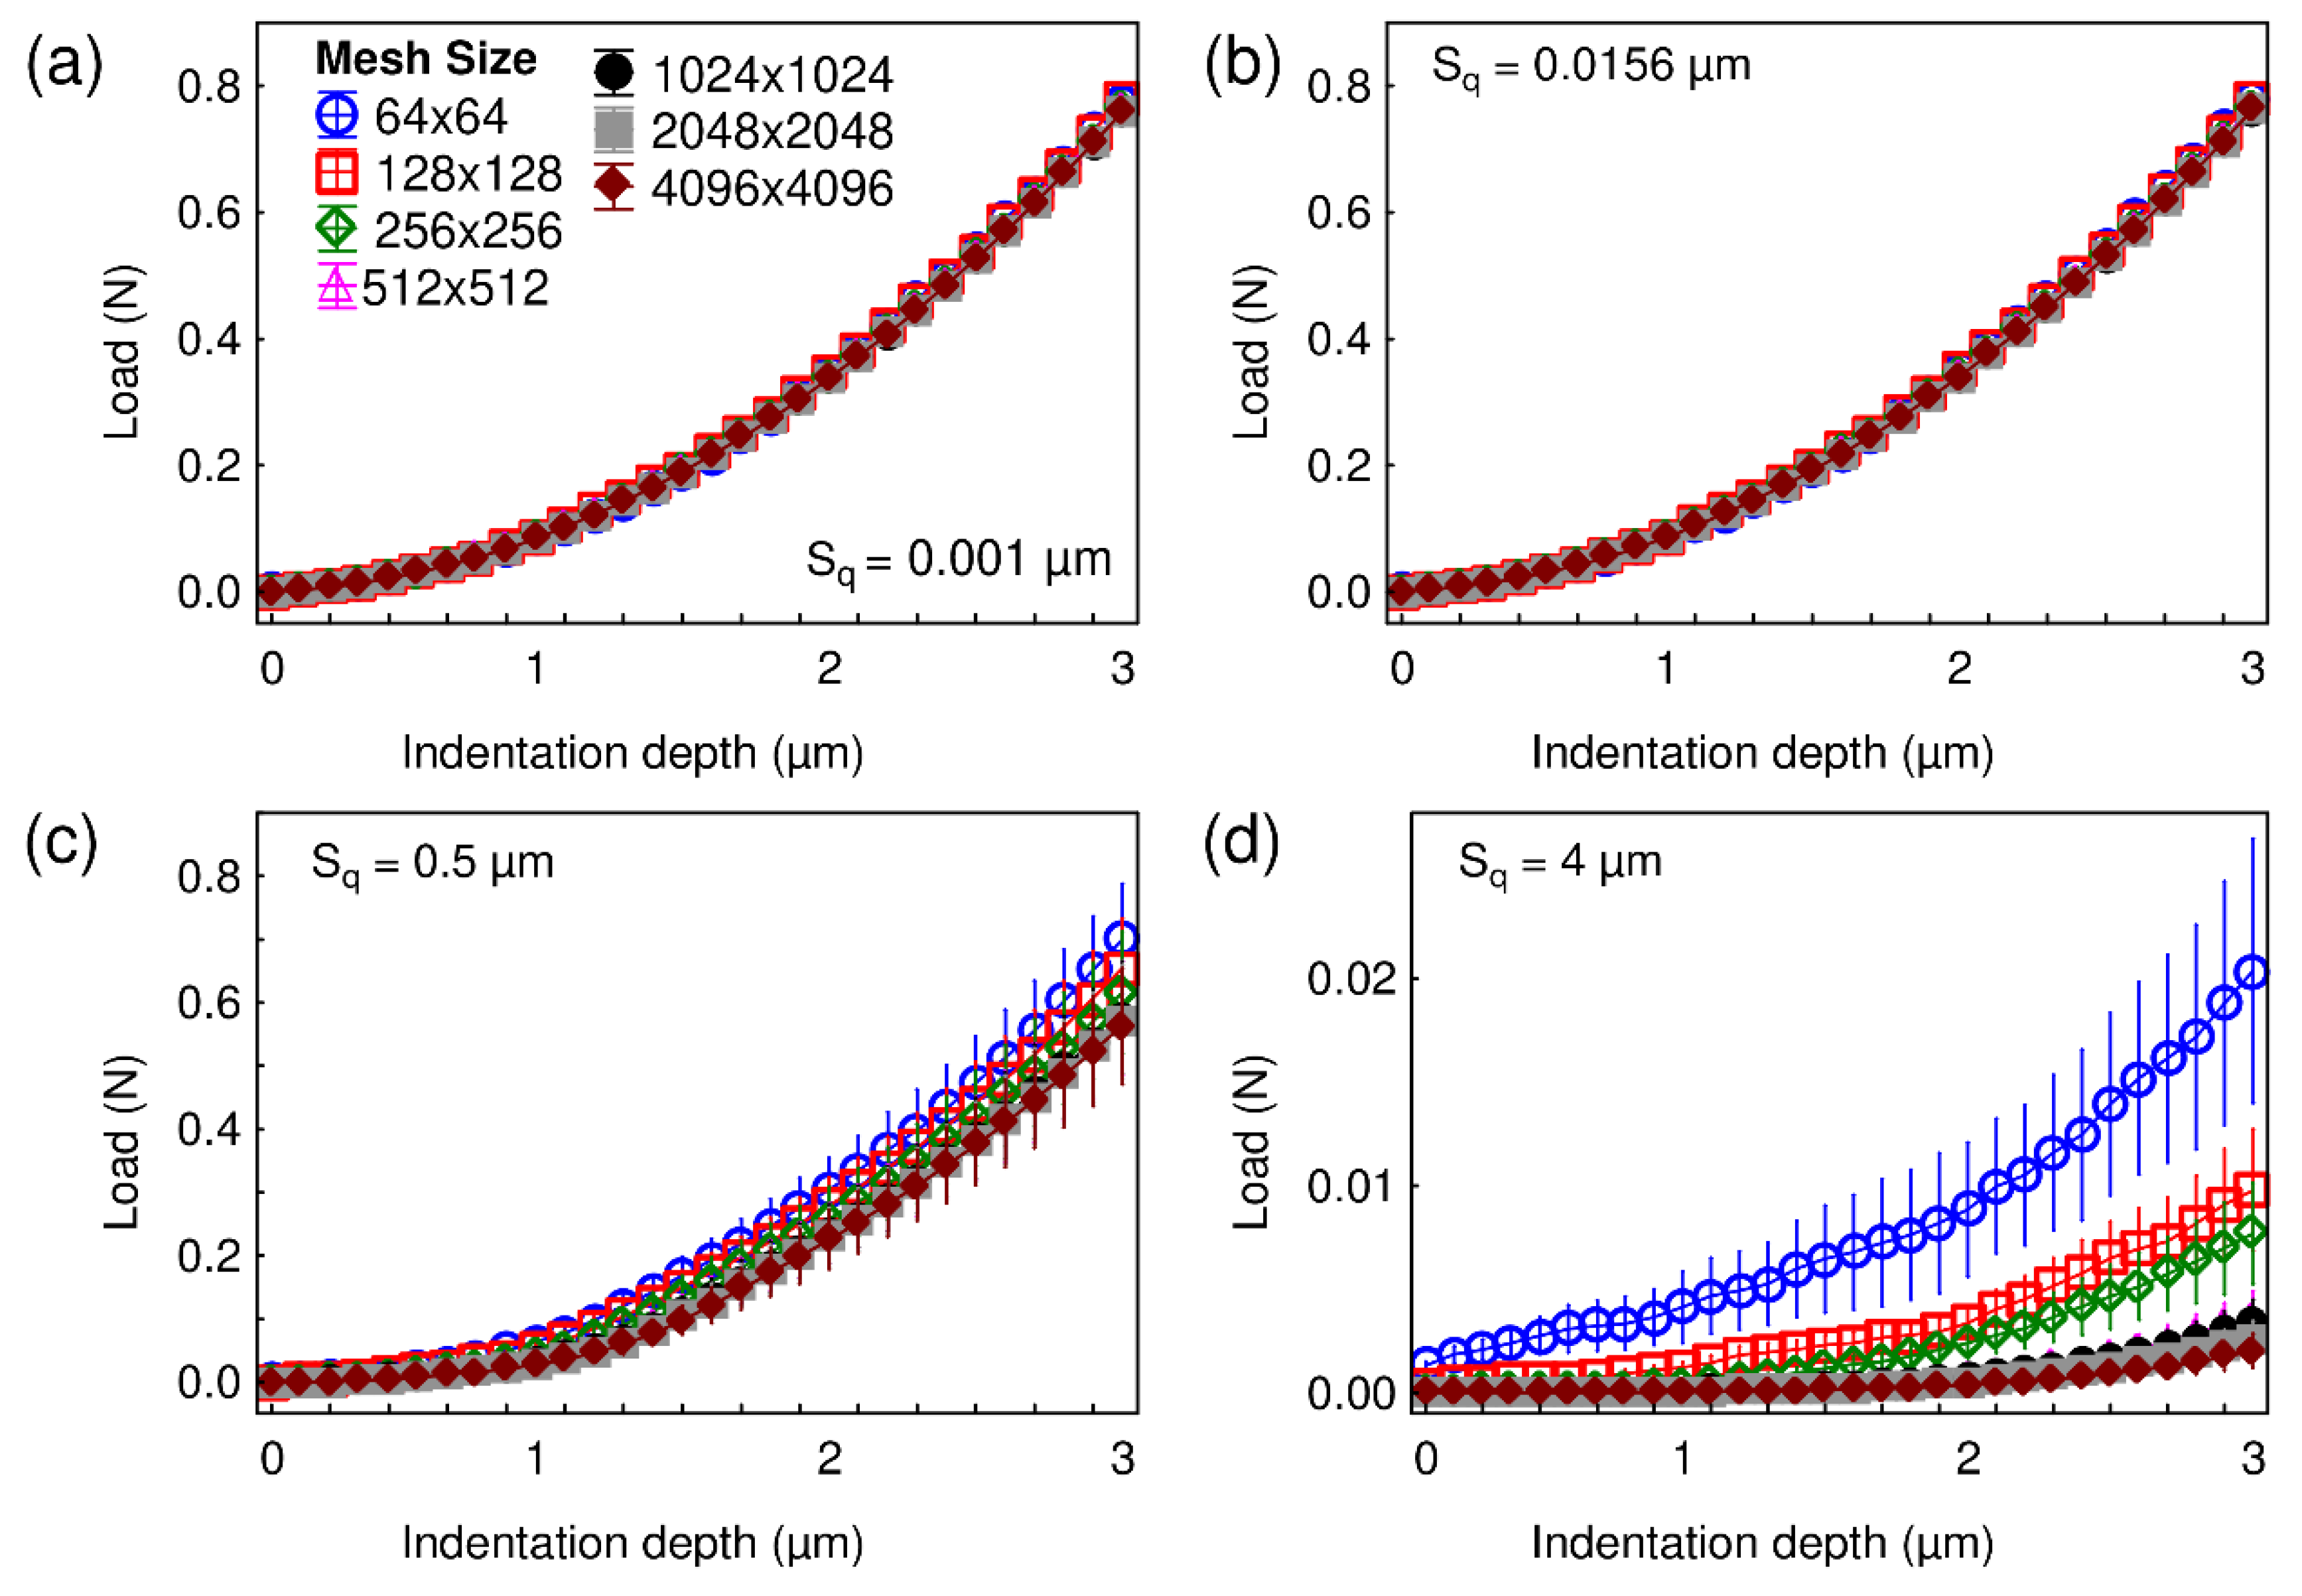
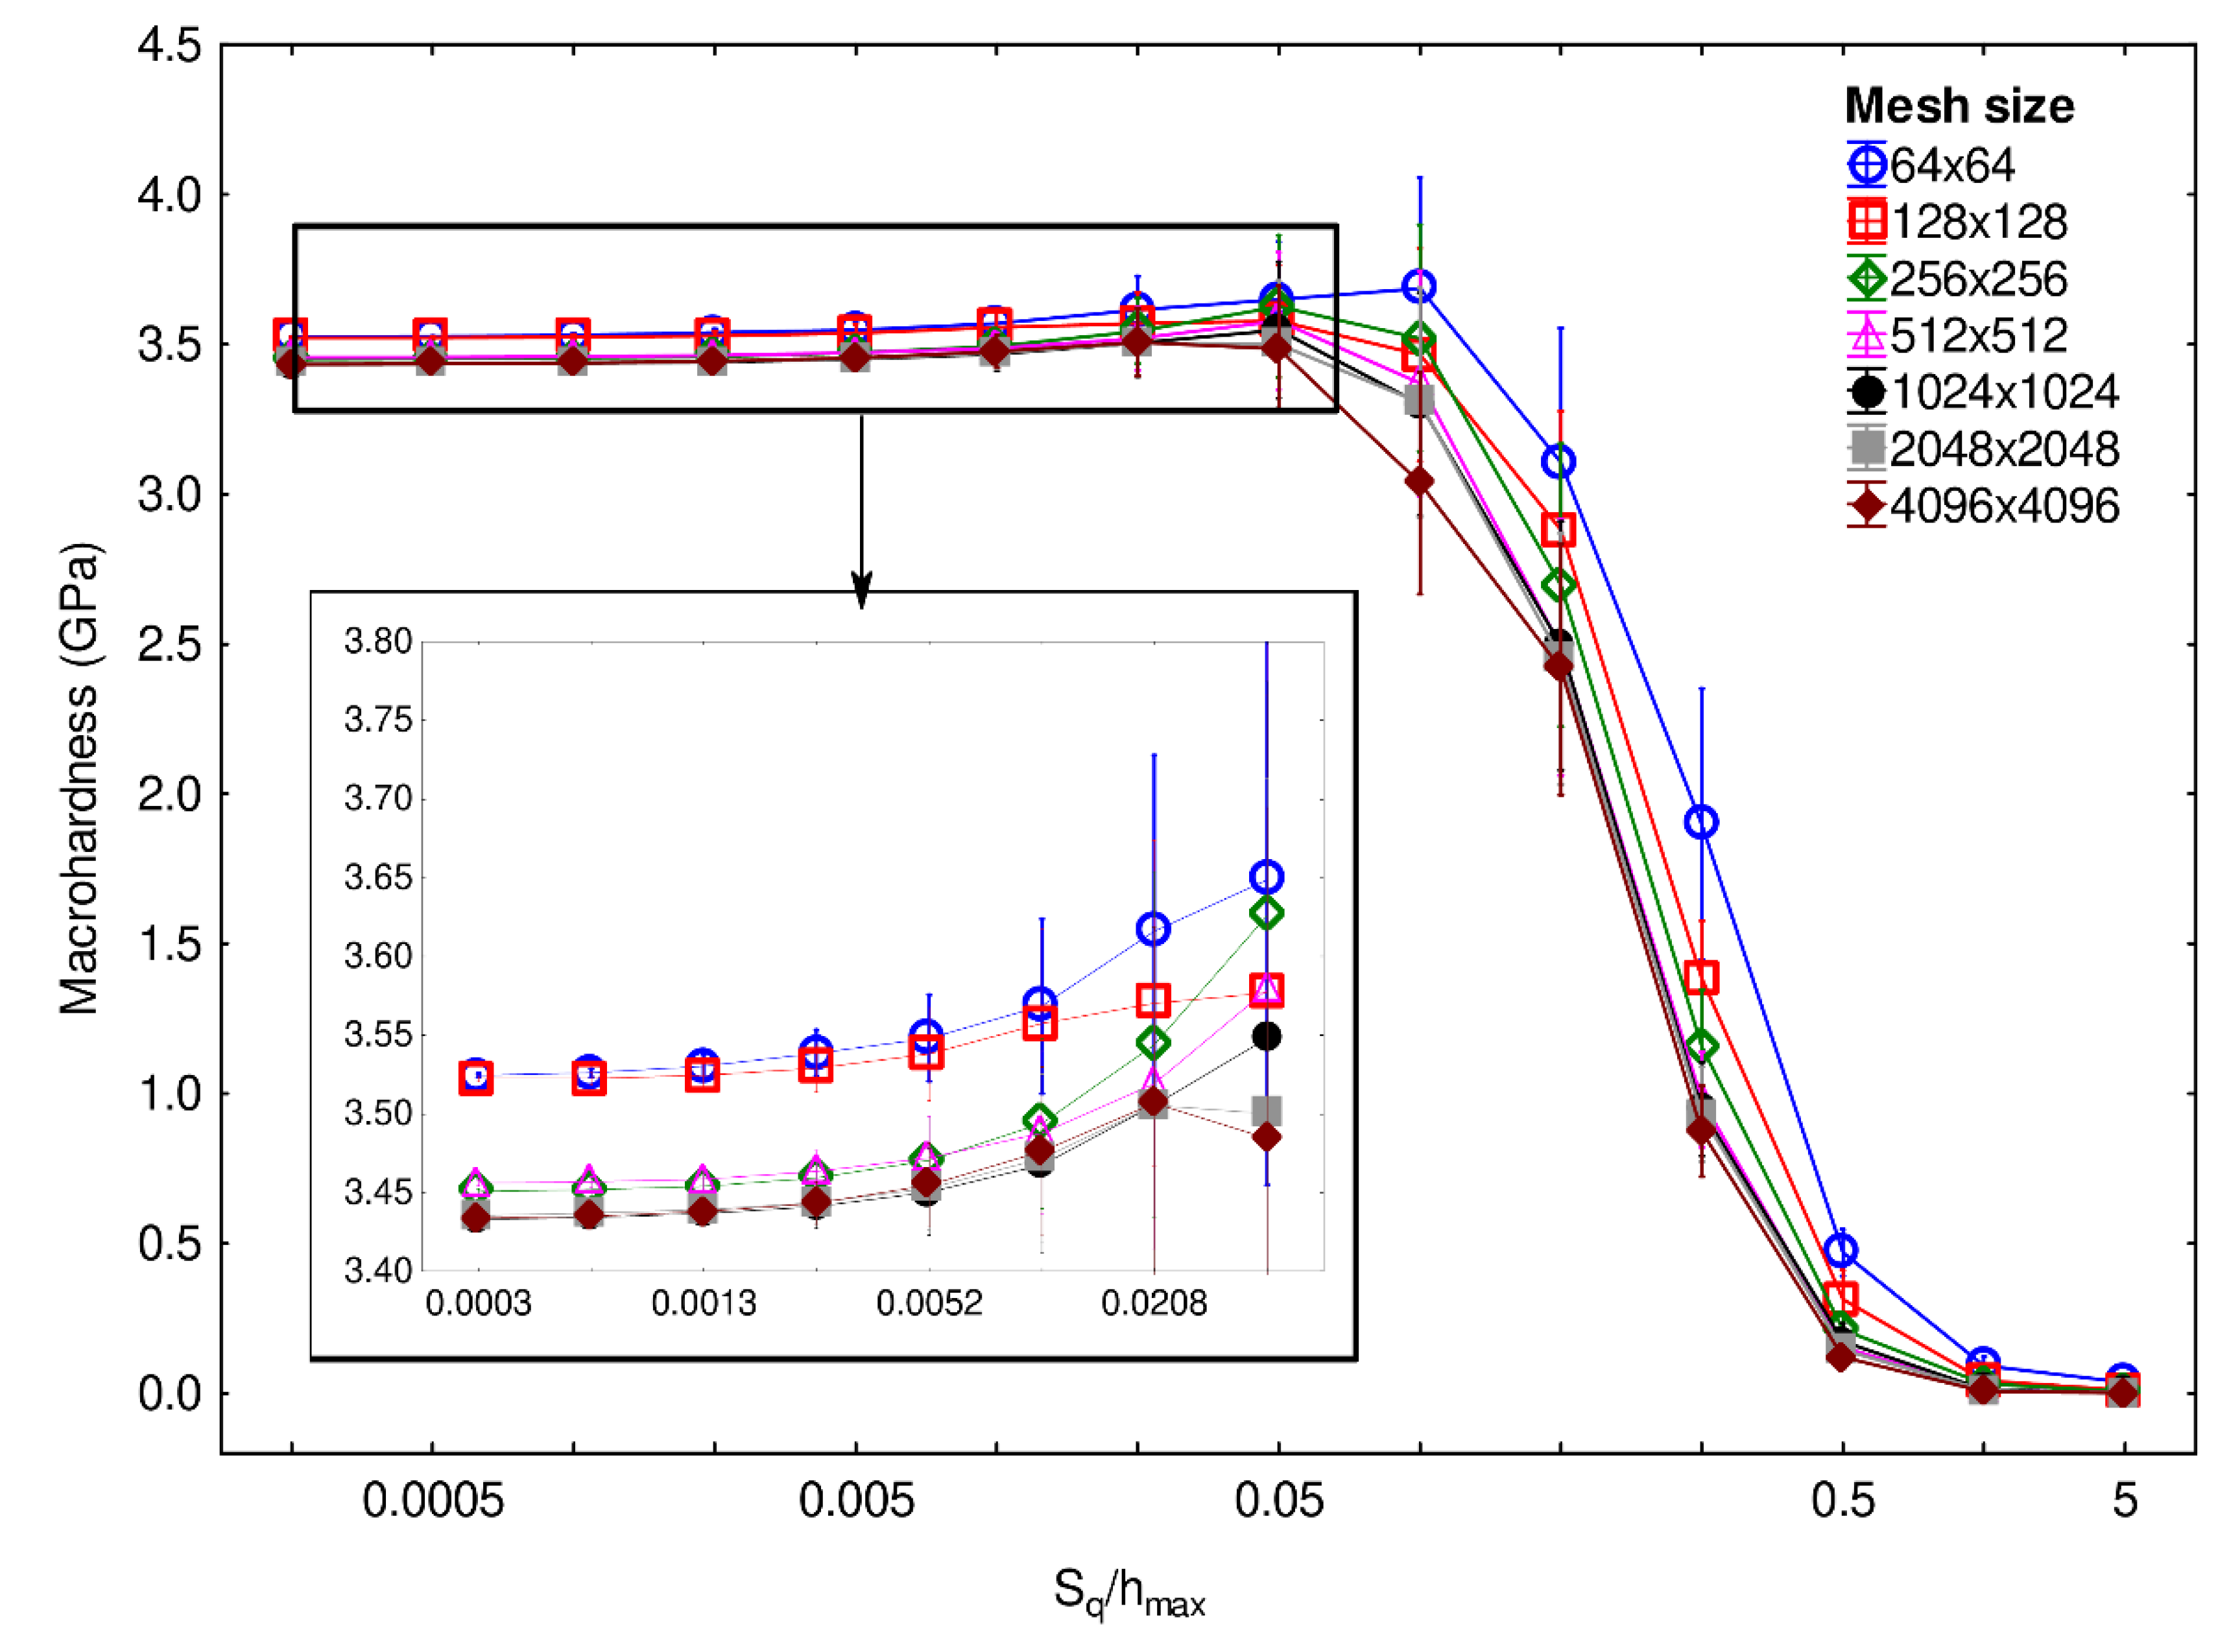
The amplitude described by the root-mean-square deviation Sq, as described in [18]. The following values were tested: 0.001, 0.002, 0.0039, 0.0078, 0.0156, 0.0313, 0.0625, 0.125, 0.25, 0.5, 1, 2, 4, and 8 µm. It should be noted that very small values of Sq are only used as asymptotic values.
-
The wavelength. The following values were used: 0.2496, 0.4992, 1.0016, 2, 4, 8, 16, 32, 64, 128, and 256 µm. To be consistent with the standard, the wavelength was not defined by series truncation of Equation (5) but was obtained with the cut-off frequency of Gaussian high-pass filtering as defined in [19].
-
Fractal dimension. Values ranging from 2 to 3 using an increment of 0.1 were used.
The effect of discretization was tested using different mesh sizes: 64 × 64, 128 × 128, 256 × 256, 512 × 512, 1024 × 1024, 2048 × 2048, and 4096 × 4096. All the produced surfaces were based on high resolution: no truncations were made on the Weierstrass function. Lower resolutions were obtained with an interpolation based on the spline function. Examples of Weierstrass surfaces are shown in Figure 1.

2.2. Description of the Semianalytical Model Used for Simulating Indentation Testing

The semianalytical model used for simulating indentation testing assumed that a rough and hard surface was in contact with a perfectly smooth rigid indenter having a Berkovich tip. Contacts were assumed to be local: they took place at the summits of the surface. The analysis of local summit geometry was used to numerically investigate the behavior of each asperity. Roughness was described as a series of cones having hemispherical end tips. The asperities were described using a distribution of contact angles. The semianalytical model was based on Johnson’s equations describing elastic-plastic indentation with a conical indenter [20]. According to Johnson’s equations, the mean pressure pjm undergone by a given asperity was
p j m = 2 3 R e ( 1 + ln ( E   t a n θ j 3 R e ) )
where Re is the elastic limit, E is Young’s modulus of the material, and θ is the attack angle. In this study, either an elastic deformation or a fully plastic deformation was assumed for the asperity. Elastic interactions between asperities were neglected. The full deformation led to
p m   ~   3 R e   ~   H t h
where Hth is the macrohardness of the material.
Computing was performed using elliptic local areas of contact with semiaxes aj and bj. This choice led to the elastoplastic deformation of the asperities being neglected. The local areas of contact were divided into N elements cji (i = 1, …, N). Local pressure on a given asperity j was distributed as follows:
p j ( x i , y i ) = 3 2 p j m ( 1 ( x i a j ) 2 ( y i b j ) 2 ) 1 / 2
The corresponding normal force Fj applied on an asperity was
F j = i c j i p i
The load applied to the summits of a rough surface was equal to the sum of the normal forces Fj. All the details of the numerical model can be found in [21].
The maximum indentation depth for the numerical simulations was equal to 3 µm. For most of the computations, the material Young’s modulus E was equal to 110 GPa and the elastic limit Re was set to 1050 MPa. Poisson’s coefficient was set to 0.3. The plastic behavior was assumed to be fully plastic, and Tresca’s criterion was used. To integrate the stochastic aspect of the surface morphology, at least one hundred computations were performed for each studied case. An example of the indentation of a Weierstrass surface with a Sq of 0.5 µm, a fractal dimension of 2.5, and no-high-pass filtering is given in Figure 2.

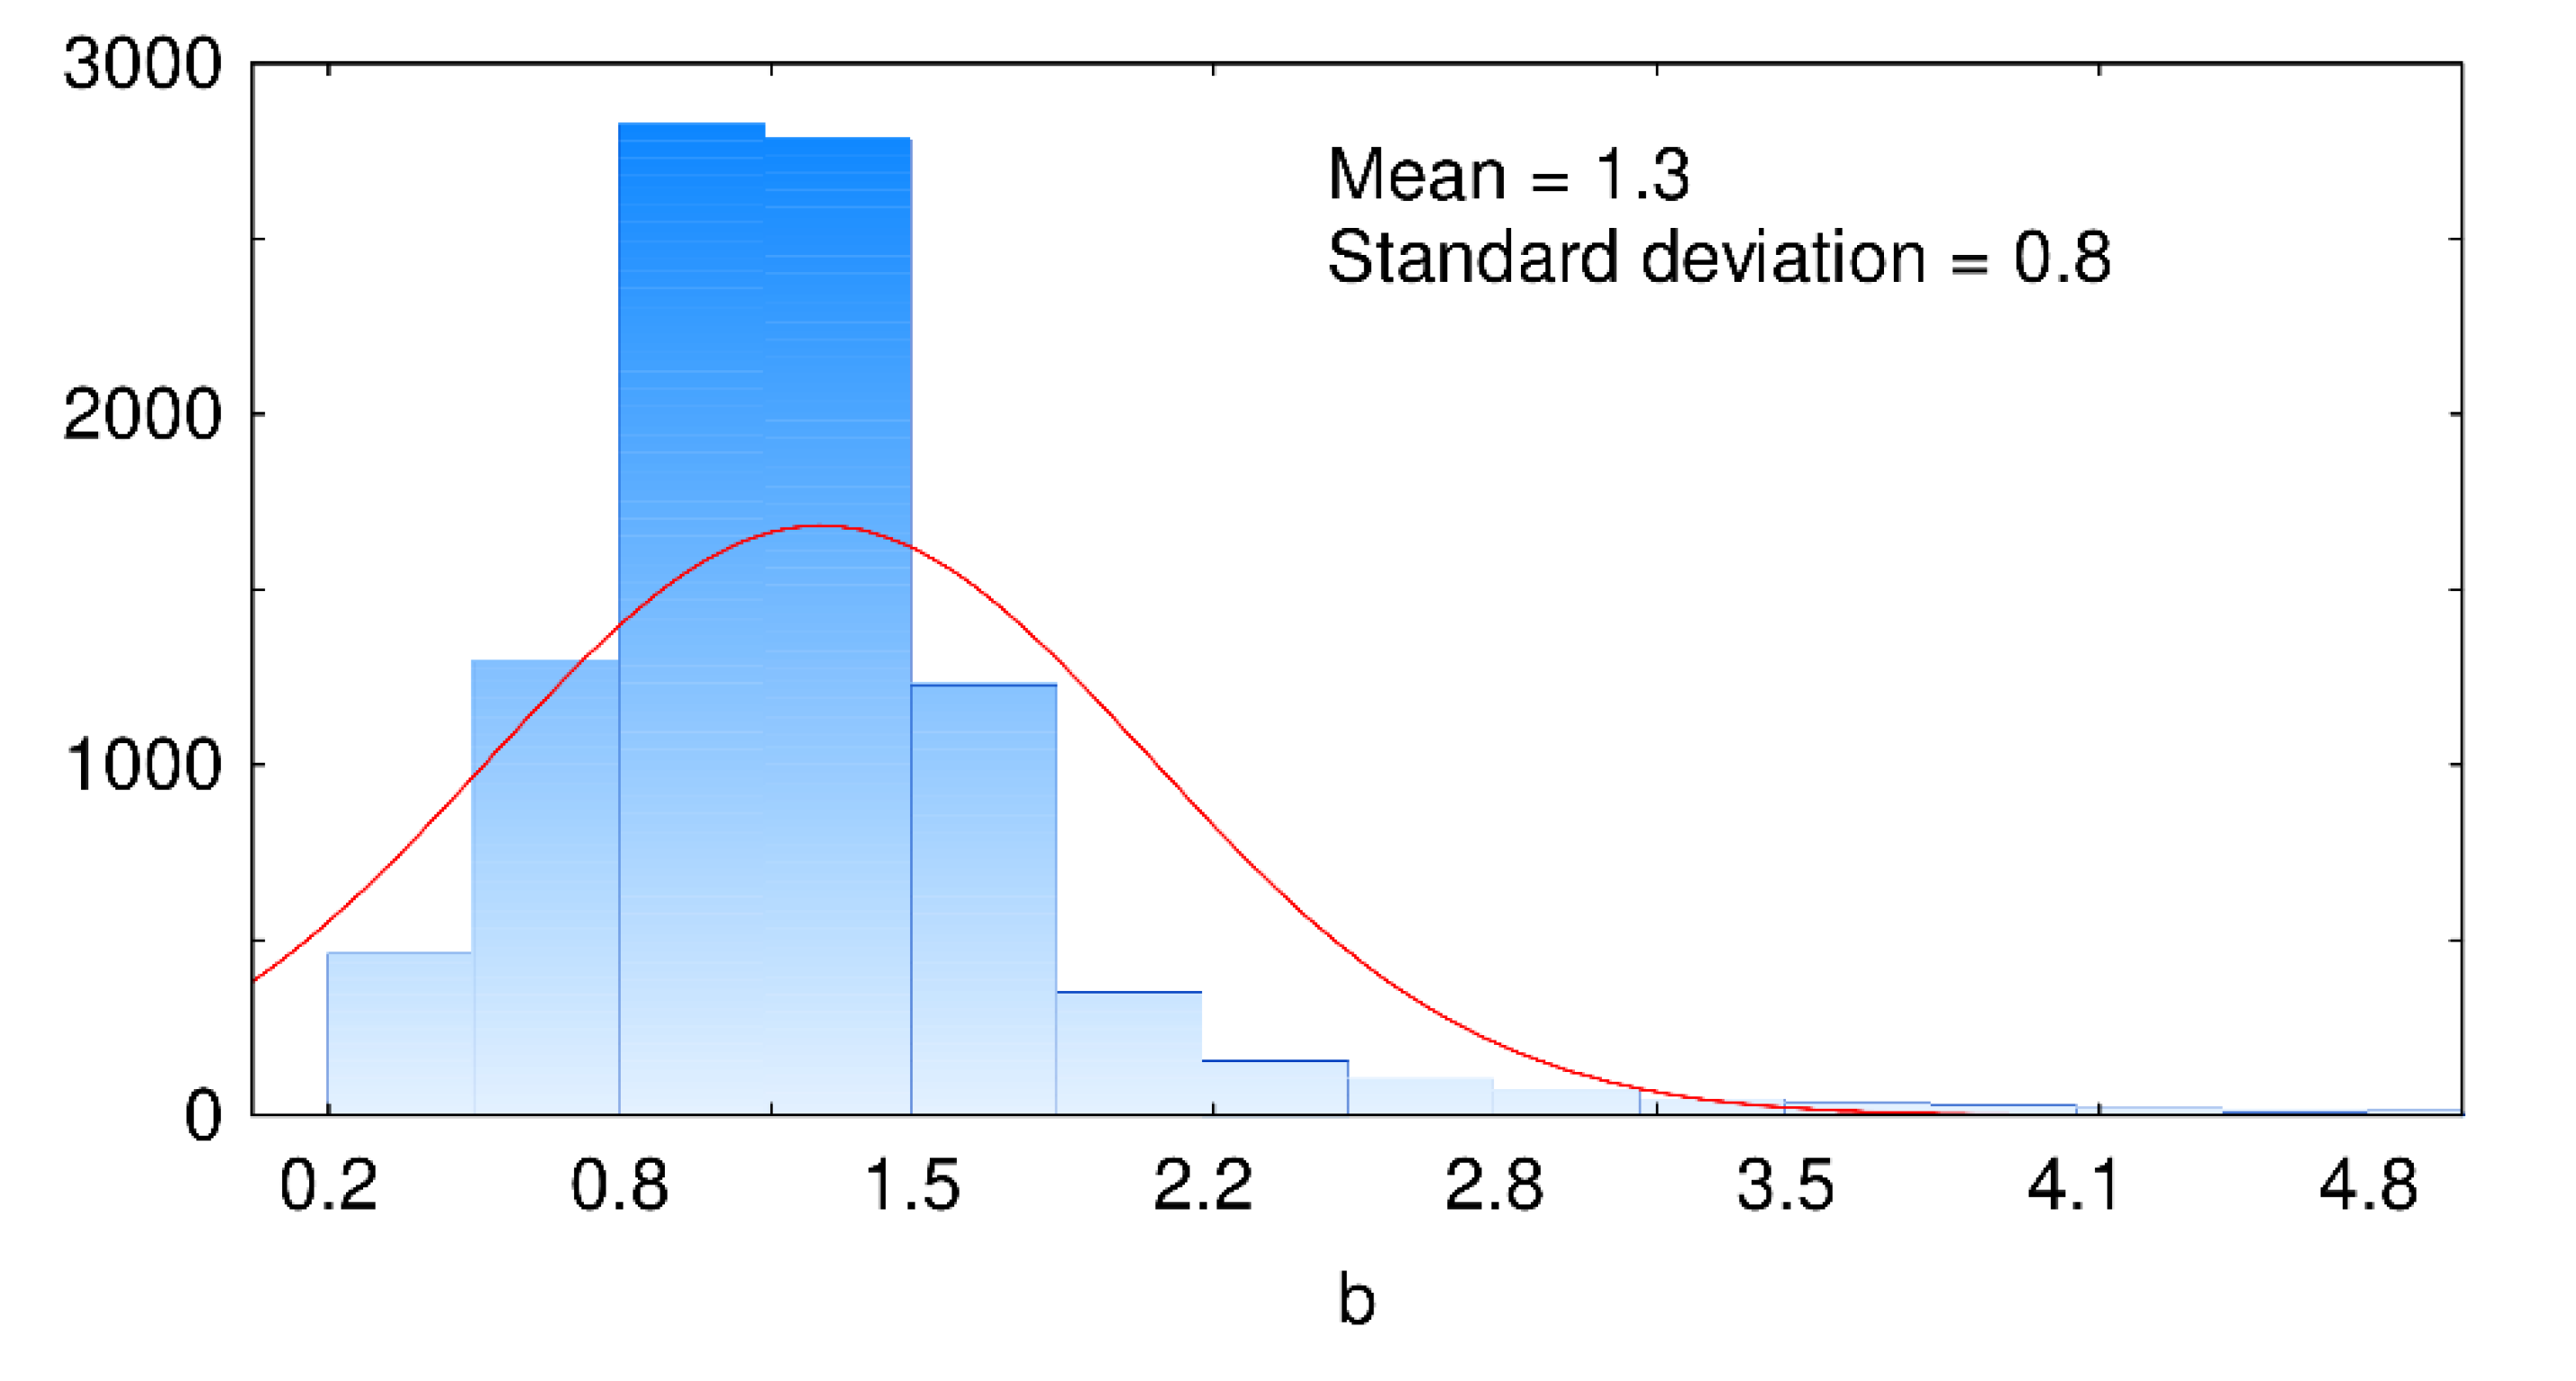
2.3. Hardness Computation Method
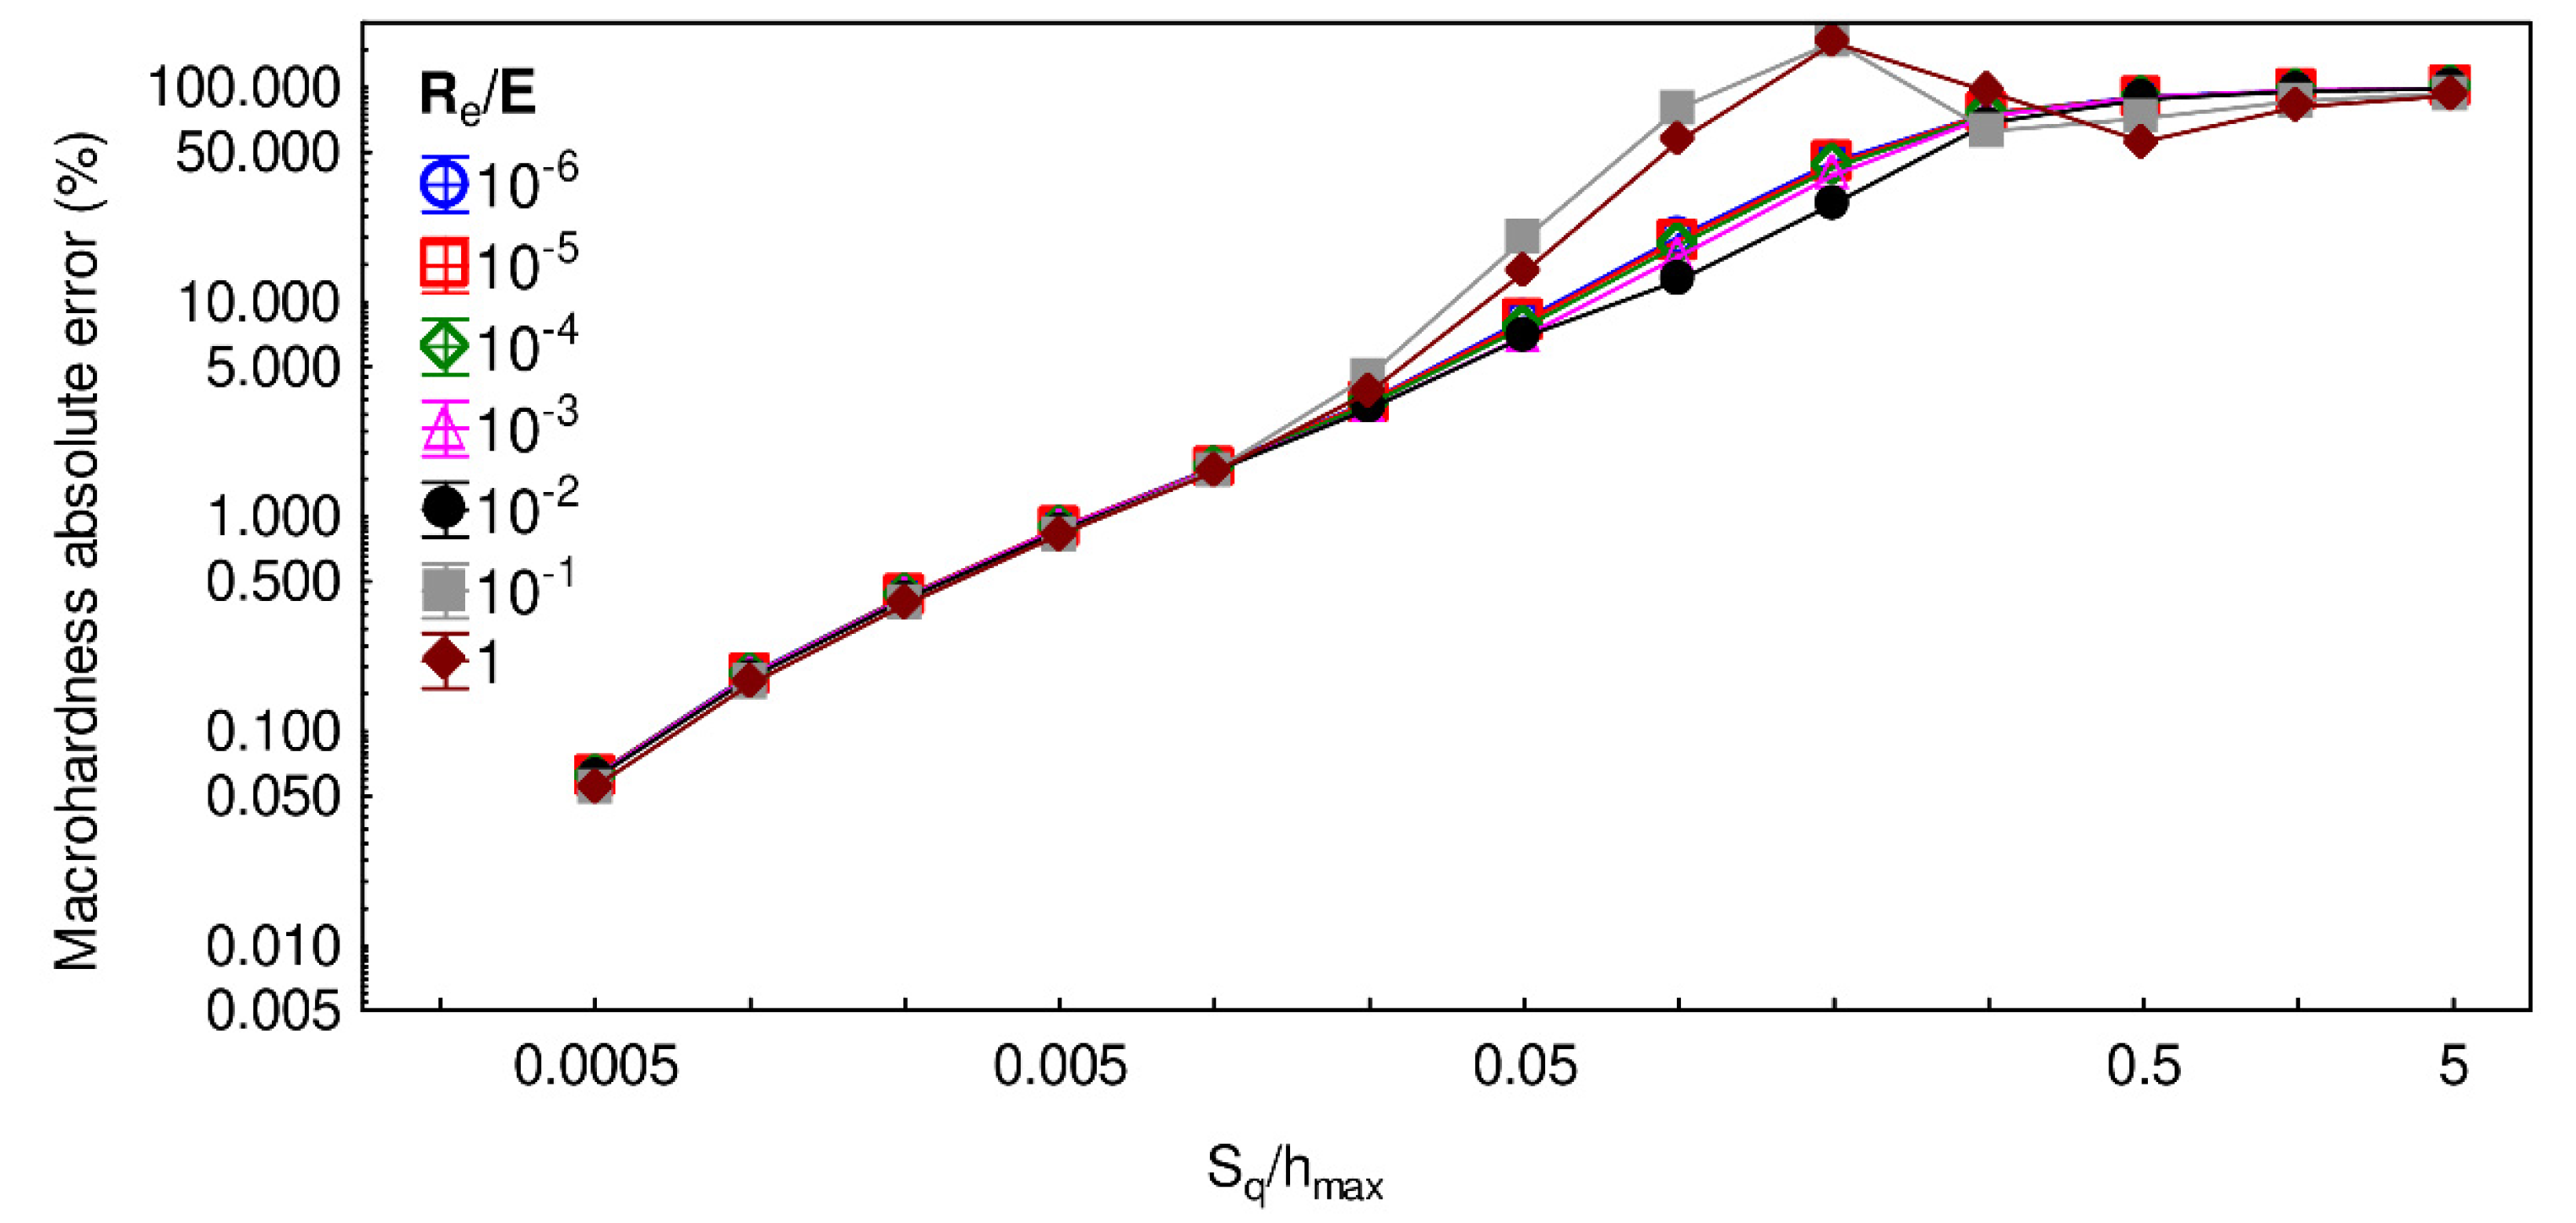
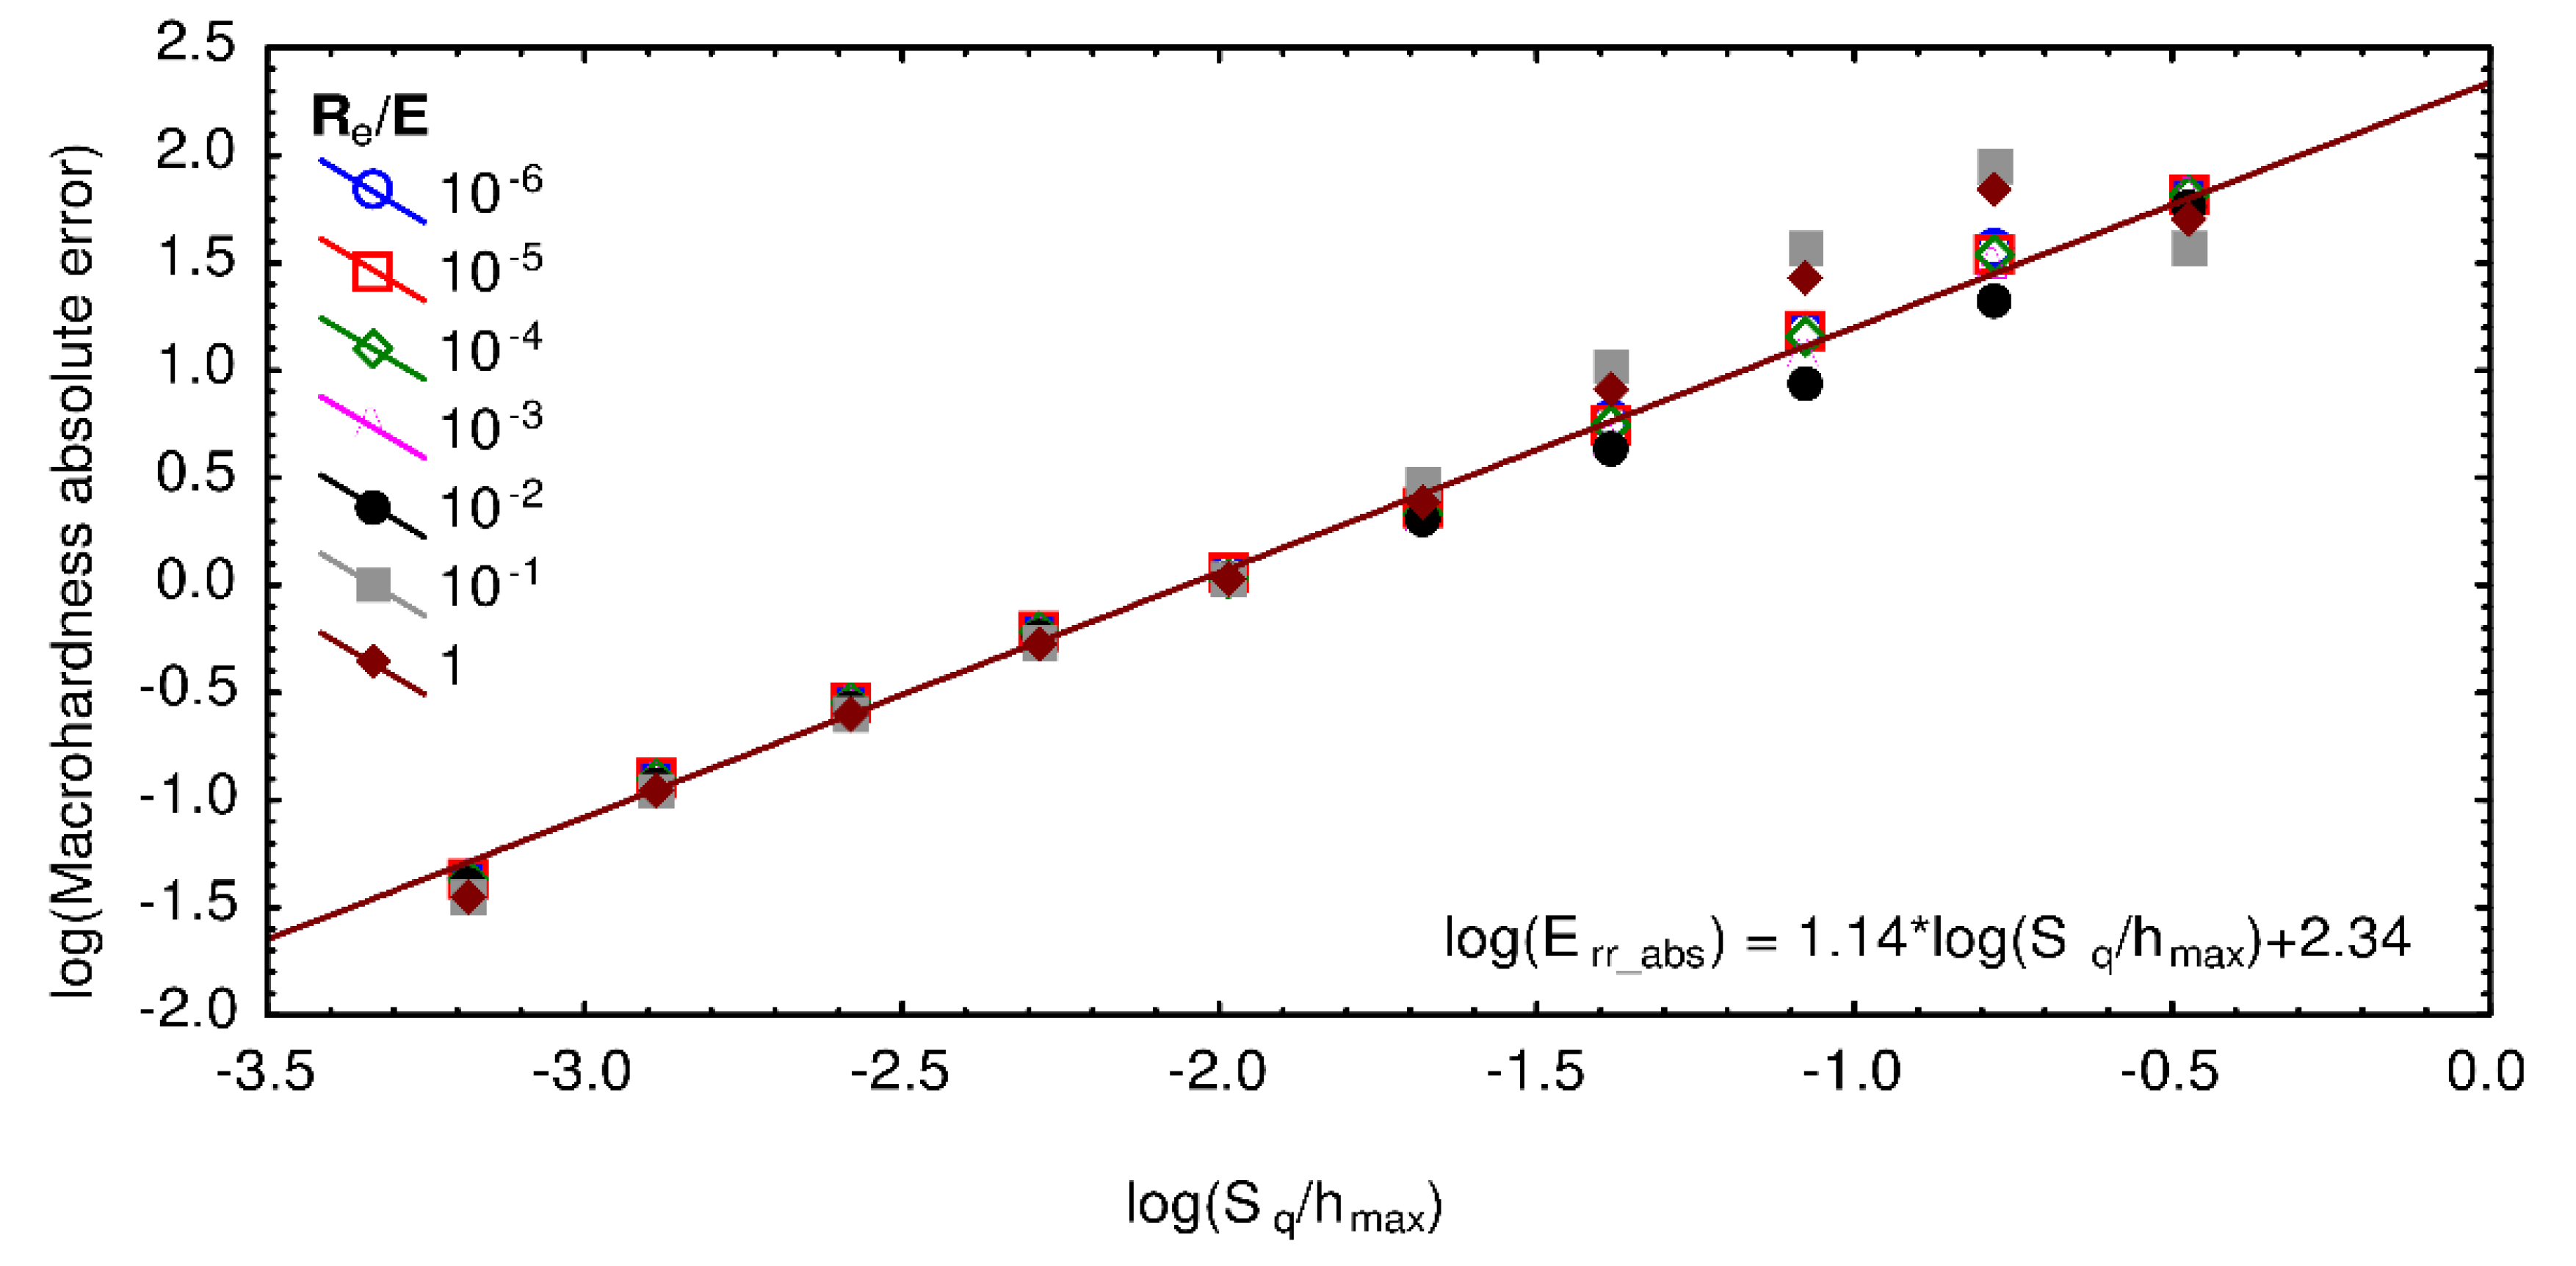
As non-negligible topography causes the scatter of the indentation curves; macrohardness was computed using a methodology first presented in [16]. In short, the loading part of the indentation curves was described using Kick’s law [17,22] (and not Bernhardt’s law as in [16,23] as the Indentation Size Effect was assumed to be nil in the present article). The equation given by Kick’s law was rewritten using the contact depth hc used by Oliver and Pharr in [3] and the macrohardness H0. Then, it was assumed that there was a discrepancy between Kick’s law and the actual shape of the computed loading curves, called Δhc. Finally, the following minimization was performed on all the computed loading curves in order to identify H0
min H 0 , Δ h 1   Δ h n i = 1 n j = 1 p i [ P i , j α ( H 0 h c , j 2 + ( 2 H 0 Δ h c , i ) h c , j + H 0 Δ h c , i 2 ) ] 2
where index j refers to a point belonging to curve i and α is a constant linked with the indenter geometry.

3. Results

Before studying the influence of roughness on the determination of hardness, indentation curves were computed for different values of the root-mean-square roughness Sq using fixed wavelength and fractal dimension values. Figure 3 shows the loading parts of the indentation curves obtained with the semianalytical model for a maximum indentation depth equal to 3 µm. The wavelength and fractal dimension of the tested surfaces were, respectively, set to 32 µm and 2.5, while the root-mean-square roughness Sq was equal to (a) 0.001 µm, (b) 0.0156 µm, (c) 0.5 µm, and (d) 4 µm. Different mesh sizes were tested for each examined case. For Sq values of 0.001 µm and 0.0156 µm, it can be seen that all the loading curves are superimposed, whatever the tested mesh sizes, and very low standard deviations are observed. For Sq equal to or larger than 0.5 µm, there is a change of trend: the loading curves are superimposed for small indentation depths, and then the curves obtained with lower mesh sizes tend to show larger loads than the curves computed with larger mesh sizes, for a given indentation depth. For Sq equal to 0.5 µm, the standard deviations of all the curves overlap. On the contrary, when Sq is equal to 4 µm, the curves obtained with mesh dimensions equal to 64 × 64, 128 × 128, and 256 × 256 show different trends than the ones obtained with mesh sizes equal to or larger than 512 × 512. Moreover, these curves have very low load values compared to the other tested Sq values for similar indentation depths. It seems that the surface roughness is too large compared to the indentation depth. The surface asperities only began to flatten, thus giving low load values. To underline the importance of the scale and as the examined contact case has selfsimilar geometry, dimensionless results were computed for the following figures, i.e., the results are expressed using the ratio Sq/hmax, where hmax is the maximum indentation depth.
The methodology introduced in Section 2.3 was then applied to all the computed loading curves to determine the macrohardness for different values of mesh sizes and root-mean-square roughness Sq. Figure 4 illustrates the computed macrohardness results as a function of Sq divided by the maximum indentation depth hmax, for different mesh sizes. The wavelength and fractal dimension of the tested surfaces were, respectively, set to 32 µm and 2.5. For Sq/hmax ratios equal to or lower than 0.04, the computed macrohardness values are between 3.4 and 3.7 GPa and are thus close together, even if globally larger macrohardness values are identified for lower mesh sizes. Then, for Sq/hmax ratios greater than 0.04, whatever the mesh size, the macrohardness values significantly decrease and reach zero for ratios equal to or larger than approximately 1.5. According to these results, it seems that, for Sq/hmax ratios greater than 0.04, indentation testing does not enable the macrohardness of the examined material to be accurately determined.
In order to confirm these results, the variation of the standard deviation of the macrohardness was examined as a function of the ratio Sq/hmax for different mesh sizes in Figure 5, using the same wavelength and fractal dimension as in Figure 4. For a ratio Sq/hmax larger than 0.04, the macrohardness standard deviation becomes non-negligible as it is larger than 0.5 GPa. The same transition zone, as in Figure 4, is thus identified. The macrohardness standard deviation rises to a maximum approximately equal to 1 GPa for a ratio Sq/hmax around 0.2, whatever the mesh size. The lower standard deviations of macrohardness observed for ratios greater than 0.2 are correlated with the decrease of macrohardness observed in the previous graph. Hereafter, the mesh size is fixed and is equal to 256 × 256 as it gives representative results and enables quick computation to be performed.
Wavelength influence is now examined. Figure 6 illustrates the variations of the macrohardness standard deviation plotted as a function of the ratio Sq/hmax for different wavelengths. A trend similar to the one obtained for the previous figure is observed. Whatever the observed wavelength, the macrohardness standard deviation first increases and then decreases as a function of the ratio Sq/hmax. The identified maxima are slightly different depending on the wavelength: for wavelengths equal to 32 µm or lower, the maximum is reached when Sq/hmax is equal to 0.2, while it is reached for a ratio equal to 0.3 for larger wavelengths. For a ratio Sq/hmax equal to 0.04, very similar results are obtained whatever the wavelength as the macrohardness standard deviation is between 0.15 and 0.3 GPa. Thus, globally, the wavelength has a small impact on the standard deviation of hardness, compared to the root-mean-square roughness Sq, for ratios Sq/hmax lower than 0.04.
In order to observe the variation of the macrohardness as a function of Sq, another indicator is examined: the macrohardness absolute error, which is computed as follows:
E r r _ a b s = ( | H t h H 0 | H t h ) × 100
where Err_abs is the microhardness absolute error, Hth is the hardness value used in the simulation (3.5 GPa), and H0 is the value computed for the macrohardness using the methodology described in Section 2.3.
Figure 7 shows the computation of the macrohardness absolute error as a function of the ratio Sq/hmax for (a) different fractal values with a fixed wavelength equal to 32 µm and (b) for different wavelength values and a fixed fractal dimension equal to 2.5. Whatever the observed graph, the standard deviations are very small. Both graphs also show the same trend as a function of the increase of the ratio Sq/hmax: the macrohardness absolute error increases until it reaches a plateau for a value of Sq/hmax around 0.3. The first part of the curve follows a power law representing the error made in the computation of macrohardness caused by roughness: this is a systematic error. For a Sq/hmax ratio equal to 0.04, the macrohardness absolute error is equal to 5%, whatever the tested wavelength or fractal dimension.
If one assumes that the macrohardness absolute error follows a power law having an exponent called b for values of Sq/hmax lower than 0.3 and if one tests this law for all the fractal dimensions and wavelength presented in Figure 7, then the histogram shown in Figure 8 is obtained. The average value of coefficient b is equal to 1.3, while its standard deviation is equal to 0.8. The identified coefficient is neither dependent on the fractal dimension values nor on the wavelength values. This identification means that the error committed on macrohardness determination increases by a power of 1.3 with the increase of the ratio Sq/hmax.
In order to check if the identified relationships between the macrohardness value and the root-mean-square roughness Sq are not dependent on the studied material, different values of Young’s modulus E and elastic limit Re are tested using the semianalytical model. As the macrohardness values are directly linked with the tested elastic limits, the macrohardness coefficient of variation is computed in order to assess the effect of the material properties. The macrohardness coefficient of variation (CV) is defined as follows:
C V = σ μ
where σ and µ are the standard deviation and the mean value of the macrohardness, respectively. It should be noted that the computation of the hardness coefficient of variation requires a mean value different from zero and the use of at least two hardness values. Both conditions are respected in the examined cases.
Figure 9 shows the macrohardness coefficient of variation computed as a function of the ratio Sq/hmax for values of Young’s modulus E comprised between 1 and 500 GPa, and values of elastic limit Re between 1 and 1000 MPa. The computations made with different values of E and Re give trends that are nearly identical. Once again, for Sq/hmax ratios lower than 0.3, a power law can be identified.
In the literature, the impact of mechanical properties on indentation test results is often assessed by observing the ratios Re/E, e.g., [24,25]. The computation of the macrohardness absolute error as a function of the ratio Sq/hmax for different values of Re/E is illustrated in Figure 10. Globally, the macrohardness absolute error follows the same trend whatever the tested Re/E ratio for Sq/hmax ratios lower than 0.02 and larger than 1.3. Within this interval, low values Re/E ratio show larger macrohardness absolute error values. According to this graph, having a systematic error below 5% requires an indentation depth that is approximately fifty times larger than Sq, whatever the examined material.
Using logarithmic values for both axes and only showing Sq/hmax ratios lower than 1, Figure 11 is obtained. Through the use of linear regression analysis, the following relationship is identified
log 10 E r r _ a b s = 1.14 log 10 S q h m a x + 2.34 .
The previous equation is valid for Sq/hmax ratios lower than 0.01, whatever the mechanical properties or for values of Sq/hmax ratios between 0.01 and 0.5 for Re/E ratios lower than 10−2.

4. Conclusions

Roughness effects on the indentation test results were examined using a semianalytical model. The use of a semianalytical model enabled a large number of calculations with low computation time to be obtained and is thus ideal for examining the error made on the computation of the macrohardness when using a methodology based on a minimization of the gaps between the shapes of the experimental loading curves and the ones predicted by Kick’s law.
Using both the semianalytical model and the methodology for computing the macrohardness, it was first found that the surface amplitude described by the root-mean-square deviation Sq had the largest influence on the macrohardness results. The two other parameters used to describe the surface. i.e., the surface wavelength and fractal dimension, had negligible effects on the macrohardness determination at the scale of investigation (i.e., when focusing on low errors on the macroharness computation).
Then, it was shown that the error made on the macrohardness determination increased as a function of the ratio Sq/hmax, where hmax is the maximum indentation depth. It followed a power law having an exponent equal to 1.3 for maximum indentation depths that are larger than thrice the root-mean-square deviation Sq. This law was dependent neither on wavelength variations nor on fractal dimension variations.
Finally, the error committed on the computed macrohardness was shown to be independent of the mechanical properties values for Sq/hmax ratios lower than 0.01. Then, for Sq/hmax ratios between 0.01 and 0.5, the error was shown to be independent of the mechanical properties for Re/E ratios smaller than 10−2. Finally, it was shown that in order to obtain a systematic error of the macrohardness lower than 5%, whatever the examined material mechanical properties, a Sq/hmax ratio lower than 0.02 was required. Future work will focus on the building of surfaces with controlled roughness features to further investigate and test the effect of roughness on indentation testing.

Author Contributions

Conceptualization, M.B. and J.M.; software, M.B. and A.J.; writing—original draft preparation, J.M.; writing—review and editing, J.M. and M.B.; supervision, M.B. All authors have read and agreed to the published version of the manuscript.

Funding

This research received no external funding.

Conflicts of Interest

The authors declare no conflict of interest.

Nomenclature

αConstant linked to indenter geometry
aj, bjSemiaxes of ellipse
bPower-law exponent
CVCoefficient of variation
ΔhcDiscrepancy between Kick’s law and computed indentation curve
EYoung’s modulus
Err_absMacrohardness absolute error
FjNormal force
hcContact depth
hmaxMaximum indentation depth
HHölder exponent
HthMacrohardness of the material
H0Macrohardness computed with curve shifting methodology
pjLocal pressure
pjmMean pressure undergone by a given asperity j
PIndentation load
ReElastic limit
SqRoot-mean-square deviation
θAngle of attack

References

  1. Marteau, J.; Bigerelle, M.; Bouvier, S.; Iost, A. Reflection on the measurement and use of the topography of the indentation imprint. Scanning 2014, 36, 115–126. [Google Scholar] [CrossRef] [PubMed] [Green Version]
  2. Walter, C.; Mitterer, C. 3D versus 2D finite element simulation of the effect of surface roughness on nanoindentation of hard coatings. Surf. Coat. Technol. 2009, 203, 3286–3290. [Google Scholar] [CrossRef]
  3. Oliver, W.C.; Pharr, G.M. An Improved Technique for Determining Hardness and Elastic Modulus Using Load and Displacement Sensing Indentation Experiments. J. Mater. Res. 1992, 7, 1564–1583. [Google Scholar] [CrossRef]
  4. Li, M.; Chen, W.; Cheng, Y.-T.; Cheng, C.-M. Influence of contact geometry on hardness behavior in nano-indentation. Vacuum 2009, 84, 315–320. [Google Scholar] [CrossRef]
  5. Wei, P.J.; Tsai, P.W.; Lin, J.F. Micro-contact analysis for the initial contact in nanoindentation tests. Tribol. Int. 2008, 41, 1247–1254. [Google Scholar] [CrossRef]
  6. Qasmi, M.; Delobelle, P. Influence of the average roughness Rms on the precision of the Young’s modulus and hardness determination using nanoindentation technique with a Berkovich indenter. Surf. Coat. Technol. 2006, 201, 1191–1199. [Google Scholar] [CrossRef]
  7. Jiang, W.-G.; Su, J.-J.; Feng, X.-Q. Effect of surface roughness on nanoindentation test of thin films. Eng. Fract. Mech. 2008, 75, 4965–4972. [Google Scholar] [CrossRef]
  8. ISO. For ISO Standard 14577-1 2002 Metallic Materials—Instrumented Indentation Test for Hardness and Materials Parameters—Part 1: Test Method. Available online: https://www.iso.org/standard/30104.html (accessed on 19 March 2020).
  9. Wai, S.W.; Spinks, G.M.; Brown, H.R.; Swain, M. Surface roughness: Its implications and inference with regards to ultra microindentation measurements of polymer mechanical properties. Polym. Test. 2004, 23, 501–507. [Google Scholar] [CrossRef]
  10. Arivuoli, D.; Lawson, N.S.; Krier, A.; Attolini, G.; Pelosi, C. Nanoindentation studies of MOVPE grown GaAs/InP heterostructures. Mater. Chem. Phys. 2000, 66, 207–212. [Google Scholar] [CrossRef]
  11. Kim, J.-Y.; Kang, S.-K.; Lee, J.-J.; Jang, J.; Lee, Y.-H.; Kwon, D. Influence of surface-roughness on indentation size effect. Acta Mater. 2007, 55, 3555–3562. [Google Scholar] [CrossRef]
  12. de Souza, G.B.; Mikowski, A.; Lepienski, C.M.; Foerster, C.E. Indentation hardness of rough surfaces produced by plasma-based ion implantation processes. Surf. Coat. Technol. 2010, 204, 3013–3017. [Google Scholar] [CrossRef]
  13. Chicot, D.; Ageorges, H.; Voda, M.; Louis, G.; Ben Dhia, M.A.; Palacio, C.C.; Kossman, S. Hardness of thermal sprayed coatings: Relevance of the scale of measurement. Surf. Coat. Technol. 2015, 268, 173–179. [Google Scholar] [CrossRef]
  14. Li, H.; Bradt, R.C. The effect of indentation-induced cracking on the apparent microhardness. J. Mater. Sci. 1996, 31, 1065–1070. [Google Scholar] [CrossRef]
  15. Bobji, M.S.; Biswas, S.K. Deconvolution of hardness from data obtained from nanoindentation of rough surfaces. J. Mater. Res. 1999, 14, 2259–2268. [Google Scholar] [CrossRef] [Green Version]
  16. Marteau, J.; Bigerelle, M.; Xia, Y.; Mazeran, P.E.; Bouvier, S. Quantification of first contact detection errors on hardness and indentation size effect measurements. Tribol. Int. 2013, 59, 154–162. [Google Scholar] [CrossRef]
  17. Marteau, J.; Bigerelle, M. Toward an understanding of the effect of surface roughness on instrumented indentation results. J. Mater. Sci. 2017, 52, 7239–7255. [Google Scholar] [CrossRef]
  18. Stout, K.J.; Matthia, T.; Sullivan, P.J.; Dong, W.P.; Mainsah, E.; Luo, N.; Zahouani, H. The Developments of Methods for the Characterisation of Roughness in Three Dimensions; Office for Official Publications of the European Communities: Luxembourg, 1993. [Google Scholar]
  19. ISO—ISO 16610-49:2015—Geometrical Product Specifications (GPS)—Filtration—Part 49: Morphological Profile Filters: Scale Space Techniques. Available online: https://www.iso.org/standard/61381.html (accessed on 19 March 2020).
  20. Johnson, K.L. Contact Mechanics; Cambridge University Press: London, UK, 1985. [Google Scholar]
  21. Jourani, A.; Dursapt, M.; Hamdi, H.; Rech, J.; Zahouani, H. Effect of the belt grinding on the surface texture: Modeling of the contact and abrasive wear. Wear 2005, 259, 1137–1143. [Google Scholar] [CrossRef]
  22. Kick, F. Das Gesetz der Proportionalen Widerstände und Seine Anwendungen: Nebst Versuchen Über das Verhalten Verschiedener Materialien bei Gleichen Formänderungen Sowohl Unter der Presse als dem Schlagwerk; Verlag von Arthur Felix: Leipzig, Germany, 1885. [Google Scholar]
  23. Marteau, J.; Mazeran, P.-E.; Bouvier, S.; Bigerelle, M. Zero-point correction method for nanoindentation tests to accurately quantify hardness and indentation size effect. Strain 2012, 48, 491–497. [Google Scholar] [CrossRef]
  24. Dao, M.; Chollacoop, N.; Van Vliet, K.J.; Venkatesh, T.A.; Suresh, S. Computational modeling of the forward and reverse problems in instrumented sharp indentation. Acta Mater. 2001, 49, 3899–3918. [Google Scholar] [CrossRef] [Green Version]
  25. Cheng, Y.-T.; Cheng, C.-M. Scaling, dimensional analysis, and indentation measurements. Mater. Sci. Eng. R Rep. 2004, 44, 91–149. [Google Scholar] [CrossRef]
Figure 1. Examples of Weierstrass surfaces (1024 × 1024 µm2) with Sq equal to 0.5 µm, fractal dimensions equal to two or three, and no filtering or high-pass filtering with different wavelengths.
Materials 13 01589 g001
Figure 2. Example of the indentation of a Weierstrass surface with a Sq of 0.5 µm, a fractal dimension of 2.5, and no-high-pass filtering. The indenter is not shown but is still in contact with the surface.
Materials 13 01589 g002
Figure 3. Load-indentation depth curves obtained for different mesh sizes with a root-mean-square roughness Sq equal to (a) 0.001 µm, (b) 0.0156 µm, (c) 0.5 µm, and (d) 4 µm. The wavelength and fractal dimension of the tested surfaces are, respectively, set to 32 µm and 2.5.
Materials 13 01589 g003
Figure 4. Macrohardness as a function of the ratio Sq/hmax, which is the root-mean-square roughness divided by the maximum indentation depth, computed with different mesh sizes. The wavelength and fractal dimension of the tested surfaces are, respectively, set to 32 µm and 2.5.
Materials 13 01589 g004
Figure 5. Standard error of macrohardness as a function of the ratio Sq/hmax, for different mesh sizes. The wavelength and fractal dimension of the tested surfaces are, respectively, set to 32 µm and 2.5.
Materials 13 01589 g005
Figure 6. Standard deviation of macrohardness as a function of the ratio Sq/hmax for different values of wavelengths. The mesh size and fractal dimension of the tested surfaces are, respectively, set to 256 × 256 and 2.5.
Materials 13 01589 g006
Figure 7. The macrohardness absolute error as a function of Sq is computed using (a) different fractal dimensions and a fixed wavelength equal to 32 µm and (b) different wavelengths with a fractal dimension set to 2.5. The mesh size is 256 × 256.
Materials 13 01589 g007
Figure 8. Distribution of coefficient b.
Materials 13 01589 g008
Figure 9. Coefficient of variation of the macrohardness as a function of the ratio Sq/hmax for different values of Young’s modulus E and elastic limit Re. The mesh size, wavelength, and fractal dimension were, respectively, set to 256 × 256, 32 µm, and 2.5.
Materials 13 01589 g009
Figure 10. Macrohardness absolute error as a function of the ratio Sq/hmax for different values of Re/E ratio. The mesh size, wavelength, and fractal dimension were, respectively, set to 256 × 256, 32 µm, and 2.5.
Materials 13 01589 g010
Figure 11. Logarithm of the macrohardness absolute error as a function of the logarithm of the ratio Sq/hmax for different values of Re/E ratio. The mesh size, wavelength, and fractal dimension were, respectively, set to 256 × 256, 32 µm, and 2.5.
Materials 13 01589 g011

