Laser Operating Windows Prediction in Selective Laser-Melting Processing of Metallic Powders: Development and Validation of a Computational Fluid Dynamics-Based Model


Abstract
1. Introduction
2. Materials and Methods
- h0 equal to the powder layer thickness plus 10 microns, which could be consistent with the high permeability of the powder bed to laser rays, due to its scarce compactness.
3. Results
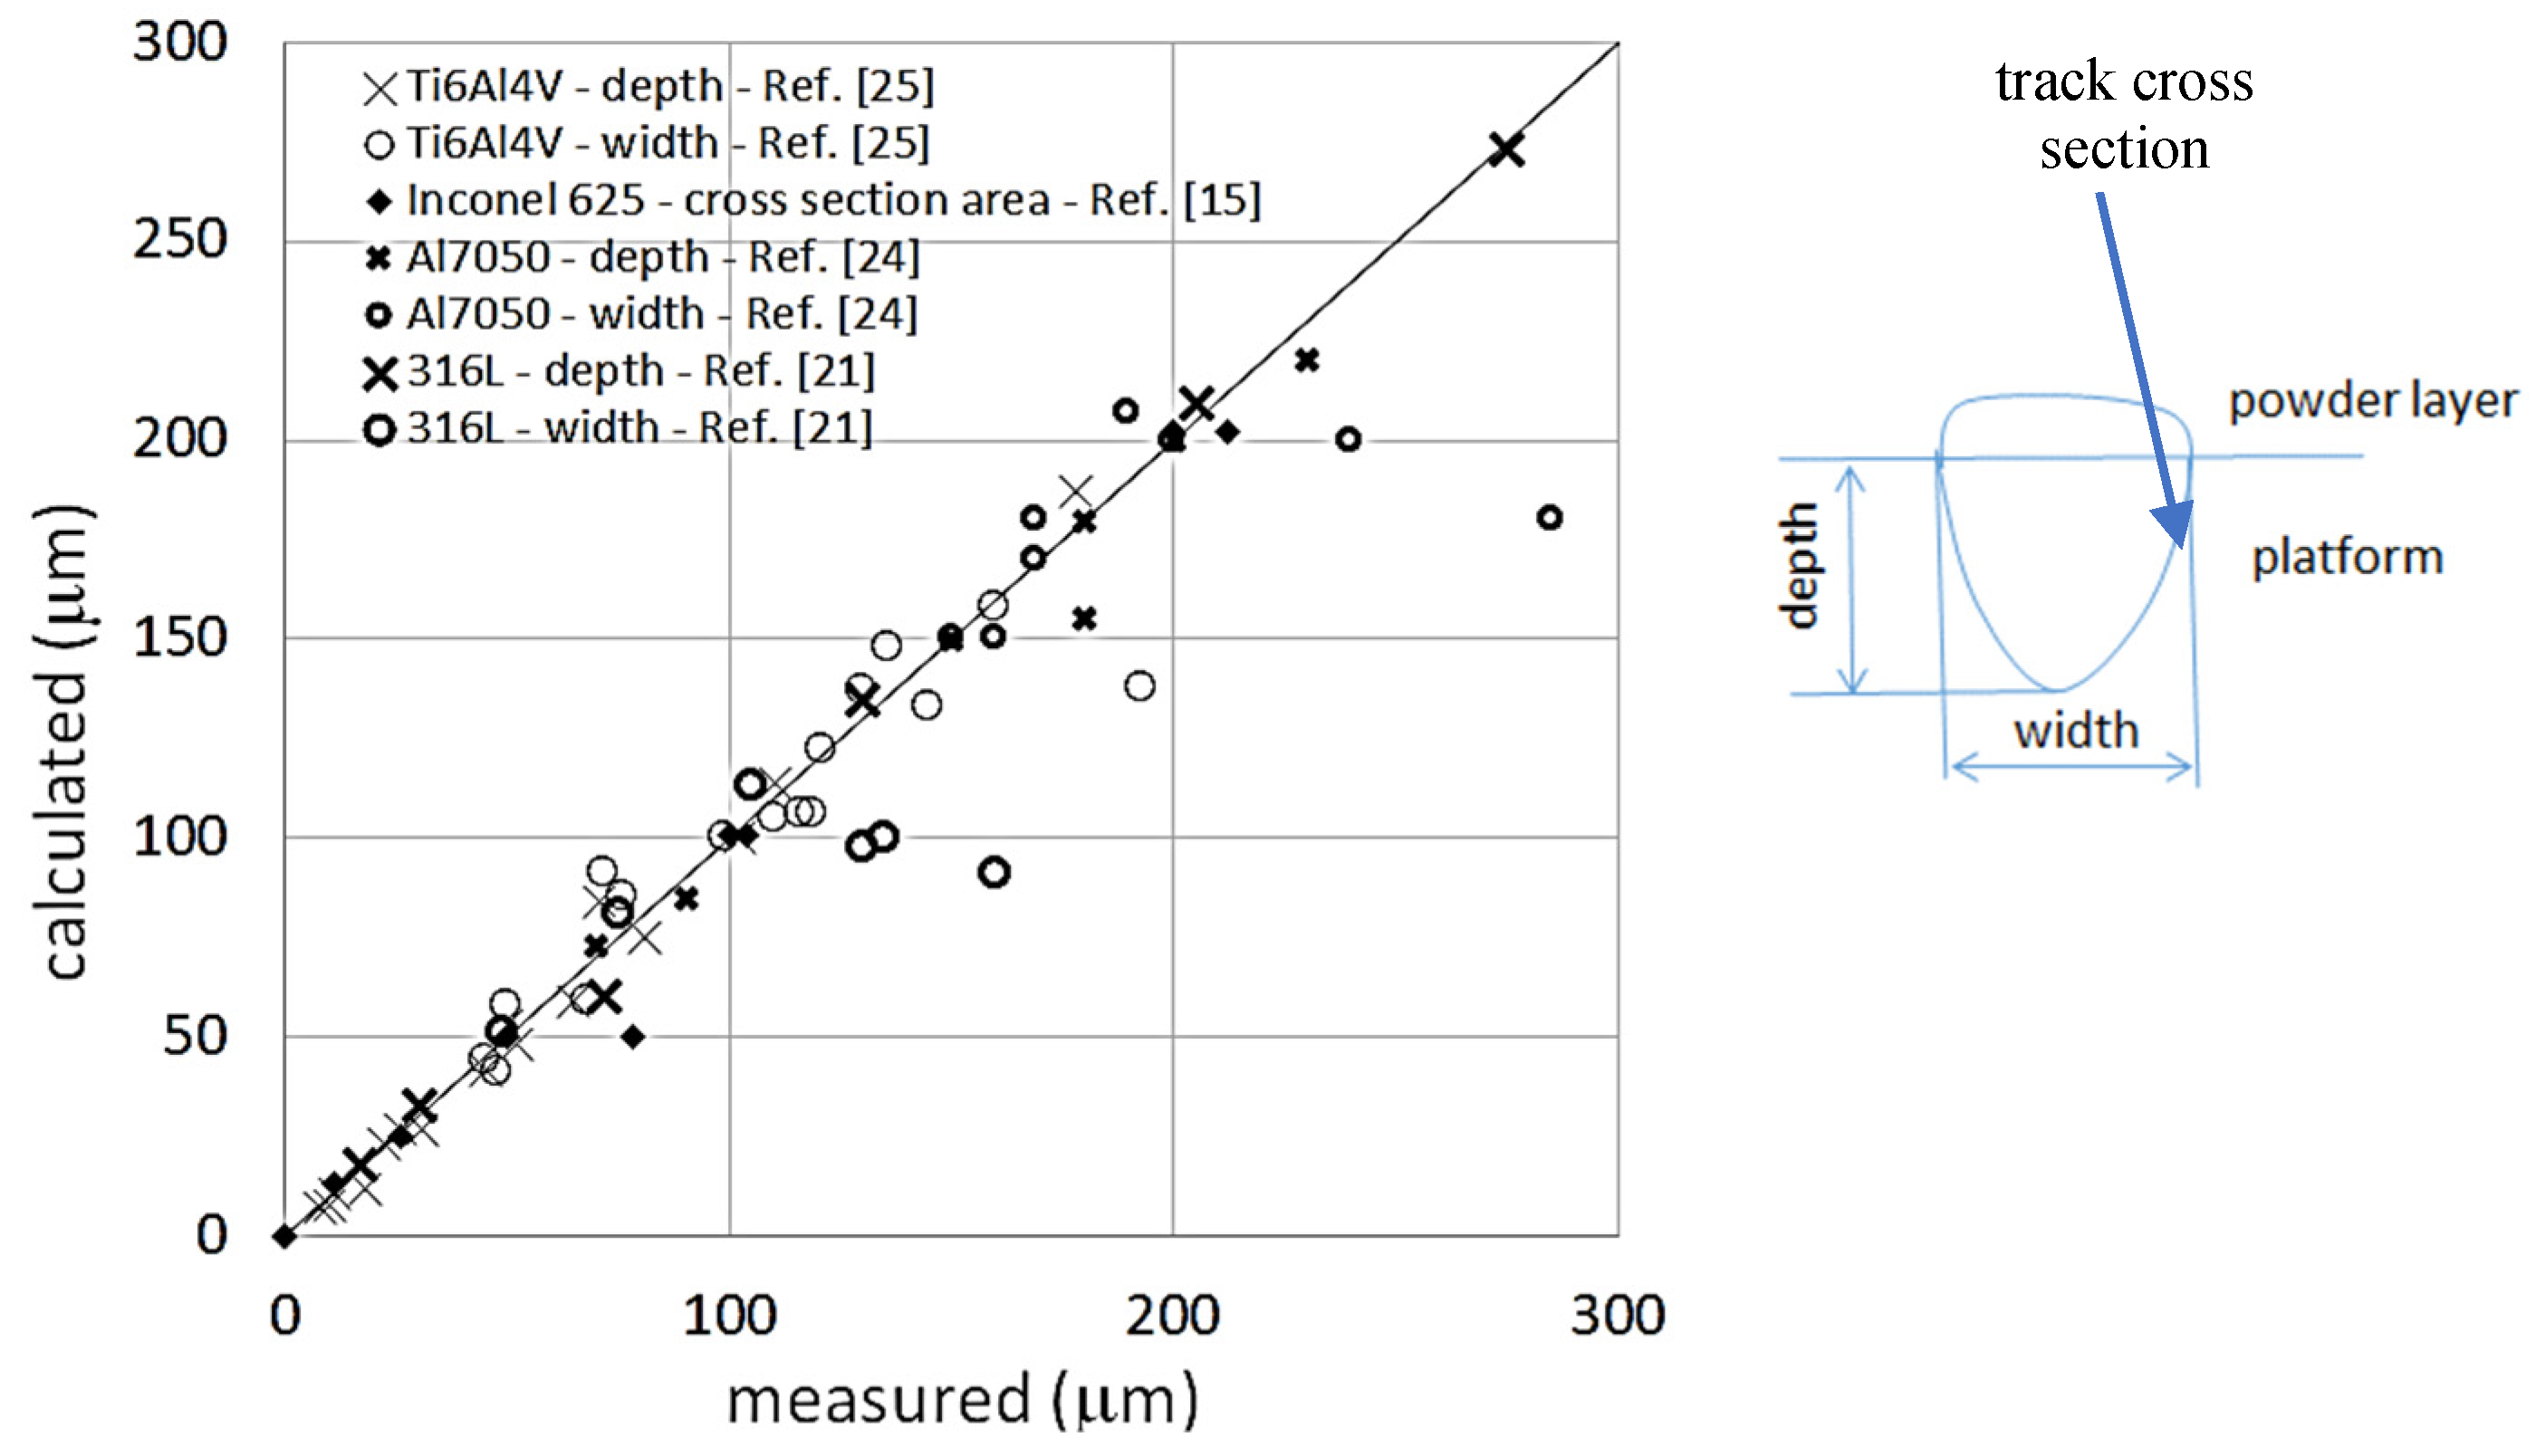
3.1. Comparison of Calculated and Measured Data of Track Geometry
3.2. Comparison of Calculated and Measured Data of Relative Density
- porosity for E < 50 J/mm3 (porosity due to lack of fusion): calculated values are much lower than measured. Values of porosity as high as 65% are found in the reference source [30], which raise some doubt about the coherency of the measured sample. Therefore, no deep analysis about the reason of the discrepancy among calculated and measured data has been done, concerning the highest values, otherwise the information given by the measured porosity trend has been considered valid;
- the calculated threshold of formation of porosity due to lack of fusion is calculated at 42 J/mm3 against the experimentally observed at 50 J/mm3;
- the model cannot calculate porosity due to deep keyhole, but only the threshold which is found at E = 133 J/mm3. Experimental data show presence of 1% porosity at E = 87 J/mm3 and a net porosity increase above E = 100 J/mm3. Thus, keyhole porosity could already form for a calculated value of α equal to about 0.85.
4. Discussion
5. Conclusions
Author Contributions
Funding
Conflicts of Interest
Nomenclature
| Ck | multiplying factor |
| D | distribution factor |
| f | metal fraction in the powder bed |
| fl | metal liquid fraction in the mushy zone |
| gi | gravity acceleration components (m s−2) |
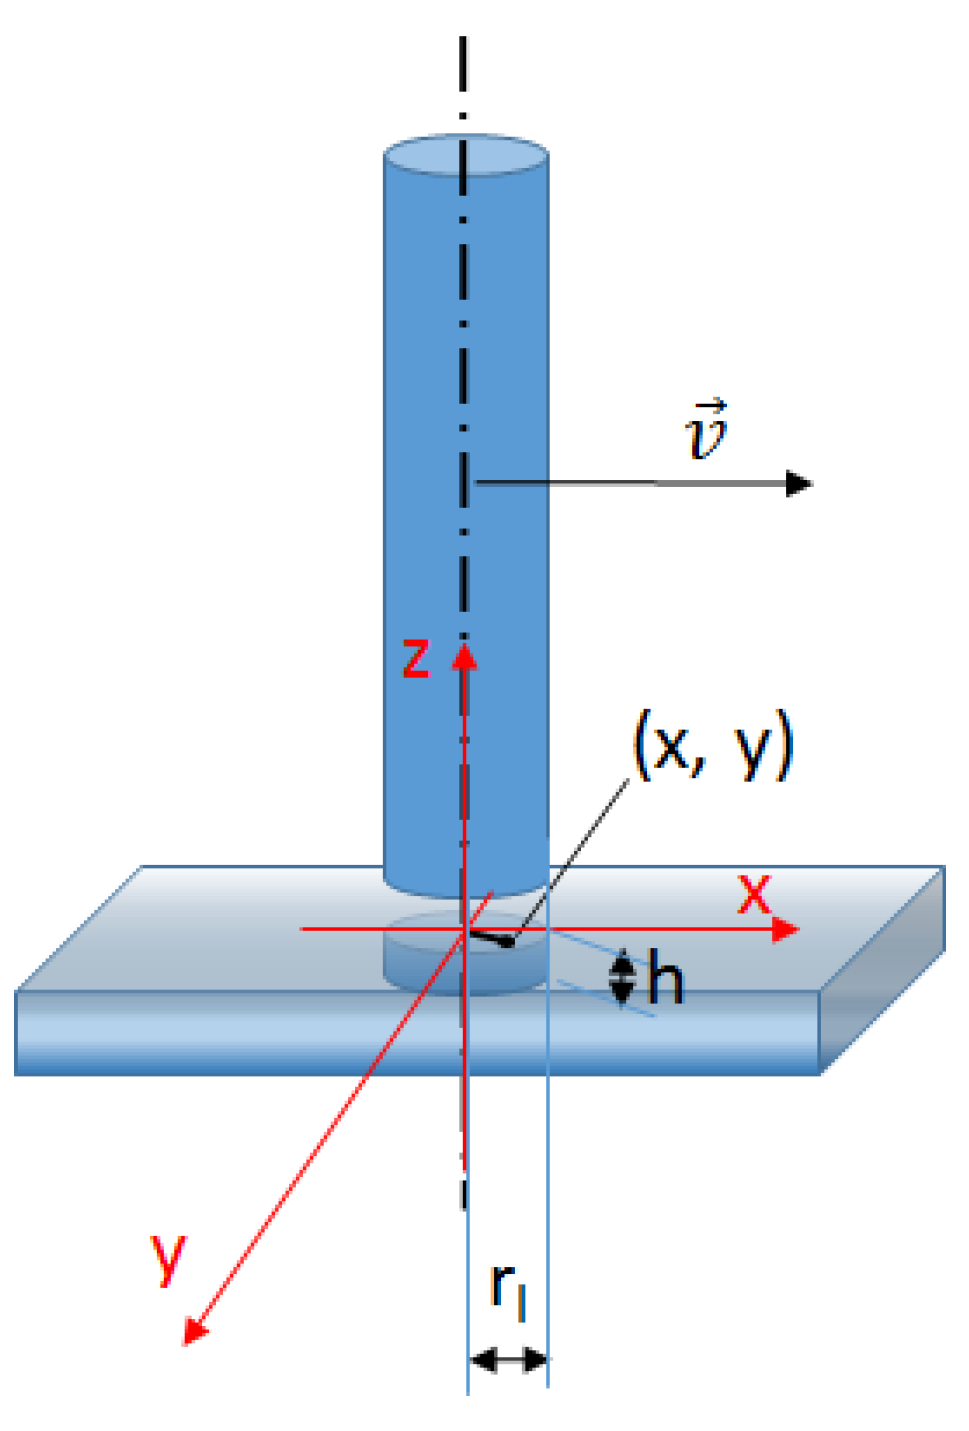
| h | height of the cylinder of laser heat application |
| ha | hatch spacing (mm) |
| H | enthalpy (J kg−1) |
| keff | effective thermal conductivity (W m−1 K−1) |
| kliq | thermal conductivity of the liquid metal (W m−1 K−1) |
| K | mushy zone permeability (m2) |
| p | pressure (Pa) |
| P | laser power (W) |
| PDAS | primary dendrite arm spacing (m) |
| rl | laser beam radius |
| Sv | volumetric heat source (J m3) |
| t | time (s) |
| teff | printing regime bed powder thickness (μm) |
| tnom | nominal powder bed thickness (μm) |
| Tliq | liquidus temperature (K) |
| Tsol | solidus temperature (K) |
| ui, uj | velocity components (m s−1) |
| v | scanning speed (m s−1) |
| x, y | coordinates in a frame relative to the laser beam (m) |
| xi, xj | coordinates (m) |
| α | laser absorptivity |
| β | fraction of the track surface contacting powder |
| η | laser efficiency |
| μ | viscosity (Pa s) |
| ρ | metal density (kg m−3) |
| ρp | part density (kg m−3) |
References
- Mindt, H.-W.; Desmaison, O.; Megahed, M.; Peralta, A.; Neumann, J. Modeling of Powder Bed Manufacturing Defects. J. Mater. Eng. Perform. 2017, 27, 32–43. [Google Scholar] [CrossRef]
- Beuth, J.L.; Klingbeil, N. The role of process variables in laser-based direct metal solid freeform fabrication. JOM 2001, 53, 36–39. [Google Scholar] [CrossRef]
- Mower, T.M.; Long, M.J. Mechanical behavior of additive manufactured, powder-bed laser-fused materials. Mater. Sci. Eng. A 2016, 651, 198–213. [Google Scholar] [CrossRef]
- Gong, H.; Rafi, K.; Gu, H.; Starr, T.; Stucker, B. Analysis of defect generation in Ti–6Al–4V parts made using powder bed fusion additive manufacturing processes. Addit. Manuf. 2014, 1, 87–98. [Google Scholar] [CrossRef]
- Khairallah, S.A.; Anderson, A.T.; Rubenchik, A.; King, W.E. Laser powder-bed fusion additive manufacturing: Physics of complex melt flow and formation mechanisms of pores, spatter, and denudation zones. Acta Mater. 2016, 108, 36–45. [Google Scholar] [CrossRef]
- Aboulkhair, N.T.; Everitt, N.M.; Ashcroft, I.; Tuck, C.; Tuck, C. Reducing porosity in AlSi10Mg parts processed by selective laser melting. Addit. Manuf. 2014, 1, 77–86. [Google Scholar] [CrossRef]
- Buchbinder, D.; Schleifenbaum, H.; Heidrich, S.; Meiners, W.; Bültmann, J. High Power Selective Laser Melting (HP SLM) of Aluminum Parts. Phys. Procedia 2011, 12, 271–278. [Google Scholar] [CrossRef]
- Louvis, E.; Fox, P.; Sutcliffe, C.J. Selective laser melting of aluminium components. J. Mater. Process. Technol. 2011, 211, 275–284. [Google Scholar] [CrossRef]
- Colopi, M.; Demir, A.G.; Caprio, L.; Previtali, B. Limits and solutions in processing pure Cu via selective laser melting using a high-power single-mode fiber laser. Int. J. Adv. Manuf. Technol. 2019, 104, 2473–2486. [Google Scholar] [CrossRef]
- Lodes, M.A.; Guschlbauer, R.; Körner, C. Process development for the manufacturing of 99.94% pure copper via selective electron beam melting. Mater. Lett. 2015, 143, 298–301. [Google Scholar] [CrossRef]
- Sun, Z.; Tan, X.; Tor, S.B.; Yeong, W.Y. Selective laser melting of stainless steel 316L with low porosity and high build rates. Mater. Des. 2016, 104, 197–204. [Google Scholar] [CrossRef]
- Zitelli, C.; Folgarait, P.; Di Schino, A. Laser Powder Bed Fusion of Stainless Steel Grades: A Review. Metals 2019, 9, 731. [Google Scholar] [CrossRef]
- Beuth, J.; Fox, J.; Gockel, J.; Montgomery, C.; Yang, R.; Qiao, H.; Soylemez, E.; Reeseewatt, P.; Anvari, A.; Narra, S.; et al. Process Mapping for Qualification Across Multiple Direct Metal Additive Manufacturing Processes. In Proceedings of the Solid Freeform Fabrication Symposium 2013 Proceedings, Austin, TX, USA, 12–14 August 2013; pp. 655–665. [Google Scholar]
- Liu, B.; Wildman, R.; Tuck, C.; Ashcroft, I.; Hague, R. Investigation the effect of particle size distribution on processing parameters optimisation in selective laser melting process. In Proceedings of the Annual Int Solid Freeform Fabrication Symp, University of Texas at Austin, Austin, TX, USA, 6–8 August 2011; pp. 227–238. [Google Scholar]
- Montgomery, C.; Beuth, K.; Sheridan, L.; Klingbeil, N. Process mapping of Inconel 625 in laser powder bed additive manufacturing. In Proceedings of the Solid freeform fabrication symposium (2015), Austin, TX, USA, 10–12 August 2015; pp. 1195–1204. [Google Scholar]
- Schänzel, M.; Shakirov, D.; Ilin, A.; Ploshikhin, V. Coupled thermo-mechanical process simulation method for selective laser melting considering phase transformation steels. Comput. Math. Appl. 2019, 78, 2230–2246. [Google Scholar] [CrossRef]
- Almangour, B.; Grzesiak, D.; Cheng, J.; Ertas, Y. Thermal behavior of the molten pool, microstructural evolution, and tribological performance during selective laser melting of TiC/316L stainless steel nanocomposites: Experimental and simulation methods. J. Mater. Process. Technol. 2018, 257, 288–301. [Google Scholar] [CrossRef]
- Bartel, T.; Guschke, I.; Menzel, A. Towards the simulation of Selective Laser Melting processes via phase transformation models. Comput. Math. Appl. 2019, 78, 2267–2281. [Google Scholar] [CrossRef]
- Markl, M.; Körner, C. Multiscale Modeling of Powder Bed–Based Additive Manufacturing. Annu. Rev. Mater. Res. 2016, 46, 93–123. [Google Scholar] [CrossRef]
- Mayi, Y.; Dal, M.; Peyre, P.; Bellet, M.; Metton, M.; Moriconi, C.; Fabbro, R. A Mesoscopic Approach for Modelling Laser Beam Melting (LBM). In Proceedings of the II International Conference on Simulation for Additive Manufacturing-Sim-AM 2019, Pavia, Italy, 11–13 September 2019. [Google Scholar]
- King, W.; Barth, H.D.; Castillo, V.M.; Gallegos, G.F.; Gibbs, J.; Hahn, D.E.; Kamath, C.; Rubenchik, A. Observation of keyhole-mode laser melting in laser powder-bed fusion additive manufacturing. J. Mater. Process. Technol. 2014, 214, 2915–2925. [Google Scholar] [CrossRef]
- Mukherjee, T.; Zuback, J.S.; De, A.; Debroy, T. Heat and Fluid Flow Modeling to Examine 3D-Printability of Alloys. Proceedings of the 7th International Symposium on High-Temperature Metallurgical Processing; Springer Science and Business Media LLC: Berlin/Heidelberg, Germany, 2016; pp. 471–478. [Google Scholar]
- Ki, H.; Mazumder, J.; Mohanty, P.S. Modeling of laser keyhole welding: Part I. mathematical modeling, numerical methodology, role of recoil pressure, multiple reflections, and free surface evolution. Met. Mater. Trans. A 2002, 33, 1817–1830. [Google Scholar] [CrossRef]
- Trapp, J.; Rubenchik, A.M.; Guss, G.; Matthews, M. In situ absorptivity measurements of metallic powders during laser powder-bed fusion additive manufacturing. Appl. Mater. Today 2017, 9, 341–349. [Google Scholar] [CrossRef]
- Maina, M.R.; Okamoto, Y.; Inoue, R.; Nakashiba, S.-I.; Okada, A.; Sakagawa, T. Influence of Surface State in Micro-Welding of Copper by Nd:YAG Laser. Appl. Sci. 2018, 8, 2364. [Google Scholar] [CrossRef]
- Carman, P. Fluid flow through granular beds. Chem. Eng. Res. Des. 1997, 75, S32–S48. [Google Scholar] [CrossRef]
- Dantzig, J. Solidification; Informa UK Limited: Colchester, UK, 2009; pp. 130–131. [Google Scholar]
- Semak, V.; Matsunawa, A. The role of recoil pressure in energy balance during laser materials processing. J. Phys. D Appl. Phys. 1997, 30, 2541–2552. [Google Scholar] [CrossRef]
- Qi, T.; Zhu, H.; Zhang, H.; Yin, J.; Ke, L.; Zeng, X. Selective laser melting of Al7050 powder: Melting mode transition and comparison of the characteristics between the keyhole and conduction mode. Mater. Des. 2017, 135, 257–266. [Google Scholar] [CrossRef]
- Dilip, J.J.S.; Zhang, S.; Teng, C.; Zeng, K.; Robinson, C.; Pal, D.; Stucker, B. Influence of processing parameters on the evolution of melt pool, porosity, and microstructures in Ti-6Al-4V alloy parts fabricated by selective laser melting. Prog. Addit. Manuf. 2017, 2, 157–167. [Google Scholar] [CrossRef]
- Colopi, M.; Caprio, L.; Demir, A.G.; Previtali, B. Selective laser melting of pure Cu with a 1 kW single mode fiber laser. Procedia CIRP 2018, 74, 59–63. [Google Scholar] [CrossRef]
- Polyanskiy, M.N. Refractive Index Database. Available online: https://refractiveindex.info. (accessed on 20 November 2019).
- Walter, W.T. Change in Reflectivity of Metals under Intense Laser Radiation, Revision; Defense Technical Information Center (DTIC): Fairfax County, VA, USA, 1981.
- Cagran, C. Thermal Conductivity and Thermal Diffusivity of Liquid Copper. Bahchelor Thesis, TUGRAZ, Graz, Austria, 2000. [Google Scholar]
- Spierings, G.L. Comparison of density of stainless steel 316L parts produced with selective laser melting using different powder grades. In Proceedings of the Annual International Solid Freeform Fabrication Symposium (2009), Austin, TX, USA, 3–5 August 2009; pp. 342–353. [Google Scholar]


| Property | Ti6Al4V | INC625 | Al7050 | 316L | Cu(99,9%) |
|---|---|---|---|---|---|
| Density (kg/m3) | 4000 | 8440 | 2810 | 7890 | 8960 |
| Liquidus Temperature: Tliq (K) | 1986 | 1607 | 906 | 1710 | 1356 |
| Solidus Temperature: Tsol (K) | 1970 | 1513 | 787 | 1608 | 1356 |
| Specific Heat (J/(kgK)) | |||||
| Tamb | 550 | 440 | 860 | 450 | 481 |
| Tsol | 830 | 650 | 1050 | 750 | 481 |
| Tliq | 980 | 670 | 1120 | 770 | 531 |
| Thermal Conductivity (W/(mK)) | |||||
| Tamb | 5 | 11 | 117 | 16 | 397 |
| Tsol | 32 | 30 | 156 | 33 | 317 |
| Tliq | 32 | 30 | 87 | 30 | 157 |
| Latent Heat of Fusion (J/m3)·109 | 1.4 | 1.99 | 1.05 | 1.37 | 2.07 |
| Boiling Temperature (K) | 3600 | 3000 | 2800 | 3100 | 2840 |
| Reflectivity at 1.06 μm (T≈900K) | 0.52 | 0.71 | 0.65 | 0.63 | 0.84 |
| Reference | [30] | [15] | [29] | [24] | [31] |
© 2020 by the authors. Licensee MDPI, Basel, Switzerland. This article is an open access article distributed under the terms and conditions of the Creative Commons Attribution (CC BY) license (http://creativecommons.org/licenses/by/4.0/).
Share and Cite
Ridolfi, M.R.; Folgarait, P.; Di Schino, A. Laser Operating Windows Prediction in Selective Laser-Melting Processing of Metallic Powders: Development and Validation of a Computational Fluid Dynamics-Based Model. Materials 2020, 13, 1424. https://doi.org/10.3390/ma13061424
Ridolfi MR, Folgarait P, Di Schino A. Laser Operating Windows Prediction in Selective Laser-Melting Processing of Metallic Powders: Development and Validation of a Computational Fluid Dynamics-Based Model. Materials. 2020; 13(6):1424. https://doi.org/10.3390/ma13061424
Chicago/Turabian StyleRidolfi, Maria Rita, Paolo Folgarait, and Andrea Di Schino. 2020. "Laser Operating Windows Prediction in Selective Laser-Melting Processing of Metallic Powders: Development and Validation of a Computational Fluid Dynamics-Based Model" Materials 13, no. 6: 1424. https://doi.org/10.3390/ma13061424
APA StyleRidolfi, M. R., Folgarait, P., & Di Schino, A. (2020). Laser Operating Windows Prediction in Selective Laser-Melting Processing of Metallic Powders: Development and Validation of a Computational Fluid Dynamics-Based Model. Materials, 13(6), 1424. https://doi.org/10.3390/ma13061424