Durability and Aesthetics of Architectural Concrete under Chloride Attack or Carbonation

Abstract
1. Introduction
2. Experiments
2.1. Raw Materials and Mix Proportions
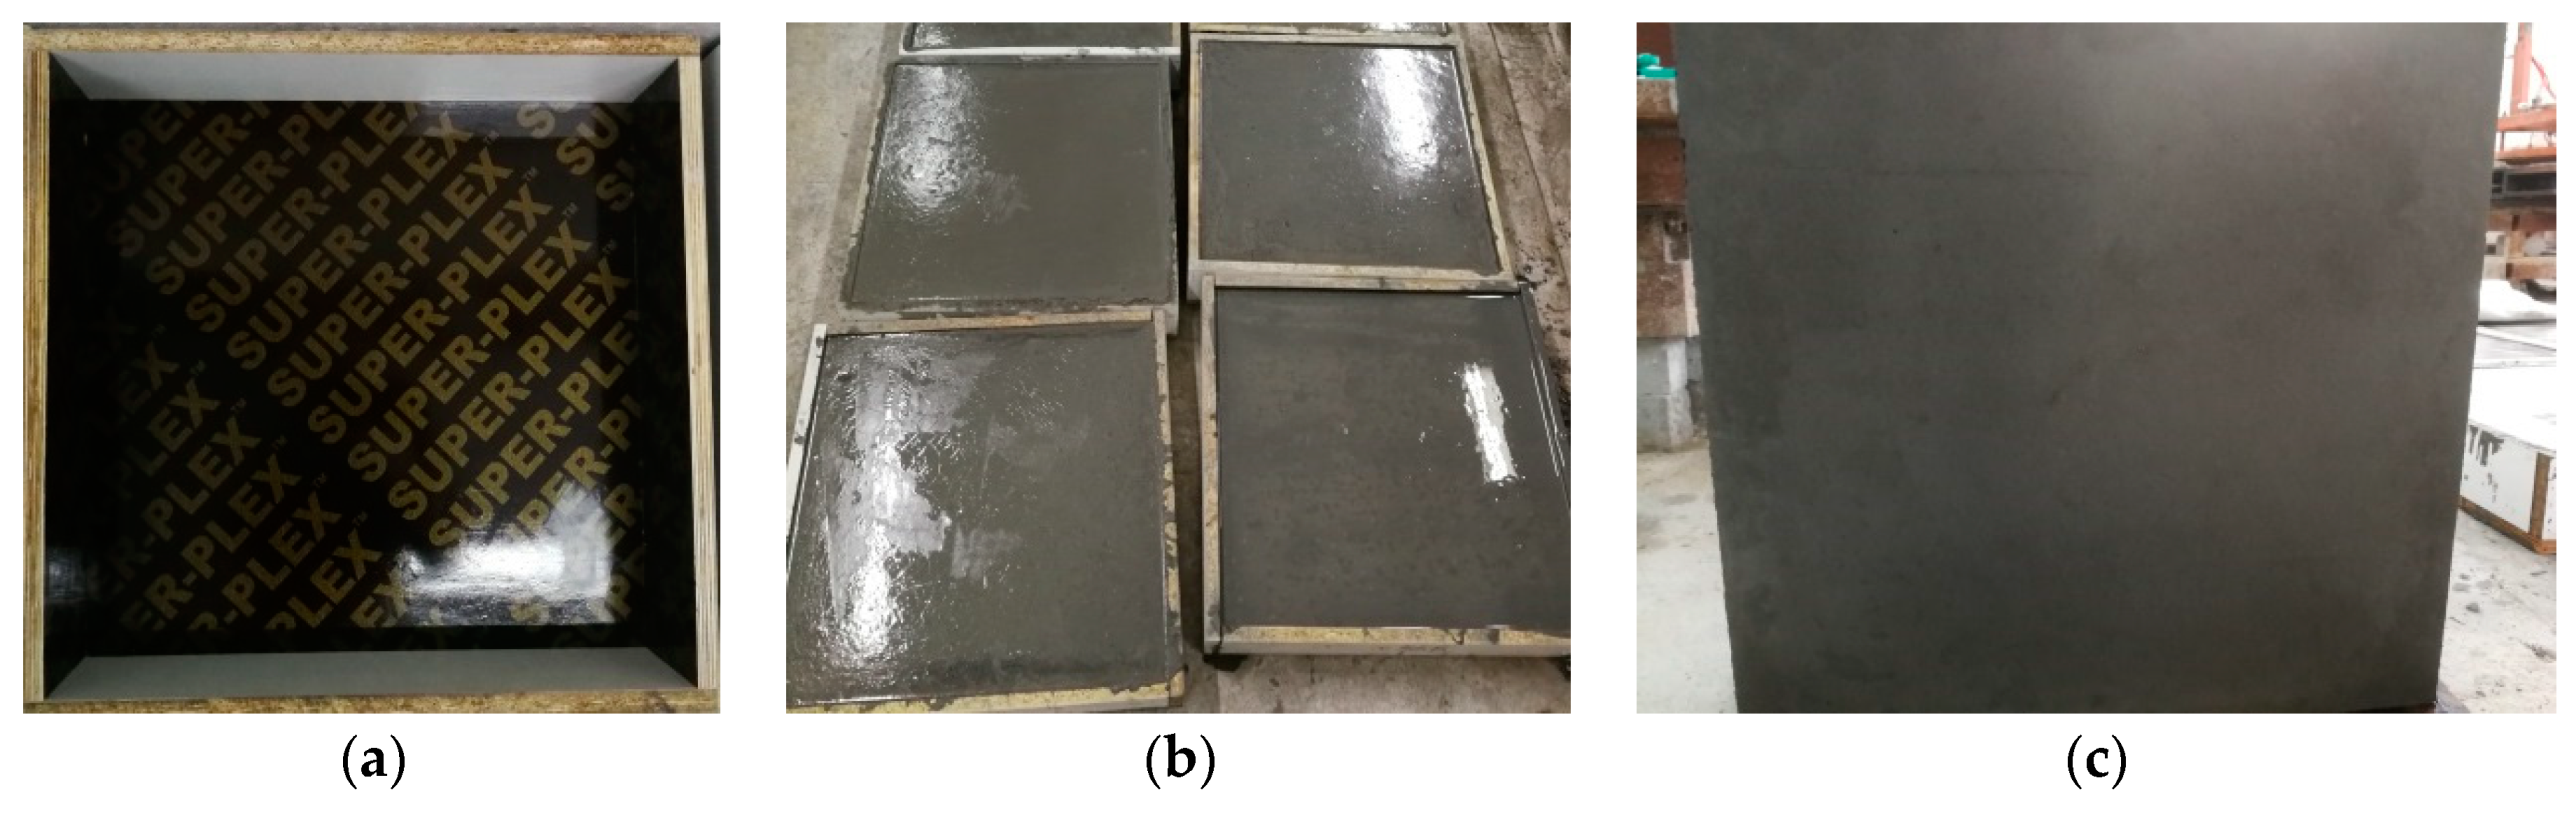
2.2. Sample Preparation
2.3. Compressive Strength
2.4. Carbonation
2.5. Salt Fog Exposure
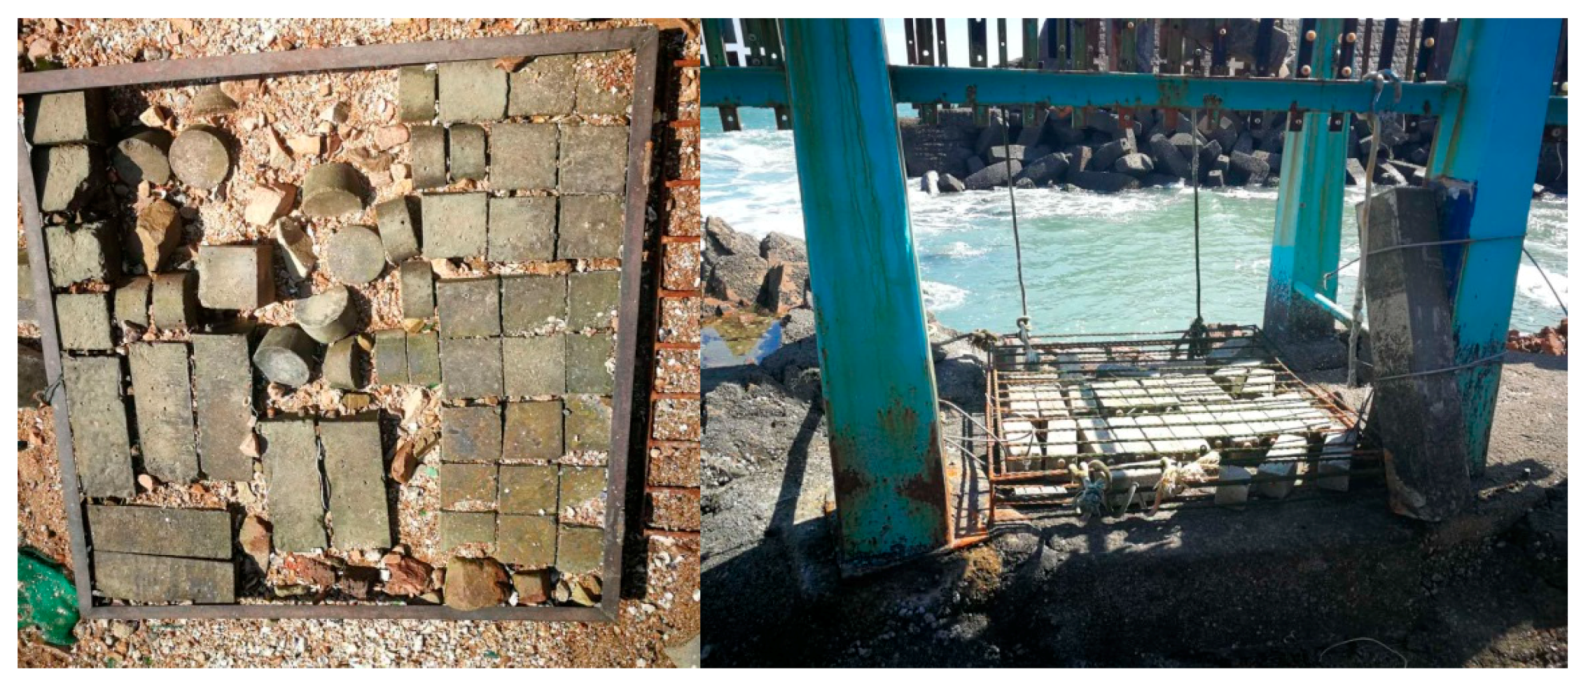
2.6. Marine Environments Exposure
2.7. Surface Appearance
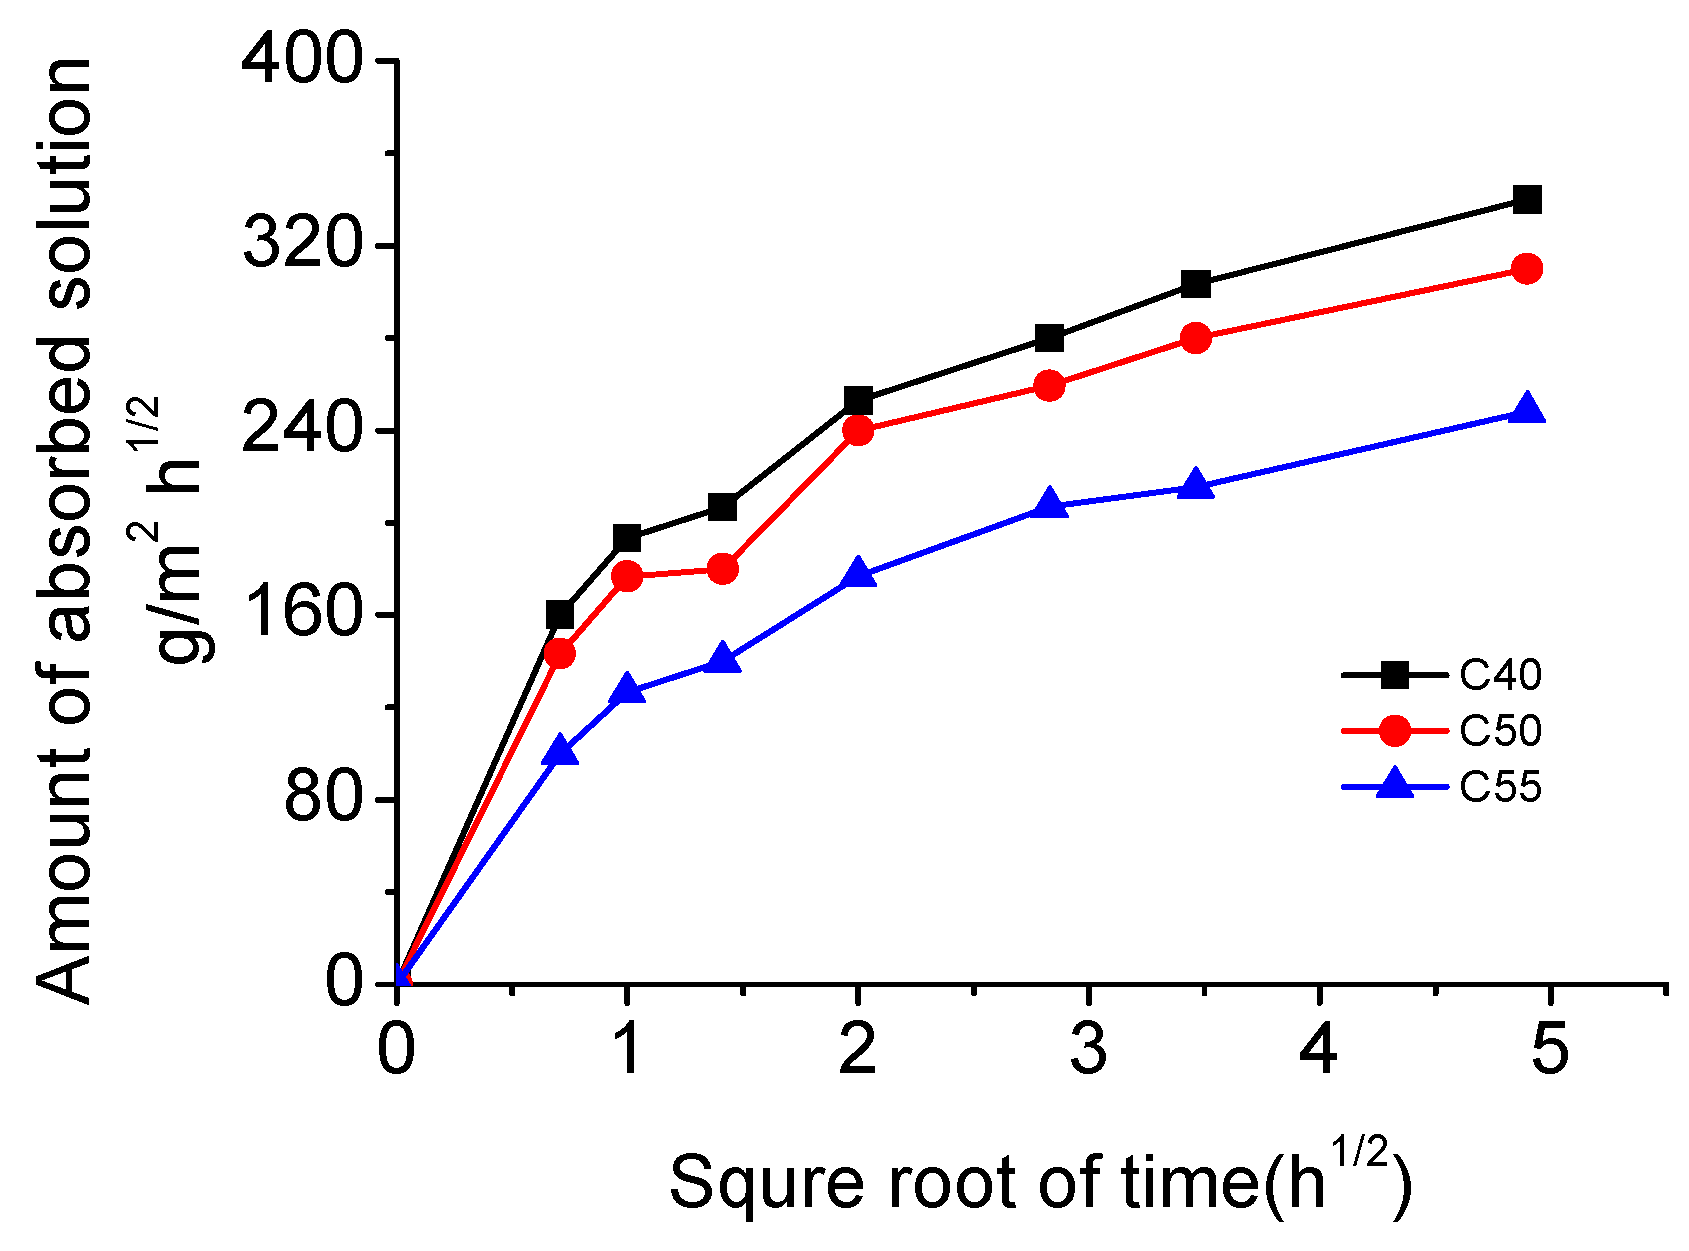
2.8. Capillary Absorption
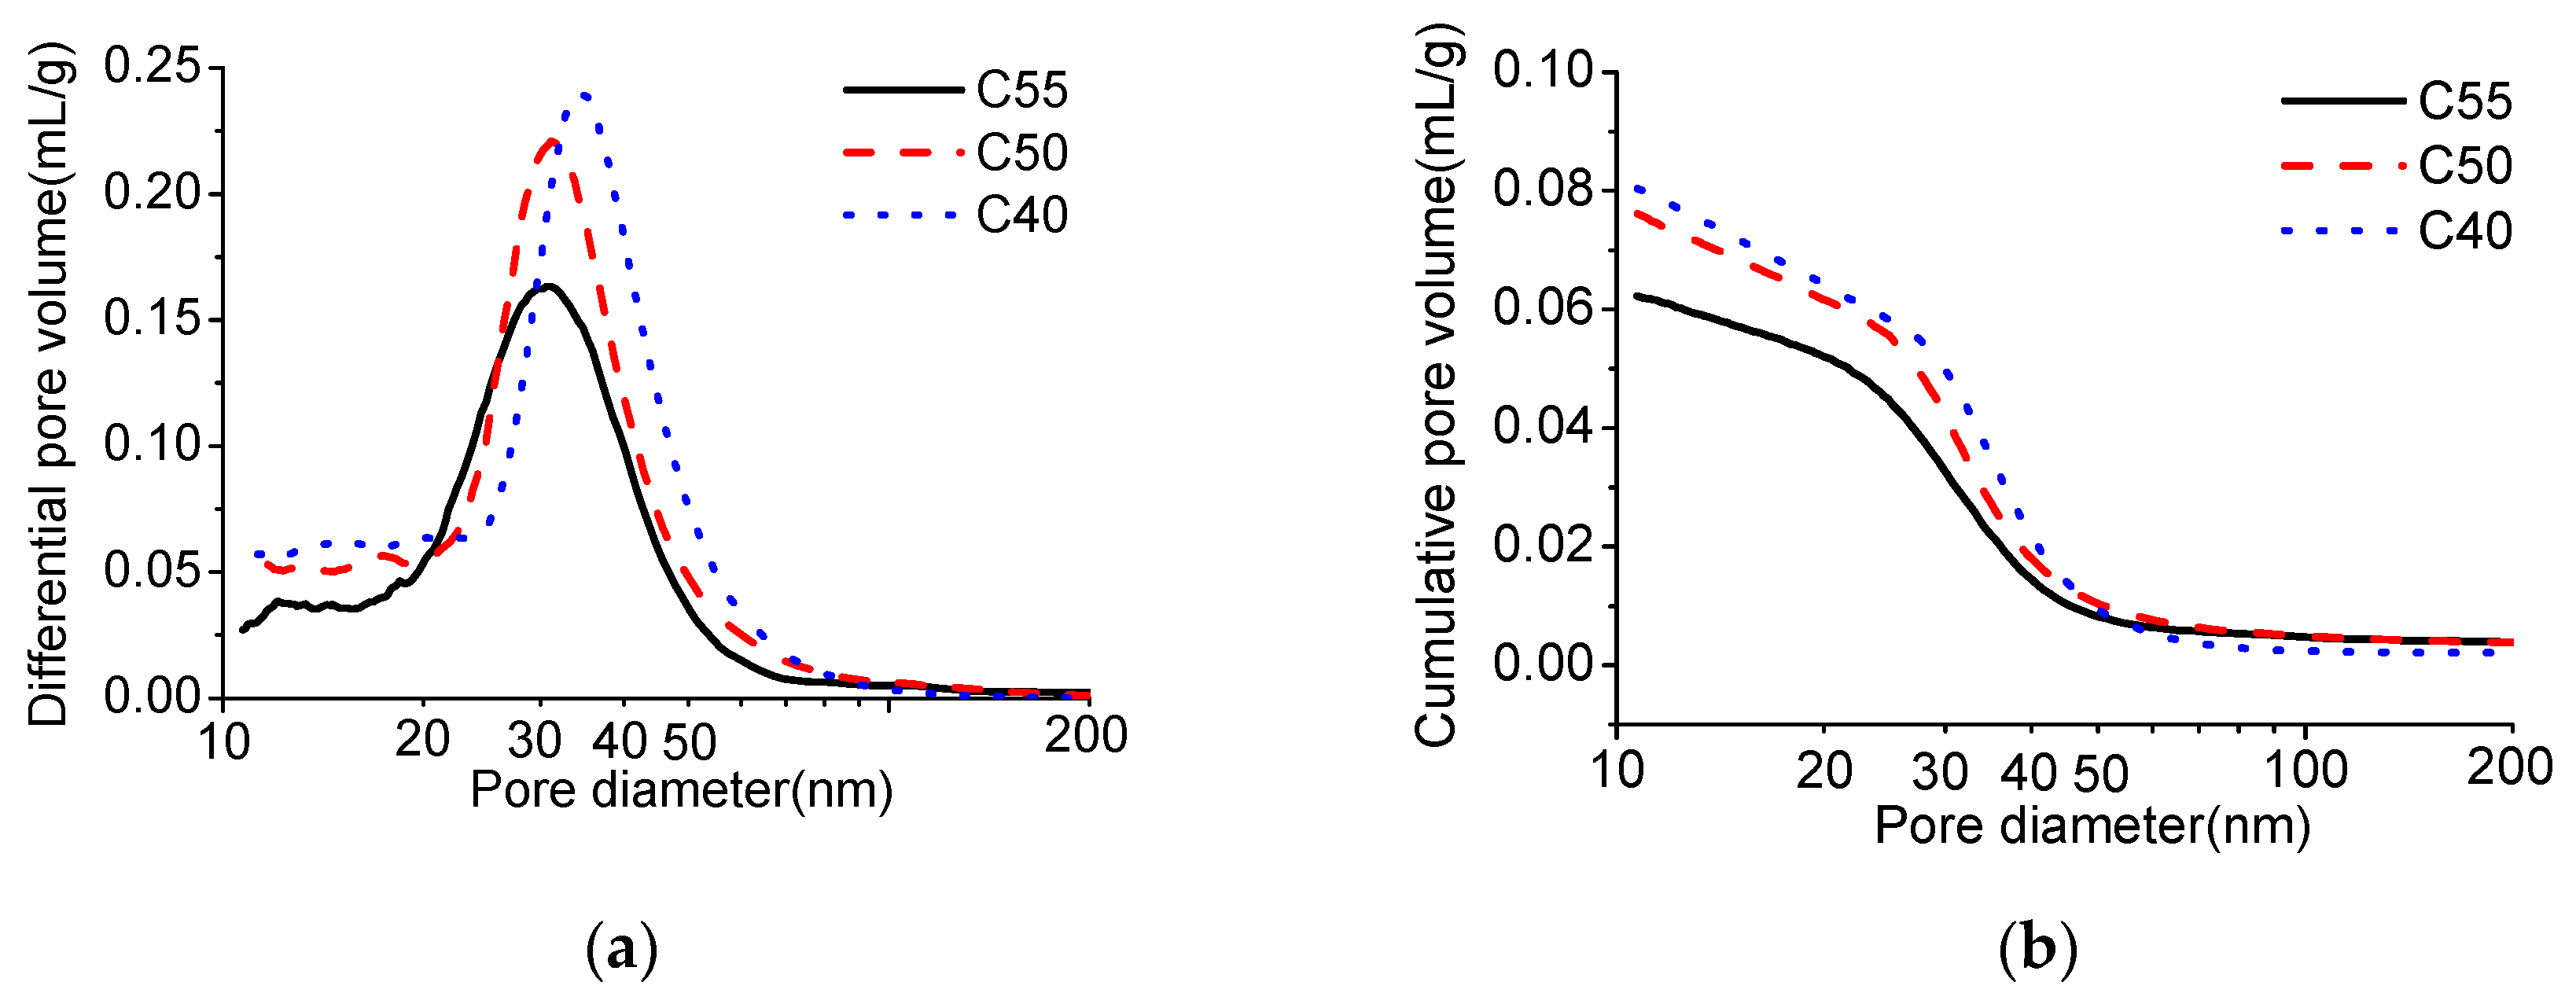
2.9. Mercury Intrusion Porosimetry (MIP)
3. Results and Discussion
3.1. Basic Properties
3.2. Capillary Absorption Capacity
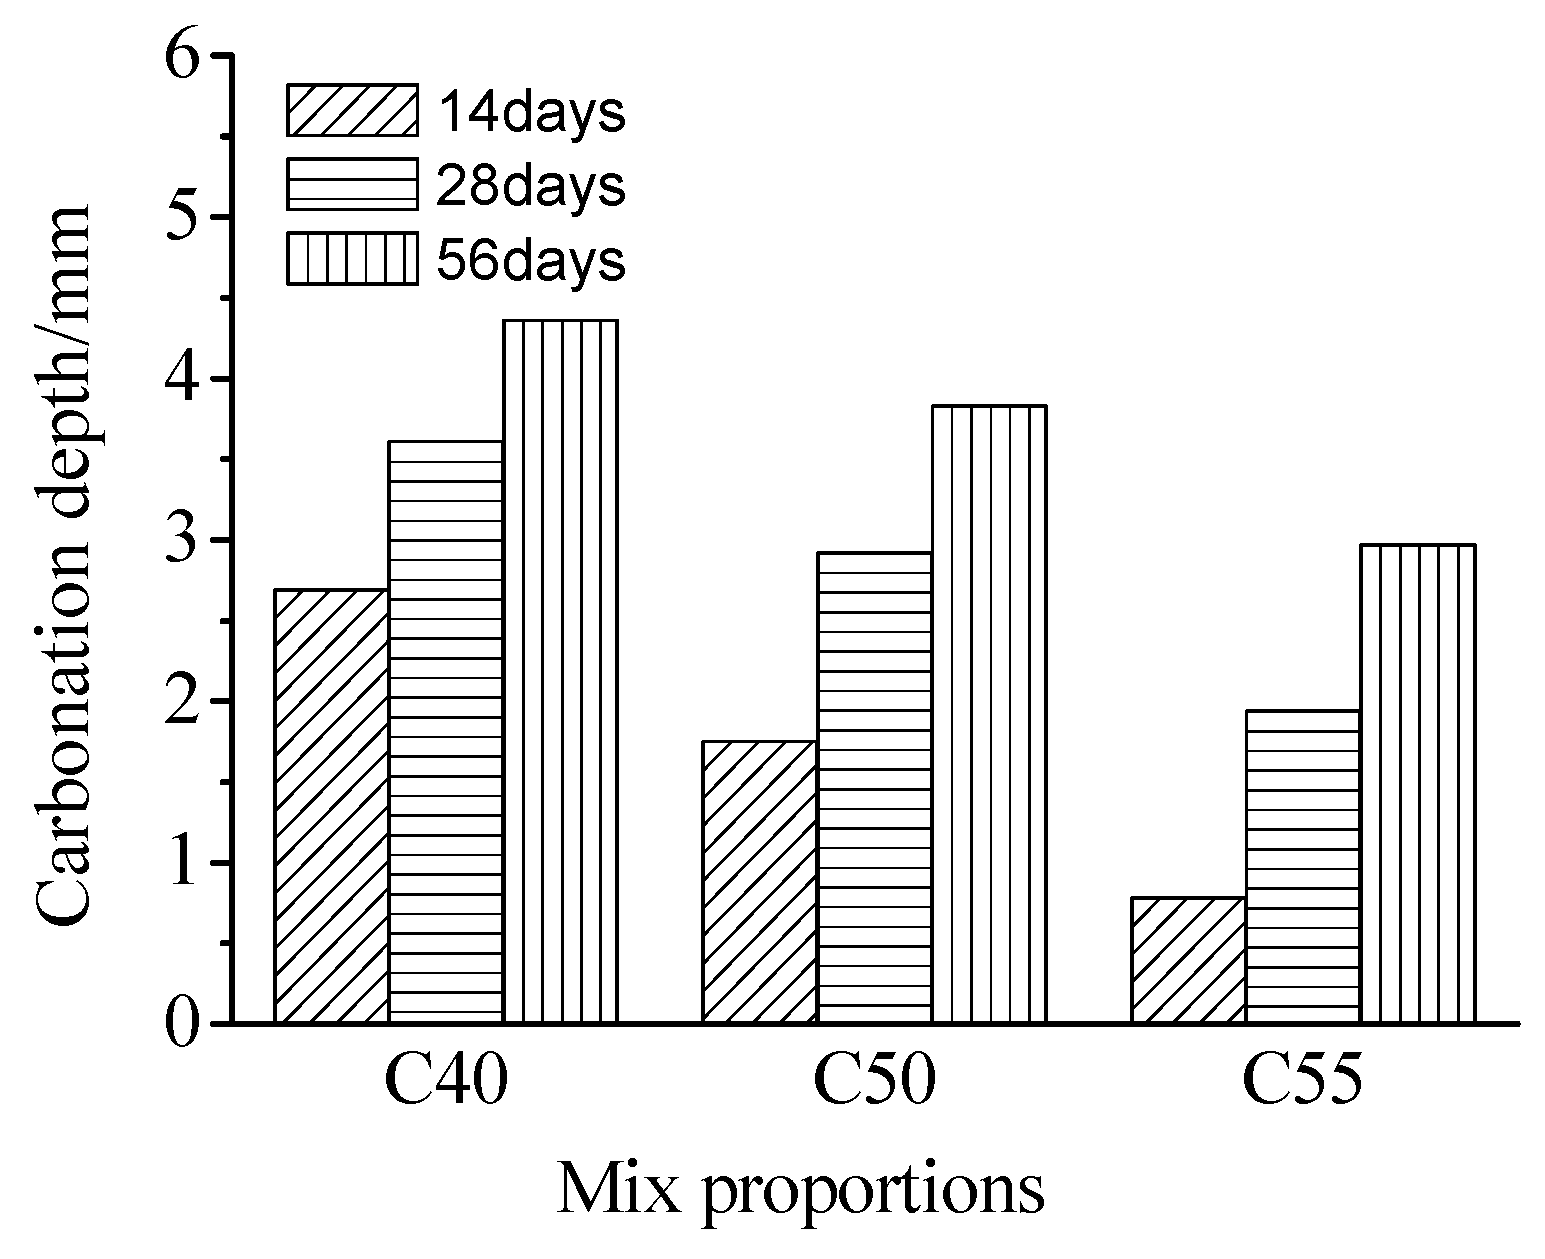
3.3. Carbonation Resistance
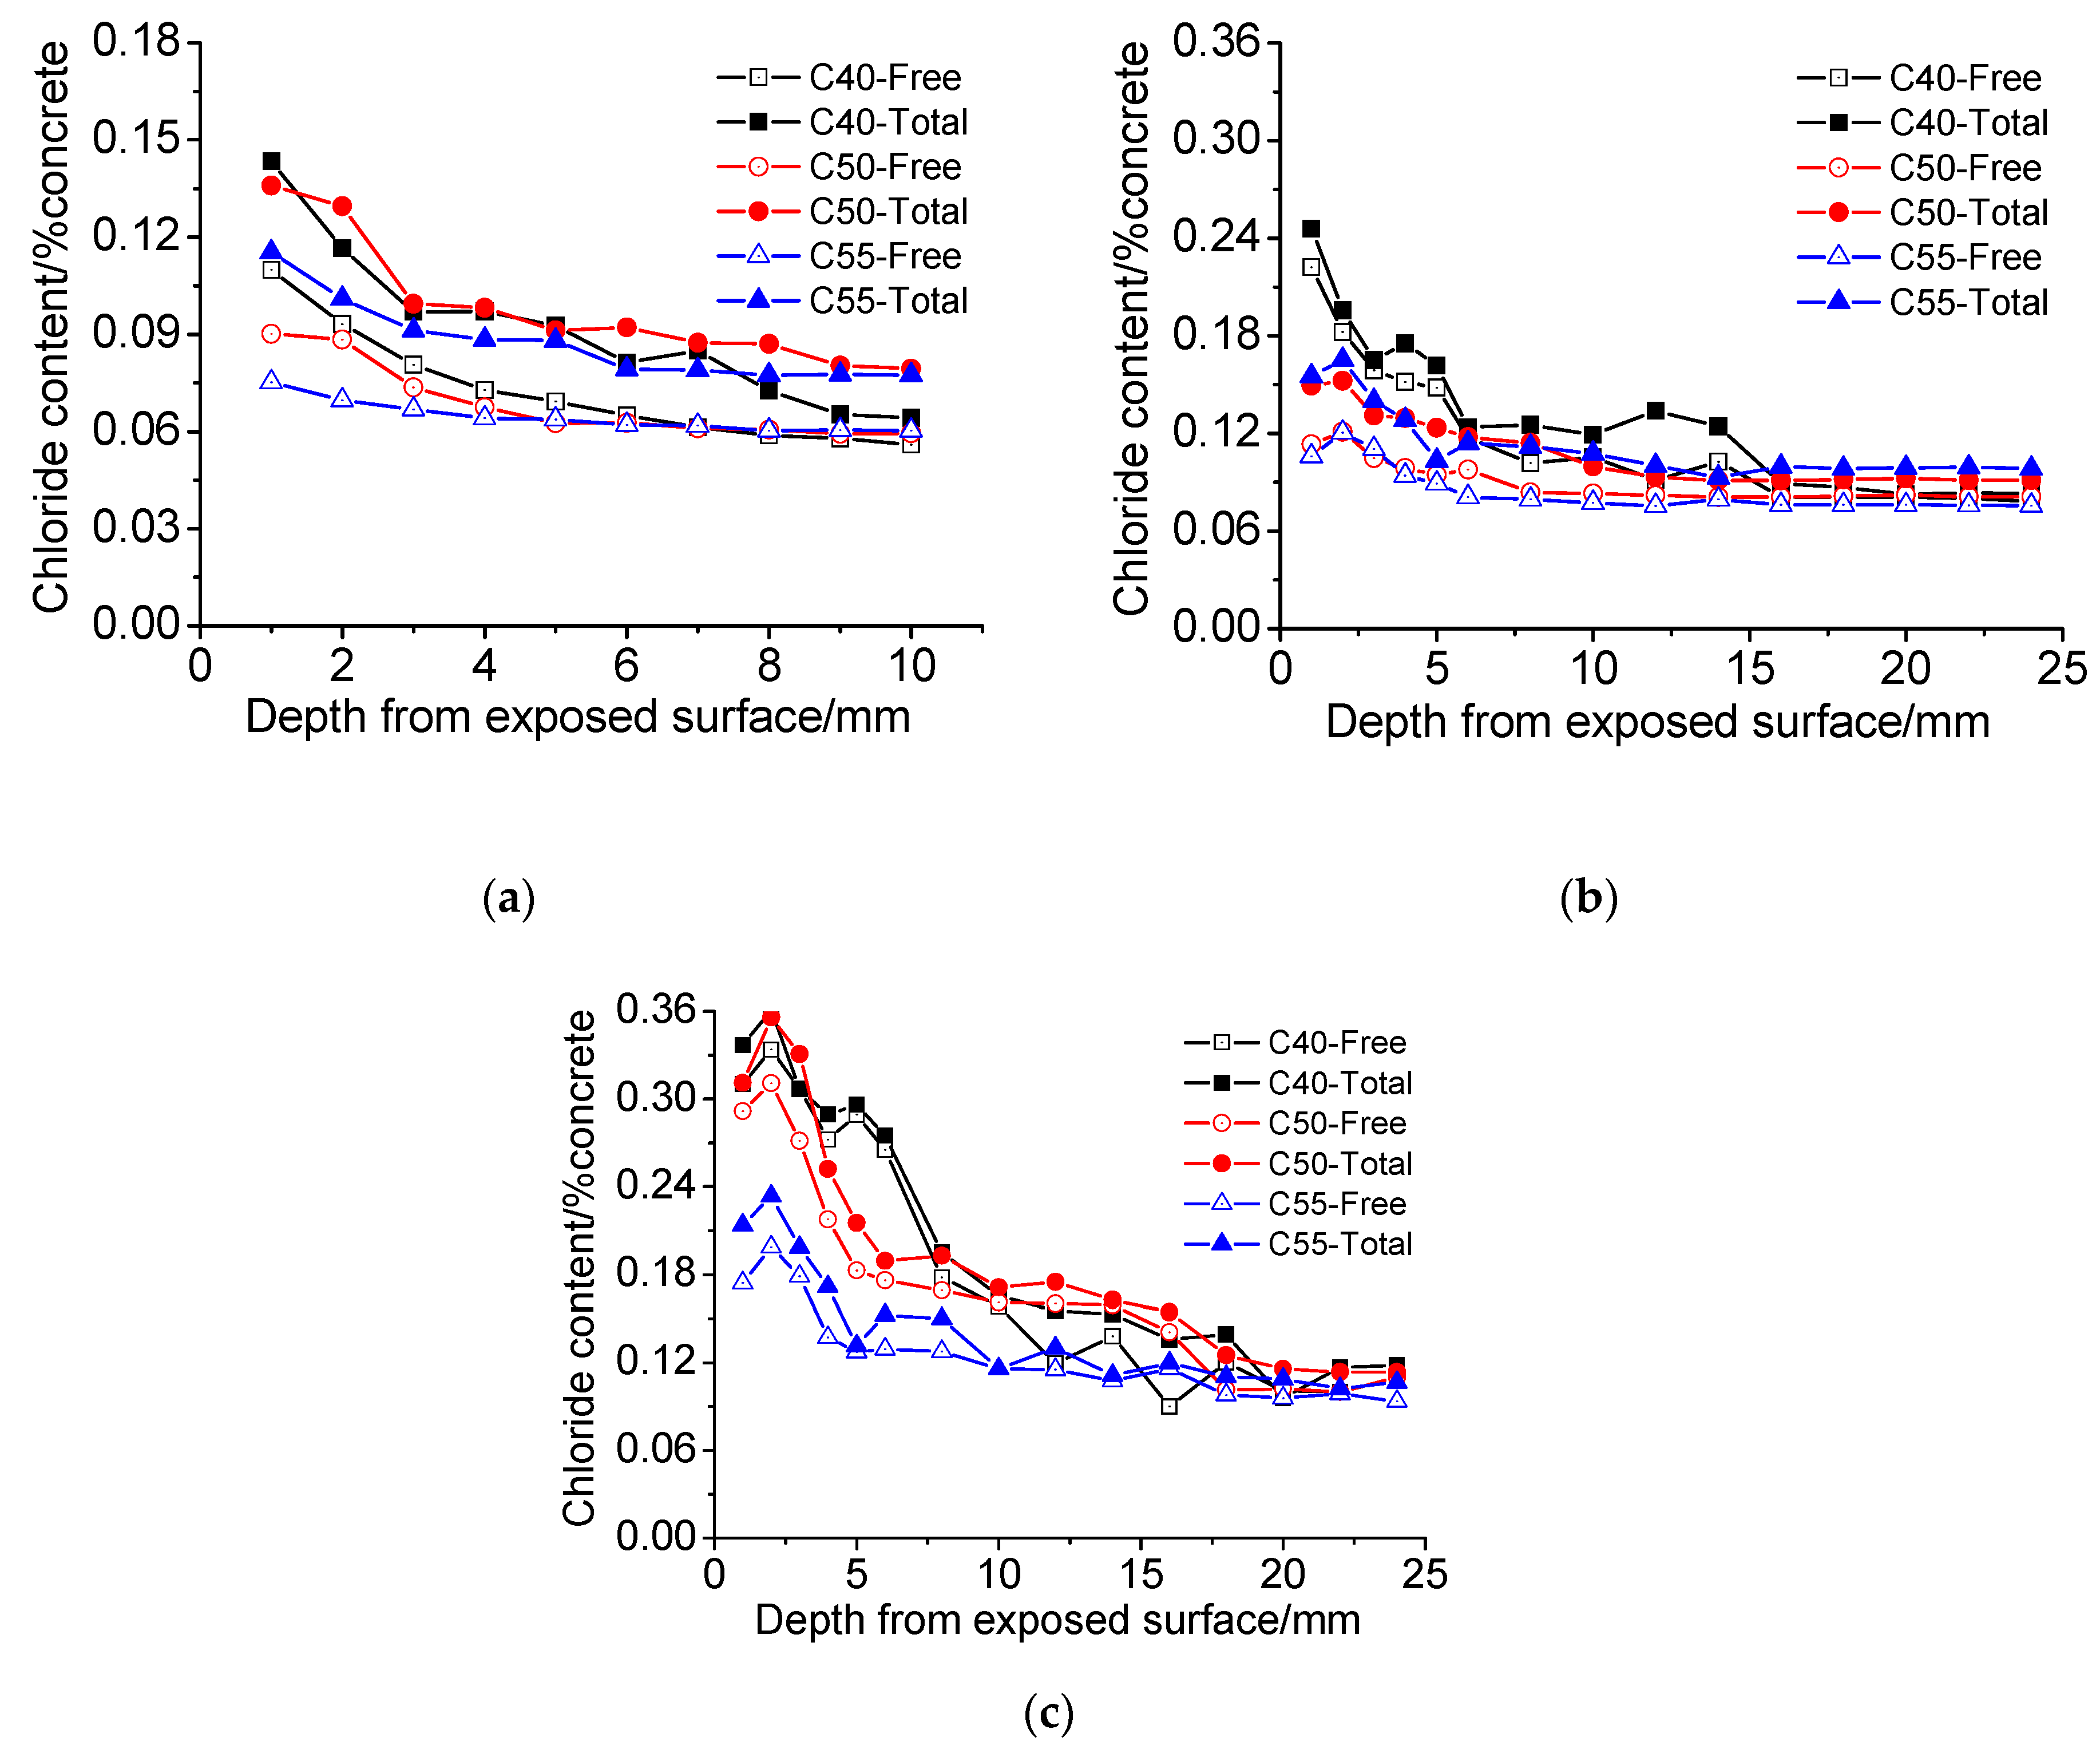
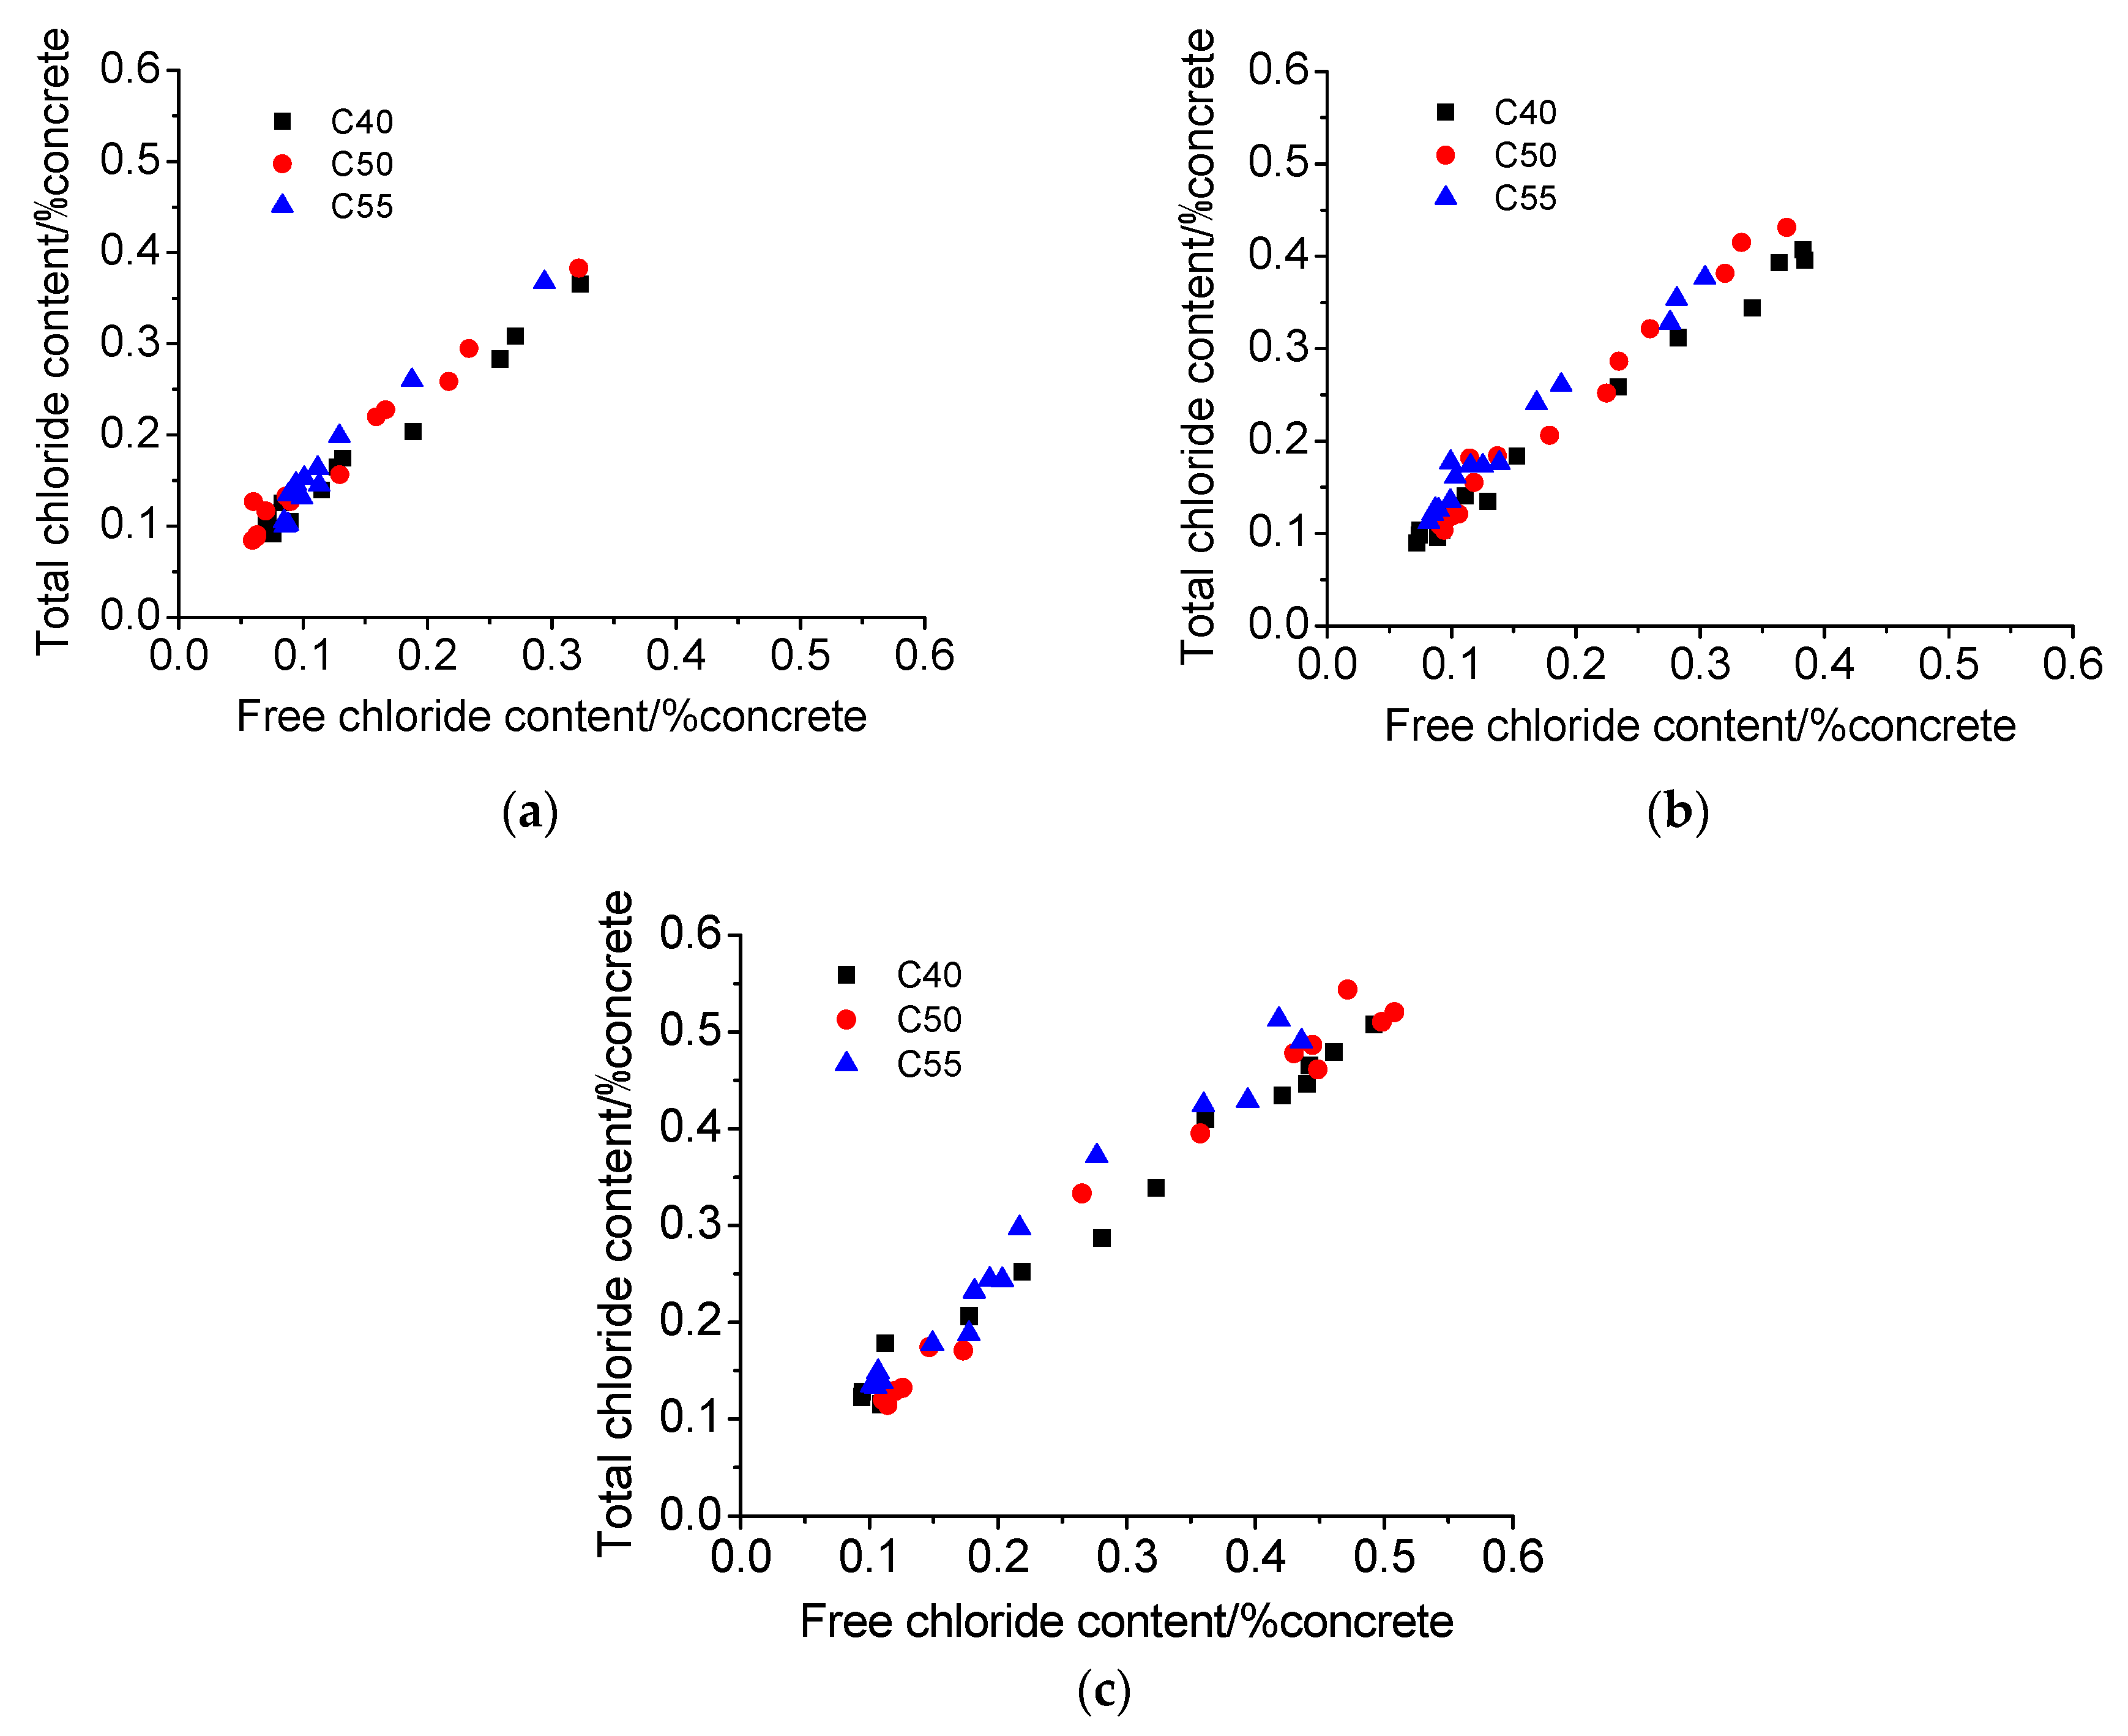
3.4. Chloride Penetration Resistance
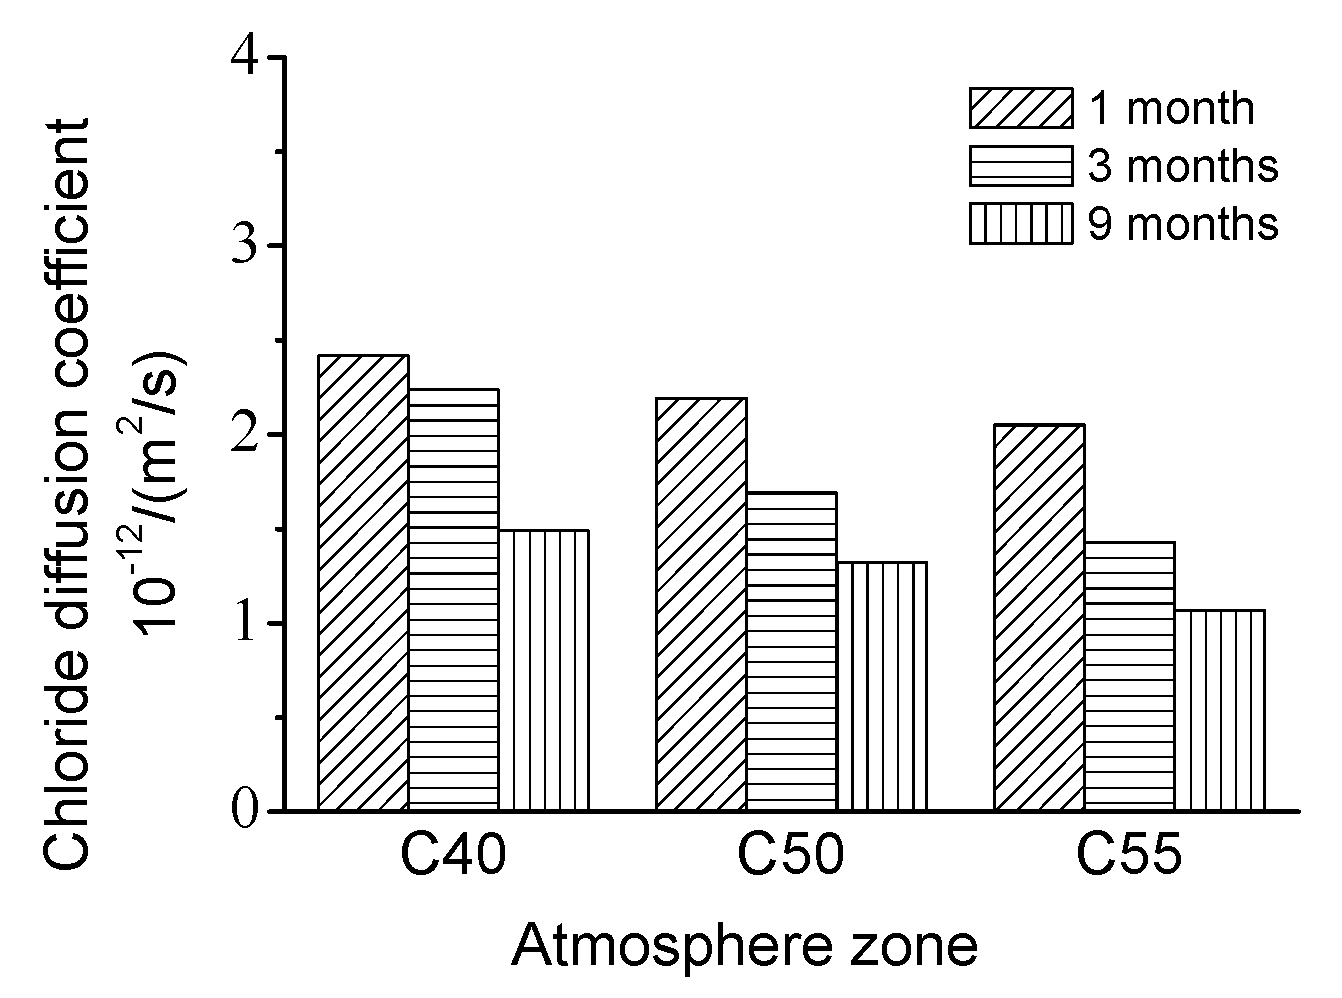
3.4.1. Atmosphere Zone
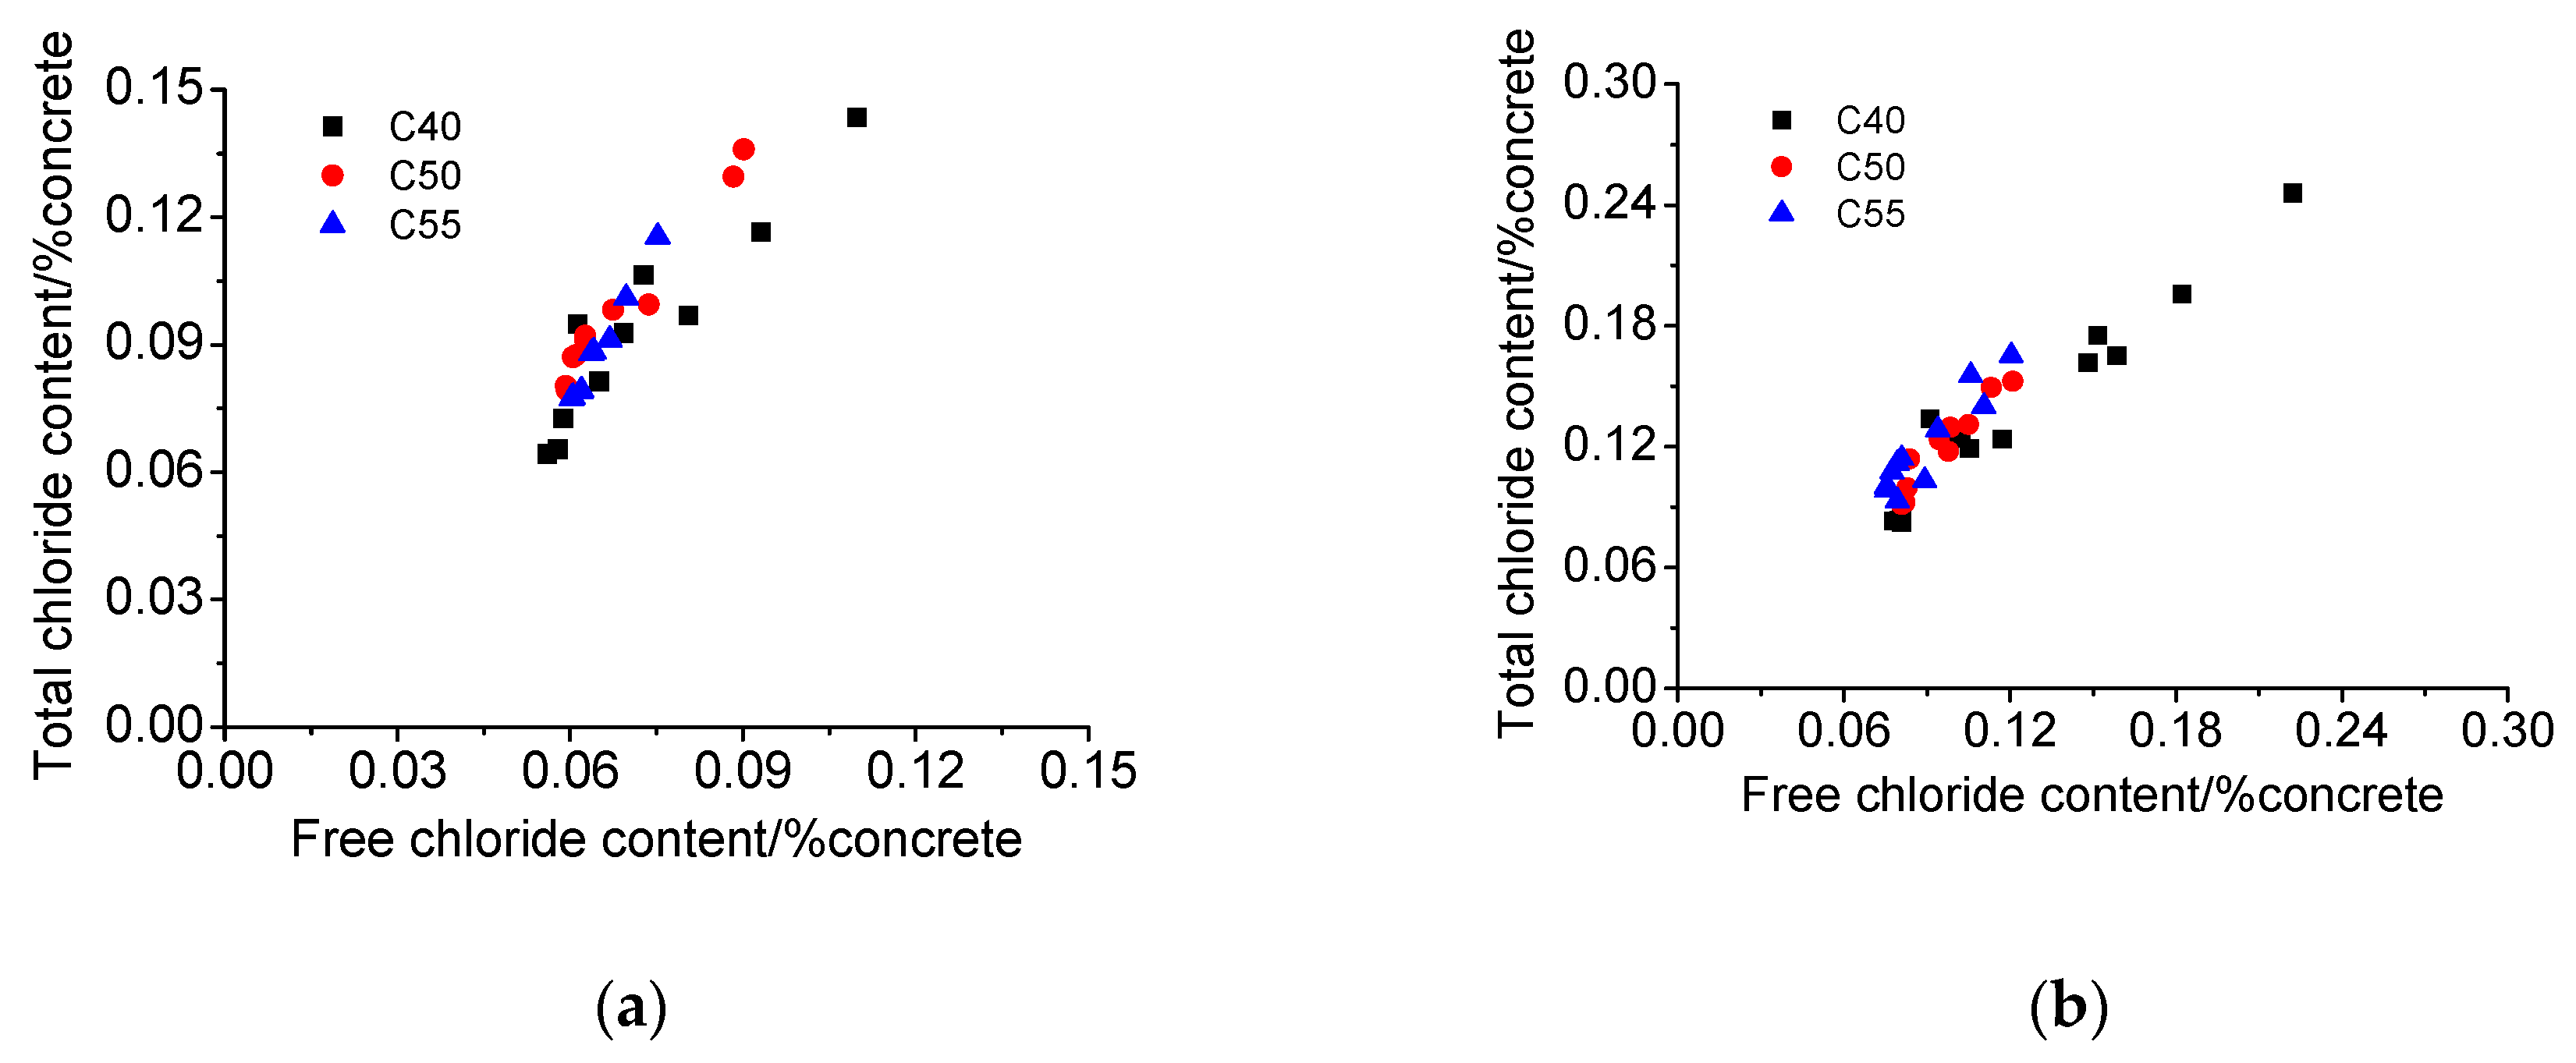
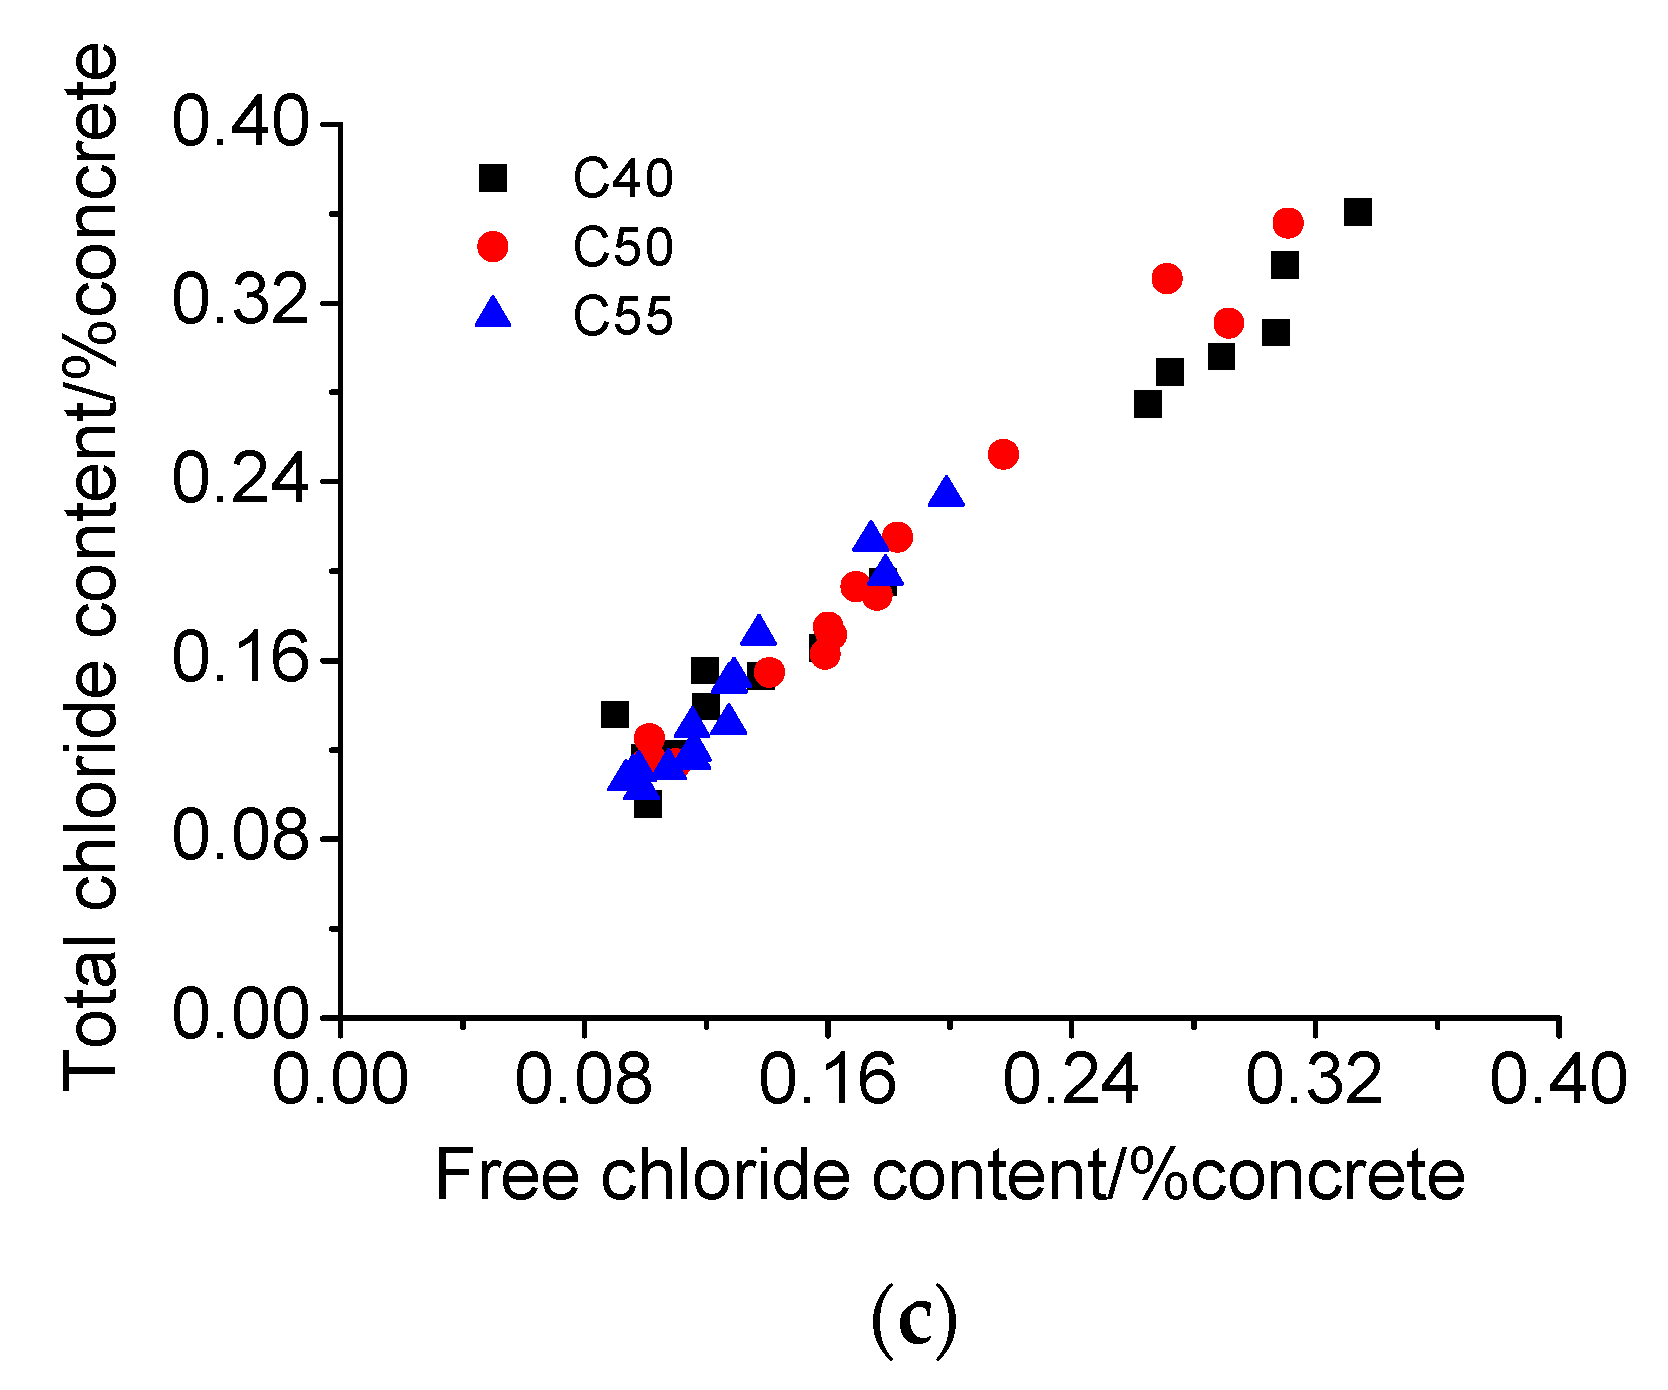
3.4.2. Tidal Zone
3.5. Surface Appearance
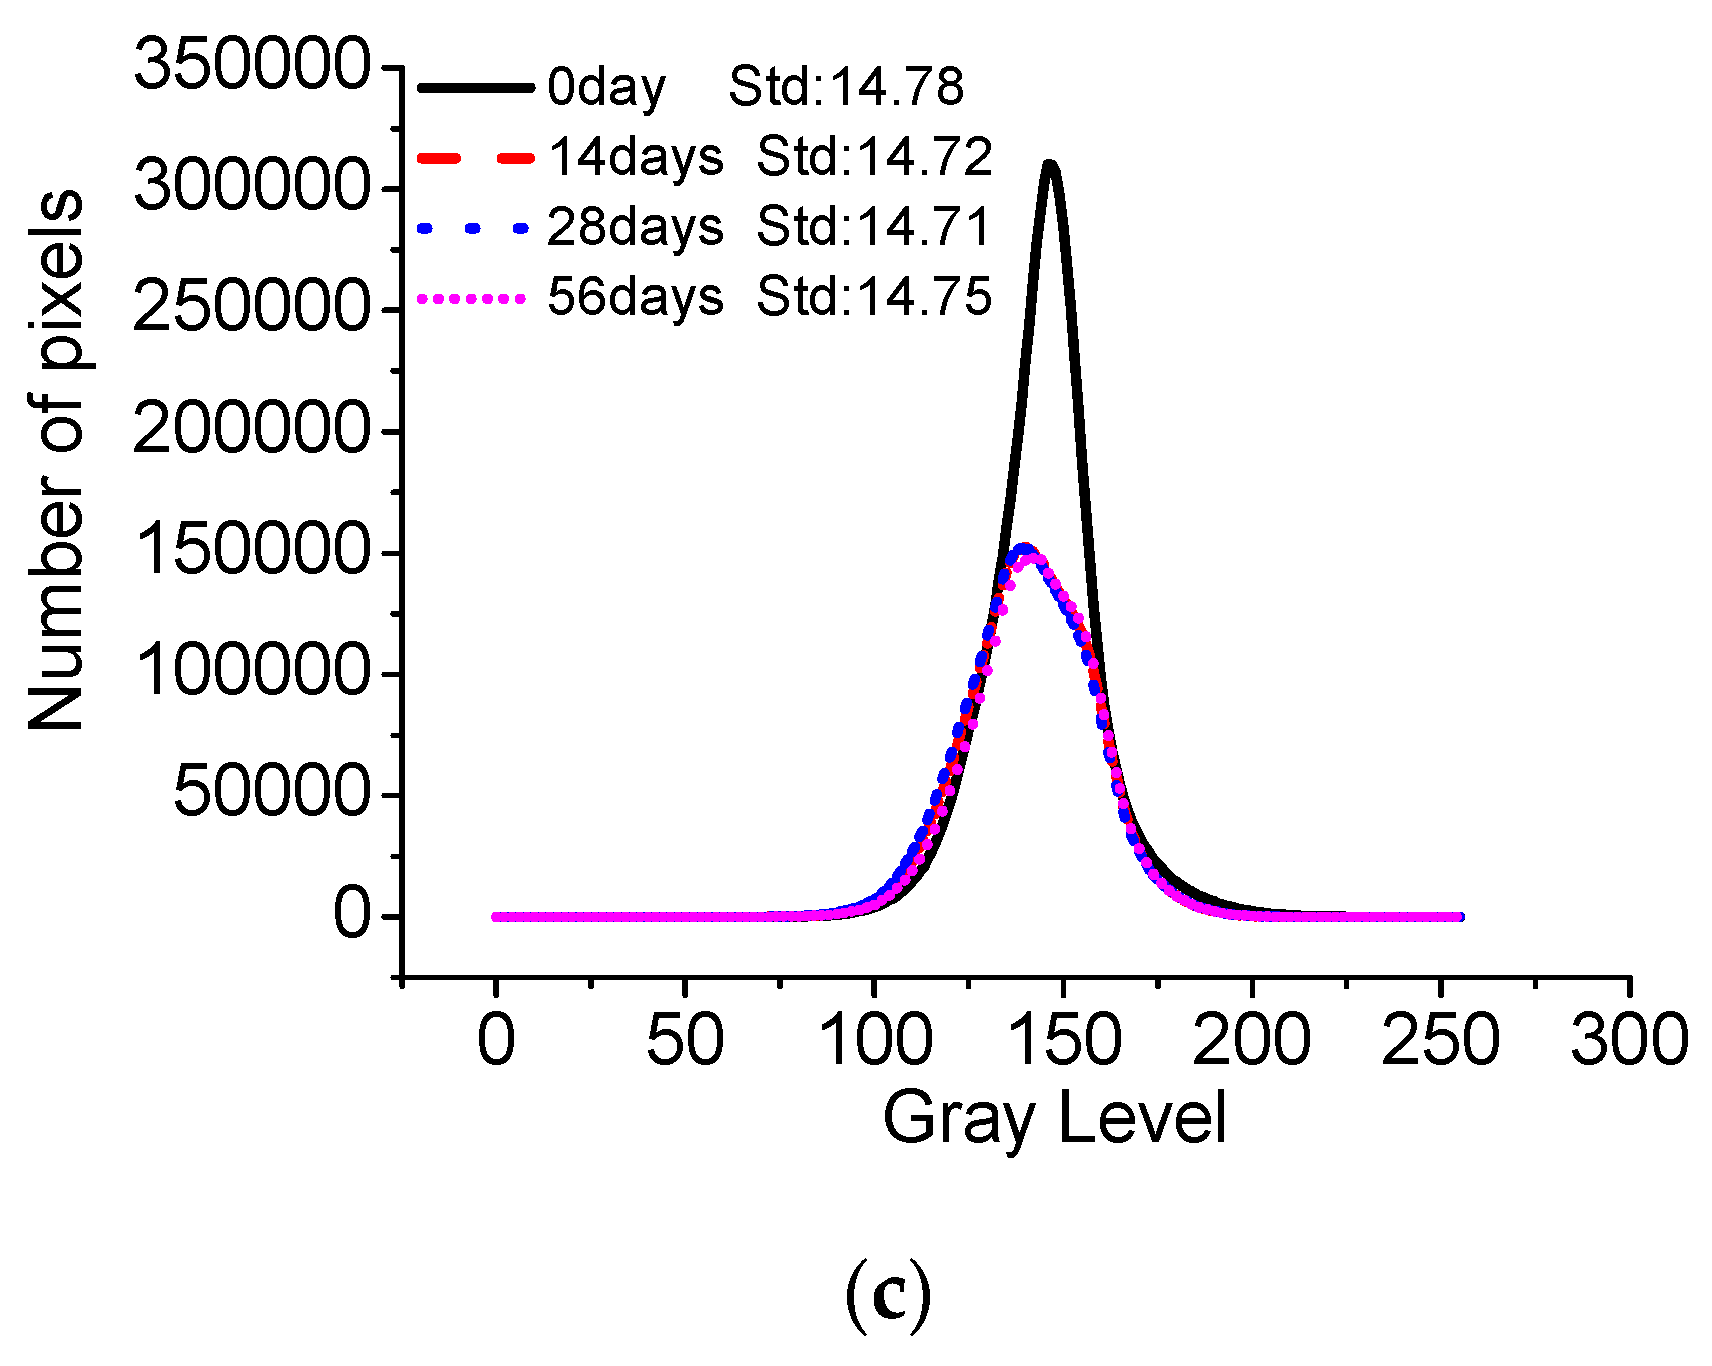
3.5.1. Carbonation
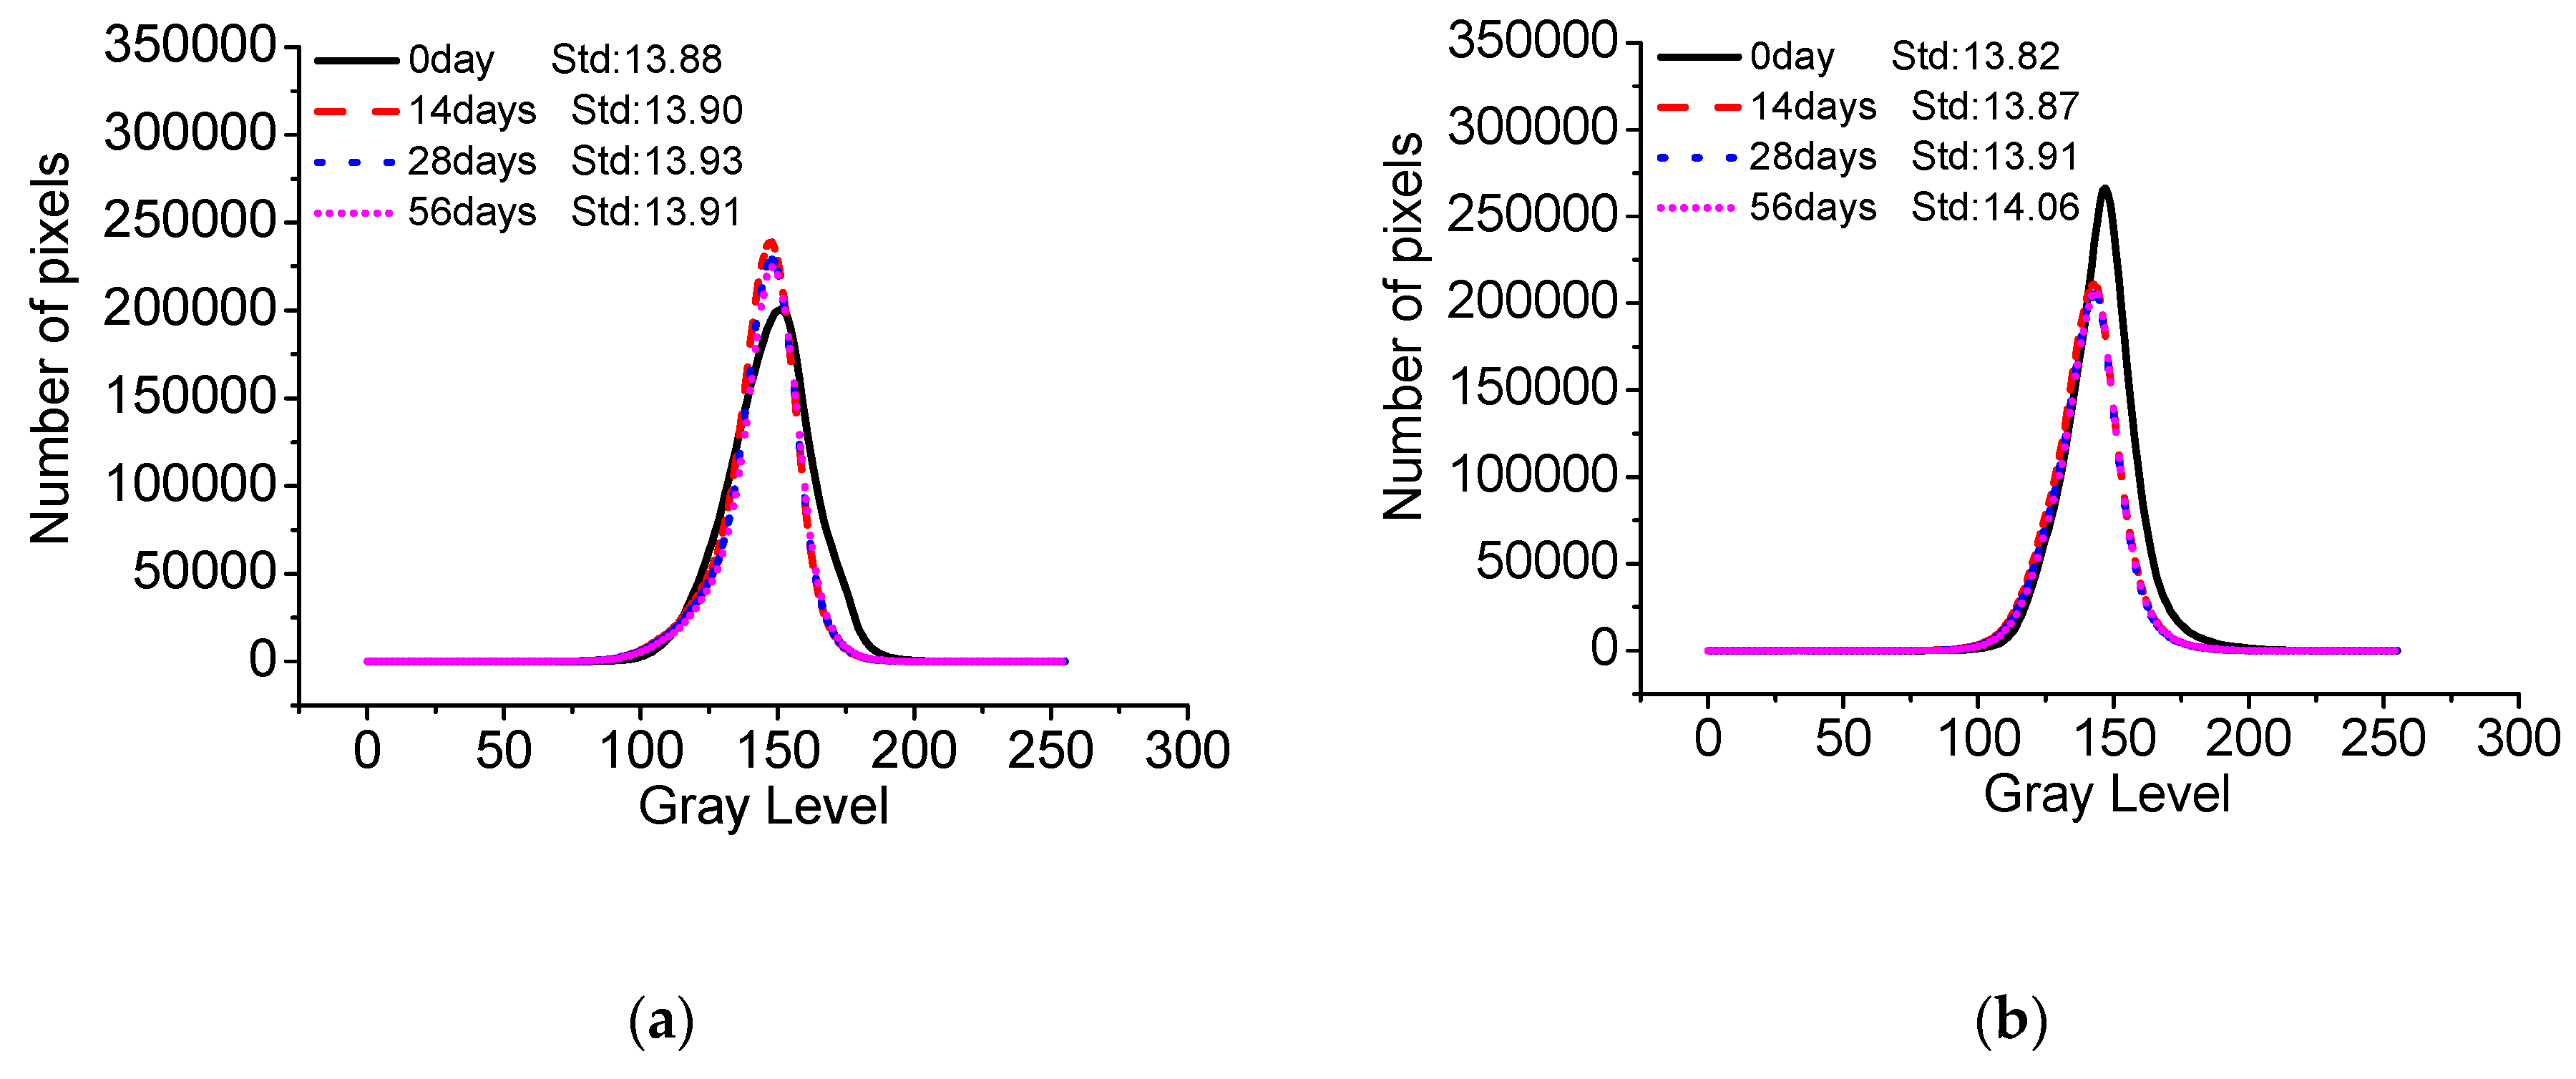
3.5.2. Salt Fog
3.5.3. Atmosphere Zone
4. Conclusions
- (1)
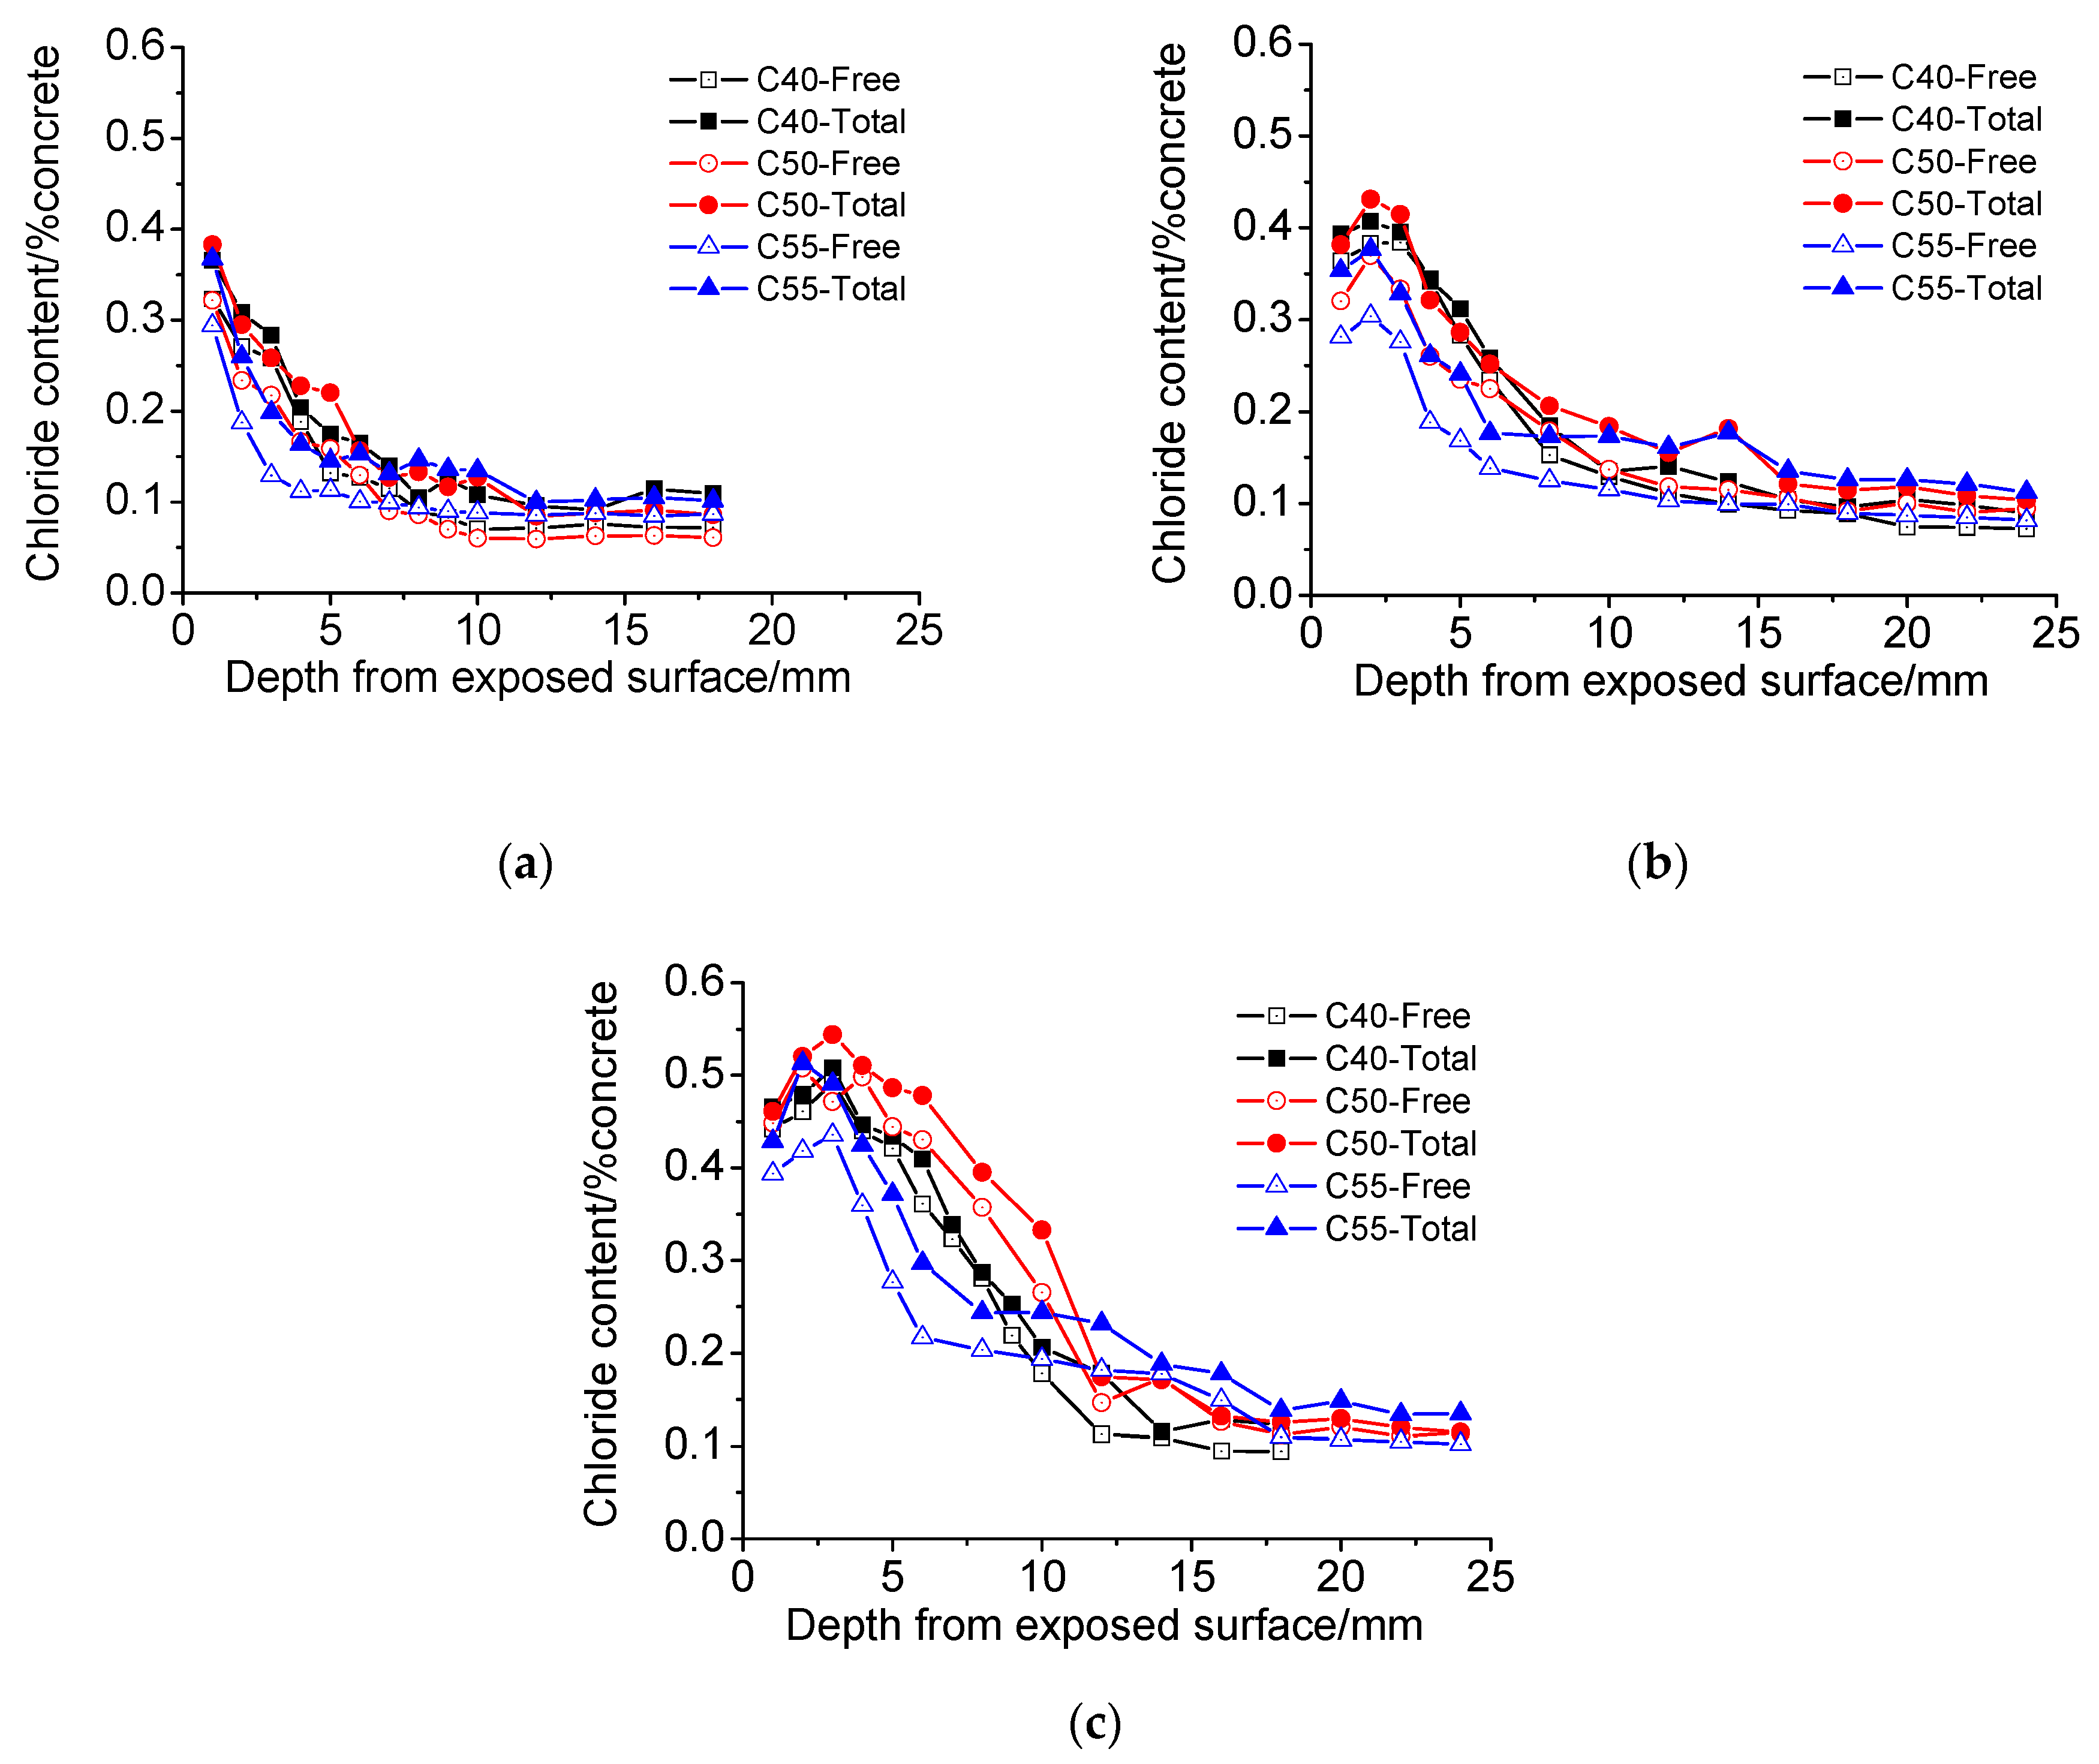
- The chloride distributions of architectural concrete in the marine atmosphere zone and tidal zone are similar. The total and free chloride content generally decreases with depth; chloride content augments significantly with exposure time, forming a maximum chloride peak near the surface of concrete. Besides, the chloride diffusion coefficient is small throughout the measurements, indicating that architectural concrete possesses superior capacity on resisting chloride penetration. Moreover, architectural concrete also has great carbonation resistance based on carbonation depth data obtained from the accelerated carbonation experiment.
- (2)
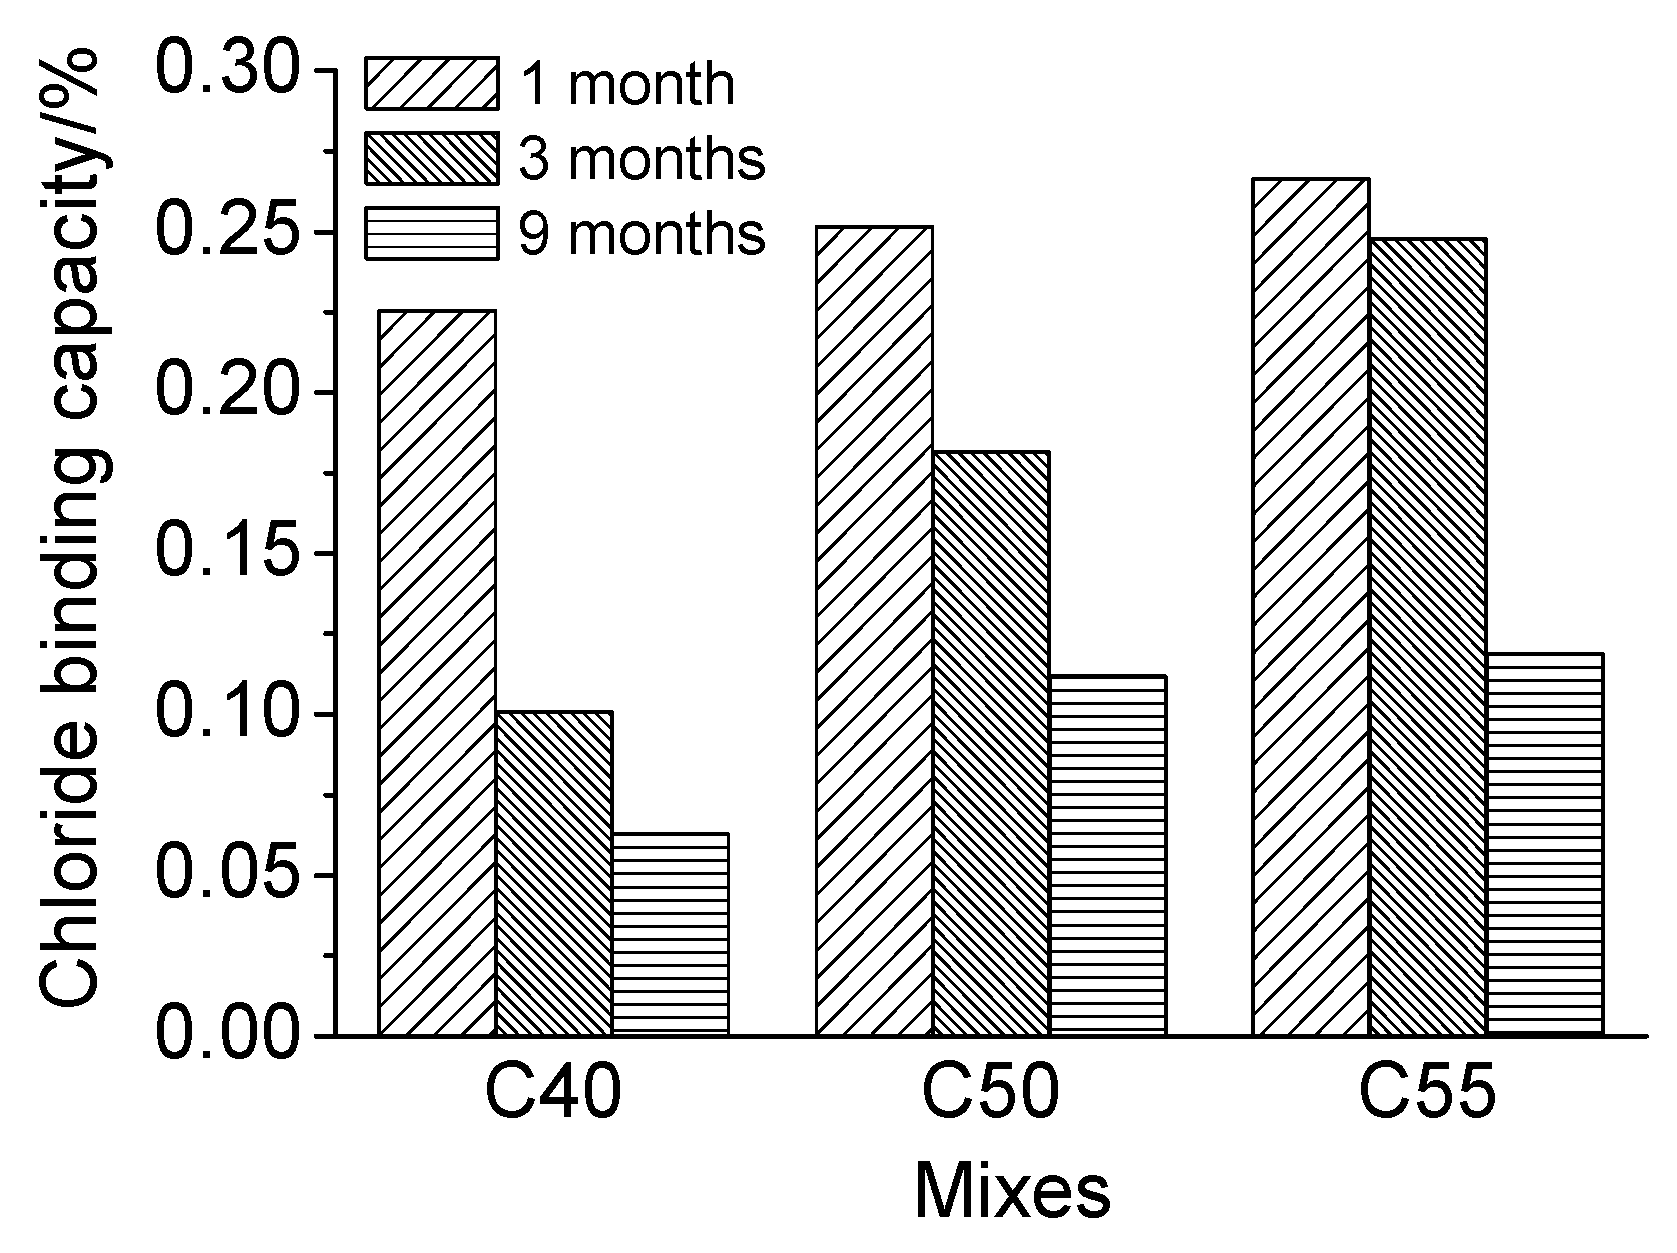
- Concrete of higher strength grade has better chloride binding capacity due to a larger quantity of hydration products and a more densified microstructure, both of which are beneficial for the chloride penetration resistance of concrete.
- (3)
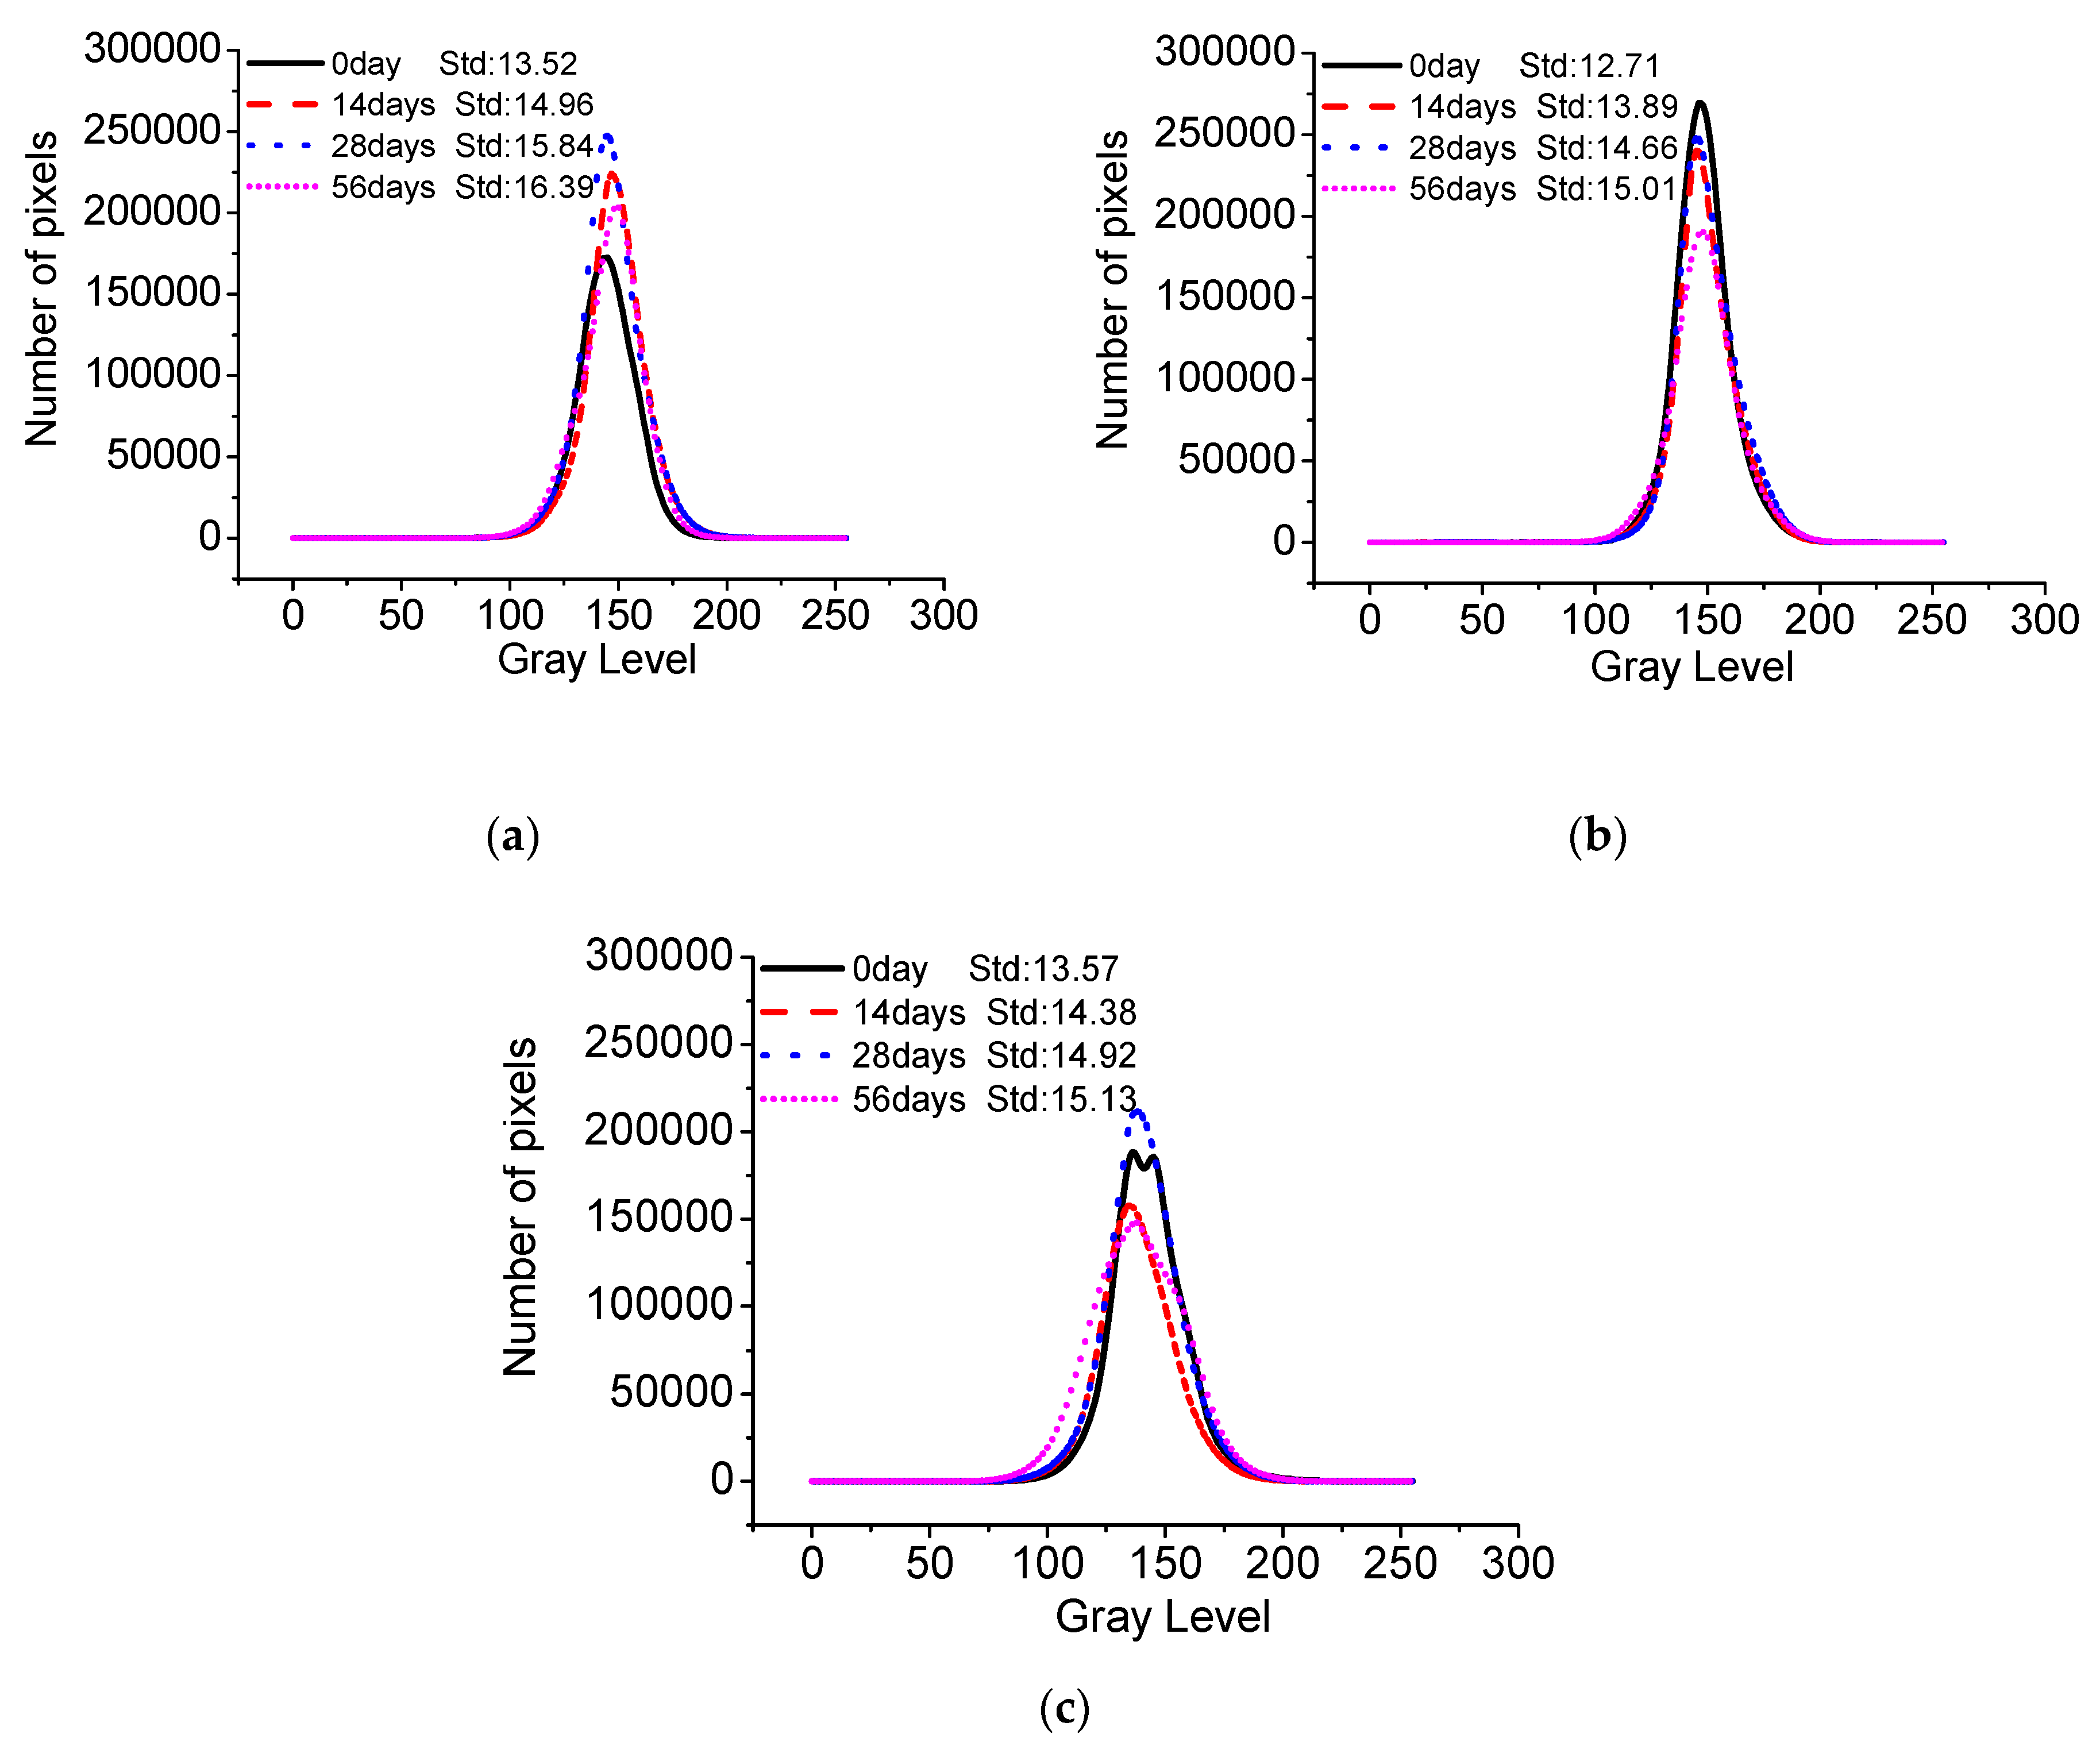
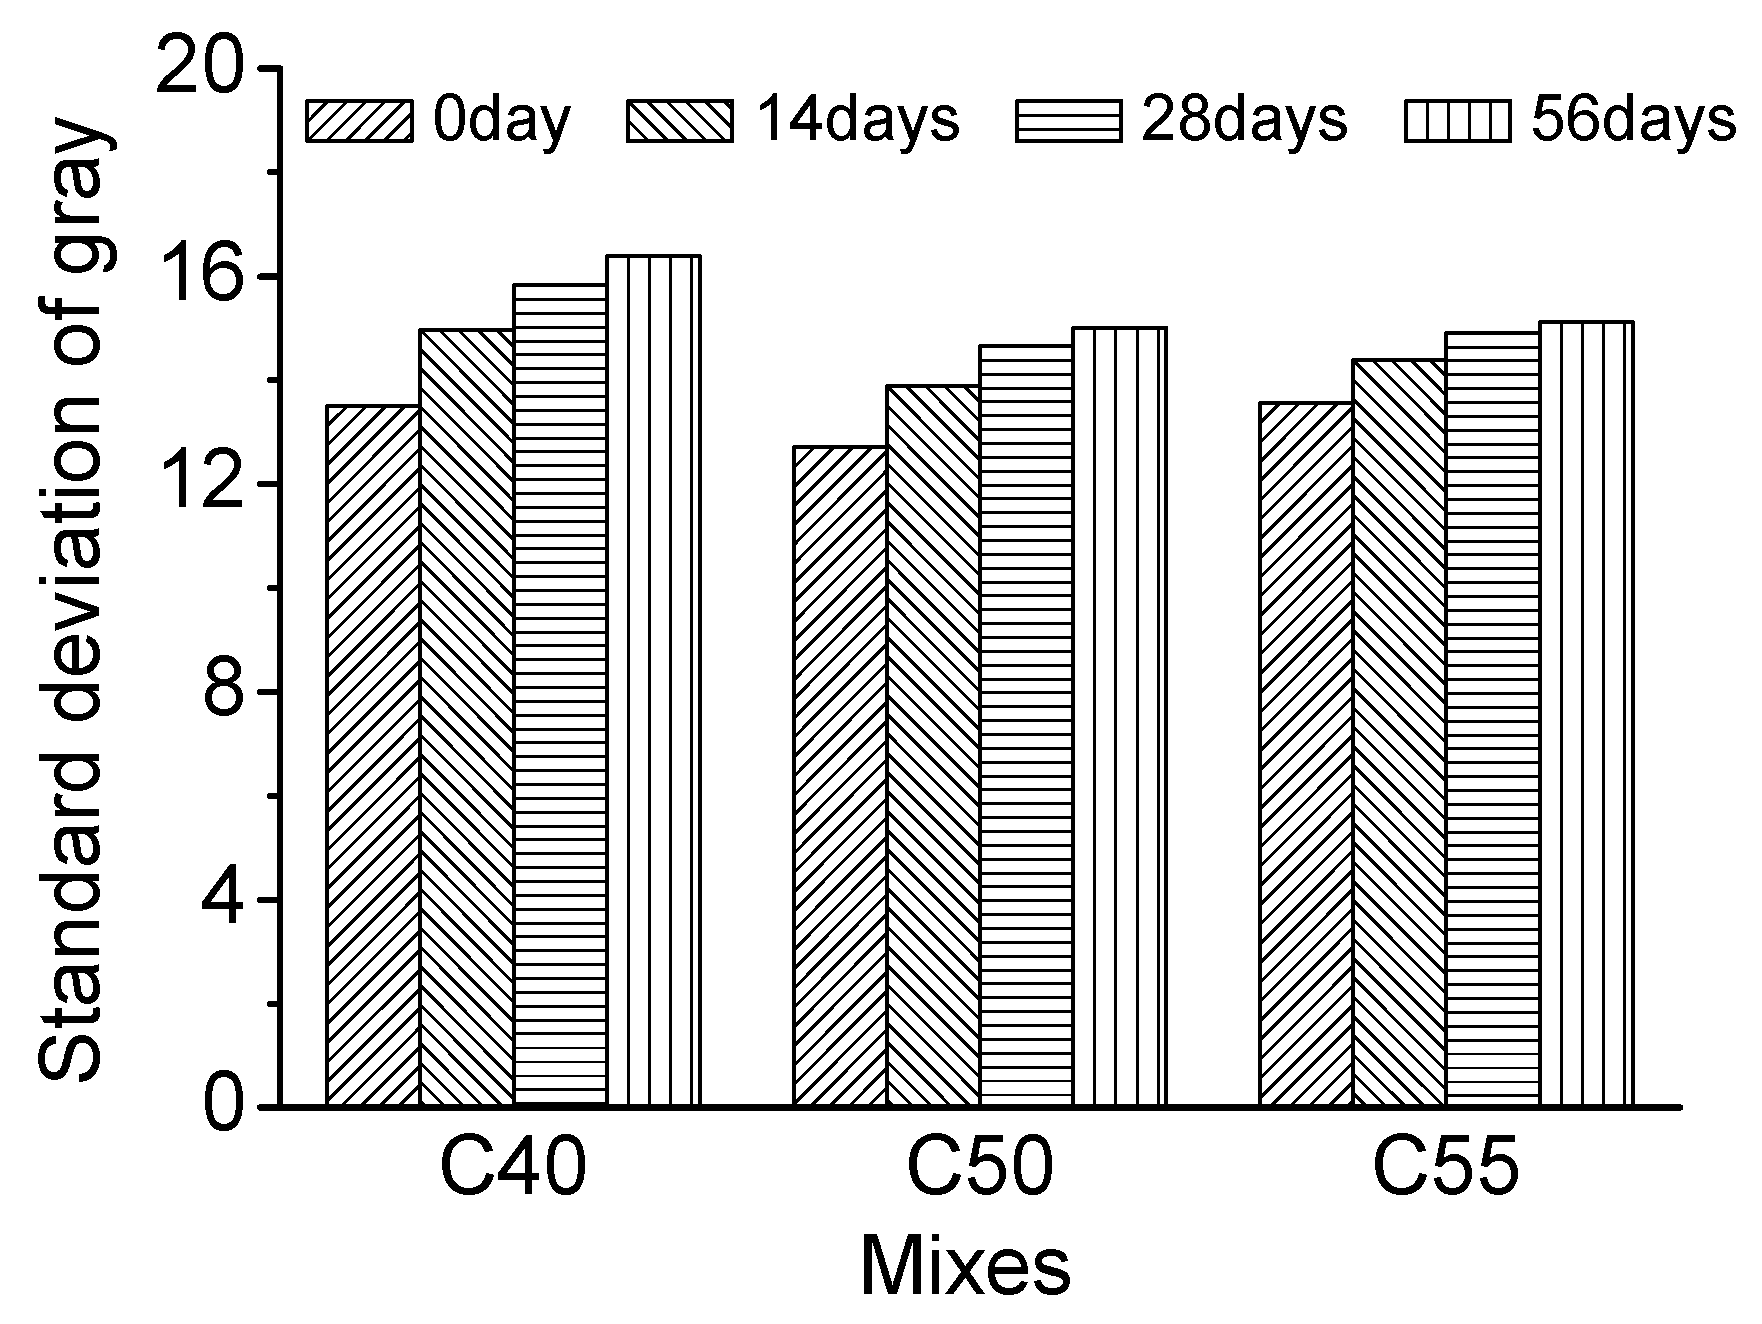
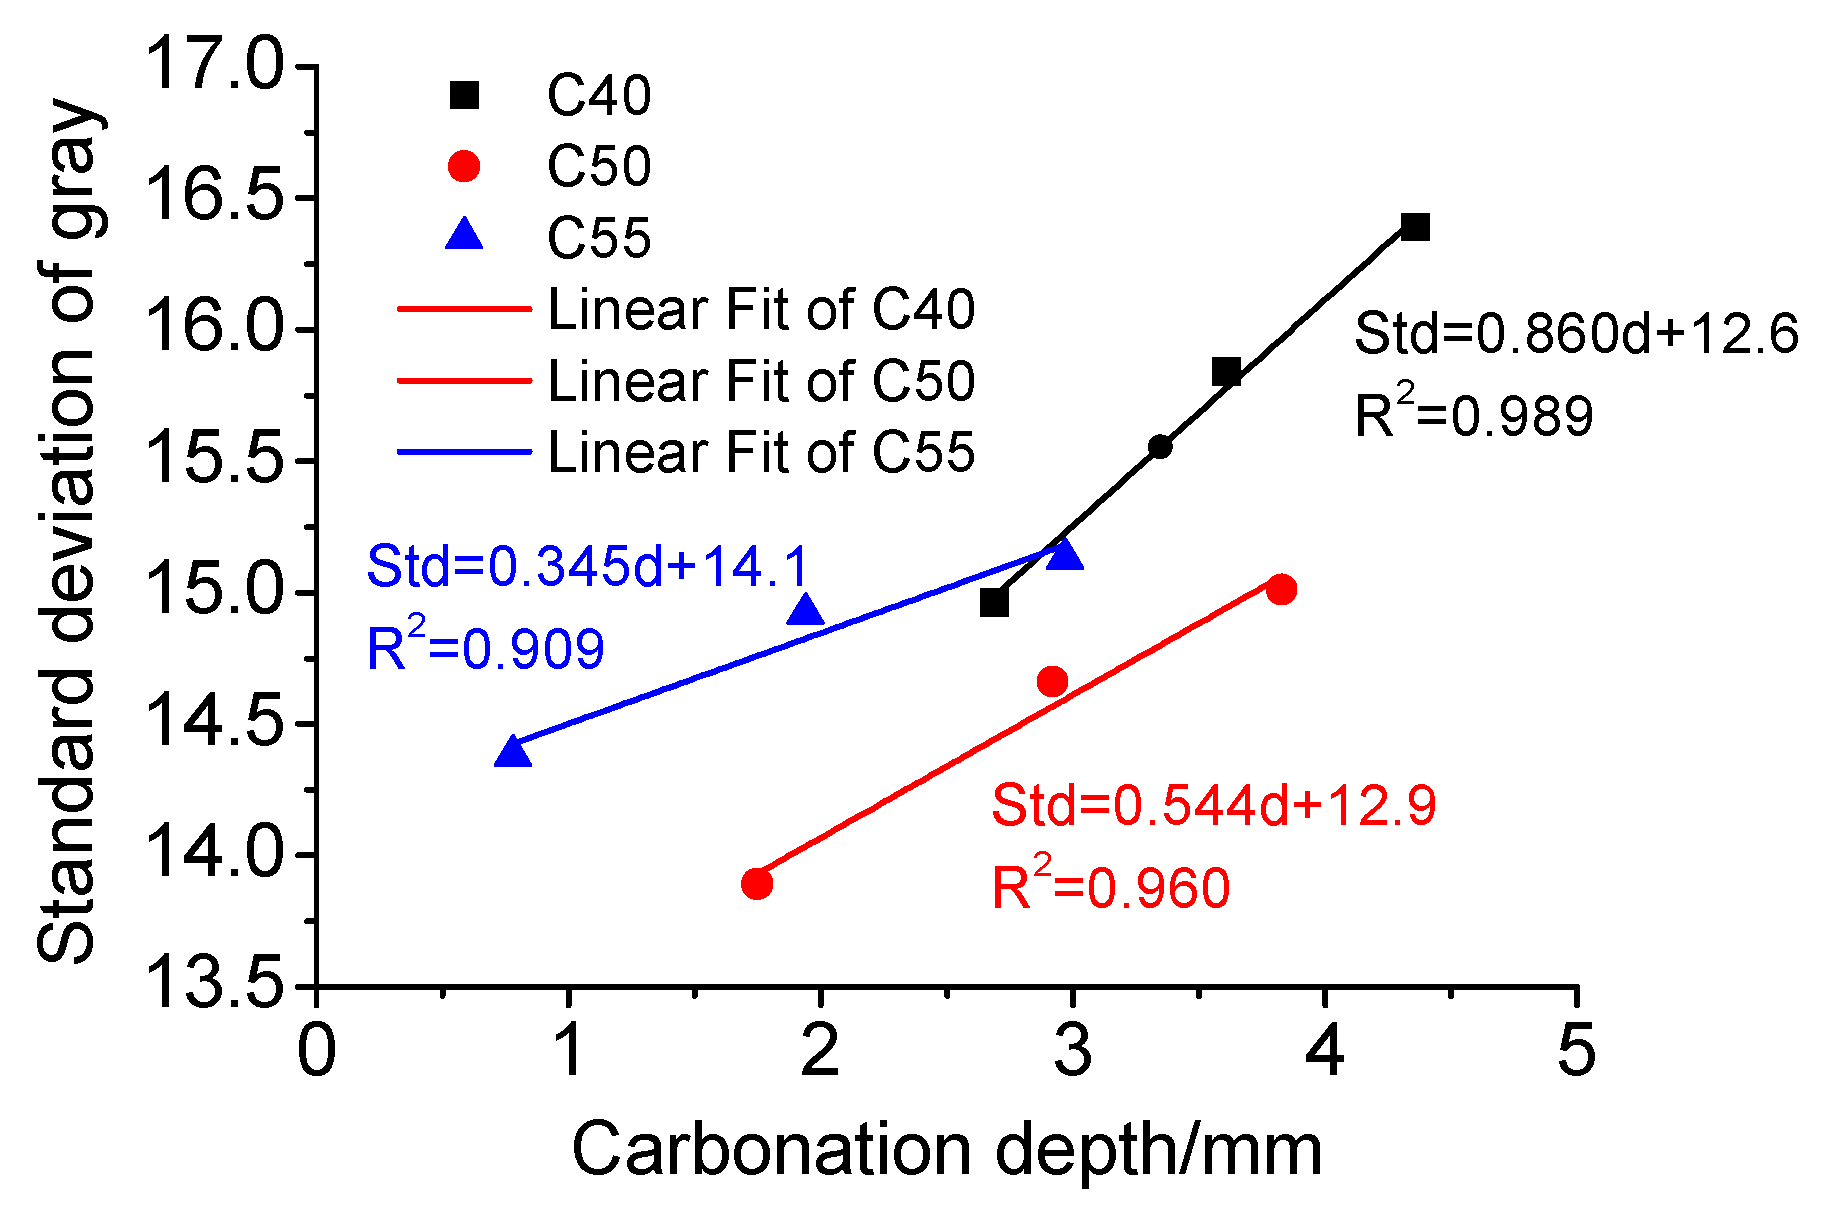
- The standard deviation of surface gray levels of architectural concrete only changes slightly after being exposed to salt fog and the marine atmosphere zone for different times, suggesting that chloride penetration has a very limited impact on the surface-color-consistency. On the contrary, carbonation has a profound influence on the surface-color-consistency; the higher the carbonation degree, the worse the surface-color-consistency. Therefore, the influence of carbonation should be carefully handled to maintain the aesthetic appearance of architectural concrete in long-term service.
Author Contributions
Funding
Conflicts of Interest
References
- Xu, H.; Dong, H.; Yang, L. Study and application of fair-faced concrete in large shield tunnel. N. Build. Mater. 2019, 10, 136–140. [Google Scholar]
- Li, S.; Wang, X.; Hu, L.; Li, X.; Wang, L.; Zhang, Y. Countermeasures to resolve the whole life cycle of fair-faced concrete buildings. J. Shandong Agric. Univ. 2019, 50, 597–600. [Google Scholar]
- Mickael, S.; Véronique, B.; Fabien, B. Chloride binding in sound and carbonated cementitious materials with various types of binder. Constr. Build. Mater. 2014, 68, 82–91. [Google Scholar]
- Simčič, T.; Pejovnik, S.; Schutter, G.D.; Bosiljkov, V.B. Chloride ion penetration into fly ash modified concrete during wetting-drying cycles. Constr. Build. Mater. 2015, 93, 1216–1223. [Google Scholar] [CrossRef]
- Chang, H. Chloride binding capacity of pastes influenced by carbonation under three conditions. Cem. Concr. Compos. 2017, 84, 1–9. [Google Scholar] [CrossRef]
- Zhu, X.; Zi, G.; Cao, Z.; Cheng, X. Combined effect of carbonation and chloride ingress in Concrete. Constr. Build. Mater. 2016, 110, 369–380. [Google Scholar] [CrossRef]
- Han, S.; Park, W.; Yang, E. Evaluation of concrete durability due to carbonation in harbor concrete Structures. Constr. Build. Mater. 2013, 48, 1045–1049. [Google Scholar] [CrossRef]
- Ye, H.; Jin, N.; Jin, X.; Fu, C. Model of chloride penetration into cracked concrete subject to drying–wetting cycles. Constr. Build. Mater. 2012, 36, 259–269. [Google Scholar] [CrossRef]
- Liu, Q.F.; Hu, Z.; Lu, X.Y.; Yang, J.; Azim, I.; Sun, W. Prediction of Chloride Distribution for Offshore Concrete Based on Statistical Analysis. Materials 2020, 13, 174. [Google Scholar] [CrossRef]
- Castro, P.; de Rincon, O.T.; Pazini, E.J. Interpretation of chloride profiles from concrete exposed to tropical marine environments. Cem. Concr. Res. 2001, 31, 529–537. [Google Scholar] [CrossRef]
- Li, Q.; Li, X.; Meng, W. Development status of finish concrete technology in our country and its existing problems and countermeasures. Arch. Technol. 2007, 1, 6–8. [Google Scholar]
- Liu, L. Development and application prospect of faced Concrete. Chin. Build. Mater. Sci. Technol. 2016, 25, 26–27. [Google Scholar]
- Shi, J.; Huan, G. Defect prevention for fair-faced concrete and prospective research on construction techniques and Materials. Build. Constr. 2004, 26, 333–335. [Google Scholar]
- Wang, J.; Xu, J. Construction quality control of fair-faced Concrete. Ind. Constr. 2002, 32, 60–61. [Google Scholar]
- Chen, Z.; Han, J.; Wang, X. Study on architectural concrete and its application in Tianjin museum. Ind. Constr. 2005, 35, 72–75. [Google Scholar]
- Liu, H.; Li, Q.; Zhou, Y.; Yue, G. Experimental research on mechanical properties and mix proportion optimization of fair-faced Concrete. Concrete 2018, 3, 101–104. [Google Scholar]
- Liu, H.; Du, H.; Li, Q.; Zhou, Y. Study on mechanical properties and mix proportion optimization of fair-faced Concrete. Concrete 2018, 7, 30–33. [Google Scholar]
- Lv, D.; Liu, D. Research on Durability of Architectural Concrete based on experimental investigation and engineering application. REIT 2010, 18, 499–503. [Google Scholar]
- Silva, C.; Coelho, F.; de Brito, J.; Silvestre, J.; Pereira, C. Inspection, diagnosis, and repair of architectural concrete surfaces. J. Perform. Constr. Facil. 2017, 31, 04017035. [Google Scholar] [CrossRef]
- Lim, J. A study on the application of the apc (architectural precast concrete) panel for the improvement of modern plasticity in youth training facilities. Youth Facil. Environ. 2018, 16, 193–203. [Google Scholar]
- Standard for Test Method of Performance on Ordinary Fresh Concrete; (GB/T 50080-2002); China Construction Industry Press: Beijing, China, 2002; pp. 6–7.
- Standard for Test Method of Mechanical Properties on Ordinary Concrete; (GB/T 50081-2002); China Construction Industry Press: Beijing, China, 2003; pp. 53–67.
- Standard for Test Methods of Long-Term Performance and Durability of Ordinary Concrete; (GBT50082-2009); China Construction Industry Press: Beijing, China, 2009; pp. 61–64.
- Vineet, S.; Shashank, B. Carbonation resistance of cements containing supplementary cementitious materials and its relation to various parameters of Concrete. Constr. Build. Mater. 2018, 178, 219–232. [Google Scholar]
- Andreas, L.; Peter, N.; Josef, K. Relation between carbonation resistance, mix design and exposure of mortar and Concrete. Cem. Concr. Compos. 2015, 62, 33–43. [Google Scholar]
- Elsalamawy, M.; Ashraf, R.M.; Eslam, M.K. The role of relative humidity and cement type on carbonation resistance of Concrete. Alex. Eng. J. 2019, 58, 1257–1264. [Google Scholar] [CrossRef]
- Ma, R.; Niu, D.; Wang, J. Accelerated carbonation test of sprayed Concrete. Concrete 2014, 11, 31–33, 37. [Google Scholar]
- Tang, W.; Lee, H.; Vimonsatit, V. Optimization of micro and nano palm oil fuel ash to determine the carbonation resistance of the concrete in accelerated condition. Materials 2019, 12, 130. [Google Scholar] [CrossRef]
- Li, G.; Yao, F.; Liu, P. Long-term carbonation resistance of concrete under initial high-temperature curing. Mater. Struct. 2016, 49, 2799–2806. [Google Scholar] [CrossRef]
- Tang, J.; Wu, J.; Zou, Z. Influence of axial loading and carbonation age on the carbonation resistance of recycled aggregate Concrete. Constr. Build. Mater. 2018, 173, 707–717. [Google Scholar] [CrossRef]
- Jiang, L.; Liu, Z.; Ye, Y. Durability of concrete incorporating large volumes of low-quality fly ash. Cem. Concr. Res. 2004, 34, 1467–1469. [Google Scholar] [CrossRef]
- Chang, H.; Jin, Z.; Zhao, T.; Wang, B.; Li, Z.; Liu, J. Capillary suction induced water absorption and chloride transport in non-saturated concrete: The influence of humidity, mineral admixtures and sulfate ions. Constr. Build. Mater. 2020, 236, 117581. [Google Scholar]
- Testing Code of Concrete for Port and Waterway Engineering; (JTJ 270-98); China Construction Industry Press: Beijing, China, 1998; pp. 202–207.
- Chang, H.; Feng, P.; Lyu, K.; Liu, J. A novel method for assessing C-S-H chloride adsorption in cement pastes. Constr. Build. Mater. 2019, 225, 324–331. [Google Scholar] [CrossRef]
- Fu, Z. The threshold selection method based on the measure of difference between images. J. Comput. Res. Dev. 2001, 38, 563–567. [Google Scholar]
- Peng, H.; Su, J.; Fang, Z.; Yuan, J. Detection and assessment of discoloration on concrete surface based on image analysis technology. Highw. Eng. 2012, 05, 19–22. [Google Scholar]
- Chang, H.; Mu, S.; Feng, P. Influence of carbonation on “maximum phenomenon” under cyclic wetting and drying condition. Cem. Concr. Res. 2018, 103, 95–109. [Google Scholar] [CrossRef]
- Sulapha, P.; Wong, S.F.; Wee, T.H. Carbonation of concrete containing mineral admixtures. J. Mater. Civ. Eng. 2003, 15, 134–143. [Google Scholar] [CrossRef]
- Kuosa, H.; Ferreira, R.M.; Holt, E.; Leivo, M.; Vesikari, E. Effect of coupled deterioration by freeze–thaw, carbonation and chlorides on concrete service life. Cem. Concr. Compos. 2014, 47, 32–40. [Google Scholar] [CrossRef]
- Chang, H.; Mu, S.; Xie, D.; Wang, P. Influence of pore structure and moisture distribution on chloride “maximum phenomenon” in surface layer of specimens exposed to cyclic drying-wetting condition. Constr. Build. Mater. 2017, 131, 16–30. [Google Scholar] [CrossRef]
- Andrade, C.; Díez, J.M.; Alonso, C. Mathematical modeling of a concrete surface “Skin Effect” on diffusion in chloride contaminated media. Adv. Cem. Based Mater. 1997, 6, 39–44. [Google Scholar] [CrossRef]
- Meira, G.R.; Andrade, C.; Padaratz, I.J.; Alonso, C.; Borba, J.C., Jr. Chloride penetration into concrete structures in the marine atmosphere zone–Relationship between deposition of chlorides on the wet candle and chlorides accumulated into Concrete. Cem. Concr. Compos. 2007, 29, 667–676. [Google Scholar] [CrossRef]
- Ye, H.; Tian, Y.; Jin, N.; Jin, X.; Fu, C. Influence of cracking on chloride diffusivity and moisture influential depth in concrete subjected to simulated environmental conditions. Constr. Build. Mater. 2013, 47, 66–79. [Google Scholar] [CrossRef]
- Ožbolt, J.; Orsanic, F.; Balabanic, G. Modeling influence of hysteretic moisture behavior on distribution of chlorides in Concrete. Cem. Concr. Compos. 2016, 63, 73–84. [Google Scholar] [CrossRef]
- Chang, H.; Feng, P.; Liu, J.; Jin, Z.; Lv, K.; Liu, Q. Chloride maximum phenomenon near the surface of cement paste induced by moisture evaporation and carbonation. Mater. Struc. 2018, 51, 132. [Google Scholar] [CrossRef]
- Hassan, Z. Binding of External Chloride by Cement Pastes. PhD thesis, University of Toronto, Toronto, ON, Canada, 2001. [Google Scholar]
- Geng, J.; Easterbrook, D.; Liu, Q.; Li, L. Effect of carbonation on release of bound chlorides in chloride contaminated Concrete. Mag. Concr. Res. 2015, 68, 353–363. [Google Scholar] [CrossRef]
- Florea, M.V.A.; Brouwers, H.J.H. Chloride binding related to hydration products Part I: Ordinary Portland Cement. Cem. Concr. Res. 2012, 42, 282–290. [Google Scholar] [CrossRef]
- Thomas, M.D.A.; Hooton, R.D.; Scottc, A.; Zibara, H. The effect of supplementary cementitious materials on chloride binding in hardened cement paste. Cem. Concr. Res. 2012, 42, 1–7. [Google Scholar] [CrossRef]
- Plusquellec, G.; Nonat, A. Interactions between calcium silicate hydrate (C-S-H) and calcium chloride, bromide and nitrate. Cem. Concr. Res. 2016, 90, 89–96. [Google Scholar] [CrossRef]
- Shi, Z.; Geiker, M.R.; de Weerdt, K.; Østnor, T.A.; Lothenbach, B.; Winnefeld, F.; Skibsted, J. Role of calcium on chloride binding in hydrated Portland cement–metakaolin–limestone blends. Cem. Concr. Res. 2017, 95, 205–216. [Google Scholar] [CrossRef]
- Yuan, Q.; Shi, C.; de Schutter, G.; Audenaert, K.; Deng, D. Chloride binding of cement-based materials subjected to external chloride environment-A review. Constr. Build. Mater. 2009, 23, 1–13. [Google Scholar] [CrossRef]
- Baroghel-Bouny, V.; Wang, X.; Thiery, M.; Saillio, M.; Barberon, F. Prediction of chloride binding isotherms of cementitious materials by analytical model or numerical inverse analysis. Cem. Concr. Res. 2012, 42, 1207–1224. [Google Scholar] [CrossRef]


| Binder | CaO | SiO2 | Al2O3 | MgO | Fe2O3 | SO3 | K2O | TiO2 | Na2O | MnO | Other | LOI |
|---|---|---|---|---|---|---|---|---|---|---|---|---|
| P.I.52.5 | 52.7 | 19.9 | 6.4 | 4.6 | 2.8 | 2.6 | 0.7 | 0.4 | 0.2 | 0.1 | 9.6 | 3.5 |
| FA | 8.2 | 48.8 | 24.2 | 1.3 | 6.5 | 1.4 | 2.1 | 1.3 | 1.1 | / | 5.1 | 1 |
| SL | 36.4 | 29.1 | 14.3 | 8.9 | 0.3 | 2.0 | 0.6 | 1.6 | 0.3 | 0.6 | 5.9 | 0.37 |
| NO | w/b | Cement | SL | FA | Fine Aggregate | Coarse Aggregate | Water | SP |
|---|---|---|---|---|---|---|---|---|
| C40 | 0.33 | 173 | 86 | 86 | 780 | 1169 | 113 | 4.50 |
| C50 | 0.30 | 217 | 109 | 109 | 738 | 1108 | 133 | 5.70 |
| C55 | 0.27 | 237 | 118 | 118 | 721 | 1081 | 119 | 6.20 |
| NO | Slump/mm | Extended Degree/mm | Compressive Strength/MPa | ||
|---|---|---|---|---|---|
| 3 days | 28 days | 56 days | |||
| C40 | 185 | 380 | 28.9 | 53.1 | 56.6 |
| C50 | 188 | 410 | 37.4 | 64.2 | 68.0 |
| C55 | 220 | 435 | 44.7 | 72.0 | 74.8 |
| 1 Month | 3 Months | 9 Months | ||||
|---|---|---|---|---|---|---|
| α | R2 | α | R2 | α | R2 | |
| C40 | 1.291 | 0.992 | 1.112 | 0.993 | 1.067 | 0.995 |
| C50 | 1.336 | 0.998 | 1.222 | 0.995 | 1.126 | 0.997 |
| C55 | 1.363 | 0.995 | 1.329 | 0.995 | 1.135 | 0.995 |
| 1 Month | 3 Months | 9 Months | ||||
|---|---|---|---|---|---|---|
| α | R2 | α | R2 | α | R2 | |
| C40 | 1.170 | 0.989 | 1.074 | 0.996 | 1.058 | 0.995 |
| C50 | 1.278 | 0.987 | 1.208 | 0.996 | 1.080 | 0.996 |
| C55 | 1.339 | 0.991 | 1.310 | 0.990 | 1.195 | 0.994 |
© 2020 by the authors. Licensee MDPI, Basel, Switzerland. This article is an open access article distributed under the terms and conditions of the Creative Commons Attribution (CC BY) license (http://creativecommons.org/licenses/by/4.0/).
Share and Cite
Chang, H.; Wang, P.; Jin, Z.; Li, G.; Feng, P.; Ye, S.; Liu, J. Durability and Aesthetics of Architectural Concrete under Chloride Attack or Carbonation. Materials 2020, 13, 839. https://doi.org/10.3390/ma13040839
Chang H, Wang P, Jin Z, Li G, Feng P, Ye S, Liu J. Durability and Aesthetics of Architectural Concrete under Chloride Attack or Carbonation. Materials. 2020; 13(4):839. https://doi.org/10.3390/ma13040839
Chicago/Turabian StyleChang, Honglei, Penggang Wang, Zuquan Jin, Gang Li, Pan Feng, Shoujie Ye, and Jian Liu. 2020. "Durability and Aesthetics of Architectural Concrete under Chloride Attack or Carbonation" Materials 13, no. 4: 839. https://doi.org/10.3390/ma13040839
APA StyleChang, H., Wang, P., Jin, Z., Li, G., Feng, P., Ye, S., & Liu, J. (2020). Durability and Aesthetics of Architectural Concrete under Chloride Attack or Carbonation. Materials, 13(4), 839. https://doi.org/10.3390/ma13040839