Formability of the 5754-Aluminum Alloy Deformed by a Modified Repetitive Corrugation and Straightening Process

 ,
,  , ,
, ,  ,
,  and
and
Abstract
1. Introduction
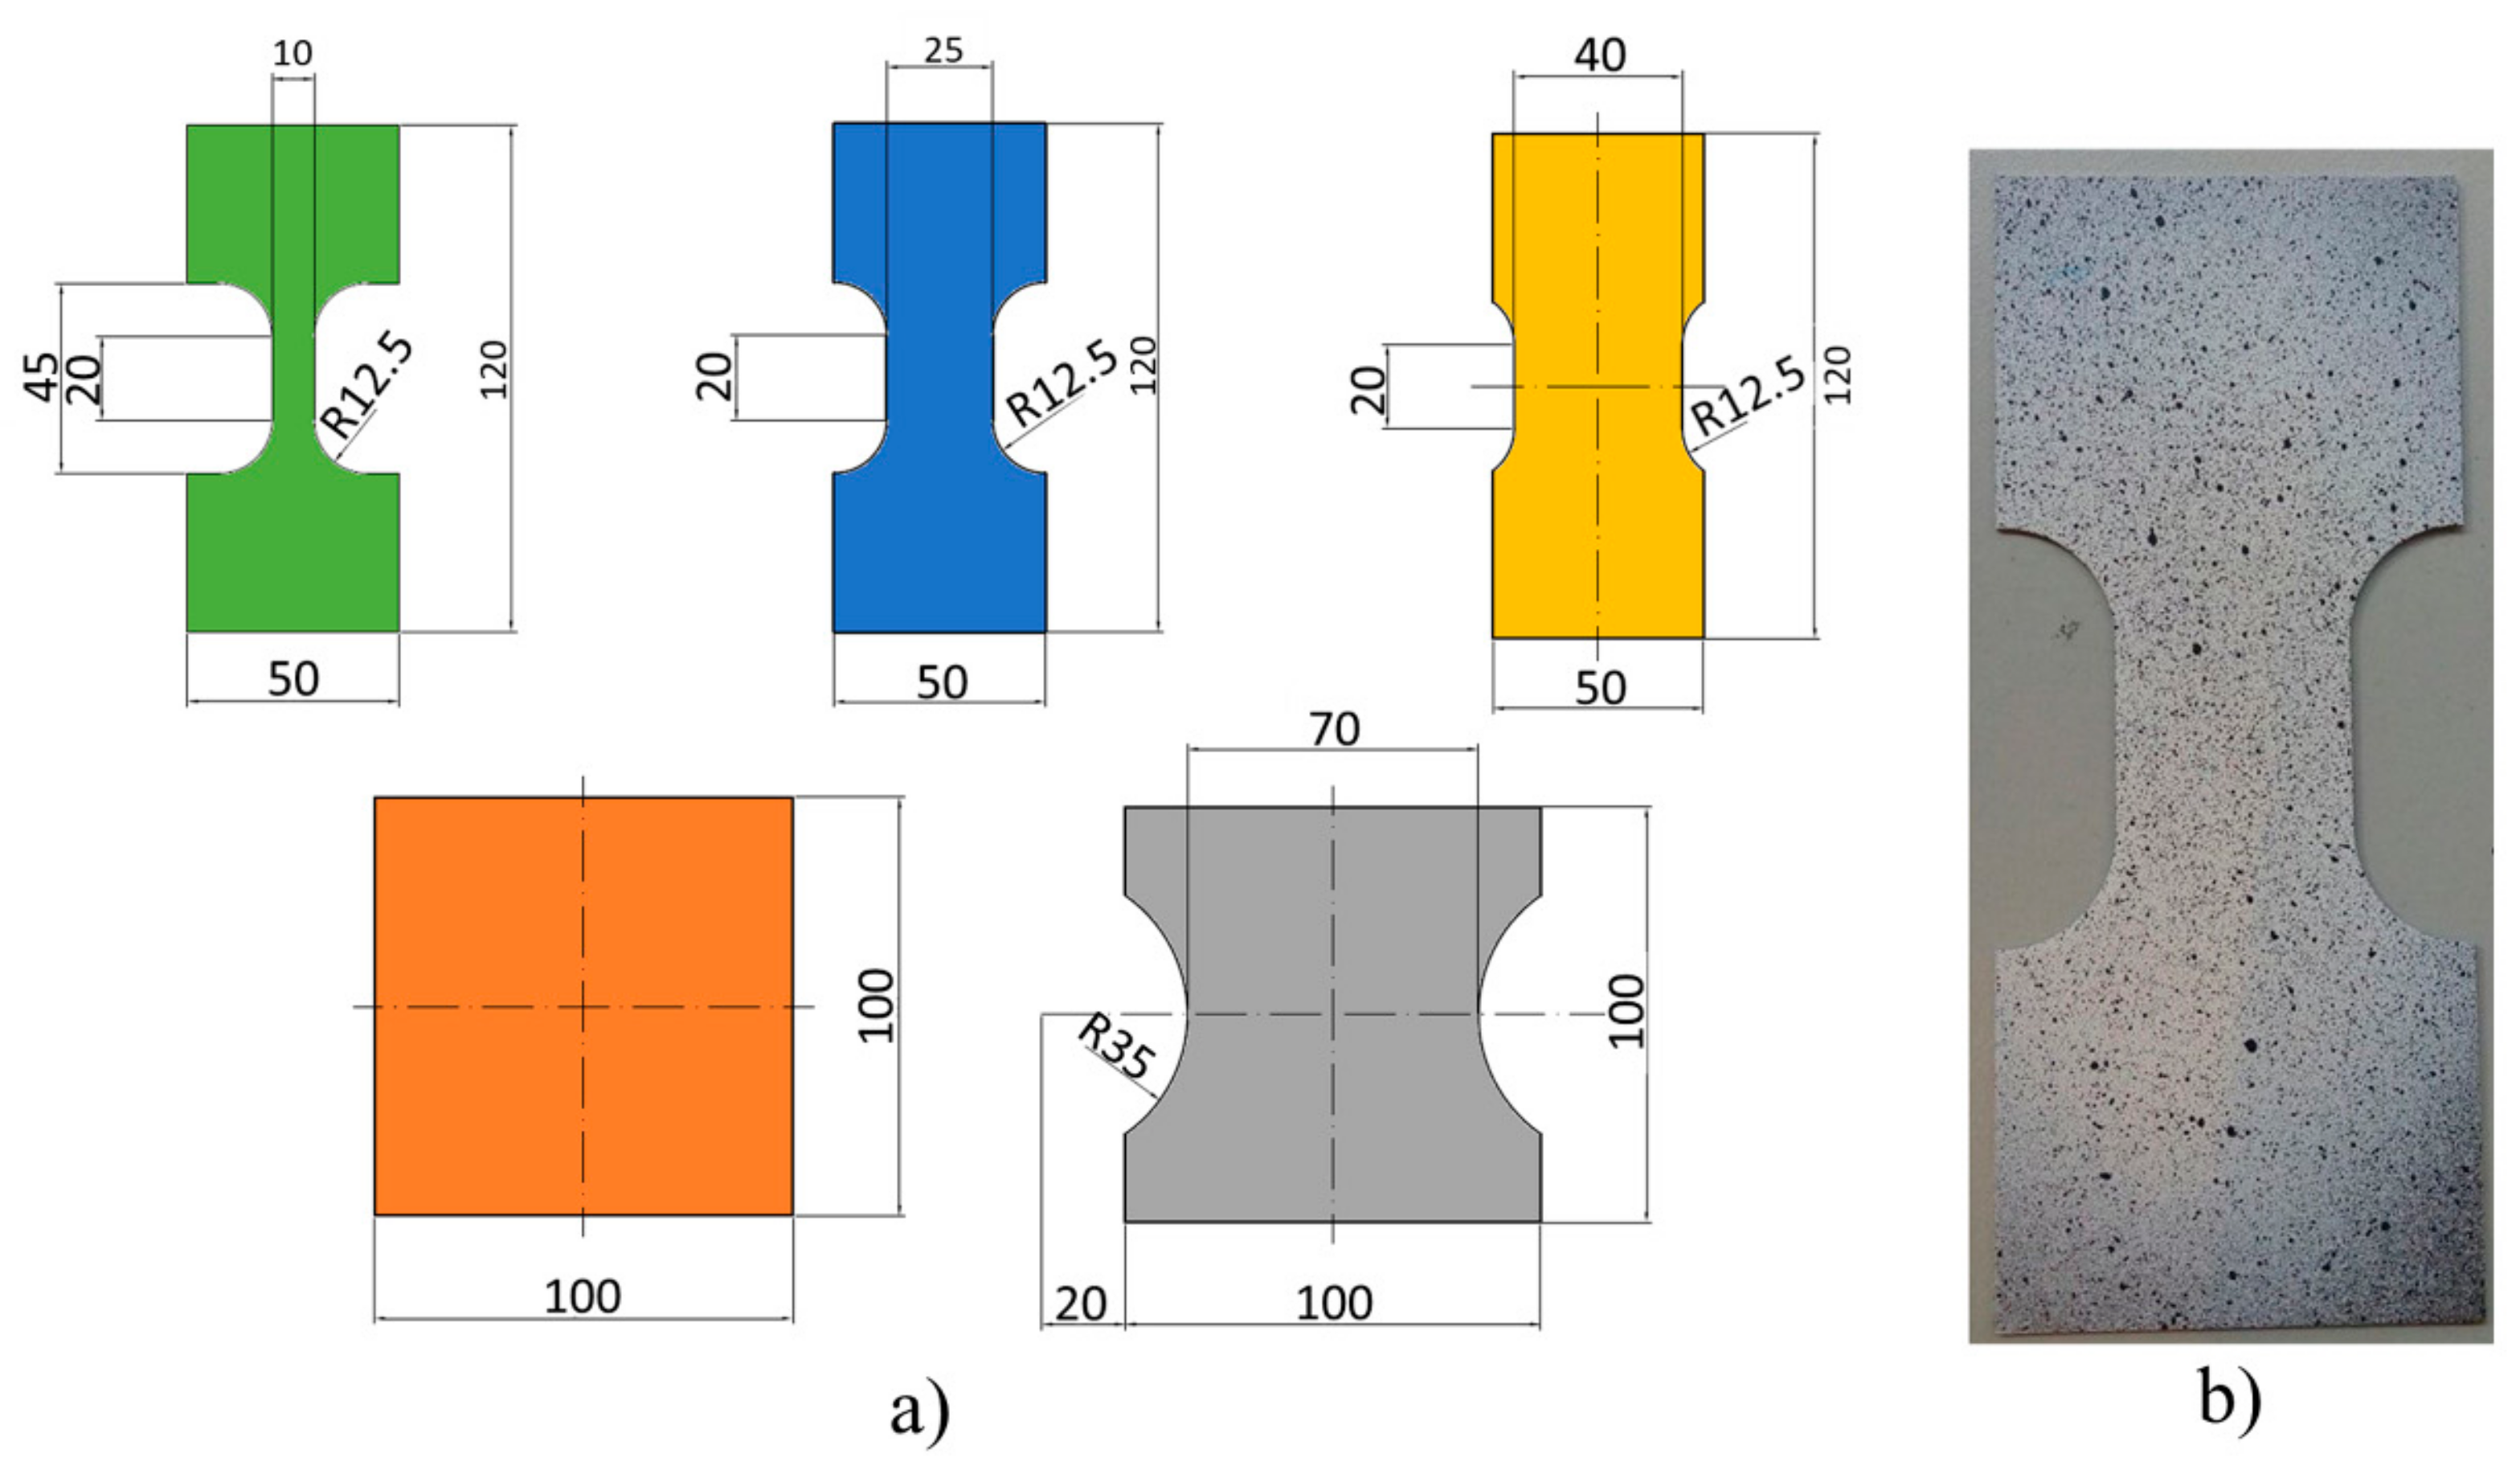
2. Materials and Methods
Material
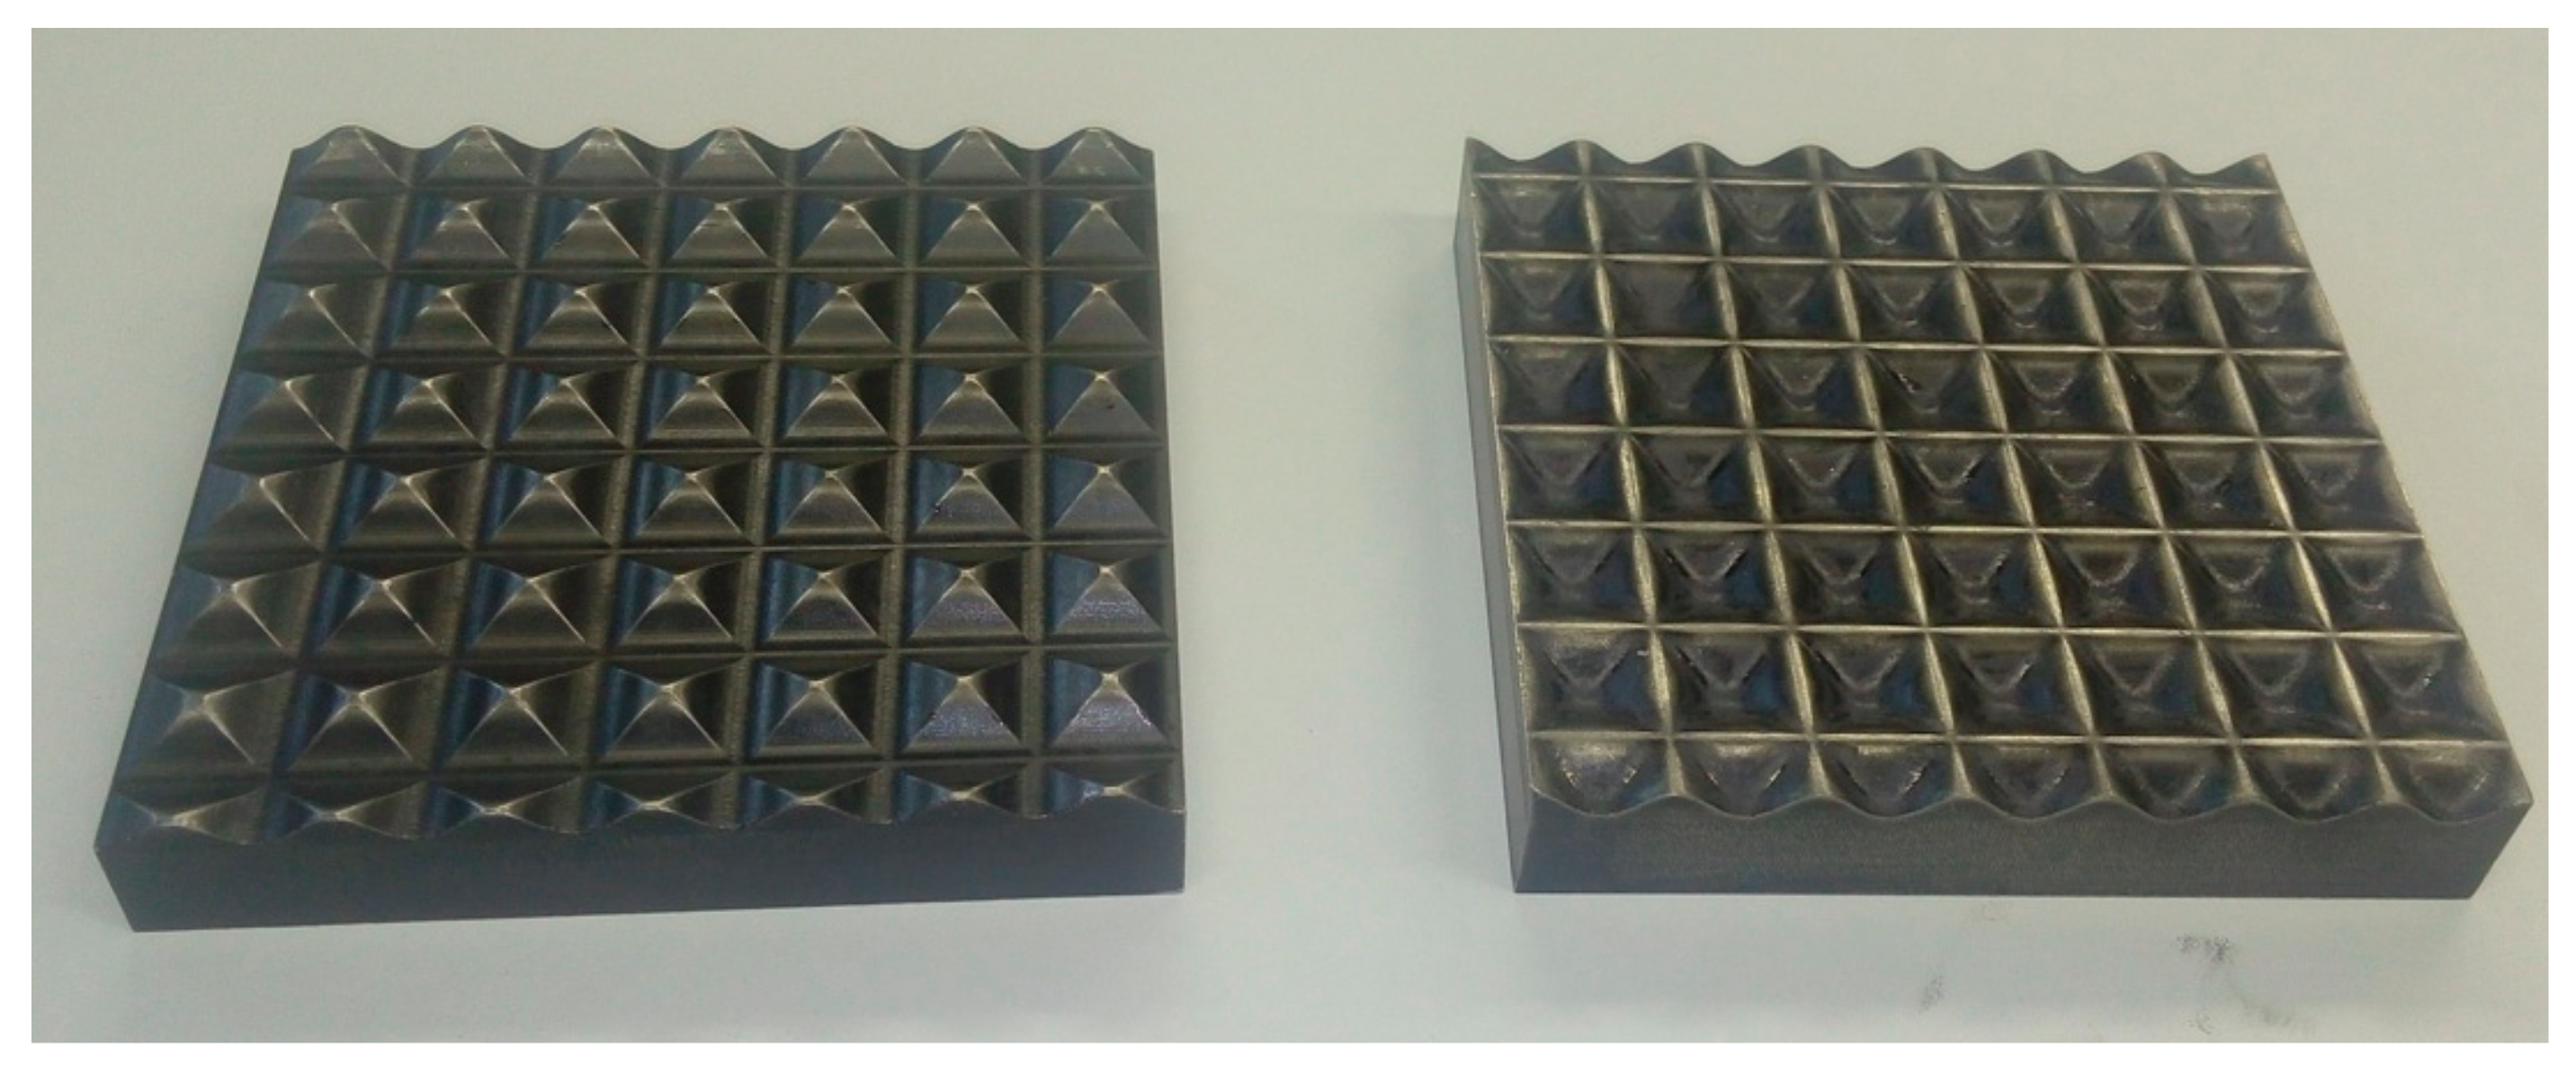
3. Modified RCS
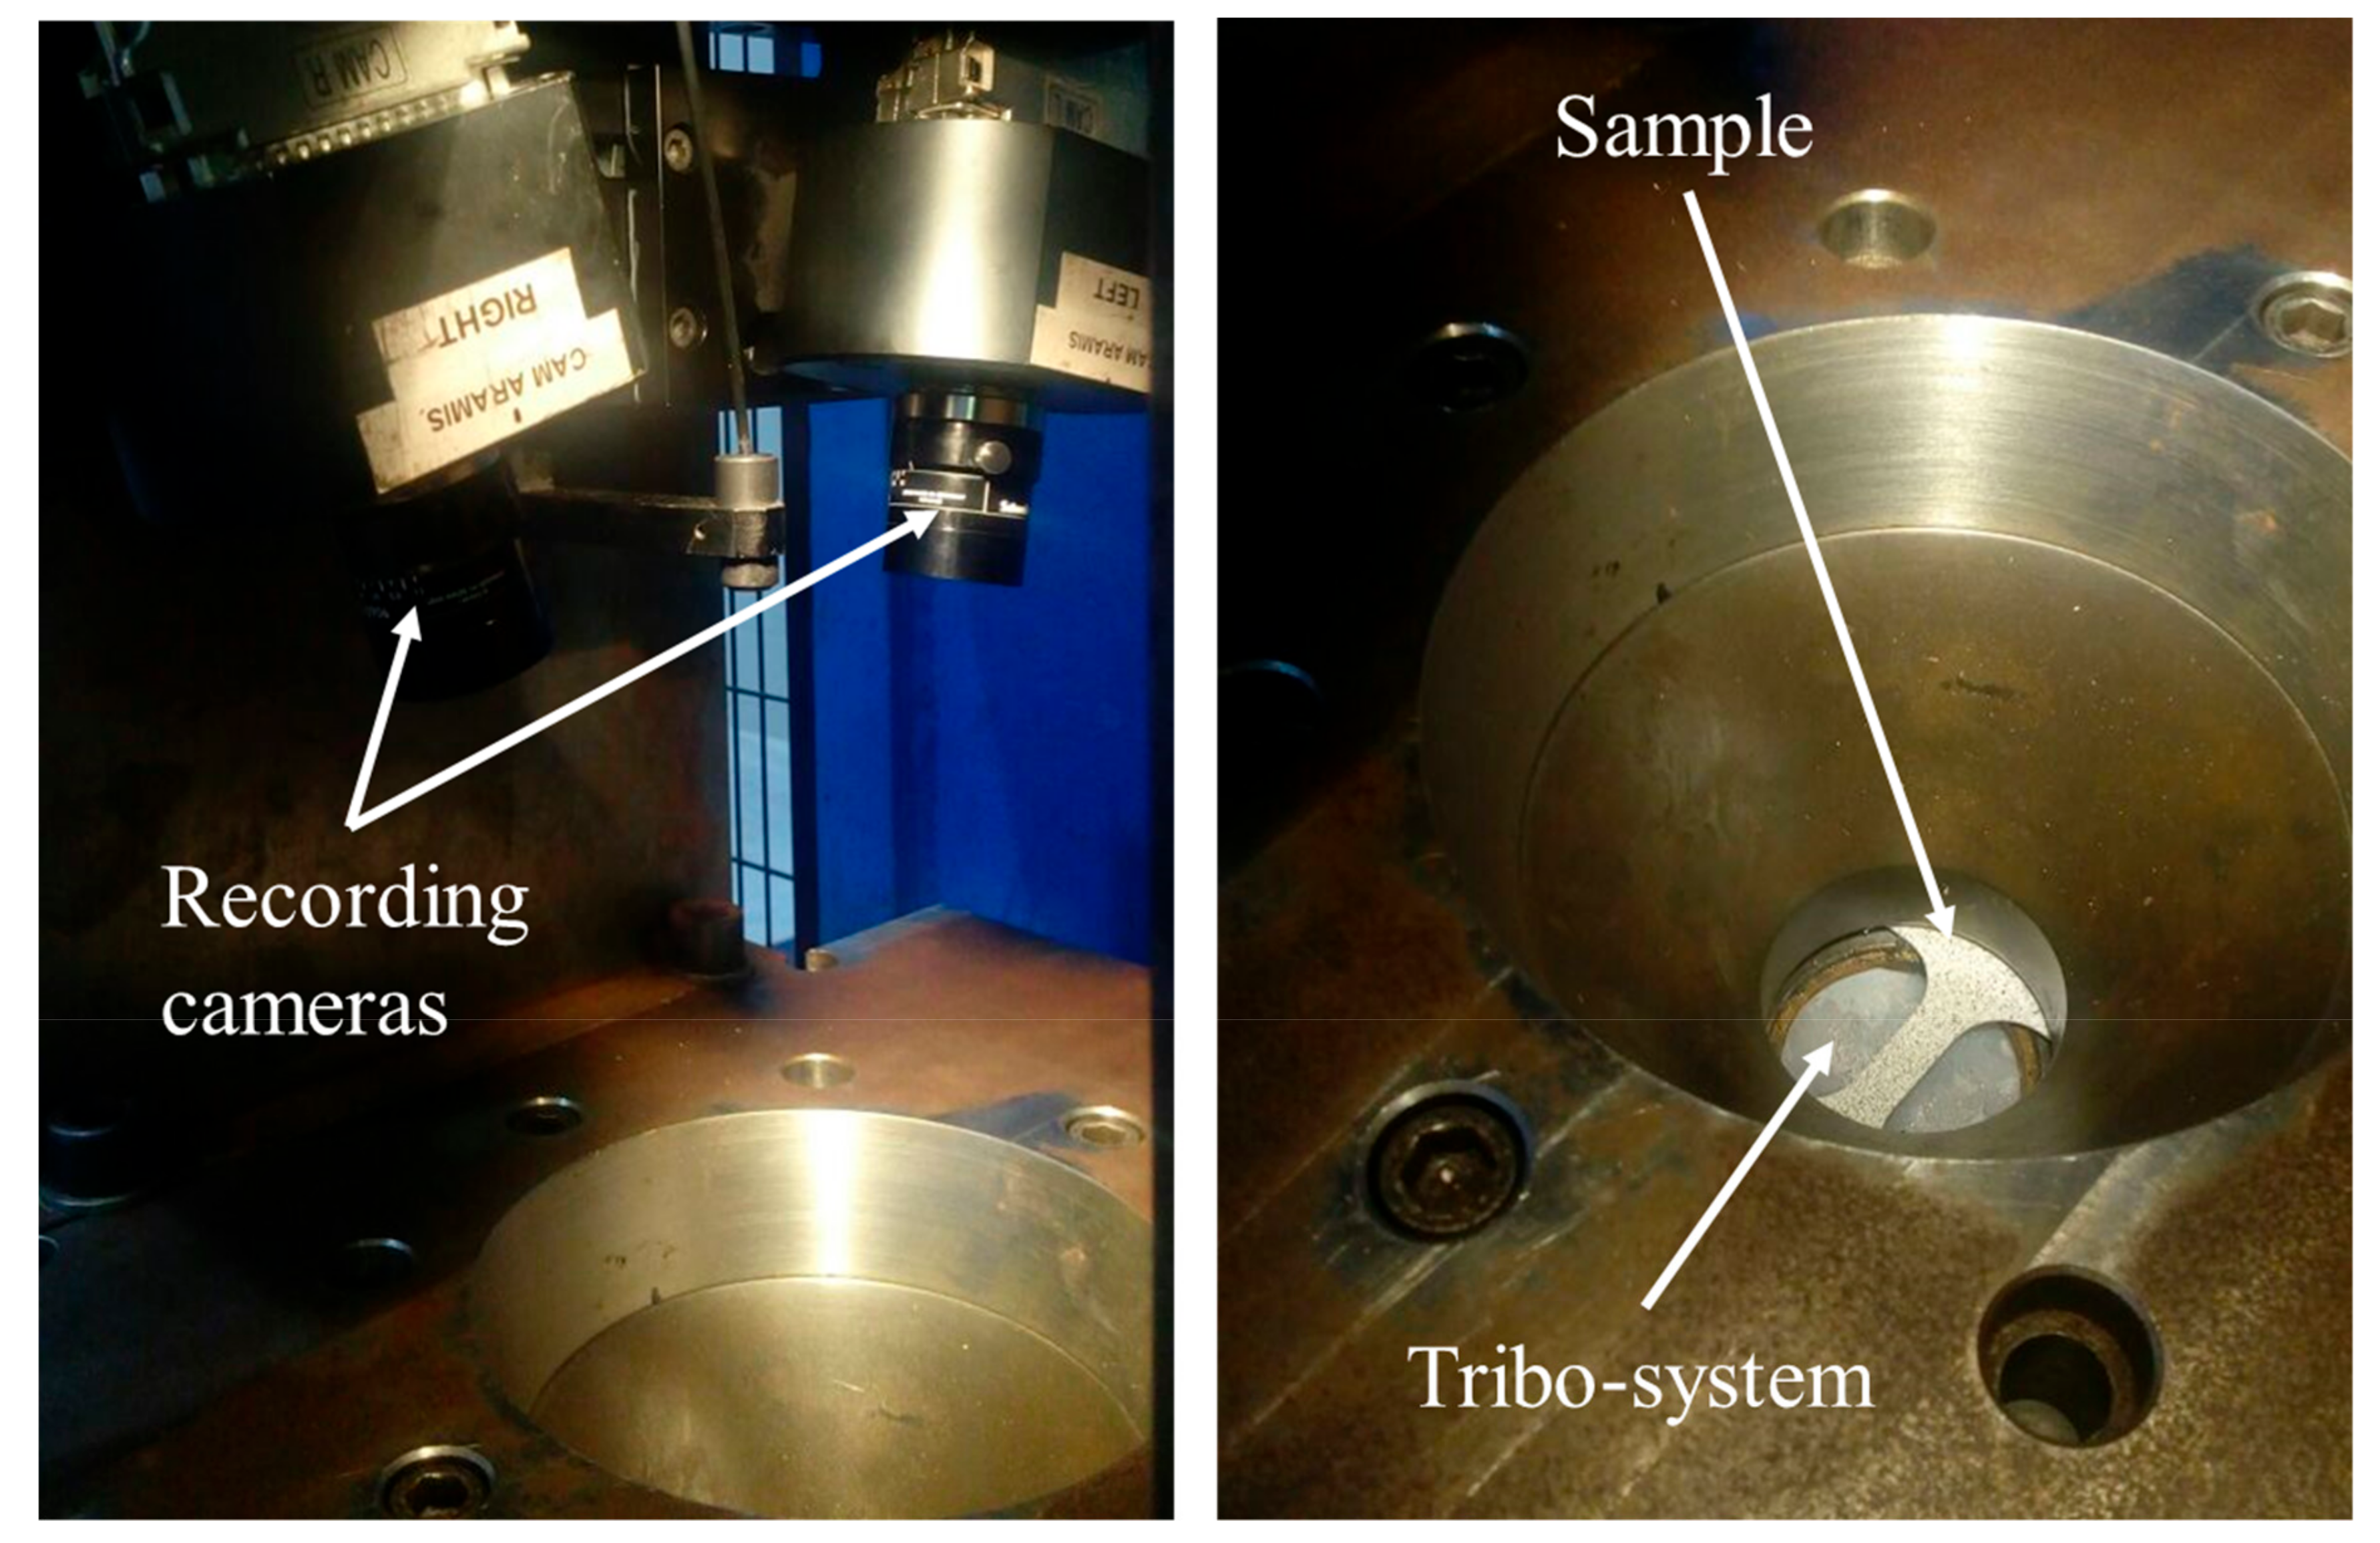
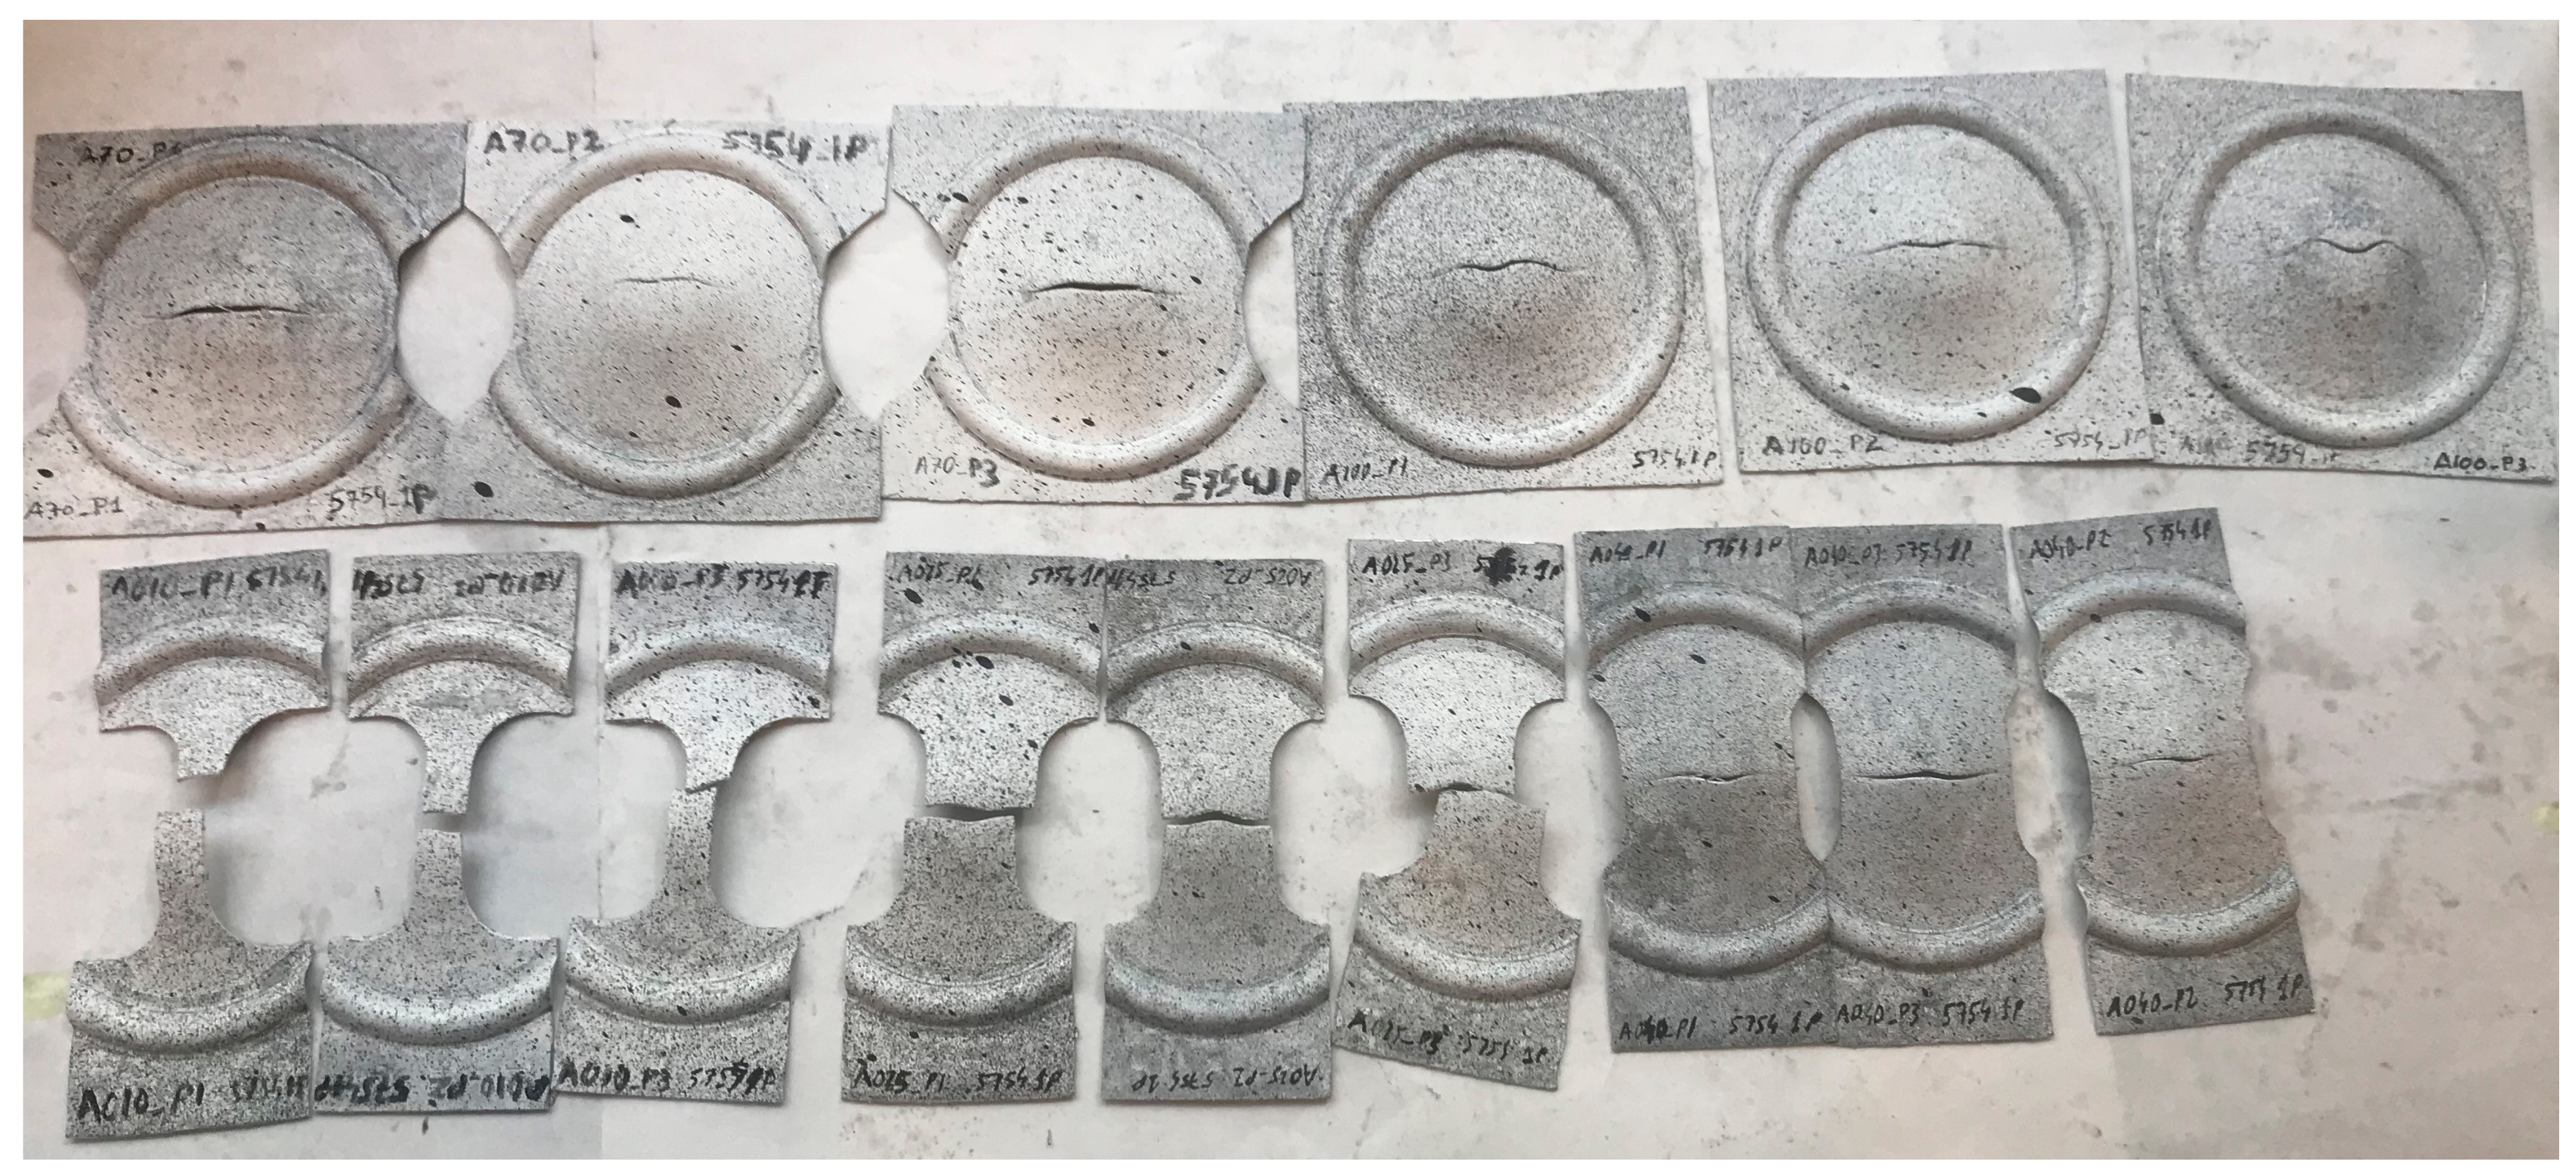
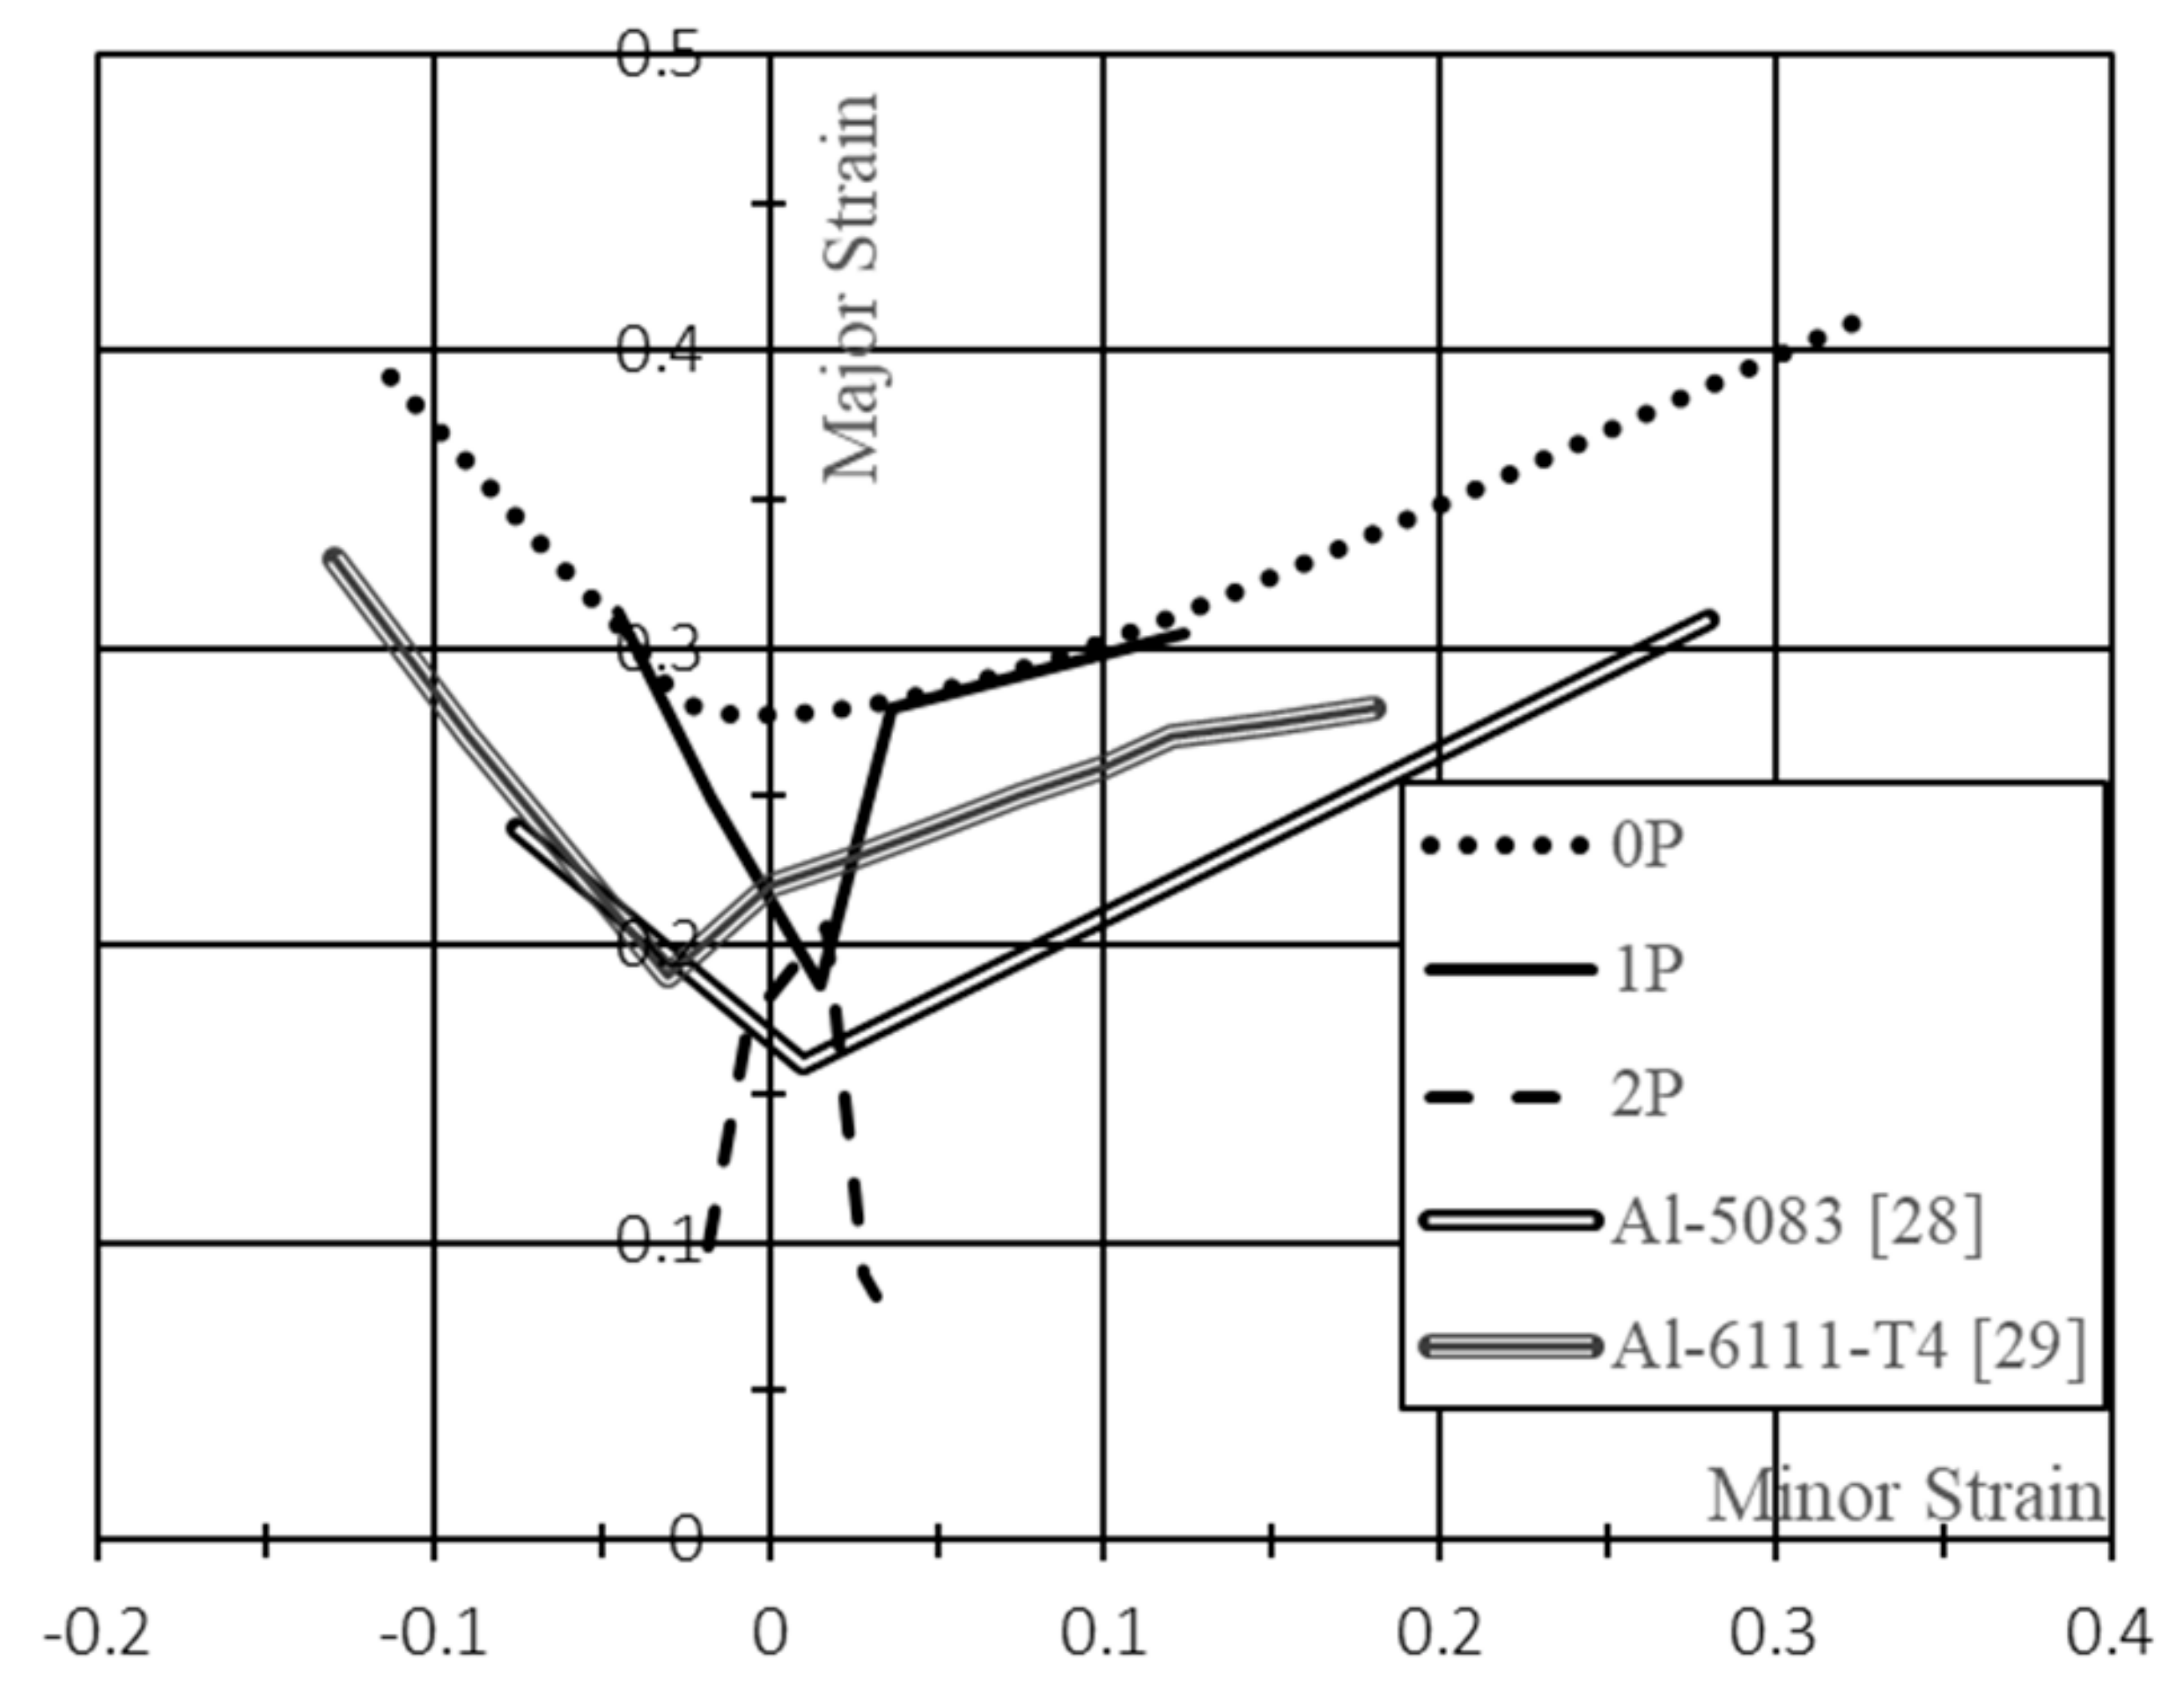
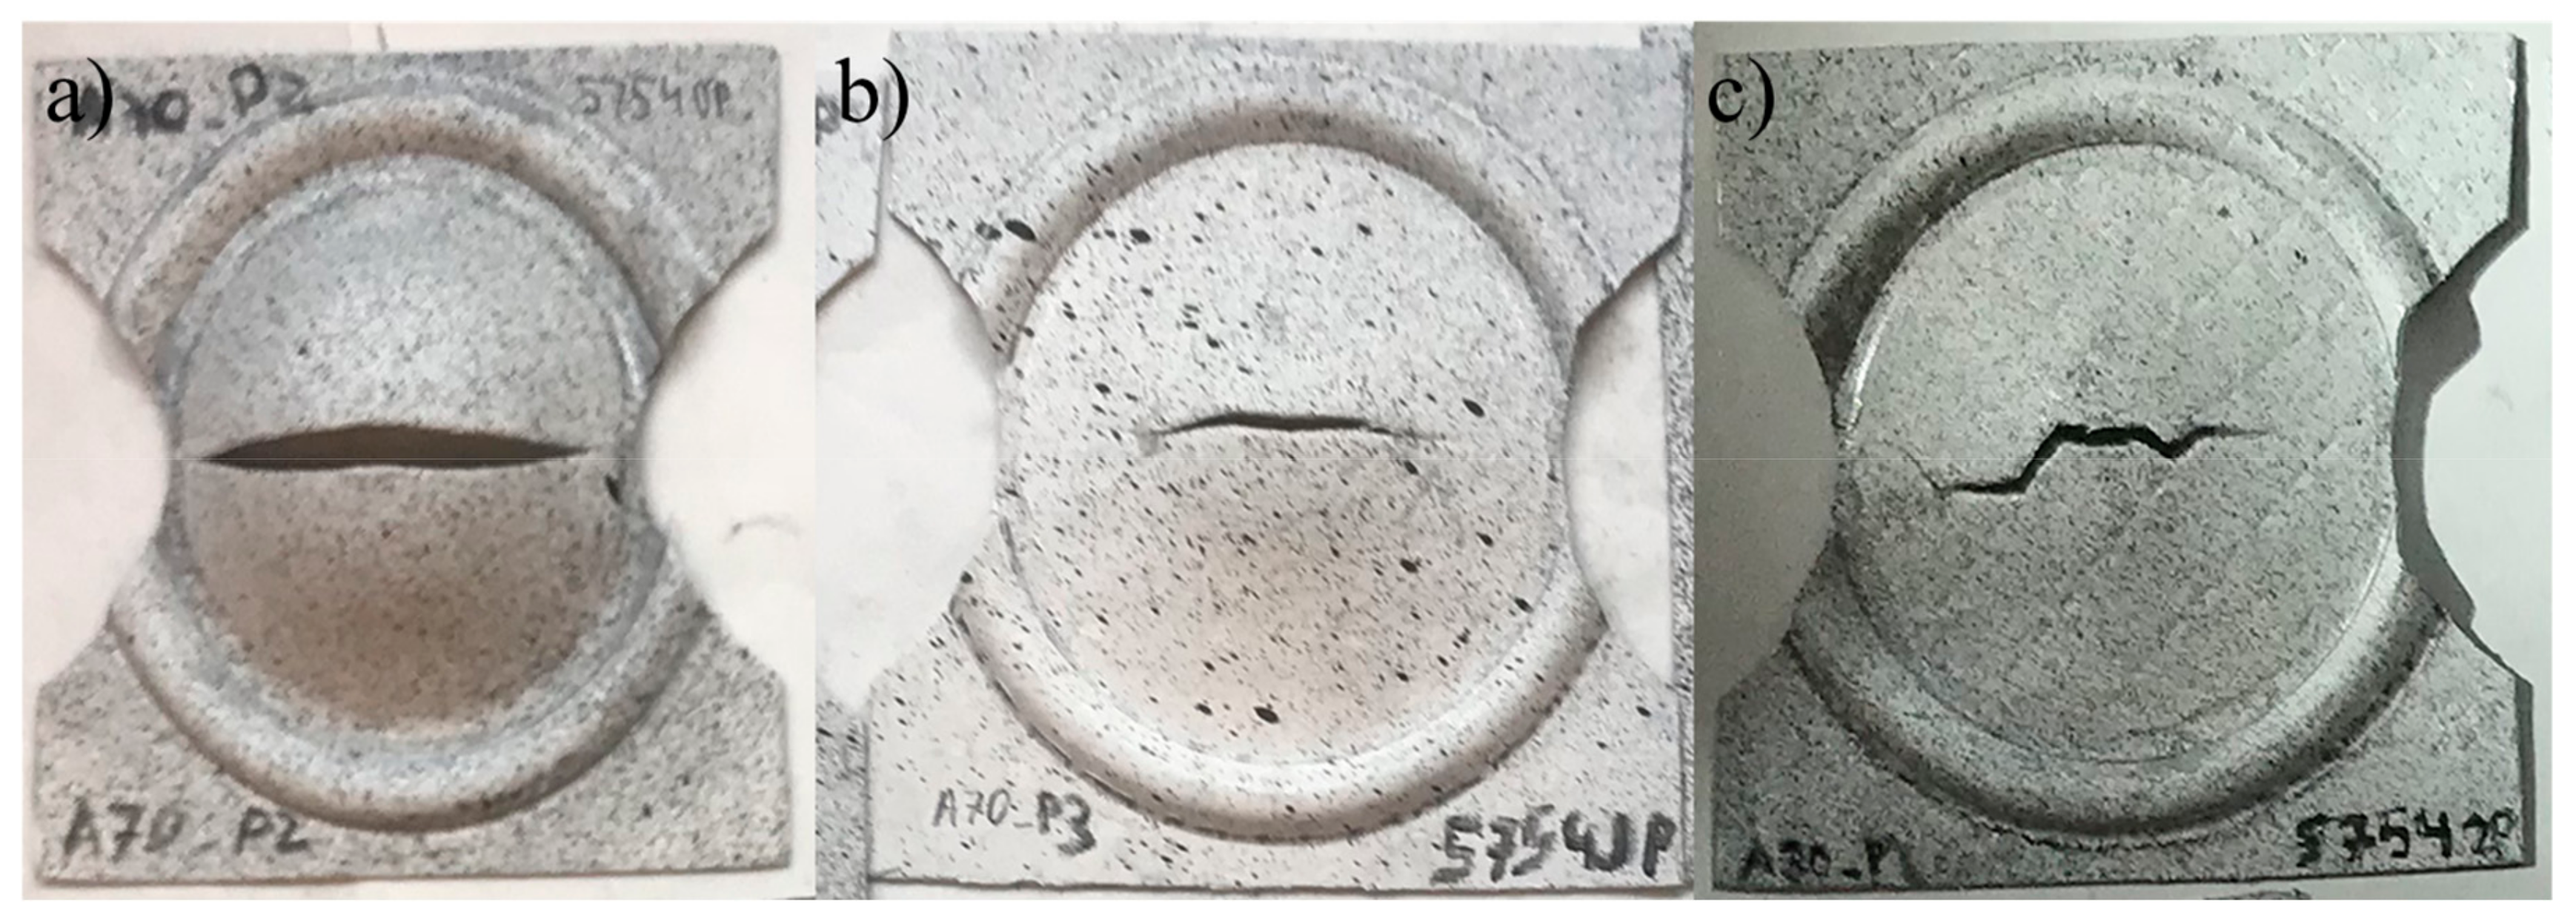
4. Forming Limit Diagrams
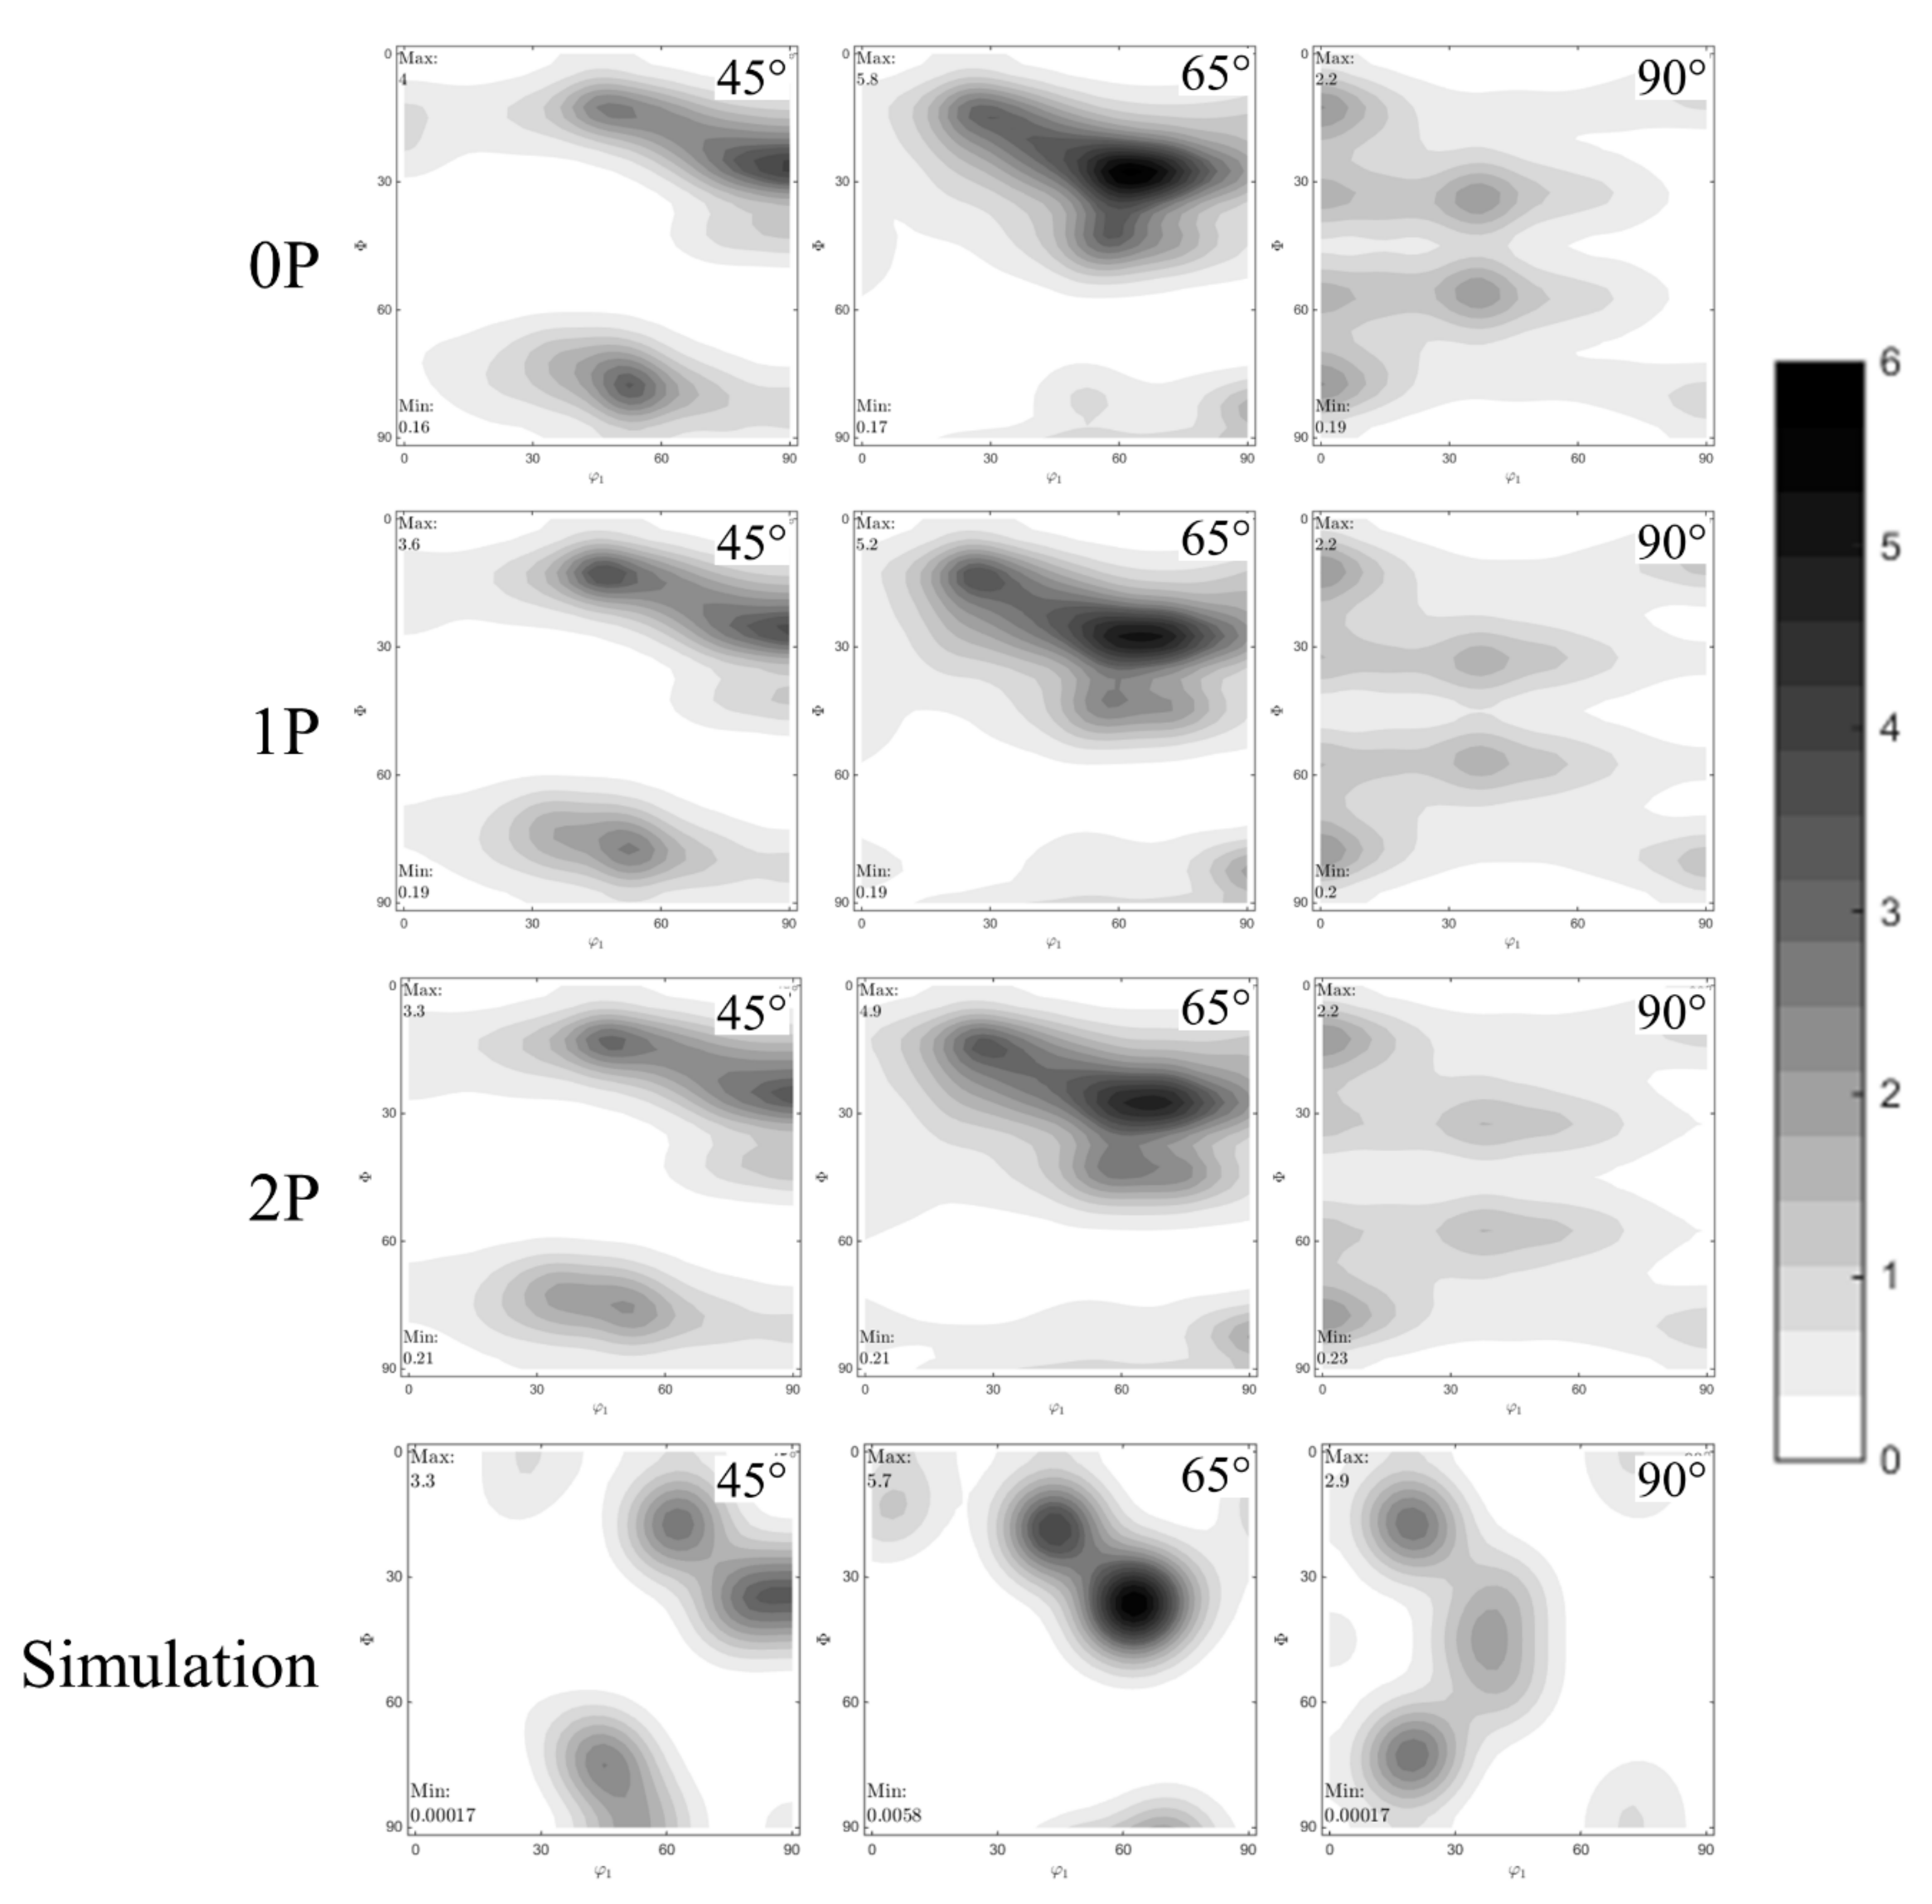
5. Macrotexture Analysis
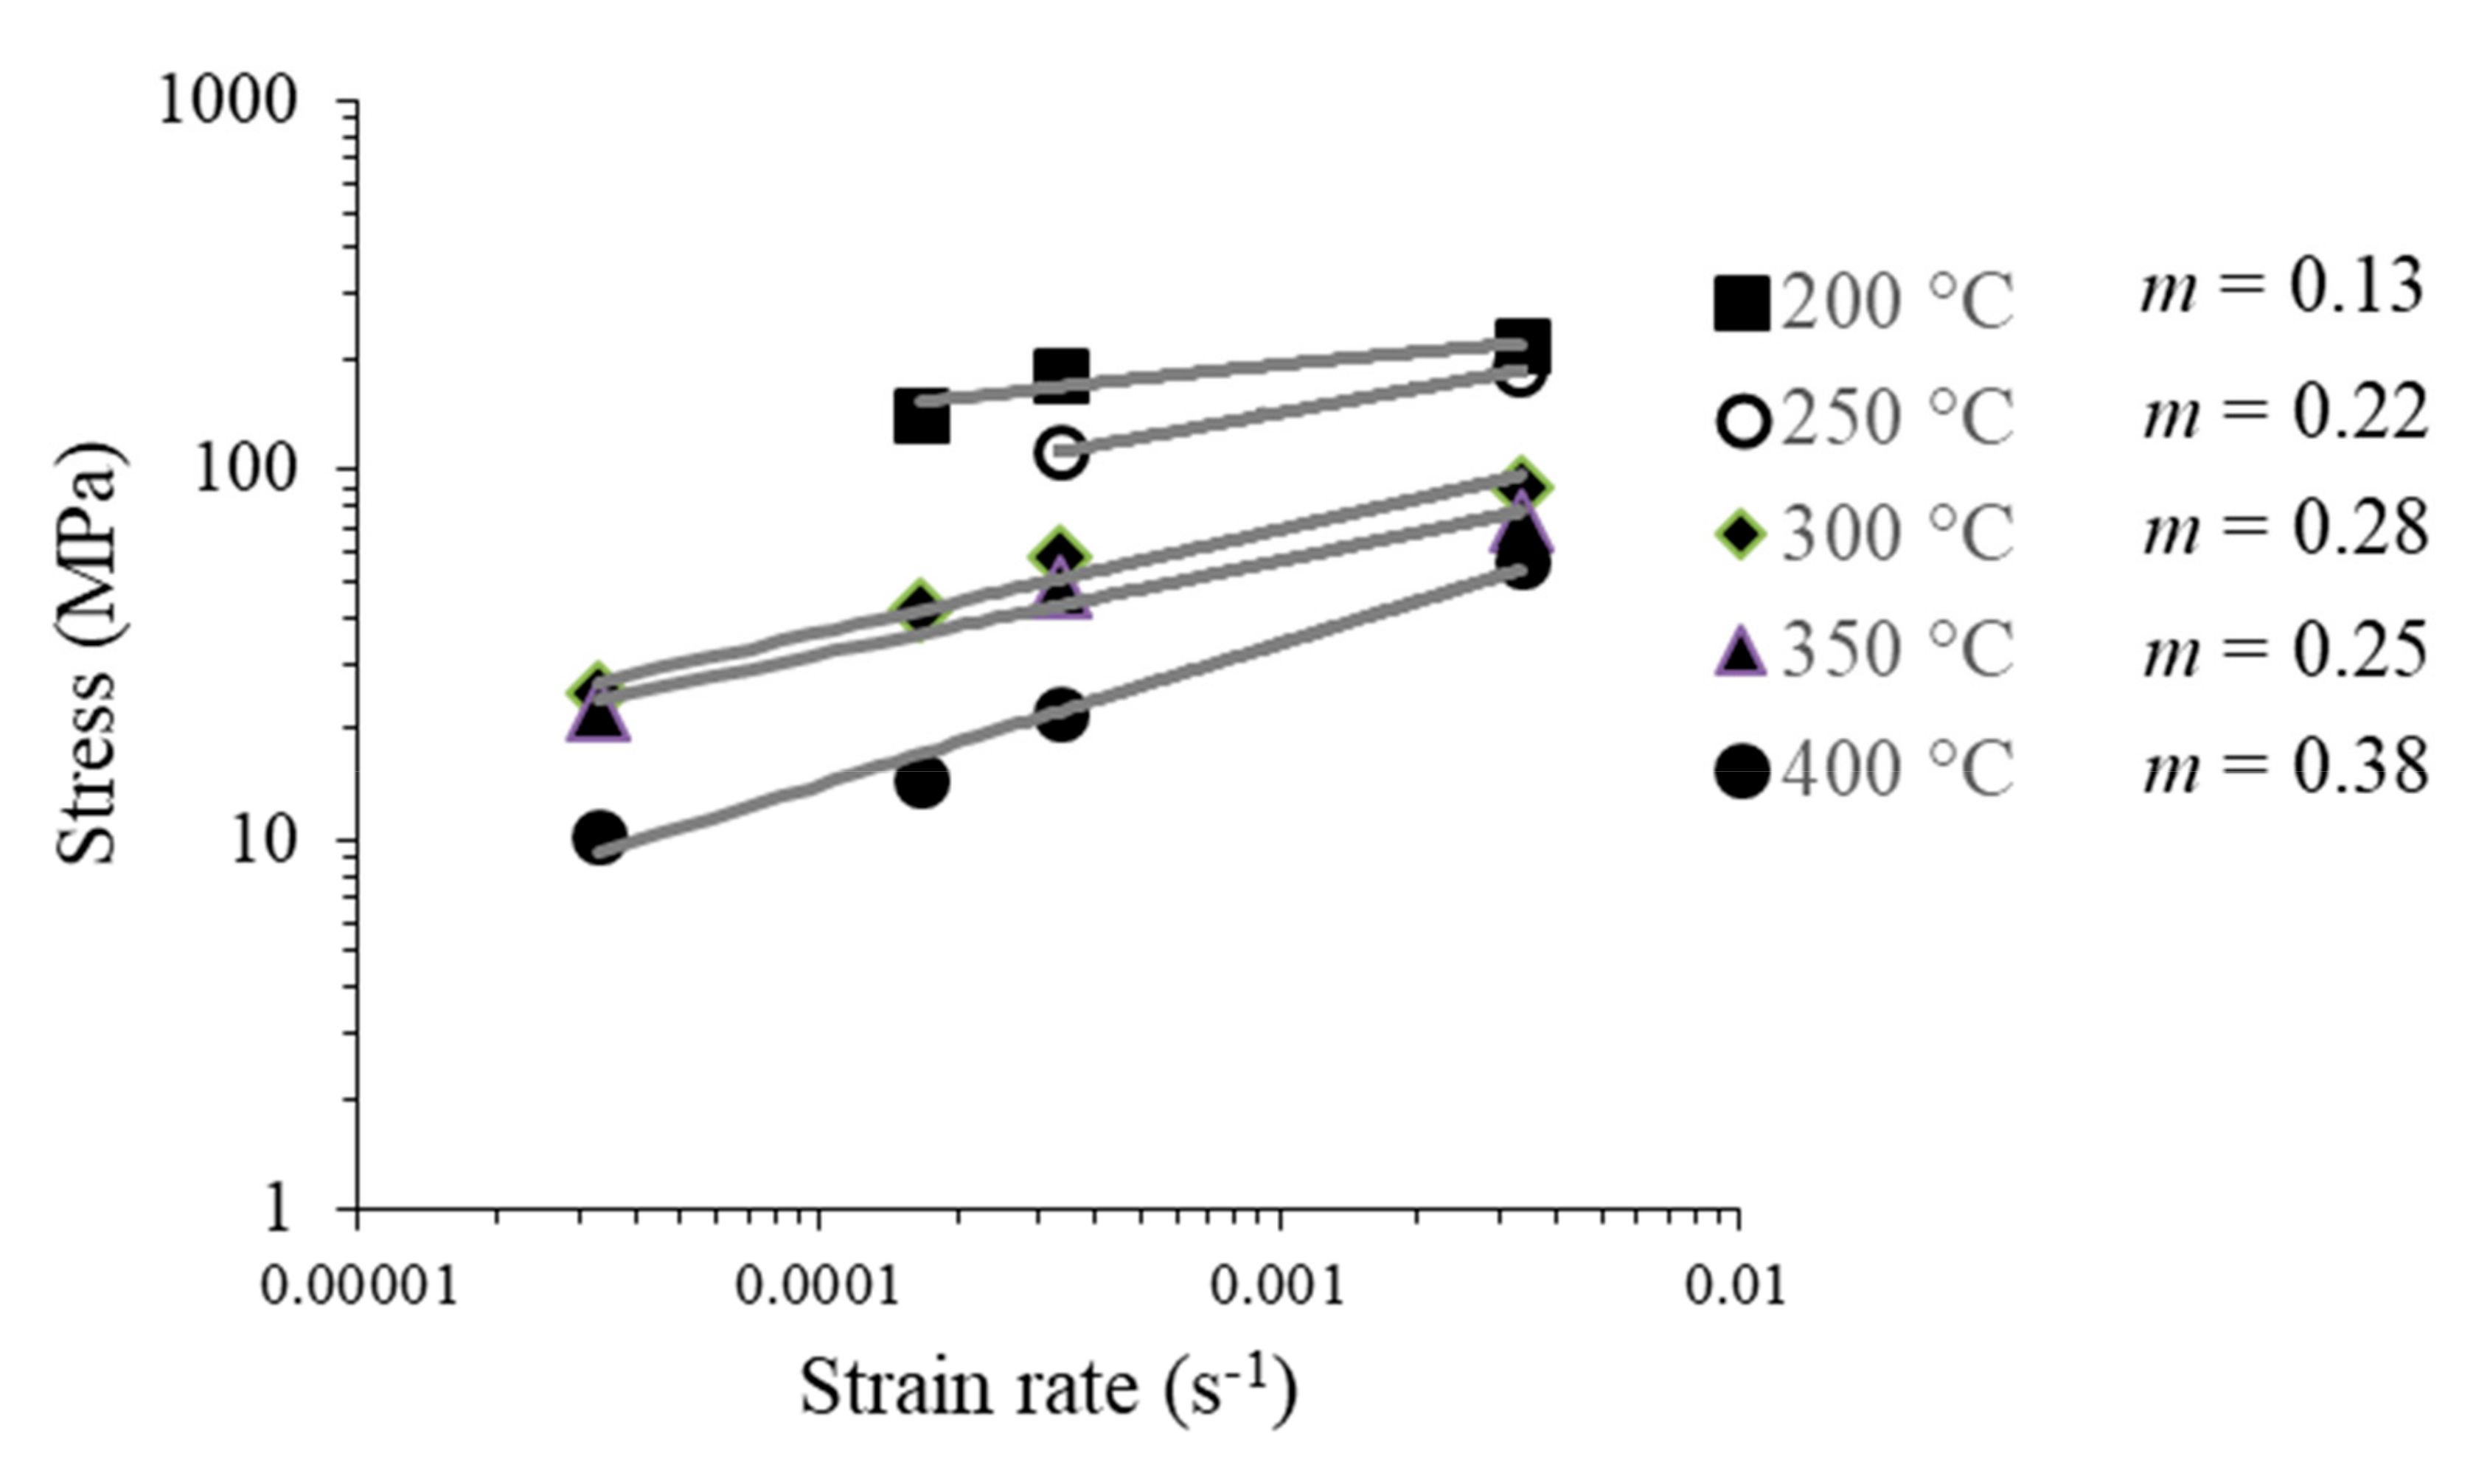
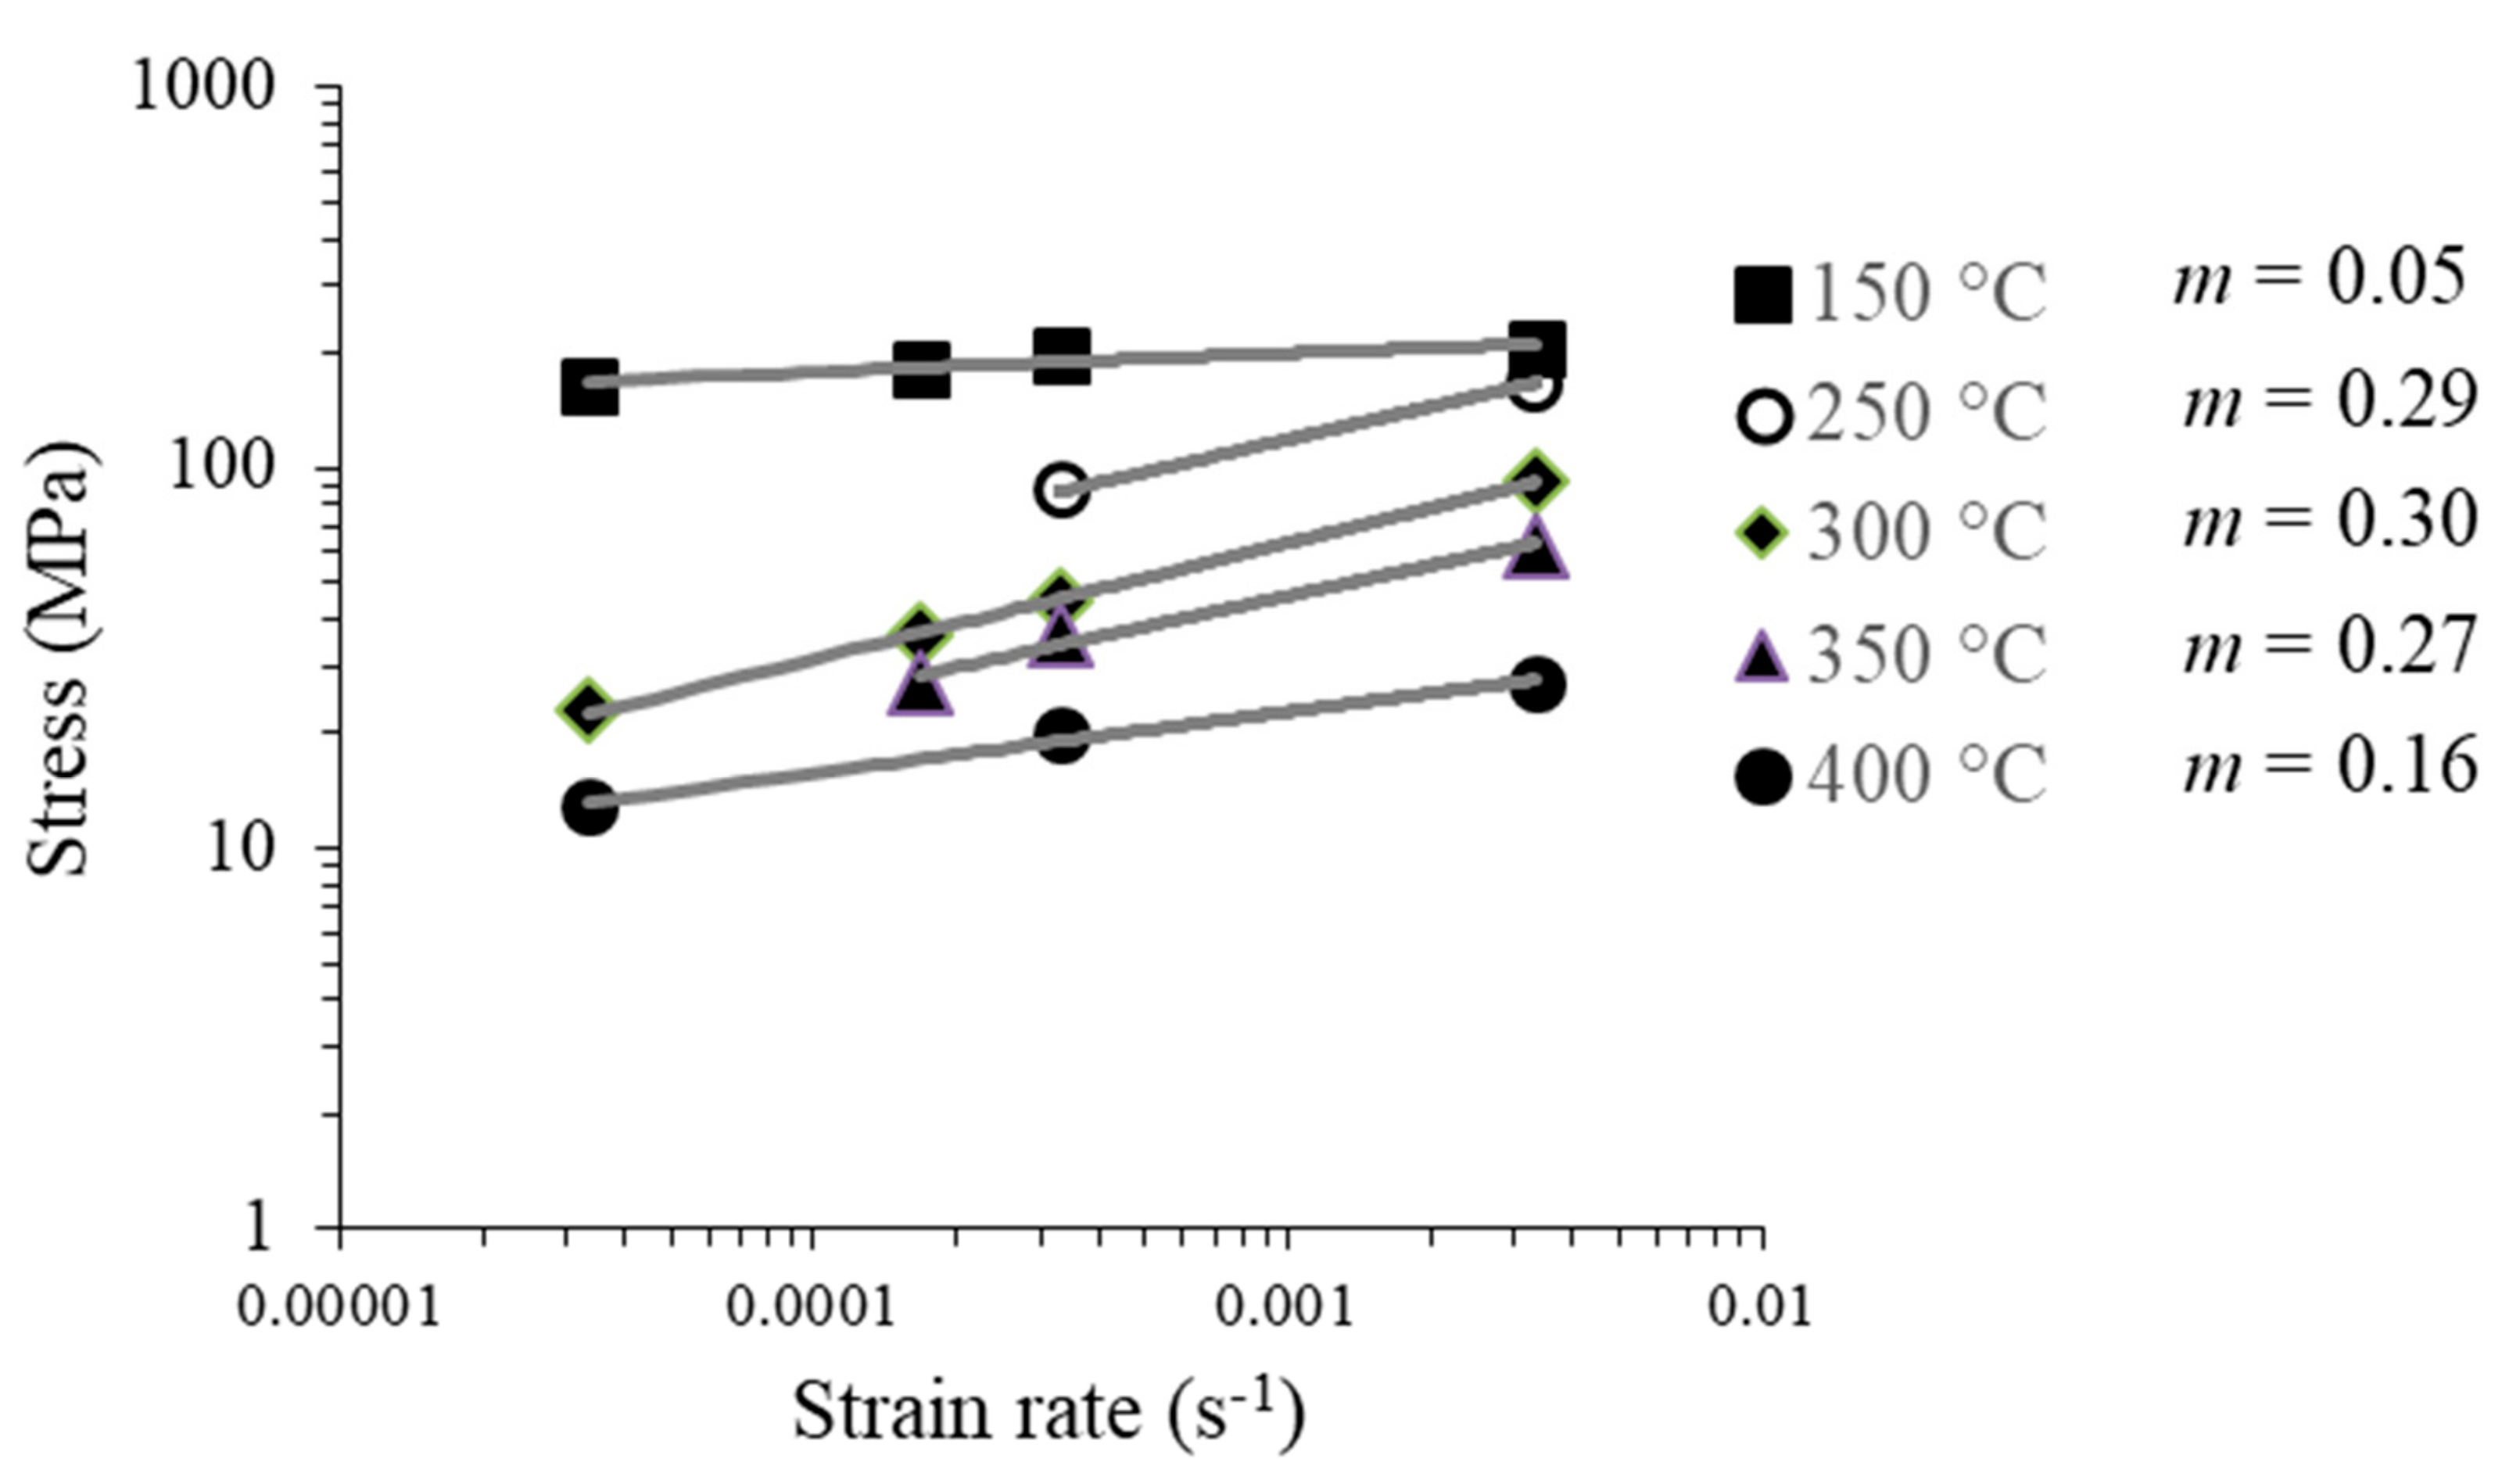
6. Strain-Rate Sensitivity
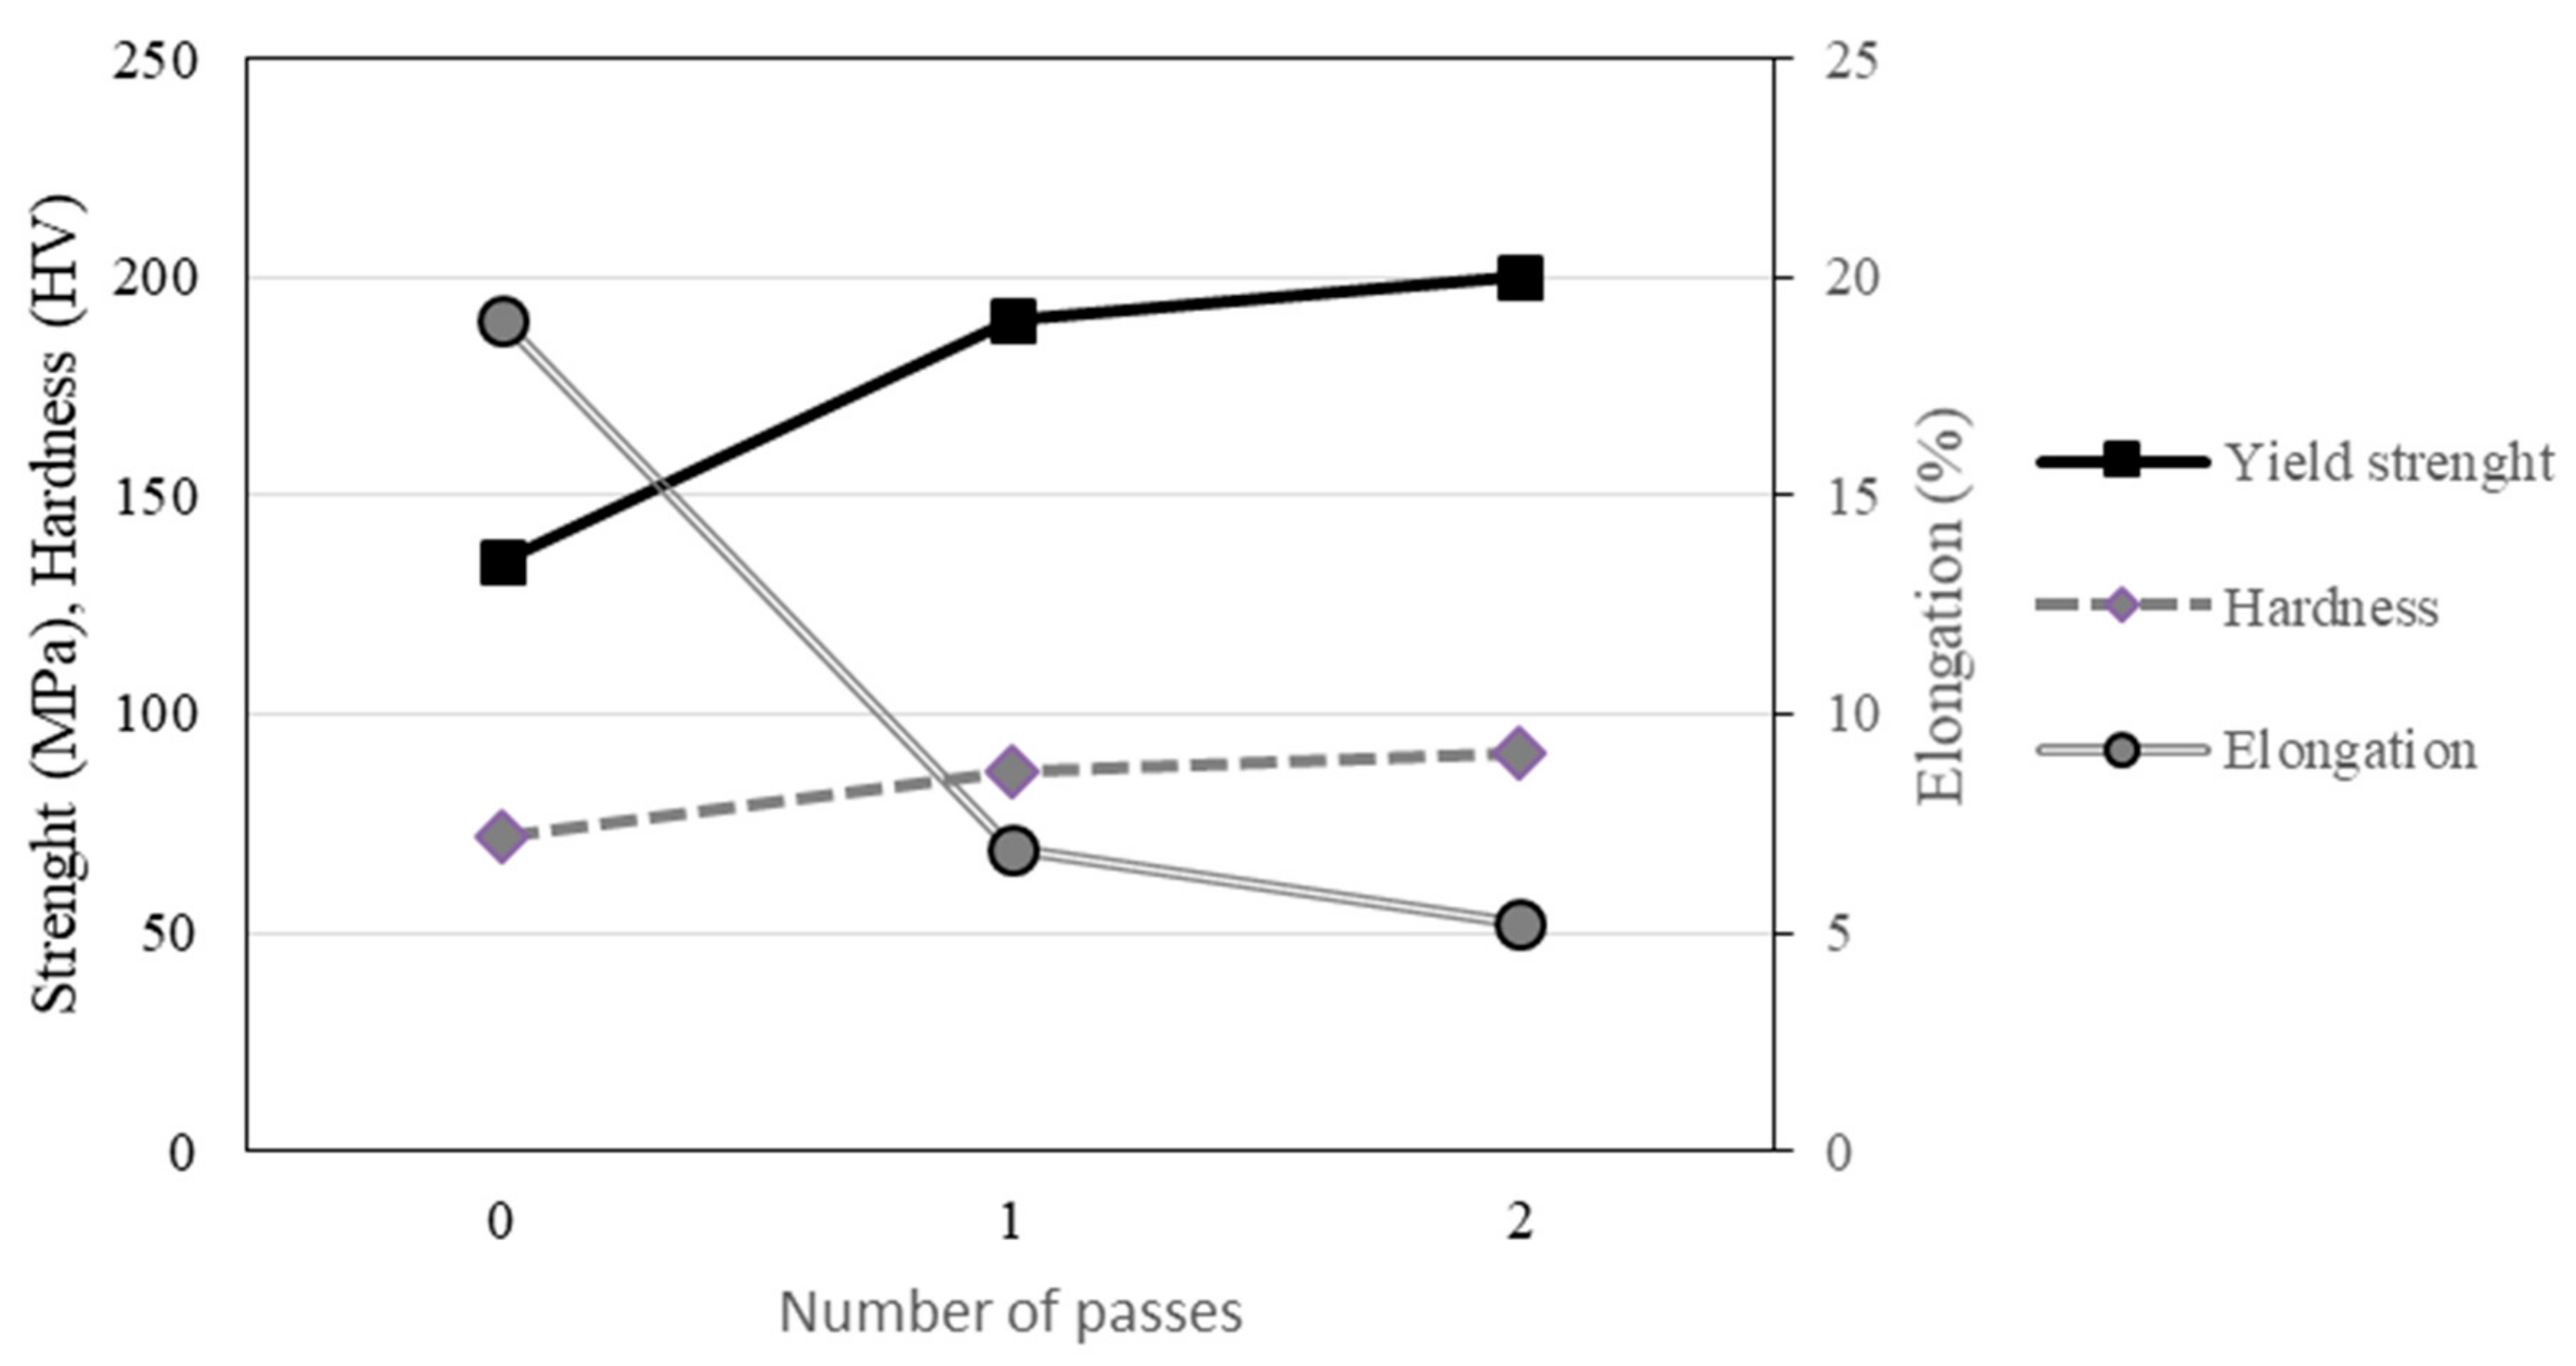
7. Results and Discussion
8. Forming Limit Curves
9. Crystallographic Texture
10. Strain-Rate Sensitivity
11. Conclusions
Author Contributions
Funding
Acknowledgments
Conflicts of Interest
References
- Taktak, W.; Taktak, R.; Haddar, N.; Elleuch, R. Study of the Influence of Cold Working on Mechanical Behavior and Ductile Fracture of 5754 Aluminum Alloy: Experimental and Numerical Simulations. J. Theor. Appl. Mech. 2017, 55, 923–935. [Google Scholar] [CrossRef]
- Yen, C.H.; Wu, C.T.; Chen, Y.H.; Lee, S.L. Effects of Annealing Temperature on Stress Corrosion Susceptibility of AA5083-H15 Alloys. J. Mater. Res. 2016, 31, 1163–1170. [Google Scholar] [CrossRef]
- Zhu, H.; Ghosh, A.K.; Maruyama, K. Effect of Cold Rolling on Microstructure and Material Properties of 5052 Alloy Sheet Produced by Continuous Casting. Mater. Sci. Eng. A 2006, 419, 115–121. [Google Scholar] [CrossRef]
- Rahimi, H.R.; Sedighi, M.; Hashemi, R. Forming Limit Diagrams of Fine-Grained Al 5083 Produced by Equal Channel Angular Rolling Process. Proc. Inst. Mech. Eng. Part L J. Mater. Des. Appl. 2018, 232, 922–930. [Google Scholar] [CrossRef]
- Khamei, A.A.; Dehghani, K. Effects of Strain Rate and Temperature on Hot Tensile Deformation of Severe Plastic Deformed 6061 Aluminum Alloy. Mater. Sci. Eng. A 2015, 627, 1–9. [Google Scholar] [CrossRef]
- Khakbaz, F.; Kazeminezhad, M. Work Hardening and Mechanical Properties of Severely Deformed AA3003 by Constrained Groove Pressing. J. Manuf. Process. 2012, 14, 20–25. [Google Scholar] [CrossRef]
- Valiev, R.Z.; Sabirov, I.; Zhilyaev, A.P.; Langdon, T.G. Bulk Nanostructured Metals for Innovative Applications. JOM 2012, 64, 1134–1142. [Google Scholar] [CrossRef]
- Sabirov, I.; Murashkin, M.Y.; Valiev, R.Z. Nanostructured Aluminium Alloys Produced by Severe Plastic Deformation: New Horizons in Development. Mater. Sci. Eng. A 2013, 560, 1–24. [Google Scholar] [CrossRef]
- Ozturk, F.; Pekel, H.; Halkaci, H.S. The Effect of Strain-Rate Sensitivity on Formability of AA 5754-O at Cold and Warm Temperatures. J. Mater. Eng. Perform. 2011, 20, 77–81. [Google Scholar] [CrossRef]
- Turkoz, M.; Yigit, O.; Dilmec, M.; Halkaci, H.S. Construction of Forming Limit Diagrams for AA5754 and AA2024 Aluminium Alloys. Prooceding of the 12th International Conference on Aluminum Alloys, Yokohama, Japan, 5–9 September 2010; pp. 516–521. [Google Scholar]
- Morovvati, M.R.; Dariani, B.M. The Effect of Annealing on the Formability of Aluminum 1200 after Accumulative Roll Bonding. J. Manuf. Process. 2017, 30, 241–254. [Google Scholar] [CrossRef]
- Wu, P.D.; MacEwen, S.R.; Lloyd, D.J.; Neale, K.W. Effect of Cube Texture on Sheet Metal Formability. Mater. Sci. Eng. A 2004, 364, 182–187. [Google Scholar] [CrossRef]
- Limbadri, K.; Gangadhar, J.; Maruti Ram, A.; Singh, S.K. Review of Formability in Relation to Texture. Mater. Today Proc. 2015, 2, 2198–2204. [Google Scholar] [CrossRef]
- Kestens, L.A.I.; Pirgazi, H. Texture Formation in Metal Alloys with Cubic Crystal Structures. Mater. Sci. Technol. 2016, 32, 1303–1315. [Google Scholar] [CrossRef]
- Olaf, E.; Valerie, R. Introduction to Texture Analysis: Macrotexture, Microtexture and Orientation Mapping, 2nd ed.; CRC Press: Boca Raton, FL, USA, 2010. [Google Scholar]
- Kumar, R.; Gupta, A.; Kumar, A.; Chouhan, R.N.; Khatirkar, R.K. Microstructure and Texture Development during Deformation and Recrystallisation in Strip Cast AA8011 Aluminum Alloy. J. Alloys Compd. 2018, 742, 369–382. [Google Scholar] [CrossRef]
- Narayanasamy, R.; Ravindran, R.; Manonmani, K.; Satheesh, J. A Crystallographic Texture Perspective Formability Investigation of Aluminium 5052 Alloy Sheets at Various Annealing Temperatures. Mater. Des. 2009, 30, 1804–1817. [Google Scholar] [CrossRef]
- Yoshida, K.; Ishizaka, T.; Kuroda, M.; Ikawa, S. The Effects of Texture on Formability of Aluminum Alloy Sheets. Acta Mater. 2007, 55, 4499–4506. [Google Scholar] [CrossRef]
- Sakai, T.; Hamada, S.; Saito, Y. Improvement of the R-Value in 5052 Aluminum Alloy Sheets Having through-Thickness Shear Texture by 2-Pass Single-Roll Drive Unidirectional Shear Rolling. Scr. Mater. 2001, 44, 2569–2573. [Google Scholar] [CrossRef]
- Ratchev, P.; van Houtte, P.; Verlinden, B.; de Smet, P.; Neutjens, P.; Baartman, R.; Drent, P. Prediction of Forming Limit Diagrams of Al-Mg Rolled Sheets Taking Texture into Account. Textures Microstruct. 1994, 22, 219–231. [Google Scholar] [CrossRef]
- Barnwal, V.K.; Raghavan, R.; Tewari, A.; Narasimhan, K.; Mishra, S.K. Effect of Microstructure and Texture on Forming Behaviour of AA-6061 Aluminium Alloy Sheet. Mater. Sci. Eng. A 2017, 679, 56–65. [Google Scholar] [CrossRef]
- Woodford, D.A. Strain Rate Sensitivity as a Measure of Ductility. ASM Am. Soc. Metals Trans. Quart. 1969, 62, 291–293. [Google Scholar]
- Spencer, K.; Corbin, S.F.; Lloyd, D.J. The Influence of Iron Content on the Plane Strain Fracture Behaviour of AA 5754 Al-Mg Sheet Alloys. Mater. Sci. Eng. A 2002, 325, 394–404. [Google Scholar] [CrossRef]
- Smolej, A.; Skaza, B.; Markoli, B.; Klobčar, D.; Dragojević, V.; Slaček, E. Superplastic Behaviour of AA5083 Aluminium Alloy with Scandium and Zirconium. Mater. Sci. Forum 2012, 706–709, 395–401. [Google Scholar] [CrossRef]
- Zhang, K.F.; Yan, H.H. Deformation Behavior of Fine-Grained 5083 Al Alloy at Elevated Temperature. Trans. Nonferrous Met. Soc. China 2009, 19, s307–s311. [Google Scholar] [CrossRef]
- Ezequiel, M.; Figueroa, I.A.; Elizalde, S.; Cabera, J.M.; Braham, C.; Morin, L.; Gonzalez, G. Numerical and experimental study of a 5754-aluminum alloy processed by heterogeneous repetitive corrugation and straightening. J. Mater Res. Technol. 2019. In press. [Google Scholar] [CrossRef]
- Mainprice, D.; Bachmann, F.; Hielscher, R.; Schaeben, H. Descriptive Tools for the Analysis of Texture Projects with Large Datasets Using MTEX: Strength, Symmetry and Components. Geol. Soc. London Spec. Publ. 2015, 409, 251–271. [Google Scholar] [CrossRef]
- Zhang, C.; Xie, F.; Yang, Y.; Wang, Y. Identification of Modified Swift Constitutive Model and Its Application in Predicting FLDs of AA5083 at Elevated Temperatures. Procedia Manuf. 2018, 15, 1142–1148. [Google Scholar] [CrossRef]
- Chow, C.L.; Yu, L.G.; Tai, W.H.; Demeri, M.Y. Prediction of Forming Limit Diagrams for AL6111-T4 under Non-Proportional Loading. Int. J. Mech. Sci. 2001, 43, 471–486. [Google Scholar] [CrossRef]
- Lee, D.N.; Han, H.N. The Cube Recrystallization-Texture Related Component in the β-Fiber Rolling-Texture FCC Metals. Mater. Sci. Forum 2014, 783–786, 51–56. [Google Scholar] [CrossRef]
- Türköz, M.; Halkaci, H.S.; Koç, M. The Effect of Temperature and Strain-Rate Sensitivity on Formability of AA 5754. Appl. Mech. Mater. 2012, 217–219, 1596–1601. [Google Scholar] [CrossRef]
- Worswick, M.J.; Smerd, R.; Salisbury, C.P.; Winkler, S.; Lloyd, D.J. High Strain Rate Behaviour of Aluminium Alloy Sheet. Mater. Sci. Forum 2006, 519–521, 139–146. [Google Scholar] [CrossRef]


| Si | Fe | Cu | Mn | Mg | Cr | Zn | Ti | Al |
| 0.04 | 0.17 | 0.00 | 0.01 | 3.00 | 0.22 | 0.00 | 0.02 | Rest |
| Texture Component | 0P (%) | 1P (%) | 2P (%) |
|---|---|---|---|
| Goss | 2.3 | 2.0 | 1.7 |
| Brass | 6.6 | 5.1 | 3.9 |
| S | 25.9 | 21.7 | 21.7 |
| Cu | 6.3 | 5.7 | 6.0 |
| Cube | 0.7 | 0.9 | 0.7 |
| S-cube connecting fiber | 18.3 | 18.3 | 17.9 |
© 2020 by the authors. Licensee MDPI, Basel, Switzerland. This article is an open access article distributed under the terms and conditions of the Creative Commons Attribution (CC BY) license (http://creativecommons.org/licenses/by/4.0/).
Share and Cite
Ezequiel, M.; Elizalde, S.; Cabrera, J.-M.; Picas, J.; Figueroa, I.A.; Alfonso, I.; Gonzalez, G. Formability of the 5754-Aluminum Alloy Deformed by a Modified Repetitive Corrugation and Straightening Process. Materials 2020, 13, 633. https://doi.org/10.3390/ma13030633
Ezequiel M, Elizalde S, Cabrera J-M, Picas J, Figueroa IA, Alfonso I, Gonzalez G. Formability of the 5754-Aluminum Alloy Deformed by a Modified Repetitive Corrugation and Straightening Process. Materials. 2020; 13(3):633. https://doi.org/10.3390/ma13030633
Chicago/Turabian StyleEzequiel, Marco, Sergio Elizalde, José-María Cabrera, Josep Picas, Ignacio A. Figueroa, Ismeli Alfonso, and Gonzalo Gonzalez. 2020. "Formability of the 5754-Aluminum Alloy Deformed by a Modified Repetitive Corrugation and Straightening Process" Materials 13, no. 3: 633. https://doi.org/10.3390/ma13030633
APA StyleEzequiel, M., Elizalde, S., Cabrera, J.-M., Picas, J., Figueroa, I. A., Alfonso, I., & Gonzalez, G. (2020). Formability of the 5754-Aluminum Alloy Deformed by a Modified Repetitive Corrugation and Straightening Process. Materials, 13(3), 633. https://doi.org/10.3390/ma13030633