It should be pointed out that bismuth layer-structured multiferroic compounds of the composition Bi
m+1Fe
m–3Ti
3O
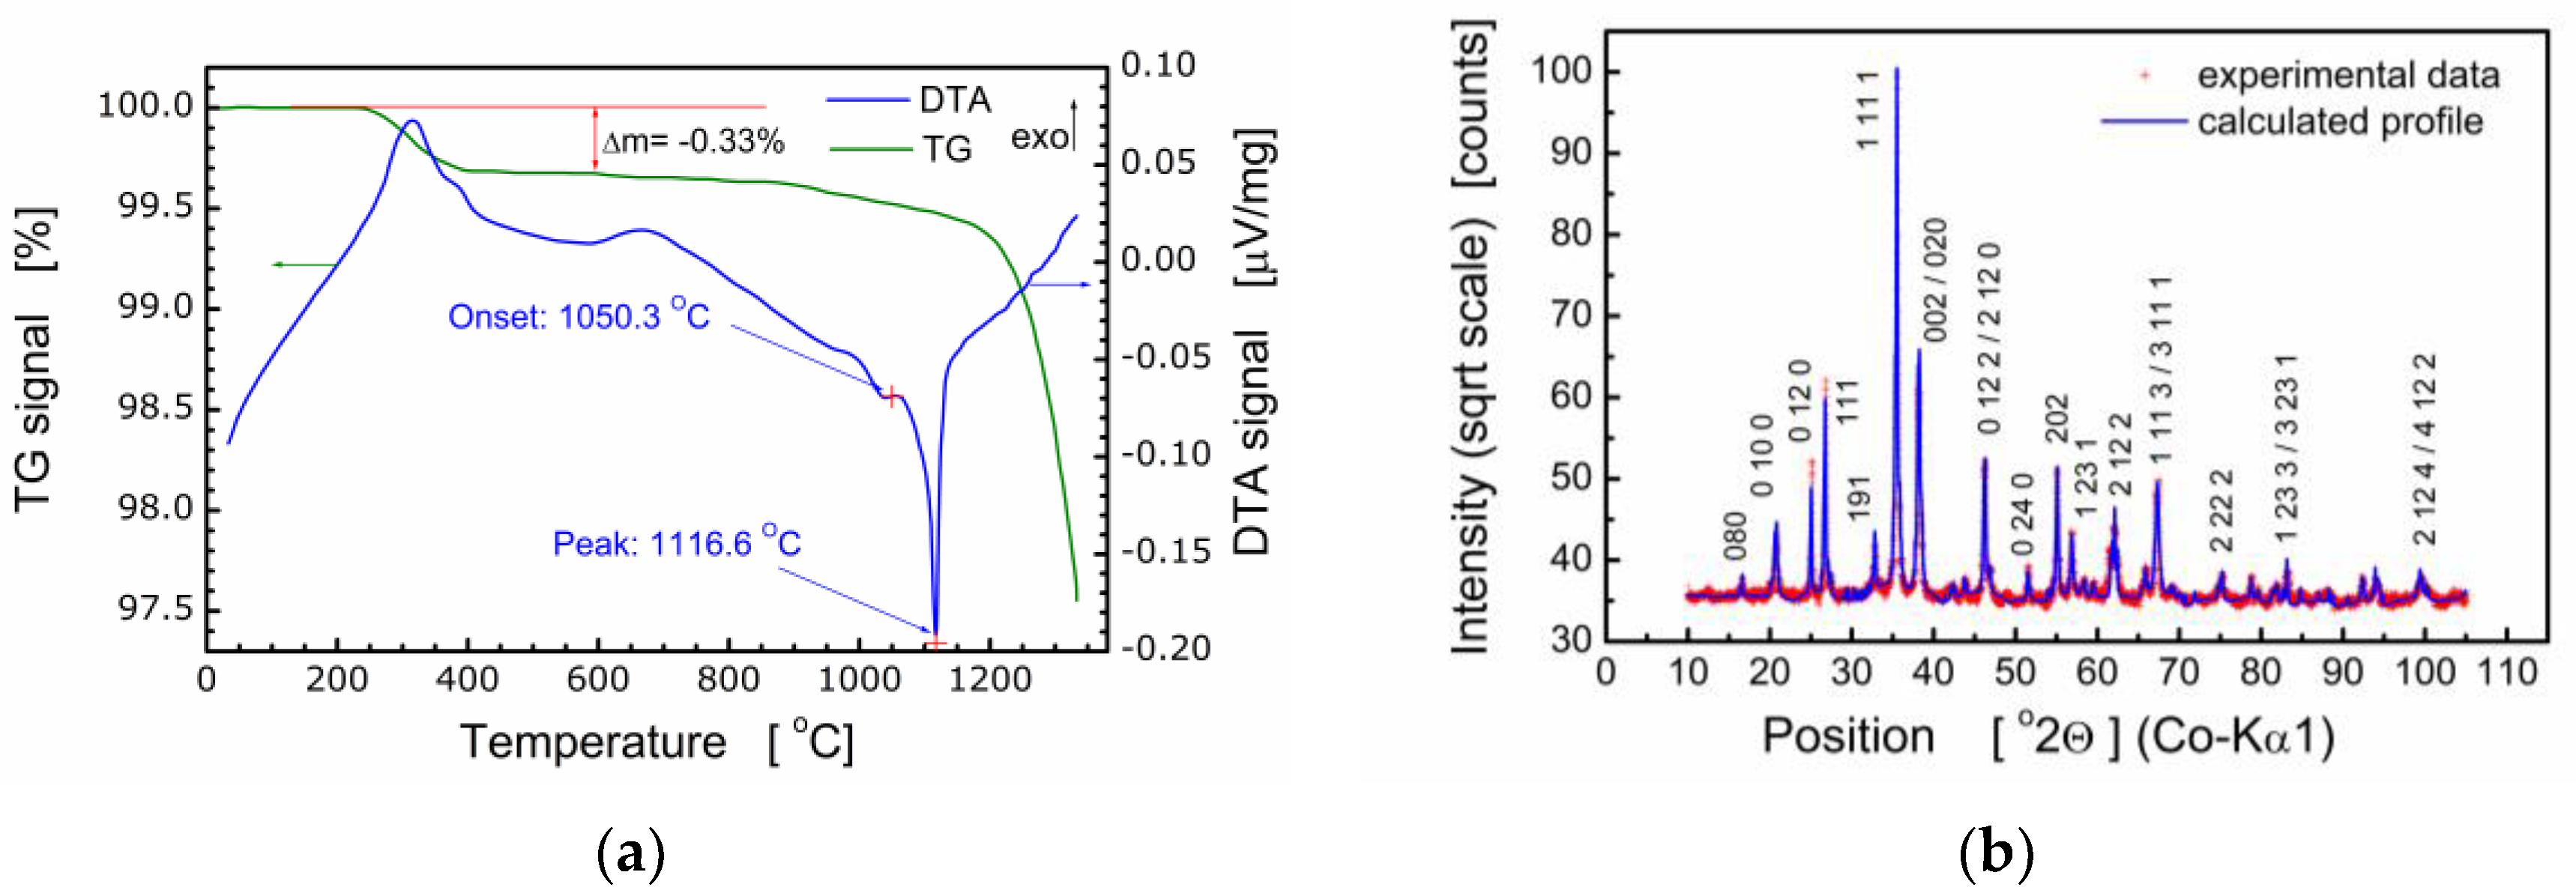
3m+3 are difficult to produce because these compounds are formed in several stages and their thermal stability is low. Therefore, the process of fabrication of BFTO was controlled with both simultaneous thermal analysis (STA) and X-ray diffraction analysis. It was found by STA that the formation of the BFTO phase took place at the temperature range Δ
T ≈ 650–700 °C [
7]. For that reason, the temperature of calcination was chosen as
Tc = 720 °C. Results of the thermal analysis of BFTO powder are shown in
Figure 1a.
Results of X-ray diffraction studies performed for ceramics sintered at
Ts = 850 °C,
Ts = 1080 °C [
7], and
Ts = 980 °C [
8,
21] proved the essential influence of the sintering temperature on the crystal structure and phase composition of the Bi
6Fe
2Ti
3O
18 compound. It was found that the BFTO ceramics sintered at
Ts = 850 °C,
Ts = 1080 °C were multiphase ones and consisted of two phases, namely, the Aurivillius phase with
m = 5 layers (i.e., the stoichiometric phase) and
m = 4 (i.e., the phase with a reduced number of layers in the slab) [
7]. Our earlier studies have shown [
8,
21] that Bi
6Fe
2Ti
3O
18 ceramics, sintered at
Ts = 980 °C, were single-phase and adopted the orthorhombic structure of the
Aba2 (41) space group. Therefore, for the purpose of the present studies, final sintering of BFTO ceramics was performed at
Ts = 980 °C. The resulting X-ray diffraction pattern is shown in
Figure 1b.
Structural analyses based on the X-ray diffraction pattern (
Figure 1b) show the BFTO compound crystallized in an orthorhombic structure,
Fmm2 space group, with the following elementary cell parameters:
a = 5.4565(4) Å,
b = 49.375(3) Å, and
c = 5.4816(3) Å. The Rietveld refinement of the crystal structure was performed using the ICSD standard (ICSD collection code: 156257), primary reference [
9]. The average size of crystallites was calculated 〈
D〉 = 433.2 Å as well as the average strain 〈
ε〉 = 0.043%. It is worth noting that quality parameters of the Rietveld refinement procedure were as follows: R(expected) = 2.81305%; R(profile) = 3.97795%; R(weighted profile) = 5.52957%; goodness of fit GOF = 3.86392%.
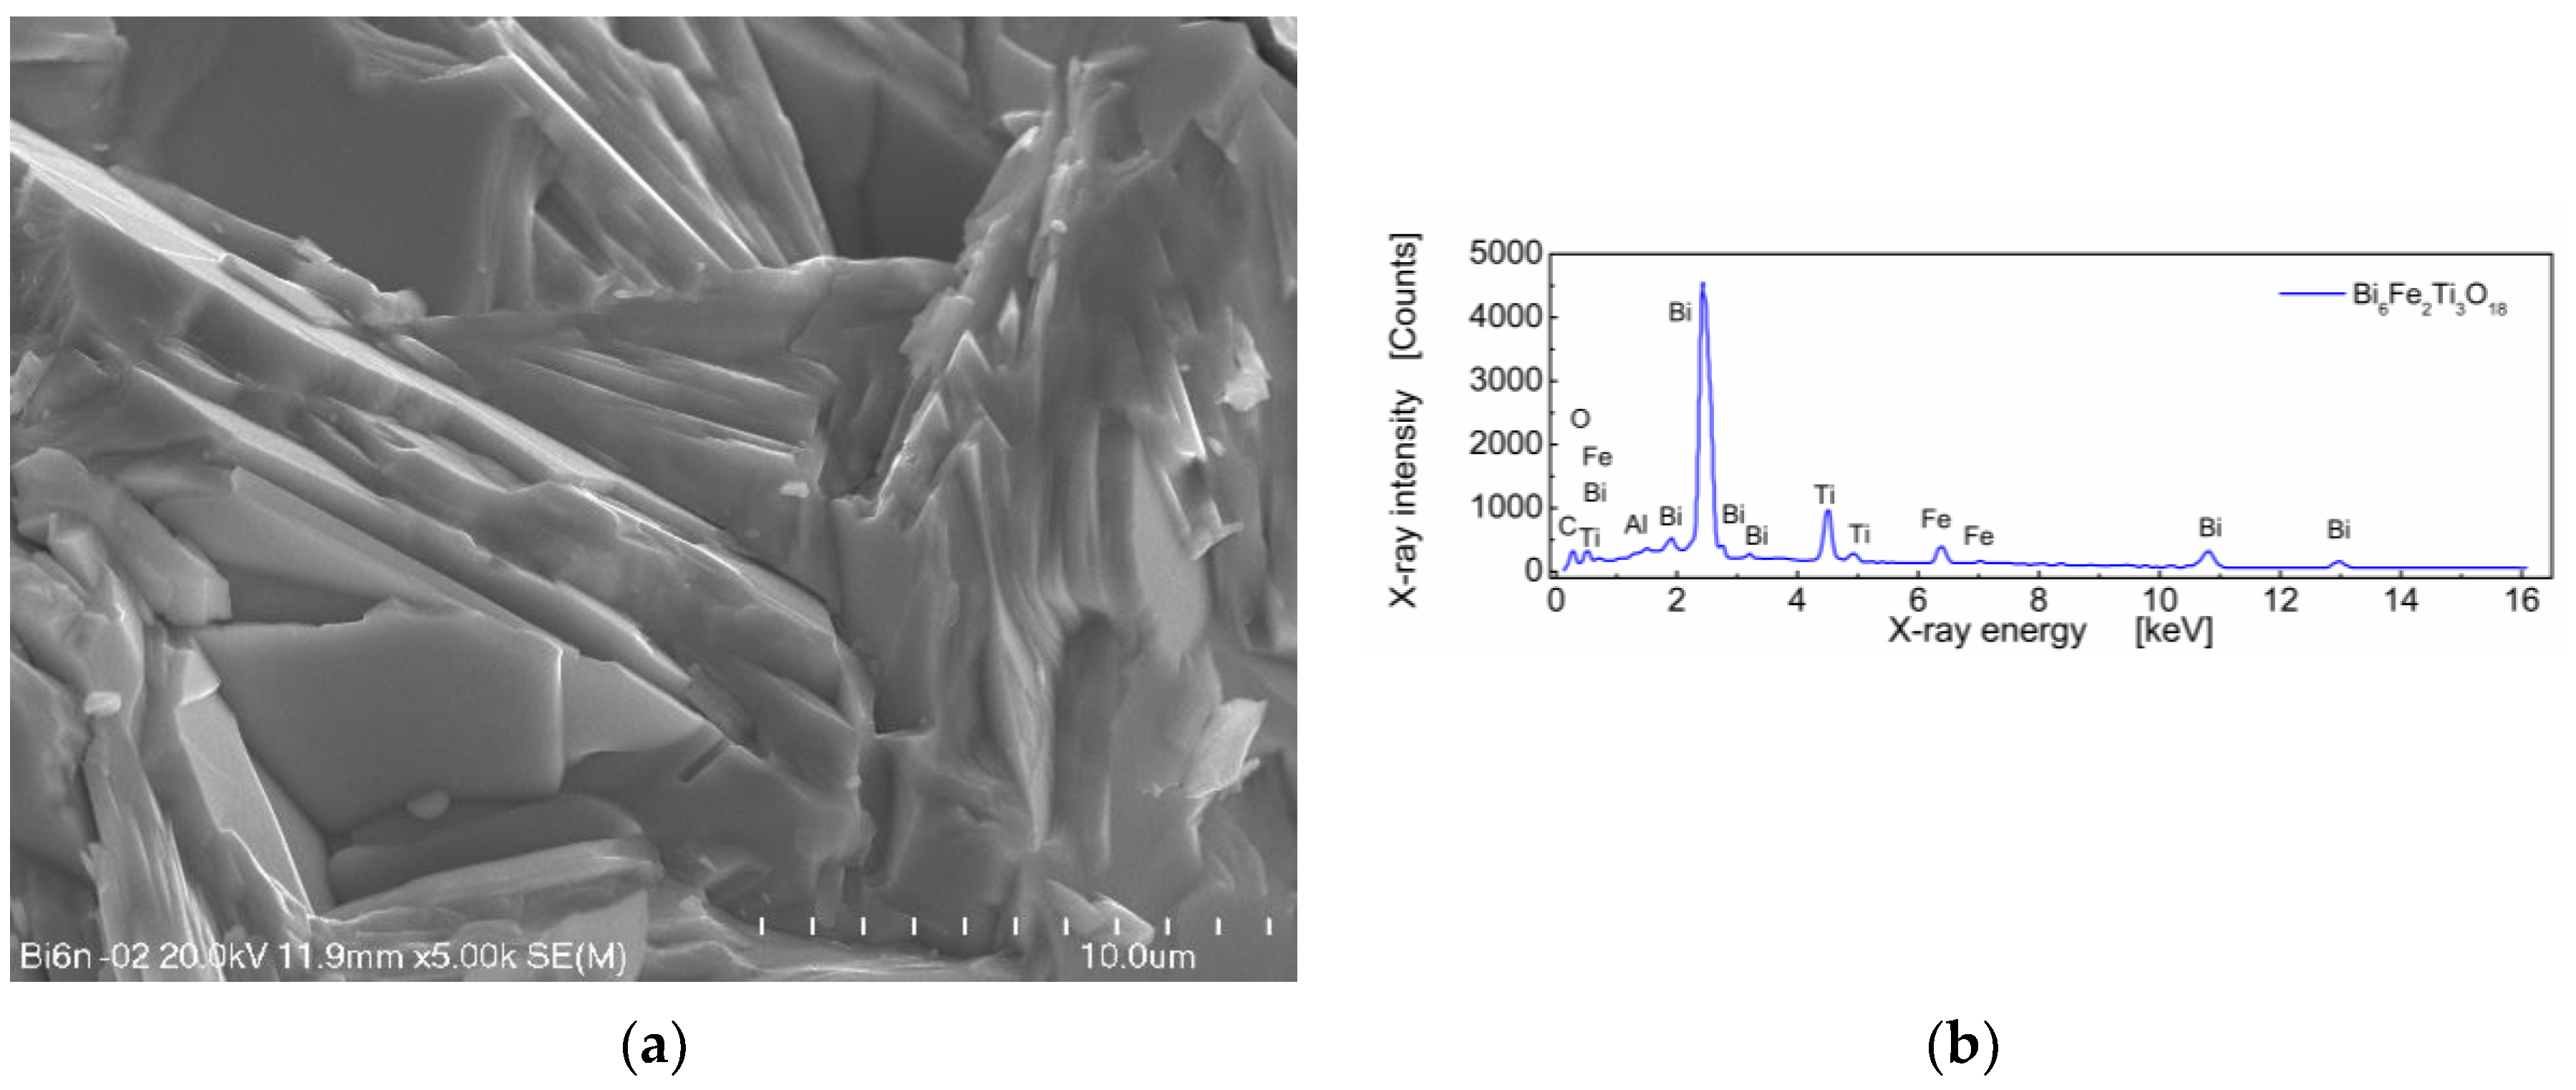
One can see in
Figure 2a that BFTO grains adopt a plate-like shape. Measurements of the average grain size taken as an average diagonal of the plate-like grain were performed with the help of an ImageJ—A public domain Java image processing program [
22]. It was found that the average grain size was 7.21 μm (
Figure 3a). Apart from the diagonal, the thickness of the plates was measured. It was found that the average thickness of the plate-like grain was 0.44 μm. The resulting distribution of “thicknesses” of the plate-like grains is shown in
Figure 3b.
The stoichiometric composition of the Bi
6Fe
2Ti
3O
18 compound expressed in the weight fraction of oxides is as follows: Bi
2O
3—77.7 wt%; Fe
2O
3—9.0 wt%; and TiO
2—13.3 wt% [
8]. The EDS quantitative results, calculated on the base of the spectrum shown in
Figure 2b, for BFTO ceramics were as follows: Bi
2O
3—78.26 wt%; Fe
2O
3—8.80 wt%; and TiO
2—12.94 wt%.
3.1. Complex Impedance Analysis
Dielectric spectroscopy is extremely susceptible to random disturbances that do not show up in the impedance spectrum at first glance. Therefore, in order to obtain reliable results as a result of the analysis of impedance data, it is necessary to test the consistency of the recorded measurement data. For this purpose, the Kramers–Kronig (K–K) equations were used to test the quality of measurement data. Inspection of the results showed high compliance of the measurement with the K–K calculations. The value of the “chi-square” parameter was obtained within the range
χ2 = 5 × 10
−5–2 × 10
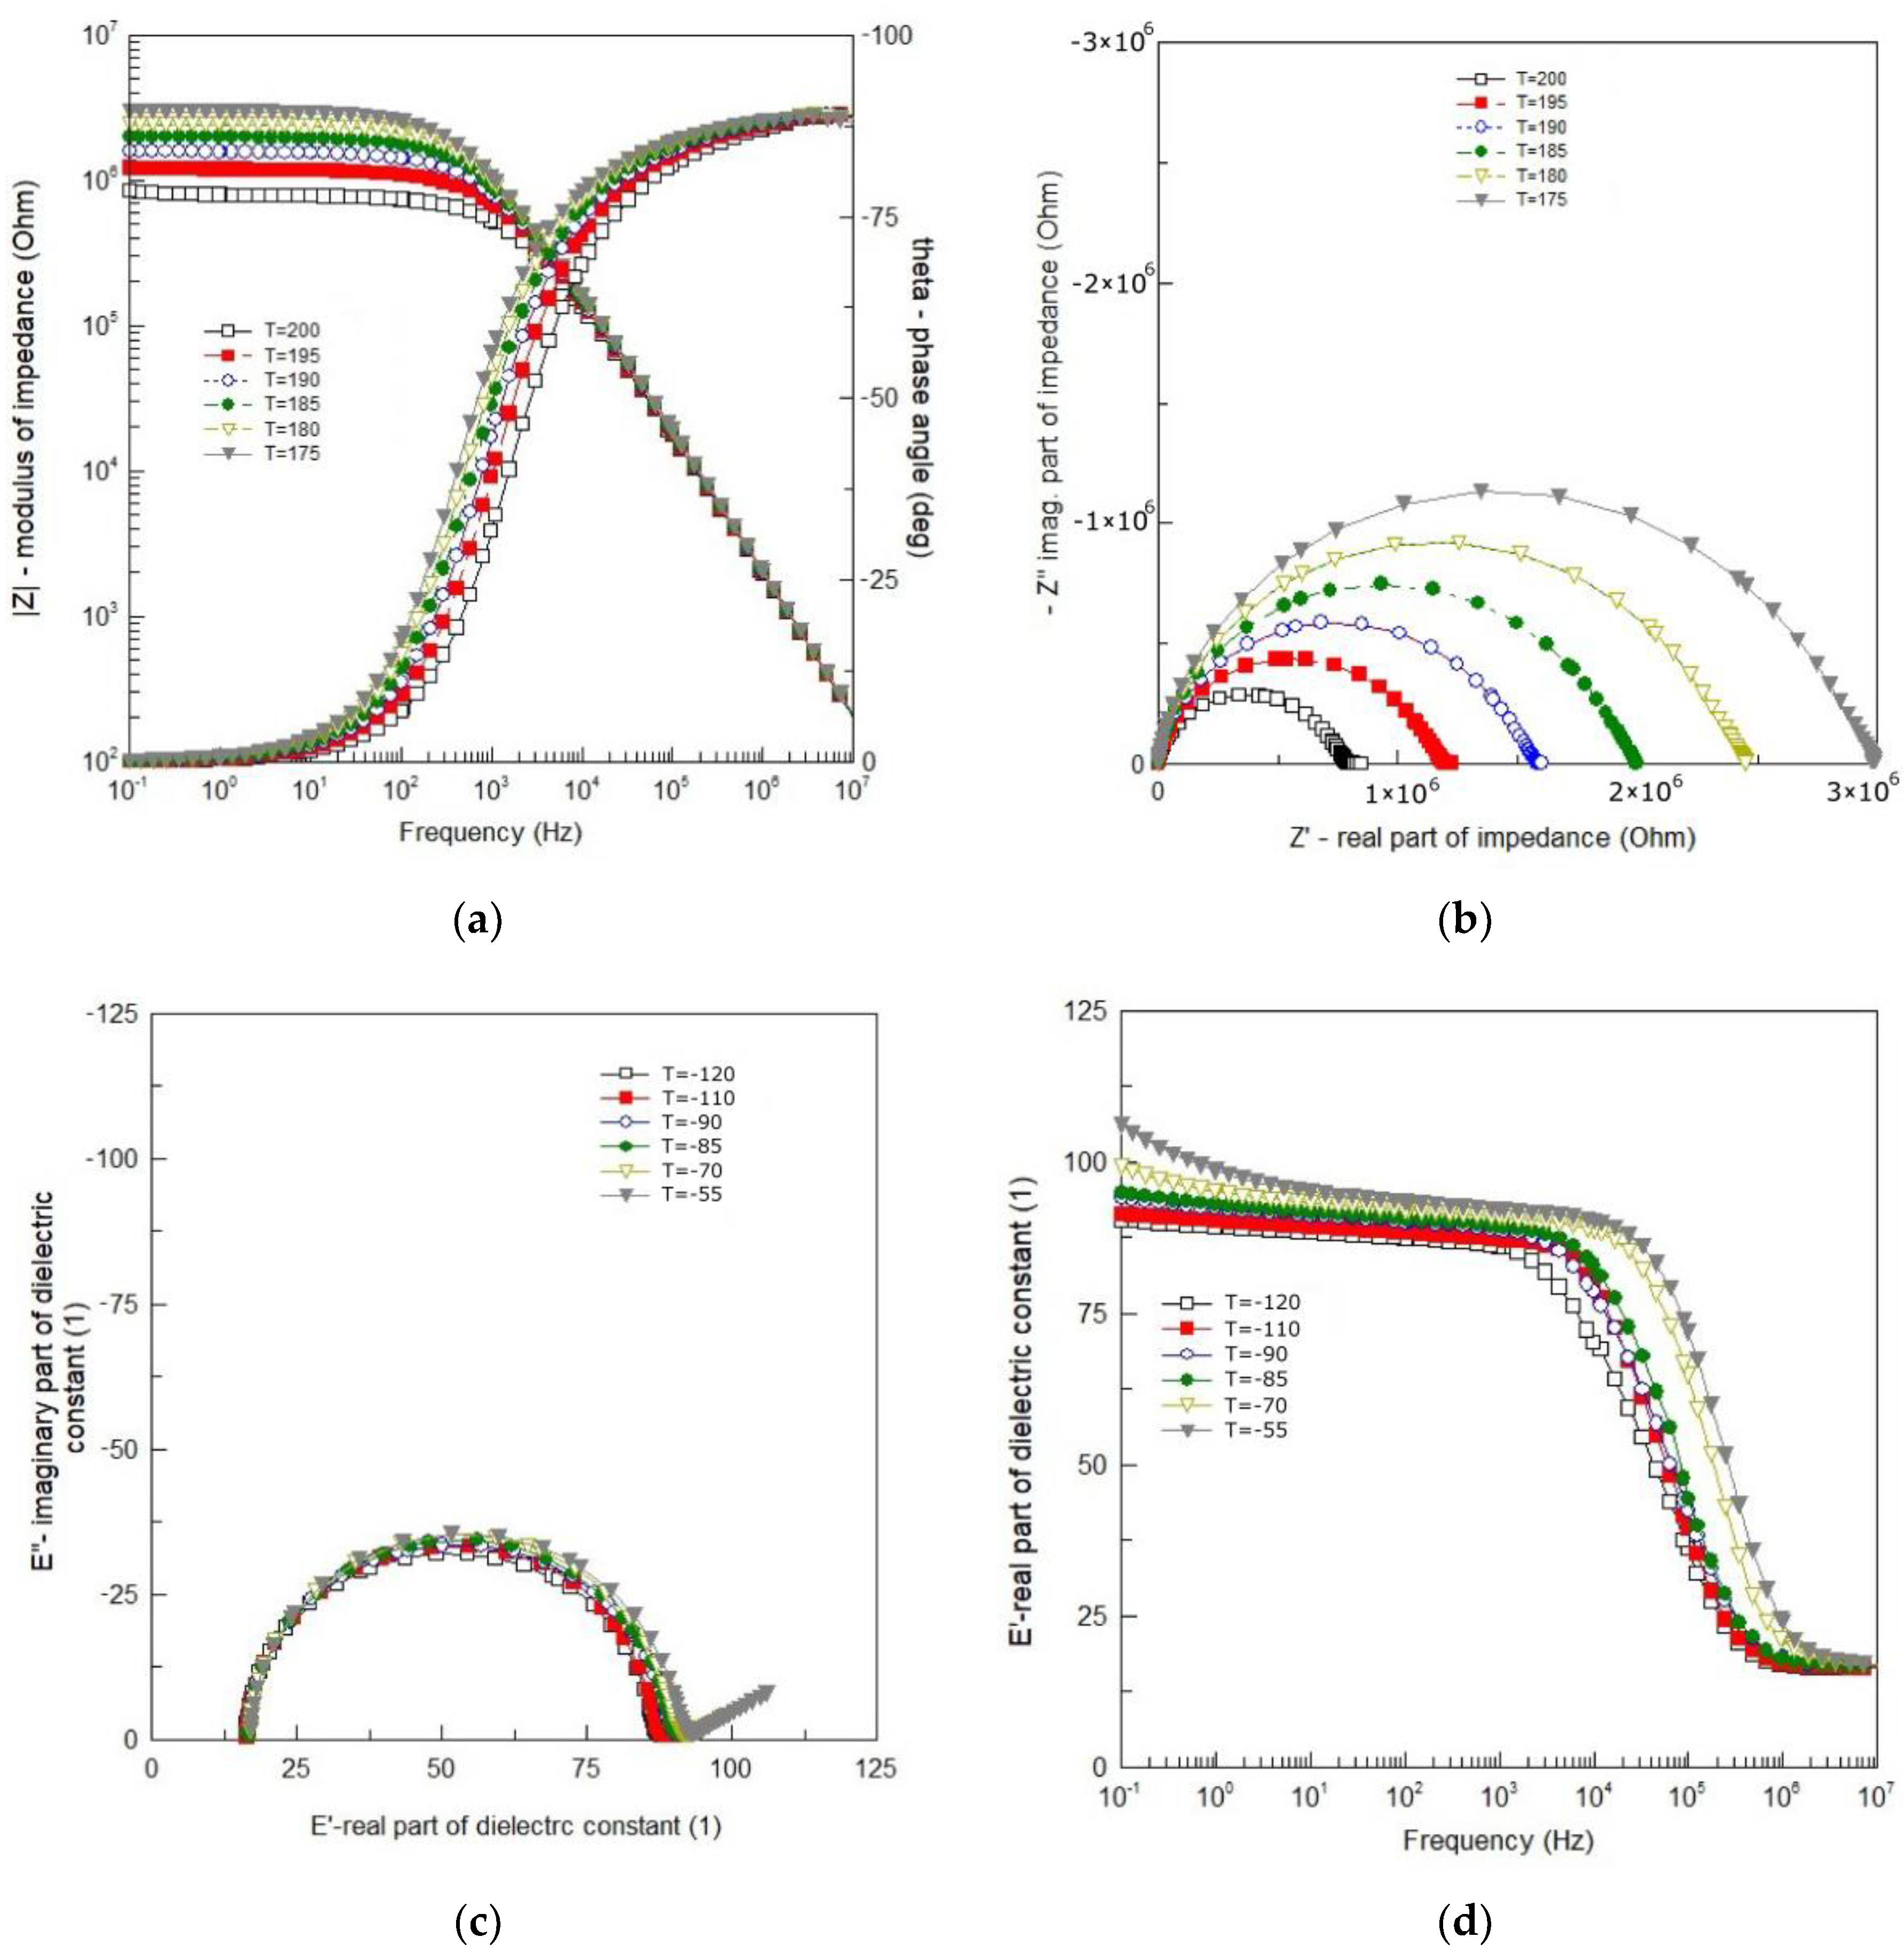
−7. Thus, an excellent quality of the measurements was confirmed. Results of the impedance measurements are shown in
Figure 4.
One can see smooth and monotonic curves of modulus of the complex impedance |
Z| that exhibit weak frequency dispersion in the low frequency range and strong frequency dependence in the high frequency range (
Figure 4a). The changeover point from weak to strong dependence on frequency, shifts toward higher frequency with an increase in temperature. One can see in
Figure 4a that in the high frequency range |
Z| (
ν) curves for different temperatures overlap each other. The curves representing a spectroscopic plot of the phase angle (
θ) exhibit a sigmoidal shape (in a semi-logarithmic scale). They are also smooth and change monotonically from
θ = 0° for low frequency to
θ = −90° for high frequency (
Figure 4a). They shift toward higher frequency with an increase in temperature.
The dependence of the imaginary part of complex impedance (−
Z″) on the real part of complex impedance (
Z′) is shown in
Figure 4b. One can see that despite the isotropic linear scale used, the experimental curves (
Figure 4b) are rarely ideal semicircles. In the present case, the curves resemble arcs (deformed, flattened semicircles) with the centers below the real axis. The frequency at which the arc reaches a maximum corresponds to the relaxation frequency, e.g., [
16]:
where
ωm,
τm—relaxation frequency and relaxation time, respectively. As the temperature rises, the depression angle increases and the arc radius decreases, which indicates the thermal activation of the conduction mechanism. The shape of the Nyquist diagram (
Figure 4b) shows that the relaxation time of the polarization processes taking place in BFTO ceramics cannot be defined as a single quantity, but as a quantity with a certain distribution around the mean value.
Impedance data for the temperature range Δ
T = −120 °C–55 °C are shown in
Figure 1 in a form of the Cole–Cole plot (
Figure 4c) and the spectroscopic dependence of the real part of dielectric permittivity (
Figure 4d). Almost ideal semicircles, shown in
Figure 4c, mean that the phenomena responsible for relaxation in the BFTO ceramics can be described by a simple Debye model with one relaxation time. The main advantage of such presentation is a possibility to read from the plot values for both the static (
εs) and high frequency (
ε∞) limits of dielectric permittivity. The phenomena of dielectric relaxation, however, become significantly more complicated with increasing temperature. As the temperature increases, a straight line appears on the Cole–Cole diagram (for low frequencies).
Figure 4d demonstrates the frequency dependence of the real part (
ε′) of the complex permittivity for the BFTO ceramics at various temperatures chosen from the temperature range Δ
T = −120 °C–55 °C. It is clear from
Figure 4d that the BFTO ceramics exhibit a low-frequency dispersion. However, what may attract our attention is the step-like decrease in
ε′ that shifts to higher frequency with increasing the temperature, indicating the thermally activated mechanism.
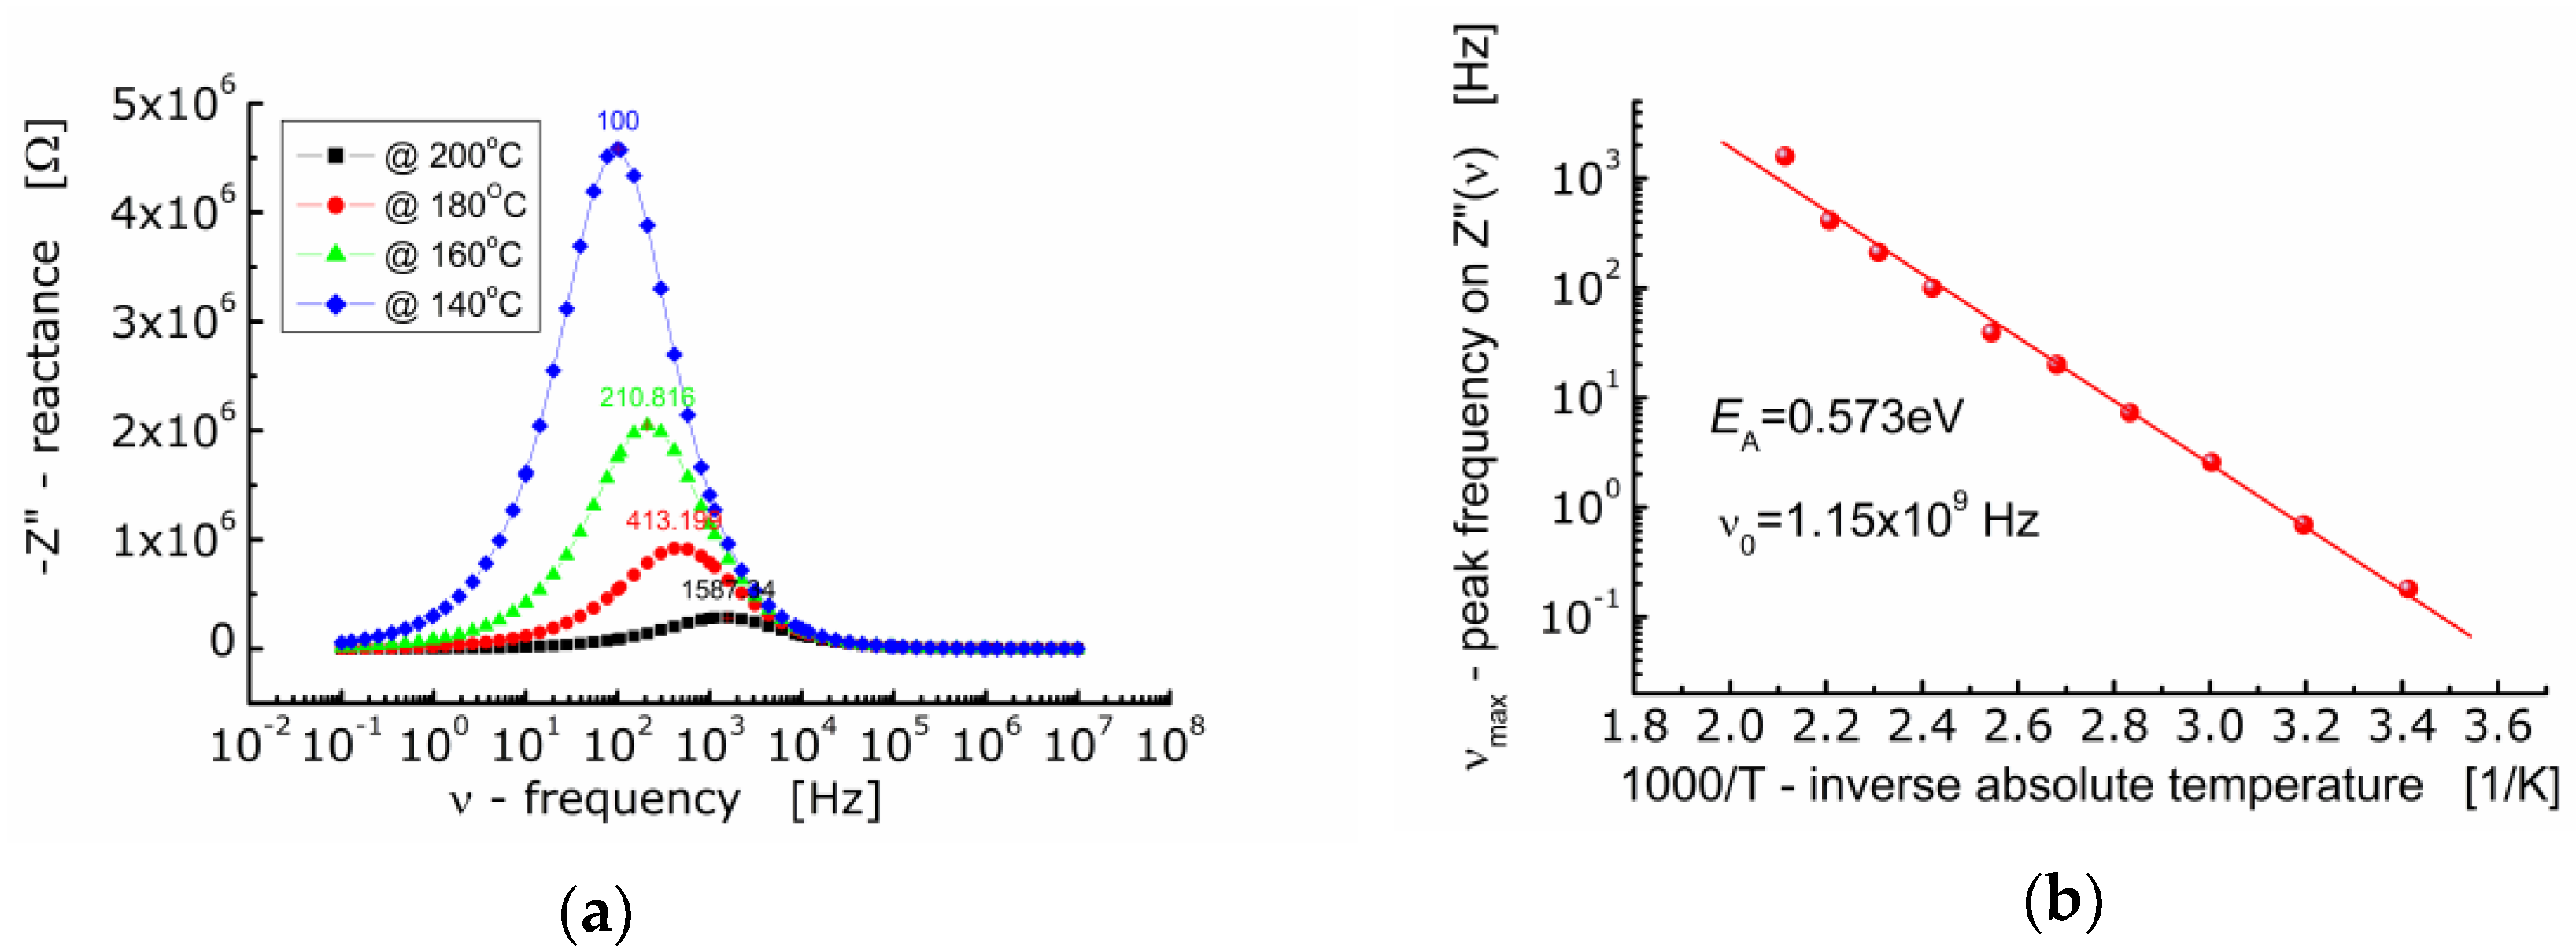
Figure 5a shows the dependence of the imaginary part of impedance (−
Z”) of BFTO ceramics on the frequency. One can see that as the temperature rises, the maximum of the
Z″-curve shifts towards higher values of frequency. The curves taken at different temperatures are not symmetrical and wide (FWHM ≈ 2 decades of frequency). The dependence of
νmax on inverse absolute temperature is shown in
Figure 5b. The activation energy corresponding to relaxation was found to be
EA = 0.573 eV.
Presentation of impedance data in the complex −
Z″−
Z′ plane (the so-called Nyquist diagram) or in the form of a spectroscopic dependence
Z″(
ν) (the so-called Bode diagram) allows to distinguish the contribution of the areas with the highest resistance to the total impedance response of the tested system. They are useful when the relaxation frequencies of polarization processes taking place inside the grains (
νb), at the grain boundaries (
νgb) and in the electrode areas (
νe), differ significantly (e.g.,
νb >>
νgb >>
νel). However, they may not be sufficient to define the contribution of the areas comprising the interior of the grains (bulk) with highly resistive grain boundaries. They are also of little use when the contributions from individual areas of the ceramic microstructure (grains and grain boundaries) overlap (see: flattened, deformed arcs in
Figure 4b). In such cases, it is advisable to represent the impedance data using an electric modulus function that is sensitive to input from low capacitance areas [
23].
3.2. Electric Modulus Analysis
In dielectric spectroscopy, a function called the electric modulus is often used. This function is complex and is defined as the reciprocal of the dielectric constant:
where
ε′,
ε″—real and imaginary part of dielectric constant, respectively.
The electric modulus function is neither a directly measurable quantity nor directly related to any microscopic physical processes. However, it completes the set of four interrelated to each other electrical relaxation functions, which are complex permittivity, complex conductivity, complex resistivity, and complex electric modulus [
24]. The advantages of an analysis based on the use of electrical modulus functions are apparent when there is a need to distinguish the electrode polarization phenomena or assess the relaxation time of electrical conductivity [
25]. Presentation of the impedance data in the form of a spectroscopic dependence of the electric modulus often allows to emphasize the contribution of polarization phenomena occurring inside the grains (bulk) and characterized by the lowest capacitance. A contribution of other polarization processes exhibiting small differences in capacitance may also be revealed [
23].
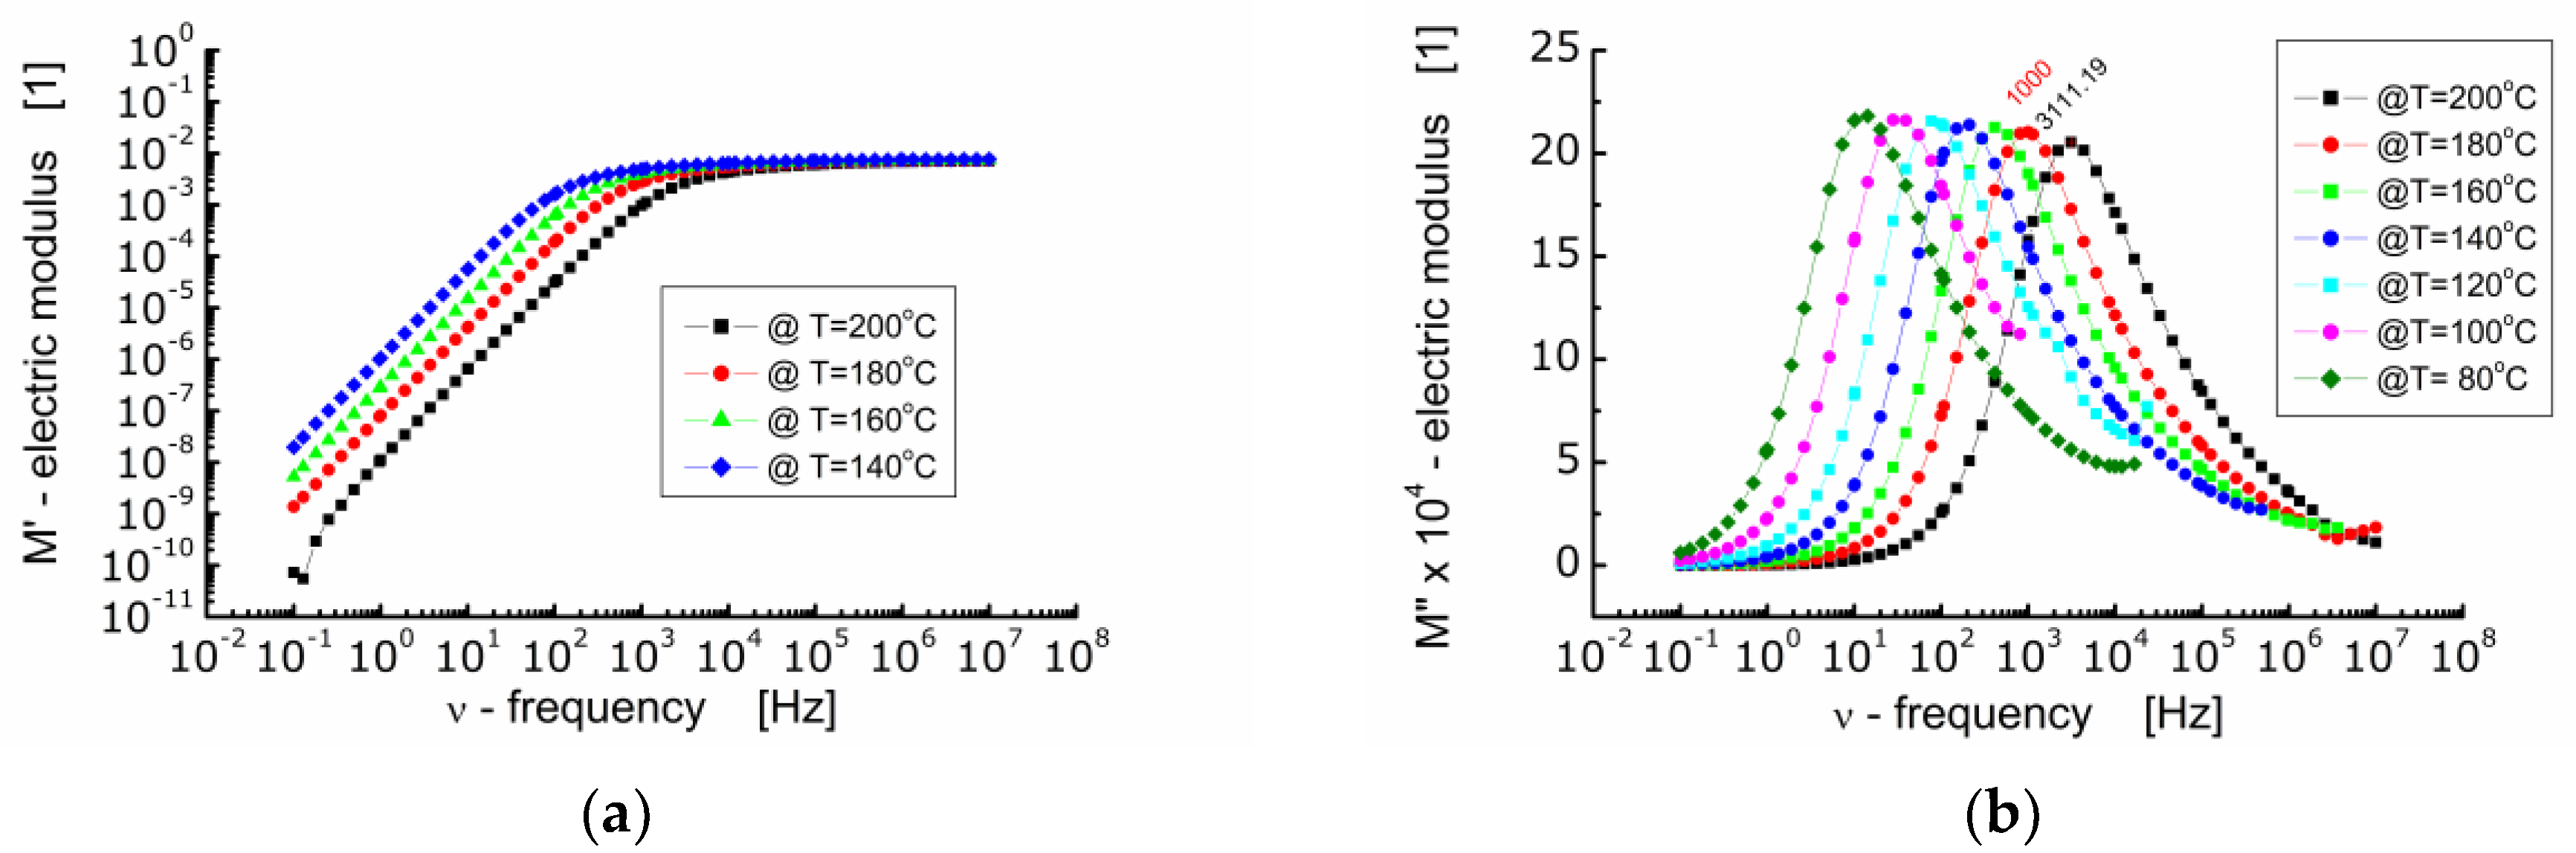
Figure 6 shows the dependence of the real part of electric modulus
M′ (
Figure 6a) and the imaginary part of electric modulus
M″ (
Figure 6b) on frequency at diverse temperatures for BFTO ceramics.
One can see from
Figure 6a that in the low frequency range
M′ reaches very low values. A drive of
M′ towards zero points out that the force restoring the flow of charge decays as the frequency of the measuring electric field decreases. At the same time, it indicates that the electrode and/or interfacial processes, which usually manifest themselves within the low frequency range, do not significantly contribute to the total dielectric response of BFTO ceramics [
26]. In the high frequency range,
M′ tends to a constant value the same for all measurements carried out at different temperatures. This in turn represents the reciprocal value of the frequency independent dielectric constant characterizing the bound charge response. The changeover point from a strong to weak dependence of
M′ on frequency shifts toward higher frequency with an increase in temperature.
The dependence of the imaginary part of the electric modulus on frequency presented in
Figure 6b allows to highlight the relaxation processes taking place inside the grains (bulk). It can be seen that as the temperature increases, the maxima on
M″ curves shift towards higher frequencies and the height of the maximum decreases slightly. It is worth noting that the dependence of
M″ on frequency should be of the Lorentz type if the relaxation process is the exponential one. Nevertheless, a deviation from the Debye behavior of relaxation phenomena in BFTO ceramics has been noted. The Lorentz fit of the
M″ spectroscopic dependence showed that the maxima are wide (FWHM was about 2 decades) and asymmetric. Two possible reasons for such behavior observed in BFTO ceramics can be assumed, namely, the presence of a distribution of relaxation times or stretching of the relaxation times [
25].
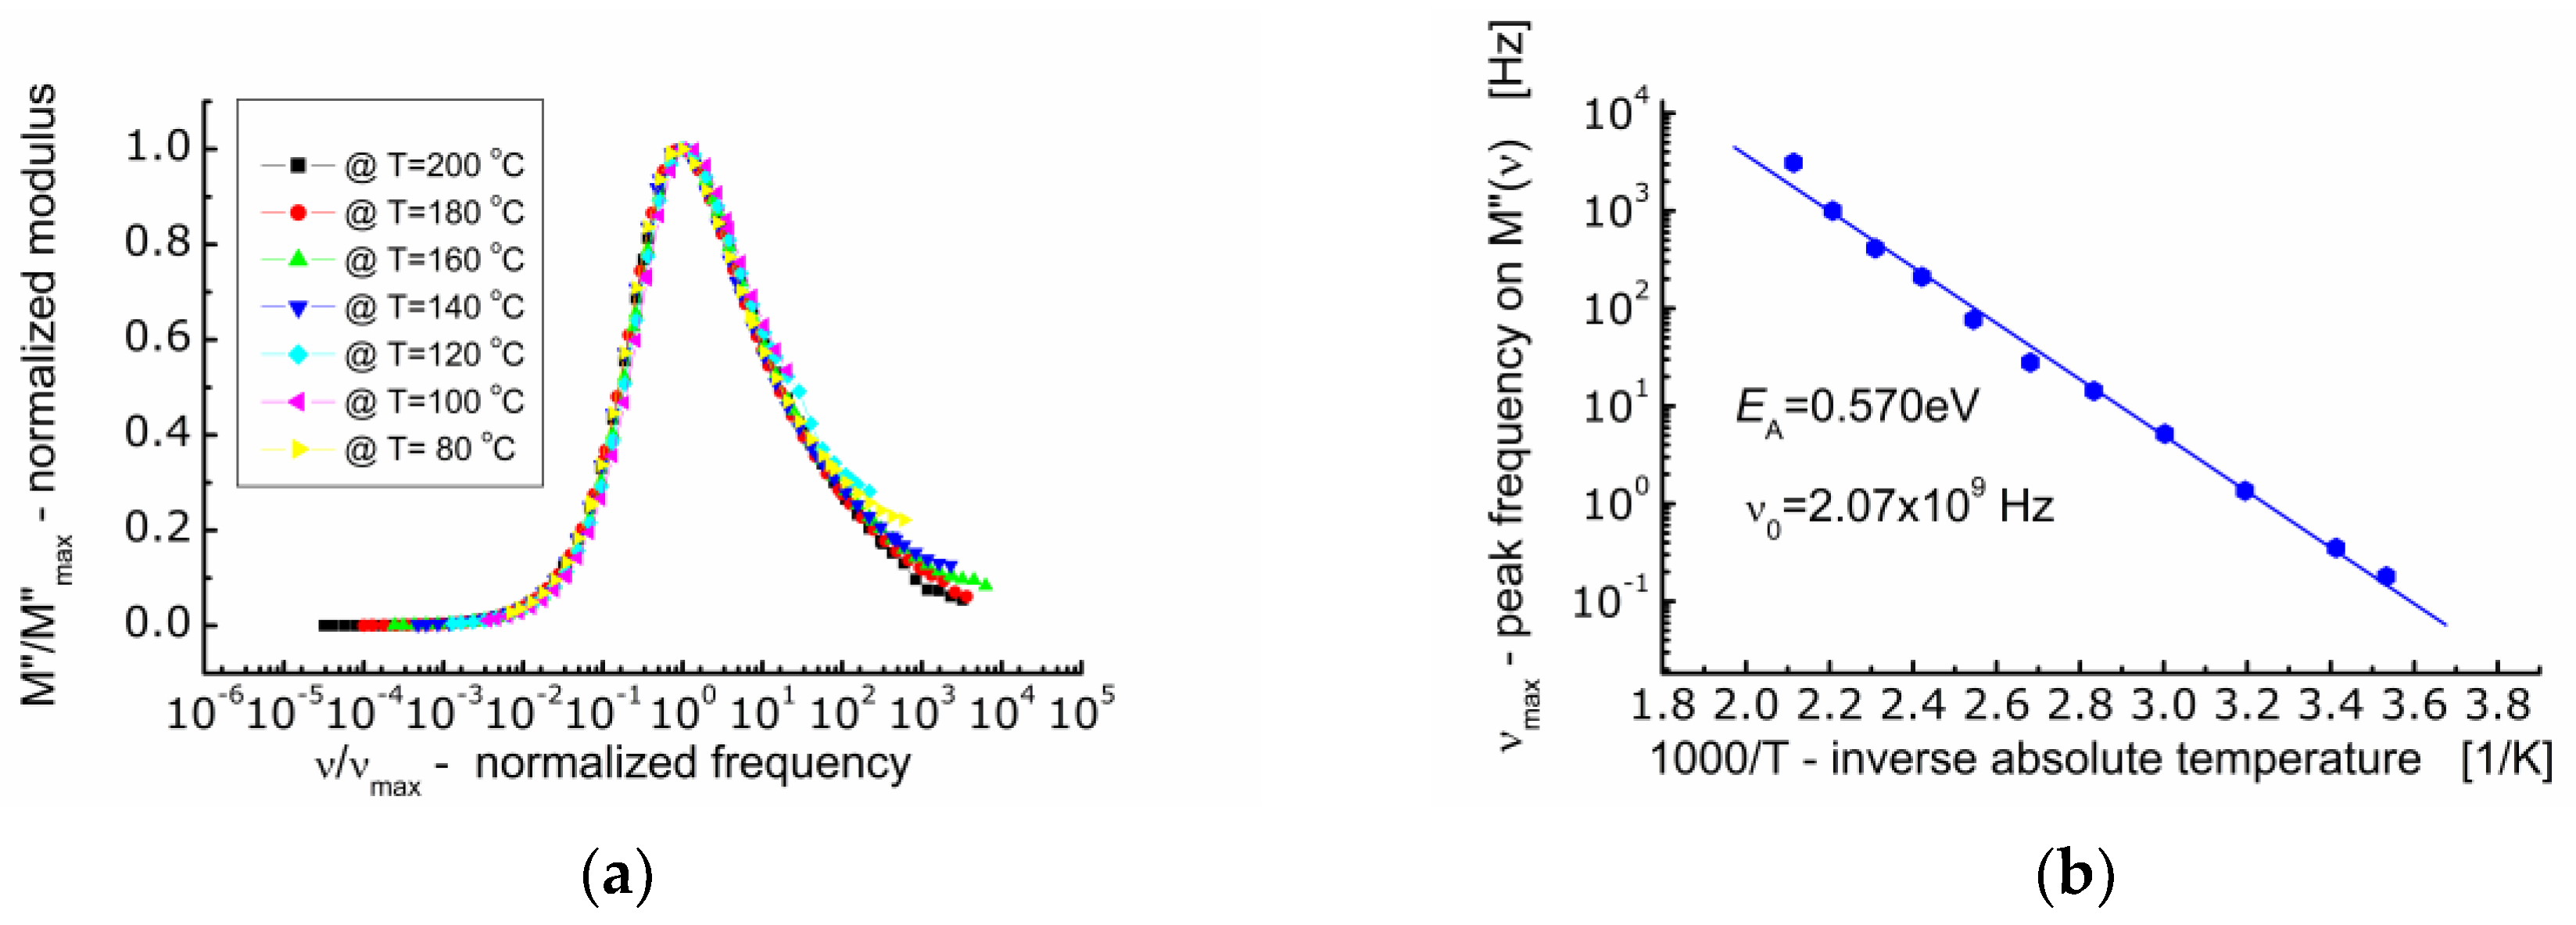
The spectroscopic
M″ data were normalized along the ordinate axis and abscissa axis (
Figure 7a). Normalization along the ordinate axis consisted in dividing the current values of
M″ by the maximum value of the imaginary component of the electric modulus (
M″
/Mmax). Normalization along the abscissa axis consisted in dividing the current value of the measuring frequency by the frequency corresponding to the maximum value of the imaginary component of the electric modulus (
ν/
νmax) known as the conduction relaxation frequency (
νmax). As a result of such data treatment, it was found that the profile of the spectroscopic curve of the electric modulus (
M″) does not change with temperature. All the
M″-curves were superimposed on one so-called primary curve.
The analysis of the dependence of the conduction relaxation frequency of BFTO ceramics on the inverse absolute temperature (
Figure 7b) allowed to calculate the activation energy of the process
EA = 0.570 eV.
3.3. Electric Conductivity Analysis
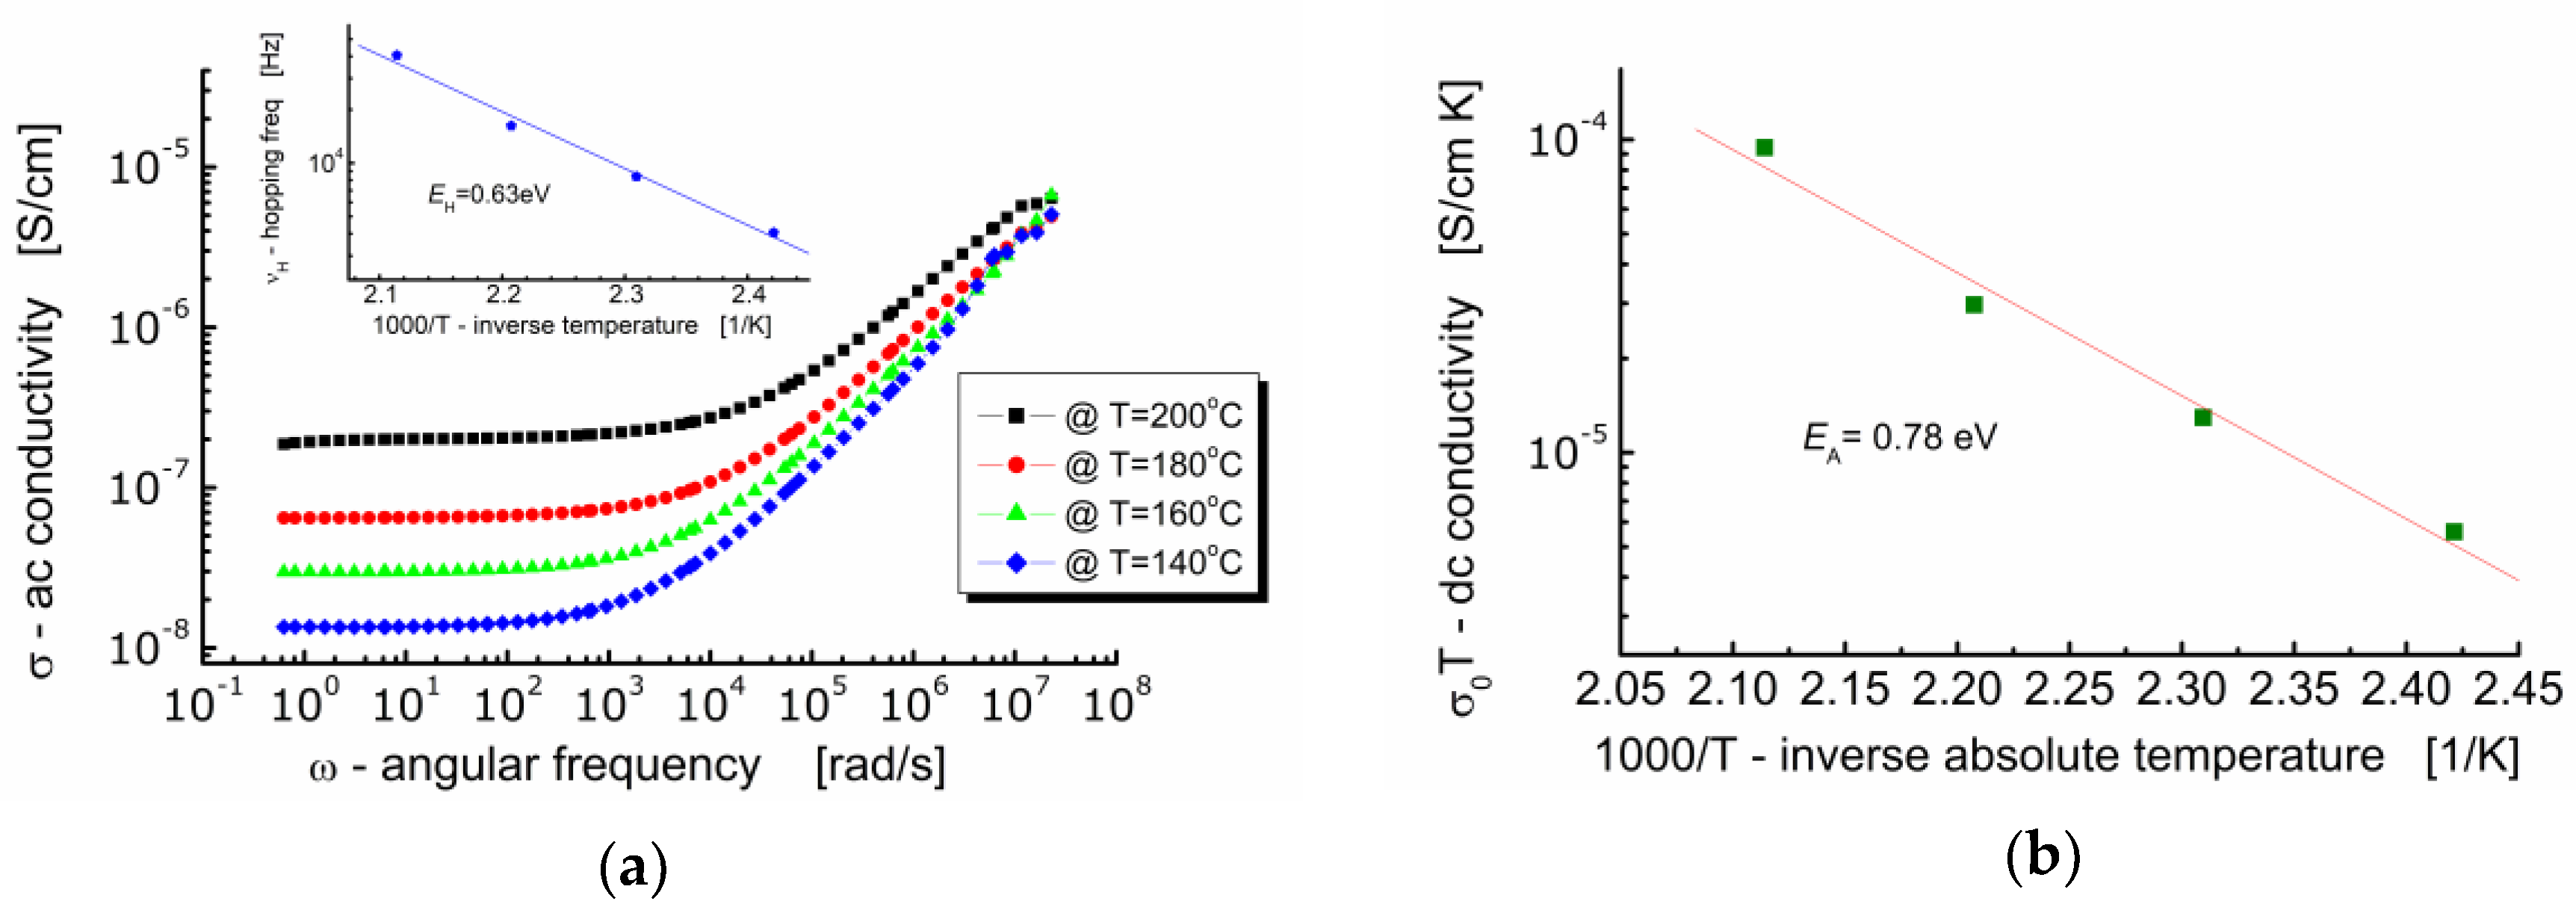
Figure 8a shows the dependence of
ac-conductivity (
σ) on angular frequency (
ω) at various temperatures for Bi
6Fe
2Ti
3O
18 ceramics. One can see in
Figure 8a that the behavior of BFTO ceramics is typical for ionic materials. It can be seen that in the low-frequency region, the electrical conductivity hardly depends on the frequency (plateau is present) and takes a value equal to the volume conductivity of the sample
σ(0). With an increase in the measuring frequency, a strong high-frequency dependence of the electric conductivity of the sample appears. On the other hand, the
dc-plateau is temperature dependent—the raise of conductivity is observed while temperature increases. The plot in
Figure 8b shows the dependence of conductivity
σ(0)
T (assuming a hopping conduction mechanism) on 1000/
T (
T is an absolute temperature).
The expression “hopping” refers to the sudden movement of an electric charge carrier from one location to another in its vicinity. The process of electric current conduction based on the hopping mechanism does not take place through the conduction band. It occurs through the use of localized energy states within the band gap and it is characteristic for dielectrics, like, e.g., BFTO ceramics.
It can be seen in
Figure 8a that the conductivity spectroscopic curve bent strongly starting from a characteristic point. At that bent point, not only the marked dependence of the conductivity on frequency begins, but also the relaxation of the conductivity starts. Geometrically, it can be found as the intersection of two tangent lines to the conductivity spectroscopic curve, namely, one tangent plotted in the low frequency region and the other tangent plotted in the high frequency region. The frequency that corresponds to that characteristic point is referred as a hopping rate (
νH), e.g., [
27]. Values of the hopping rate for BFTO ceramics were read out from
Figure 8a and plotted against inverse absolute temperature (the insertion in
Figure 8a).
The
dc-conductivity activation energy was found to be
EDC = 0.78 eV, whereas the hopping activation energy was found to be
EH = 0.63 eV. This result suggests that the charge carriers have to overcome the different energy barriers while conducting or relaxing [
28]. It can be explained in terms of a jump relaxation model [
29] which allows for two competing relaxation processes. The first is the forward-backward hop of the ion. The second is the relaxation of the crystal lattice in the immediate vicinity of the ion and the creation of a new energetically convenient vacant location for the ion to hop.
For most ceramic materials, the dependence of ionic conductivity on frequency can be described by Jonscher’s law of dielectric response [
30] as
where
σ(0) is the
dc-conductivity,
A is a constant, and the exponent
n is within 0 <
n < 1. Experimental data were subjected to the fitting procedure according to Equation (3).
One can see from
Table 1 that fitting quality parameters, namely,
χ2 (chi-squared) and
R2 (r-squared), state that the fitting quality improves with increasing temperature.
It is worth noting that conductivity is a fundamental physical quantity. Therefore, presentation and analysis of the dielectric data of ionic conductors using the concept of
ac-conductivity is preferable. For that reason, an attempt was made to scale the experimental data of
ac-conductivity according to the approach given in the literature [
31]. The results are shown in
Figure 9a.
It can be seen in
Figure 9a that the curves measured at different temperatures and showing the dependence of the normalized specific
ac-conductivity (
σ/
σDC) on the circular frequency divided by
σ(0)
T (i.e., ionic conductivity for hopping mechanism) lie on the same primary curve. The fact that the
ac-conductivity curves recorded at different temperatures are superimposed and their profile remains unchanged, allows us to conclude that the conductivity relaxation mechanism is independent on temperature [
25]. An experimental confirmation for conduction taking place according to the hopping mechanism is the linear dependence of conductivity, or electric resistivity in relation to the absolute temperature raised to the power (−1/4). One can see in
Figure 9b that the linear dependence is present but for temperature higher than
T ≈ −17 °C. Below that temperature, the dependence can hardly be fitted with a linear function exhibiting the same slope.
Considering the existence of structural defects such as oxygen deficiency, bismuth volatilization, and imperfect arrangement of Ti and Fe ions in the crystal lattice of BFTO ceramics valence transfer may occur between Fe
3+ and Fe
2+ in order to maintain the electrical neutrality of the system—as reported in literature [
12,
32]. Therefore, one may suppose that the relaxation was due to the hopping electron between Fe
2+ and Fe
3+, executing short-range movement. However, taking into consideration the atoms’ positions in the orthorhombic structure,
Fmm2 space group [
9], one can see that when Fe ions are located at Ti
4+ sites, the next neighbor oxygen can be vacant forming a neutral center which relaxes the hopping conduction ions.


