Abstract
To study the brittle/ductile behavior of concrete beams reinforced with low amounts of rebar and fibers, a new multi-scale model is presented. It is used to predict the flexural response of an ideal Hybrid Reinforced Concrete (HRC) beam in bending, and it is validated with the results of a specific experimental campaign, and some tests available in the technical literature. Both the numerical and the experimental measurements define a linear relationship between the amount of reinforcement and the Ductility Index (DI). The latter is a non-dimensional function depending on the difference between the ultimate load and the effective cracking load of a concrete beam. As a result, a new design-by-testing procedure can be established to determine the minimum reinforcement of HRC elements. It corresponds to DI = 0, and can be considered as a linear combination of the minimum area of rebar (of the same reinforced concrete beam) and the minimum fiber volume fraction (of the same fiber-reinforced concrete beam), respectively.
1. Introduction
In the technical literature, there is a strong interest in the use of Hybrid Reinforced Concrete (HRC) structures, reinforced by both steel bars and discrete fibers randomly dispersed in the cementitious matrix [1,2,3,4,5]. In addition to rigid pavements [6], HRC is often adopted in massive concrete members (e.g., precast and cast-in-situ tunnel linings) with the aim of reducing the amount of traditional rebar [7,8,9,10,11]. This is possible in structural elements containing low amounts of reinforcement, because the increment in strength provided by the fibers is comparable to that of rebar [12].
In concrete beams in bending (Figure 1a), having a massive cross-sectional area, the curve load P vs. midspan deflection δ (Figure 1b) can show an ultimate load Pu smaller than the effective cracking load Pcr* [8,9]. To be more precise, Pu corresponds to the failure of the reinforcing system (made of rebar and/or fibers), whereas Pcr* is the load that produces the first crack [13]. In the post-cracking stage of load controlling tests, if the reinforcement cannot bear the load carried by concrete, brittle failure occurs, as showed by the dashed curve (i) in Figure 1b. On the contrary, ductile failure of lightly reinforced concrete beams is guaranteed (see the curves (ii), (iii) of Figure 1b) when
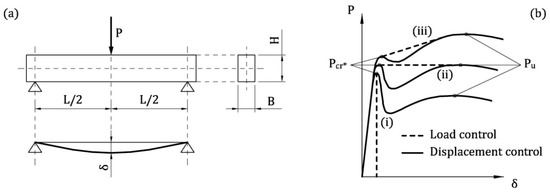
Figure 1.
Flexural behavior of concrete beam reinforced with rebar and/or fibers: (a) three point bending test; (b) applied load vs. midspan deflection curves in the cases of (i) brittle response, (ii) brittle/ductile transition, and (iii) ductile response.
In Lightly Reinforced Concrete (LRC) beams, the brittle failure is avoided by introducing a minimum reinforcement As,min, defined as the amount of steel rebar which guarantees the condition Pu = Pcr* [14,15,16,17]. The minimum reinforcement of LRC members should also ensure crack control in service [18], hence As,min provided by building codes generally fulfill both the ultimate (static) and the serviceability limit states [18,19,20]. Similarly, in Fiber-Reinforced Concrete (FRC) beams, the minimum fiber volume fraction Vf,min can be defined as As,min in LRC beams [21,22,23]. In other words, when the content of fiber is Vf,min, the transition from deflection-softening (i.e., the brittle response) to deflection-hardening (i.e., the ductile response) occurs [23,24].
If the minimum reinforcement of HRC beams is evaluated as in those LRC are, the resisting contribution of fibers is not exploited, making the use of fiber-reinforcement useless. This is particularly true in the case of massive structures, when the computation of As,min, performed in accordance with building code rules, leads to a large amount of steel rebar [8].
Even in several projects focused on the flexural behavior of HRC members, little research has been devoted, to date, to studying the problem of minimum hybrid reinforcement. For instance, the experimental campaigns performed by Barros et al. [25], Blanco et al. [26], Meda et al. [27], and Ning et al. [28] involved only beams with deflection hardening. On the other hand, Carpinteri et al. [29], Dancygier and Berkover [30], di Prisco et al. [31], Dupont [32], Falkner and Henke [33] and You et al. [34] analyzed under-reinforced concrete beams, without focusing on the minimum hybrid reinforcement.
The transition from the brittle to ductile behavior of HRC members was investigated deeply by Chiaia et al. [35], Liao et al. [3] and Mobasher et al. [36]. Although they demonstrated the possibility of reducing the amount of steel rebar in presence of fibers, a simple and univocal criterion for evaluating the minimum reinforcement of HRC beams cannot be found in the current literature. Thus, the introduction of a criterion for evaluating the minimum amount of hybrid reinforcement, made with rebar and fibers, is of practical interest. To fill this research gap, both numerical and experimental investigations on lightly reinforced HRC beams are performed herein. In particular, an approach to evaluate the minimum reinforcement ratio of HRC beams is described in the following sections. It can be considered as an extension to HRC of the design-by-testing procedure already proposed by Fantilli et al. [15,21,37] for LRC and FRC beams. The effectiveness of this new approach is corroborated not only by the experimental data measured by other authors, but also by new tests performed on 30 concrete beams reinforced with low amounts of rebar and/or fibers.
2. Multi-Scale Model for HRC Beams
A new general model is introduced herein to predict the flexural behavior of HRC beams. Specifically, both the bridging effects on crack surfaces given by rebar and fibers are analyzed through ideal ties (Figure 2), composed by the reinforcement and the surrounding cementitious matrix. This tie has a single orthogonal crack in the midsection (Figure 3a). At the micro scale (Figure 2a), the pull-out mechanism of the fiber (i.e., the solution of the tension-stiffening problem) provides the cohesive stress vs. crack width relationship of FRC. This relationship represents the response of cracked FRC surrounding the rebar of the HRC beam. The tension-stiffening problem can also be solved at the scale of the beam, in the rebar–FRC tie (Figure 2b), obtaining the flexural response of this structural element. Different from other approaches (see, for instance, Barros et al. [38]), in the proposed multi-scale model the strain localization of concrete in compression is neglected, because it generally does not occur in the presence of a low amount of reinforcement.
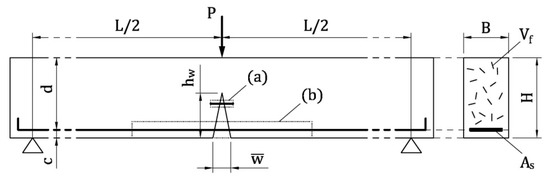
Figure 2.
Modelling the bridging effect of the reinforcing systems in a Hybrid Reinforced Concrete (HRC) beam under bending actions: (a) the ideal tie representing the fiber and the surrounding cementitious matrix; (b) the ideal tie representing the rebar surrounded by Fiber-Reinforced Concrete (FRC).
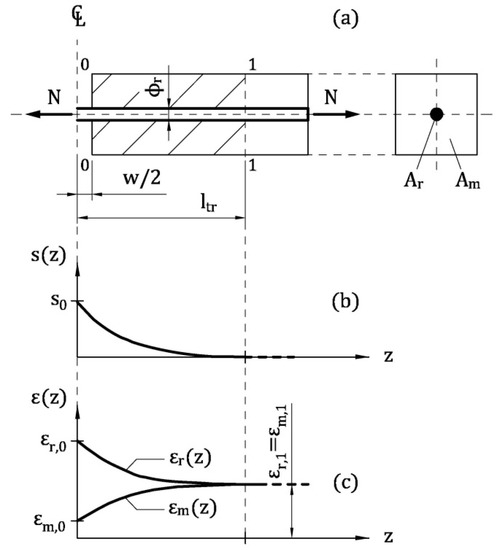
Figure 3.
The ideal tie composed by the reinforcement and the surrounding cement-based material: (a) longitudinal and transversal cross-section; (b) slip between reinforcement and matrix; (c) strains in reinforcement and concrete.
2.1. Formulation of the Tension-Stiffening Problem
To evaluate the post-cracking behavior of the reinforced concrete tie depicted in Figure 3a, a portion of this element, delimited by the cracked cross-section and the so-called Stage I cross-section, is investigated [15]. To be more precise, the cracked cross-section, labelled as 0-0 in Figure 3a, is assumed to be in the midspan of the tie and orthogonal to the reinforcement. Moreover, in the Stage I cross-section (i.e., the cross-section 1-1 in Figure 3a) the perfect bond between reinforcement and cementitious matrix is re-established. Within ltr (= transfer length, which the distance between the cross-sections 0-0 and 1-1), as the horizontal coordinate z increases, tensile stresses (and strains) transfer from reinforcement to the matrix, due to the bond-slip mechanism acting at the interface of the materials. The slip s between reinforcement and matrix vanishes in the Stage I cross-section (Figure 3b), where the strains of reinforcement εr and of matrix εm are both equal to that computed with the linear elastic theory (εr,1 = εm,1 in Figure 3c). At the scale of fiber (Figure 2a) and of beam (Figure 2b), the subscripts r = f = steel fiber and r = s = steel rebar, respectively. Similarly, m = t = cement-based matrix surrounding the fiber in tension and m = c = FRC matrix surrounding the rebar.
When 0 ≤ z < ltr, the interaction between reinforcement and matrix is described by the following equilibrium and compatibility equations
where σr = stress in the reinforcement; pr, Ar, ϕr = perimeter, area, and diameter of the reinforcement cross-section;τ = bond stress corresponding to the slip s between reinforcement and matrix.
Equations (2) and (3) are the equations of the tension-stiffening problem, which can be solved by introducing the following boundary conditions:
- In the cracked cross-section (at z = 0), the slip s0 = w/2, where w = crack width at level of reinforcement;
- At z = ltr < Lr/2 (where Lr = reinforcement length), s = 0 and ds/dz = 0 have to be imposed.
Moreover, both at the scale of fiber and at that of the beam, the bond-slip between reinforcement and cementitious matrix and the fracture mechanics of concrete in tension need to be considered [39].
2.1.1. At the Scale of Fiber
According to Fantilli et al. [21], in the ideal tie reproducing FRC (Figure 2a), fiber-reinforcement is a single straight steel fiber surrounded by the cross-sectional area of concrete matrix At, which, is in turn, a function of the fiber volume fraction Vf
where Af, ϕf = area and diameter of the fiber cross-section, respectively.
Both steel fiber and uncracked matrix are assumed in the linear elastic regime, whereas the cohesive stresses on the crack surfaces of the ideal tie are defined by the fictitious crack model shown in Figure 4. It consists of a bilinear stress vs. crack width relationship, σt-w, as proposed by Model Code 2010 [20]
where w1 = GF/fct; wc = 5 ∙ GF/fct; GF = 0.073 × fc 0.18 = fracture energy of concrete in tension in N/mm (fc = compressive strength of concrete in MPa); and fct = tensile strength of concrete (in MPa).
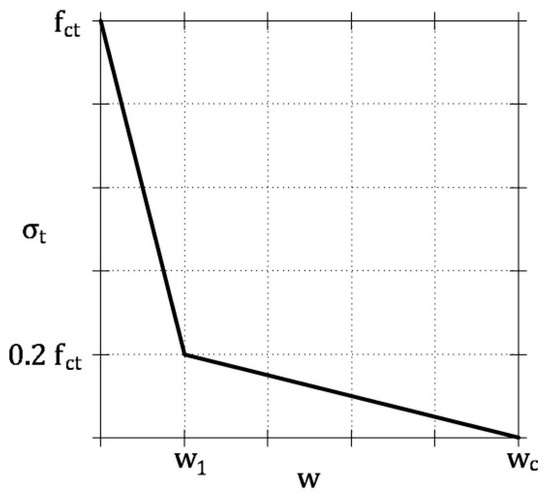
Figure 4.
Fictitious crack model proposed by Model Code 2010 [20].
Model Code 2010 [20] also suggests the mean value of fct, which can be estimated from the compressive strength (expressed in MPa)
Moreover, the interaction between fiber and concrete matrix is modelled with a bond-slip τ s relationship. For the sake of the simplicity, the model proposed by Fantilli and Vallini [40], originally developed for smooth steel fibers in a cementitious matrix, is adopted herein
where τmax = maximum bond stress; τf = residual bond stress; s1 = 0.1 mm; α = 0.5; and β = 2/mm.
The values of τmax and τf can be computed with the following formulae [40]
where the compressive strength of concrete is in MPa and the diameter of fiber is in mm.
With all these data, the tension-stiffening problem is solved within the domain 0 ≤ z < ltr, by using the iterative procedure summarized in the following points [21]:
- Assign a value to the crack width w in the midsection of the ideal tie (Figure 3a);
- By means of Equation (5), calculate the tensile stress of the matrix in the midsection σt,0;
- Under the hypothesis of linear elastic behavior of the concrete matrix, calculate the strain in midsection εt,0 (with Et = modulus of elasticity of concrete matrix)
- Assume a trial value to the axial load N (Figure 3a);
- By imposing the equilibrium in the cracked cross-section, the stress in the fiber σf,0 can be evaluated with the following equation
- Assuming the linear elastic behavior of the fiber (σf,0 has to be lower than fu, where fu = strength of fiber), calculate the strain in midsection εf,0where Ef = modulus of elasticity of the fiber.
- Considering Δl as a small portion of the unknown ltr, define zi = i ∙ Δl (where i = 1, 2, 3, …);
- For each i (or zi) calculate:
- -
- The bond stress τi, related to the slip si-1 [Equation (7)];
- -
- The strain of the fiber εf,i, based on Equation (2)
- -
- The strain εt,i of the matrix
- -
- The slip si by means of the finite difference form of Equation (3):
- When si ≅ 0, if εf,i ≠ εt,i change N and go back to step 6;
- Calculate the tensile stress σc referred to the cross-sectional area of the tie (i.e., At + Af)
For a given w, such a procedure calculates the corresponding stress of the cracked FRC. The complete σc-w curve can be obtained by varying the assigned crack width.
2.1.2. At the Scale of Beam
As in the case of LRC members [15], a block of HRC beam in three-point bending, which fails in the presence of a single flexural crack, is modelled. Within such a block, an ideal tie including the steel rebar in tension and the surrounding FRC can be identified (Figure 2b). In analogy with the fiber scale, this tie is delimited by the cracked cross-section (i.e., the midsection 0-0 in Figure 3) and the Stage I cross-section (i.e., the cross-section 1-1 in Figure 3), in which the perfect bond between rebar and FRC in tension is present.
In accordance with Chiaia et al. [35], strain decrements in rebar and strain increments in concrete at level of reinforcement can be assumed as
where εs and εc = strains in steel rebar and concrete at level of reinforcement; εs,0 and εc,0 = values of εs and εc in the cracked cross-section; εs,1 and εc,1 = values of εs and εc in the Stage I cross-section (evaluated according to the linear elastic theory); and χ = coefficient of similarity.
In uncracked concrete, linear elastic constitutive law is assumed in tension, whereas the ascending branch of the Sargin’s parabola [20] is the σc-εc relationship in compression (Figure 5a)
where k = Ec/Ec1 = plasticity number; Ec = 21,500 × (fc/10) 1/3 = tangent modulus of elasticity of concrete, at the origin of the stress (fc in MPa); Ec1 = fc/εc1 = secant modulus from the origin to the peak in compressive stress; εc1 = strain at the peak in stress; η = εc/εc1 = normalized compressive strain.
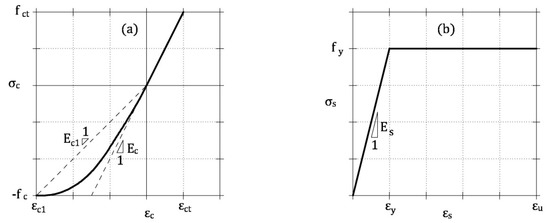
Figure 5.
Constitutive relationships for the materials of an HRC beam [20]: (a) ascending branch of the Sargin’s parabola for concrete in compression, and linear elastic law for uncracked concrete in tension; (b) elastic-perfectly plastic law for steel rebar.
The stress vs. strain relationship σs-εs of the steel rebar is modeled with the elastic-perfectly plastic constitutive law illustrated in Figure 5b [20]
where Es, fy, εy and εu are the modulus of elasticity, the yielding strength and strain, and the ultimate strain of steel rebar, respectively.
To describe the interaction at the interface between rebar and concrete, the bond–slip relationship proposed by Model Code 2010 [20] for ribbed bars is used (see Figure 6a)
where τmax = 2.5 × fc 0.5 (fc in MPa); τf = 0.4 ∙ τmax; α = 0.4; s1 = 1.0 mm; s2 = 2.0 mm; and s3 = cclear = clear distance between the ribs of rebar.
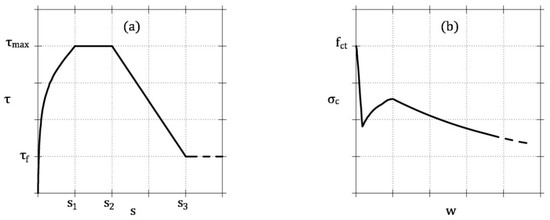
Figure 6.
Stresses at the interface between rebar and concrete in tension and on the crack surface: (a) bond-slip model proposed by Model Code 2010 [20]; (b) stress vs. crack width relationship obtained from the analysis at the scale of the fiber.
Finally, the fictitious crack model obtained with the procedure described at fiber scale, and depicted in Figure 6b, is adopted to model the behavior of the cracked FRC.
What follows is the procedure used to solve the tension-stiffening problem at level of rebar [15]:
- In the cracked cross-section, assign a value to the crack width at the bottom level (Figure 2);
- Assume a trial value for the crack depth hw (c < hw < H in Figure 2, where c = concrete cover, and H = beam depth);
- Assuming a linear crack profile (Figure 2), calculate the slip s0 in the cracked cross-section (where zi = 0)
- Calculate the cohesive stress σc,0(w) in cracked FRC at z = 0 by means of the stress vs. crack opening relationship obtained by modelling the ideal tie at the scale of the fiber (Figure 6b);
- In cross-section 0-0, assume a plane state of strain for uncracked FRC, and calculate εc,0 and εs,0;
- In the same cross-section, define the state of stress of uncracked FRC, σc,0, and of steel rebar, σs,0, by means of Equations (18) and (19);
- Calculate the result of axial stresses R in the cracked cross-section;
- If R ≠ 0, then change the state of strain and go back to step 6;
- Compute the internal bending moment M in the cracked cross-section;
- Considering Δl as a small portion of the transfer length, define zi = i ∙ Δl (where i = 1, 2, 3, …);
- For each i (or zi), calculate:
- -
- The bond stress τi, related to the slip si-1 (Equation (20));
- -
- The strain εs,i in the reinforcement, by using Equation (2) written in the finite difference form (where ϕs = diameter of rebar)
- -
- The similarity coefficient χi, by inverting Equation (17a)
- -
- The strain of concrete εc,i at level of rebar with Equation (17b);
- -
- The slip si by means of the finite difference form of Equation (3)
- When si ≅ 0, if εs,i ≠ εc,i, change hw and go back to step 3.
The previous procedure calculates the internal moment M corresponding to a given and, consequently, the complete M- by varying the assigned crack width.
3. Numerical Investigation
In what follows, the M- curves of several ideal HRC beams in bending are numerically computed. The aim is to evaluate the effects of reinforcement (i.e., rebar and/or fibers) on the brittle/ductile behavior of some hybrid beams, in order to identify the condition of minimum reinforcement. More precisely, 108 ideal HRC beams in three-point bending are taken into consideration. They are divided into 36 groups of three beams, having the same geometrical and material properties, but with different amounts of rebar or fibers. In particular, in 18 groups the area of rebar changes and the fiber volume fraction is constant, whereas in the remaining 18 groups As is the same and Vf varies. For all the groups, the width B and the span L of the beams are 0.5 and 6 times the depth H (which is equal to 200 and 400 mm), respectively. Three compressive strengths of concrete are considered (i.e., fc = 30, 45, and 60 MPa), and Et = Ec in all the beams. The same properties of steel rebar are assumed in all the groups (i.e., fy = 450 MPa, and Es = 210 GPa), whereas steel fibers (with Lf = 60 mm, fu = 1000 MPa, and Ef = 210 GPa) have the aspect ratio Lf/ϕf = 40, 60, and 80. Hence, for each group of HRC members, the minimum amount of reinforcement As,min, and of Vf,min, defined by Equation (1) in the presence of sole rebar, or sole fibers, are known. They are computed by applying the design-by-testing procedure proposed by Fantilli et al. [15,21,37] for LRC and FRC elements.
Table 1 summarizes the characteristics of all the beams, which are labeled with the acronym SX_CYY_AZZ_ϕW_K, where X depends on the beam depth (X = 1 for H = 200 mm, and X = 2 for H = 400 mm), YY is the concrete strength in MPa, ZZ is the fiber aspect ratio, W is the rebar diameter in mm, and K is a number (1, 2, or 3) associated with the different amounts of hybrid reinforcement in each of the 36 groups.

Table 1.
Properties of the ideal HRC beams of Groups 1–36.
As an example, the M- curves of the three beams of Group 9 are reported in Figure 7a. Two stationary points, concerning the effective cracking moment (Mcr*) and the ultimate bending moment (Mu), are clearly evident in each curve. The curve of the beam S1_C45_A60_ϕ5_1 shows a brittle response, because Mu < Mcr*, whereas the reinforcement of S1_C45_A60_ϕ5_2 is close to the minimum value as Mu ≅ Mcr*. Finally, the M- curve of S1_C45_A60_ϕ5_3 describes a typical ductile behavior with Mu > Mcr*. The same behavior can also be observed in the beams of Group 10, which are reported in Figure 7c,d.
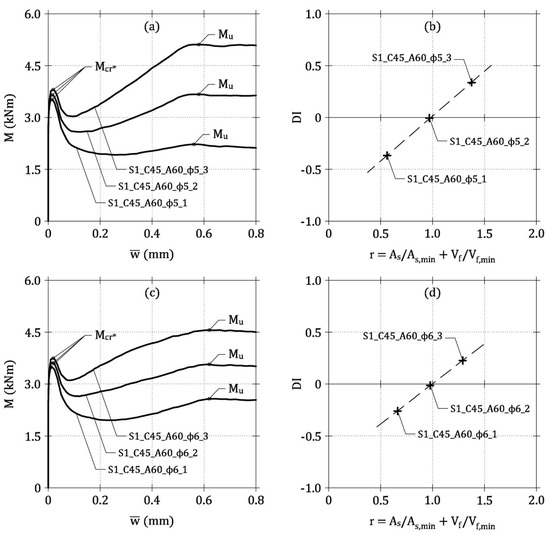
Figure 7.
Application of the general model: (a) M- curves of the ideal beams of Group 9; (b) DI-r relationship of the ideal beams of Group 9; (c) M- curves of the ideal beams of Group 10; (d) DI-r relationship of the ideal beams of Group 10.
Numerical Brittle/Ductile Assessment
As in the case of LRC and FRC beams [15,21,37], the brittle/ductile behavior of HRC beams can be evaluated by means of the following ductility index (DI)
Based on Equation (1), DI assumes positive values for lightly reinforced beams, showing a ductile response (i.e., when the failure of reinforcement does not occur), whereas under-reinforced concrete members exhibit DI < 0. Accordingly, the minimum amount of hybrid reinforcement (or, equivalently, the brittle/ductile transition) can be identified by imposing DI = 0.
Since both Mu (or Pu) and Mcr* (or Pcr*) depend on the amount of reinforcement in HRC beams, DI should be in turn a function of As and Vf. In this regard, the following reinforcement ratio r can be introduced as the parameter governing the brittle/ductile transition [41]
Specifically, the area As and the fiber content Vf of HRC beam are linearly combined with the minimum amounts As,min and Vf,min, coming from the corresponding LRC and FRC beams. In other words, As,min is the area of rebar defined by the brittle/ductile transition of the concrete beam, when it is reinforced with only steel rebar. Analogously, Vf,min is the fiber volume fraction necessary to satisfy the requirement of Equation (1) in fiber-reinforced concrete beams. As As,min and Vf,min are defined for the specific type of beam, all the related parameters are automatically taken into account within r. In such a way, the non-dimensional variable r is normalized with respect to any geometrical and mechanical property. In particular, r = 1 for LRC beam reinforced with As = As,min [15], as well as for a FRC beam containing a quantity of fibers Vf = Vf,min [21]. Thus, in concrete beams, under-bending actions, As,min and Vf,min assume the same mechanical function, according to Fantilli et al. [37].
The definition of r given by Equation (26) is also in agreement with the findings of Falkner and Henke [33], who demonstrated that the effects produced by rebar and fibers in HRC members can be superposed at ultimate limit state. Hence, Mu (or Pu), and DI as well, can be considered a function of r, if Mcr* (or Pcr*) does not vary with the amount of reinforcement.
As in the case of LRC and FRC beams, within each group of beams (e.g., those of Group 9 in Figure 7), a linear relationship between DI and r is attained (see Figure 7b) and the intersection between the line DI-r and the horizontal axis (i.e., DI = 0) occurs when r ≅ 1, corresponding to the minimum hybrid reinforcement. Thus, the following symbolic equation can be written
where the slope ζ is equal to 1 in the presence of only rebar [15], and ζ = 0.7 in FRC beams [21].
If LRC and FRC beams are considered as two limit cases, a range delimited by two lines of Equation (27) (i.e., with ζ = 1 and ζ = 0.7) defines the DI-r relationships of HRC beam (Figure 8a). Indeed, by reporting in a single diagram all the [DI, r] couples computed in the ideal HRC beams of Table 1, almost all of them fall within this range (Figure 8b). The slope ζ of the least square regression line of all the numerical data is equal to 0.8, and, therefore, it is comprised between the values computed for LRC and FRC beams [15,21].
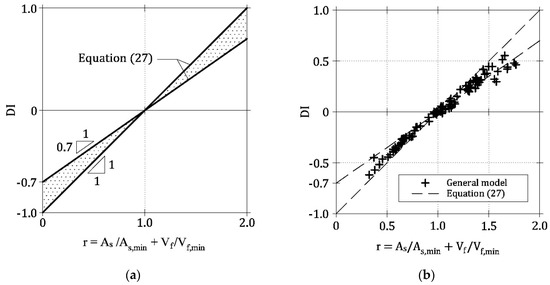
Figure 8.
(a) Proposed DI-r envelope for HRC beams [Equation (27)] and (b) comparison with the results of the general model.
4. Experimental Investigation
To check the effectiveness of the range depicted in Figure 8, an experimental campaign was carried out, in cooperation with Cemex Research Group, with the aim of studying the flexural behavior of HRC beams. Several combinations of rebar and fibers were adopted to reinforce 30 concrete beams. As for conventional reinforcement, steel rebar having ϕs = 6 mm, fy = 527 MPa, and fu = 623 MPa were used. Moreover, two types of steel fibers with hooked-ends were used in six different concrete mixtures: short fibers-Type 1 (ϕf = 0.38 mm, Lf = 30 mm, and fu = 3070 MPa), and long fibers-Type 2 (ϕf = 0.71 mm, Lf = 60 mm, and fu = 2600 MPa). The compositions of the mixtures (labelled with the letters from A to F) are reported in Table 2. In particular, for both the types of fiber, a reference plain concrete and two FRC mixtures (with Vf = 0.50 and 0.75%) were tailored by mixing the components in 100 L planetary mixer for 180 s.
Table 2.
Material components (in 1 m3) of the concrete mixtures used in this research project.
As reported in Table 3, LRC beams were cast for the two mixtures without fibers (i.e., series A and series D), whereas both FRC and HRC beams were made with all the other mixtures (i.e., series B, C, E, and F). With these mixtures, 10 series of three un-notched prismatic beams, having a length of 700 mm and a square cross-section of 150 × 150 mm, were cast (Figure 9). Such beams are equal to those tested by Falkner and Henke [33] in four-point bending. Each series of beams was labelled by two letters, referred to the concrete mixture and to the presence (R), or the absence (P), of a single rebar (As = 28 mm2).
Table 3.
Amounts of rebar and fibers used to reinforce the beams tested in this research project.
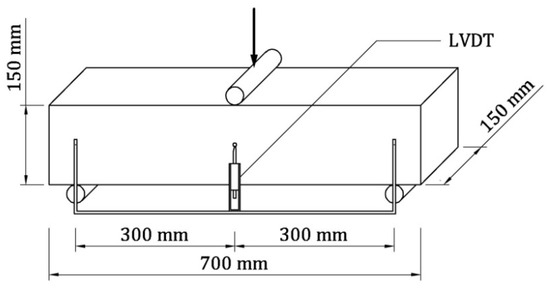
Figure 9.
Three-point bending test on un-notched prismatic specimen carried out in the experimental investigation on HRC beams.
The beams were tested in three-point bending by using an MTS testing machine. As linear supports (at a distance of 600 mm), and for the application of load as well, steel cylinders were used (see Figure 9). A load cell of 100 kN was used to apply the load P, and two LVDTs measured the midspan deflection δ on the two sides of the beam (depurated by the support settlements). The bending tests were performed under displacement control, at a velocity of 0.08 mm per minute up to the maximum load. Afterword, the velocity increased to 0.20 mm per minute.
To measure the compressive strength of the mixtures, cylindrical specimens (with a diameter of 150 mm and a height of 300 mm) were also tested in uniaxial compression. The cylinders were tested 28 days after casting with a Galdabini testing machine, having a load capacity of 5000 kN. During all the test, the velocity of the stroke was kept constant, at 0.60 mm per minute. The P-δ curves of the 30 concrete beams are illustrated in Figure 10, where they are grouped in the 10 series of beams as described in Table 3.
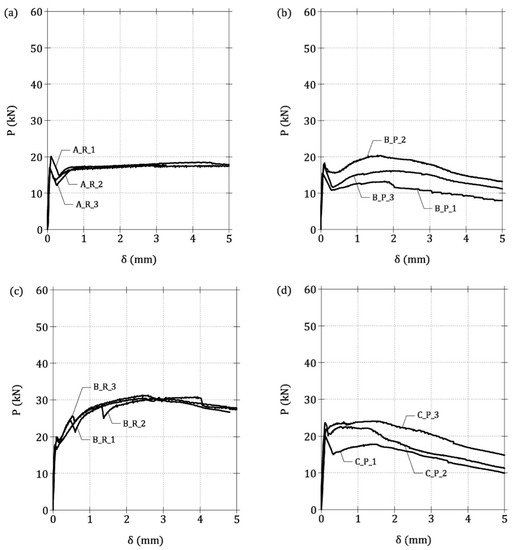
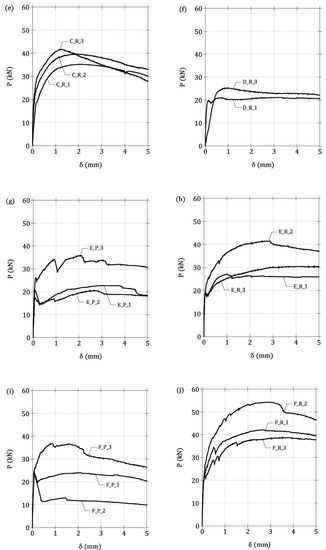
Figure 10.
Load vs. deflection curves from three point bending tests. (a) A_R series, (b) B_P series, (c) B_R series, (d) C_P series, (e) C_R series, (f) D_R series, (g) E_P series, (h) E_R series, (i) F_P series and (j) F_R.
Specifically, Figure 10a represents the curves of the LRC beams cast with mixture A, whereas the curves of the beams containing short fibers (i.e., mixtures B and C), with and without rebar, are shown in Figure 10b–e. Similarly, Figure 10f illustrates the P-δ curves of the LRC beams made with the mixture D, and in Figure 10g–j the mechanical responses of the beams containing long fibers (i.e., mixtures E and F), with and without rebar, are shown.
Concerning the LRC beams (i.e., A_R and D_R), a ductile behavior can be observed in the diagrams of Figure 10a,f, because the beams were able to bear the maximum load after cracking. For the FRC beams with short and long fibers (i.e., B_P, C_P, E_P and F_P), the softening branch after the cracking is followed by an hardening stage, as depicted in the P-δ curves of Figure 10b,d,g,i, respectively. On the other hand, when a rebar is added to the previous elements, the HRC beams (i.e., B_R, C_R, E_R and F_R) exhibit a clear deflection hardening (post-cracking load is greater than cracking load in Figure 10c,e,h,j). A certain dispersion of the experimental data can be noticed in the diagrams of Figure 10, especially in the beams B_P, C_P, E_P, and F_P. In these beams, due to the absence of rebar, the random dispersion and orientation of fibers play a fundamental role on the post-cracking bearing capacity. Such a dispersion is larger in beams having a small width and depth (only 150 mm in this case).
Experimental Brittle/Ductile Assessment
According to Fantilli et al. [37], the minimum amount of reinforcement of both LRC and FRC beams can be determined by applying the same design-by-testing approach, summarized by the following formulae
where As and Vf are the amounts of rebar and fibers in the tested beam, and ζ can be assumed, for the sake of the simplicity, 0.8 for both LRC and FRC beams. Hence, the values of As,min and Vf,min can be determined for the LRC and FRC beams associated to the HRC beam, making, in turn, the evaluation of r (with Equation (26)) be possible.
In addition to the specimens tested herein, this procedure is also applied to the results of some experimental campaigns on HRC elements in bending performed by Carpinteri et al. [42], Dancygier and Berkover [30], di Prisco et al. [31], Dupont [32], Falkner and Henke [33], and You et al. [34]. With the exception of the three-point bending tests carried out by Carpinteri et al. [42], in all the other experimental investigations, the beams were tested in four-point bending. For each beam, DI is calculated with Equation (25) and, after computing As,min and Vf,min for HRC beams (Equations (28) and (29)), r is also evaluated (Equation (26)). The values of DI and r are reported in Table 4.
Table 4.
Evaluation of r and DI in the HRC beams tested in this research project and in other experimental campaigns.
The experimental values of DI, obtained for 25 HRC beams, are plotted in Figure 11 as a function of r. In this figure, experimental data are compared to the range defined by Equation (27) when ζ = 0.7 and ζ = 1. According to the numerical results, as most of the points representing the experimental data fall within the range, the brittle/ductile transition (i.e., DI = 0) really occurs when r ≅ 1. Therefore, the simplified hypotheses used in the general model (fiber symmetrically and orthogonally positioned with respect to crack surfaces, linear crack profile in HRC beam, etc.) seem to be irrelevant to assess the brittle/ductile behavior of HRC beams, as already found by Fantilli et al. [15,21] in LRC and FRC beams.
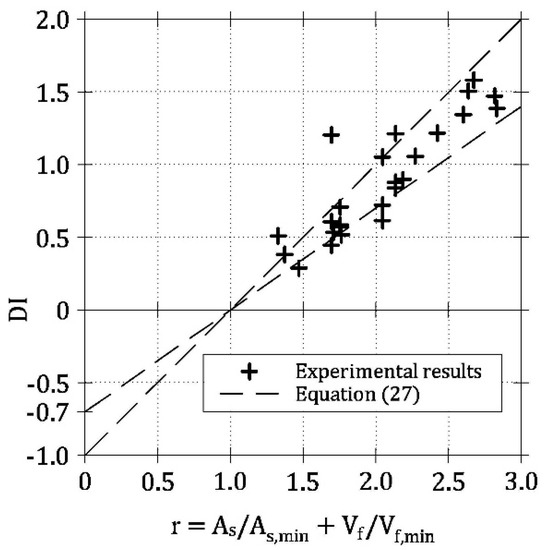
Figure 11.
Proposed DI-r range [Equation (27)] and the results of some experimental campaigns.
From a practical point of view, it is useful to analyze all the ways to reinforce HRC beam in order to satisfy the requirement Pu = Pcr* or DI = 0. Indeed, it is sufficient to impose r = 1 into Equation (26), as revealed by both numerical and experimental results (Figure 8b and Figure 11, respectively). Accordingly, the minimum reinforcement to be used in HRC members is given by any linear combination of As,min and Vf,min (Figure 12)
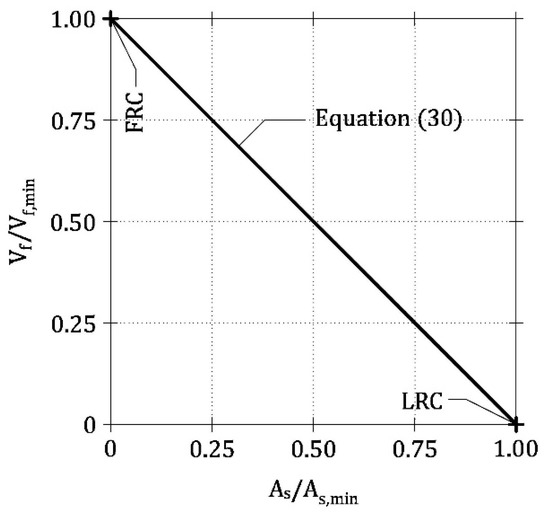
Figure 12.
The condition of minimum ductility (i.e., DI = 0) given by Equation (30), when rebar and fibers are used to reinforce concrete beams.
Hence, by combining rebar and fibers, it is possible to reduce the minimum amount of reinforcement As,min traditionally required by building codes for LRC beams [18,19,20]. This is in accordance with the results of some previous theoretical models [35,36] and with the recommendations given by Model Code 2010 [20]. In addition, Equation (30) is similar to the formulation proposed by Liao et al. [3], even if the terms As,min and Vf,min are herein evaluated by testing LRC and FRC full-scale members, rather than small beam specimens. On the other hand, the use of non-dimensional parameters in Equations (25)–(30) makes the geometrical dimensions of the beam irrelevant. This is a novelty of the proposed approach, which correctly predicts the experimental results without including any size-effect law [42,43]. As a consequence, in design-by-testing approaches, used to evaluate the minimum hybrid reinforcement of real structures [44], the transition between small specimens and real structures is automatically included within the ductility index.
5. Conclusions
The numerical and experimental analyses reported in this paper lead to the following conclusions:
- The brittle/ductile flexural behavior of hybrid reinforced concrete beams HRC can be described by the ductility index DI, which, in turn, depends on the difference between the ultimate load and the effective cracking load of a beam;
- The hybrid reinforcement of lightly reinforced concrete beams can be quantified by means of r, which is a linear combination of the area of rebar and the volume of fibers, both normalized with respect to the minimum reinforcement of LRC and FRC beams, respectively;
- Both numerical and experimental investigations performed on HRC beams reveal the existence of a range in the DI vs. r diagram. The borders of this range are two linear DI-r functions reproducing the behavior of LRC and FRC beams, respectively;
- The minimum hybrid reinforcement, corresponding to DI = 0, is a linear combination of the minimum amount of rebar and the minimum fiber volume fraction required for LRC and FRC beams, separately. Accordingly, the minimum reinforcement of LRC beams can be reduced by the presence of fibers.
Further theoretical and experimental studies will be devoted to extending the current approach to HRC beams under shear and bending actions, and to the brittle/ductile response of other structures (e.g., slabs on ground).
Author Contributions
Conceptualization, A.P.F. and A.G.; methodology, A.P.F. and A.G.; software, A.P.F. and A.G.; validation, A.P.F. and A.G.; formal analysis, A.P.F. and A.G.; investigation, A.P.F. and A.G.; resources, A.P.F. and A.G.; data curation, A.P.F. and A.G.; writing—original draft preparation, A.P.F. and A.G.; writing—review and editing, A.P.F. and A.G. All authors have read and agreed to the published version of the manuscript.
Funding
This research received no external funding.
Acknowledgments
The authors would like to thank Cemex Research Group for the technical support in beams preparation, and for the continuous collaboration in research activities.
Conflicts of Interest
The authors declare no conflict of interest.
References
- di Prisco, M.; Colombo, M.; De Wilder, K.; Vandewalle, L. A new FRC solution for a partially prefabricated industrial deck. In Proceedings of the 9th RILEM International Symposium on Fiber Reinforced Concrete (BEFIB 2016), Vancouver, BC, Canada, 19–21 September 2016; pp. 1407–1421. [Google Scholar]
- Facconi, L.; Plizzari, G.A.; Minelli, F. Hybrid reinforcement (rebars + fibers) for elevated slabs. In Proceedings of the 9th RILEM International Symposium on Fiber Reinforced Concrete (BEFIB 2016), Vancouver, BC, Canada, 19–21 September 2016; pp. 969–979. [Google Scholar]
- Liao, L.; de la Fuente, A.; Cavalaro, S.; Aguado, A. Design procedure and experimental study on fibre reinforced concrete segmental rings for vertical shafts. Mater. Des. 2016, 92, 590–601. [Google Scholar] [CrossRef]
- Tiberti, G.; Trabucchi, I.; Al Hamaydeh, M.; Minelli, F.; Plizzari, G. Crack control in concrete members reinforced by conventional rebars and steel fibers. IOP Conf. Ser. Mater. Sci. Eng. 2017, 246, 012008. [Google Scholar] [CrossRef]
- Yoo, D.Y.; Banthia, N.; Yoon, Y.S. Impact resistance of reinforced ultra-high-performance concrete beams with different steel fibers. ACI Struct. J. 2017, 114, 113–124. [Google Scholar] [CrossRef]
- Pujadas, P.; Blanco, A.; de la Fuente, A.; Aguado, A. Cracking behavior of FRC slabs with traditional reinforcement. Mater. Struct. 2012, 45, 707–725. [Google Scholar] [CrossRef]
- Caratelli, A.; Meda, A.; Rinaldi, Z. Design according to MC2010 of a fibre-reinforced concrete tunnel in Monte Lirio, Panama. Struct. Concr. 2012, 13, 166–173. [Google Scholar] [CrossRef]
- Chiaia, B.; Fantilli, A.P.; Vallini, P. Combining fiber-reinforced concrete with traditional reinforcement in tunnel linings. Eng. Struct. 2009, 31, 1600–1606. [Google Scholar] [CrossRef]
- de la Fuente, A.; Pujadas, P.; Blanco, A.; Aguado, A. Experiences in Barcelona with the use of fibres in segmental linings. Tunn. Undergr. Space Technol. 2012, 27, 60–71. [Google Scholar] [CrossRef]
- Meng, G.; Gao, B.; Zhou, J.; Cao, G.; Zhang, G. Experimental investigation of the mechanical behavior of the steel fiber reinforced concrete tunnel segment. Constr. Build. Mater. 2016, 126, 98–107. [Google Scholar] [CrossRef]
- Plizzari, G.A.; Tiberti, G. Steel fibres as reinforcement for precast tunnel segments. Tunn. Undergr. Space Technol. 2006, 21, 438–439. [Google Scholar] [CrossRef]
- Facconi, L.; Conforti, A.; Minelli, F.; Plizzari, G. Flexural Design of Elevated Slabs Made of FRC According to fib Model Code 2010: A Case Study. Lect. Notes Civ. Eng. 2020, 42, 570–584. [Google Scholar]
- Maldague, J.C. Établissement des Lois Moments-Courbures. Ann. l’Institut Tech. Batim. Trav. Publics 1965, 213, 1170–1218. [Google Scholar]
- Bosco, C.; Carpinteri, A.; Debernardi, P.G. Minimum reinforcement in high-strength concrete. ASCE J. Struct. Eng. 1990, 116, 427–437. [Google Scholar] [CrossRef]
- Fantilli, A.P.; Chiaia, B.; Gorino, A. Minimum reinforcement and ductility index of lightly reinforced concrete beams. Comput. Concr. 2016, 18, 1175–1194. [Google Scholar]
- Accornero, F.; Rubino, A.; Carpinteri, A. Ductile-to-brittle transition in fibre-reinforced concrete beams: Scale and fibre volume fraction effects. Mater. Des. Process. Commun. 2020, 1–11. [Google Scholar] [CrossRef]
- Ruiz, G.; Elices, M.; Planas, J. Size Effect and Bond-Slip Dependence of Lightly Reinforced Concrete Beams. Eur. Struct. Integr. Soc. 1999, 24, 67–97. [Google Scholar]
- ACI—American Concrete Institute. 318–14: Building Code Requirements for Structural Concrete and Commentary; American Concrete Institute: Farmington Hills, MI, USA, 2014. [Google Scholar]
- CEN—European Committee for Standardization. EN 1992-1-1: Eurocode 2: Design of Concrete Structures—Part 1-1: General Rules and Rules for Buildings; European Committee for Standardization: Brussels, Belgium, 2004. [Google Scholar]
- Fib—International Federation for Structural Concrete. fib Bulletin: Model Code 2010; Final Draft; International Federation for Structural Concrete: Lausanne, Switzerland, 2012; Volume 1, p. 65. [Google Scholar]
- Fantilli, A.P.; Chiaia, B.; Gorino, A. Fiber volume fraction and ductility index of concrete beams. Cem. Concr. Compos. 2016, 65, 139–149. [Google Scholar] [CrossRef]
- Liao, L.; de la Fuente, A.; Cavalaro, S.; Aguado, A. Design of FRC tunnel segments considering the ductility requirements of the Model Code 2010. Tunn. Undergr. Space Technol. 2015, 47, 200–210. [Google Scholar] [CrossRef]
- Naaman, A.E. Strain hardening and deflection hardening fiber reinforced cement composites. In Proceedings of the 4th International RILEM Workshop on High Performance Fiber Reinforced Cement Composites, University of Michigan, Ann Arbor, MI, USA, 16–18 June 2003; pp. 95–113. [Google Scholar]
- Facconi, L.; Minelli, F. Verification of structural elements made of FRC only: A critical discussion and proposal of a novel analytical method. Eng. Struct. 2017, 131, 530–541. [Google Scholar] [CrossRef]
- Barros, J.A.O.; Santos, S.; Lourenço, L.; Gonçalves, D. Flexural behaviour of steel fibre reinforced self-compacting concrete laminar structures. In Proceedings of the 1st Spanish Congress on Self-Compacting Concrete, Valencia, Spain, 18–19 February 2008; pp. 567–578. [Google Scholar]
- Blanco, A.; Pujadas, P.; de la Fuente, A.; Cavalaro, S.; Aguado, A. Application of constitutive models in European codes to RC-FRC. Constr. Build. Mater. 2013, 40, 246–259. [Google Scholar] [CrossRef]
- Meda, A.; Minelli, F.; Plizzari, G.A. Flexural behaviour of RC beams in fibre reinforced concrete. Compos. Part B 2012, 43, 2930–2937. [Google Scholar] [CrossRef]
- Ning, X.; Ding, Y.; Zhang, F.; Zhang, Y. Experimental study and prediction model for flexural behavior of reinforced SCC beam containing steel fibers. Constr. Build. Mater. 2015, 93, 644–653. [Google Scholar] [CrossRef]
- Carpinteri, A.; Cadamuro, E.; Ventura, G. Fiber-reinforced concrete in flexure: A cohesive/overlapping crack model application. Mater. Struct. 2015, 48, 235–247. [Google Scholar] [CrossRef]
- Dancygier, A.N.; Berkover, E. Effect of steel fibers on the flexural ductility of lightly reinforced concrete beams. In Innovative Materials and Techniques in Concrete Construction; Fardis, M.N., Ed.; Springer: Berlin, Germany, 2012; pp. 197–207. [Google Scholar]
- di Prisco, M.; Colombo, M.; Bonalumi, P.; Beltrami, C. FRC structural applications according to the fib Model Code 2010: A unified approach. In Proceedings of the FRC 2014 Joint ACI-fib International Workshop, Montreal, QC, Canada, 24–25 July 2014; pp. 224–234. [Google Scholar]
- Dupont, D. Modelling and Experimental Validation of the Constitutive Law (σ–ε) and Cracking Behaviour of Fibre Reinforced Concrete. Ph.D. Thesis, Katholieke Universiteit Leuven, Leuven, Belgium, 2003. [Google Scholar]
- Falkner, H.; Henke, V. Steel fibre reinforced concrete, from research to standards. Concr. Struct. Annu. Tech. J. Hung. Group Fib. 2005, 6, 39–46. [Google Scholar]
- You, Z.; Chen, X.; Dong, S. Ductility and strength of hybrid fiber reinforced self-consolidating concrete beam with low reinforcement ratios. Syst. Eng. Procedia 2011, 1, 28–34. [Google Scholar] [CrossRef]
- Chiaia, B.; Fantilli, A.P.; Vallini, P. Evaluation of minimum reinforcement ratio in FRC members and application to tunnel linings. Mater. Struct. 2007, 40, 593–604. [Google Scholar] [CrossRef]
- Mobasher, B.; Yao, Y.; Soranakom, C. Analytical solutions for flexural design of hybrid steel fiber reinforced concrete beams. Eng. Struct. 2015, 100, 164–177. [Google Scholar] [CrossRef]
- Fantilli, A.P.; Chiaia, B.; Gorino, A. Unified Approach for Minimum Reinforcement of Concrete Beams. ACI Struct. J. 2016, 113, 1107–1116. [Google Scholar] [CrossRef]
- Barros, J.A.O.; Taheri, M.; Salehian, H. A model to simulate the moment–rotation and crack width of FRC members reinforced with longitudinal bars. Eng. Struct. 2015, 100, 43–56. [Google Scholar] [CrossRef]
- Bažant, Z.P.; Cedolin, L. Stability of Structures: Elastic, Inelastic, Fracture and Damage Theories; Oxford University Press: New York, NY, USA, 1991. [Google Scholar]
- Fantilli, A.P.; Vallini, P. Bond-slip relationship for smooth steel reinforcement. In Proceedings of the Computational Modelling of Concrete Structures (EURO-C 2003), St. Johann Im Pongau, Austria, 17–20 March 2003; pp. 215–224. [Google Scholar]
- Gorino, A.; Fantilli, A.P.; Chiaia, B.; Zampini, D.; Guerini, A.; Volpatti, G. Brittle vs. ductile behavior of concrete beams reinforced with steel rebars and fibers. In Proceedings of the 9th Rilem International Symposium on Fiber Reinforced Concrete (BEFIB 2016), University of British Columbia, Vancouver, BC, Canada, 19–21 September 2016; pp. 1263–1274. [Google Scholar]
- Carpinteri, A.; Ferro, G.; Bosco, C.; Elkatieb, M. Scale effects and transitional failure phenomena of reinforced concrete beams in flexure. Eur. Struct. Integr. Soc. 1999, 24, 1–30. [Google Scholar]
- Grünewald, S.; Bartoli, L.; Ferrara, L.; Kanstad, T.; Dehn, F. Translation of test results of small specimens of flowable fibre concrete to structural behaviour: A discussion paper of fib Task Group 4.3. In Proceedings of the FRC 2014 Joint ACI-fib International Workshop, Montreal, QC, Canada, 24–25 July 2014; pp. 555–564. [Google Scholar]
- fib Bulletin 95. Fibre Reinforced Concrete: From Design to Structural Applications. In Proceedings of the ACI-fib-RILEM International Workshop—FRC2018, Desenzano, Italy, 27–30 June 2020. [Google Scholar]


Publisher’s Note: MDPI stays neutral with regard to jurisdictional claims in published maps and institutional affiliations. |
© 2020 by the authors. Licensee MDPI, Basel, Switzerland. This article is an open access article distributed under the terms and conditions of the Creative Commons Attribution (CC BY) license (http://creativecommons.org/licenses/by/4.0/).