Complexation with Random Methyl-β-Cyclodextrin and (2-Hydroxypropyl)-β-Cyclodextrin Promotes Chrysin Effect and Potential for Liver Fibrosis Therapy

 ,
,  ,
, 
 ,
,  ,
,  and
and 
Abstract
1. Introduction
2. Materials and Methods
2.1. Preparation of Chrysin–Cyclodextrin Complexes and Dynamic Light Scattering and Zeta-Potential Measurement
2.2. Cell Cultures
2.3. Biocompatibility Evaluation
2.4. Immunohistochemical Staining and Analysis of Nuclear Factor Kappa B (NF-κB) Nuclear Translocation
2.5. Superoxide Dismutase (SOD) Assay
2.6. Glutathione Peroxidase Assay
2.7. Oxygen Radical Absorbance Assay (ORAC Assay)
2.8. Antifibrotic Effect of the Complexes on LX2 Cell Line
3. Results
3.1. Characteristics of Chrysin–Cyclodextrin Complexes Measured by Dynamic Light Scattering
3.2. Biocompatibility of the Complexes
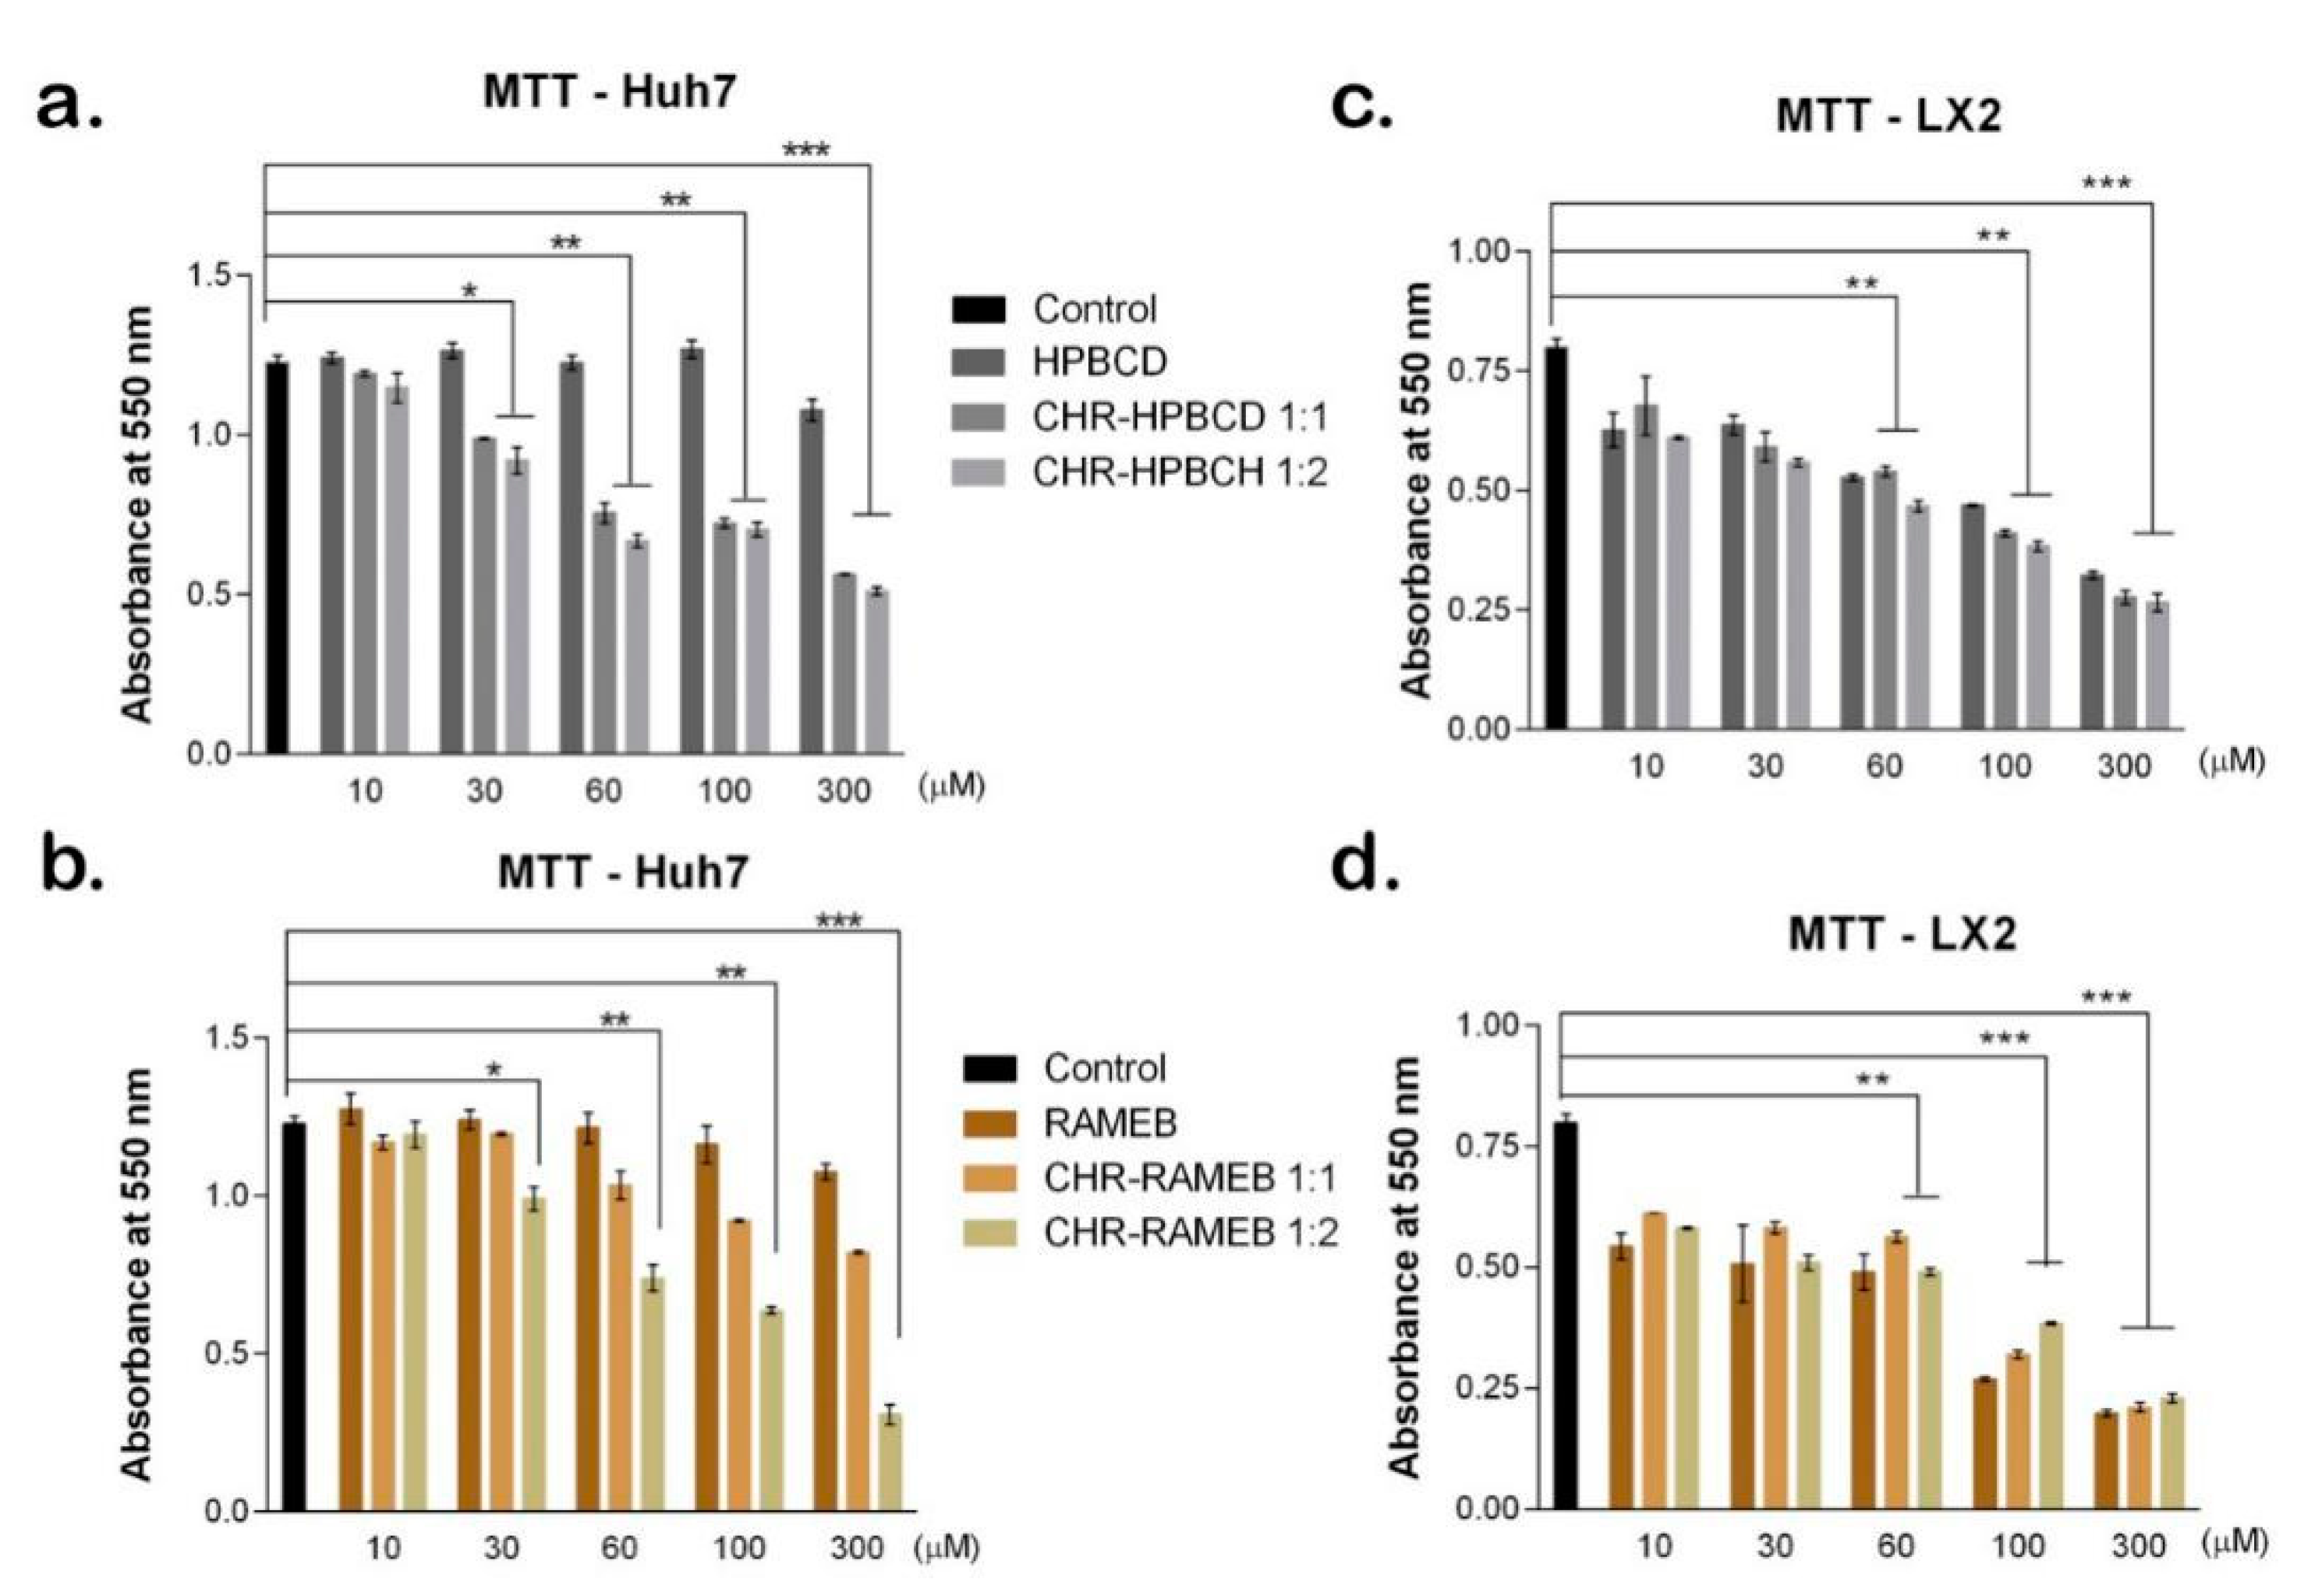
3.2.1. MTT Test
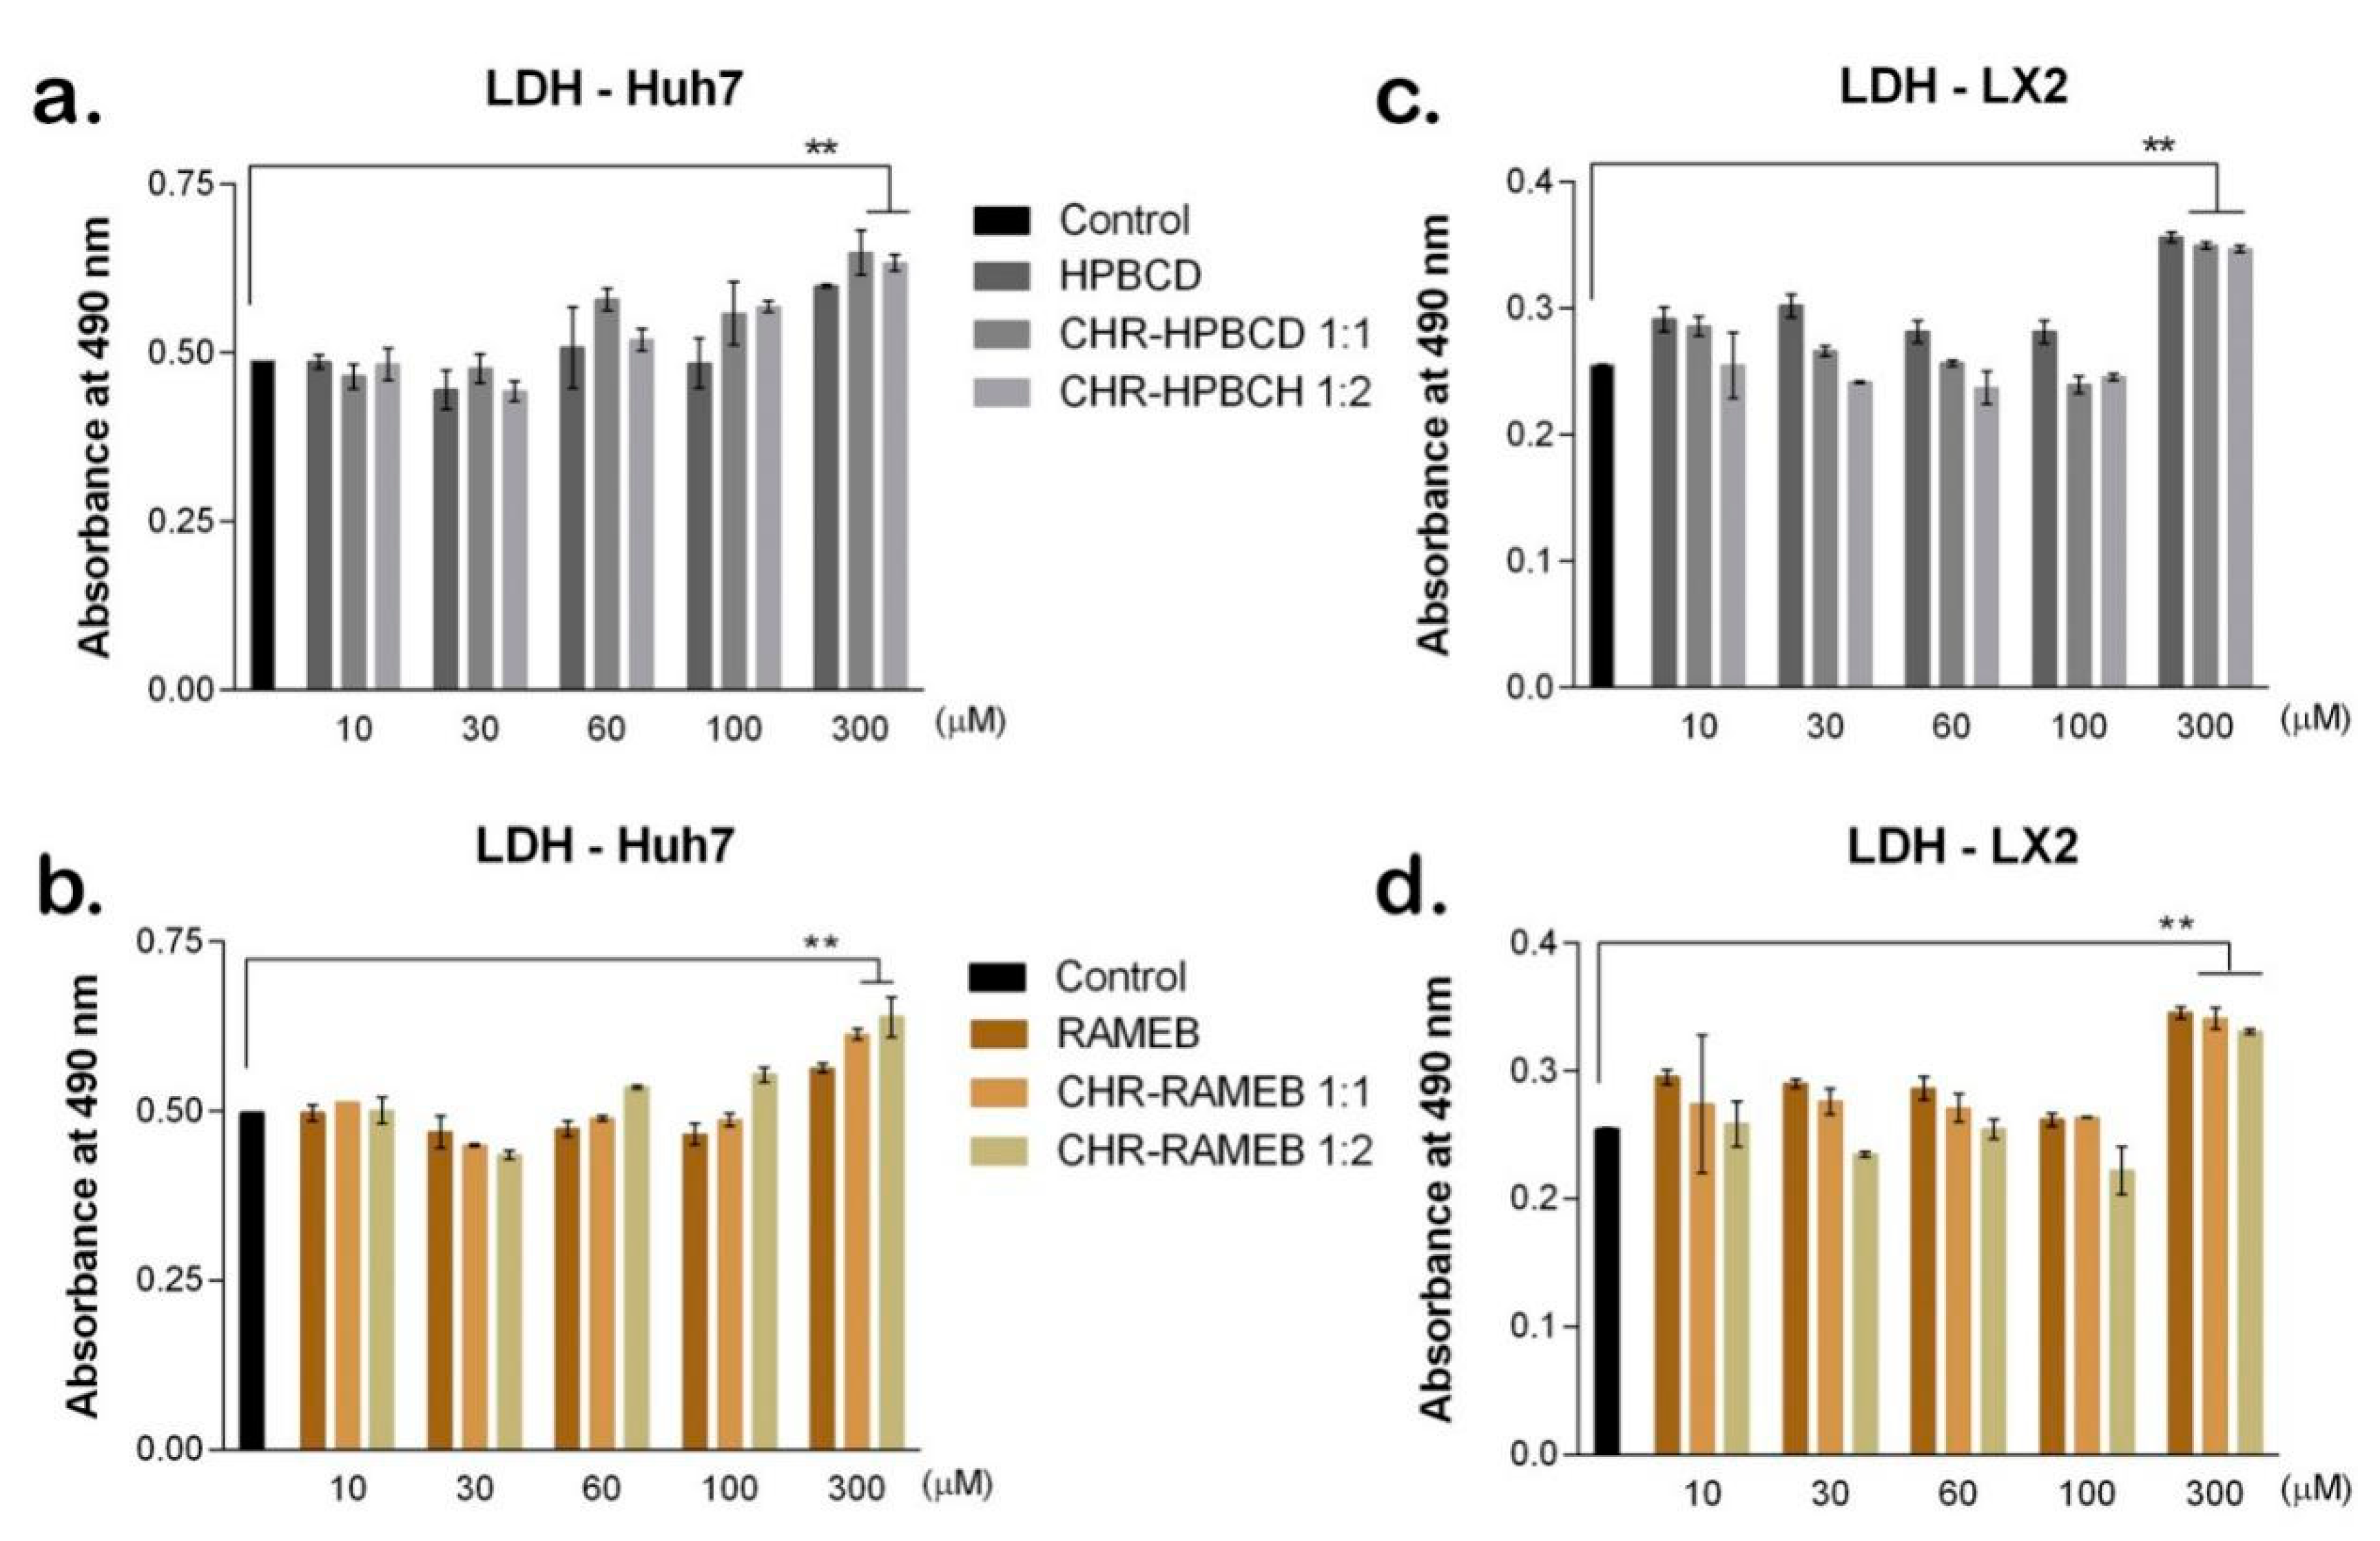
3.2.2. LDH Test
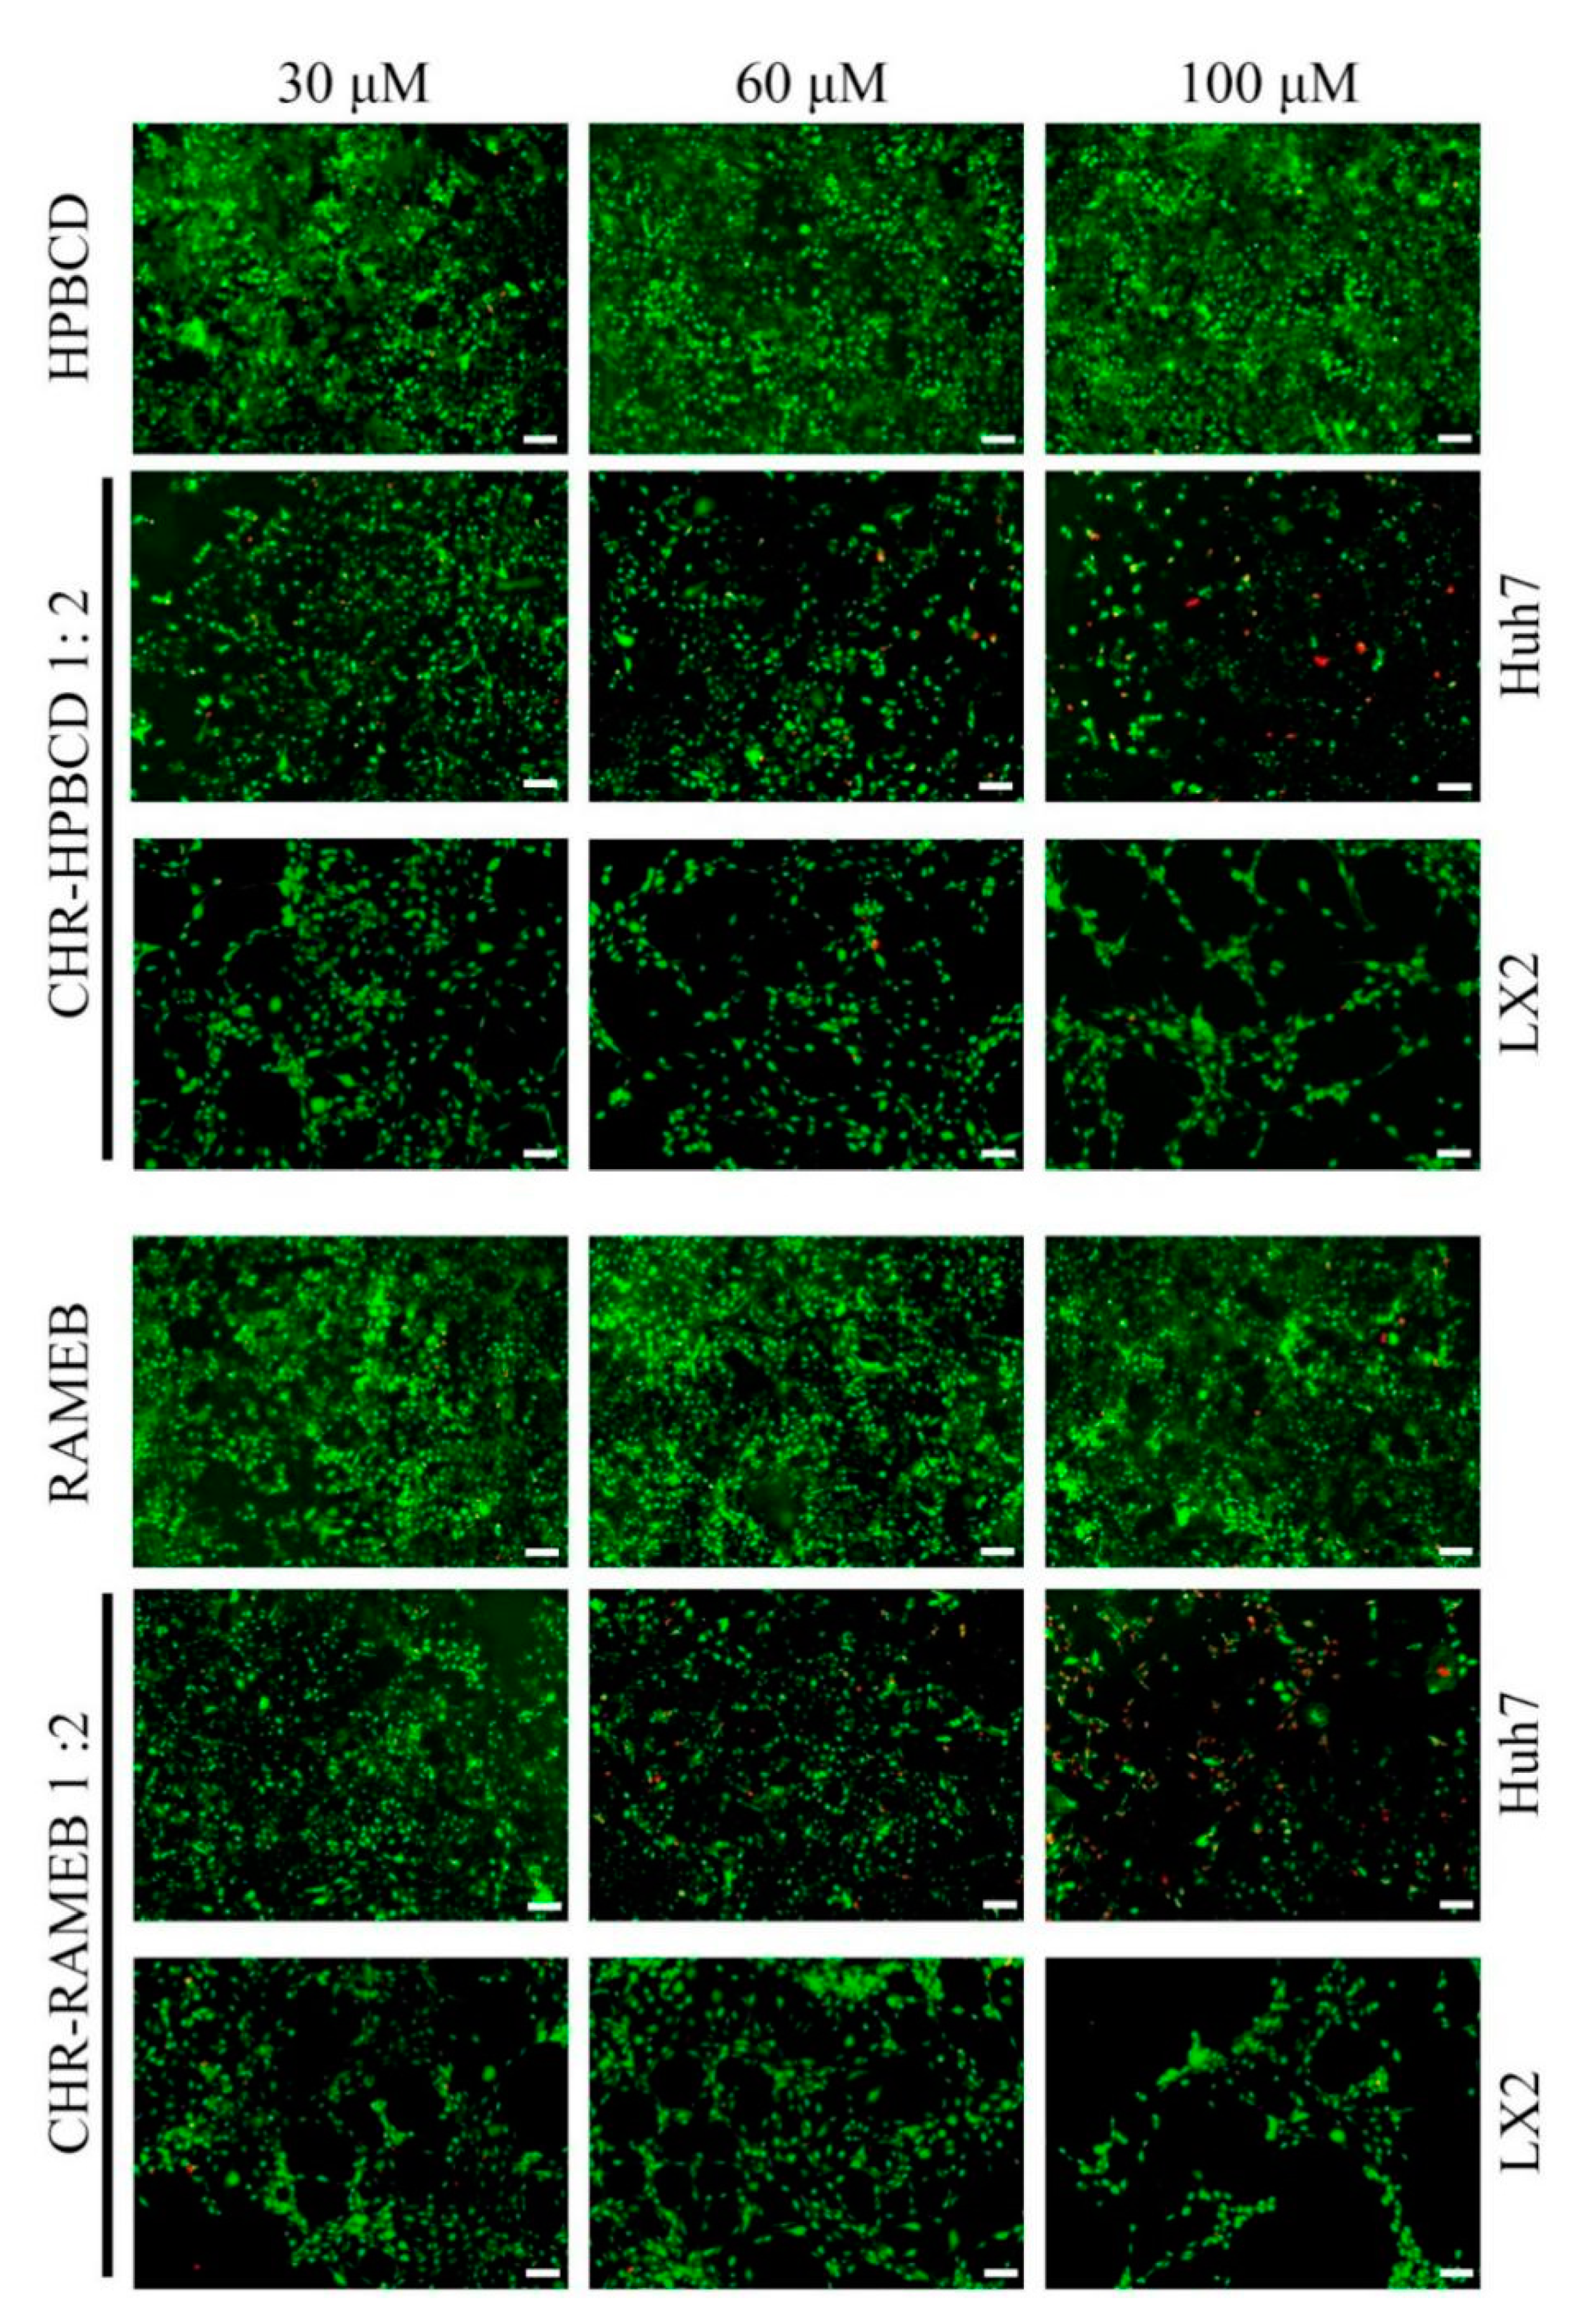
3.2.3. LiveDead Assay
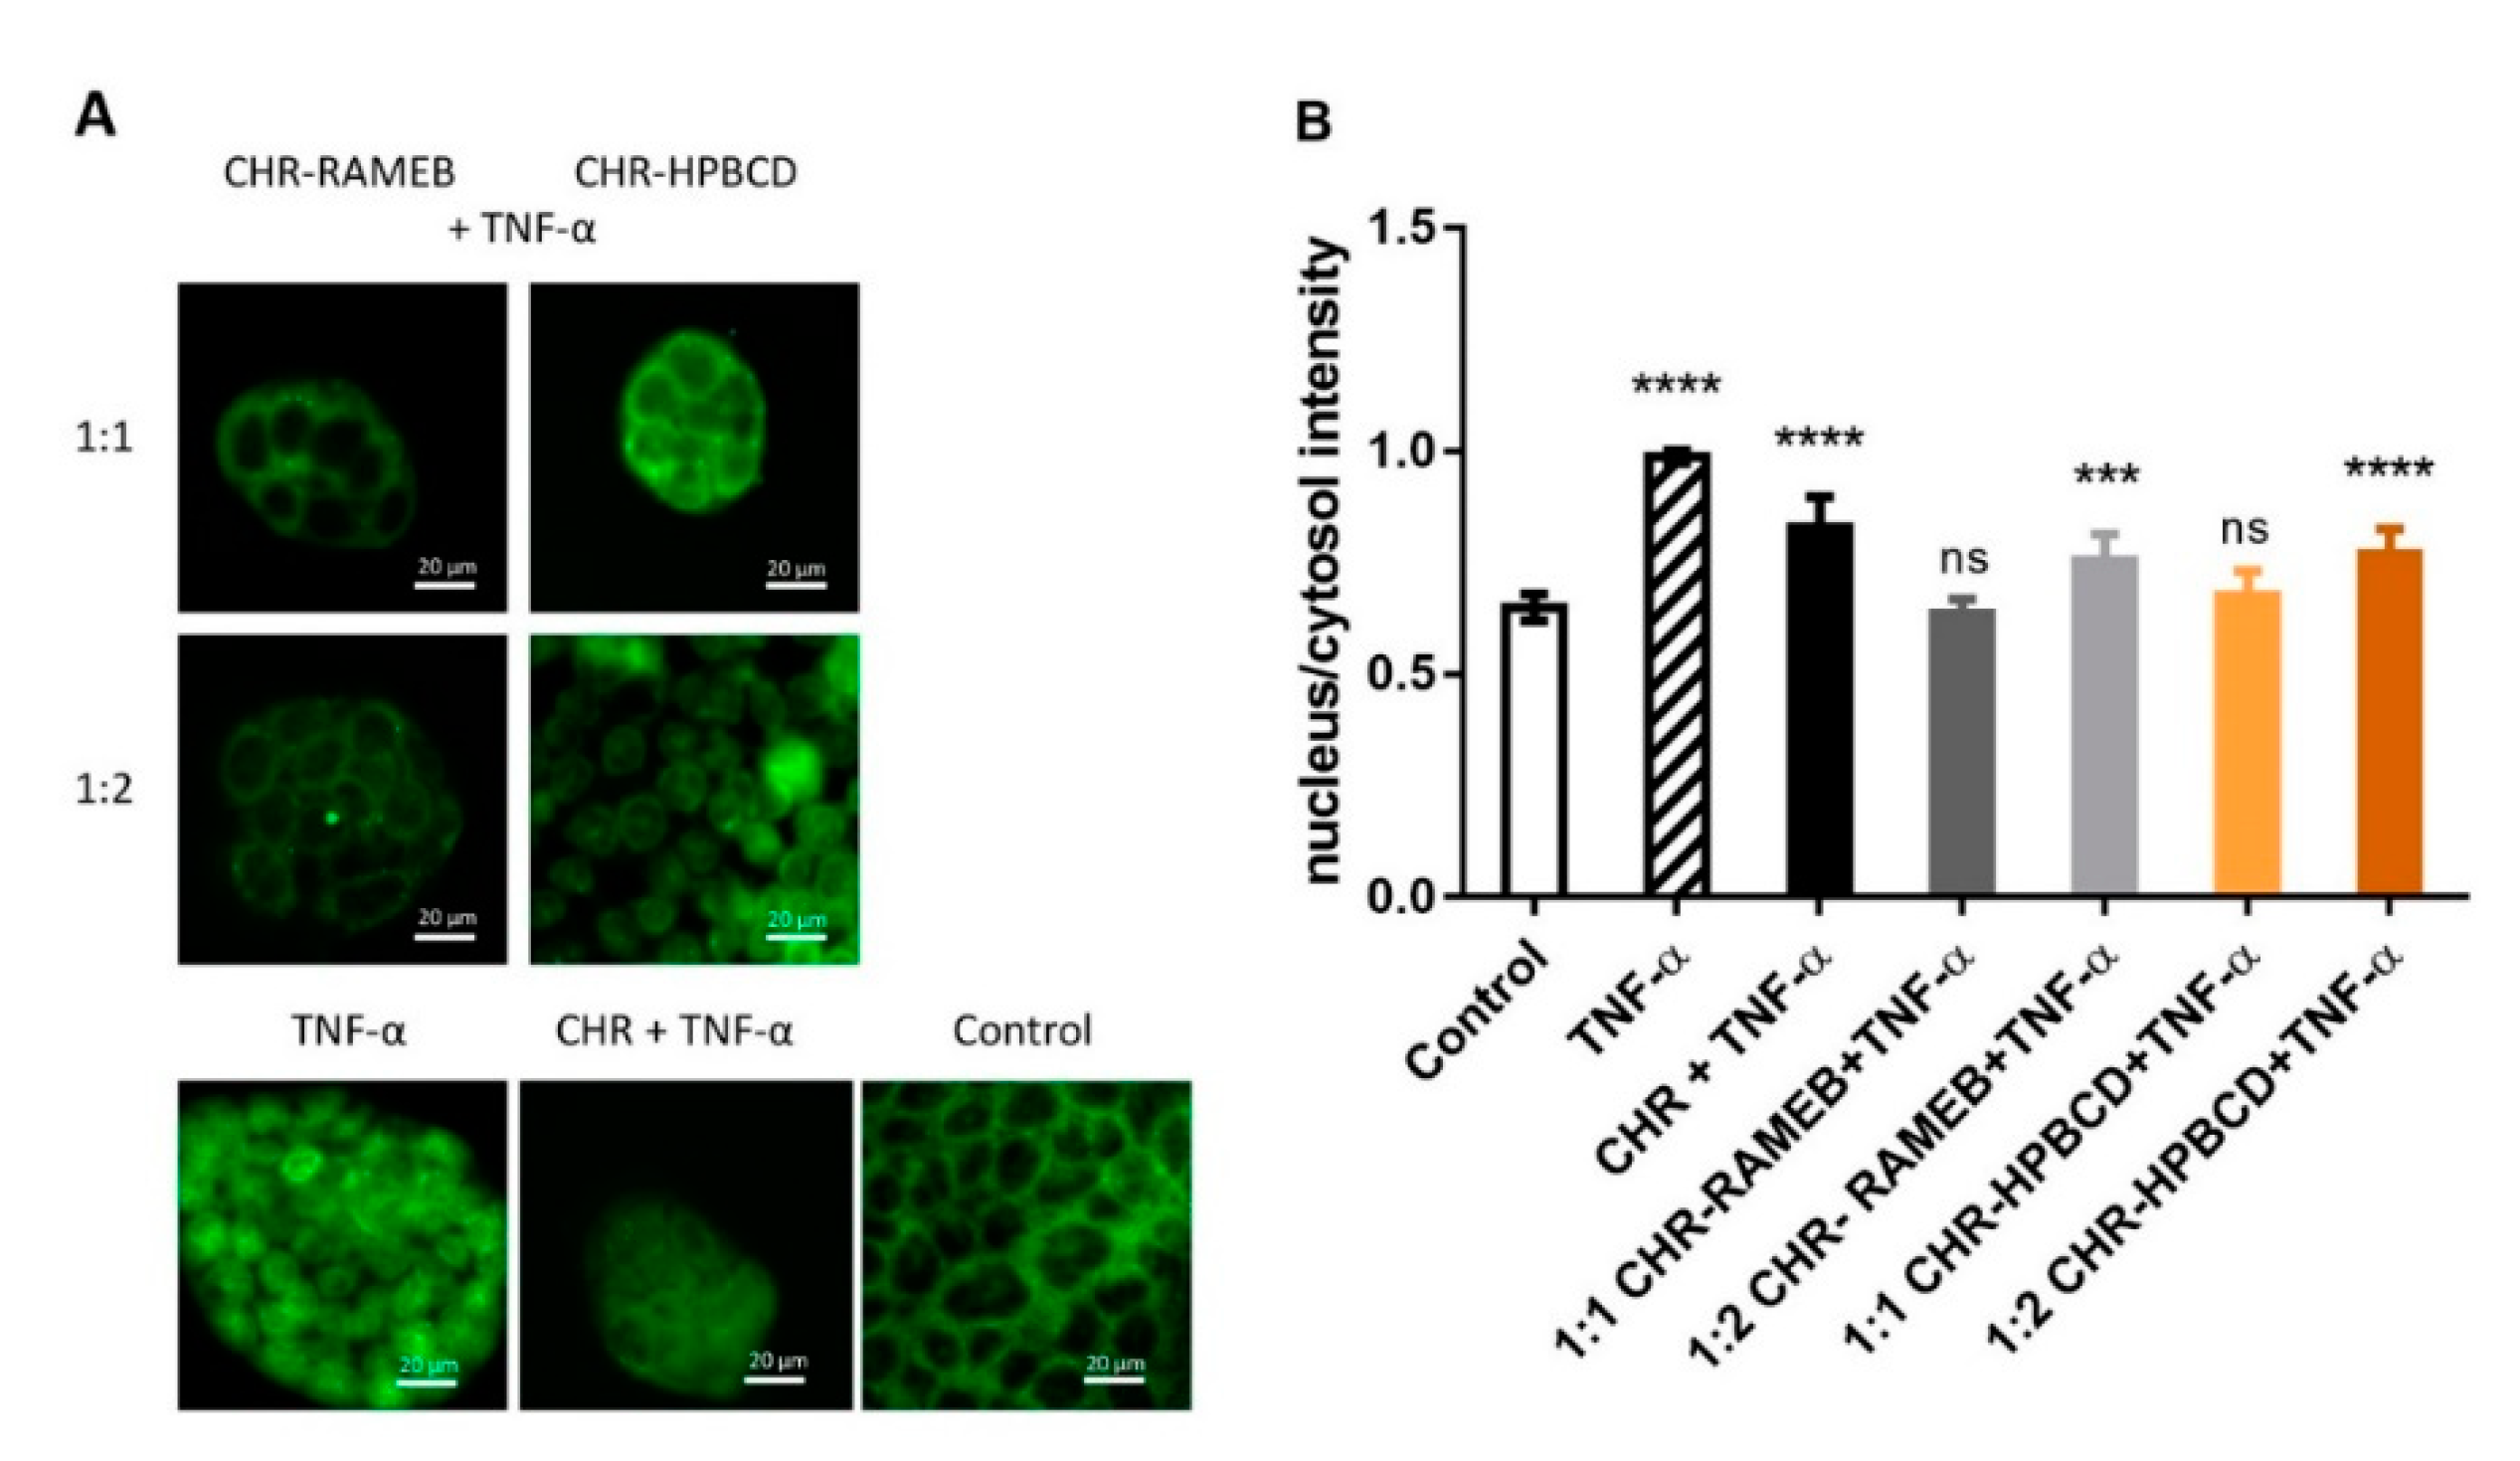
3.3. Analysis of NF-κB Nuclear Translocation
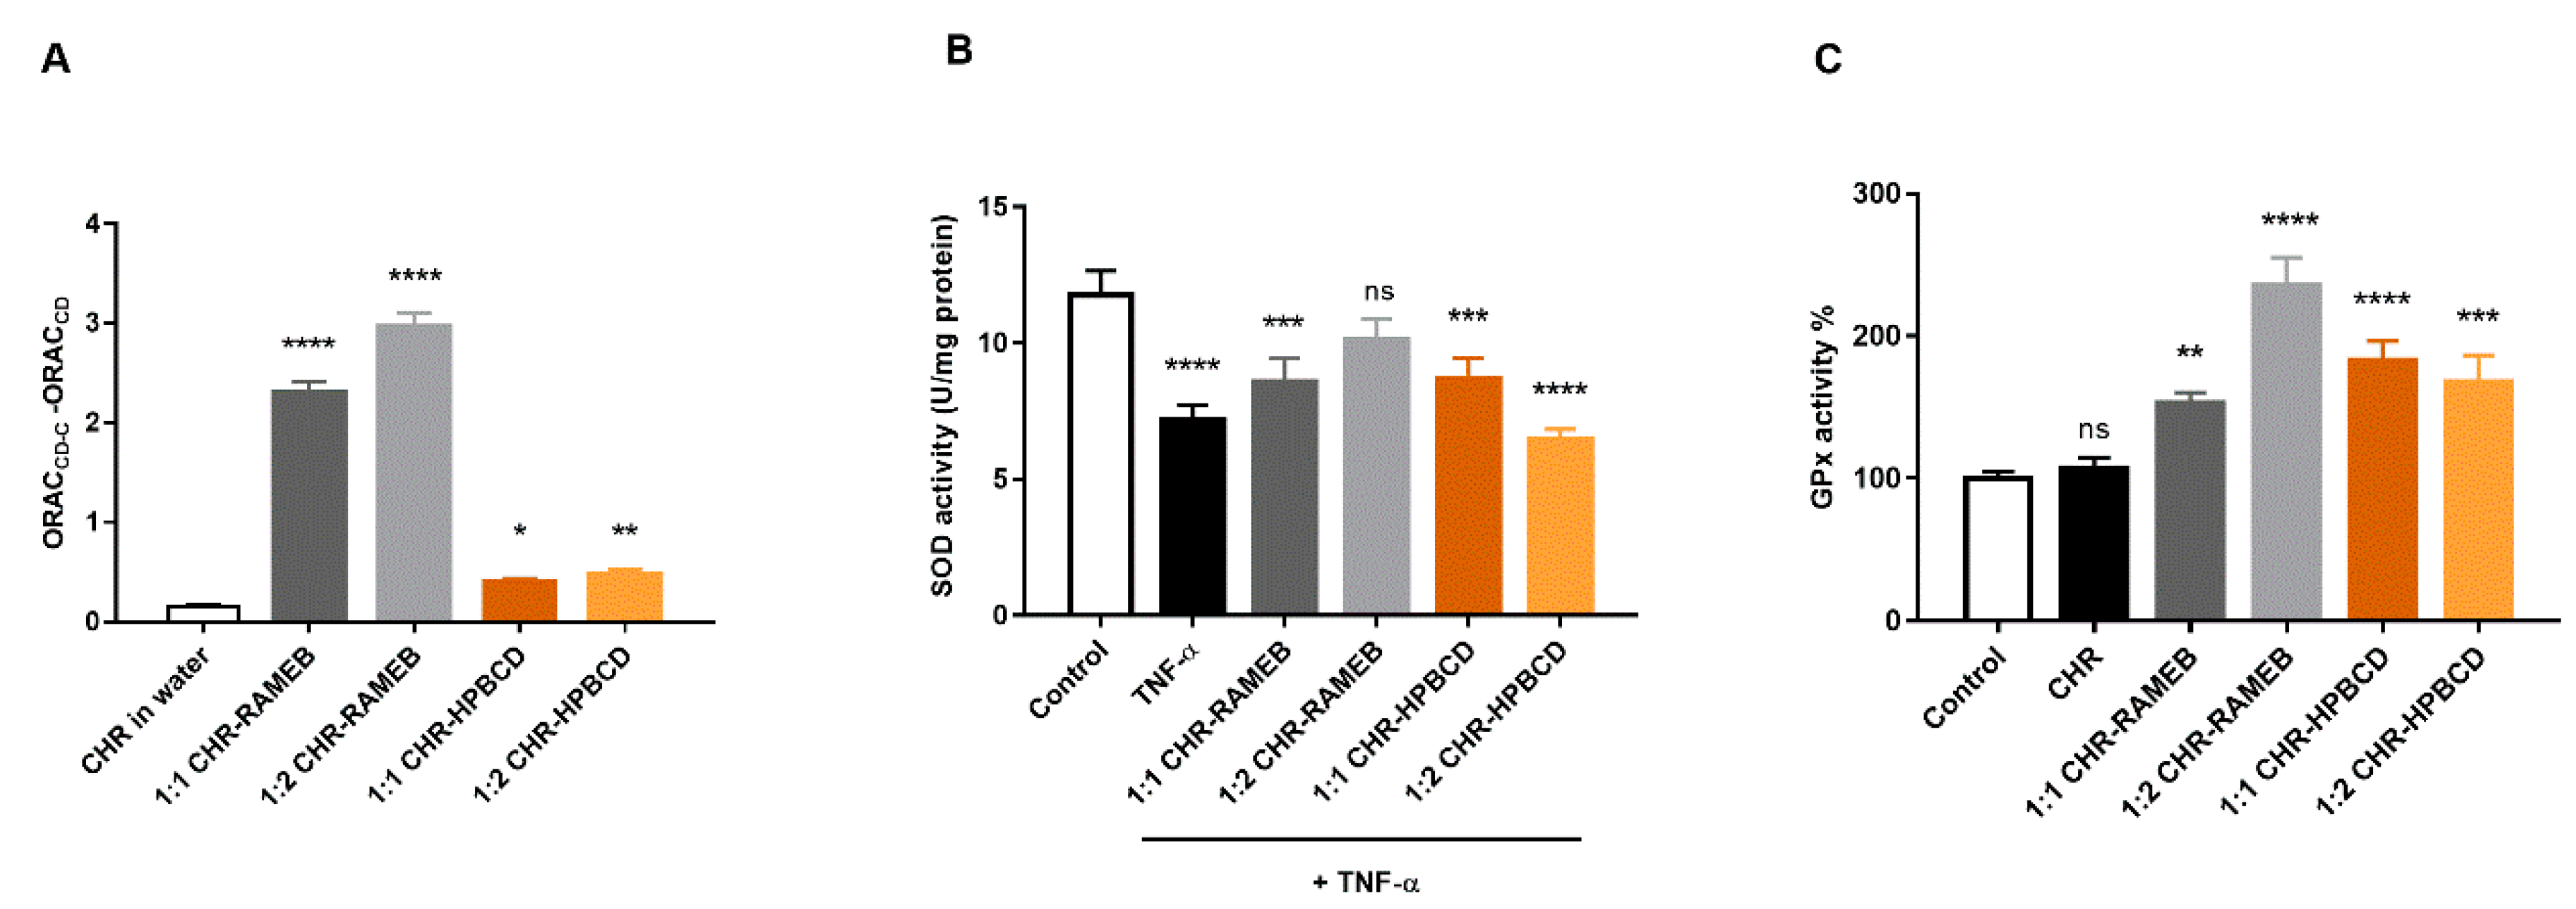
3.4. Analysis of Antioxidant Effects of Chrysin and Its Cyclodextrin Complexes
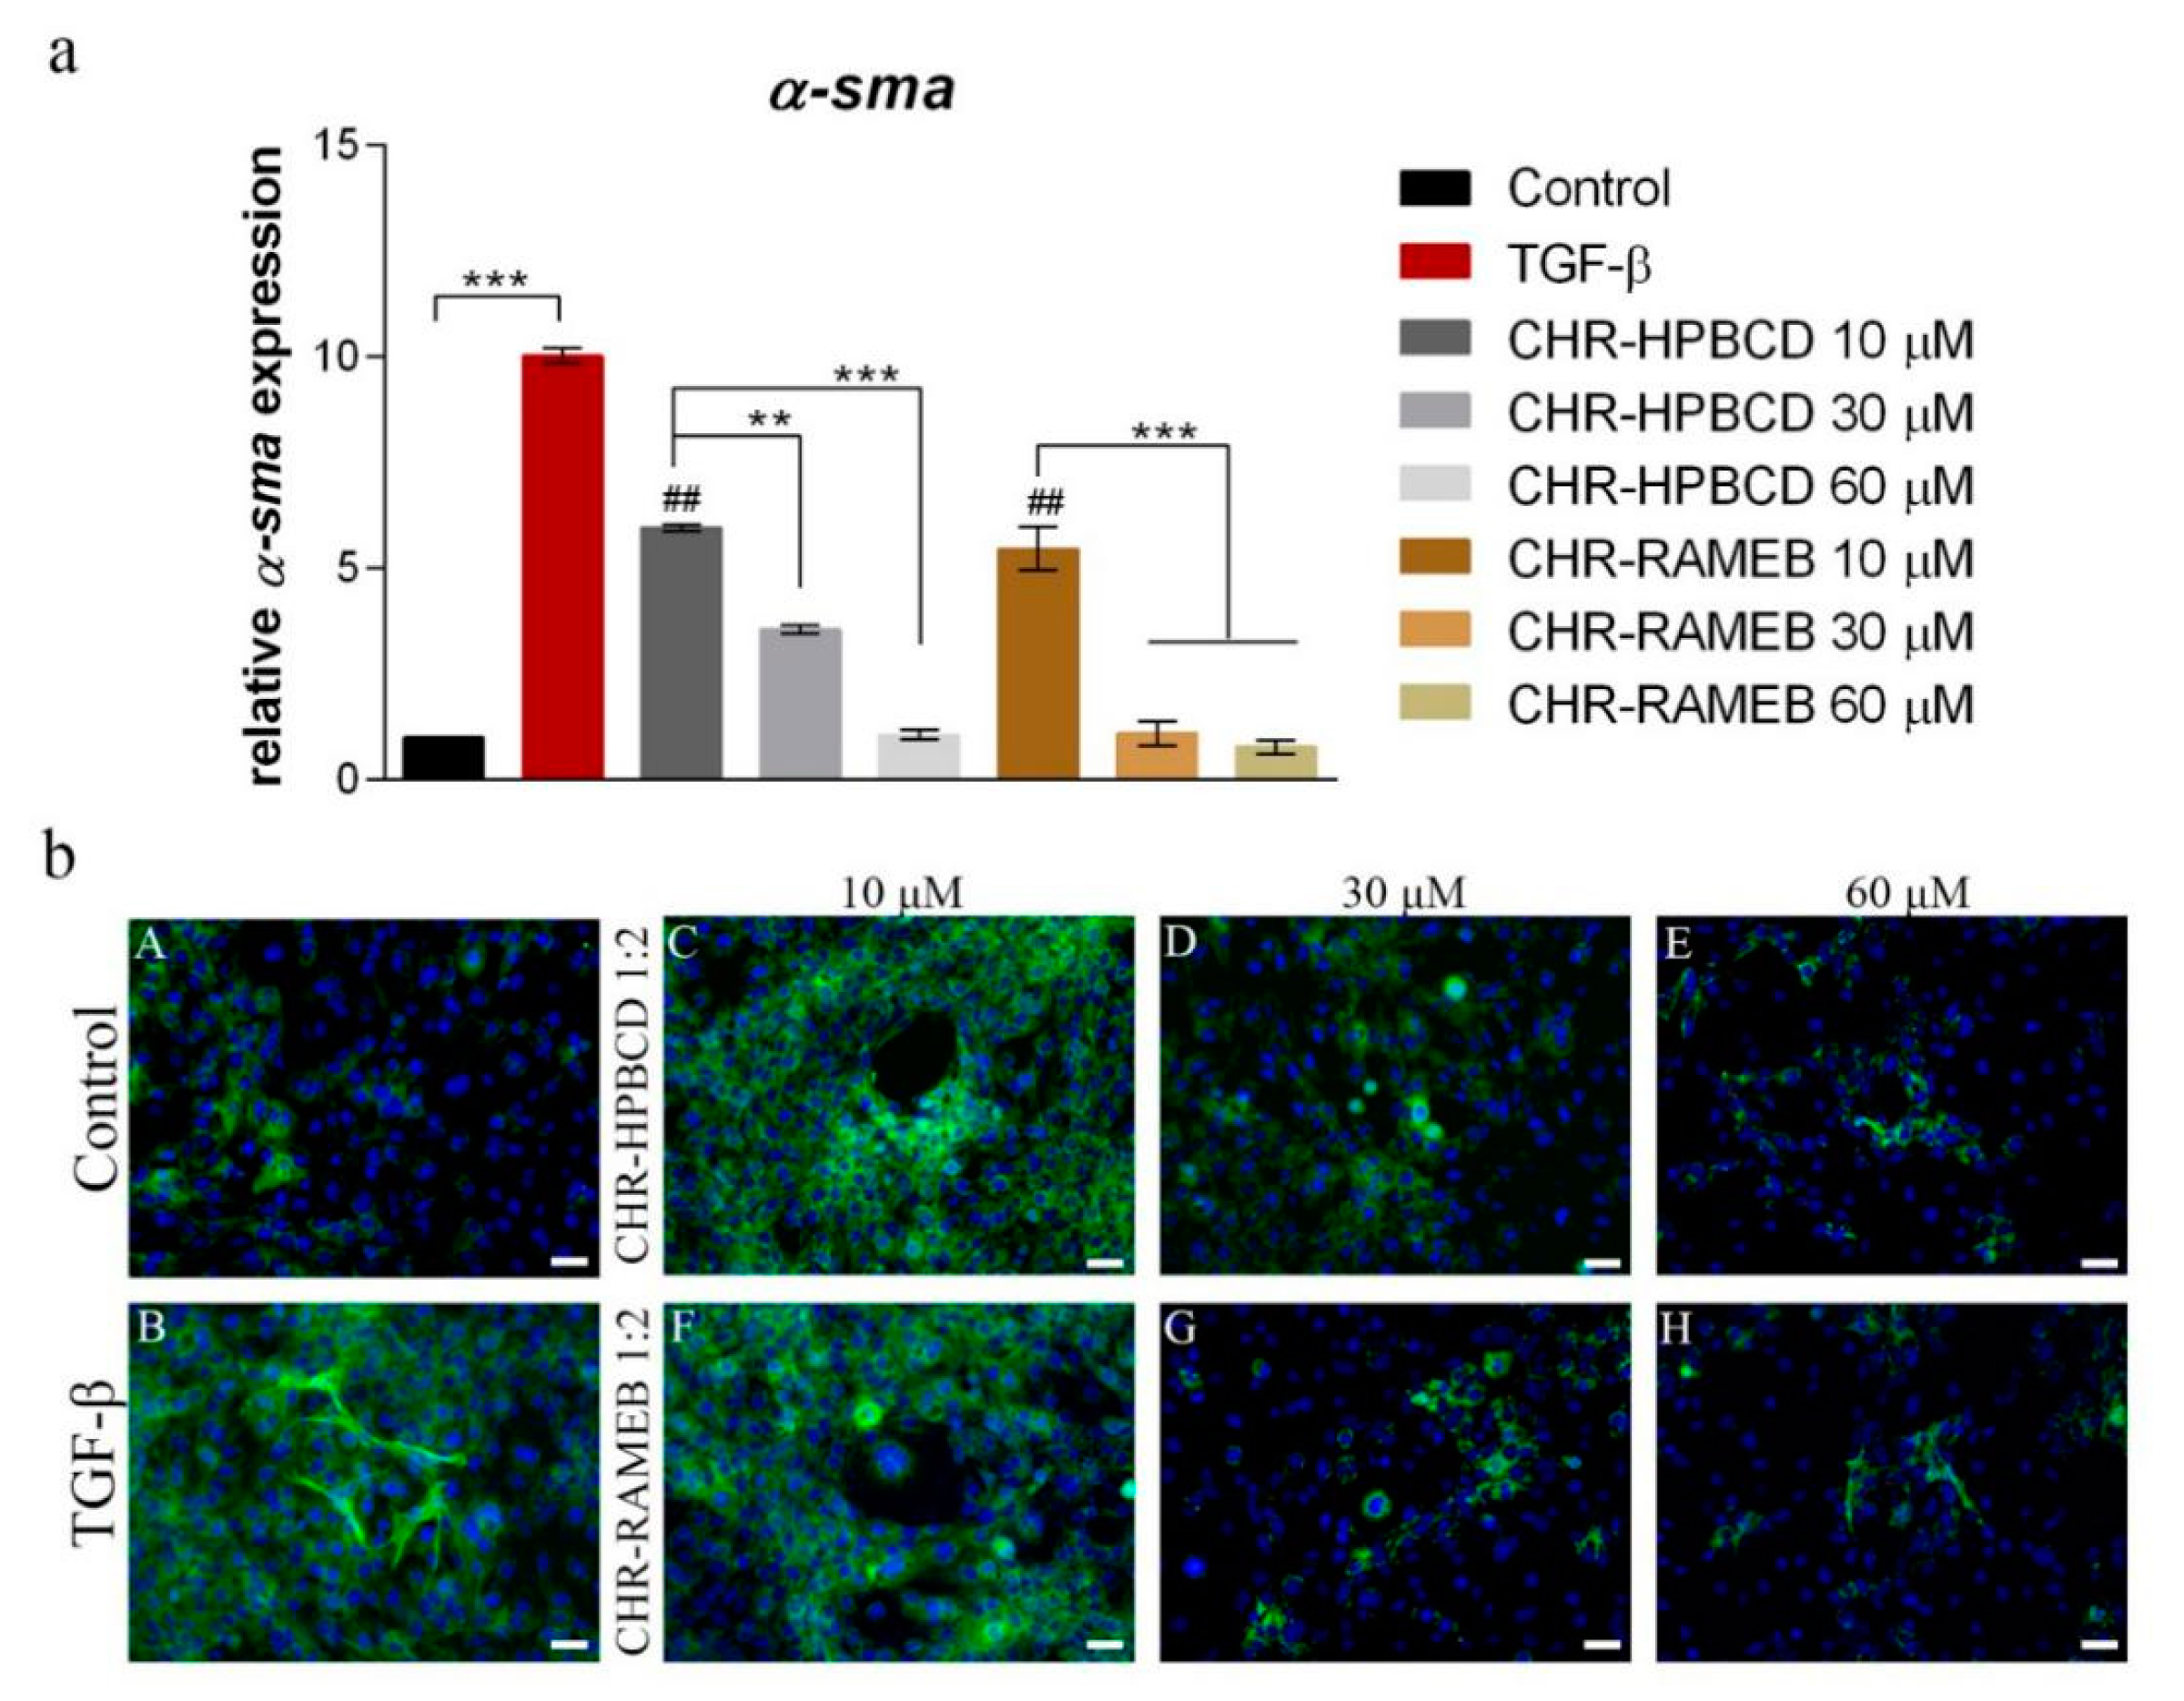
3.5. Analysis of α-sma Expression in LX2 Cells after Exposure to Chrysin Complexes
3.5.1. Real Time PCR
3.5.2. Immunofluorescence Staining
4. Discussion
5. Conclusions
Author Contributions
Funding
Acknowledgments
Conflicts of Interest
References
- Aydin, M.M.; Akcali, K.C. Liver fibrosis. Turk. J. Gastroenterol. 2018, 29, 14–21. [Google Scholar] [CrossRef]
- Zoubek, M.E.; Trautwein, C.; Strnad, P. Reversal of liver fibrosis: From fiction to reality. Best Pract. Res. Clin. Gastroenterol. 2017, 31, 129–141. [Google Scholar] [CrossRef] [PubMed]
- Sun, M.; Kisseleva, T. Reversibility of liver fibrosis. Clin. Res. Hepatol. Gastroenterol. 2015, 39, S60–S63. [Google Scholar] [CrossRef]
- Ignat, S.-R.; Dinescu, S.; Hermenean, A.; Costache, M. Cellular Interplay as a Consequence of Inflammatory Signals Leading to Liver Fibrosis Development. Cells 2020, 9, 461. [Google Scholar] [CrossRef]
- Chen, S.-R.; Chen, X.-P.; Lu, J.-J.; Wang, Y.; Wang, Y.-T. Potent natural products and herbal medicines for treating liver fibrosis. Chin. Med. 2015, 10, 7. [Google Scholar] [CrossRef]
- Trautwein, C.; Friedman, S.L.; Schuppan, D.; Pinzani, M. Hepatic fibrosis: Concept to treatment. J. Hepatol. 2015, 62, S15–S24. [Google Scholar] [CrossRef]
- Mata-Santos, H.A.; Dutra, F.F.; Rocha, C.C.; Lino, F.G.; Xavier, F.R.; Chinalia, L.A.; Hossy, B.H.; Castelo-Branco, M.T.L.; Teodoro, A.J.; Paiva, C.N.; et al. Silymarin Reduces Profibrogenic Cytokines and Reverses Hepatic Fibrosis in Chronic Murine Schistosomiasis. Antimicrob. Agents Chemother. 2014, 58, 2076–2083. [Google Scholar] [CrossRef]
- Renuka, M.; Vijayakumar, N.; Ramakrishnan, A. Chrysin, a flavonoid attenuates histological changes of hyperammonemic rats: A dose dependent study. Biomed. Pharmacother. 2016, 82, 345–354. [Google Scholar] [CrossRef]
- Balta, C.; Herman, H.; Boldura, O.M.; Gasca, I.; Rosu, M.; Ardelean, A.; Hermenean, A. Chrysin attenuates liver fibrosis and hepatic stellate cell activation through TGF-β/Smad signaling pathway. Chem. Biol. Interact. 2015, 240, 94–101. [Google Scholar] [CrossRef]
- Xu, D.; Jin, J.; Yu, H.; Zhao, Z.; Ma, D.; Zhang, C.; Jiang, H. Chrysin inhibited tumor glycolysis and induced apoptosis in hepatocellular carcinoma by targeting hexokinase-2. J. Exp. Clin. Cancer Res. 2017, 36, 44. [Google Scholar] [CrossRef]
- Ali, N.; Rashid, S.; Nafees, S.; Hasan, S.K.; Sultana, S. Beneficial effects of Chrysin against Methotrexate-induced hepatotoxicity via attenuation of oxidative stress and apoptosis. Mol. Cell. Biochem. 2014, 385, 215–223. [Google Scholar] [CrossRef] [PubMed]
- Hermenean, A.; Mariasiu, T.; Navarro-González, I.; Vegara-Meseguer, J.; Miuțescu, E.; Chakraborty, S.; Pérez-Sánchez, H. Hepatoprotective activity of chrysin is mediated through TNF-α in chemically-induced acute liver damage: An in vivo study and molecular modeling. Exp. Ther. Med. 2017, 13, 1671–1680. [Google Scholar] [CrossRef]
- Sun, X.; Huo, X.; Luo, T.; Li, M.; Yin, Y.; Jiang, Y. The anticancer flavonoid chrysin induces the unfolded protein response in hepatoma cells. J. Cell. Mol. Med. 2011, 15, 2389–2398. [Google Scholar] [CrossRef]
- Balta, C.; Ciceu, A.; Herman, H.; Rosu, M.; Boldura, O.M.; Hermenean, A. Dose-Dependent Antifibrotic Effect of Chrysin on Regression of Liver Fibrosis: The Role in Extracellular Matrix Remodeling. Dose-Response 2018, 16, 155932581878983. [Google Scholar] [CrossRef]
- Walle, T. Methylation of Dietary Flavones Increases Their Metabolic Stability and Chemopreventive Effects. Int. J. Mol. Sci. 2009, 10, 5002–5019. [Google Scholar] [CrossRef]
- Zhao, J.; Yang, J.; Xie, Y. Improvement strategies for the oral bioavailability of poorly water-soluble flavonoids: An overview. Int. J. Pharm. 2019, 570, 118642. [Google Scholar] [CrossRef]
- Gharbia, S.; Balta, C.; Herman, H.; Rosu, M.; Váradi, J.; Bácskay, I.; Vecsernyés, M.; Gyöngyösi, S.; Fenyvesi, F.; Voicu, S.N.; et al. Enhancement of Silymarin Anti-fibrotic Effects by Complexation With Hydroxypropyl (HPBCD) and Randomly Methylated (RAMEB) β-Cyclodextrins in a Mouse Model of Liver Fibrosis. Front. Pharmacol. 2018, 9, 883. [Google Scholar] [CrossRef]
- Schönbeck, C.; Gaardahl, K.; Houston, B. Drug Solubilization by Mixtures of Cyclodextrins: Additive and Synergistic Effects. Mol. Pharm. 2019, 16, 648–654. [Google Scholar] [CrossRef]
- Saokham, P.; Muankaew, C.; Jansook, P.; Loftsson, T. Solubility of Cyclodextrins and Drug/Cyclodextrin Complexes. Molecules 2018, 23, 1161. [Google Scholar] [CrossRef]
- Fenyvesi, F.; Nguyen, T.L.P.; Haimhoffer, Á.; Rusznyák, Á.; Vasvári, G.; Bácskay, I.; Vecsernyés, M.; Ignat, S.-R.; Dinescu, S.; Costache, M.; et al. Cyclodextrin Complexation Improves the Solubility and Caco-2 Permeability of Chrysin. Materials 2020, 13, 3618. [Google Scholar] [CrossRef]
- Kiss, T.; Fenyvesi, F.; Bácskay, I.; Váradi, J.; Fenyvesi, É.; Iványi, R.; Szente, L.; Tósaki, Á.; Vecsernyés, M. Evaluation of the cytotoxicity of β-cyclodextrin derivatives: Evidence for the role of cholesterol extraction. Eur. J. Pharm. Sci. 2010, 40, 376–380. [Google Scholar] [CrossRef]
- Shityakov, S.; Salmas, R.E.; Salvador, E.; Roewer, N.; Broscheit, J.; Förster, C. Evaluation of the potential toxicity of unmodified and modified cyclodextrins on murine blood-brain barrier endothelial cells. J. Toxicol. Sci. 2016, 41, 175–184. [Google Scholar] [CrossRef]
- Gould, S.; Scott, R.C. 2-Hydroxypropyl-β-cyclodextrin (HP-β-CD): A toxicology review. Food Chem. Toxicol. 2005, 43, 1451–1459. [Google Scholar] [CrossRef]
- Kiss, T.; Fenyvesi, F.; Pasztor, N.; Feher, P.; Varadi, J.; Kocsan, R.; Szente, L.; Fenyvesi, E.; Szabo, G.; Vecsernyes, M.; et al. Cytotoxicity of different types of methylated beta-cyclodextrins and ionic derivatives. Pharmazie 2007, 62, 557–558. [Google Scholar]
- Bahadori, M.; Baharara, J.; Amini, E. Anticancer Properties of Chrysin on Colon Cancer Cells, In vitro and In vivo with Modulation of Caspase-3, -9, Bax and Sall4. Iran. J. Biotechnol. 2016, 14, 177–184. [Google Scholar] [CrossRef]
- Ryu, S.; Lim, W.; Bazer, F.W.; Song, G. Chrysin induces death of prostate cancer cells by inducing ROS and ER stress. J. Cell. Physiol. 2017, 232, 3786–3797. [Google Scholar] [CrossRef]
- Nagasaka, M.; Hashimoto, R.; Inoue, Y.; Ishiuchi, K.; Matsuno, M.; Itoh, Y.; Tokugawa, M.; Ohoka, N.; Morishita, D.; Mizukami, H.; et al. Anti-Tumorigenic Activity of Chrysin from Oroxylum indicum via Non-Genotoxic p53 Activation through the ATM-Chk2 Pathway. Molecules 2018, 23, 1394. [Google Scholar] [CrossRef]
- Jarčuška, P.; Janičko, M.; Veselíny, E.; Jarčuška, P.; Skladaný, Ľ. Circulating markers of liver fibrosis progression. Clin. Chim. Acta 2010, 411, 1009–1017. [Google Scholar] [CrossRef]
- Rehman, K.; Akash, M.S.H. Mechanisms of inflammatory responses and development of insulin resistance: How are they interlinked? J. Biomed. Sci. 2016, 23, 87. [Google Scholar] [CrossRef]
- Samarghandian, S.; Farkhondeh, T.; Azimi-Nezhad, M. Protective Effects of Chrysin Against Drugs and Toxic Agents. Dose-Response 2017, 15, 155932581771178. [Google Scholar] [CrossRef] [PubMed]


| Complexes | Peak 1 Average Diameter (nm) | Peak 1 Average Area Intensity (%) | Peak 2 Average Diameter (nm) | Peak 2 Average Area Intensity (%) | Zeta-Potential (mV) |
|---|---|---|---|---|---|
| CHR–RAMEB 1:1 | 1.5 ± 0.1 | 66 ± 24 | 259 | 32 ± 21 | −13 ± 1 |
| CHR–RAMEB 1:2 | 1.5 ± 0.2 | 89 ± 15 | 144 | 22 | −10 ± 1 |
| CHR–HPBCD 1:1 | 2 ± 0.2 | 25 ± 5 | 206 ± 85 | 72 ± 4 | −13 ± 2 |
| CHR–HPBCD 1:2 | 2 ± 0.2 | 8 ± 2 | 143 ± 64 | 90.5 ± 2 | −12 ± 0.3 |
Publisher’s Note: MDPI stays neutral with regard to jurisdictional claims in published maps and institutional affiliations. |
© 2020 by the authors. Licensee MDPI, Basel, Switzerland. This article is an open access article distributed under the terms and conditions of the Creative Commons Attribution (CC BY) license (http://creativecommons.org/licenses/by/4.0/).
Share and Cite
Ignat, S.-R.; Dinescu, S.; Váradi, J.; Fenyvesi, F.; Nguyen, T.L.P.; Ciceu, A.; Hermenean, A.; Costache, M. Complexation with Random Methyl-β-Cyclodextrin and (2-Hydroxypropyl)-β-Cyclodextrin Promotes Chrysin Effect and Potential for Liver Fibrosis Therapy. Materials 2020, 13, 5003. https://doi.org/10.3390/ma13215003
Ignat S-R, Dinescu S, Váradi J, Fenyvesi F, Nguyen TLP, Ciceu A, Hermenean A, Costache M. Complexation with Random Methyl-β-Cyclodextrin and (2-Hydroxypropyl)-β-Cyclodextrin Promotes Chrysin Effect and Potential for Liver Fibrosis Therapy. Materials. 2020; 13(21):5003. https://doi.org/10.3390/ma13215003
Chicago/Turabian StyleIgnat, Simona-Rebeca, Sorina Dinescu, Judit Váradi, Ferenc Fenyvesi, Thi Le Phuong Nguyen, Alina Ciceu, Anca Hermenean, and Marieta Costache. 2020. "Complexation with Random Methyl-β-Cyclodextrin and (2-Hydroxypropyl)-β-Cyclodextrin Promotes Chrysin Effect and Potential for Liver Fibrosis Therapy" Materials 13, no. 21: 5003. https://doi.org/10.3390/ma13215003
APA StyleIgnat, S.-R., Dinescu, S., Váradi, J., Fenyvesi, F., Nguyen, T. L. P., Ciceu, A., Hermenean, A., & Costache, M. (2020). Complexation with Random Methyl-β-Cyclodextrin and (2-Hydroxypropyl)-β-Cyclodextrin Promotes Chrysin Effect and Potential for Liver Fibrosis Therapy. Materials, 13(21), 5003. https://doi.org/10.3390/ma13215003