Abstract
Microstructure as well as magnetic, thermal and magnetocaloric properties of the mechanically alloyed Fe72Nb8B20 powders have been investigated by means of Mössbauer spectrometry, differential scanning calorimetry (DSC), and magnetic measurements. The Mössbauer spectrometry results showed the formation of nanostructured Fe(B) and Fe(Nb) solid solutions, Fe2B boride, and an amorphous phase. The endothermic and exothermic peaks that are observed in the DSC curves might be related to the Curie temperature, and the crystallization of the amorphous phase, respectively. The critical exponent values around the magnetic phase transition of the amorphous phase (TC = 480 K), are deduced from the modified Arrott plots, Kouvel−Fisher curves and critical isotherm examination. The calculated values (β = 0.457 ± 0.012, γ = 0.863 ± 0.136 and δ = 3.090 ± 0.004) are near to those of the mean field model, revealing a dominating role of magnetic order arising due to long-range ferromagnetic interactions, as the critical exponents are mean-field-like. The maximum entropy change and the refrigerant capacity values are 1.45 J/kg·K and 239 J/kg, respectively, under a magnetic field of 5 T.
1. Introduction
Magnetic refrigeration (MR) is a promising alternate to the conventional refrigeration, and a developing technology that enhances energy efficiency and environmental respect as it uses clean energy. MR is established on the magnetocaloric effect (MCE) which represents a thermal reaction or a temperature variation of certain magnetic solids under the solicitation/removal of a magnetic field in an adiabatic condition [1]. Indeed, the application of a magnetic field gives rise to the alignment of the magnetic moments of a solid parallel to it and hence, to the increase of the temperature owing to the released thermal energy. Consequently, the magnetic entropy is reduced. By removing the magnetic field, the sample cooled down due to the random orientation of the magnetic moments, and the entropy increased [2].
Many researches have been devoted to nanoscale magnetic materials magnetic materials owing to a large MCE in the superparamagnetic nanostructured materials [3,4]. According to their magnetic phase transition, magnetic refrigerant materials can exhibit either a first order magnetic phase transition (FOMT) or a second order magnetic phase transition (SOMT). The former is described by large magnetic entropy variations, considerable hysteresis, a narrow temperature range, and a strong correlation between magnetism and crystallographic structure [5,6]. Whereas the SOMT materials show no structural transition at the Curie temperature () that could improve the magnetization change, and they have negligible hysteresis, lower magnetic entropy change peaks and a wide temperature range [7,8,9,10]. The main problem of magnetic phase transitions theory consists in studying the behavior of a given system in the neighborhood of the ferromagnetic (FM) to paramagnetic (PM) magnetic transition temperature. Indeed, some physical magnitudes corresponding to the system have singularities at the critical point. These singularities are, generally, expressed in terms of power law categorized by critical exponents, which qualitatively determine the nature of the behavior of a given system. According to different theoretical models [11], the magnetic phase variation near is defined by a set of critical exponents (β, γ and δ), where β is related to the spontaneous magnetization Ms (μ0H = 0) under ; γ is linked to the initial magnetic susceptibility χ0 below , and δ can be deduced from the magnetic isotherm at .
Fe-Nb-B alloys are very stimulating materials owing to their soft magnetic properties (high magnetization of saturation, low core losses, zero magnetostriction, etc.) that can be achieved after optimum thermal heat treatment [12]. Accordingly, they have many industrial applications such as telecommunications, magnetic heads, sensors, power transformers, etc. [13,14]. Besides, Fe-Nb-B alloys exhibit other possible functionalities such as MCE [15,16]. Indeed, in the amorphous Fe93-xNb7Bx (x = 9, 14 and 20) prepared by rapid quenching, the entropy values are for x = 9, 14 and 20, respectively [17]. The temperature dependence of the MCE was studied in amorphous and nanocrystalline Fe80.5Nb7B12.5 melt-spun ribbons [18]. The maximum entropy change was about , at of the amorphous phase, upon a magnetic field modification of 0.7 T. Nevertheless, the magnetic entropy variation decreased and its peak broadened with the progressive nanocrystallization of the amorphous ribbons.
Many methods have been used to produce magnetocaloric materials such as mechanical alloying (MA) [19,20], solid state reactions [21], sol gel routes [22], melt spinning [23,24], etc. In the mechanically alloyed powders, the MCE response can be affected by several factors such as the alloy composition, the multiphase character, the demagnetizing field effect, etc. [25]. Consequently, depending on the experimental procedure, the obtained results might be different. Hence, the goal of the current work was to study the structure and the magnetocaloric, magnetic and thermal properties of the ball-milled Fe72Nb8B20 powders. The critical behavior near the Curie temperature of the amorphous phase is also discussed.
2. Experimental Details
Fe72Nb8B20 (wt. %) powders were ball-milled for 50 h. The experimental details are reported in reference [26]. The local 57Fe environment was studied by Mössbauer spectrometry in transmission geometry, at 300 K, by means of a 57Co source diffused in an Rh matrix. Setaram DSC131 evo apparatus (DSC) (Setaram Instrumentation, Lyon, France) was used to examine the thermal behavior within the temperature range 323−973 K, under argon atmosphere, by using different heating rates. The hysteresis loops were measured, at room temperature, with a Lakeshore 7404 vibrating sample magnetometer (VSM) (LakeShore, Westerville, Oh, USA) under an applied magnetic field of 1.5 T. Magnetization versus temperature comparisons were performed on a BS2 magnetometer developed at the Néel Institute. The demagnetization field effect might have been neglected because the sample was used in powder form. The demagnetization factor D = 0.027 was determined from the slope of the M(Happ) curve near zero field. The corrected magnetic field after subtraction of the demagnetization field is , where Happ is the applied magnetic field.
3. Results and Discussions
3.1. Hyperfine Structure
Mössbauer spectrometry of 57Fe enables the examination of the iron sites by the determination of the local Fe environment, composition variations and the spreading of Fe atoms. The coexistence of crystalline and amorphous magnetic phases is evidenced by the presence of sharp and widened magnetic lines, respectively, in the Mössbauer spectra of the Fe72Nb8B20 powders (Figure 1). The presence of nonmagnetic B and/or Nb atoms in the neighborhood of Fe atoms leads to the atomic disorder which is manifested by the enlargement of the Mössbauer lines. In order to identify the different Fe sites, the Mössbauer spectra were fitted by a least-squares MOSFIT program [27], by using two magnetic sextets (SS1, SS2), one paramagnetic doublet (SS3) and a hyperfine field distribution (HFD). The obtained hyperfine parameters magnetic field (Bhf), isomer shift (IS), quadrupolar splitting/shift (QS/2ε), line width (Γ) are presented in Table 1. The IS is related to α-Fe at room temperature.
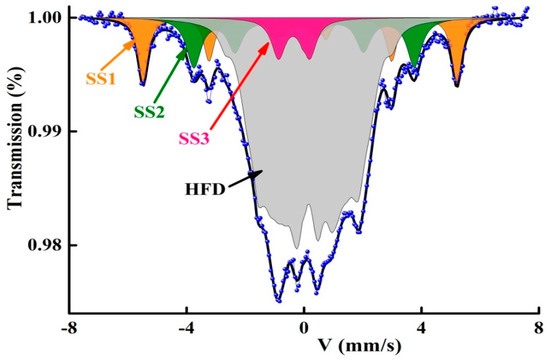
Figure 1.
Fitting of the Mössbauer spectrum with four components (SS1, SS2, SS3 and HFD).

Table 1.
Bhf, IS, 2ε, QS, Γ and percentage of the formed phases.
The hyperfine parameters of the sextet SS1 (Bhf = 33 T and IS = 0.011 mm/s) can be associated with an Fe-rich Fe(B) solid solution containing a very small concentration of boron atoms. Indeed, existence of one B atom as the nearest neighbor (nn) of an Fe atom raises IS by about 0.07 mm/s. In such Fe(B) sites, the average number of B atoms (nB) can be estimated from the linear relationship between the hyperfine magnetic field (Bhf) and the number of B atoms [28]: Bhf = 33.6–2.7nB. Accordingly, the number of B atoms in the sextet SS1 is about nB = 0.22. The sextet SS2 with B =23.2 T and IS = 0.062 mm/s, is ascribed to the Fe2B boride phase. The paramagnetic doublet with IS = −0.203 mm/s and QS = 0.996 mm/s can be linked to an Fe(Nb) solid solution, since the existence of one Nb atom as the first or second nn of an Fe atom diminishes IS by 0.04 mm/s [29]. The HFD is due to the existence of numerous non−equivalent Fe surroundings where the Fe atoms are mainly surrounded by B atoms in their neighborhoods. The HFD can be linked to a B-rich FeB amorphous matrix. These results agree well with XRD findings (not shown here) [26].
3.2. Thermal Analysis
The continuous heating DSC curves with several heating rates (5, 10, 15 and 20 K/min) are shown in Figure 2. The DSC scans exhibit two endothermic peaks at about ~389 K and 428 K that can be associated to the magnetic transition (TC) of the amorphous phase, since those of α−Fe (1043 K) and Fe2B (1015 K) are higher [30]. The existence of two TC might be related to the impurity phases and/or the distribution of Curie transitions in the highly disordered amorphous matrix. Similar results have been observed in other ball-milled powder alloys [31,32]. The obtained values are analogous to those of B containing alloys [17,18]. The broad exothermic peak in the temperature range 650−800 K can be attributed to the crystallization of the amorphous phase. The apparent activation energy under continuous heating conditions can be calculated by means of the Kissinger peak displacement method [33]: ln(β/T2) = −EA/RT + const., where β is the constant heating rate, R is the gas constant and T stands for the crystallization peak temperature. The activation energy EA = 342 ± 10 kJ/mol has been estimated from the linear fit of ln(β/T2) versus 1/T plot. This value can be linked to a grain growth process. A slightly different value of about 324 ± 35 kJ/mol has been found in the 80h ball-milled Fe74Nb6B20 powders [34]. Those discrepancies might be related to the milling conditions and the obtained phases.
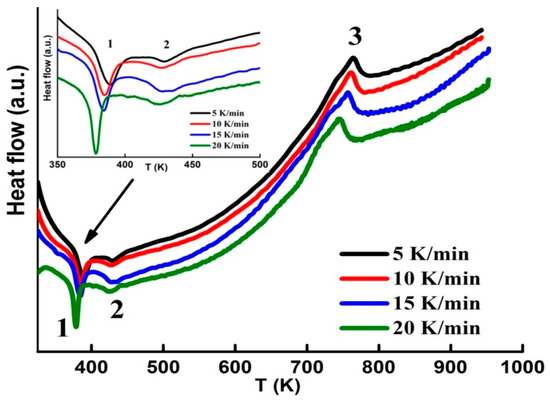
Figure 2.
DSC scans measured with several heating rates (the inset shows the first peak). Peaks 1 and 2 correspond to two FM-PM transitions, and peak 3 to the crystallization process.
3.3. Magnetic Properties
Figure 3 displays the hysteresis loops recorded at room temperature for the ball-milled and heat-treated powders after DSC analysis. The hysteresis loops show the same trend. They are saturated and exhibit a sigmoidal shape type. For the as-milled powders, the coercivity is 0.0302 T and the saturation magnetization is 92 emu/g. However, after DSC heat treatment, both the coercivity and saturation magnetization increased to ~0.0397 T and 181 emu/g, respectively. The increase in coercivity may be attributed to a higher number of non-magnetic phases and/or Fe2B boride. However, the increase in saturation magnetization might be correlated to the formation of α−Fe nanocrystals.
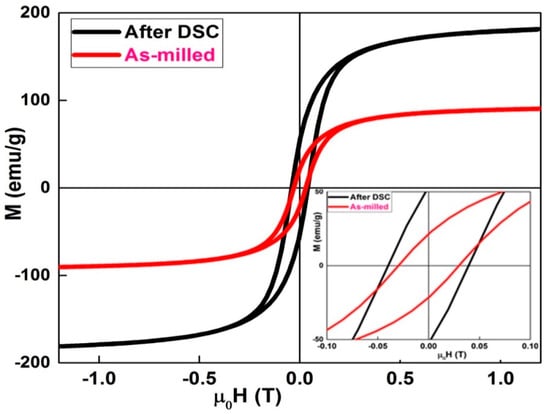
Figure 3.
Hysteresis cycles of the as-milled and heat treated Fe72Nb8B30 powders.
Figure 4 displays the magnetization as a function of temperature, M(T), measured in a magnetic field of 0.05 T. TC of the amorphous phase that corresponds to the minimum of δM/δT, was found to be 480 K. This value is higher than that observed in the DSC curves by about 100 K. The measured TC depends on the compositional heterogeneity, strain distribution, sample shape and/or the determination method, in particular in several constituent alloys [35]. During heating, the sensitivity of a reaction is related to its energy evolved as well as to the mass of the sample. In the M(T) curve, TC is usually determined from the drop of magnetization or the inflection point method, whereas, DSC detects TC as a heat flow variation owing to the small quantity of energy accompanying the ferromagnetic-to-paramagnetic phase transition. Hence, the endothermic reaction that happens below TC represents the absorbed energy during heating to induce randomization of the magnetic dipoles. Furthermore, the presence of many phases should impact the modification of the magnetization around TC. This later depends on the exchange interaction between the magnetic moments, which in turn depends on the distance between the magnetic atoms. Consequently, TC is dependent on the composition of the amorphous phase. For example, in the Fe80.5Nb7B12.5 melt-spun ribbons was found to be 363 K [18]. In the amorphous Fe100-xBx alloys (10≤ x ≤35 at. % B), of the amorphous phase increased with the augmentation of the boron content from 480 K for x = 10 up to 820 K for x = 28, and then decreased [36].
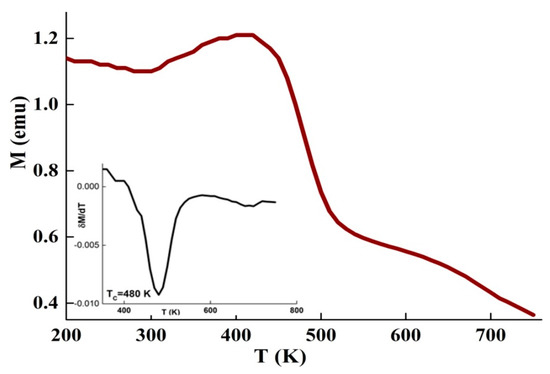
Figure 4.
Evolution of the magnetization against the temperature under H= 0.05 T. The derivative of δM/δT is presented in the inset.
3.4. Magnetocaloric Effect
Figure 5 displays the isothermal M(H) plots in the temperature range 400−700 K. The magnetocaloric behavior can be studied through the evaluation of the magnetic entropy changes ΔSM from the magnetization measurements by using the Maxwell Equation:
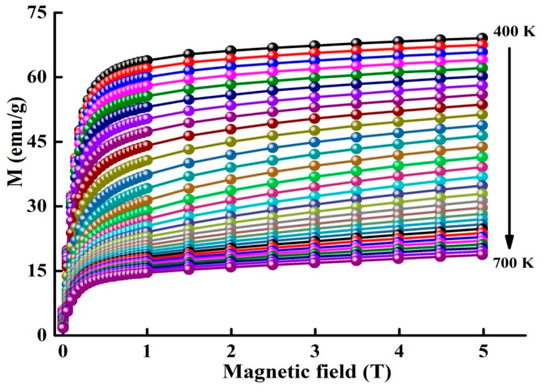
Figure 5.
Isothermal magnetization curves around at different temperatures.
With and the applied magnetic fields where , and . The numerical Maxwell’s Equation can be given by:
where and are the experimental data of the magnetization at and , respectively, under the magnetic field HC, the temperature dependence of change in magnetic entropy − ΔSM(T) is presented in Figure 6. The magnetic entropy change versus temperature shows a peak, which has been previously identified as . One also observes that ΔSM increases as the applied magnetic field rises and attains under 5 T. Different values of −ΔSM and (Table 2) are obtained for certain Fe-Nb-B alloys [17,18,37,38,39]. Those differences might be accredited to the experimental conditions such as the fabrication method, alloy composition, particle size and shape, structure, phase nature, matrix interactions, neighboring particles, etc. Those parameters have a deep effect on the magnetic behavior of a material.
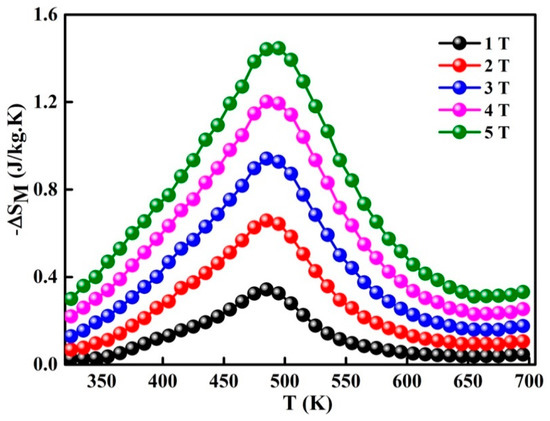
Figure 6.
Temperature dependence of change in magnetic entropy for different magnetic fields.
Table 2.
TC and −ΔSM(T) in amorphous and partially amorphous (partially am.) Fe-Nb-B alloys.
A linear dependence has been found between the maximum entropy change and log(H). The Equation is:
The linear fitting is (R2 = 0.9694). This tendency indicates that when increasing the applied magnetic field, the maximum entropy change increases (with a factor below that corresponding to magnetic field change).
The refrigerant capacity (RC) associated with the entropy variation represents a way to evaluate the magnetocaloric efficacy of materials. RC denotes the transferred quantity of warmth between the warm and cold tanks [40]. RC is determined experimentally from ΔSM(T) and the full width at half maximum (δTFWHM) of the peak entropy, since it is defined as follows:
The temperatures T1 and T2 are defined by δTFWHM of ΔSM(T) peak; as an example, T1 = 325 K and T2 = 650 K at 1 T. RC reaches 239 J/kg for a magnetic field change of 5 T.
3.5. Critical Behavior
The universal behavior of materials can be studied by the critical exponents (β, γ and δ) related to the phase transitions (Table 3). Four distinct conventional models [11] can be used to estimate the critical exponents β, and δ from the M(H) curves such as the: (i) mean field model related to long-range mean field theory, (ii) Heisenberg model correlated to short-range interactions, (iii) 3D-Ising model, and (iv) tricritical mean field model. The exponent β is correlated to the variation of the spontaneous magnetization as a function of temperature (MS ≈ (T − TC)β). It describes the ordered moment growth for ; γ is connected to the temperature dependence of the initial magnetic susceptibility against of the temperature ((χo)−1 ≈ (T − TC)γ). It defines the divergence of χo at TC, and δ is associated to with the critical isothermal magnetization. It designates the curvature of the isothermal magnetization curves M(H) at TC.
Table 3.
Critical exponents of Fe72Nb8B20 powders compared to those of theoretical models. MAP (modified Arrott plot), K-F (Kouvel-Fisher) and CI (critical isotherm).
The exponents β, γ and δ have been evaluated by using the modified Arrott plots (MAP) [41], Kouvel-Fisher plots (K–F)( [42,43] and critical isotherm (CI) methods according to evaluated by using Equations:
ε = (T-TC)/ TC is the reduced temperature; Mo, ho, and D are the critical amplitudes.
The modified Arrott plots around of the amorphous phase are presented in Figure 7. In order to determine the model that defines the system, it is necessary to evaluate the relative slope which is defined by the relationship between the slope at each temperature T, S(T), and the slope at TC, S(TC). RS is obtained from the linear fit of the high field area of each curve (Figure 8). Accordingly, the phase transition in the ball-milled Fe72Nb8B20 powders can be described by the mean field model because the relative slope RS is close to the unit.
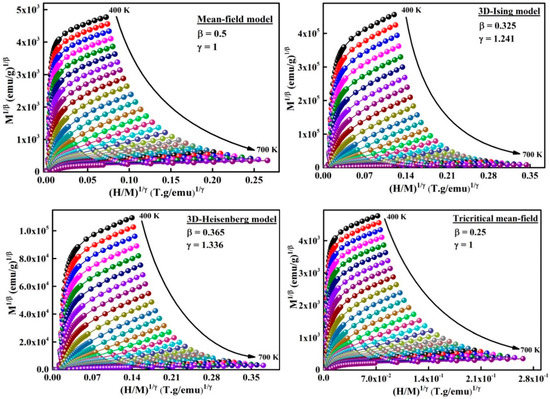
Figure 7.
Adapted Arrott plots versus from M(H) isotherms.
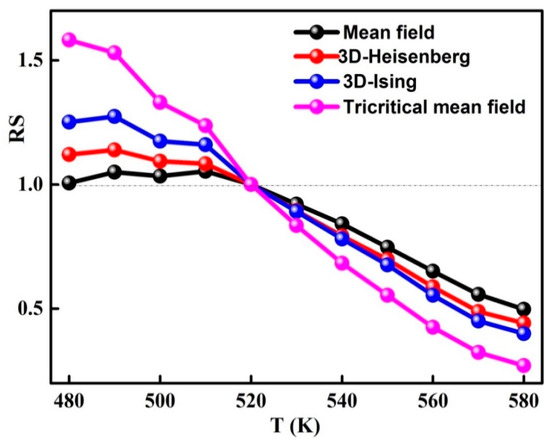
Figure 8.
Temperature reliance of the relative slope ( for different models.
The exponents β, γ can be deduced by fitting of MS(T,0) and curves by means of Equations (5) and (6), respectively (Figure 9). The determined values β = 0.457 ± 0.012 and γ = 0.863 ± 0.136 are reasonable and comparable to those of the mean field (Table 3). is approximately 40 K higher than that obtained from the M(T) curve. Those divergences might be correlated to the determination method. Moreover, the Kouvel-Fisher (K-F) method can be used to evaluate the critical exponents’ β and γ from the slopes 1/β and 1/γ of and plots versus temperature, respectively (Figure 10).
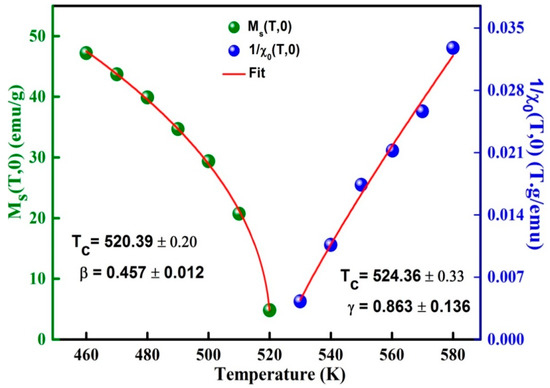
Figure 9.
Variation of and as a function of the temperature around TC.
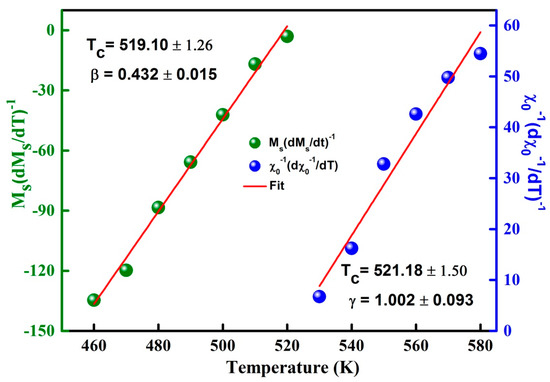
Figure 10.
K-F plots of and versus T.
One notes that β = 0.432 ± 0.015 and γ = 1.002 ± 0.093 values are also close to those of the mean field model. Likewise, the Widom scaling relationship permits the determination of the third exponent δ since it is related to β and γ exponent values through the subsequent Equation [44]:
By using the critical exponents β and γ that are deduced from the K–F method, the obtained δ value, δ = 2.888 ± 0.124 (Table 3), is similar to that estimated from the CI curves (Figure 11), δ = 3.090 ± 0.004. The scaling hypothesis confirms the reliability of the critical exponents and [45]:
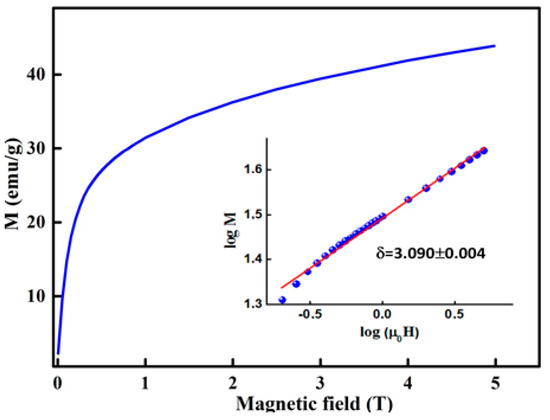
Figure 11.
M(H) critical isotherm curve. The insert shows the log-log plot.
The regular analytic functions f+ and f− are undertaken for T > TC and T < TC, respectively. Figure 12 displays the M|ε|-β as a function of H|ε|-(β+γ) are plotted in the vicinity of the Tc. The accuracy of the predicted critical exponents and is confirmed by the presence of two distinct branches below and above TC.
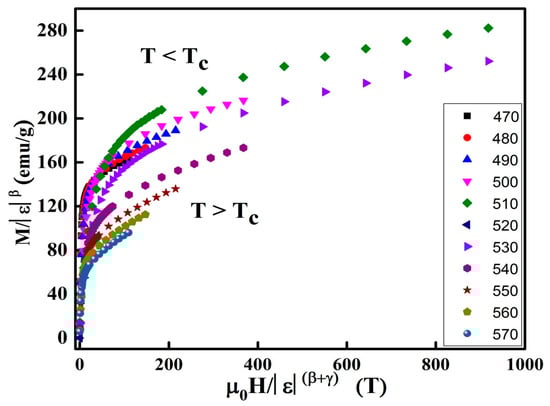
Figure 12.
Scaling plots in the vicinity of TC.
4. Conclusions
Partially amorphous Fe72Nb8B20 powders have been prepared by MA. The MCE, critical behavior, thermal, hyperfine structure and magnetic properties have been investigated. The milling process leads to nanocomposite type structure where nanocrystalline α−Fe(B), Fe(Nb) and Fe2B phases and embedded into an amorphous matrix. The detected endothermic and exothermic peaks in the DSC scans are related to the Curie temperature and crystallization of the amorphous phase, respectively. The saturation magnetization and the coercivity increase after the crystallization. The critical exponent’s values (β = 0.457 ± 0.012, γ = 0.863 ± 0.136 and δ = 3.090 ± 0.004) around , are near to those of the mean field model, with a dominating role of magnetic order arising due to long-range ferromagnetic interactions, as the critical exponents are mean-field-like. The maximum entropy change and the refrigerant capacity values are of about 1.45 J/kg·K and 239 J/kg, respectively, for an applied magnetic field of 5 T. These alloys, as magnetocaloric materials, are candidates to work in magnetic refrigeration devices (high temperature span applications) after consolidation in optimized geometries.
Author Contributions
Conceptualization: S.A. and J.-J.S.; methodology: E.-K.H., S.A.; experimental: T.C., N.B.; formal analysis: L.E., J.S., E.-K.H.; supervision: S.A., writing and editing: S.A. and J.-J.S. All authors have read and agreed to the published version of the manuscript.
Funding
This research was founded by the DGRSDT/MESRS-Algeria, the PHC-Maghreb 15 MAG07 program and the Spanish MINECO projects MAT2013-47231-C2-2-P and MAT2016-75967-P.
Conflicts of Interest
The authors declare no conflict of interest.
References
- Li, L.W. Review of magnetic properties and magnetocaloric effect in the intermetallic compounds of rare earth with low boiling point metals. Chin. Phys. B 2016, 25, 037502. [Google Scholar] [CrossRef]
- Poddar, P.; Srinath, S.; Gass, J.; Prasad, B.L.V.; Srikanth, H.J. Magnetic transition and large magnetocaloric effect associated with surface spin disorder in Co and CocoreAgshell nanoparticles. Phys. Chem. C. 2007, 111, 14060–14066. [Google Scholar] [CrossRef]
- Bjørk, R.; Nielsen, K.K.; Bahl, C.R.H.; Smith, A.; Wulff, A.C. Comparing superconducting and permanent magnets for magnetic refrigeration. AIP ADV. 2016, 6, 056205. [Google Scholar] [CrossRef]
- Skomski, R.; Binek, C.; Mukherjee, T.; Sahoo, S.; Sellmyer, D.J. Temperature and field induced entropy changes in nanomagnets. J. Appl. Phys. 2008, 103, 07B329. [Google Scholar] [CrossRef]
- Franco, V.; Conde, A.; Sidhaye, D.; Prasad, B.L.V.; Poddar, P.J. Field dependence of the magnetocaloric effect in core-shell nanoparticles. J. Appl. Phys. 2010, 107, 09A902. [Google Scholar] [CrossRef]
- Ho, T.A.; Lin, S.H.; Phan, T.L.; Yu, S.C. Universal curves in assessing the order of magnetic transition of La0.7−xPrxCa0.3MnO3 compounds exhibiting giant magnetocaloric effect. J. Alloys Compd. 2017, 692, 687. [Google Scholar] [CrossRef]
- Thang, N.V.; van Dijk, N.H.; Brück, E. Tuneable giant magnetocaloric effect in (Mn,Fe)2(P,Si) materials by Co-B and Ni-B Co-doping. Materials 2017, 10, 14. [Google Scholar] [CrossRef]
- Zaidi, N.; Mnefgui, S.; Dhahri, J.; Hlil, E.K. Structural and critical behavior near the ferromagnetic-paramagnetic phase transition in La0.6Pr0.1Sr0.3Mn1−xRuxO3 (x = 0.00, 0.05 and 0.15) perovskites. J. Magn. Magn. Mat. 2017, 432, 511. [Google Scholar] [CrossRef]
- Tlili, R.; Bejar, M.; Dhahri, E.; Zaoui, A.; Hlil, E.K.; Bessais, L. Influence of crystallite size reduction on the magnetic and magnetocaloric properties of La0.6Sr0.33Ca0.05CoO3 nanoparticles. Polyhedron 2017, 121, 19–24. [Google Scholar] [CrossRef]
- Dhahri, M.; Dhahri, J.; Hlil, E.K. Critical behavior near the ferromagnetic to paramagnetic phase transition temperature in polycrystalline La0.5Sm0.1Sr0.4Mn1−xInxO3 (0 ≤ x ≤ 0.1). J. Magn. Magn. Mat. 2017, 434, 100. [Google Scholar] [CrossRef]
- Huang, K. Statistical mechanics, 2nd ed.; Wiley: New York, NY, USA, 1987. [Google Scholar]
- Makino, A.; Inoue, A.; Masumoto, T. Nanocrystalline soft magnetic Fe-M-B (M = Zr, Hf, Nb), Fe-M-O (M= Zr, Hf, rare earth) alloy and their applications. Nanostr. Mater. 1999, 12, 825–828. [Google Scholar] [CrossRef]
- Makino, A.; Hatanai, T.; Inoue, A.; Matsumoto, T. Nanocrystalline soft magnetic Fe-M-B (M = Zr, Hf, Nb) and their applications. Mater. Sci. Eng. A 1997, 226–228, 594–602. [Google Scholar] [CrossRef]
- McHenry, M.E.; Willard, M.A.; Laughlin, D.E. Amorphous and nanocrystalline materials for applications as soft magnets. Prog. Mater. Sci. 1999, 44, 291–433. [Google Scholar] [CrossRef]
- Li, W.; Yang, Y.Z.; Xu, J.; Xie, C.X. High field magnetization and mean field theory in amorphous Co75Er17B8 ribbons. J. Supercond. Nov. Magn. 2017, 30, 1877. [Google Scholar] [CrossRef]
- Stoica, M.; Hajlaoui, K.; Das, J.; Eckert, J.; Yavari, A.R. FeNbB bulk metallic glass with high boron content. Rev. Adv. Mater. Sci. 2008, 18, 61–65. [Google Scholar]
- Min, S.G.; Kim, K.S.; Yu, S.C.; Lee, K.W. The magnetization behavior and magnetocaloric effect in amorphous Fe-Nb-B ribbons. Mat. Sci. Eng. 2007, 451, 423–425. [Google Scholar] [CrossRef]
- Škorvánek, I.; Kováč, J. Magnetocaloric behavior in amorphous and nanocrystalline FeNbB soft magnetic alloys. Czechoslovak J. Phys. 2004, 54, 189–192. [Google Scholar] [CrossRef]
- Alleg, S.; Souilah, S.; Dadda, K.; Suñol, J.J.; Hlil, E.K.; Lassri, H. Investigation on the critical behavior and magnetocaloric properties in the nanocrystalline CuNi powders. J. Magn. Magn. Mat. 2017, 444, 54–60. [Google Scholar] [CrossRef]
- Riahi, A.; Messaoui, I.; Cheikhrouhou-Koubaa, W.; Mercone, S.; Leridon, B.; Koubaa, M.; Cheikhrouhou, A. Effect of synthesis route on the structural, magnetic and magnetocaloric properties of La0.78Dy0.02Ca0.2MnO3 manganite: A comparison between sol-gel, high-energy ball-milling and solid state process. J. Alloys Compd. 2016, 688, 1028–1038. [Google Scholar] [CrossRef]
- Assoudi, N.; Walha, I.; Dhahri, E.; Alleg, S.; Hlil, E.K. Structural, magnetic and magnetocaloric properties near the paramagnetic to ferromagnetic phase transition in La0.5SrxCa0.4MnO3 compounds. Sol. Stat. Comm. 2018, 277, 13–18. [Google Scholar] [CrossRef]
- Henchiri, C.; Mnasri, T.; Benali, A.; Hamdi, R.; Dhahri, E.; Valente, M.A.; Costa, B.F.O. Structural study and large magnetocaloric entropy change at room temperature of La1-xSrxMnO3 compounds. RSC Adv. 2020, 10, 8352–8363. [Google Scholar] [CrossRef]
- Dadda, K.; Alleg, S.; Souilah, S.; Suñol, J.J.; Dhahri, E.; Bessais, L.; Hlil, E.K. Critical behavior, magnetic and magnetocaloric properties of melt-spun Ni50Mn35Sn15 ribbons. J. Alloys Compd. 2018, 735, 1662–1672. [Google Scholar] [CrossRef]
- Dadda, K.; Alleg, S.; Suñol, J.J.; Bessais, L.; Hlil, E.K. Structure, manetocaloric effect and crutucal behavior in Ni50Mn30(Sn,In)20 Heusler alloys. J. Supercond. Nov Magn. 2020, 33, 2209–2218. [Google Scholar] [CrossRef]
- Blazquez, J.S.; Ipus, J.J.; Moreno-Ramırez, L.M.; Alvarez-Gomez, J.M.; Sanchez-Jimenez, D.; Lozano-Perez, S.; Franco, V.; Conde, A. Ball milling as a way to produce magnetic and magnetocaloric materials: A review. J. Mater. Sci. 2017, 52, 11834–11850. [Google Scholar] [CrossRef]
- Chabi, T.; Bensebaa, N.; Alleg, S.; Azzaza, S.; Suñol, J.J.; Hlil, E.K. Effect of the boron content on the amorphization process and magnetic properties of the mechanically alloyed Fe92−xNb8Bx powders. J. Supercond. Nov. Magn. 2019, 32, 893–901. [Google Scholar] [CrossRef]
- Varret, F.; Teillet, J. Unpublished Mosfit Program; Université du Maine: Le Mans, France, 1976. [Google Scholar]
- Barinov, V.A.; Tsurin, V.A.; Voronin, V.I.; Novikov, S.I.; Surikov, V.T. Mössbauer investigations of the metastable Fe23B6 phase. Phys. Met. Metallogr. 2006, 101, 496–507. [Google Scholar] [CrossRef]
- Van der Woode, F.; Maring, K.W. The electronic and magnetic properties of iron-sp element alloys. In Proceedings of the Mössbauer Effect ICAME 77, Bucharest Romania, September 1977; Barb, D., Jarinã, D., Eds.; p. 133. [Google Scholar]
- Wang, D.; Ma, L.; Li, L.; Xu, X.L.; Guo, Y.B.; Zhao, S.Q. Characterization of polycrystalline Fe2B compound with high saturation magnetization. J. Supercond Nov Magn 2018, 31, 431–435. [Google Scholar] [CrossRef]
- Alleg, S.; Brahimi, A.; Azzaza, S.; Souilah, S.; Zergoug, M.; Suñol, J.J.; Greneche, J.M. X-ray diffraction, Mössbauer spectrometry and thermal studies of the mechanically alloyed (Fe1−xMnx)2P powders. Adv. Pow. Techn. 2018, 29, 257–265. [Google Scholar] [CrossRef]
- Alleg, S.; Rihia, G.; Sunol, J.J. Structural evolution of the ball milled Ni70P30 powders. Ann. Chim. Sci. Mat. 2009, 34, 267–273. [Google Scholar] [CrossRef]
- Kissinger, H.E. Variation of peak temperature with heating in differential thermal analysis. J. Res. Nat. Bur. Stand. 1956, 57, 217–221. [Google Scholar] [CrossRef]
- Suñol, J.J.; González, A.; Saurina, J.; Escoda, L.; Bruna, P. Thermal and structural characterization of Fe-Nb-B alloys prepared by mechanical alloying. Mater. Sci. Eng. 2004, 377, 874–880. [Google Scholar]
- Zverev, V.I.; Gimaev, R.R.; Tishin, A.M.; Mudryk, Y.; Gschneidner, K.A., Jr.; Pecharsky, V.K. The role of demagnetization factor in determining the true value of the Curie temperature. J. Magn. Magn. Mater. 2011, 323, 2453–2457. [Google Scholar] [CrossRef]
- Nakajima, T.; Kita, E.; Ino, H. Crystallization process and magnetic properies of Fe100−xBx (10 ≤ x ≤ 35) amorphous alloys and supersaturated state of boron in α-Fe. J. Mater. Sci. 1988, 23, 1279–1288. [Google Scholar] [CrossRef]
- Shishkin, D.A.; Volegov, A.S.; Baranov, N.V. The thermomechanical stability of Fe based amorphous ribbons exhibiting magnetocaloric effect. App. Phys. A: Mater. Sci. Proces. 2016, 122, 1002. [Google Scholar] [CrossRef]
- Ipus, J.J.; Blázquez, J.S.; Franco, V.; Conde, A.; Kiss, L.F. Magnetocaloric response of Fe75Nb10B15 powders partially amorphized by ball milling. J. App. Phys. 2009, 105, 123922. [Google Scholar] [CrossRef]
- Ipus, J.J.; Blázquez, J.S.; Conde, C.F.; Borrego, J.M.; Franco, V.; Lozano-Pérez, S.; Conde, A. Relationship between mechanical amorphization and boron integration during processing of Fe-Nb-B alloys. Intermetallics 2014, 49, 98–105. [Google Scholar] [CrossRef]
- Wood, M.E.; Potter, W.H. General analysis of magnetic refrigeration and its optimization using a new concept: Maximization of refrigerant capacity. Cryogenics 1985, 25, 667–683. [Google Scholar] [CrossRef]
- Arrott, A.; Noakes, J.E. Approximative equation of state for nickel near its critical temperature. Phys. Rev. Lett. 1967, 19, 789. [Google Scholar] [CrossRef]
- Fisher, M.E.; Ma, S.K.; Nickel, B.G. Critical exponents for long-range interactions. Phys. Rev. Lett. 1972, 29, 917–920. [Google Scholar] [CrossRef]
- Kouvel, J.S.; Fisher, M.E. Detailed magnetic behavior of nickel near its Curie point. Phys. Rev. 1964, 136, 1626–1632. [Google Scholar] [CrossRef]
- Widom, B. Surface tension and molecular correlations near the critical point. J. Chem. Phys. 1965, 43, 3892–3897. [Google Scholar] [CrossRef]
- Stanley, H.E. Introduction to phase transitions and critical phenomena (International series of monographs on Physics); Oxford University Press: London, UK, 1971. [Google Scholar]
© 2020 by the authors. Licensee MDPI, Basel, Switzerland. This article is an open access article distributed under the terms and conditions of the Creative Commons Attribution (CC BY) license (http://creativecommons.org/licenses/by/4.0/).