Evolution of Recrystallized Grain and Texture of Cold-Drawn Pure Mg Wire and Their Effect on Mechanical Properties


Abstract
1. Introduction
2. Materials and Methods
2.1. Materials
2.2. Methods
3. Results
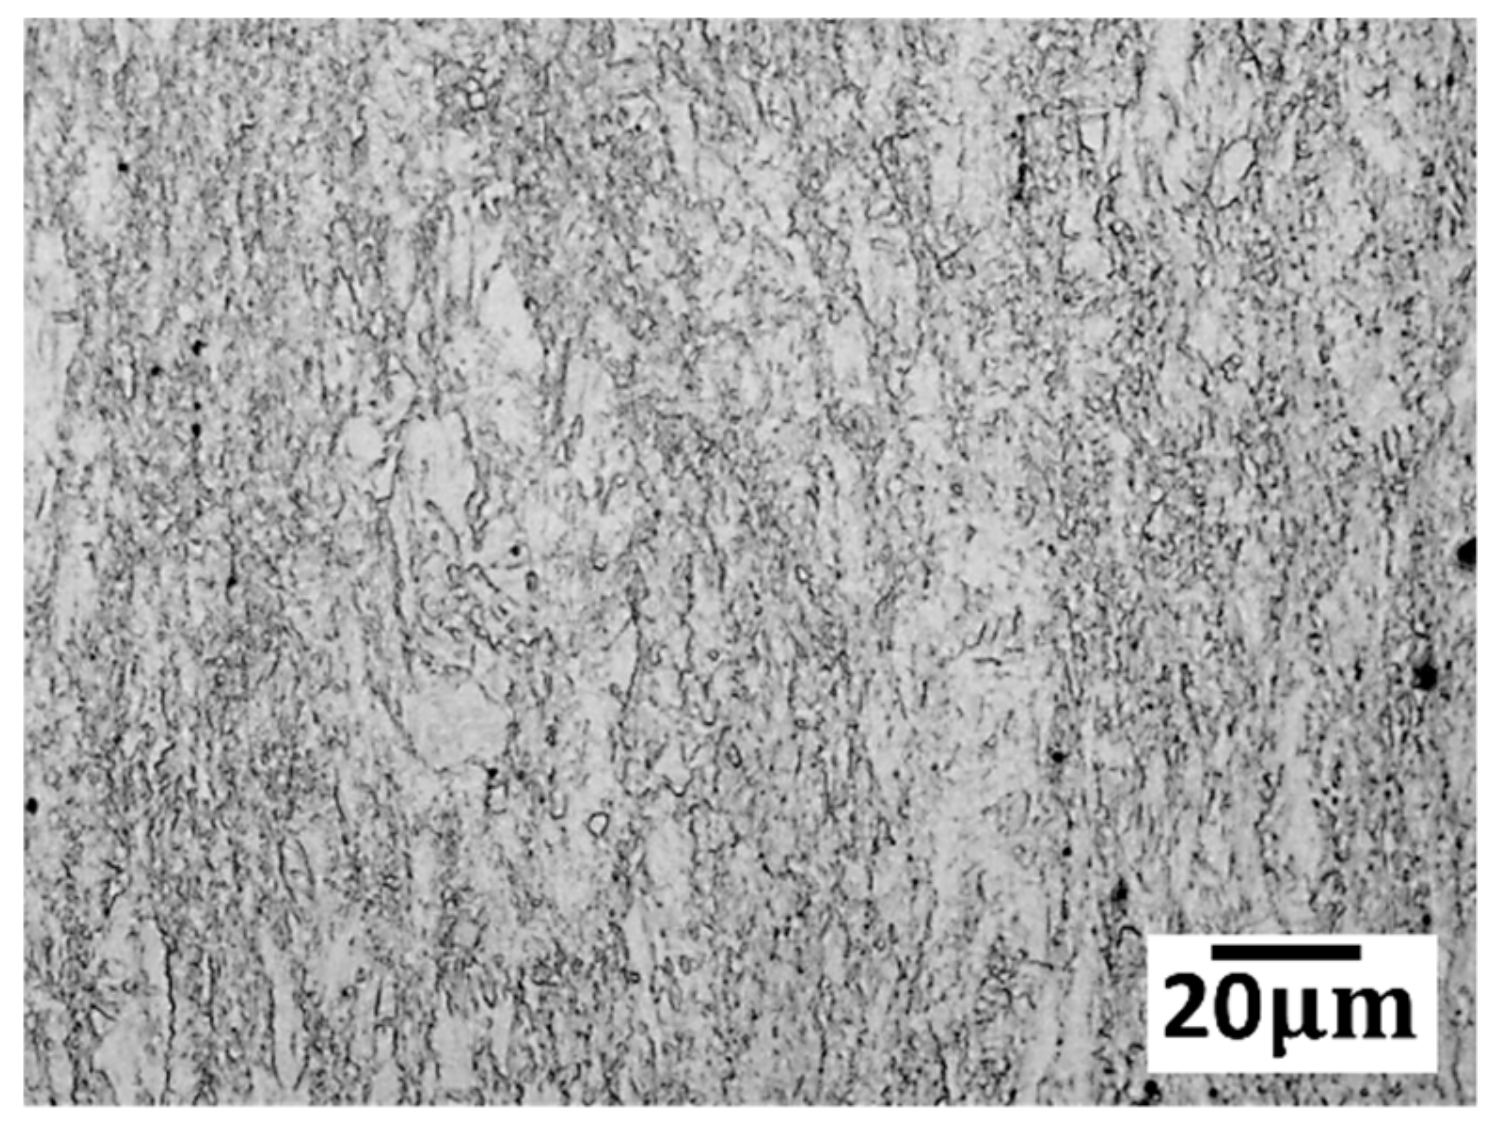
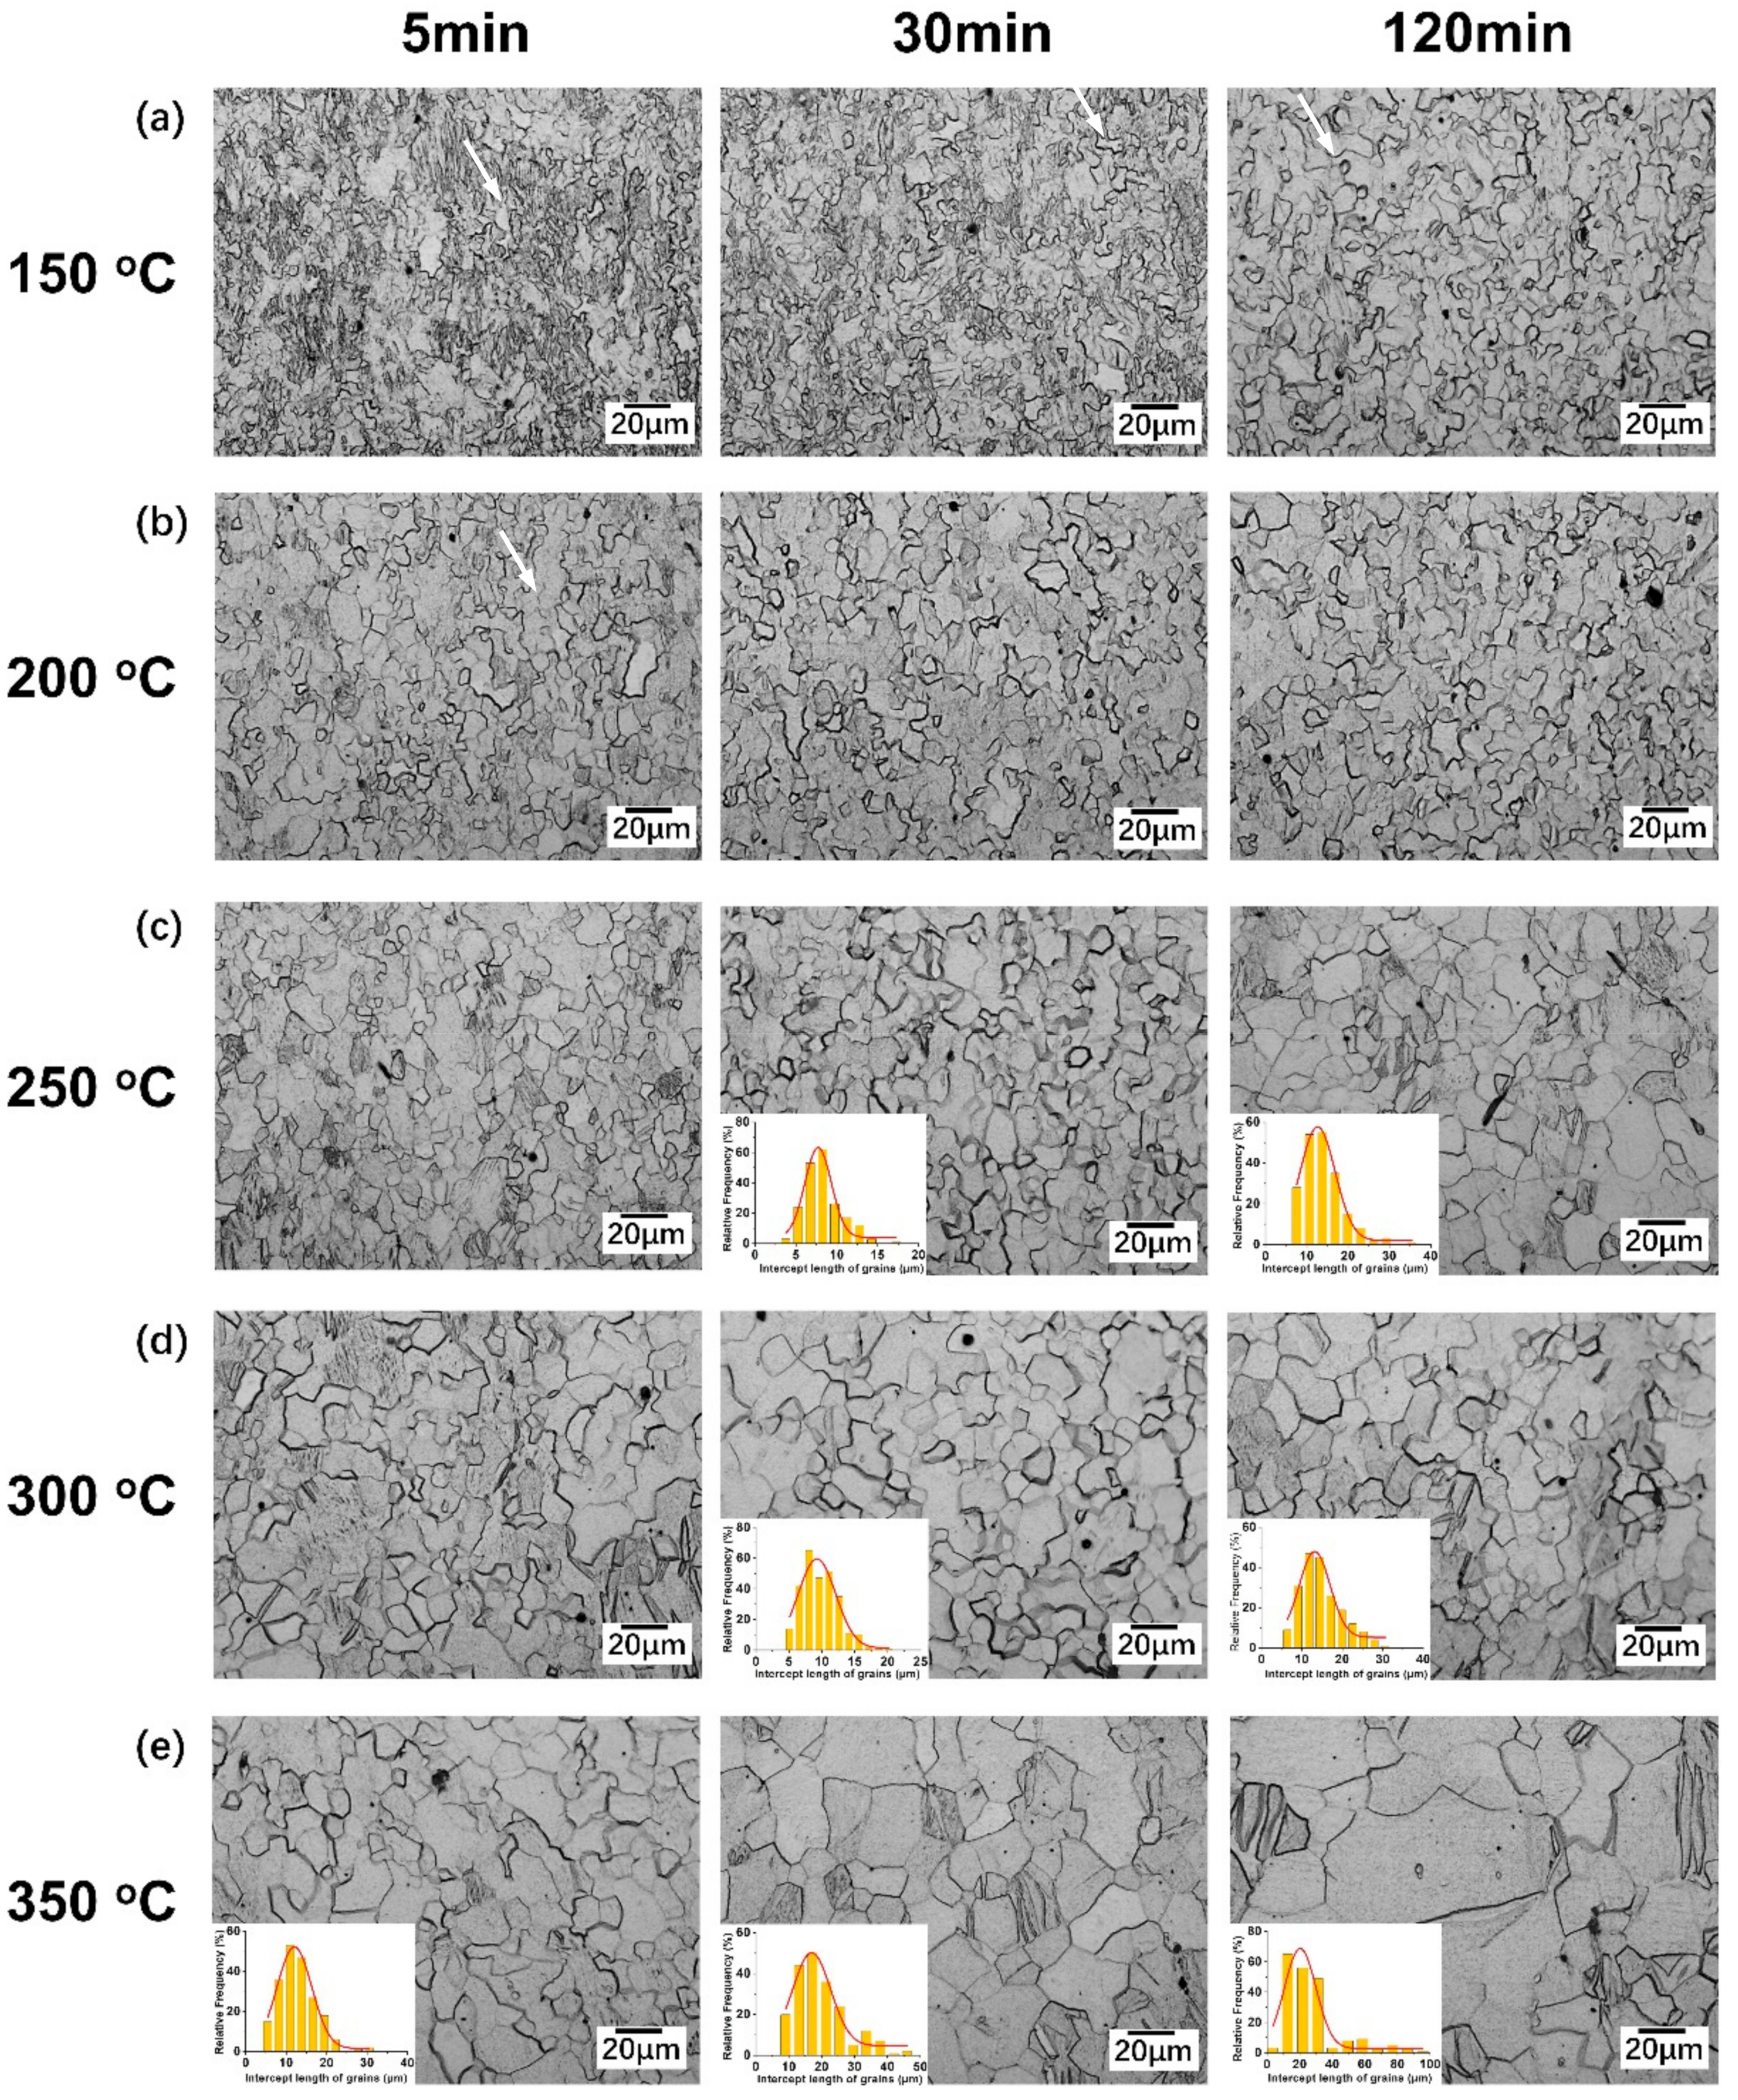
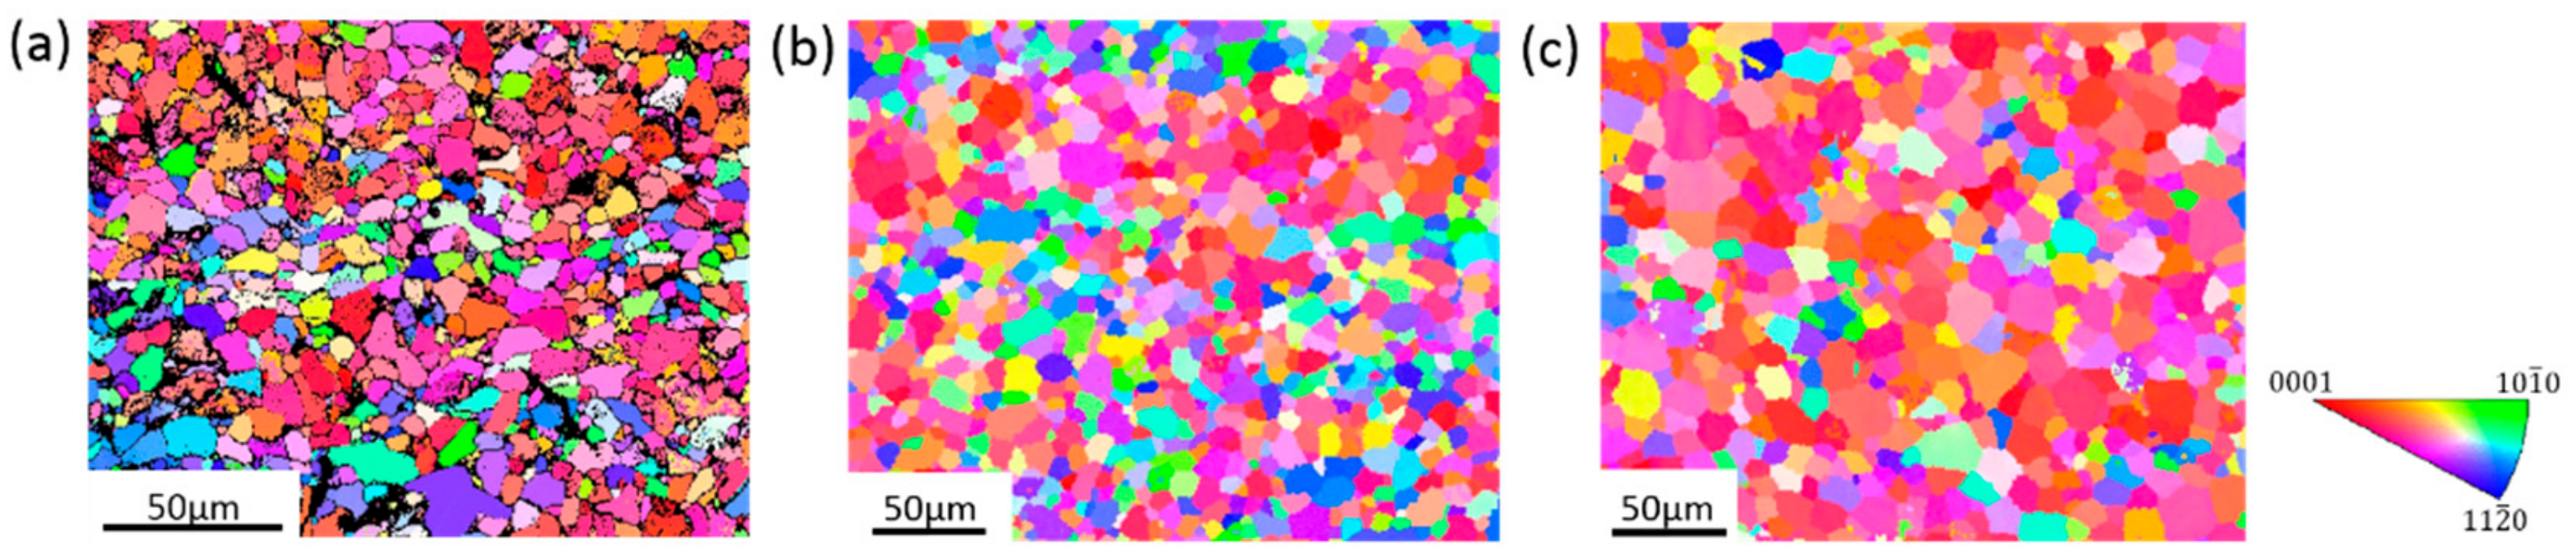
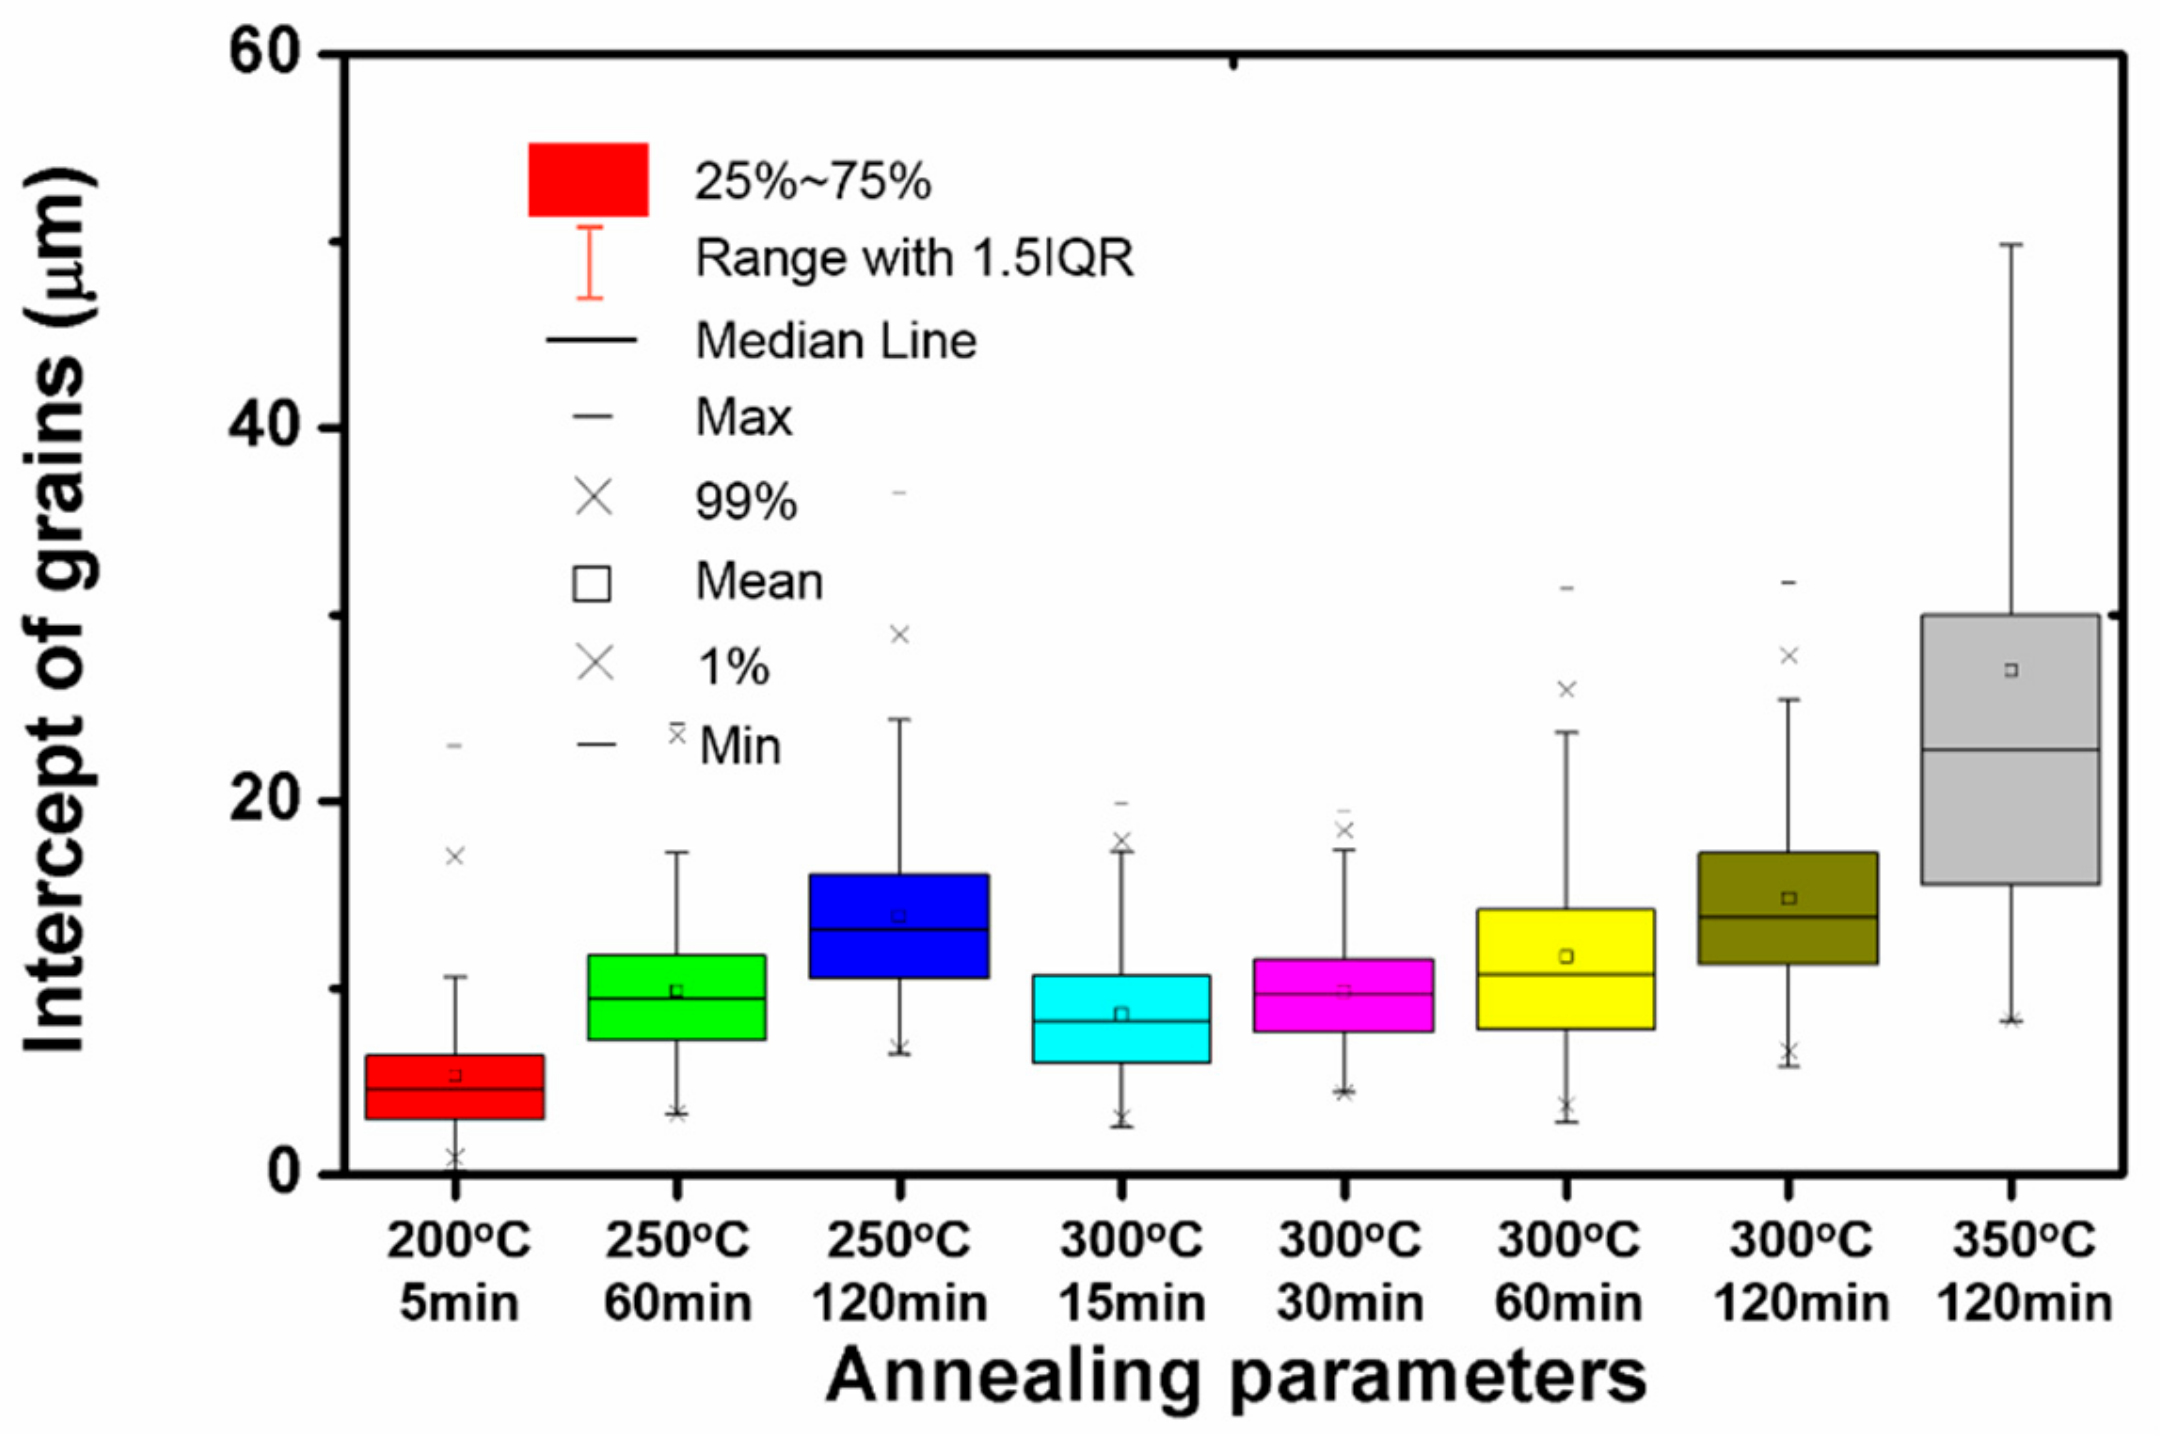
3.1. Microstructure
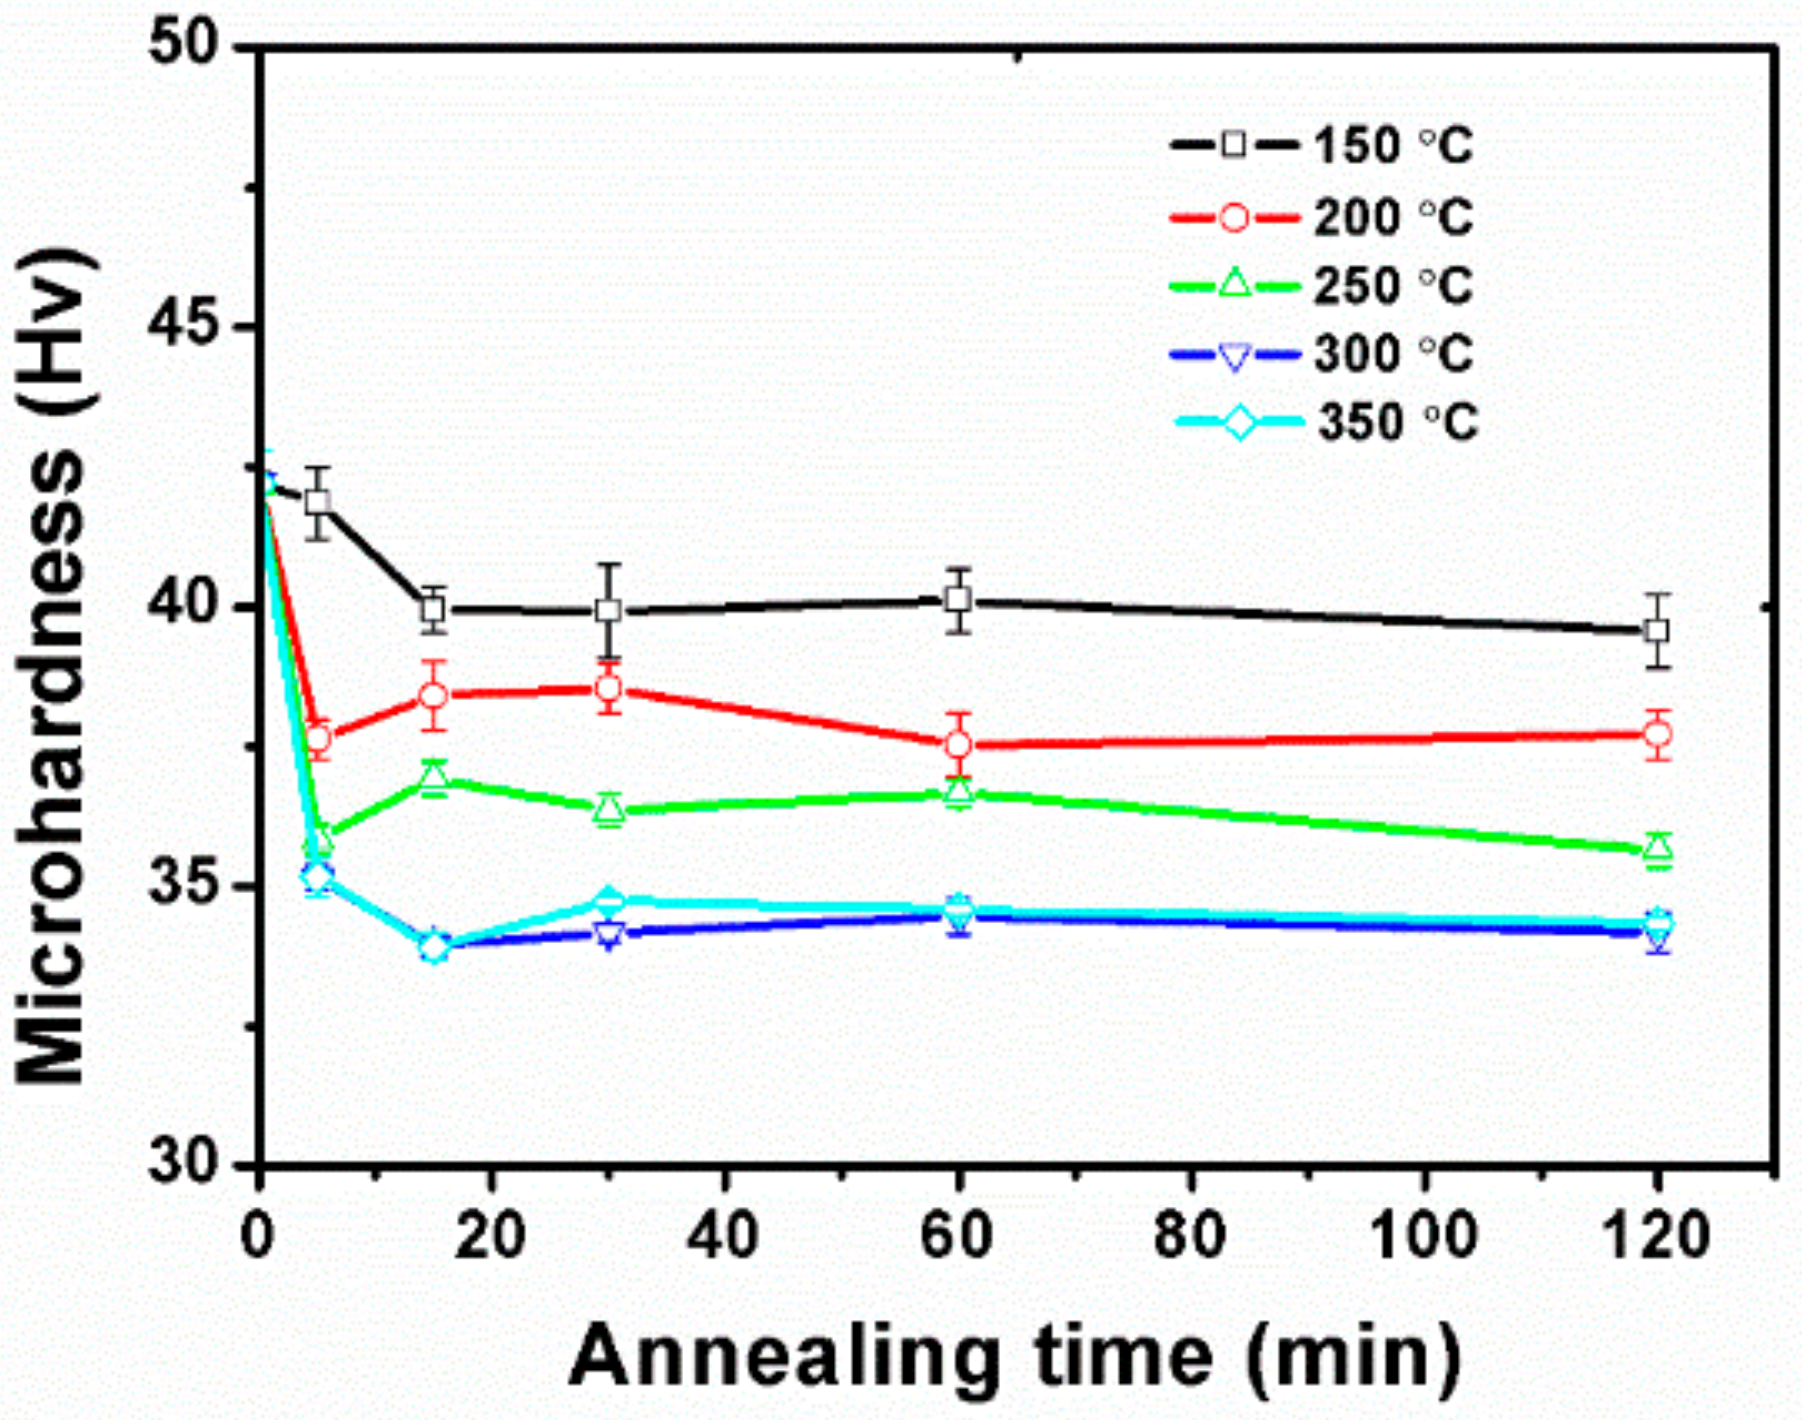
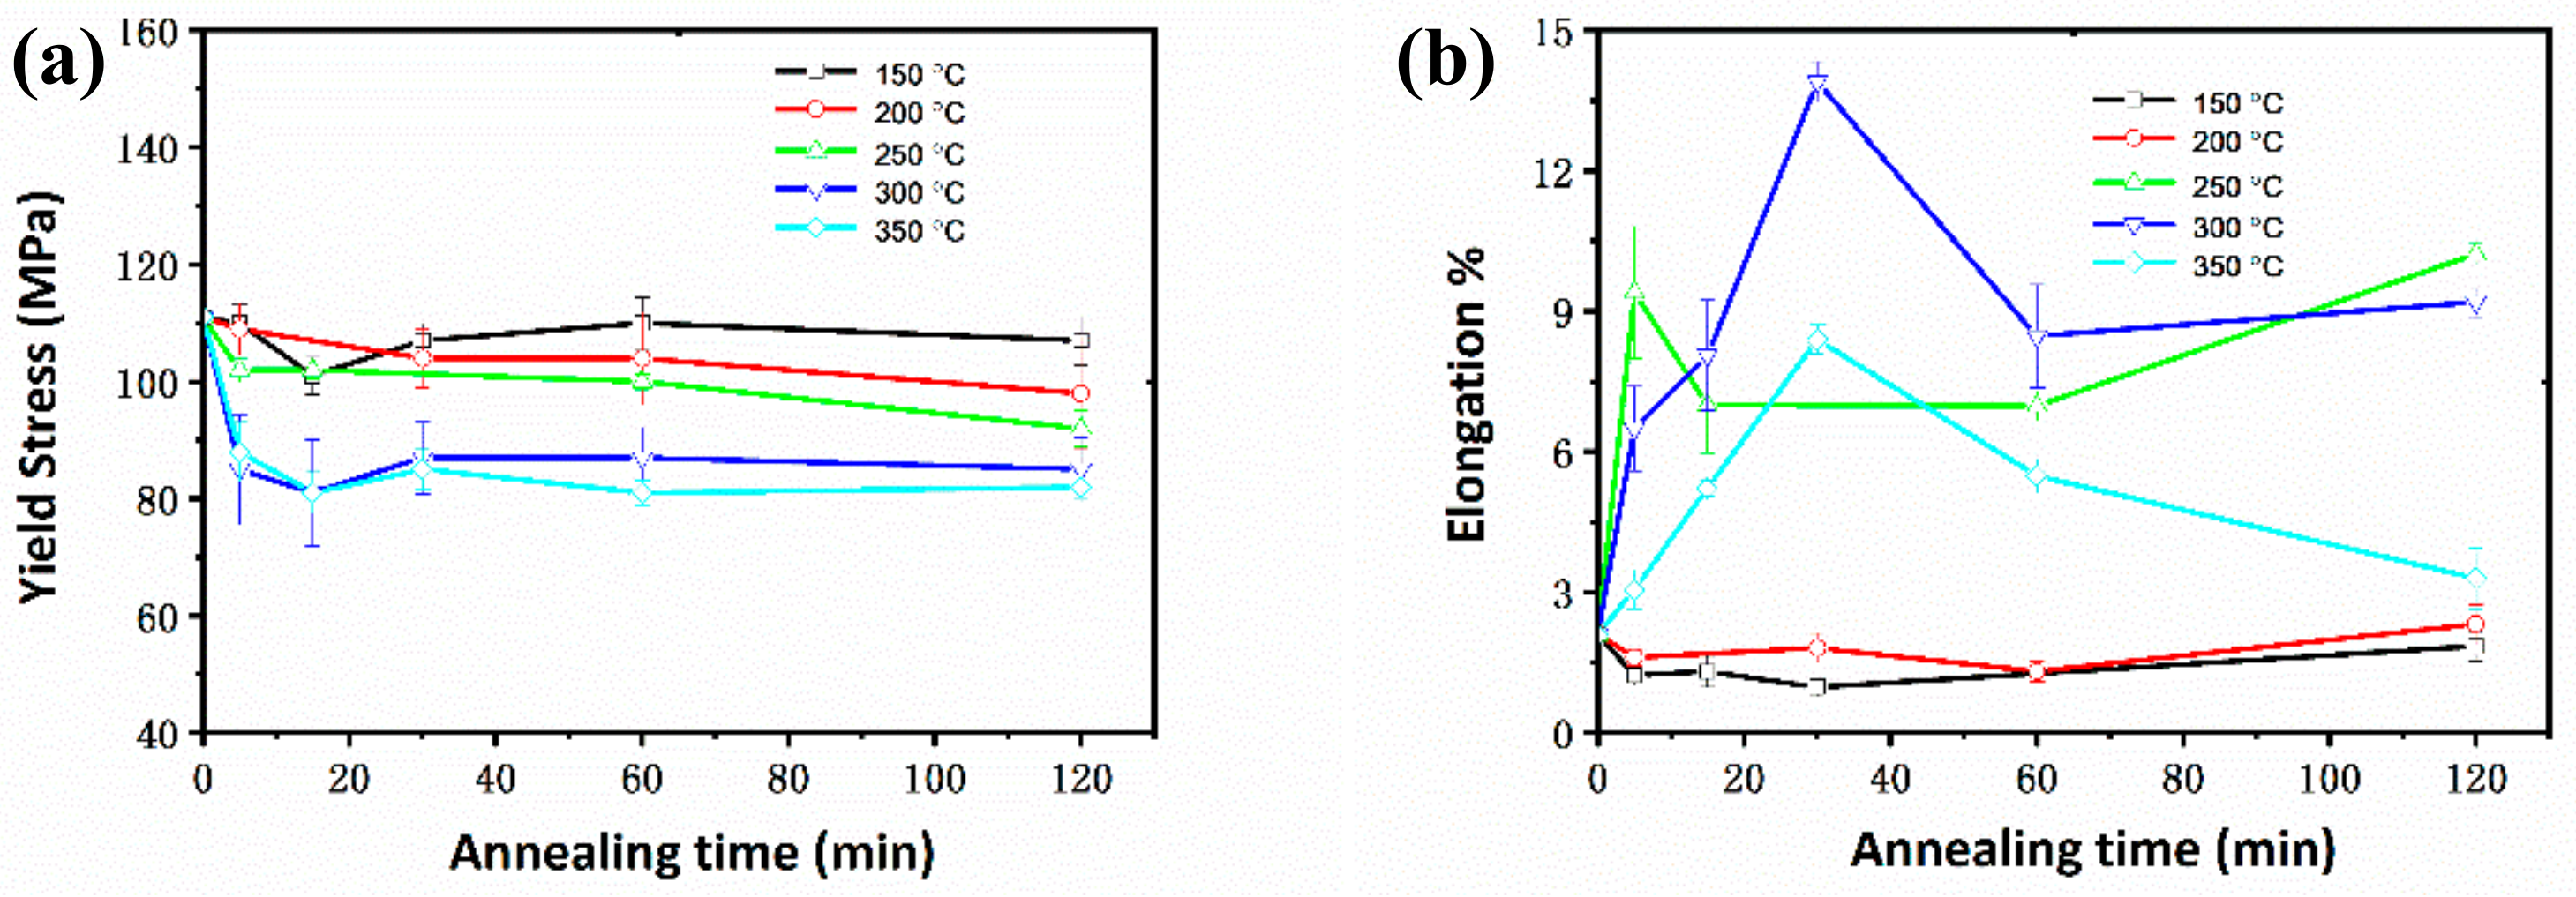
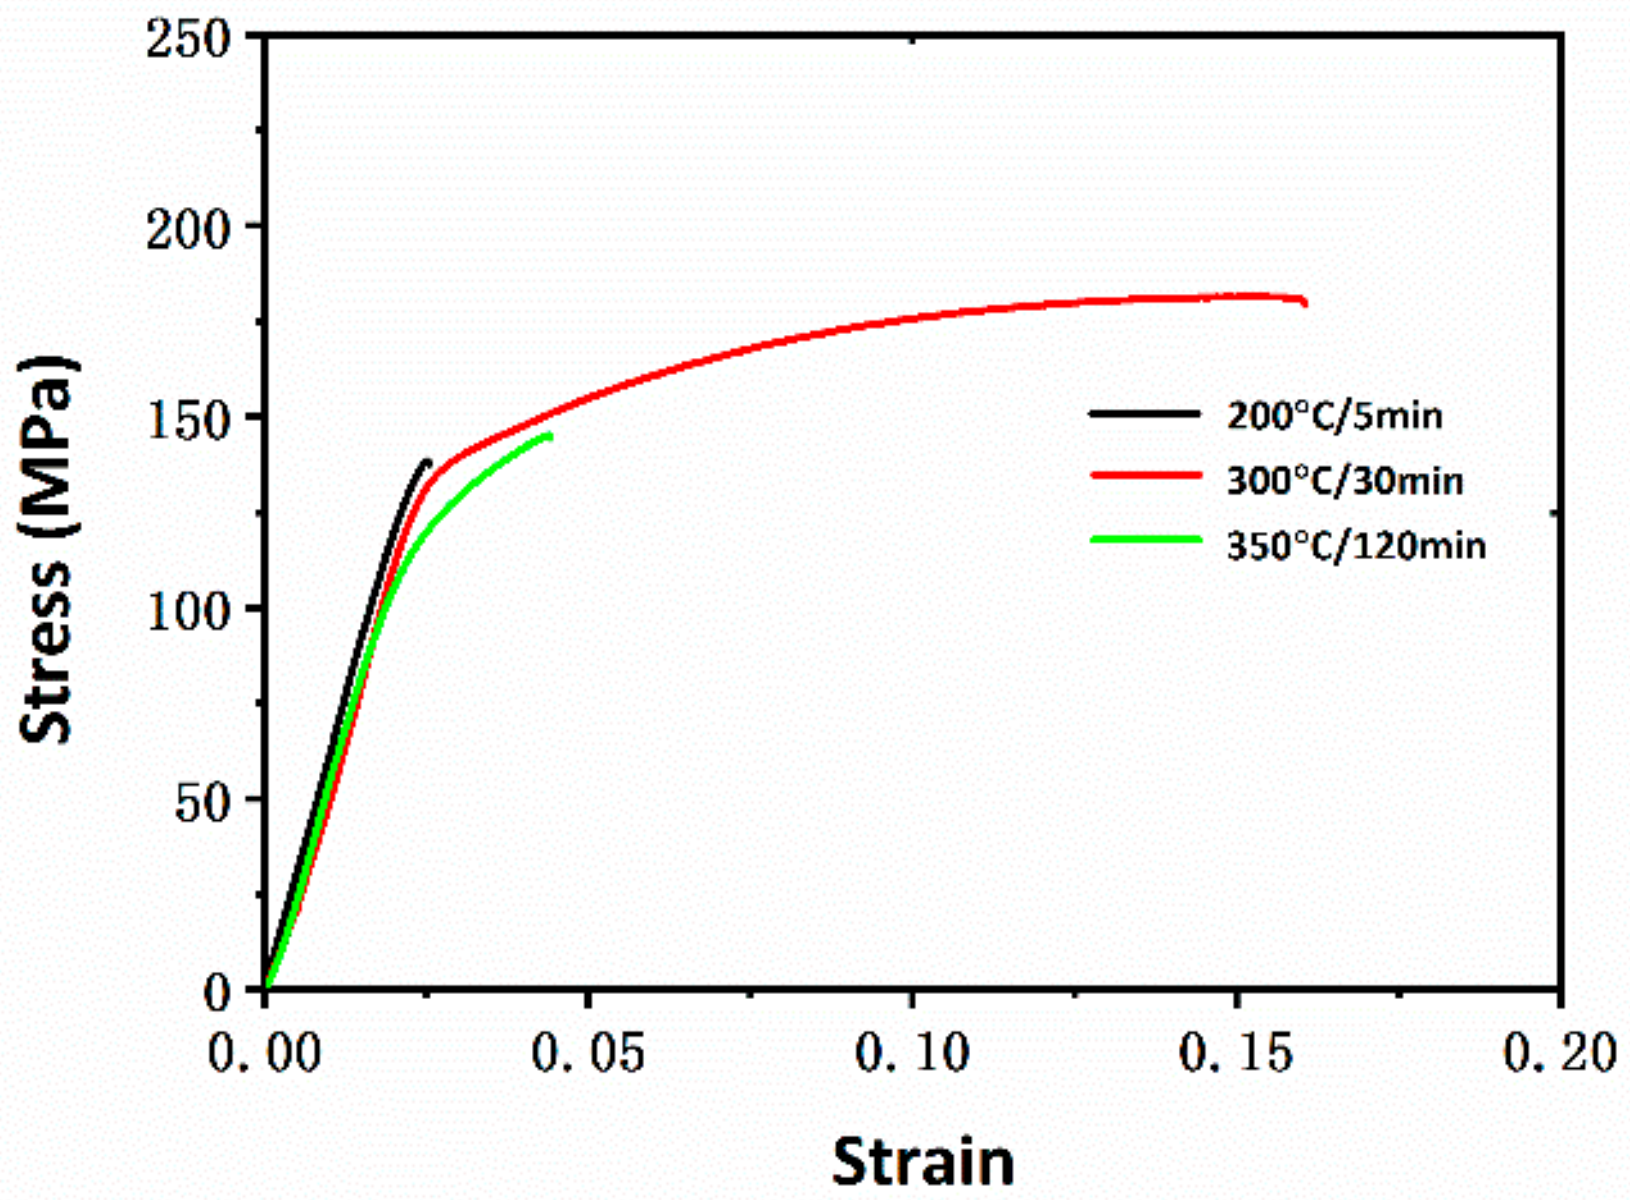
3.2. Mechanical Properties
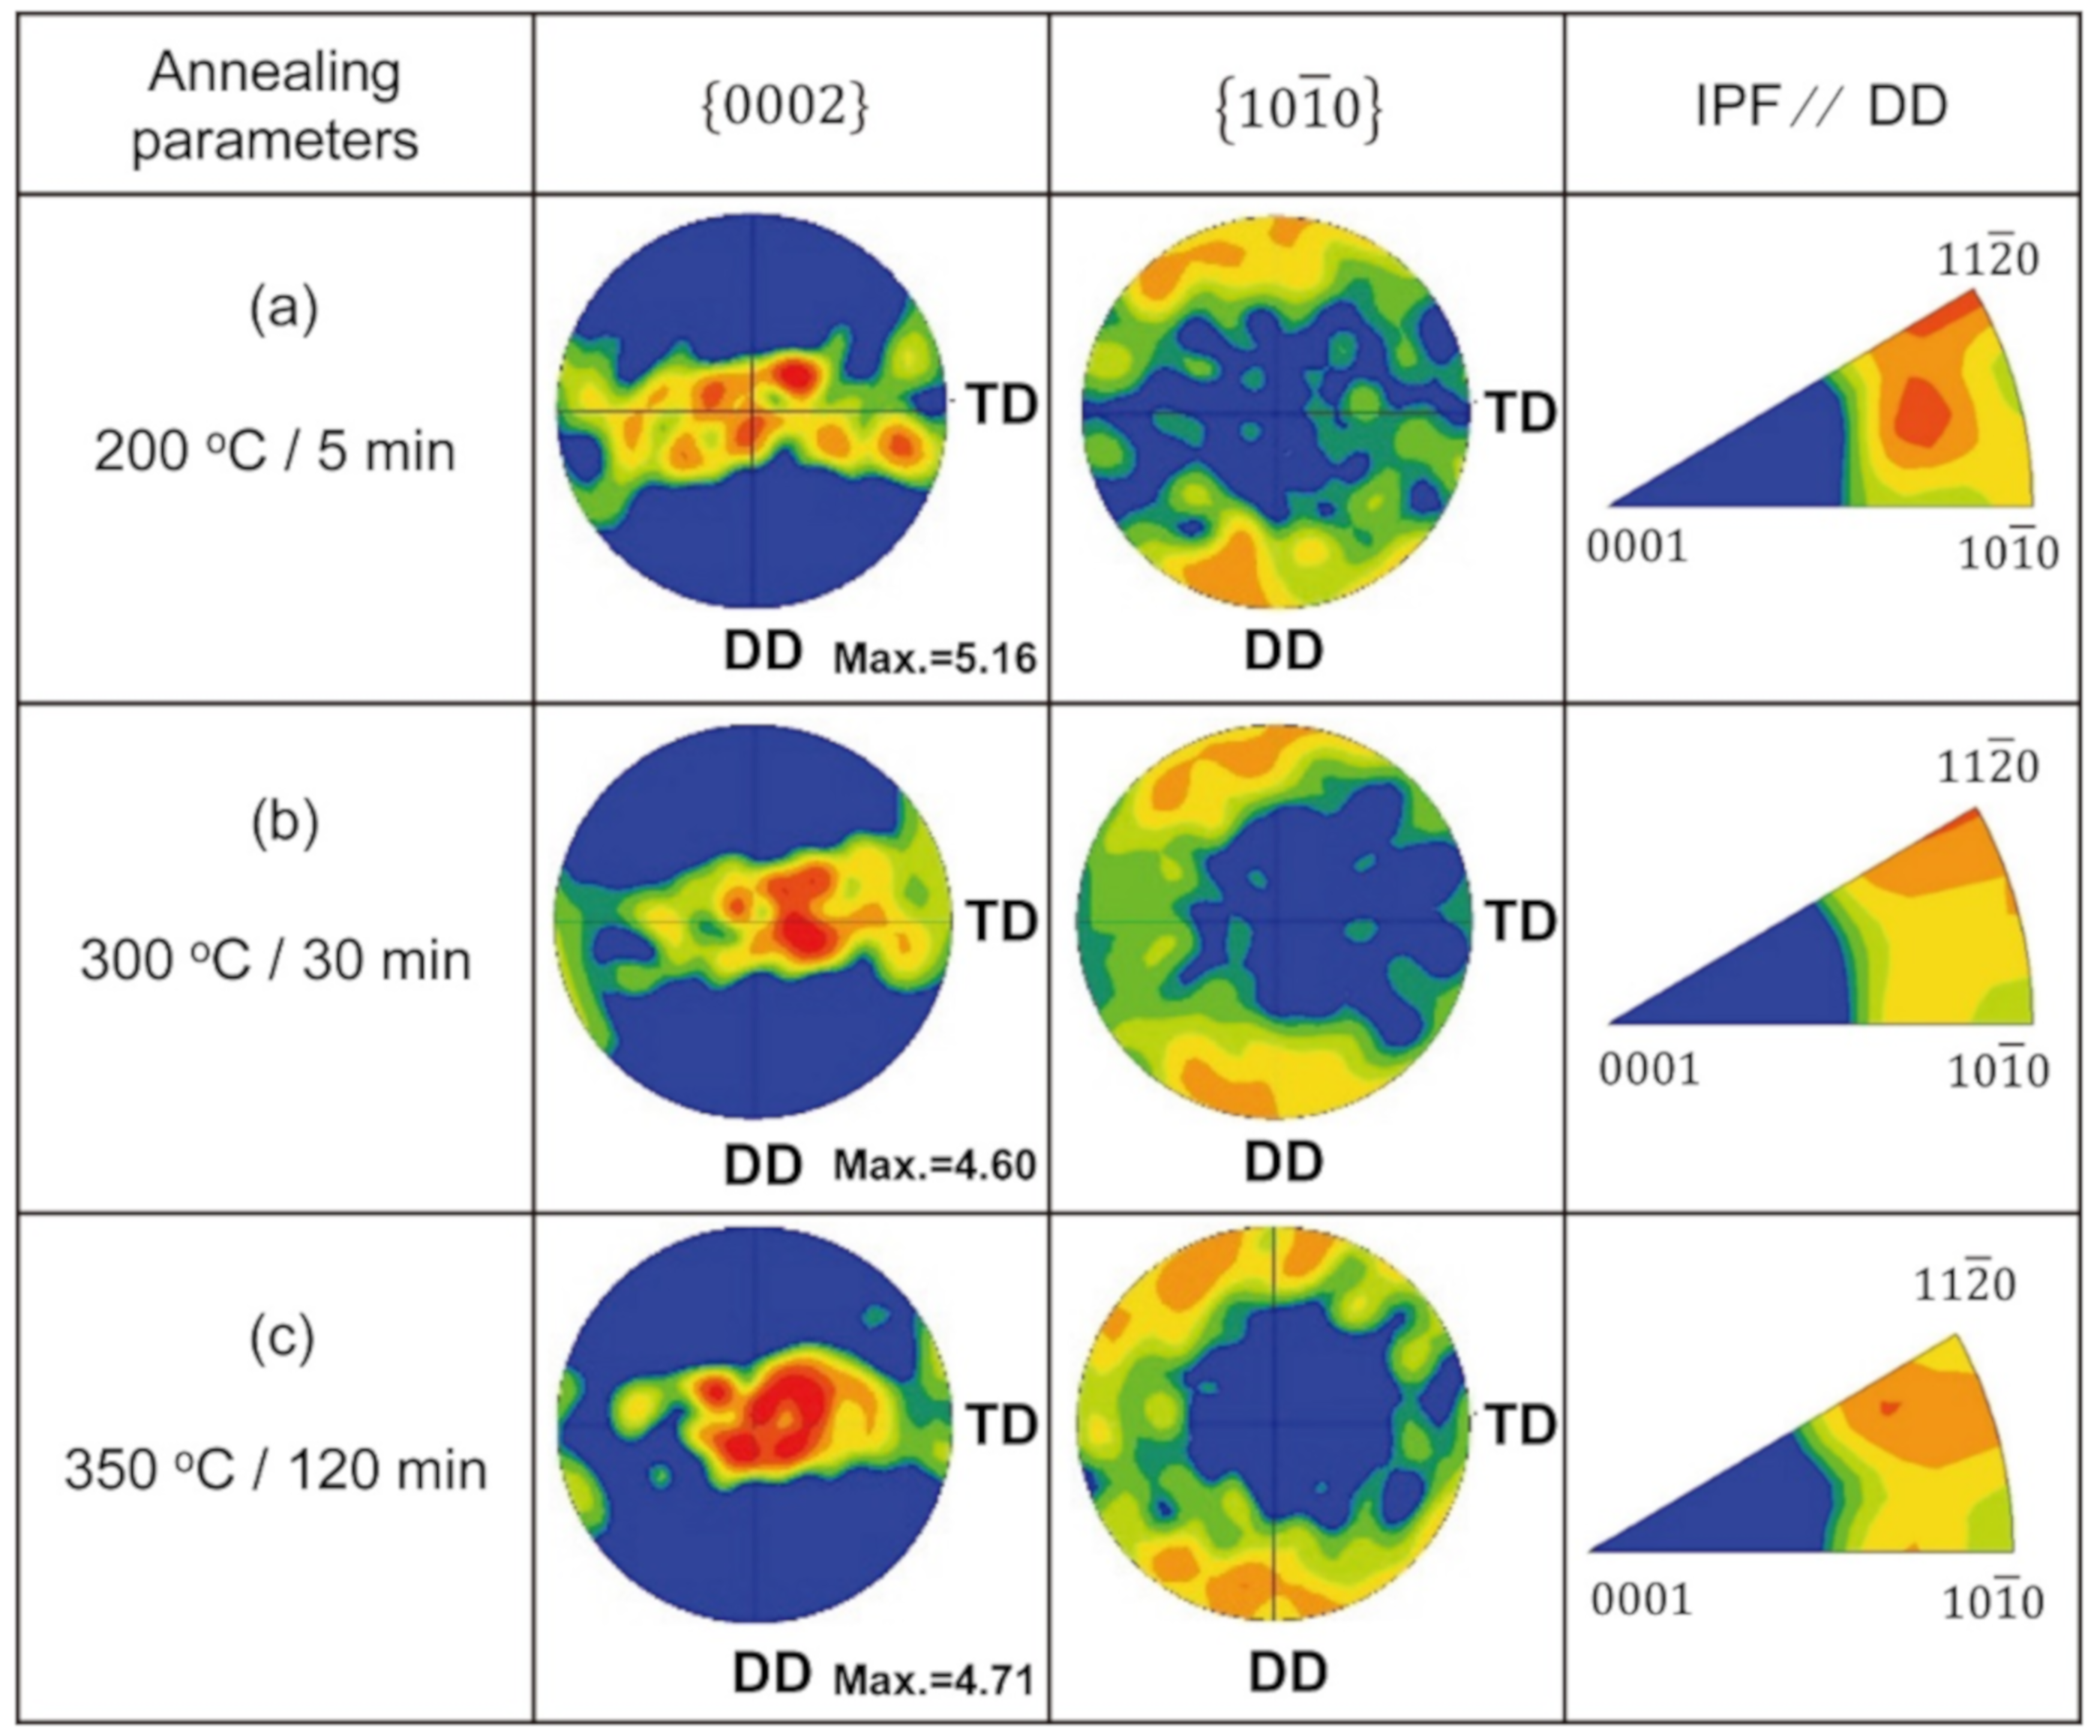
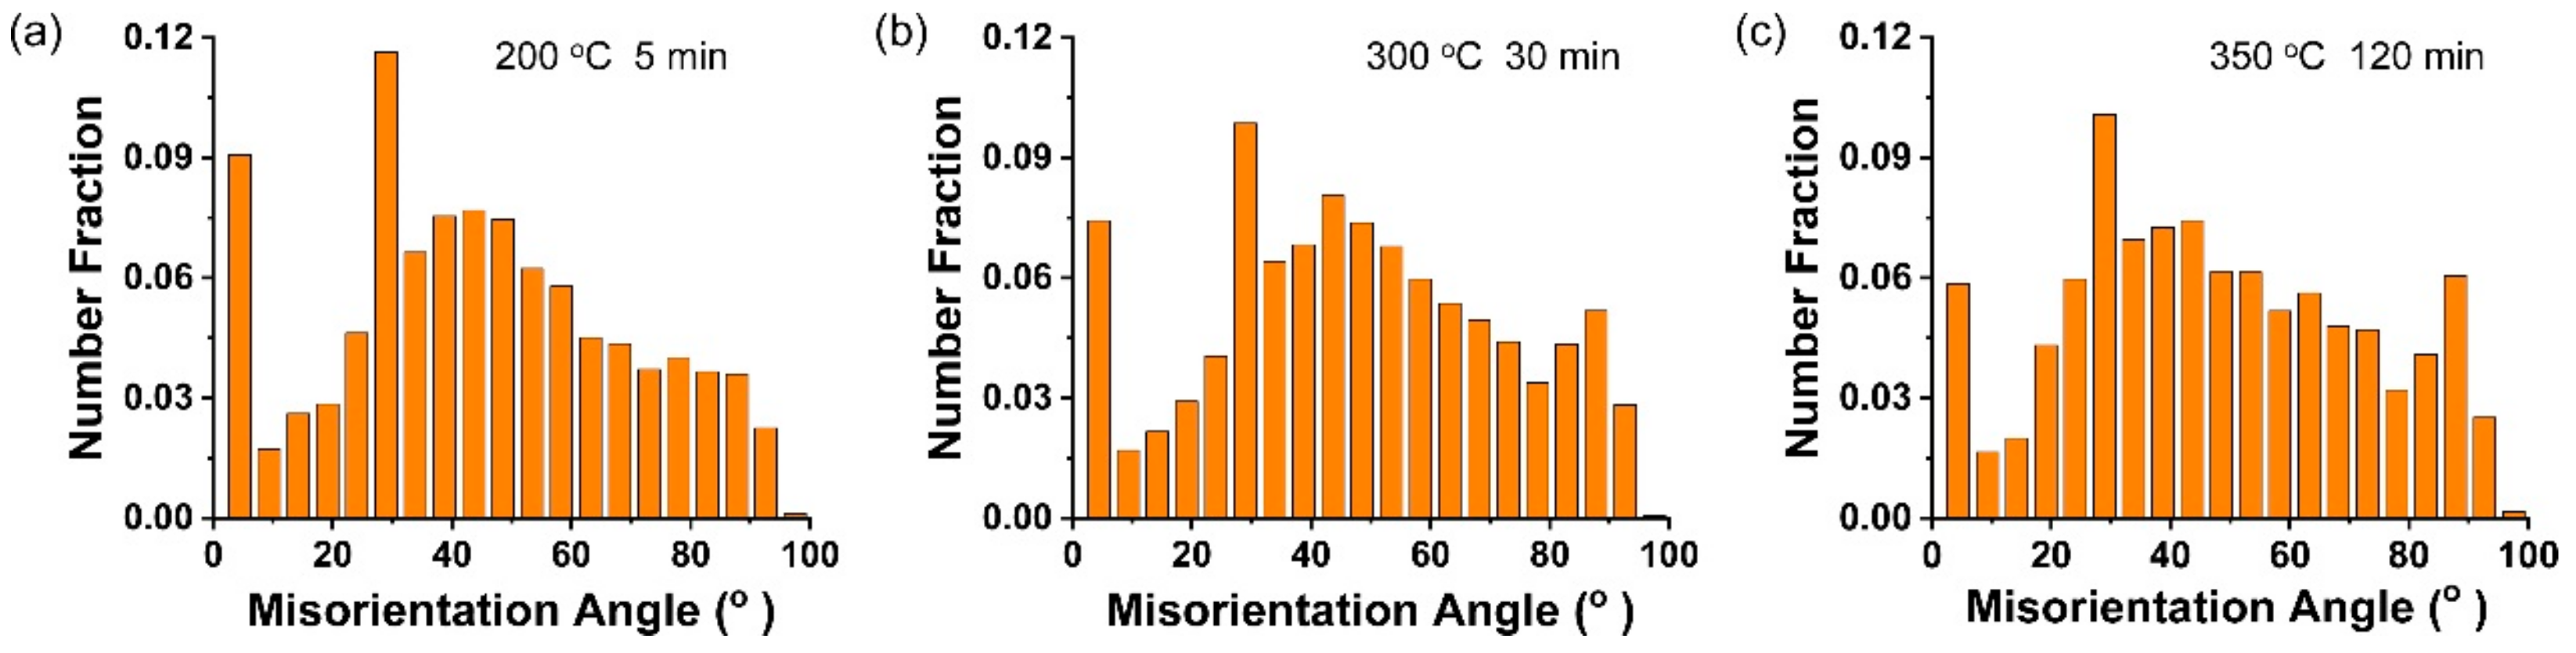
3.3. Texture
4. Discussion
5. Conclusions
Supplementary Materials
Author Contributions
Funding
Conflicts of Interest
References
- Wang, Y.; Cui, L.-Y.; Zeng, R.-C.; Li, S.-Q.; Zou, Y.-H.; Han, E.-H. In vitro degradation of pure magnesium—The effects of glucose and/or amino acid. Materials 2017, 10, 725. [Google Scholar] [CrossRef]
- Esmaily, M.; Svensson, J.; Fajardo, S.; Birbilis, N.; Frankel, G.; Virtanen, S.; Arrabal, R.; Thomas, S.; Johansson, L. Fundamentals and advances in magnesium alloy corrosion. Prog. Mater. Sci. 2017, 89, 92–193. [Google Scholar] [CrossRef]
- Chu, C.; Han, X.; Xue, F.; Bai, J.; Chu, P. Effects of sealing treatment on corrosion resistance and degradation behavior of micro-arc oxidized magnesium alloy wires. Appl. Surf. Sci. 2013, 271, 271–275. [Google Scholar] [CrossRef]
- Li, X.; Guo, C.; Liu, X.; Liu, L.; Bai, J.; Xue, F.; Lin, P.; Chu, C. Impact behaviors of poly-lactic acid based biocomposite reinforced with unidirectional high-strength magnesium alloy wires. Prog. Nat. Sci. 2014, 24, 472–478. [Google Scholar] [CrossRef]
- Seitz, J.-M.; Wulf, E.; Freytag, P.; Bormann, D.; Bach, F.-W. The manufacture of resorbable suture material from magnesium. Adv. Eng. Mater. 2010, 12, 1099–1105. [Google Scholar] [CrossRef]
- Chu, C.; Han, X.; Bai, J.; Xue, F.; Chu, P. Fabrication and degradation behavior of micro-arc oxidized biomedical magnesium alloy wires. Surf. Coat. Technol. 2012, 213, 307–312. [Google Scholar] [CrossRef]
- Wu, Y.; Li, N.; Cheng, Y.; Zheng, Y.; Han, Y. In vitro study on biodegradable AZ31 magnesium alloy fibers reinforced PLGA composite. J. Mater. Sci. Technol. 2013, 29, 545–550. [Google Scholar] [CrossRef]
- Sun, L.; Bai, J.; Xue, F.; Chu, C.; Meng, J. The work softening behavior of pure Mg wire during cold drawing. Materials 2018, 11, 602. [Google Scholar] [CrossRef]
- Sun, L.; Bai, J.; Yin, L.; Gan, Y.; Xue, F.; Chu, C.; Yan, J.; Wan, X.; Ding, H.; Zhou, G. Effect of annealing on the microstructures and properties of cold drawn Mg alloy wires. Mater. Sci. Eng. A 2015, 645, 181–187. [Google Scholar] [CrossRef]
- Bai, J.; Yin, L.; Lu, Y.; Gan, Y.; Xue, F.; Chu, C.; Yan, J.; Yan, K.; Wan, X.; Tang, Z. Preparation, microstructure and degradation performance of biomedical magnesium alloy fine wires. Prog. Nat. Sci. 2014, 24, 523–530. [Google Scholar] [CrossRef]
- Galiyev, A.; Kaibyshev, R.; Gottstein, G. Correlation of plastic deformation and dynamic recrystallization in magnesium alloy ZK60. Acta Mater. 2001, 49, 1199–1207. [Google Scholar] [CrossRef]
- Zhu, S.; Yan, H.; Chen, J.; Wu, Y.; Liu, J.; Tian, J. Effect of twinning and dynamic recrystallization on the high strain rate rolling process. Scr. Mater. 2010, 63, 985–988. [Google Scholar] [CrossRef]
- Imandoust, A.; Barrett, C.D.; Oppedal, A.L.; Whittington, W.R.; Paudel, Y.; El Kadiri, H. Nucleation and preferential growth mechanism of recrystallization texture in high purity binary magnesium-rare earth alloys. Acta Mater. 2017, 138, 27–41. [Google Scholar] [CrossRef]
- Stanford, N. The effect of rare earth elements on the behaviour of magnesium-based alloys: Part 2–Recrystallisation and texture development. Mater. Sci. Eng. A 2013, 565, 469–475. [Google Scholar] [CrossRef]
- Chao, H.; Sun, H.; Chen, W.; Wang, E. Static recrystallization kinetics of a heavily cold drawn AZ31 magnesium alloy under annealing treatment. Mater. Charact. 2011, 62, 312–320. [Google Scholar] [CrossRef]
- Sun, H.-F.; Chao, H.-Y.; Wang, E.-D. Microstructure stability of cold drawn AZ31 magnesium alloy during annealing process. Trans. Nonferrous Met. Soc. China 2011, 21, s215–s221. [Google Scholar] [CrossRef]
- Sun, L.; Bai, J.; Xue, F.; Tao, L.; Chu, C.; Meng, J. Exceptional texture evolution induced by multi-pass cold drawing of magnesium alloy. Mater. Des. 2017, 135, 267–274. [Google Scholar] [CrossRef]
- Qiao, X.G.; Zhao, Y.W.; Gan, W.M.; Chen, Y.; Zheng, M.Y.; Wu, K.; Gao, N.; Starink, M.J. Hardening mechanism of commercially pure Mg processed by high pressure torsion at room temperature. Mater. Sci. Eng. A 2014, 619, 95–106. [Google Scholar] [CrossRef]
- Su, C.W.; Lu, L.; Lai, M.O. Recrystallization and grain growth of deformed magnesium alloy. Philos. Mag. 2008, 88, 181–200. [Google Scholar] [CrossRef]
- Zhang, T.; Ji, Z.; Wu, S. Effect of extrusion ratio on mechanical and corrosion properties of AZ31B alloys prepared by a solid recycling process. Mater. Des. 2011, 32, 2742–2748. [Google Scholar] [CrossRef]
- Lin, J.; Ren, W.; Wang, Q.; Ma, L.; Chen, Y. Influence of grain size and texture on the yield strength of Mg alloys processed by severe plastic deformation. Adv. Mater. Sci. Eng. 2014, 2014, 1–9. [Google Scholar] [CrossRef]
- Yin, S.; Wang, C.; Diao, Y.; Wu, S.; Li, S. Influence of grain size and texture on the yield asymmetry of Mg-3Al-1Zn alloy. J. Mater. Sci. Technol. 2011, 27, 29–34. [Google Scholar] [CrossRef]
- Wang, J.T.; Yin, D.L.; Liu, J.Q.; Tao, J.; Su, Y.L.; Zhao, X. Effect of grain size on mechanical property of Mg–3Al–1Zn alloy. Scr. Mater. 2008, 59, 63–66. [Google Scholar] [CrossRef]
- Berbenni, S.; Favier, V.; Berveiller, M. Impact of the grain size distribution on the yield stress of homogeneous materials. Int. J. Plasticity 2007, 23, 114–142. [Google Scholar] [CrossRef]
- Zhu, S.; Yan, H.; Chen, J.; Wu, Y.; Du, Y.; Liao, X. Fabrication of Mg-Al-Zn-Mn alloy sheets with homogeneous fine-grained structures using high strain-rate rolling in a wide temperature range. Mater. Sci. Eng. A 2013, 559, 765–772. [Google Scholar] [CrossRef]
- Perez-Prado, M.T.; Ruano, O. Texture evolution during grain growth in annealed MG AZ61 alloy. Scr. Mater. 2003, 48, 59–64. [Google Scholar] [CrossRef]
- Perez-Prado, M.T.; Ruano, O. Texture evolution during annealing of magnesium AZ31 alloy. Scr. Mater. 2002, 46, 149–155. [Google Scholar] [CrossRef]


| Annealing Process | Average Grain Size (μm) | Standard Deviation | Coefficient Variation (CV) | Ultimate Strength (MPa) | Yield Strength (MPa) | Elongation (%) |
|---|---|---|---|---|---|---|
| 200 °C/5 min | 5.3 | 3.43 | 0.65 | 140 | 112 | 1.6 |
| 250 °C/60 min | 9.9 | 3.87 | 0.39 | 166 | 100 | 7.0 |
| 250 °C/120 min | 13.8 | 4.80 | 0.35 | 177 | 93 | 10.2 |
| 300 °C/15 min | 8.6 | 3.41 | 0.40 | 167 | 91 | 8.1 |
| 300 °C/30 min | 9.8 | 2.88 | 0.29 | 181 | 90 | 13.9 |
| 300 °C/60 min | 11.7 | 5.17 | 0.44 | 167 | 91 | 8.5 |
| 300 °C/120 min | 14.8 | 4.98 | 0.34 | 174 | 89 | 9.2 |
| 350 °C/120 min | 27.0 | 16.98 | 0.63 | 147 | 81 | 3.3 |
© 2020 by the authors. Licensee MDPI, Basel, Switzerland. This article is an open access article distributed under the terms and conditions of the Creative Commons Attribution (CC BY) license (http://creativecommons.org/licenses/by/4.0/).
Share and Cite
Meng, J.; Sun, L.; Zhang, Y.; Xue, F.; Chu, C.; Bai, J. Evolution of Recrystallized Grain and Texture of Cold-Drawn Pure Mg Wire and Their Effect on Mechanical Properties. Materials 2020, 13, 427. https://doi.org/10.3390/ma13020427
Meng J, Sun L, Zhang Y, Xue F, Chu C, Bai J. Evolution of Recrystallized Grain and Texture of Cold-Drawn Pure Mg Wire and Their Effect on Mechanical Properties. Materials. 2020; 13(2):427. https://doi.org/10.3390/ma13020427
Chicago/Turabian StyleMeng, Jiao, Liuxia Sun, Yue Zhang, Feng Xue, Chenglin Chu, and Jing Bai. 2020. "Evolution of Recrystallized Grain and Texture of Cold-Drawn Pure Mg Wire and Their Effect on Mechanical Properties" Materials 13, no. 2: 427. https://doi.org/10.3390/ma13020427
APA StyleMeng, J., Sun, L., Zhang, Y., Xue, F., Chu, C., & Bai, J. (2020). Evolution of Recrystallized Grain and Texture of Cold-Drawn Pure Mg Wire and Their Effect on Mechanical Properties. Materials, 13(2), 427. https://doi.org/10.3390/ma13020427