Article

The Influence of the Third Element on Nano-Mechanical Properties of Iron Borides FeB and Fe2B Formed in Fe-B-X (X = C, Cr, Mn, V, W, Mn + V) Alloys

1
Institute of Materials Research, Slovak Academy of Sciences, Watsonova 47, 040 01 Kosice, Slovakia
2
Faculty of Materials, Metallurgy and Recycling, Technical University of Košice, Letná 9, 042 00 Košice, Slovakia
*
Author to whom correspondence should be addressed.
Materials 2020, 13(18), 4155; https://doi.org/10.3390/ma13184155
Submission received: 26 August 2020 / Revised: 11 September 2020 / Accepted: 15 September 2020 / Published: 18 September 2020
(This article belongs to the Special Issue Microstructure and Mechanical Properties of Metals and Alloys)

Abstract

:
In this study, the influence of alloying elements on the mechanical properties of iron borides FeB and Fe2B formed in Fe-B-X (X = C, Cr, Mn, V, W, Mn + V) alloys were evaluated using instrumented indentation measurement. The microstructural characterization of the alloys was performed by means of X-ray diffraction and scanning electron microscope equipped with an energy dispersive X-ray analyzer. The fraction of the phases present in the alloys was determined either by the lever rule or by image analysis. The hardest and stiffest FeB formed in Fe-B-X (X = C, Cr, Mn) alloys was observed in the Fe-B-Cr alloys, where indentation hardness of HIT = 26.9 ± 1.4 GPa and indentation modulus of EIT = 486 ± 22 GPa were determined. The highest hardness of Fe2B was determined in the presence of tungsten as an alloying element, HIT = 20.8 ± 0.9 GPa. The lowest indentation hardness is measured in manganese alloyed FeB and Fe2B. In both FeB and Fe2B, an indentation size effect was observed, showing a decrease of hardness with increasing indentation depth.

1. Introduction

Owning to their characteristics, i.e., high hardness, thermal stability, high wear and corrosion resistance, metal borides are considered a perspective option where the operational conditions demand for improved performance, reliability, safety and increased service life of various engineering components [1]. For example, the use of metal borides as protective coatings is one technological area of considerable practical importance in the case of both ferrous and non-ferrous alloys [2]. The surface modification of the materials is achieved by formation of a dual layer FeB + Fe2B or a monophase Fe2B layer by high-temperature diffusion of boron atoms (boronizing process) [3]. As such, these materials are utilized, for example, in the production of forging and stamping dies used in the manufacturing industry or valves, bearings and other production tubing system components used in the oil and gas industry [4,5]. Equally important is the application of boron for hardness enhancement through alloying, where the borides formed are utilized as hard reinforcing phases, e.g., boron alloyed tool steels [6,7], and high-boron white cast irons [8,9,10,11,12], etc.
Numerous information on FeB and Fe2B borides can be obtained from boronizing processes research, where these borides have been of primary interest. Available studies on mechanical and tribological properties of boride layers vouch for their advantages over other surface hardening treatments [13,14,15,16]. Reported microhardness values for boride layers are mainly in the range between 1600 and 2200 HV0.05 [17,18,19]. The wide range in reported values can be due to differences in characterization technique used, but even more so is a result of the different alloying elements present in the substrate material [20,21,22,23].
Over recent years, a number of studies on nanomechanical characterization of FeB and/or Fe2B iron borides produced by boronizing have been published [24,25,26,27,28]. The difference among the reported values obtained by nanomechanical characterization are often prescribed to mixed phase effect, porosity, residual stresses, and differences in chemical composition of the substrate material [29]. In order to eliminate the substrate influence, Kulka et al. [27] conducted a boronizing study on pure iron (Armco iron). Berkovich nanoindentation measurement resulted in the following hardness values: FeB = 19.77–29.35 GPa and Fe2B = 16.09–18.51 GPa [27], and indentation modulus of FeB = 271.89–360.16 GPa and Fe2B = 231.52–275.37 GPa [27].
Recent studies identified metal borides, and particularly Fe2B, as potential strengthening phases [29,30,31,32]. However, limited experimental work is available on the nanomechanical properties of Fe2B, and even more so on FeB phase, as precipitate phases in boron alloyed materials [29,33,34]. In addition, lately, there is interest across scientific groups on studying the effects of alloying on the mechanical properties of hard boride phases [35,36,37]. The research has shown that the properties can be significantly influenced by the alloying elements, but still their individual influence has not been well defined and entirely understood.
Hence, the primary objective of this study is to investigate the nanomechanical properties like indentation hardness (HIT) and indentation modulus (EIT) of the FeB (MB) and Fe2B (M2B) phases, as precipitate phases. Furthermore, examination of the nanomechanical properties of precipitates FeB and Fe2B phases with respect to indentation size effect (ISE) for selected alloys is provided. The investigative Fe-B alloys of the following type: B-Fe-C, B-Fe-Cr, B-Fe-Mn, B-Fe-V, and B-Fe-W, were chosen as such, so as to be able to isolate as much as possible the effect of the third compositional element present in the iron borides on their nanomechanical properties. In general, the solubility of tungsten (W) and carbon (C) in iron borides is low, while the solubility of chromium (Cr) reaches up to 15 at.% for Fe2B phase, and 16 at.% for FeB boride at 1353 K [38]. Manganese (Mn) can completely replace iron in these borides [39], therefore it is interesting to study the influence of these elements on borides mechanical properties. One equilibrated quaternary Fe-B-Mn-V alloy was also used in order to assess the combined effect of Mn and V as alloying elements. It should be noted that due to the complete mutual solubility between compounds MnB and FeB, and Mn2B and Fe2B, notations MB and M2B are used for these phases formed in Fe-B-Mn alloys. M denotes metallic element also in the higher order system Fe-B-Mn-V.

2. Materials and Methods

The Fe-B-X alloys were prepared from high-purity powders (Fe-99.98 % or 99.96 %, B-99.95 %, C-99.90 %, Cr-99.99%, Mn-99.98 % or 99.95 %, V-99.80 %, W-99.90 %). Details on the production process can be found in published studies on phase equilibria and/or thermodynamic modelling studies [38,39,40,41,42,43,44,45,46]. The mixed powders were pressed into cylindric compacts using a uniaxial pressing machine. The subsequent melting was done using induction melting and argon arc melting in the case of Fe-B-C alloys. Fe-B-X (X = Cr, Mn, V, W, Mn + V) alloys were melted in an argon arc furnace (Mini Arc Melter MAM-1). The alloys were melted several times in order to ensure homogeneity. The produced alloys weighted 10–20 g in the case of Fe-B-C, 15 g for Fe-B-Cr, 5–7 g for Fe-B-Mn alloys, 10–20 g for Fe-B-V alloys, 2 g and 3. 5 g alloys in the case of the Fe-B-W system, and 7 g for Fe-B-Mn-V alloy. Further, the as-cast alloys were evacuated in silica glass tubes and long-term annealed using electric resistance furnace LAC-type L 06 S. For oxidation elimination, titanium turnings were placed into the silica tubes. Following the annealing treatment, the alloys were quenched into cold water. Alloy designation, chemical composition, and annealing conditions are given in Table 1. Afterward, the produced alloys were sectioned in half using electro-sparking and a metallographic procedure following a sequence of mechanical grinding, and polishing (using 120 up to 4000 grit SiC paper) was applied in order to prepare the alloys for analysis. The microstructure and the chemical composition of the phases were analyzed using a FEG SEM facility JEOL JSM-7000F equipped with an INCA EDX analyzer. The micrographs were taken in backscatter imaging mode at 10 kV acceleration voltage. The phase composition of the alloys was determined by X-ray diffraction (XRD) using Philips X’Pert Pro MPD with a Bragg–Brentano setup or Bruker D8 Advance diffractometer (Bruker, USA) in Bragg–Brentano pseudofocusing geometry (in the case of the Fe-B-V-Mn alloy). Cu Kα and Cr Kα (only for Fe-B-Cr alloys) radiation with wavelength λ = 1.540562 Å and λ = 2.289700 Å was used in the diffraction experiments. Detailed X-ray diffraction results can be found in previously published studies on phase equilibria and/or thermodynamic modeling studies [38,39,42,43,44,45].
The volume fraction of the identified phases in alloys Fe-B-C, Fe-B-Cr, Fe-B-W, and Fe-B-Mn-V was determined by image analysis. The volume fraction was derived from the area fraction. Namely, the area fraction can be considered as equivalent to the volume fraction under the assumption of homogenous and isotropic materials. Image analysis was done using the open-source scientific processing program ImageJ/Fiji [47]. The volume fraction of the identified phases present in Fe-B-Mn and Fe-B-V alloys was calculated using the lever rule. For this purpose, experimentally determined chemical composition values for the phases of interest and the overall composition of the alloys were used as input data, followed by conversion from mole percent to volume percent. Information on phases’ molar volume are taken from Repovský et al. [39]. The determined volume fractions are given in Table 2.
For the nanoindentation testing, the sectioned alloys were mounted using the compression thermosetting molding technique, and then they were ground and polished—flat. In addition, a final automatic polishing step was used to ensure a smooth top surface. Using crystal-bond hot-melt thermoplastic polymer, the alloys were mounted on aluminum sample disks, and then installed into a sample holder. Nanoindentation experiments were performed using Nano Indenter G200 produced by MTS Nano Instruments equipped with a Berkovich-type diamond indenter. Poisson’s ratio (ν) of 0.3 is used, for both FeB (MB) and Fe2B (M2B) phases, assuming a quasi-isotropic behavior. Measurements were done using both single loading–unloading indentation and continuous stiffness measurement (CSM) methods. The latter was applied to study the indentation size effect (ISE).
In both cases, an indentation depth-controlled method was used with a maximum depth of 500 nm. On average, 25 indentation tests were carried out on FeB and/or Fe2B phase for determining the indentation hardness and modulus of the alloys. In addition, 10 depth-controlled indentation tests to a maximum depth of 500 nm were performed with an aim to inspect for the presence of indentation size effect (ISE). The area function of the indenter tip was calibrated using fused silica preceding the indentation tests.

3. Results and Discussion

3.1. Phase Composition and Microstructure

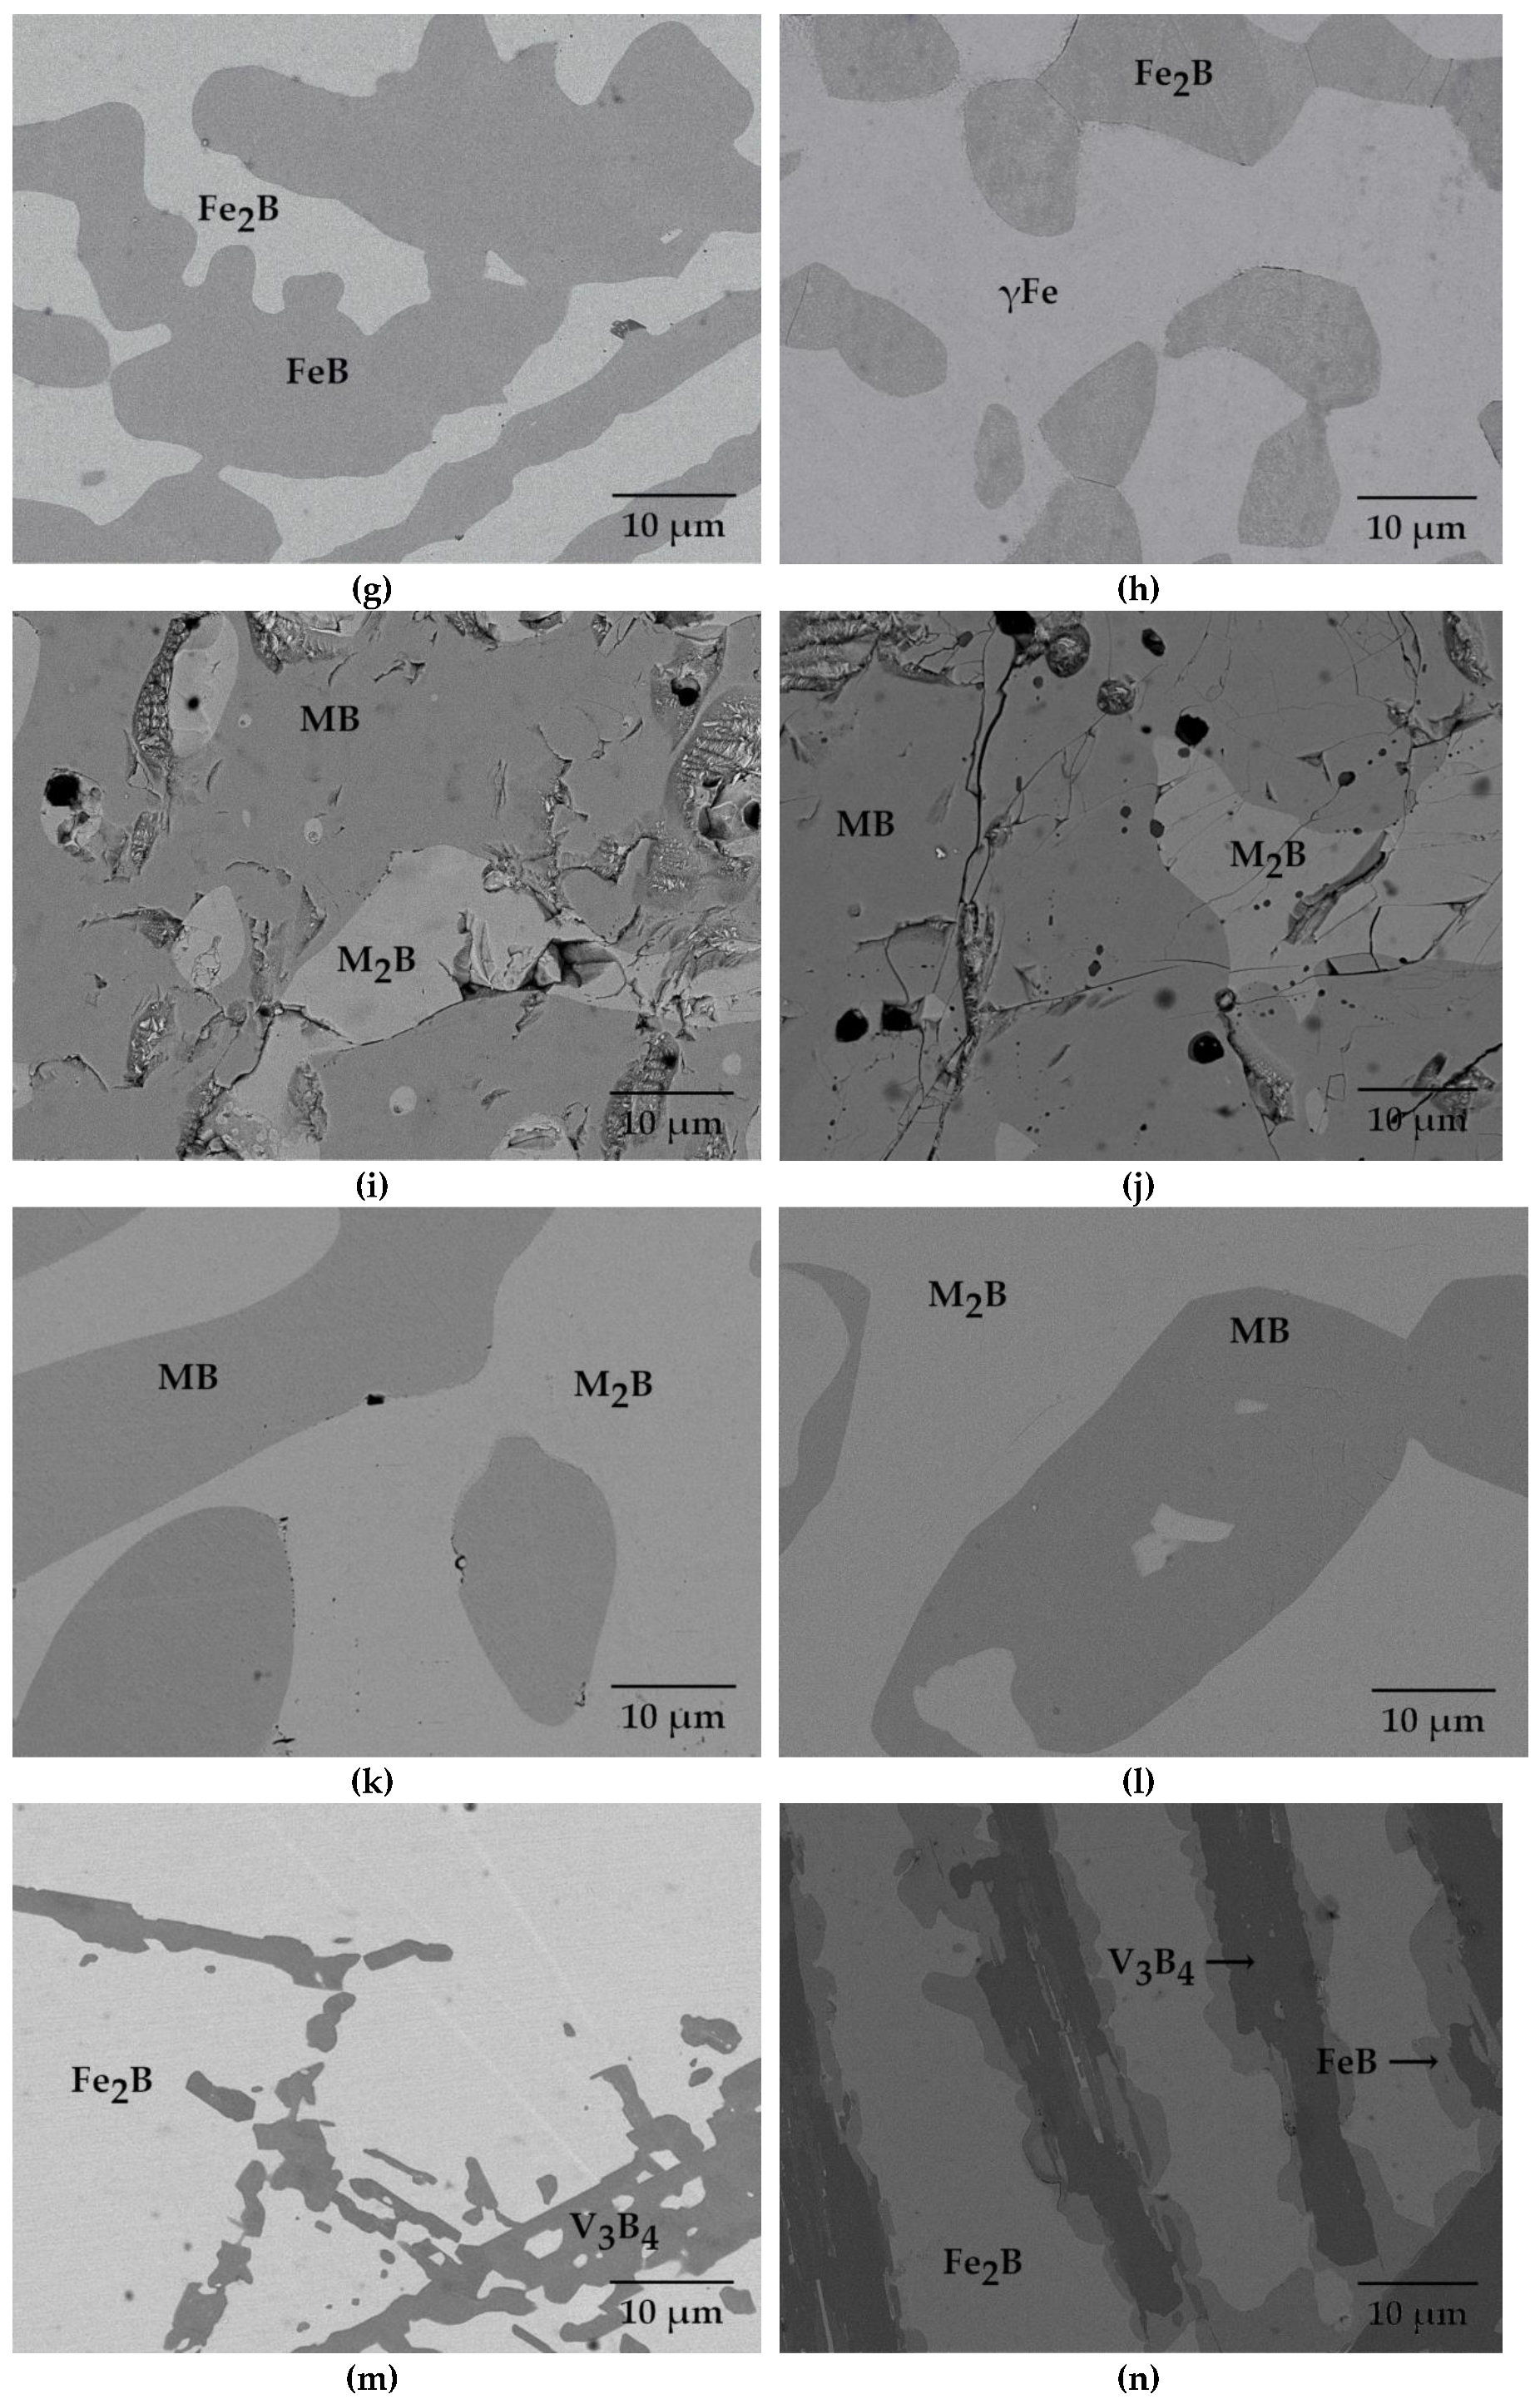
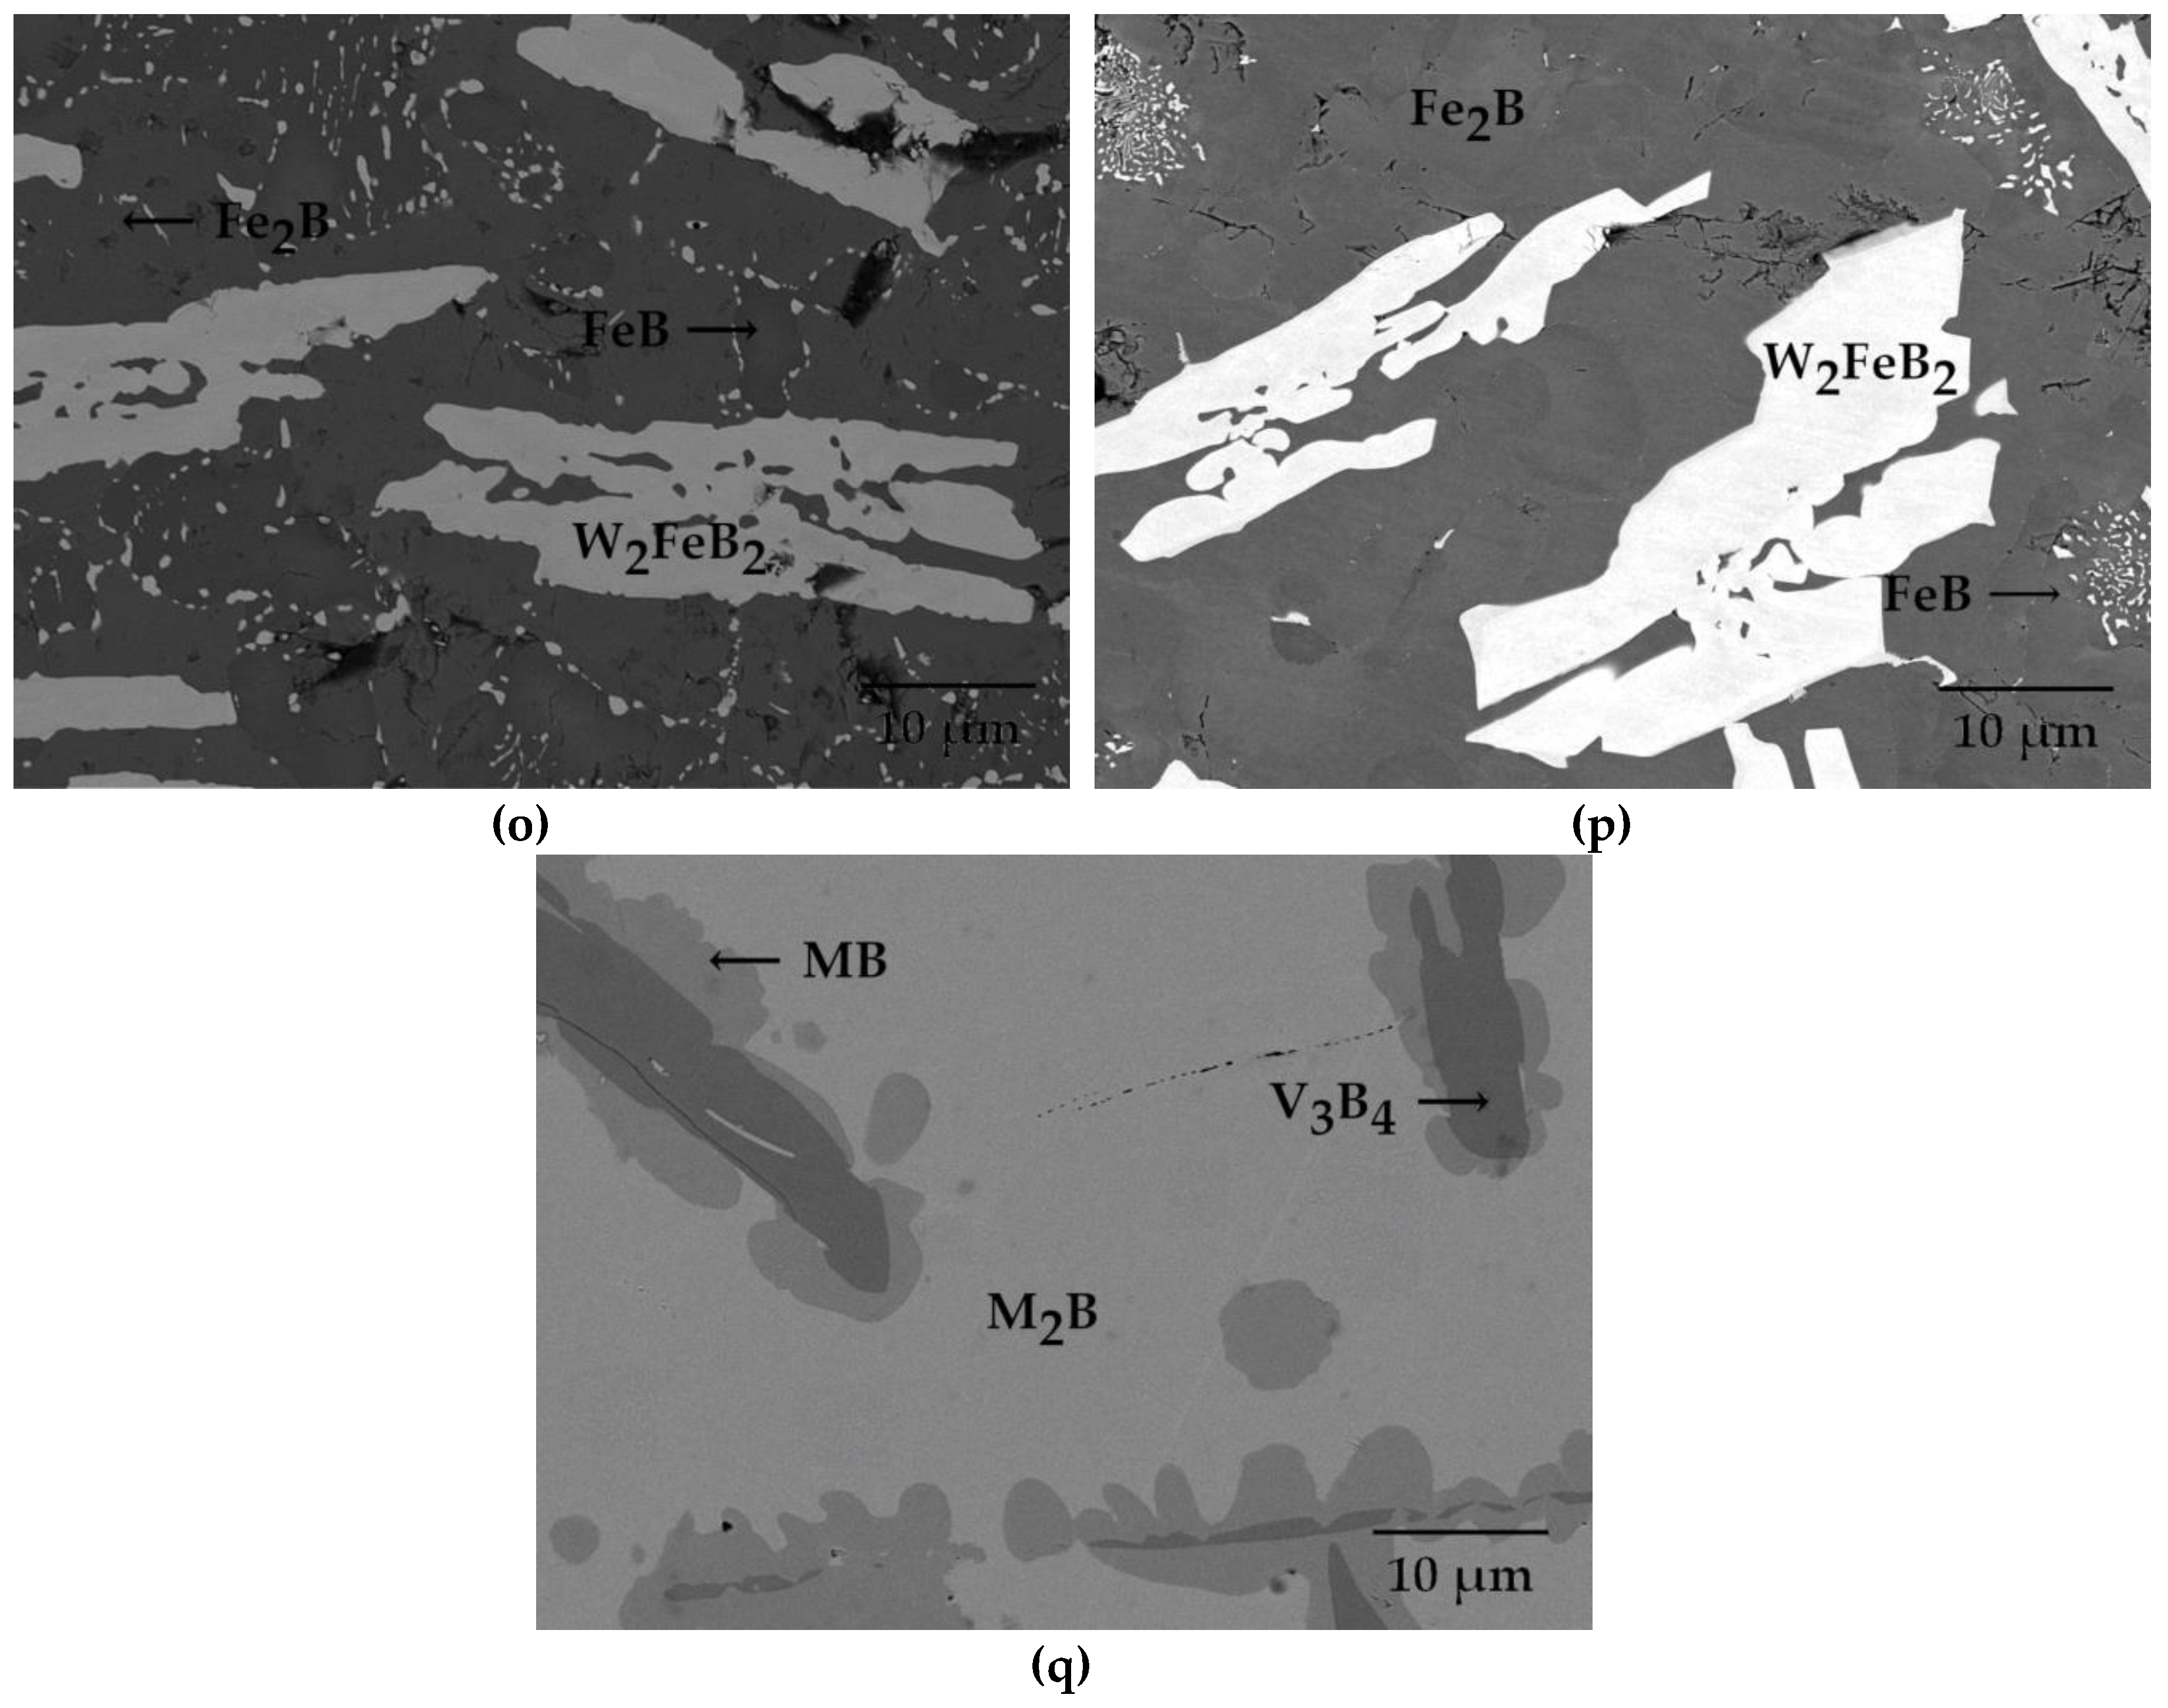
Sixteen equilibrated ternary Fe-B-X (X = C, Cr, Mn, V, W) alloys and one equilibrated quaternary Fe-B-Mn-V alloy were investigated in this study. The microstructures of the investigated alloys are shown in Figure 1. Alloys’ phase composition is given in Table 1.
Two-phase microstructure was identifiable in eight of the investigated ternary alloys. The rest of the ternary alloys were characterized by three-phase microstructure. Three-phase microstructure is also observed in the quaternary Fe-B-Mn-V alloy. In the majority of alloys, both FeB (MB) and Fe2B (M2B) are present (Figure 1). Exceptions make the following alloys: 38.5 Fe–59.22 B–2.3 C, 34.6 Fe–52 B–13.4 C, 17 Fe–65 B–18 Cr, and 8 Fe–56 B–36 Cr, where only FeB is found (Figure 1a,b,e,f). Whilst, in alloys 82 Fe–9 B–9 Mn and 50 Fe–41 B–9 V (alloy 13), only Fe2B is observed (Figure 1h,m).
Although, FeB and Fe2B phases are present in various shapes and dimensions, still, in most of the alloys, phases of 10 μm in diameter are easily identifiable (Figure 1). Iron borides relevant crystallographic structure information are as follows: FeB (Pearson symbol—oP8, Proto-type FeB, Space group Pnma) and Fe2B (Pearson symbol—tI12, Proto-type CuAl2, Space group—I4/mcm) [48].
The determined phase fractions of the investigated alloys are shown in Table 2. Values calculated by image analysis are consistent with location of the individual alloys in phase equilibrium regions of the corresponding phase diagrams. The lever rule method is essentially based on the location of the alloy in the phase equilibrium fields, so that the values calculated by this method are, of course, in accordance with it.
The iron borides dissolve the third element (in case of the quaternary alloy, also the fourth element) in greater or lesser amounts in all investigated alloys. The amount of the third element dissolved in FeB and Fe2B phases in the investigated ternary alloys and the dissolved amount of vanadium and manganese in iron borides in investigated quaternary alloy are given in Table 1.

3.1.1. Fe-B-C Alloys

The FeB phase is present in each of the investigated alloys of the Fe-B-C type (Figure 1a–d). The FeB phase is the predominant phase both in phase diameter and volume fraction in the microstructure of 38.5 Fe–59.2 B–2.3 C, 34.6 Fe–52 B–13.4 C, and 37 Fe–34 B–29 C alloys (Table 2, Figure 1a–c). The Fe2B phase is present in only two of the Fe–B–C alloys, i.e., 37 Fe–34 B–29 C and 39.7 Fe–33 B–27.3 C (Figure 1c,d). The B4C phase is identified in the microstructure of alloys 38.5 Fe–59.22 B–2.3 C and 34.6 Fe–52 B–13.4 C in small portions (Table 2). However, it should be noted that the given phase fraction for graphite, when present in the alloy, is overestimated at an expanse of B4C, Fe2B, and FeB phases, since it is very difficult to distinguish the border between graphite and these other phases.

3.1.2. Fe-B-Cr Alloys

FeB is identified in the microstructure of each of the Fe-B-Cr alloys (Figure 1e–g). In alloys 17 Fe–65 B–18 Cr and 8 Fe–56 B–36 Cr, the FeB is surrounded by chromium borides CrB4, CrB2, and Cr3B4, respectively (Figure 1e,f). The microstructure of alloy 17 Fe–65 B–18 Cr mostly consists of Fe2B, i.e., 71.35 vol.%, while in the 8 Fe–56 B–36 Cr alloy, C3B4 phase occupies the biggest portion of the microstructure, with 97.13 vol.%. (Table 2). In alloy 50 Fe–40 B–10 Cr, the FeB phase (dark gray) is present, together with light gray Fe2B phase, each characterized with relatively high chromium solubility of 8 at.% and 16 at.%, respectively (Table 1, Figure 1g).

3.1.3. Fe-B-Mn Alloys

With exception to the 82 Fe–9 B–9 Mn alloy, each of the Fe-B-Mn alloys are comprised of FeB (MB) and Fe2B (M2B) phases (Table 1, Figure 1h–l). The Fe-B-Mn ternary system is characterized by complete mutual solubility of Fe2B and Mn2B, and FeB and MnB phases [39]. Iron (Fe) took over the greatest proportion of metallic elements in all borides in the Mn alloys under study here, with exception to 22 Fe–39 B–39 Mn (alloy 9) and 22 Fe–39 B–39 Mn (alloy 10), where manganese (Mn) was the dominant element (Table 1). Additional information for Fe-B-Mn alloys are given in the studies by Repovsky et al. [39] and Kirkovska et al. [49].

3.1.4. Fe-B-V Alloys

Two Fe-B-V alloys were investigated in this study, alloy 13 (50 Fe–41 B–9 V annealing conditions 1353 K/1440 h) and alloy 14 (50 Fe–41 B–9 V annealing conditions 903 K/4560 h) (Figure 1m,n). The phase fraction analysis shows that Fe2B phase takes up the biggest portion of the microstructure, 76.7% and 63.8%, for alloys 13 and 14, respectively (Table 2). In alloy 13, the large dark grey plates of V3B4 are embedded in light gray Fe2B matrix (Figure 1m). The dendrite-like structure identified as V3B4 (darkest color) is surrounded by FeB phase (medium color), embedded in the (light gray) Fe2B matrix in alloy 14 (Figure 1n).

3.1.5. Fe-B-W Alloys

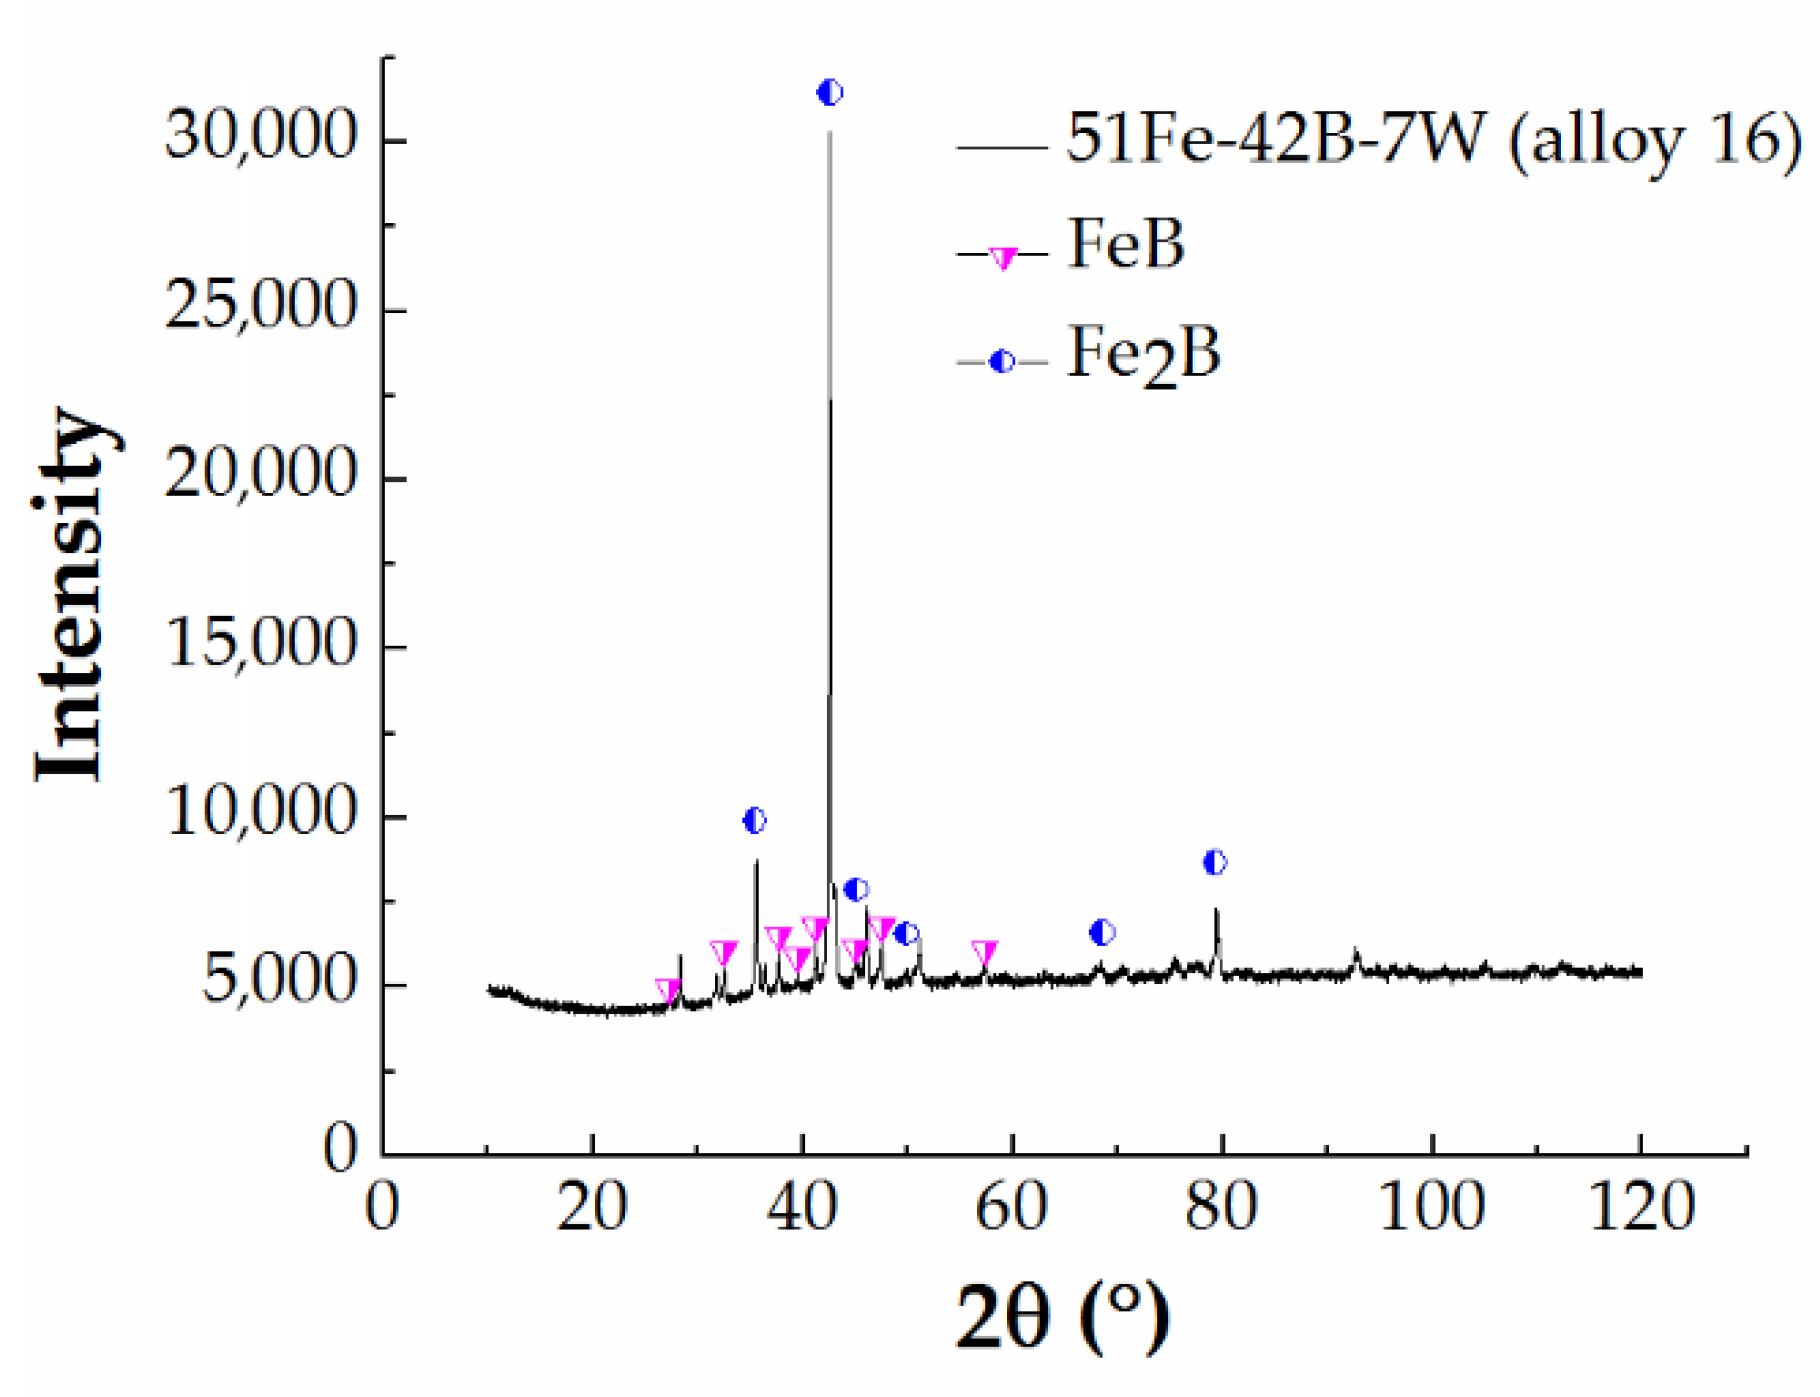
Two Fe-B-W alloys (Figure 1o,p) were investigated in the present study. X-ray analysis results confirm the existence of FeB and Fe2B (Figure 2). The experimentally determined equilibrium composition of the phases present in these alloys, using energy-dispersive X-ray spectroscopy (EDX/EDS) coupled with published Fe-B-W phase diagram studies [48], indicate the existence of W2FeB2 for the unidentified picks. Hence, a three-phase microstructure consisting of FeB + Fe2B + W2FeB2 was identified. With long-term annealing at the higher temperature (1323 K), the FeB phase appears more refined (Figure 1o,p). Also, with long-term annealing, the phase fraction of W2FeB2 ternary boride increases slightly, alongside FeB phase, at the expense of Fe2B phase (Table 2).

3.1.6. Fe-B-Mn-V Alloys

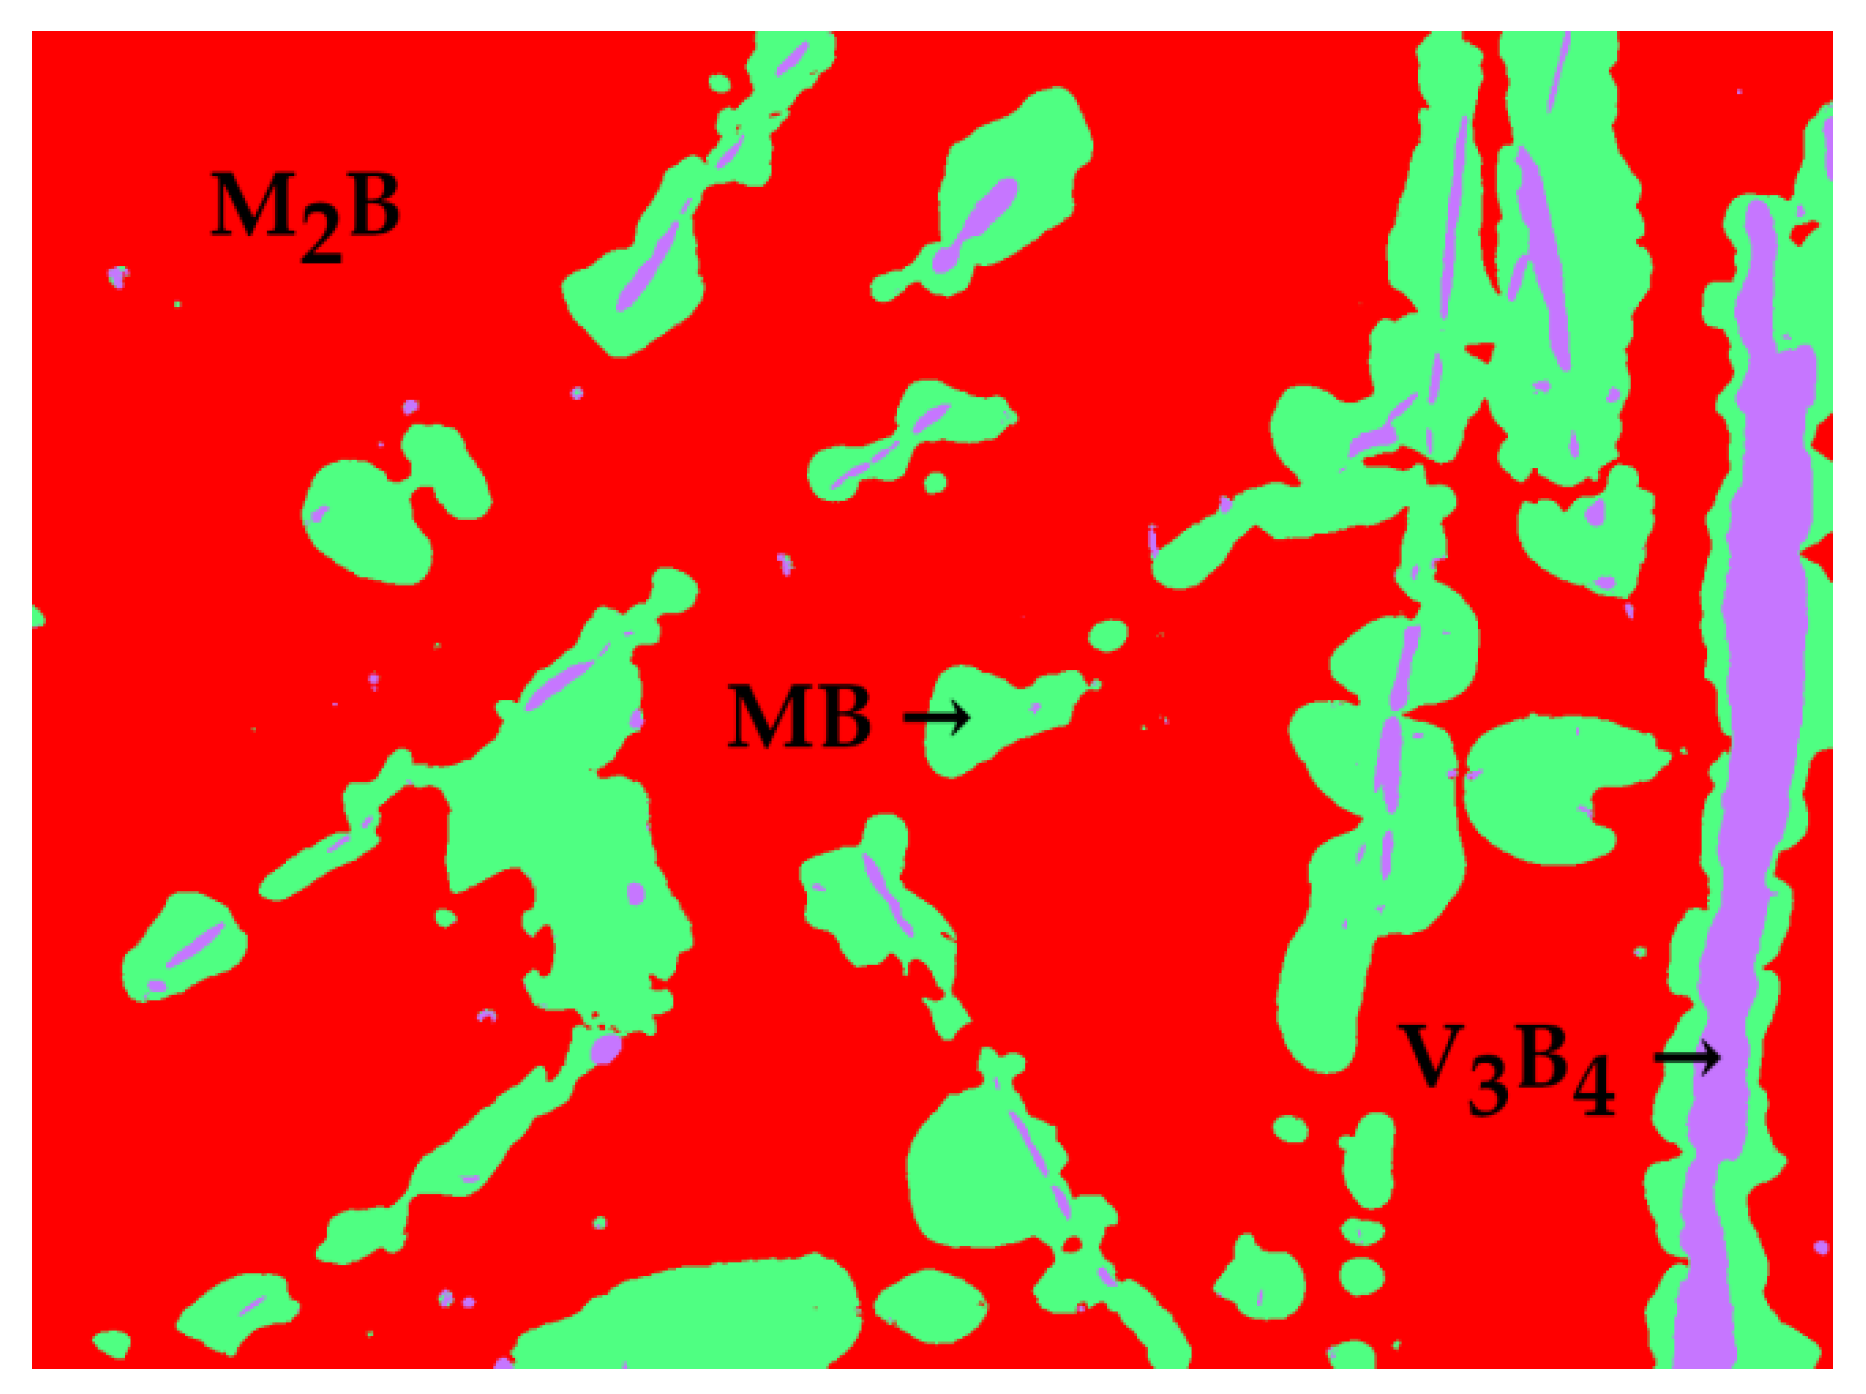
M2B, MB, and V3B4 are identified in the microstructure of the Fe-B-Mn-V alloy (Figure 1q). The matrix consists of light gray M2B phase. The dark gray phase embedded in the matrix is identified as V3B4. V3B4 is surrounded by MB phase. Here, vanadium and manganese are both dissolved in iron borides M2B and MB. Additional information about Fe-B-Mn-V quaternary can be obtained from Homolová et al. [42]. A segmented image of the microstructure of alloy 17 used for phase fraction calculation is given in Figure 3. The different colored segments are obtained using the image analysis technique and represent different phases, as labeled in Figure 3. The M2B phase is the predominant phase, occupying 71.28 vol.% of the Fe-B-Mn-V alloy microstructure (Table 2).

3.2. Hardness and Modulus of FeB and Fe2B Borides

The average hardness and indentation modulus of both FeB and Fe2B phase are given in Table 3. The averaged hardness values of FeB and Fe2B are in the range of 18.6 ± 0.6–26.9 ± 1.4 GPa and 16.1 ± 2.2–20.8 ± 0.9 GPa, respectively. The lowest hardness and modulus value of the Fe2B phase is measured in manganese-type alloy 82 Fe–9 B–9 Mn, HIT (Fe2B) = 16.1 ± 2.2 GPa and EIT (Fe2B) = 297.5 ± 24.6 GPa. The highest hardness of the Fe2B phase is measured in the alloy with tungsten 51 Fe–42 B–7 W, HIT (Fe2B) = 20.8 ± 0.9 GPa and highest modulus of Fe2B phase in 50 Fe–40 B–10 Cr, a chromium-containing alloy, EIT (Fe2B) = 391.8 ± 10.9 GPa. The highest and lowest hardness of the FeB is measured in the alloy with chromium 17 Fe–65 B–18 Cr, HIT (FeB) = 26.9 ± 1.4 GPa and manganese-containing alloy 22 Fe–39 B–39 Mn (alloy 10), HIT (FeB) = 18.6 ± 0.6. EIT = 315.6 ± 32.8 measured in 37 Fe–34 B–29 C, a carbon-type alloy, is the lowest indentation modulus determined for the FeB phase, and EIT = 485.5 ± 22.3 measured in 17 Fe–65 B–18 Cr chromium-type alloy is the highest value of indentation modulus determined for the FeB phase. The load vs. depth (P–h) plots obtained from the nanoindentation experiments on FeB phase in 38.5 Fe–59.2 B–2.3 C alloy and Fe2B phase in alloy 50 Fe–41 B–9 V (alloy 14) are shown in Figure 4.
Comparative evaluation of the results for these alloys show that Cr alloyed FeB is the hardest and stiffest boride. W alloyed Fe2B is observed as the hardest boride in the Fe2B group. Overall, the hardness is lowest in the Mn alloyed FeB and Fe2B. For these alloys, the alloying elements have more influence on the hardness of FeB than on Fe2B phase. The indentation hardness and indentation modulus for Fe2B distinguished according to the alloying element present, determined in this study, are consistent with reported values for similar borides [33,35,50]. However, there are discrepancies between the reported valued of hardness and modulus in the literature, alongside disagreement of the effect of the alloying elements in terms of decrease/increase of hardness/modulus of Fe2B [35,50,51,52,53,54]. We were not able to obtain any information on the influence of alloying elements on mechanical properties of precipitated FeB phase, or information on the effect of alloying additions on FeB from first—principle, studies.
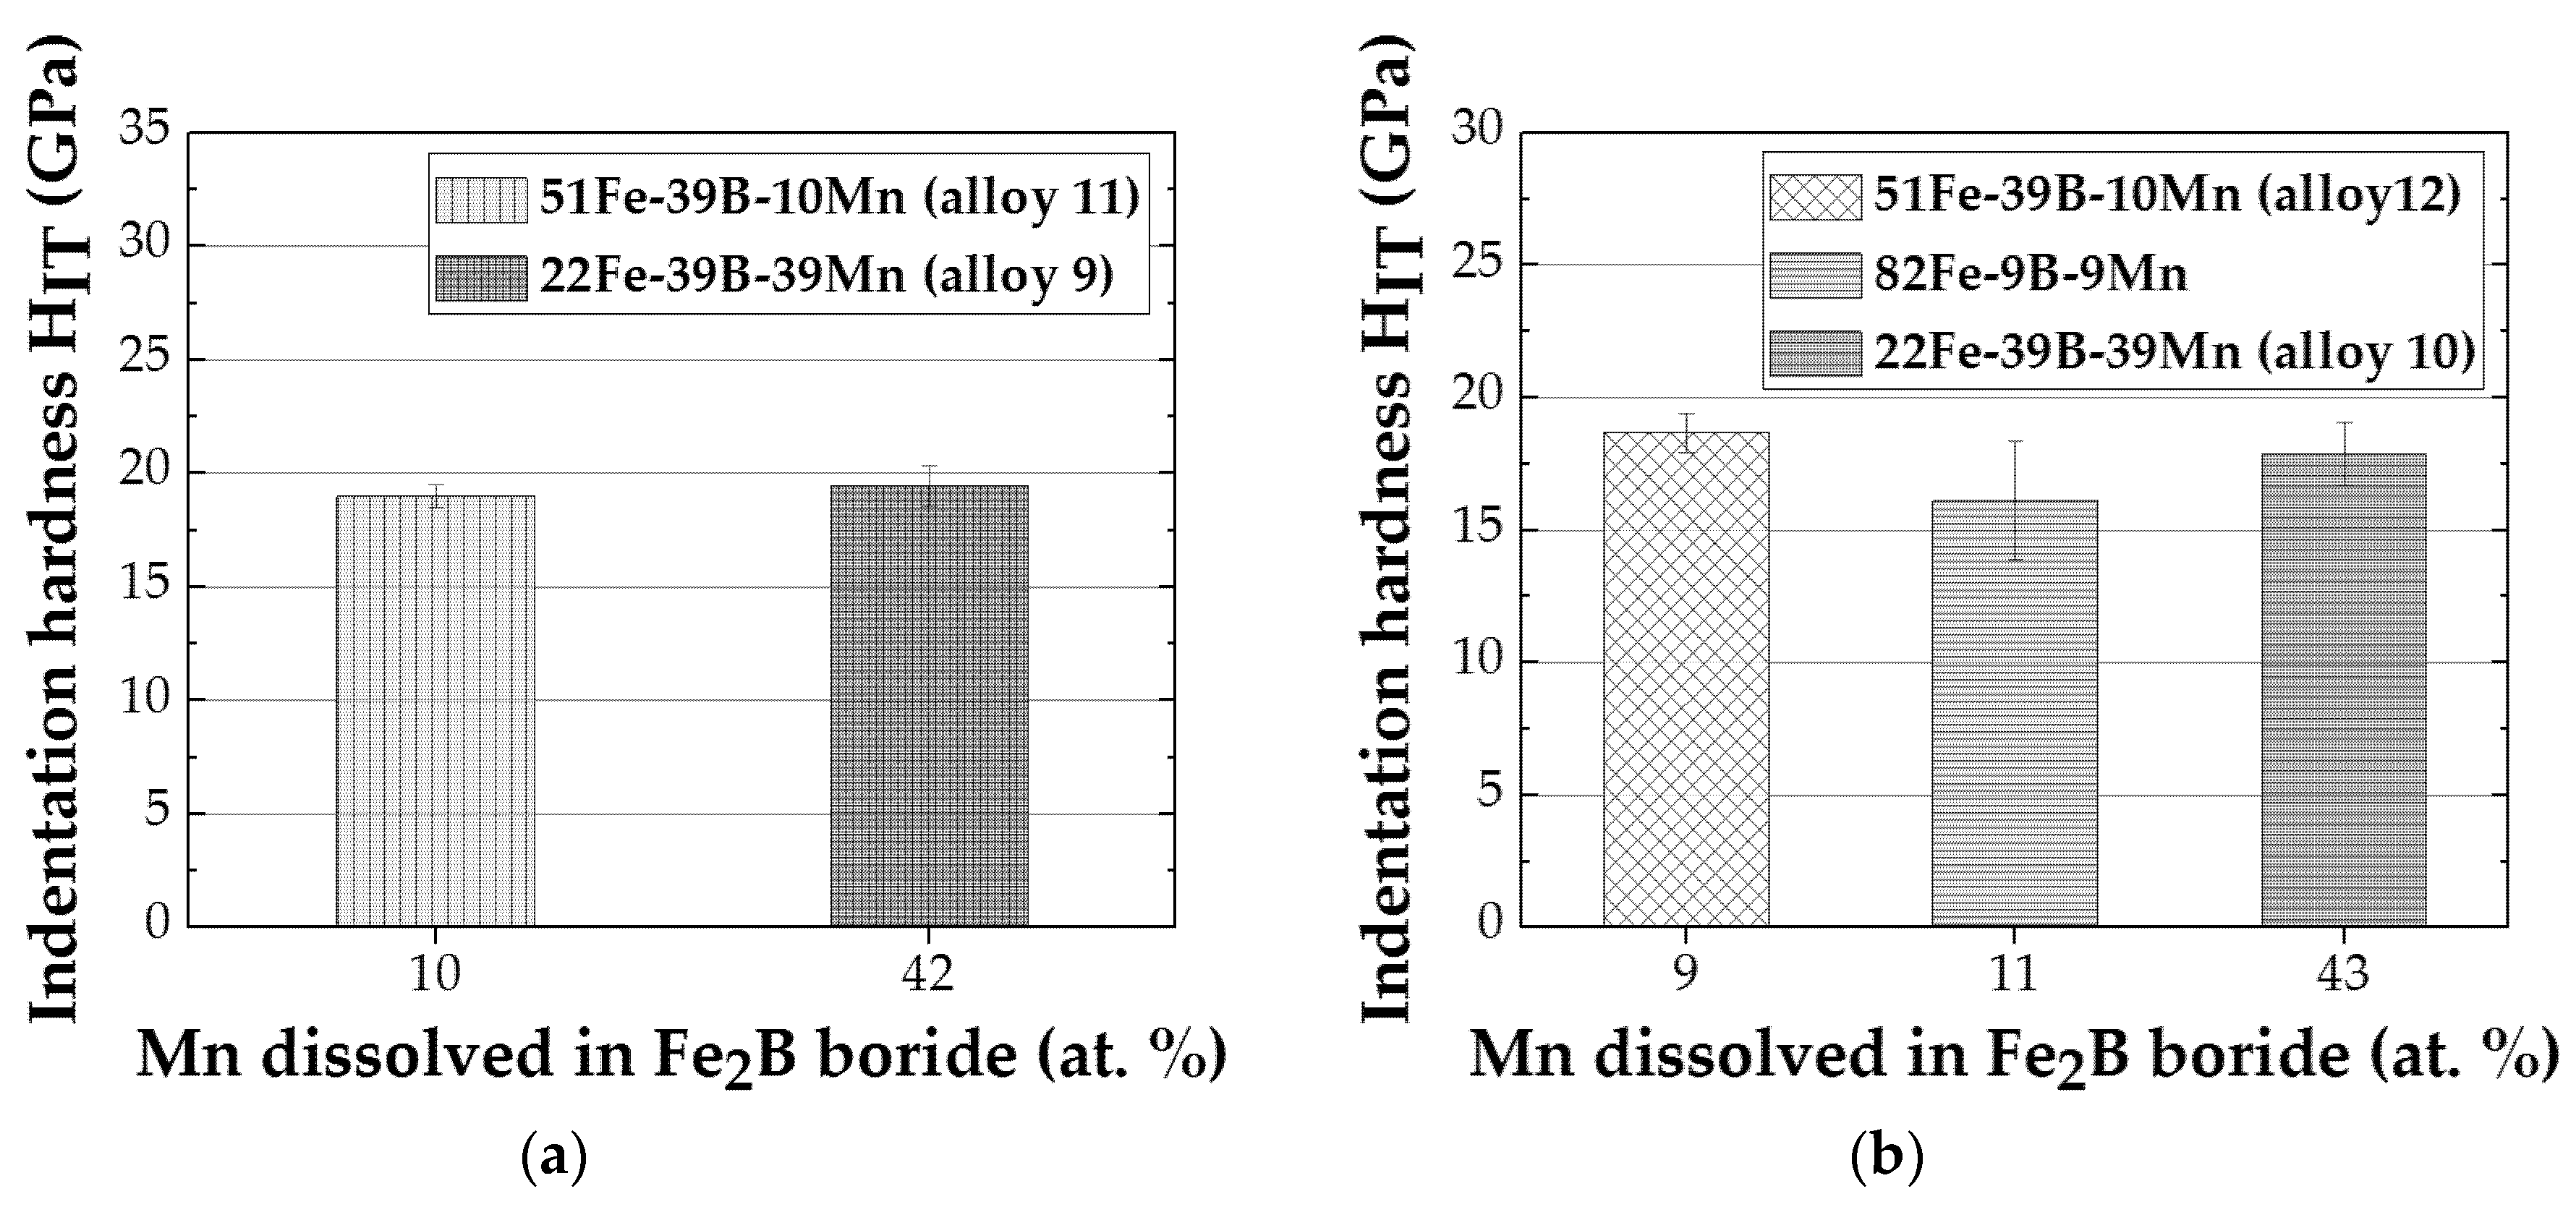
For the FeB (MB) formed in the Fe-B-C, Fe-B-Cr, and Fe-B–Mn systems, the indentation modulus and hardness are determined as a function of the amount of the third element dissolved for specific annealing conditions. The FeB (MB) indentation hardness in the Fe-B-C, Fe-B-Cr, and Fe-B-Mn systems as a function of carbon (C), chromium (Cr), and manganese (Mn) are given in Figure 5. The annealing conditions, i.e., temperature/time (Table 1) allow for comparison of the M2B only in alloy system Fe-B-Mn. Thus, the indentation hardness for the M2B in Fe-B-Mn alloys heat-treated at 1223 K and 873 K are determined as a function of the amount of manganese dissolved (Mn), and are given in Figure 6.
For the FeB formed in Fe-B-C alloys (Figure 5a), the difference in indentation hardness between alloy 38.5 Fe–59.2 B–2.3 C (1.04% C) and alloy 39.7 Fe–33 B–27.3 C (2.69% C) can be considered negligible. A sharp increase in the measured indentation hardness, i.e., 22.3 ± 1.3 GPa (Figure 4a), with a further increase in carbon content (2.7 at.%) in alloy 34.6 Fe–52 B–13.4 C was observed. The indentation hardness measured cannot be only associated with the C content variation in the alloy. Extrinsic influence in alloy 39.7 Fe–33 B–27.3 C (2.69% C) caused by the surrounding Fe2B can lead to underestimation of the indentation hardness. In addition, the high-volume percent of FeB in alloy 34.6 Fe–52 B–13.4 C, i.e., 54.25 vol.%, can be the reason for this difference. The indentation hardness in Cr alloyed FeB is higher at lower amounts of dissolved chromium (Figure 5b). In a like manner, the indentation hardness of FeB containing manganese is higher at lower amounts of dissolved manganese (Figure 5c,d). FeB indentation modulus shows the same behavior as the indentation hardness for the Fe-B-Cr and Fe-B-Mn alloys.
For the manganese alloyed Fe2B annealed at 873 K, only a slight increase in hardness is observed with higher amounts of manganese dissolved (Figure 6a). For the Fe2B formed in Fe-B-Mn alloys annealed at 1223 K, the decrease in hardness at 11 at.% Mn dissolved is followed by a hardness increase at 43 at.% Mn dissolved (Figure 6b). Fe2B indentation modulus for the Fe-B-Mn alloys annealed at 1223 K shows the same behavior. For the Fe2B in Fe-B-Mn alloys annealed at 873 K, the indentation modulus is lower at higher manganese content. Nonetheless, when probing phases during nanoindentation testing as a part of a multiphase material, it must be accounted for the possible influences of the surrounding phases/matrix. The extrinsic influences on nanoindentation measurement depend on, for example, the amount of the surrounding phases in the microstructure, and/or their proximity to the indented phase.
In these alloys, FeB and Fe2B phases are found in different combinations both with harder phases, e.g., V3B4, CrB2, CrB4, Cr3B4, B, and B4C, and/or softer, e.g., γ-Fe and graphite, as surrounding phases. Herein, in an attempt to minimize the influence of the surrounding phases, the diameters (d) of the phases measured were carefully chosen at d > 10 μm, and distance of about one-indent diameter was kept from the phase border during testing. Hence, for the alloys used in this study, the extrinsic effects can be considered minimized, although it cannot be claimed that they are eliminated entirely. On the contrary, the indentation hardness and modulus of Fe2B boride formed in the 82 Fe–9 B–9 Mn alloy and FeB in the 39.7 Fe–33 B–27.3 C alloy are probably underestimated due the extrinsic influences of the softer γ-Fe matrix and Fe2B phase, respectively.
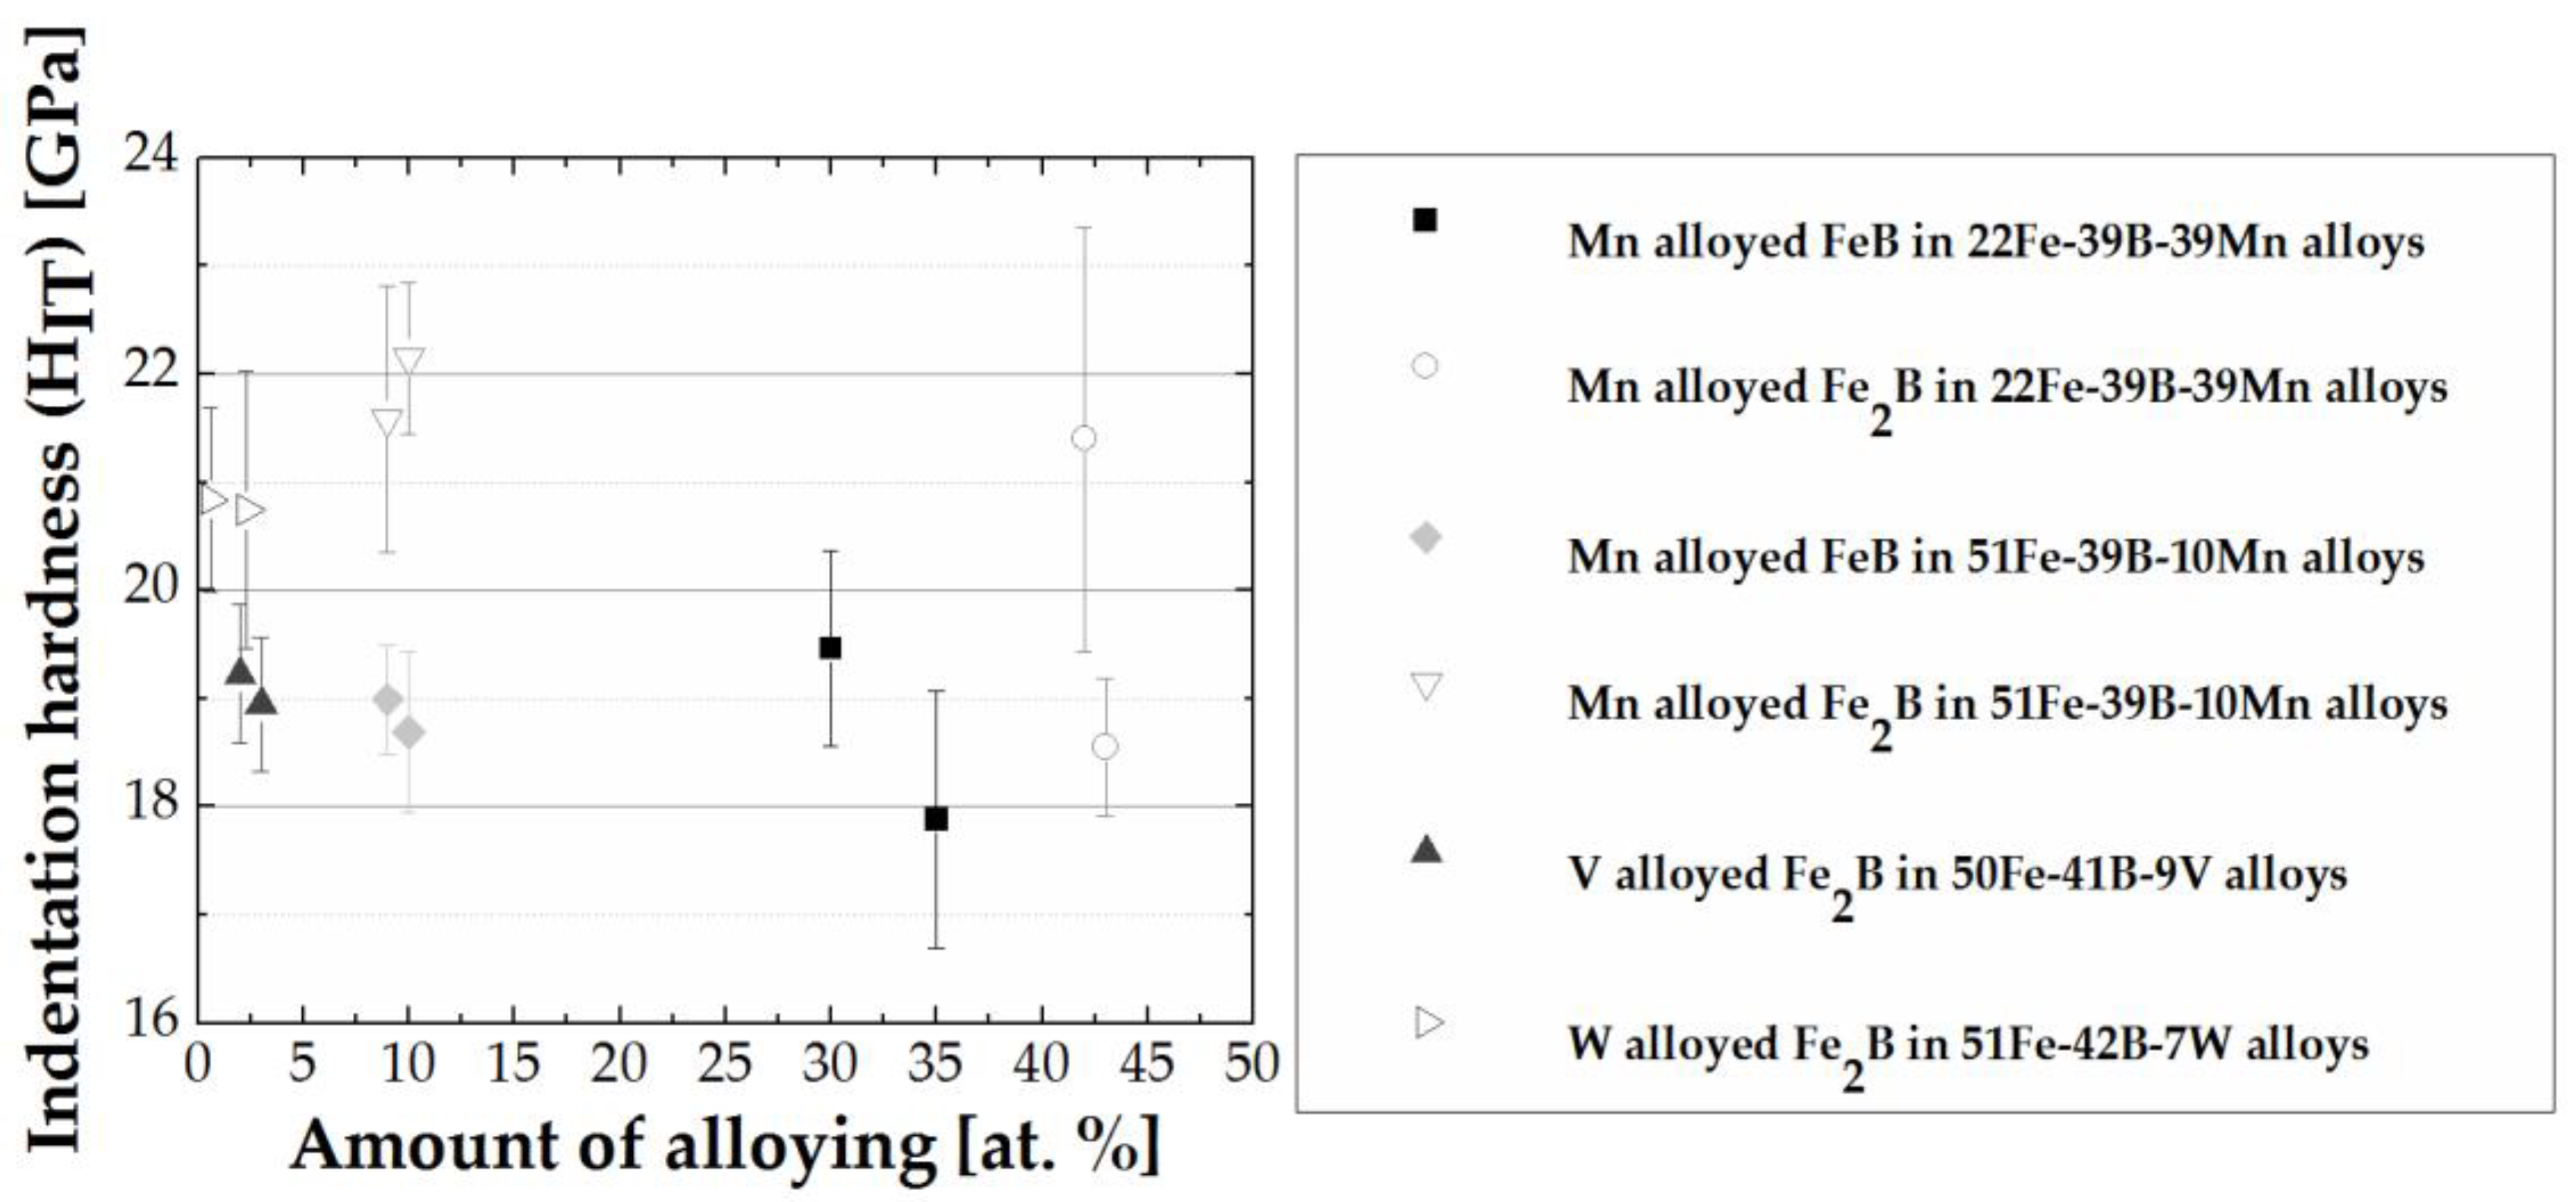
The relationship between amount of alloying and indentation hardness of alloys grouped by equal chemical composition is given in Figure 7. A trend of lower hardness at higher alloying content is observed, with exception to the Fe2B phase in alloy group 51 Fe–39 B–10 Mn. The differences between alloys in a group are within standard deviation at lower amounts of alloying content, and the difference within alloy group increases with increases in alloying content. The anomalous behavior in 51 Fe–39 B–10 Mn alloys cannot be claimed as inherent to the material and can be an outcome of the nanoindentation measurement process.
In general, the hardness of materials is primarily related to the mobility of dislocations [55]. However, at a more fundamental level, intrinsic hardness modification has been successfully linked to electronic structure effects induced by the alloying elements [56]. In the literature, the understanding of the underlying mechanism of electronic mechanical properties modification imposes a challenge, and its investigation is beyond the scope of this study. Herein, the measured indentation hardness is linked to a parameter called valence electron concentration (VEC) that has been used as an indicator for electronic modification of mechanical properties. The aim is to assess any possible relation of the VEC parameter to the nanoindentation hardness measured in this study.
The valence electron concentration (VEC) is defined as the number of valence electrons per formula unit [57]. VEC is calculated as given in Ge et al. [58]. The following valence electron numbers are used: 3 (B), 8 (Fe), 4 (C), 6 (Cr), 7 (Mn), 5 (V), and 6 (W), in determining VEC [59]. The calculation was done using the borides chemical composition as given in Table 1. VEC and indentation hardness for the Fe2B and FeB are given in the map in Figure 8. The map shows strong partitioning between the different phases, i.e., FeB and Fe2B. The typical values for single element alloyed FeB in these alloys are between 5.07 VEC to maximum 5.53 VEC, and for the Fe2B are in between mininum 6.07 VEC and maximum 6.36 VEC. Comparing FeB and Fe2B, the indentation hardness shows a decreasing trend with increasing VEC. This is due to the fact that with increasing VEC, the ‘metallic’ character of the materials increases, which could result in easier slip on a given slip system or the activation of more systems.
In the case of the Fe2B phase formed in the quaternary 45 Fe–40 B–5 Mn–10 V alloy, the map shows that the synergistic effect of Mn and V (alloying content of Mn = 5 at.% and V = 3 at.%), results in VEC = 6.16, and the measured indentation hardness is 18.1 ± 1.2 GPa. Although the boride structure type is the hardness determinant and in comparison to only manganese alloyed Fe2B, there is unclear disposition (because of the wider range of measured hardness data), the influences caused by the different elements are viable; since, in the presence of both manganese and vanadium, the indentation hardness is lower compared to only vanadium alloyed borides, i.e., 19.2 ± 0.6 GPa (alloy 13), 19.0 ± 0.6 GPa (alloy 14).
Further, even though some clustering of hardness values at the same VEC is present, a strong tendency is not observable. Among the groups of alloys mentioned above, i.e., alloys with the same alloying element and heat-treated at the same temperature, i.e., FeB in 17 Fe–65 B–18 Cr and 50 Fe–40 B–10 Cr, FeB in manganese alloys annealed at 873 K, and FeB in manganese alloys annealed at 1223 K, as well as alloy groups that have the same chemical composition and/or phase composition, i.e., FeB in 51 Fe–39 B–10 Mn, Fe2B in 50 Fe–41 B–9 V, and Fe2B in 22 Fe–39 B–39 Mn, Fe2B in manganese alloys annealed at 1223 K the VEC vs. HIT map shows that primarily lower hardness is observed at lower VEC values. However, this tendency is partially substantiated, i.e., it is not observed for the rest of the alloy groups where lower hardness is present at higher VEC values. For the C alloyed FeB annealed at 1173 K, alloy group 22 Fe–39 B–39 Mn, and manganese alloys annealed at 873 K, no relation can be discerned. The empirical relations between indentation hardness and VEC parameter obtained in this study can be used as orientation points for hardness estimation of similar borides.

3.3. Indentation Size Effect

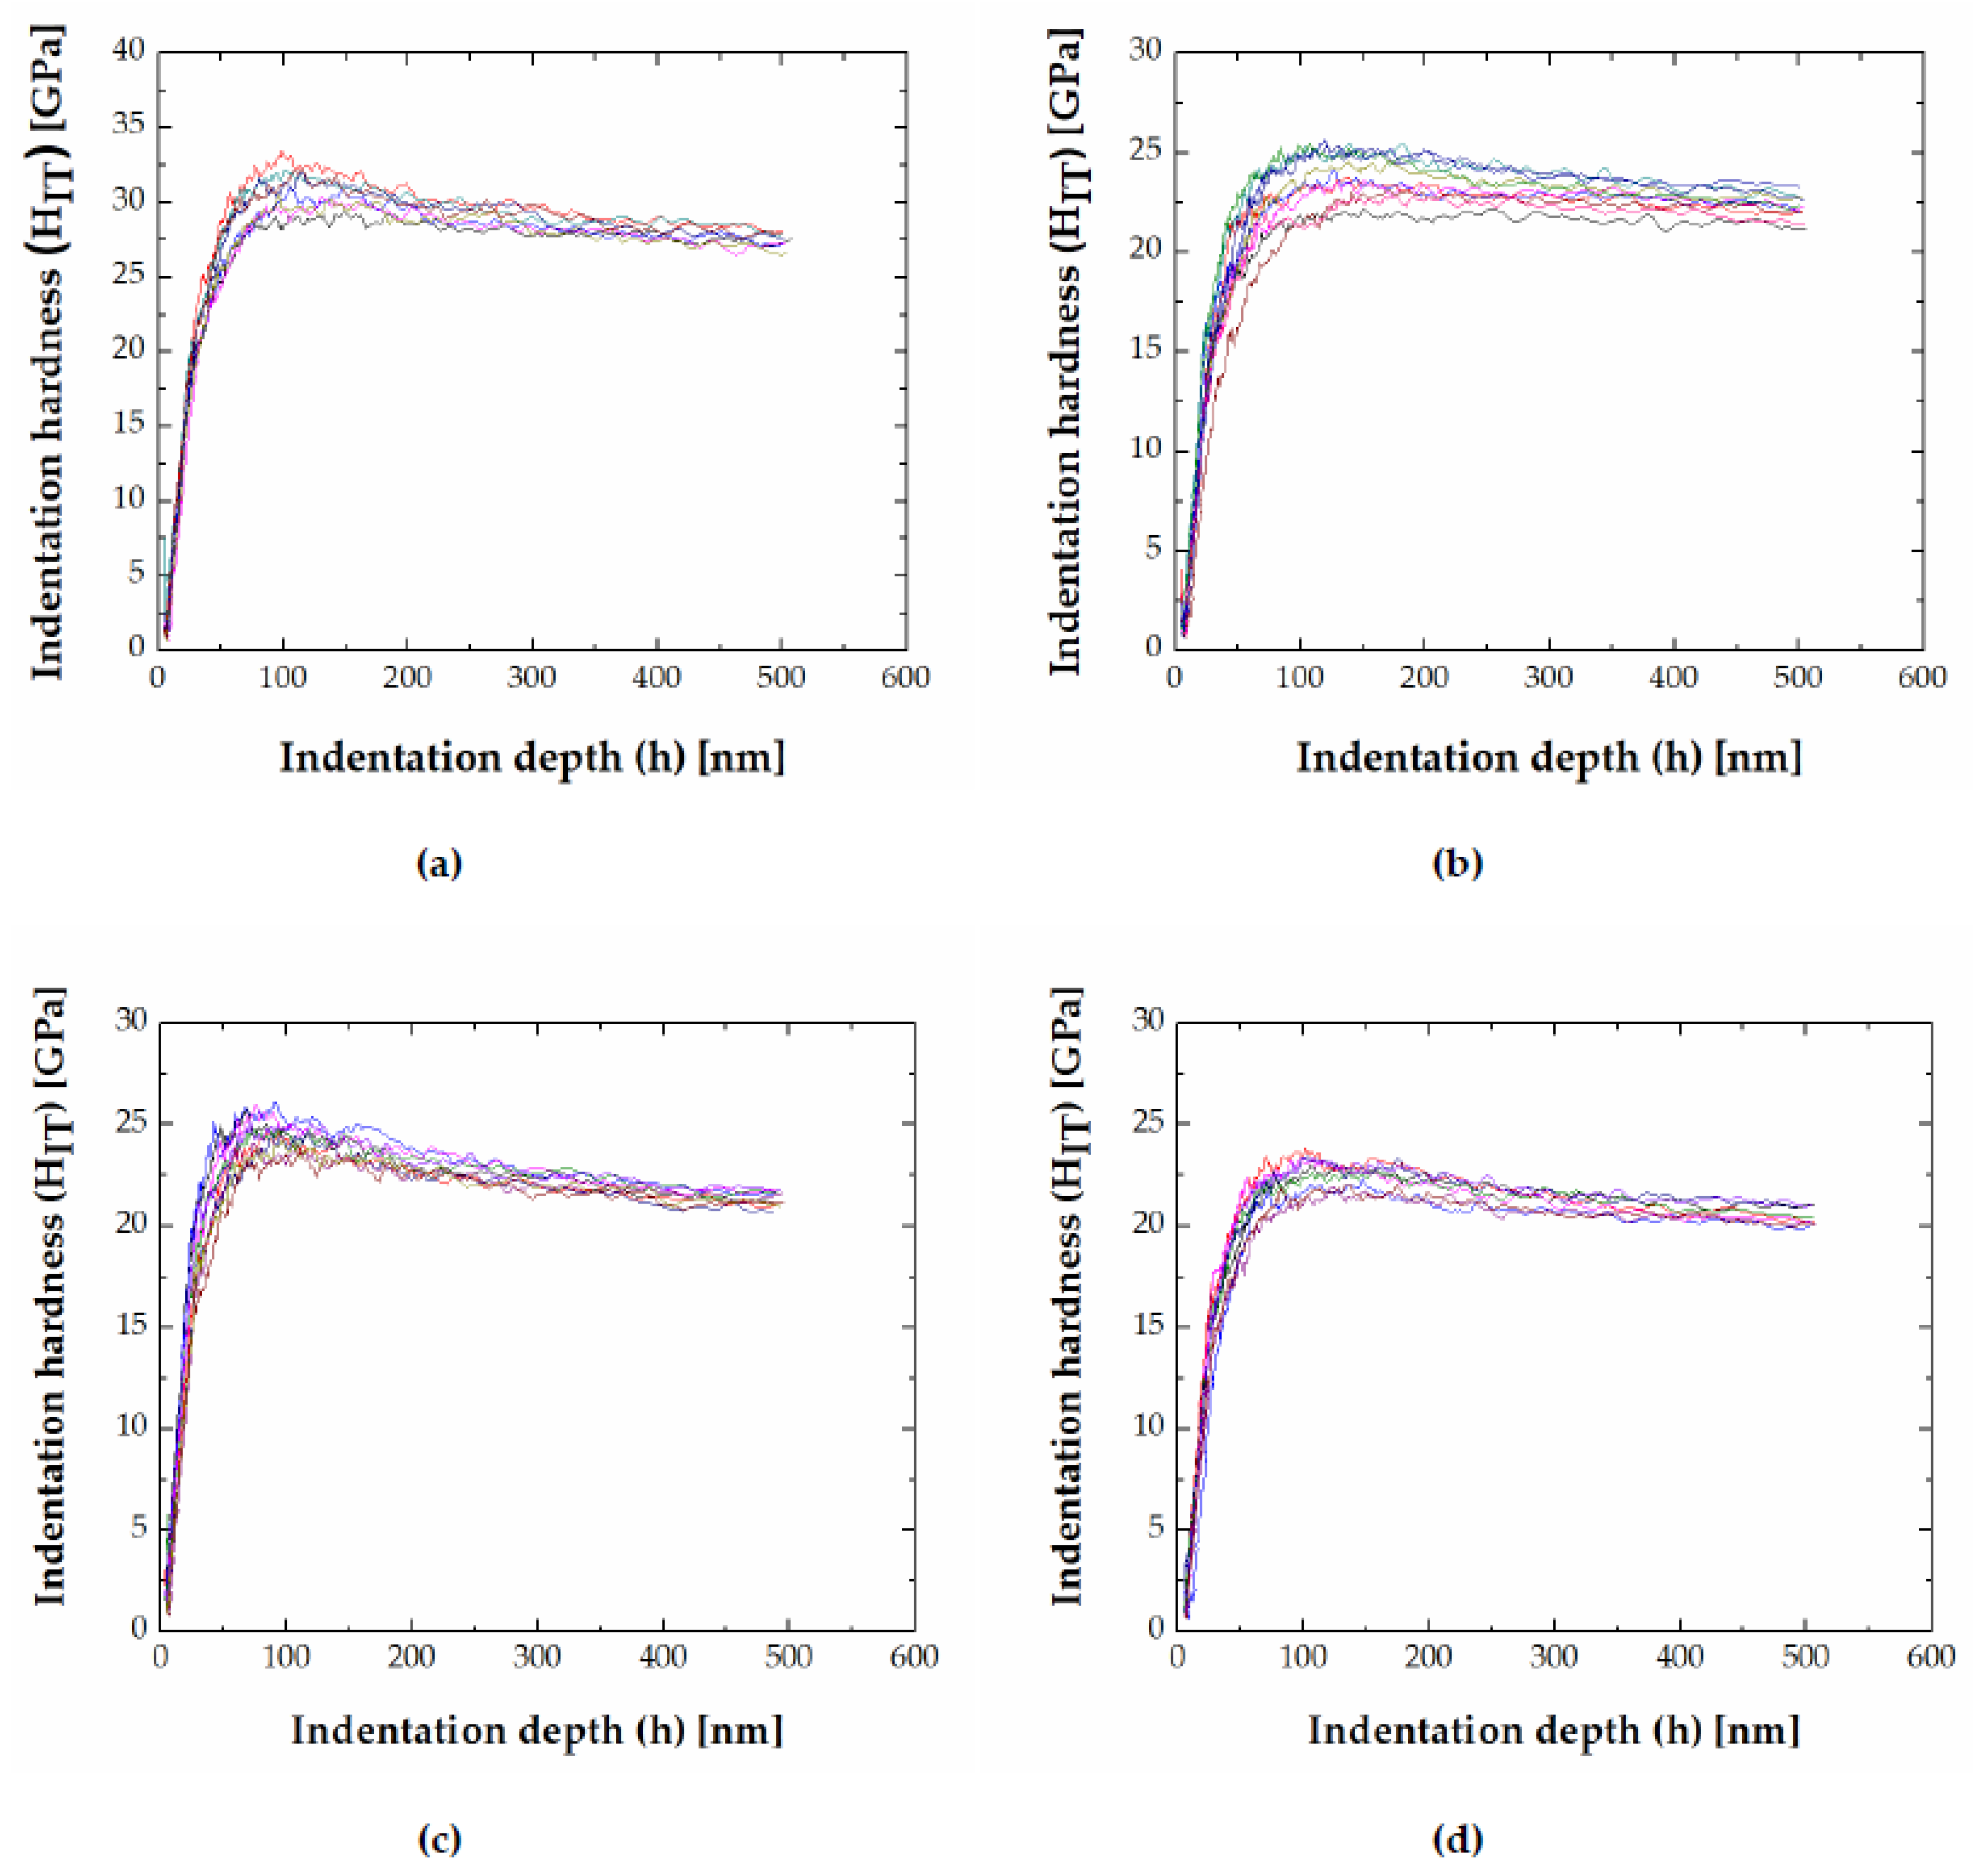
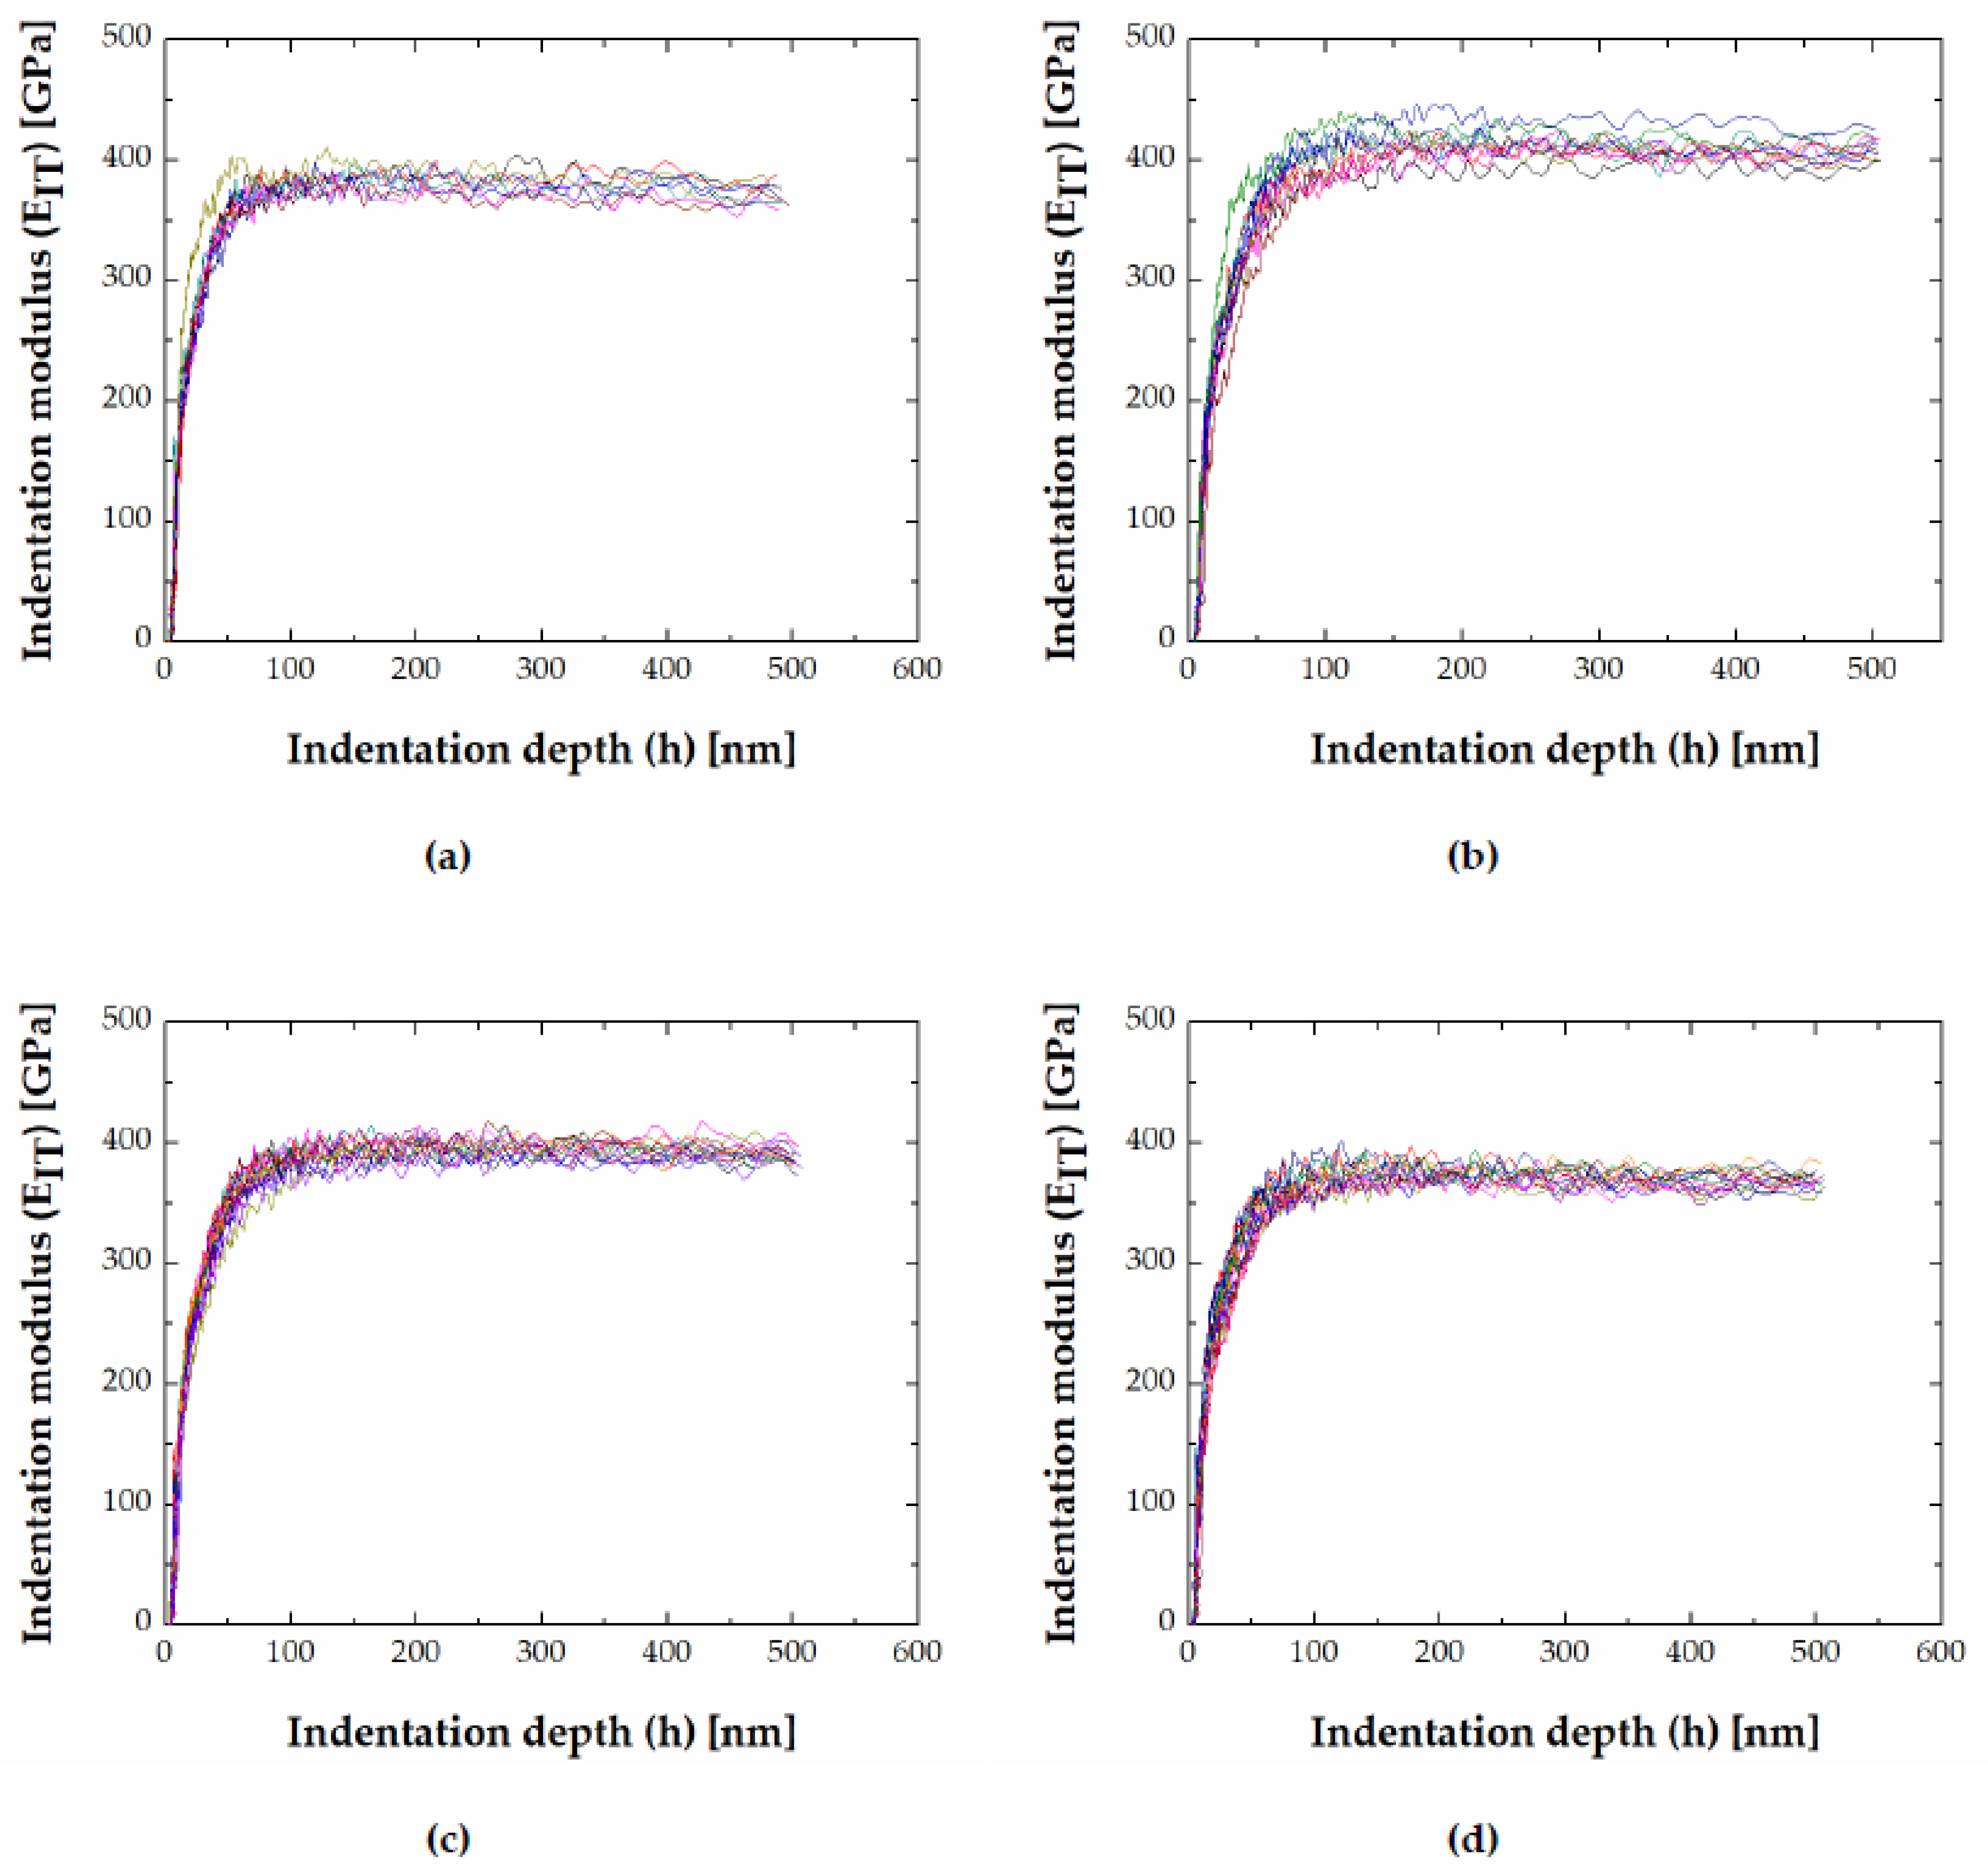
In the investigated alloys, an indentation size effect (decreasing hardness with indentation depth) in FeB and Fe2B was observed. Indentation hardness (HIT) and indentation modulus (EIT) for the FeB and Fe2B phase as a function of indentation depth (h) for chosen alloys are visualized in Figure 9 and Figure 10 (the different colored curves represent an individual indentation measurement).
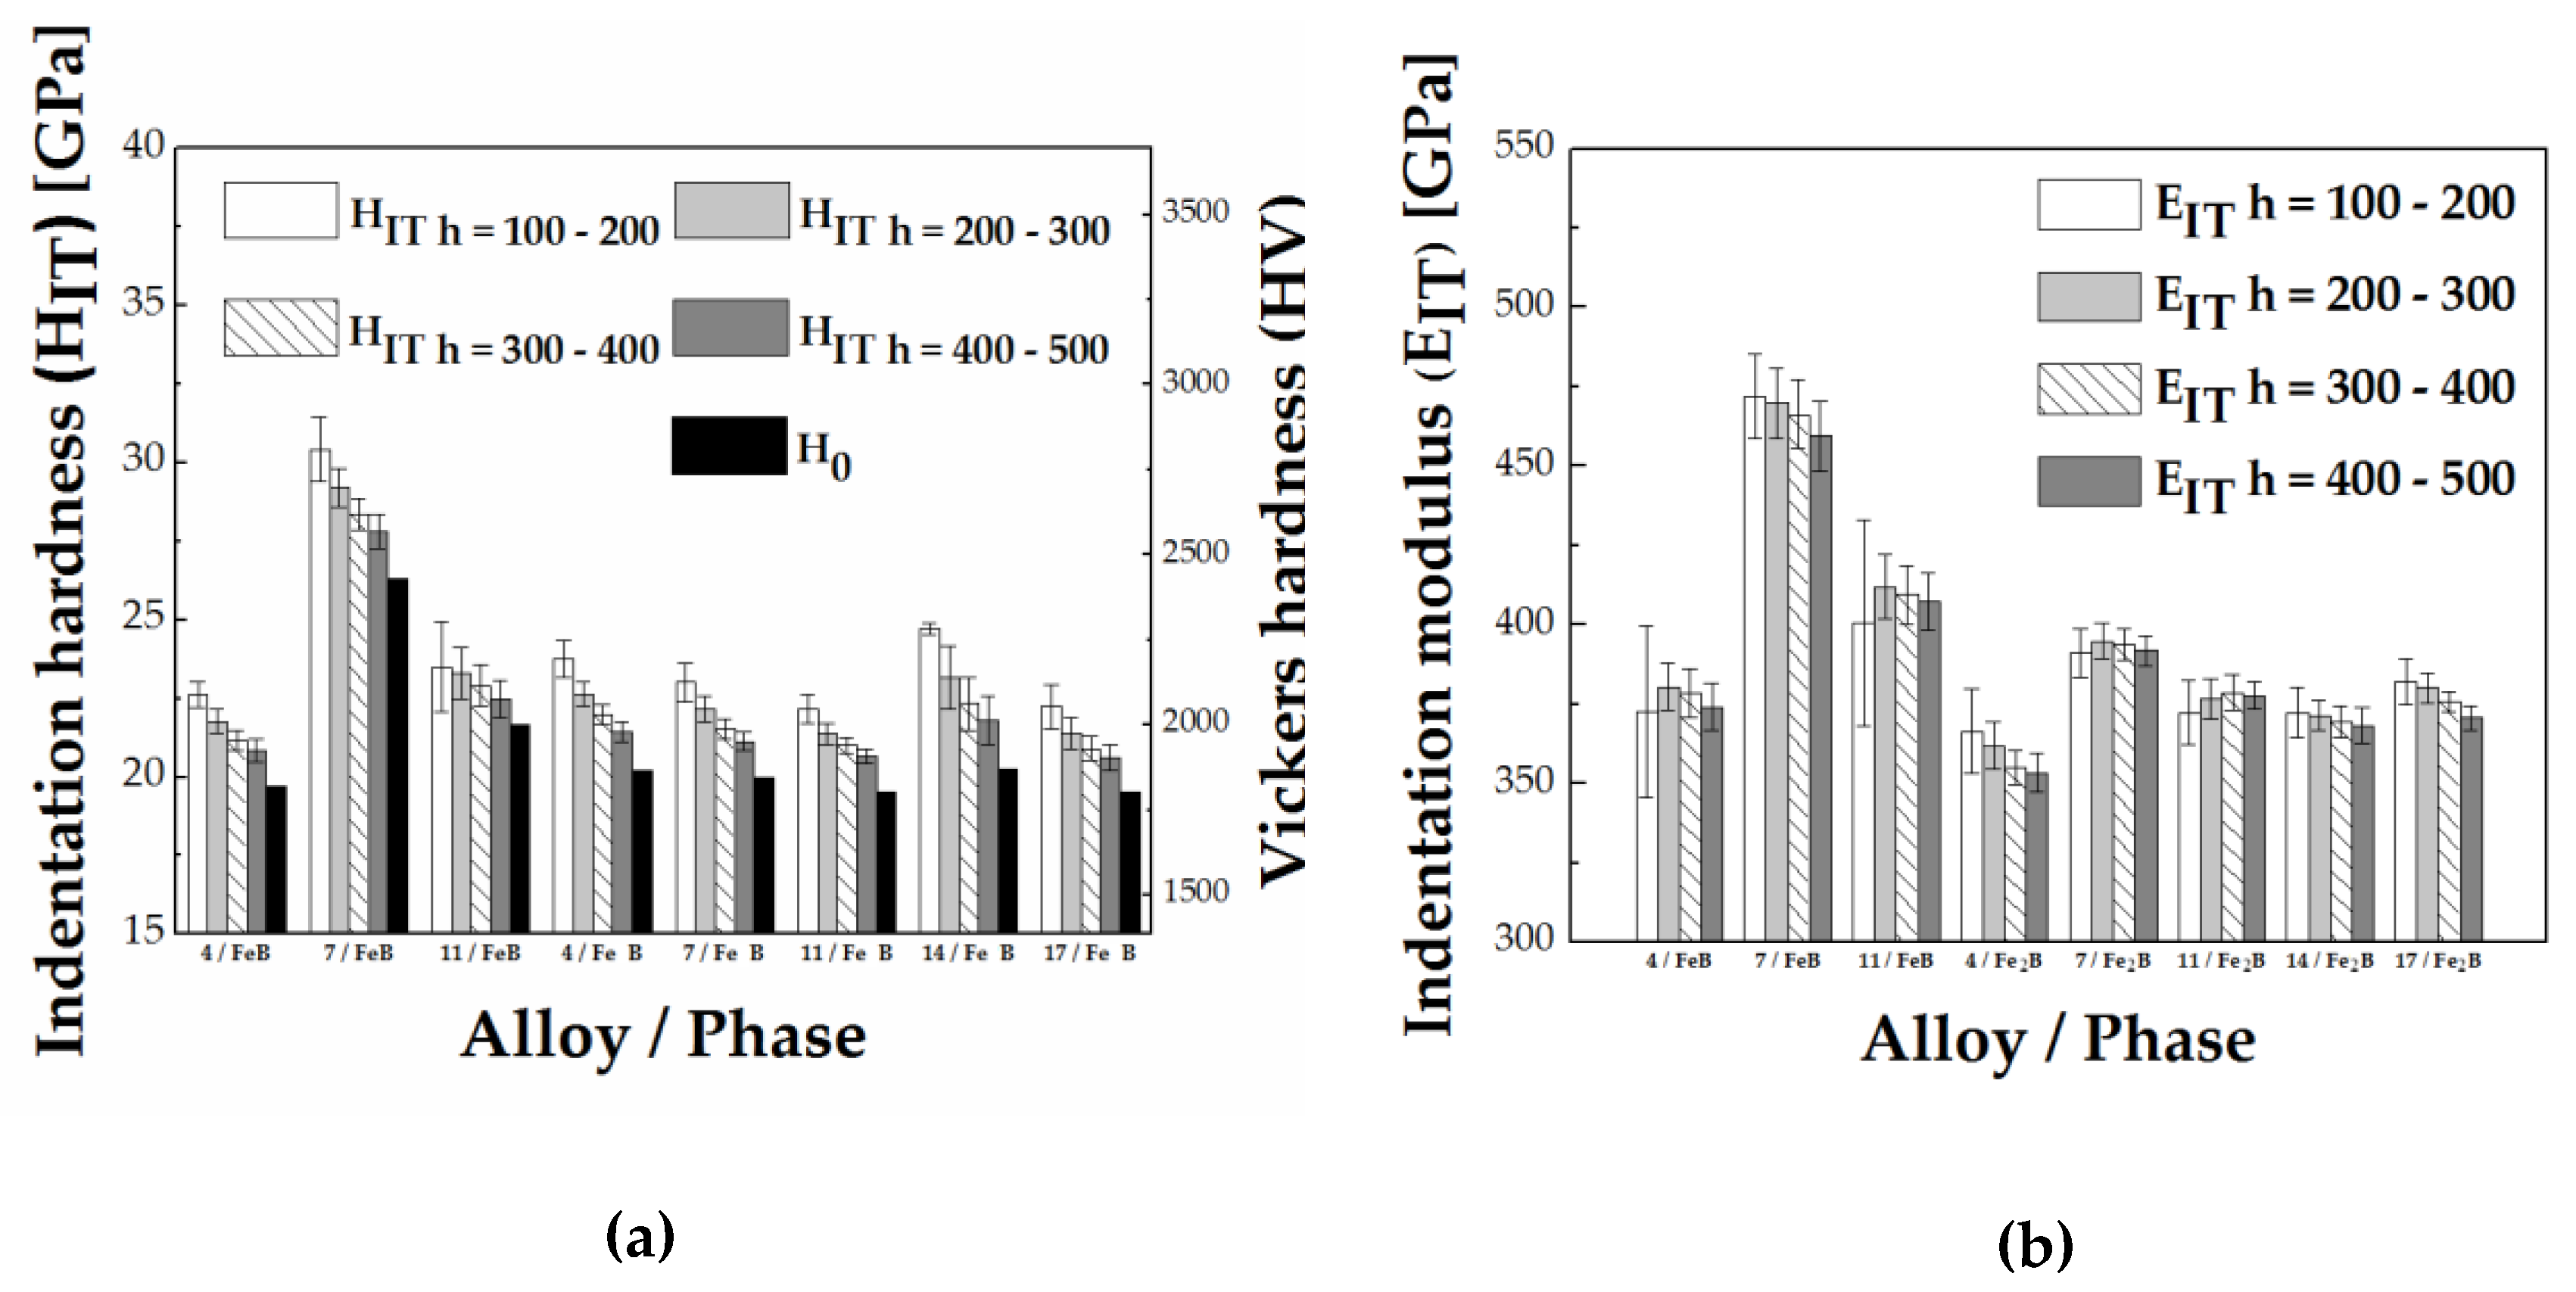
Indentation hardness vs. depth plots show that after reaching peak value (at approximately 50–100 nm), the indentation hardness decreases monotonically with increasing depth (Figure 9). The ISE for the FeB phase is most pronounced in the 50 Fe–40 B–10 Cr alloy, and for the Fe2B phase, in alloy 50 Fe–41 B–9 V (alloy 14). The ISE is more pronounced for Fe2B phase compared to FeB phase (Figure 9).
Indentation modulus vs. depth plots show an initial increase to a maximum value followed by a subsequent decrease up to a constant value (Figure 10). The constant modulus indicates that intrinsic materials’ properties were measured.
The change of indentation hardness (HIT) and indentation modulus (EIT) at different depth intervals (h = 100–200 nm, h = 200–300 nm, h = 300–400 nm, h = 400–500 nm) for the FeB and Fe2B phase is visualized in Figure 11.
Indentation size effect is a well-known phenomenon in indentation testing and various mechanisms have been identified as responsible for ISEs, such as dislocations, cracking, phase transformations, surface effects, etc. [60]. In the case of crystalline metals, the dislocation-based mechanisms are identified as the dominant underlying mechanisms of ISE [60]. The Nix and Gao model [61] is an established model used to estimate hardness based on the dislocation-based behavior as a prevailing mechanism influencing ISEs. Observed slip lines and linear details (steps) in the FeB phase in alloys 50 Fe–40 B–10 Cr (Figure 12) signify a dislocation-based deformation behavior. Dislocation-based deformation for the Fe2B was also reported by Lentz et al. [29].
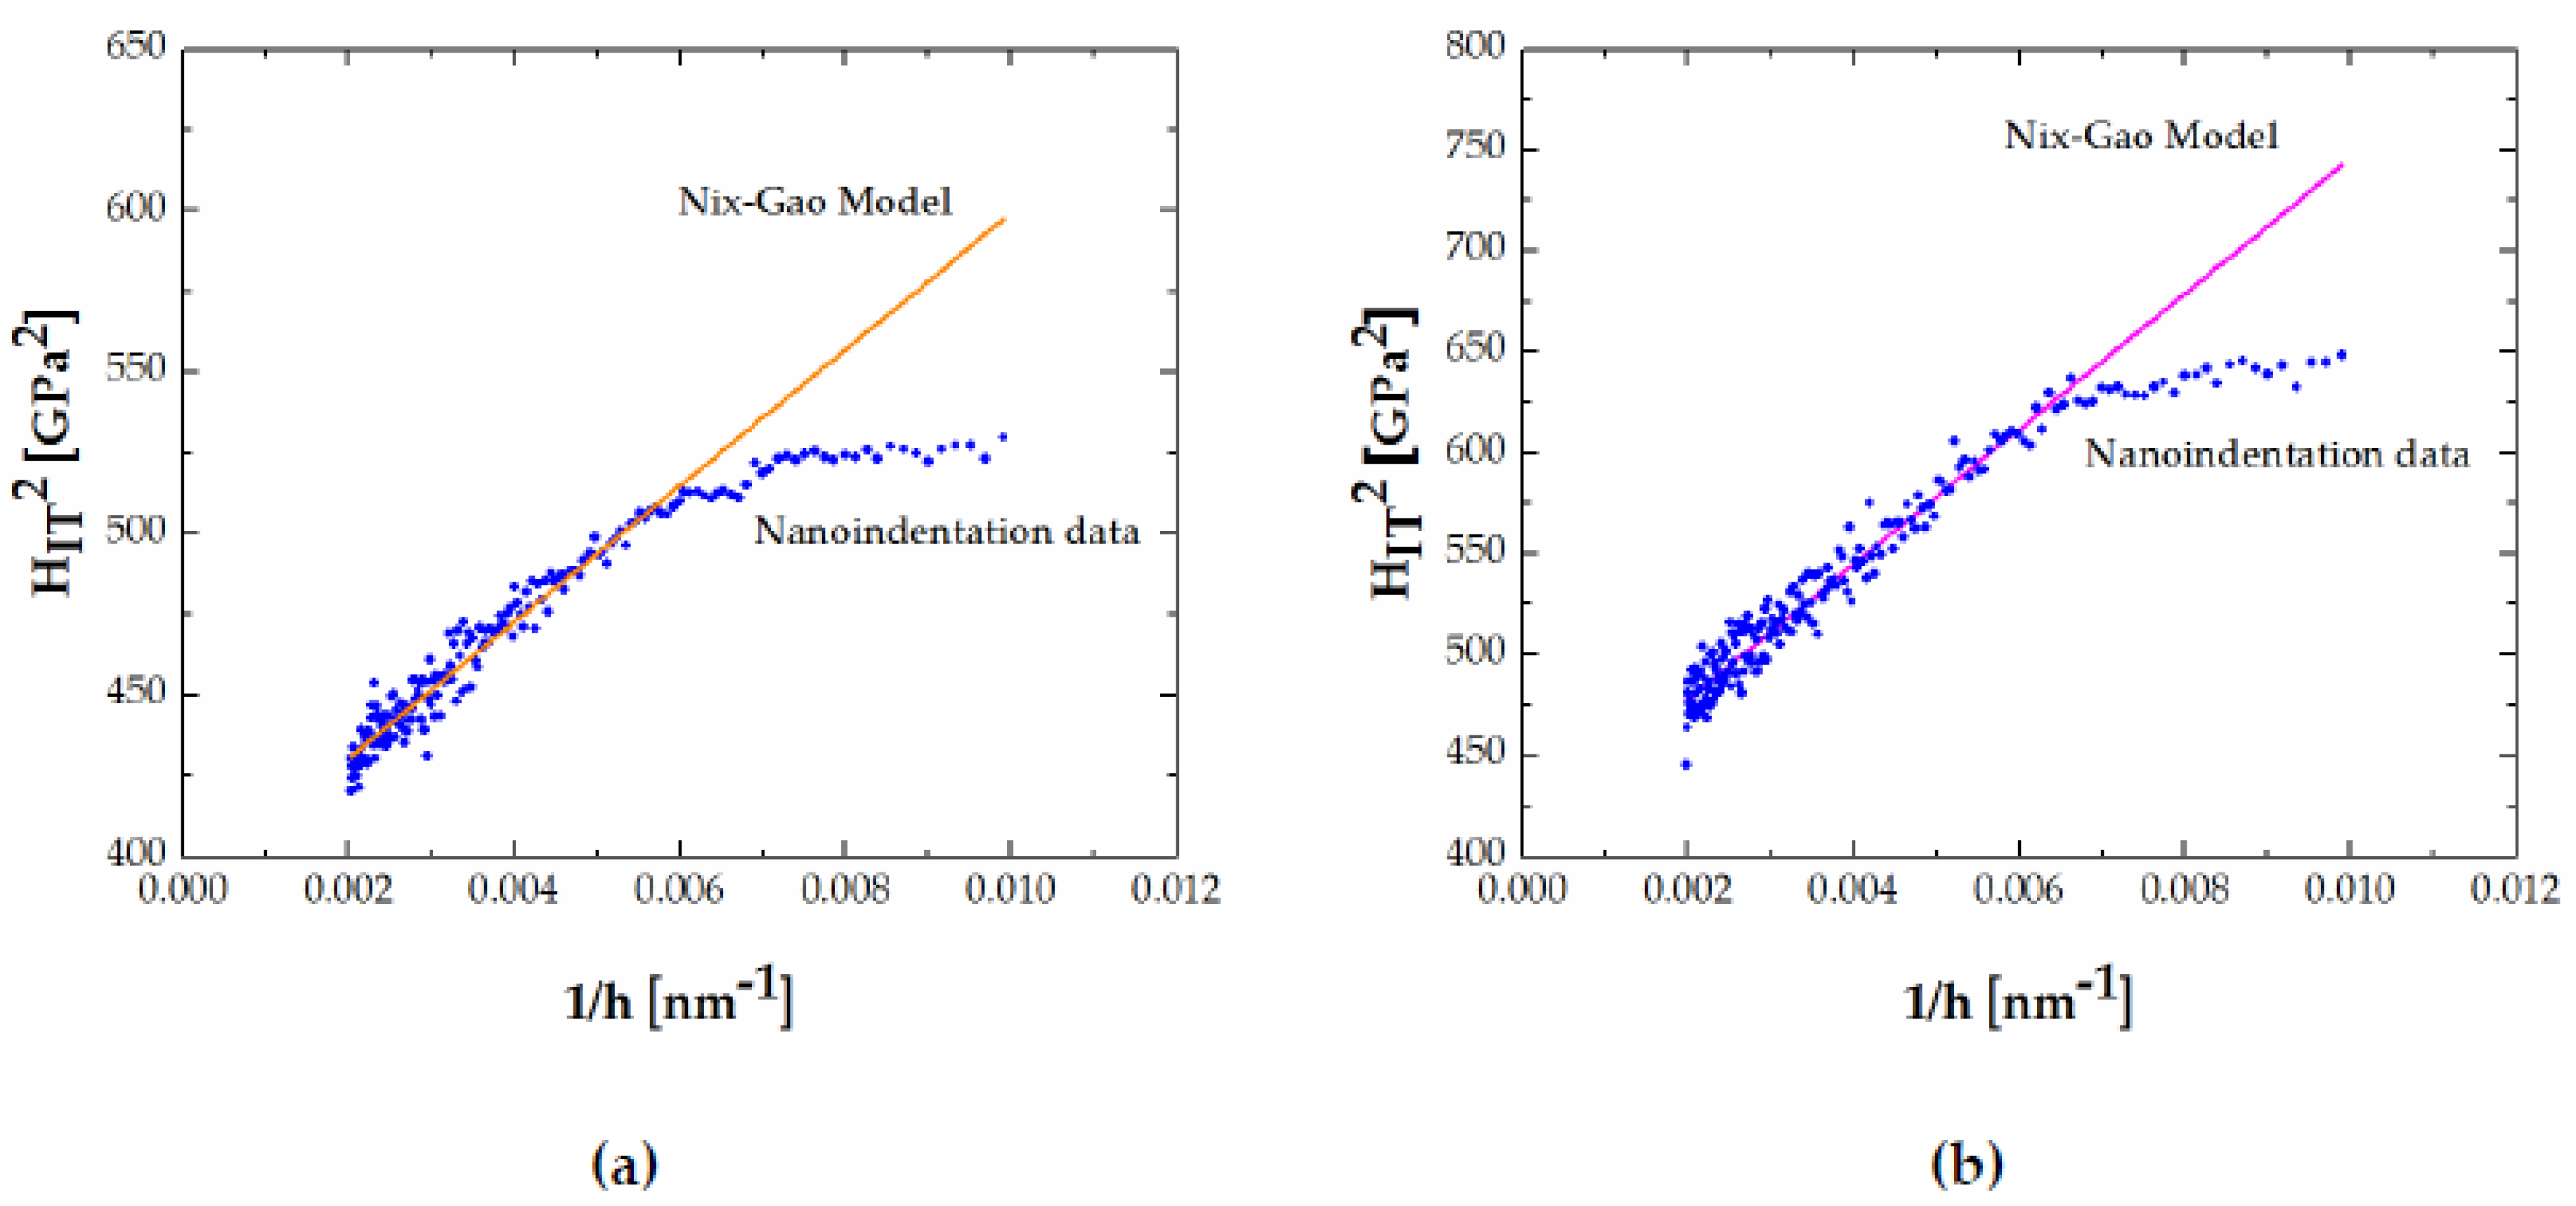
Thus, the Nix and Gao model has been applied to calculate the hardness at infinite indentation depth or true hardness (H0) of both FeB and Fe2B phases. The calculated true hardness (H0) based on the Nix–Gao model is given in Table 4.
The model was fitted to data for indentation depth >100 nm (Figure 13). The HIT2 vs. h−1 plot showed good fit of the Nix–Gao model for both FeB and Fe2B phases. However, as one can see, the plots for FeB and Fe2B phase show linear behavior at larger depths, but the linearity does not extend to smaller depths (h < approximately 150 nm). In the literature, this behavior has been interpreted as bilinear and considered as an indicator of change in the prevailing ISE mechanism at smaller depths [60,62].

4. Conclusions

In this study, the influence of the third element dissolved in FeB and Fe2B phases formed in different Fe-B-X (X = C, Cr, Mn, V, W, Mn + V) systems has been characterized by nanoindentation. The results of this study can be outlined as follows:
(1)
The determined indentation hardness under the influence of different amounts and type of alloying elements showed the highest hardness of FeB formed in Fe-B-X (X = C, Cr, Mn) systems in the presence of Cr as an alloying element with a hardness value of HIT = 26.9 ± 1.4 GPa. The highest hardness in the Fe2B was measured in the presence of W additions HIT = 20.8 ± 0.9 GPa. The lowest hardness in both alloys was determined in Mn alloyed FeB and Fe2B.
(2)
The highest hardness for FeB boride was measured at VEC = 5.28, and for the Fe2B boride, at VEC = 6.368. Comparison between FeB and Fe2B showed, overall, that the indentation hardness decreases with increasing VEC, which is associated with the increase of the ‘metallic’ character of the materials and easier slip on a given slip system or the activation of more systems.
(3)
The determined indentation modulus under the influence of different amounts and type of alloying elements showed that Cr alloyed FeB and Fe2B are stiffest, EIT = 485.5 ± 22.3 GPa and EIT = 391.7 ± 10.9 GPa, respectively. The lowest modulus in the case of FeB formed in Fe-B-X (X = C, Cr, Mn) was measured in the presence of C as an alloying element, while for Fe2B, in Mn alloyed Fe2B.
(4)
The indentation size effect was observed in both FeB and Fe2B phases and the hardness decreased with an increase in the indentation depth. The nanoindentation data has been successfully fitted to a dislocation-based model for determining the real hardness, H0.

Author Contributions

Conceptualization, I.K. and V.H.; methodology, I.K. and V.H.; software, I.K., V.H., I.P., and T.C. formal analysis, I.K., V.H., I.P., and T.C.; investigation, I.K., V.H., I.P., and T.C.; resources, V.H., I.P., and T.C.; data curation, I.K.; writing—original draft preparation, I.K.; writing—review and editing, I.K., V.H., I.P., and T.C; visualization, I.K.; supervision, V.H.; project administration, V.H.; funding acquisition, V.H. All authors have read and agreed to the published version of the manuscript.

Funding

This research was funded by Slovak Grant Agency VEGA under the project No. 2/0073/18.

Conflicts of Interest

The authors declare no conflict of interest.

References

  1. Krukovich, M.G.; Prusakov, B.A.; Sizov, I.G. Plasticity of Boronized Layers; Springer International Publishing: Cham, Switzerland, 2016; pp. 301–310. [Google Scholar]
  2. Kulka, M. Current Trends in Boriding; Springer International Publishing: Cham, Switzerland, 2019; pp. 9–16. [Google Scholar]
  3. Winter, K.-M.; Kalucki, J.; Koshel, D. Process technologies for thermochemical surface engineering. In Thermochemical Surface Engineering of Steels; Mittemeijer, E., Somers, A.J.M., Eds.; Woodhead Publishing: Cambridge, UK, 2015; Volume 3, pp. 154–196. [Google Scholar]
  4. Behrens, B.; Bräuer, G.; Paschke, H.; Bistron, M. Reduction of wear at hot forging dies by using coating systems containing boron. J. Prod. Eng. 2015, 5, 497–506. [Google Scholar] [CrossRef]
  5. Medvedovski, E.; Chinski, F.; Stewart, J. Wear- and Corrosion-Resistant Boride-Based Coatings Obtained through Thermal Diffusion CVD Processing. Adv. Eng. Mater. 2014, 16, 713–728. [Google Scholar] [CrossRef]
  6. Röttger, A.; Lentz, J.; Theisen, W. Boron-alloyed Fe–Cr–C–B tool steels—Thermodynamic calculations and experimental validation. Mater. Des. 2015, 88, 420–429. [Google Scholar] [CrossRef]
  7. Lentz, J.; Röttger, A.; Theisen, W. Microstructures, Heat Treatment, and Properties of Boron-Alloyed Tool Steels. Steel Res. Int. 2019, 91, 1900416. [Google Scholar] [CrossRef]
  8. Liu, Z.; Li, Y.; Chen, X.; Hu, K. Microstructure and mechanical properties of high boron white cast iron. Mater. Sci. Eng. A 2008, 486, 112–116. [Google Scholar] [CrossRef]
  9. Chen, X.; Li, Y.; Zhang, H. Microstructure and mechanical properties of high boron white cast iron with about 4 wt% chromium. J. Mater. Sci. 2010, 46, 957–963. [Google Scholar] [CrossRef]
  10. Chen, X.; Li, Y. Effect of heat treatment on microstructure and mechanical properties of high boron white cast iron. Mater. Sci. Eng. A 2010, 528, 770–775. [Google Scholar] [CrossRef]
  11. Liu, Z.; Chen, X.; Li, Y.; Hu, K. Effect of Chromium on Microstructure and Properties of High Boron White Cast Iron. Metall. Mater. Trans. A Phys. Metall. Mater. Sci. A 2008, 39, 636–641. [Google Scholar] [CrossRef]
  12. Chen, Z.; Miao, S.; Kong, L.; Wei, X.; Zhang, F.; Yu, H. Effect of Mo Concentration on the Microstructure Evolution and Properties of High Boron Cast Steel. Materials 2020, 13, 975. [Google Scholar] [CrossRef] [Green Version]
  13. Xu, D.; Xu, X.; Su, Z.; An, J.; Lu, Y. Mechanical properties, wear, and corrosion of boronized N80 tube steel. J. Mater. Sci. 2012, 48, 106–112. [Google Scholar] [CrossRef] [Green Version]
  14. Su, Z.; Tian, X.; An, J.; Lu, Y.; Yang, Y.; Sun, S. Investigation on Boronizing of N80 Tube Steel. ISIJ Int. 2009, 49, 1776–1783. [Google Scholar] [CrossRef]
  15. Selçuk, B.; Ipek, R.; Karamış, M. A study on friction and wear behaviour of carburized, carbonitrided and borided AISI 1020 and 5115 steels. J. Mater. Process. Technol. 2003, 141, 189–196. [Google Scholar] [CrossRef]
  16. Calik, A.; Duzgun, A.; Ekinci, A.; Karakas, S.; Ucar, N. Comparison of Hardness and Wear Behaviour οf Boronized and Carburized AISI 8620 Steels. Acta Phys. Pol. A. 2009, 116, 1029–1032. [Google Scholar] [CrossRef]
  17. Zong, X.; Jiang, W.; Fan, Z. Characteristics and wear performance of borided AISI 440C matensitic stainless steel. Mater. Express. 2018, 8, 500–510. [Google Scholar] [CrossRef]
  18. Kayali, Y.; Güneş, İ.; Ulu, S. Diffusion kinetics of borided AISI 52100 and AISI 440C steels. Vacuum 2012, 86, 1428–1434. [Google Scholar] [CrossRef]
  19. Ozbek, I. Mechanical Properties and Kinetics of Borided AISI M50 Bearing Steel. Arab. J. Sci. Eng. 2014, 39, 5185–5192. [Google Scholar] [CrossRef]
  20. Vera Cárdenas, E.; Lewis, R.; Martínez Pérez, A.; Bernal Ponce, J.; Pérez Pinal, F.; Domínguez, M.; Rivera Arreola, E. Characterization and wear performance of boride phases over tool steel substrates. Adv. Mater. Sci. Eng. 2016, 8, 168781401663025. [Google Scholar] [CrossRef] [Green Version]
  21. Campos-Silva, I.; Martínez-Trinidad, J.; Doñu-Ruíz, M.; Rodríguez-Castro, G.; Hernández-Sánchez, E.; Bravo-Bárcenas, O. Interfacial indentation test of FeB/Fe2B coatings. Surf. Coat. Technol. 2011, 206, 1809–1815. [Google Scholar] [CrossRef]
  22. Campos-Silva, I.; Bernabé-Molina, S.; Bravo-Bárcenas, D.; Martínez-Trinidad, J.; Rodríguez-Castro, G.; Meneses-Amador, A. Improving the Adhesion Resistance of the Boride Coatings to AISI 316L Steel Substrate by Diffusion Annealing. J. Mater. Eng. Perform. 2016, 25, 3852–3862. [Google Scholar] [CrossRef]
  23. Campos-Silva, I.; Palomar-Pardavé, M.; Pérez Pastén-Borja, R.; Kahvecioglu Feridun, O.; Bravo-Bárcenas, D.; López-García, C.; Reyes-Helguera, R. Tribocorrosion and cytotoxicity of FeB-Fe2B layers on AISI 316 L steel. Surf. Coat. Technol. 2018, 349, 986–997. [Google Scholar] [CrossRef]
  24. Rodríguez-Castro, G.; Campos-Silva, I.; Chávez-Gutiérrez, E.; Martínez-Trinidad, J.; Hernández-Sánchez, E.; Torres-Hernández, A. Mechanical properties of FeB and Fe2B layers estimated by Berkovich nanoindentation on tool borided steel. Surf. Coat. Technol. 2013, 215, 291–299. [Google Scholar] [CrossRef]
  25. Hernández-Sánchez, E.; Domínguez-Galicia, Y.; Orozco-Álvarez, C.; Carrera-Espinoza, R.; Herrera-Hernández, H.; Velázquez, J. A Study on the Effect of the Boron Potential on the Mechanical Properties of the Borided Layers Obtained by Boron Diffusion at the Surface of AISI 316L Steel. Adv. Mater. Sci. Eng. 2014, 2014, 1–9. [Google Scholar] [CrossRef] [Green Version]
  26. Campos-Silva, I.; Hernández-Sánchez, E.; Rodríguez-Castro, G.; Rodríguez-Pulido, A.; López-García, C.; Ortiz-Domínguez, M. Indentation size effect on the Fe2B/substrate interface. Surf. Coat. Technol. 2011, 206, 1816–1823. [Google Scholar] [CrossRef]
  27. Kulka, M.; Makuch, N.; Piasecki, A. Nanomechanical characterization and fracture toughness of FeB and Fe2B iron borides produced by gas boriding of Armco iron. Surf. Coat. Technol. 2017, 325, 515–532. [Google Scholar] [CrossRef]
  28. Campos-Silva, I.; Hernández-Sánchez, E.; Rodríguez-Castro, G.; Cimenoglu, H.; Nava-Sánchez, J.; Meneses-Amador, A.; Carrera-Espinoza, R. A study of indentation for mechanical characterization of the Fe2B layer. Surf. Coat. Technol. 2013, 232, 173–181. [Google Scholar] [CrossRef]
  29. Lentz, J.; Röttger, A.; Theisen, W. Hardness and modulus of Fe2B, Fe3(C, B), and Fe23(C, B)6 borides and carboborides in the Fe-C-B system. Mater. Charact. 2018, 135, 192–202. [Google Scholar] [CrossRef]
  30. Jian, Y.; Huang, Z.; Xing, J.; Zheng, B.; Sun, L.; Liu, Y.; Liu, Y. Effect of improving Fe2B toughness by chromium addition on the two-body abrasive wear behavior of Fe–3.0wt% B cast alloy. Tribol. Int. 2016, 101, 331–339. [Google Scholar] [CrossRef]
  31. Huang, Z.; Xing, J.; Guo, C. Improving fracture toughness and hardness of Fe2B in high boron white cast iron by chromium addition. Mater. Des. 2010, 31, 3084–3089. [Google Scholar] [CrossRef]
  32. Huang, Z.; Xing, J.; Lv, L. Effect of tungsten addition on the toughness and hardness of Fe2B in wear-resistant Fe–B–C cast alloy. Mater. Charact. 2013, 75, 63–68. [Google Scholar] [CrossRef]
  33. Huang, Z.; Xing, J.; Tao, X. Effect of molybdenum addition on fracture toughness and hardness of Fe2B in Fe–B–C cast alloy. Int. J. Mater. Res. 2012, 103, 1539–1543. [Google Scholar] [CrossRef]
  34. Jian, Y.; Huang, Z.; Xing, J.; Gao, Y. Effects of chromium on the morphology and mechanical properties of Fe2B intermetallic in Fe-3.0B alloy. J. Mater. Sci. 2018, 53, 5329–5338. [Google Scholar] [CrossRef]
  35. Wei, X.; Chen, Z.; Zhong, J.; Wang, L.; Yang, W.; Wang, Y. Effect of alloying elements on mechanical, electronic and magnetic properties of Fe2B by first-principles investigations. Comput. Mater. Sci. 2018, 147, 322–330. [Google Scholar] [CrossRef]
  36. Akopov, G.; Pangilinan, L.; Mohammadi, R.; Kaner, R. Perspective: Superhard metal borides: A look forward. APL Mater. 2018, 6, 070901. [Google Scholar] [CrossRef]
  37. Mohammadi, R.; Xie, M.; Lech, A.; Turner, C.; Kavner, A.; Tolbert, S.; Kaner, R. Toward Inexpensive Superhard Materials: Tungsten Tetraboride-Based Solid Solutions. J. Am. Chem. Soc. 2012, 134, 20660–20668. [Google Scholar] [CrossRef] [PubMed]
  38. Homolová, V.; Čiripová, L. Experimental Investigation of Isothermal Section of the B-Cr-Fe Phase Diagram at 1353 K. Adv. Mater. Sci. Eng. 2017, 2017, 1–7. [Google Scholar] [CrossRef] [Green Version]
  39. Repovský, P.; Homolová, V.; Čiripová, L.; Kroupa, A.; Zemanová, A. Experimental study and thermodynamic modelling of the B-Fe-Mn ternary system. Calphad 2016, 55, 252–259. [Google Scholar] [CrossRef]
  40. Homolová, V.; Kroupa, A.; Výrostková, A. Calculation of Fe–B–V ternary phase diagram. J. Alloys Compd. 2012, 520, 30–35. [Google Scholar] [CrossRef]
  41. Homolová, V.; Repovský, P.; Výrostková, A.; Kroupa, A. Experimental and Theoretical Determination of Phase Fraction in the Fe-B-V Alloys. J. Phase Equilib. Diffus. 2014, 35, 172–177. [Google Scholar] [CrossRef]
  42. Homolová, V.; Kepič, J.; Zemanová, A.; Zobač, O. Experimental Study of Phase Composition of B-Fe-Mn-V Alloys and Thermodynamic Calculations of Phase Equilibria in the B-Mn-V and B-Fe-Mn-V Systems. Adv. Mater. Sci. Eng. 2018, 2018, 1–10. [Google Scholar] [CrossRef] [Green Version]
  43. Homolová, V.; Čiripová, L.; Výrostková, A. Experimental Study of Phase Composition of Fe-(30-60) B-C Alloys and Boron-Rich Corner of Fe-B-C Phase Diagram. J. Phase. Equilibria. Diffus. 2015, 36, 599–605. [Google Scholar] [CrossRef]
  44. Homolová, V.; Čiripová, L.; Kepič, J. Isothermal Section of the B-Cr-Fe System at 873 K. J. Phase. Equilibria. Diffus. 2019, 40, 79–85. [Google Scholar] [CrossRef]
  45. Kirkovska, I.; Homolová, V. Experimental investigation of phase equilibrai in Fe-W-B alloys. In Proceedings of the Metalurgia Junior 2019, Herľany, Slovakia, 11–12 June 2019; Heželová, M., Pikna, L., Eds.; Technical University of Košice: Košice, Slovakia, 2019. [Google Scholar]
  46. Kirkovska, I.; Homolová, V.; Čiripová, L. Experimental study of the relationship between hardness and phase volume fraction in Fe–W–B alloys. In Proceedings of the Metalurgia Junior 2020, Košice, Slovakia, 25 May 2020; Heželová, M., Pikna, L., Eds.; Technical University of Košice: Košice, Slovakia, 2020. [Google Scholar]
  47. Schindelin, J.; Arganda-Carreras, I.; Frise, E.; Kaynig, V.; Longair, M.; Pietzsch, T.; Preibisch, S.; Rueden, C.; Saalfeld, S.; Schmid, B.; et al. Fiji: An open-source platform for biological-image analysis. Natu. Met. 2012, 9, 676–682. [Google Scholar] [CrossRef] [PubMed] [Green Version]
  48. Rogl, P. Boron–Iron–Tungsten. In Ternary Alloy Systems Phase Diagrams, Crystallographic and Thermodynamic Data, Iron Systems, Part 1; Effenberg, G., Ilyenko, S., Eds.; Springer: Heidelberg, Germany, 2008; Volume 11D1, pp. 455–463. [Google Scholar]
  49. Kirkovska, I.; Homolová, V.; Čiripová, L.; Petryshynets, I. Nanomechanical Characterization of Iron Borides in Fe–Mn–B Ternary Alloys. Met. Fractography 2019. submitted. [Google Scholar]
  50. Wei, X.; Chen, Z.; Zhong, J.; Wang, L.; Wang, Y.; Shu, Z. First-principles investigation of Cr-doped Fe2B: Structural, mechanical, electronic and magnetic properties. J. Magn. Magn. Mater. 2018, 456, 150–159. [Google Scholar] [CrossRef]
  51. Jian, Y.; Huang, Z.; Xing, J.; Guo, X.; Wang, Y.; Lv, Z. Effects of Mn addition on the two-body abrasive wear behavior of Fe-3.0 wt% B alloy. Tribol. Int. 2016, 103, 243–251. [Google Scholar] [CrossRef]
  52. Lentz, J.; Röttger, A.; Großwendt, F.; Theisen, W. Enhancement of hardness, modulus and fracture toughness of the tetragonal (Fe, Cr)2B and orthorhombic (Cr, Fe)2B phases with addition of Cr. Mater. Des. 2018, 156, 113–124. [Google Scholar] [CrossRef]
  53. Li, K.; Huang, Z.; Zhang, L.; Wang, Y.; Shen, Y.; He, L.; Zheng, Q.; Li, H. Influence of Cr addition on tribological properties of bulk Fe2B under dry friction and water lubrication. Mater. Res. Express. 2018, 5, 076506. [Google Scholar] [CrossRef]
  54. Ma, R.; Fan, Y.; Cao, X.; Wen, M. Influence of Micro-Addition Chromium on the Valence Electron Structure and Toughness of Fe2B Phase. Appl. Mech. Mater. 2010, 34–35, 1135–1139. [Google Scholar] [CrossRef]
  55. Jhi, S.; Ihm, J.; Louie, S.; Cohen, M. Electronic mechanism of hardness enhancement in transition-metal carbonitrides. Nature. 1999, 399, 132–134. [Google Scholar] [CrossRef]
  56. Yang, Q.; Lengauer, W.; Koch, T.; Scheerer, M.; Smid, I. Hardness and elastic properties of Ti(CxN1-x), Zr(CxN1-x) and Hf(CxN1-x). J. Alloys Compd. 2000, 309, L5. [Google Scholar] [CrossRef]
  57. Balasubramanian, K.; Khare, S.; Gall, D. Valence electron concentration as an indicator for mechanical properties in rocksalt structure nitrides, carbides and carbonitrides. Acta Mater. 2018, 152, 175–185. [Google Scholar] [CrossRef] [Green Version]
  58. Ge, H.; Tian, F. A Review of Ab Initio Calculation on Lattice Distortion in High-Entropy Alloys. JOM 2019, 71, 4225–4237. [Google Scholar] [CrossRef]
  59. Gou, Y.; Fu, Z.; Liang, Y.; Zhong, Z.; Wang, S. Electronic structures and mechanical properties of iron borides from first principles. Solid State Commun. 2014, 187, 28–32. [Google Scholar] [CrossRef]
  60. Pharr, G.; Herbert, E.; Gao, Y. The Indentation Size Effect: A Critical Examination of Experimental Observations and Mechanistic Interpretations. Annu. Rev. Mater. Res. 2010, 40, 271–292. [Google Scholar] [CrossRef]
  61. Nix, W.; Gao, H. Indentation size effects in crystalline materials: A law for strain gradient plasticity. J. Mechan. Phys. Sol. 1998, 46, 411–425. [Google Scholar] [CrossRef]
  62. Elmustafa, A.; Stone, D. Indentation size effect in polycrystalline F.C.C. metals. Acta Mater. 2002, 50, 3641–3650. [Google Scholar] [CrossRef]
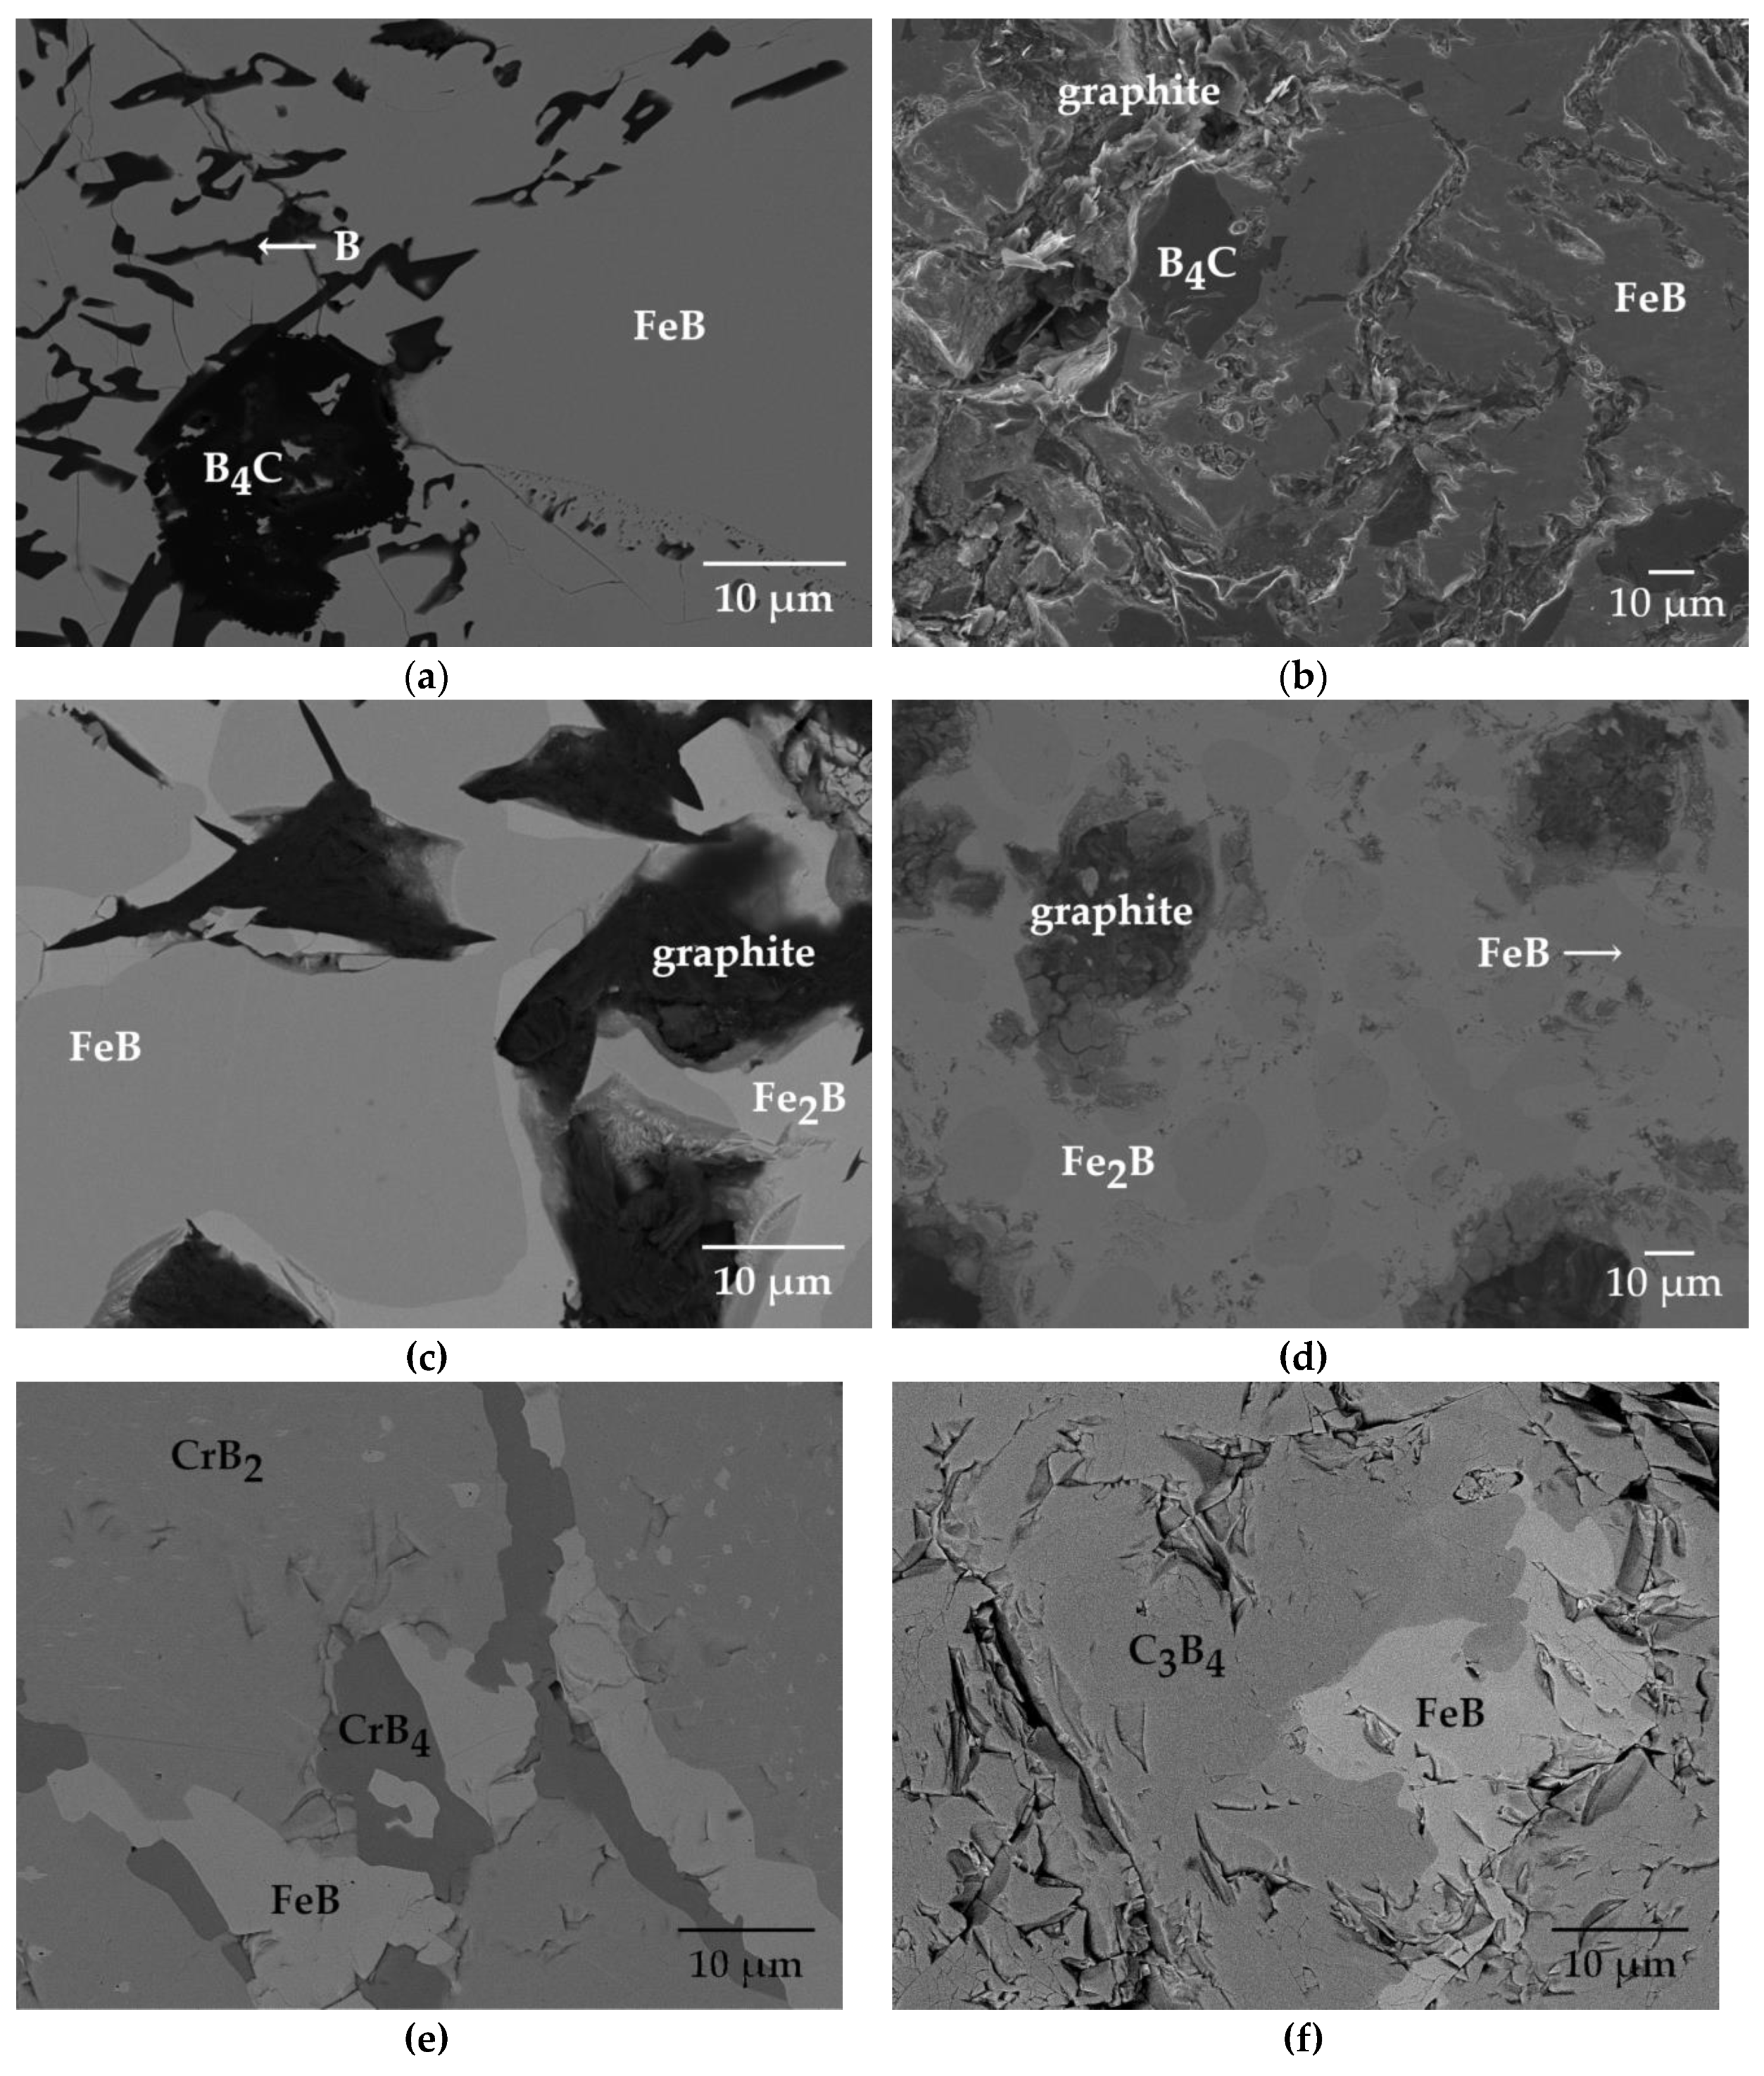
Figure 1. Alloys’ micrographs (a) 38.5 Fe–59.22 B–2.3 C; (b) 34.6 Fe–52 B–13.4 C; (c) 37 Fe–34 B–29 C; (d) 39.7 Fe–33 B–27.3 C; (e) 17 Fe–65 B–18 Cr; (f) 8 Fe–56 B–36 Cr; (g) 50 Fe–40 B–10 Cr; (h) 82 Fe–9 B–9 Mn; (i) 22 Fe–39 B–39 Mn (alloy 9); (j) 22 Fe–39 B–39 Mn (alloy 10); (k) 51 Fe–39 B–10 Mn (alloy 11); (l) 51 Fe–39 B–10 Mn (alloy 12); (m) 50 Fe–41 B–9 V (alloy 13); (n) 50 Fe–41 B–9 V (alloy 14); (o) 51 Fe–42 B–7 W (alloy 15); (p) 51 Fe–42 B–7 W (alloy 16); (q) 45 Fe–40 B–5 Mn–10 V.
Materials 13 04155 g001aMaterials 13 04155 g001bMaterials 13 04155 g001c
Figure 2. Diffraction pattern of 51 Fe–42 B–7 W (alloy 16) with identified binary FeB and Fe2B phases.
Materials 13 04155 g002
Figure 3. Segmented image of the microstructure of alloy 45 Fe–40 B–5 Mn–10 V (alloy 17).
Materials 13 04155 g003
Figure 4. Load vs. depth curves (a) FeB phase in alloy 38.5 Fe–59.2 B–2.3 C; (b) Fe2B phase in 50 Fe–41 B–9 V (alloy 14).
Materials 13 04155 g004
Figure 5. (a) Indentation hardness of FeB phase as a function of amount of C dissolved, for Fe-B-C alloys at 1173 K. (b) Indentation hardness of FeB phase as a function of amount of Cr dissolved, for Fe-B-Cr alloys at 1353 K. (c) Indentation hardness of FeB phase as a function of amount of Mn dissolved, for Fe-B-Mn alloys at 1223 K. (d) Indentation hardness of FeB phase as a function of amount of Mn dissolved in this boride in Fe-B-Mn alloys at 873 K.
Materials 13 04155 g005aMaterials 13 04155 g005b
Figure 6. (a) Indentation hardness of Fe2B phase as a function of the amount of Mn dissolved for Fe-B-Mn alloys at 873 K. (b) Indentation hardness of Fe2B phase as a function of the amount of Mn dissolved for Fe-B-Mn alloys at 1223 K.
Materials 13 04155 g006
Figure 7. Amount of alloying (at.%) vs. indentation hardness (HIT) (GPa).
Materials 13 04155 g007
Figure 8. Valence electron concentration vs. indentation hardness (HIT) map for FeB and Fe2B borides.
Materials 13 04155 g008
Figure 9. Indentation hardness vs. depth (a) FeB in 50 Fe–40 B–10 Cr, (b) MB in 51 Fe–39 B–10 Mn, (c) Fe2B in 39.7 Fe–33 B–27.3 C, (d) Fe2B in 45 Fe–40 B–5 Mn–10 V.
Materials 13 04155 g009
Figure 10. Indentation modulus vs. depth (a) FeB in 39.7 Fe–33 B–27.3 C, (b) MB in 51 Fe–39 B–10 Mn, (c) Fe2B in 50 Fe–40 B–10 Cr, (d) Fe2B in 50 Fe–41 B–9 V (alloy 14).
Materials 13 04155 g010
Figure 11. (a) Indentation hardness, HIT, as average values in indentation depth intervals of h = 100–200, 200–300, 300–400, 400–500, and true hardness H0. (b) Indentation modulus, EIT, as average values in indentation depth intervals of h = 100–200, 200–300, 300–400, 400–500.
Materials 13 04155 g011
Figure 12. Steps and slip lines near indent in the FeB phase in the microstructure of alloy 50 Fe–40 B–10 Cr.
Materials 13 04155 g012
Figure 13. HIT2 vs. h−1 plot: (a) FeB in 39.7 Fe–33 B–27.3 C, and (b) Fe2B in 50 Fe–41 B–9 V (alloy 14).
Materials 13 04155 g013
Table 1. Alloys’ chemical composition, annealing conditions, identified phases, and borides chemical composition.
AlloyAlloy
Composition
(at.%)
Annealing Conditions
T (K)/time (h)
Phase CompositionFe2B (M2B) Chemical Composition
(at.%)
FeB (MB) Chemical Composition
(at.%)
138.5 Fe–59.2 B–2.3 C1173/1000FeB + B4C + B-48.96 Fe, 50 B, 1.04 C
234.6 Fe–52 B–13.4 C1173/1000FeB + B4C + graphite-47.3 Fe, 50 B, 2.7 C
337 Fe–34 B–29 C873/1000Fe2B + FeB + graphite30.01 Fe, 66.67B, 3.32C47.92 Fe, 50 B, 2.08 C
439.7 Fe–33 B–27.3 C1173/1000Fe2B + FeB + graphite31.06 Fe, 66.67B, 2.27C47.31 Fe, 50 B, 2.69 C
517 Fe–65 B–18 Cr1353/1848FeB + CrB4 + CrB2-39 Fe, 50 B, 11 Cr
68 Fe–56 B–36 Cr873/2300FeB + Cr3B4-37 Fe, 51 B, 12 Cr
750 Fe–40 B–10 Cr1353/1848Fe2B + FeB59 Fe, 33 B, 8 Cr35 Fe, 49 B, 16 Cr
882 Fe–9 B–9 Mn1223/1440Fe2B + γFe56 Fe, 33 B, 11 Mn-
922 Fe–39 B–39 Mn873/2160M2B + MB28 Fe, 30 B, 42 Mn19 Fe, 51 B, 30 Mn
1022 Fe–39 B–39 Mn1223/1440M2B + MB27 Fe, 30 B, 43 Mn15 Fe, 50 B, 35 Mn
1151 Fe–39 B–10 Mn873/2160M2B + MB57 Fe, 33 B, 10 Mn41 Fe, 50 B, 9 Mn
1251 Fe–39 B–10 Mn1223/1440M2B +MB58 Fe, 33 B, 9 Mn40 Fe, 50 B, 10 Mn
1350 Fe–41 B–9 V1353/1440Fe2B + V3B464 Fe, 34 B, 2 V-
1450 Fe–41 B–9 V903/4560Fe2B + FeB + V3B466 Fe, 31 B, 3 V39.2 Fe, 51 B, 9.8 V
1551 Fe–42 B–7 W1323/2000Fe2B + FeB + W2FeB267 Fe, 32.4 B, 0.6 W41 Fe, 50 B, 1 W
1651 Fe–42 B–7 W950/4224Fe2B + FeB + W2FeB268.89 Fe, 28.81 B, 2.3 W47.86 Fe, 49.54 B, 2.6 W
1745 Fe–40 B–5 Mn–10 V900/2040M2B + MB + V3B458 Fe, 34 B, 5 Mn, 3 V36 Fe, 50 B, 5 Mn, 9 V
(-) the phase is not present in the alloy.
Table 2. The phase fraction of the alloys.
AlloyPhase Fraction (vol. %)
1FeB: 77.28, B4C: 11.44, B: 11.28 **
2FeB: 54.25, B4C: 6.32, graphite: 39.43 **
3Fe2B: 20,02, FeB: 52,09, graphite: 27,89 **
4Fe2B: 48.64, FeB: 23.42, graphite: 27.94 **
5FeB: 58.20, CrB4: 21.56, CrB2: 20.24 **
6FeB: 2.87, Cr3B4: 97.13 **
7Fe2B: 71.35, FeB: 28.65 **
8Fe2B: 27, γ-Fe:73 *
9M2B: 66, MB: 34 *
10M2B: 67, MB: 33 *
11M2B: 68.6, MB: 31.4 *
12M2B: 68.3, MB: 31.7 *
13Fe2B: 76.7, V3B4: 23.3 *
14Fe2B: 63.8, FeB: 21.6, V3B4: 14.6 *
15Fe2B: 25.65, FeB: 48.58, W2FeB2: 25.77 **
16Fe2B: 37.78, FeB: 44.85, W2FeB2: 17.37 **
17M2B: 60.02, MB: 21.64, V3B4: 18.34 **
(*) calculated using the lever rule, (**) determined using image analysis
Table 3. Indentation hardness (HIT) and indentation modulus (EIT) in GPa for FeB and Fe2B phase
AlloyAlloy’s Chemical CompositionHIT FeB EIT FeB HIT Fe2B EIT Fe2B
138.5 Fe–59.2 B–2.3 C20.5 ± 1.0370.3 ± 20.6--
234.6 Fe–52 B–13.4 C22.3 ± 1.3358.5 ± 30.0--
337 Fe–34 B–29 C20.4 ± 0.5315.6 ± 32.819.4 ± 0.7315.7 ± 21.7
439.7 Fe–33 B–27.3 C20.6 ± 0.8375.8 ± 22.220.3 ± 0.6350.4 ± 14.3
517 Fe–65 B–18 Cr26.9 ± 1.4485.5 ± 22.3--
68 Fe–56 B–36 Cr26.4 ± 1.9410.1 ± 27.3--
750 Fe–40 B–10 Cr24.5 ± 0.7437.4 ± 17.118.3 ± 0.7391.7 ± 10.9
882 Fe–9 B–9 Mn--16.1 ± 2.2297.5 ± 24.6
922 Fe–39 B–39 Mn21.4 ± 2.0374.3 ± 36.619.5 ± 0.9354.4 ± 11.2
1022 Fe–39 B–39 Mn18.6 ± 0.6375.0 ± 11.217.9 ± 1.2315.1 ± 35.9
1151 Fe–39 B–10 Mn22.2 ± 0.7385.5 ± 25.419.0 ± 0.5375.2 ± 8.8
1251 Fe–39 B–10 Mn21.6 ± 1.2400.5 ± 15.018.7 ± 0.7367.9 ± 8.9
1350 Fe–41 B–9 V--19.2 ± 0.6354.5 ± 9.5
1450 Fe–41 B–9 V--19.0 ± 0.6364.1 ± 8.0
1551 Fe–42 B–7 W--20.8 ± 0.9383.1 ± 8.7
1651 Fe–42 B–7 W--20.7 ± 1.3377.8 ± 8.7
1745 Fe–40 B–5 Mn–10 V--18.1 ± 1.2367.4 ± 18.7
(-) phase is not present or not measured due to small diameter.
Table 4. Real hardness, H0 (GPa), for Fe2B and FeB phases.
AlloyChemical CompositionH0-Fe2B (M2B)H0-FeB (MB)
439.7 Fe–33 B–27.3 C20.1919.70
750 Fe–40 B–10 Cr19.9826.31
1151 Fe–39 B–10 Mn19.5421.67
1450 Fe–41 B–9 V20.26-
1745 Fe–40 B–5 Mn–10 V19.54-