Article

Antiferromagnetic Ordering and Transport Anomalies in Single-Crystalline CeAgAs2

1
Institute of Low Temperature and Structure Research, Polish Academy of Sciences, 50-950 Wrocław, Poland
2
Max-Planck-Institut für Chemische Physik Fester Stoffe, 01187 Dresden, Germany
*
Author to whom correspondence should be addressed.
Materials 2020, 13(17), 3865; https://doi.org/10.3390/ma13173865
Submission received: 30 July 2020 / Revised: 21 August 2020 / Accepted: 24 August 2020 / Published: 1 September 2020
(This article belongs to the Special Issue Magnetic Materials and Applications)

Abstract

:
Single crystals of the ternary cerium arsenide CeAgAs2 were grown by chemical vapor transport. They were studied by means of x-ray diffraction, magnetization, heat capacity and electrical transport measurements. The experimental research was supplemented with electronic band structure calculations. The compound was confirmed to order antiferromagnetically at the Néel temperature of 4.9 K and to undergo metamagnetic transition in a field of 0.5 T at 1.72 K. The electrical resistivity shows distinct increase at low temperatures, which origin is discussed in terms of pseudo-gap formation in the density of states at the Fermi level and quantum corrections to the resistivity in the presence of atom disorder due to crystal structure imperfections.

1. Introduction

Most of compounds with composition CeTX2, where T is a transition metal and X stands for a pnictogen, crystallize with the tetragonal HfCuSi2-type structure (space group P 4 /nmm) or its derivatives. They were reported to show large variety of physical behaviors, e.g., field-induced quantum criticality in CeAuSb2 [1], strongly anomalous low-temperature characteristics in CeCuAs2 [2], or different types of magnetic ordering [3,4,5,6].
The formation of CeAgAs2 was first established by Demchyna et al. [7] and later confirmed by Eschen and Jeitschko [8]. Initially, the compound was reported to adopt the tetragonal HfCuSi2-type unit cell [8], yet more advanced investigations of single crystals of CeAgAs2 revealed that actually it has an orthorhombic unit cell, which can be described as a slightly distorted derivative of the HfCuSi2 structure (s.g. Pmca) [9]. A characteristic feature of this structure is the presence of cis-trans chains of As atoms, which brings about breaking of the tetragonal symmetry and thus orthorhombic deformation. As the symmetry reduction occurs just because of a small shift of one half of the As atoms [9,10,11], the tetragonal symmetry is widely preserved and the compound shows hardly any anisotropy in properties within the ab plane [11,12].
In the first report on the magnetic properties of CeAgAs2, the compound was characterized as an antiferromagnet (AFM) with the Néel temperature T N of 5.5 K, and a metamagnetic (MM) transition in a field of 0.46 T at the temperature T = 1.8 K [9]. Subsequent investigations, performed on powder samples, showed that CeAgAs2 undergoes two AFM-like transitions at T N 1 = 6 K and T N 2 = 4.8 K [6]. The neutron diffraction experiments confirmed the AFM ordering below T N = 6 K and the MM transition in a field of μ 0 H = 0.3 T in the temperatures between 4 and 6 K [11]. The Ce magnetic moments, being confined to the ab plane of the orthorhombic unit cell, were found to be coupled ferromagnetically in that plane, and antiferromagnetically along the c axis [11]. The staggered magnetic moment was established to be 1 μ B [11]. The most recent paper by Mondal et al. on the bulk physical properties of single-crystalline CeAgAs2 re-established the existence of double magnetic transition at low temperatures, namely at 6 and 4.9 K, and highlighted the role of both crystalline electric field (CEF) interactions and Kondo effect in governing the low-temperature magnetic and transport characteristics of the compound [12].
Here, we report on investigations of high quality single crystals of CeAgAs2, done in parallel and fully independent of Mondal et al. Remarkably, our results somewhat differ from those reported by the latter authors, and hence may challenge the hitherto understanding of the actual nature of the electronic ground state in CeAgAs2.

2. Results

2.1. Crystal Structure

The details on the refinement and the crystallographic information are given in Table 1, Table 2 and Table 3. Most importantly, the orthorhombic distortion reported in Ref. [9] was confirmed by the difference in the lattice parameters and by different extinction conditions in the 0 k l and h k 0 zones. Furthermore, in line with the findings communicated in Refs. [9,10], the intensities of the single crystal diffraction data of the investigated crystal were calculated as a sum of two diffraction domains related by the twin matrix (001;0–10;100), i.e., the [010] direction of the diffraction domains is preserved, while the [100] and [001] directions are interchanged due to pseudo-tetragonal unit cell. For that reason, the physical properties measurements were performed parallel and perpendicular to [010] direction.
The EDX measurements indicated that the prepared crystal was homogeneous and single phase. The EDX analysis yielded the composition Ce – 24.6(4) at.%, Ag – 25.0(3) at.%, As – 50.4(2) at.%, that corresponds well to the nominal one.

2.2. Magnetic Properties

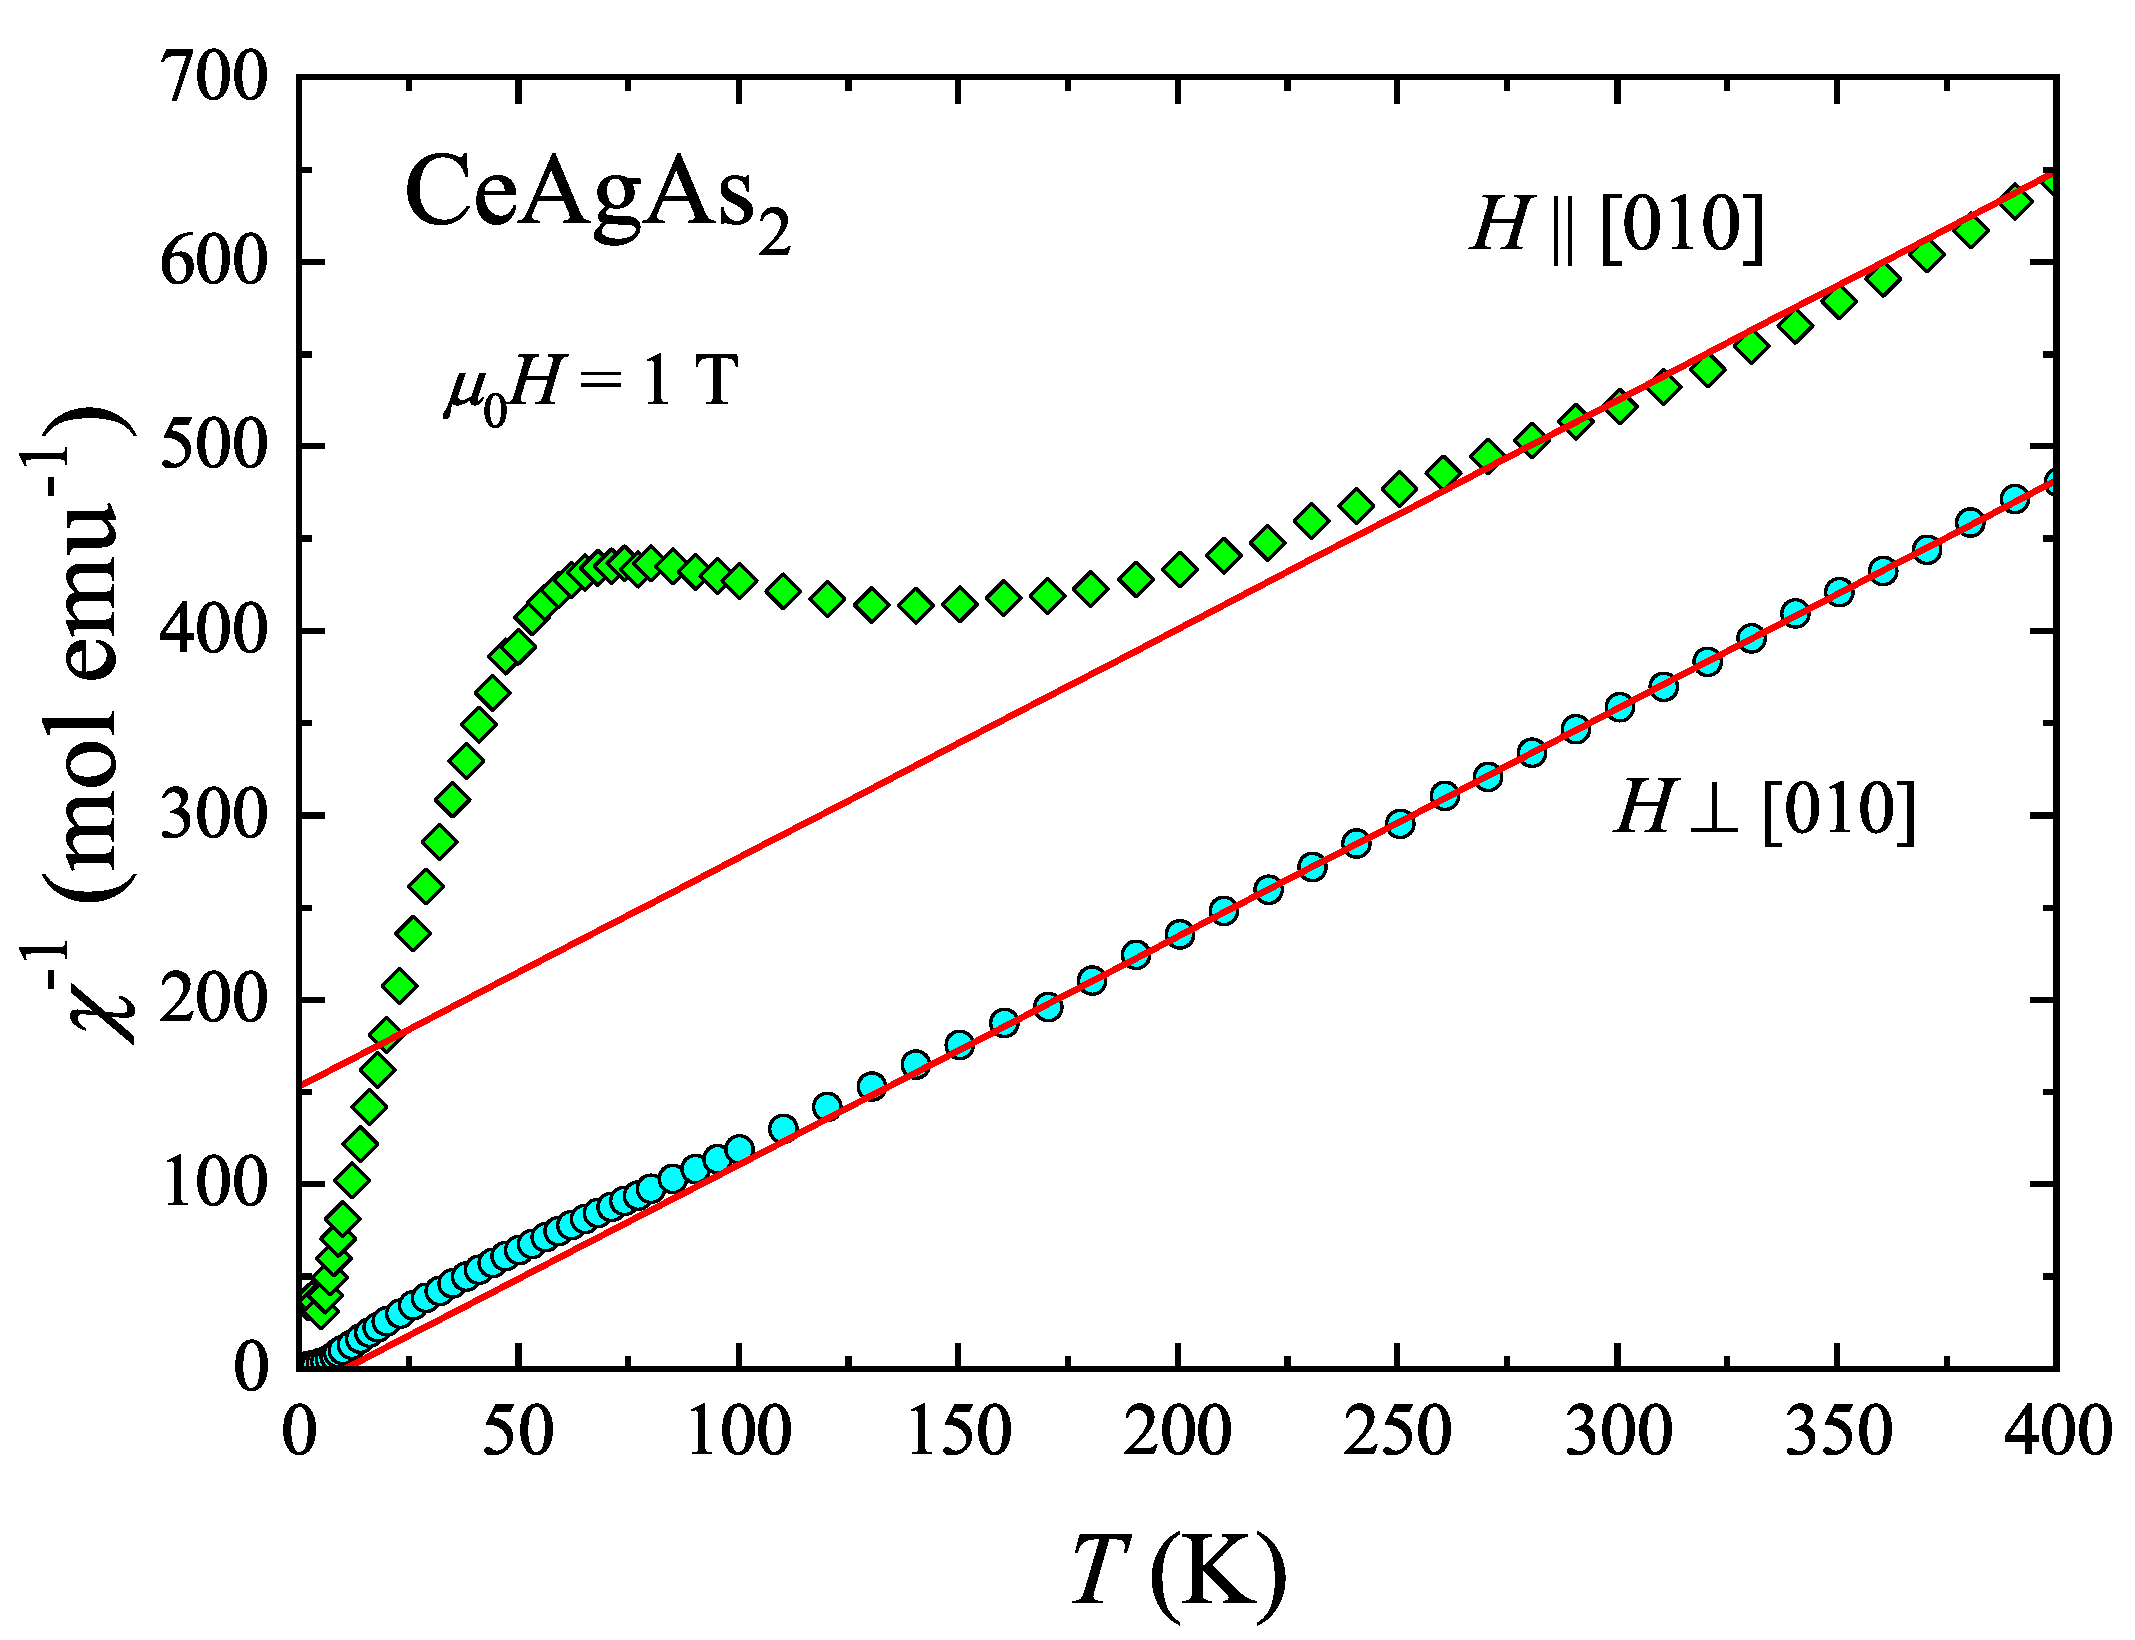
Figure 1 presents the temperature dependencies of the reciprocal molar magnetic susceptibility of CeAgAs2, χ and χ , measured parallel and perpendicular to [010] direction, respectively. The compound exhibits large magnetocrystalline anisotropy and the χ 1 ( T ) variation shows a wide maximum at about 70 K. At high temperatures (above 50 K and 250 K for susceptibility variation taken with H c and H c , respectively), both curves follow Curie–Weiss (C-W) law in the form χ = C T θ P . The least-square fitting parameters of this formula to the experimental data obtained with H c are μ eff = 8 C = 2.54 μ B and θ P = 10 K . The magnetic effective moment μ eff is the same as that predicted within Russel–Saunders coupling scenario for a free trivalent Ce ion (2.54 μ B ). In turn, the positive sign of the paramagnetic Curie temperature θ P hints at importance of ferromagnetic interactions, as inferred from neutron diffraction data [11]. Due to rather narrow range of straight-linear variation of χ ( T ) , the effective magnetic moment was assumed to be the same as for H c , while fitting the C-W dependence. The obtained value of θ P is equal to −123 K. The large difference between θ P estimated for the two main crystallographic directions is a measure of strong magnetocrystalline anisotropy. The large absolute value of θ P likely results from CEF splitting of the J = 5 / 2 multiplet into three Kramer’s doublets.
The low-temperature variations of the magnetic susceptibility of CeAgAs2 measured in a few different magnetic fields oriented within the (010) plane and in a field of 0.1 T applied along [010] are presented in Figure 2. The susceptibility shows large magnetic anisotropy with the component taken along [010] being much smaller than that taken within the (010) plane. This result is consistent with the neutron diffraction experiment, that revealed that the magnetic moments in CeAgAs2 are confined to the (010) plane [11]. The χ ( T ) variations measured in weak fields exhibit distinct maxima, which signal the onset of long-range AFM ordering. The transition temperature defined as an inflection point on the χ T ( T ) variation taken at 0.01 T (Ref. [13]) amounts to 4.9 K. This value is somewhat smaller than those reported in Refs. [9,11] but the same as that of the lower-temperature transition in Refs. [6,12]. In contrast to the behavior of χ ( T ) , no maximum is seen in the χ ( T ) variation (some little effect can be attributed to small misalignment of the specimen), and in this case the susceptibility shows below T N a plateau characteristic for antiferromagnets probed perpendicular to the direction of magnetic moments.
With increasing the magnetic field strength, the maximum in χ ( T ) shifts towards lower temperatures, as may be expected for antiferromagnets. In fields stronger than 0.5 T, the maximum is no longer discernible suggesting the occurrence of the field-induced MM transition.
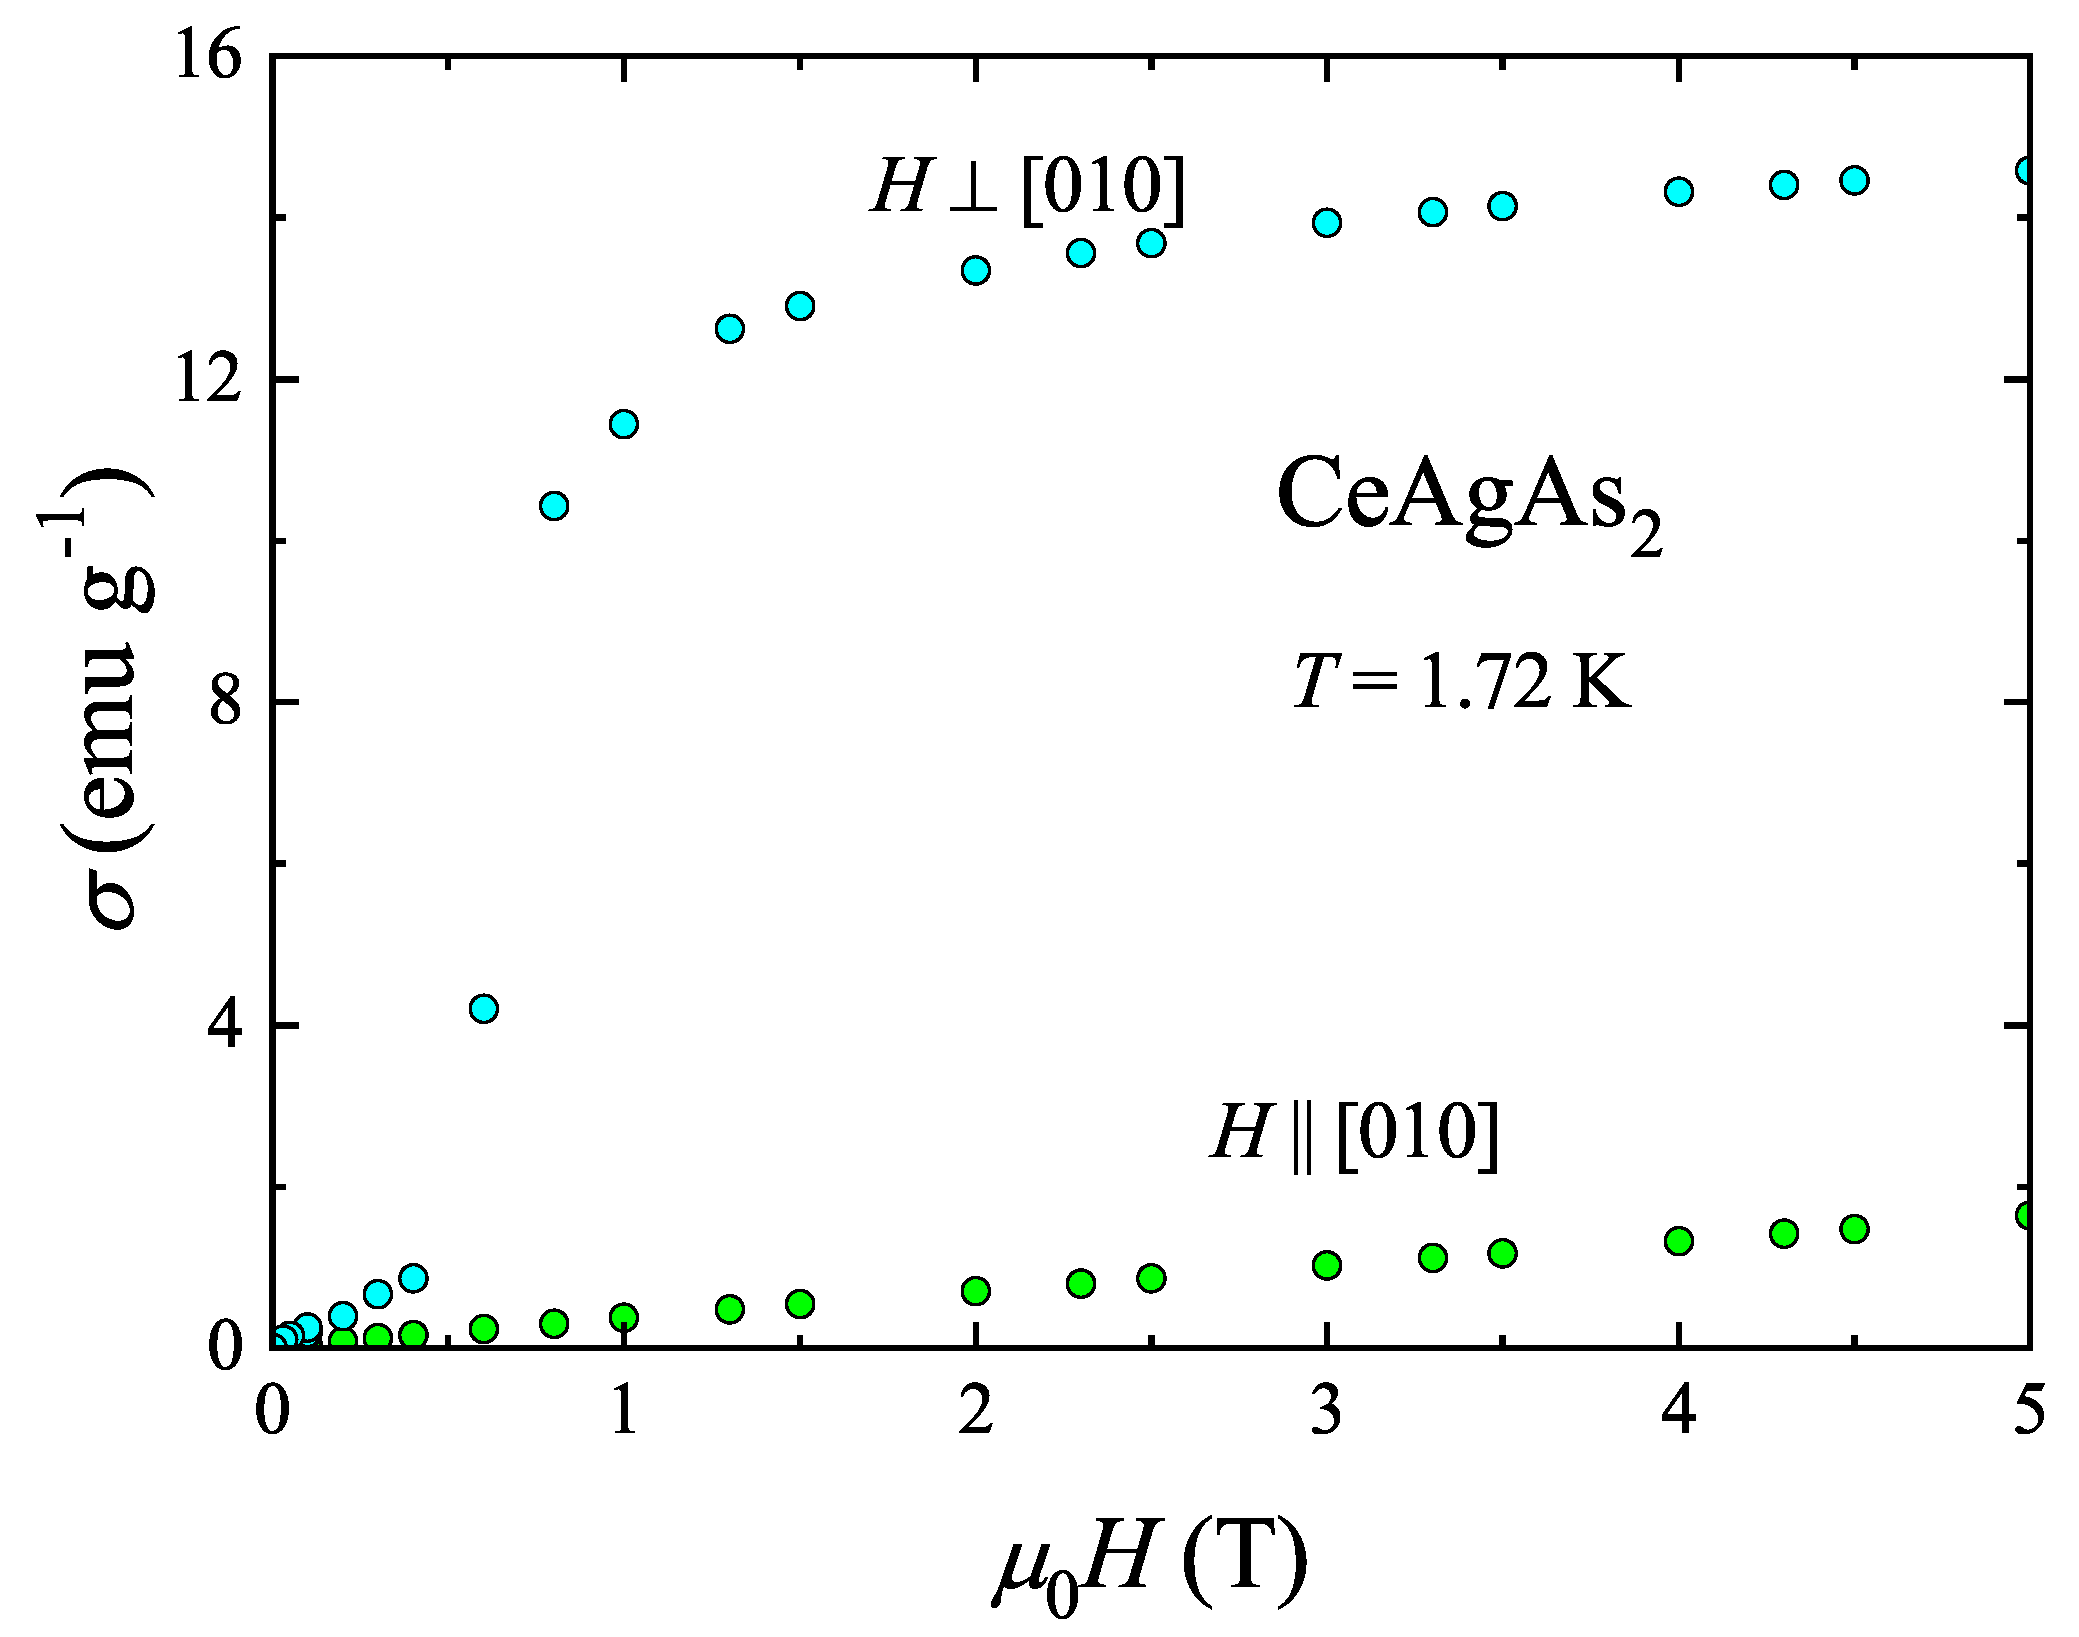
The MM character of CeAgAs2 is corroborated by inspecting the field dependencies of the magnetization measured in the ordered state. The isotherms taken at 1.72 K are presented in Figure 3. The variation measured along [010], being clearly the hard magnetic direction, is linear up to a limiting field of 5 T. In contrast, the magnetization measured with the magnetic field applied perpendicular to [010] shows a rapid increase near 0.5 T, and then tends towards saturation in stronger fields. The magnetic moment measured at 5 T has a value of 1 μ B , in perfect agreement with the neutron diffraction data [11].

2.3. Heat Capacity

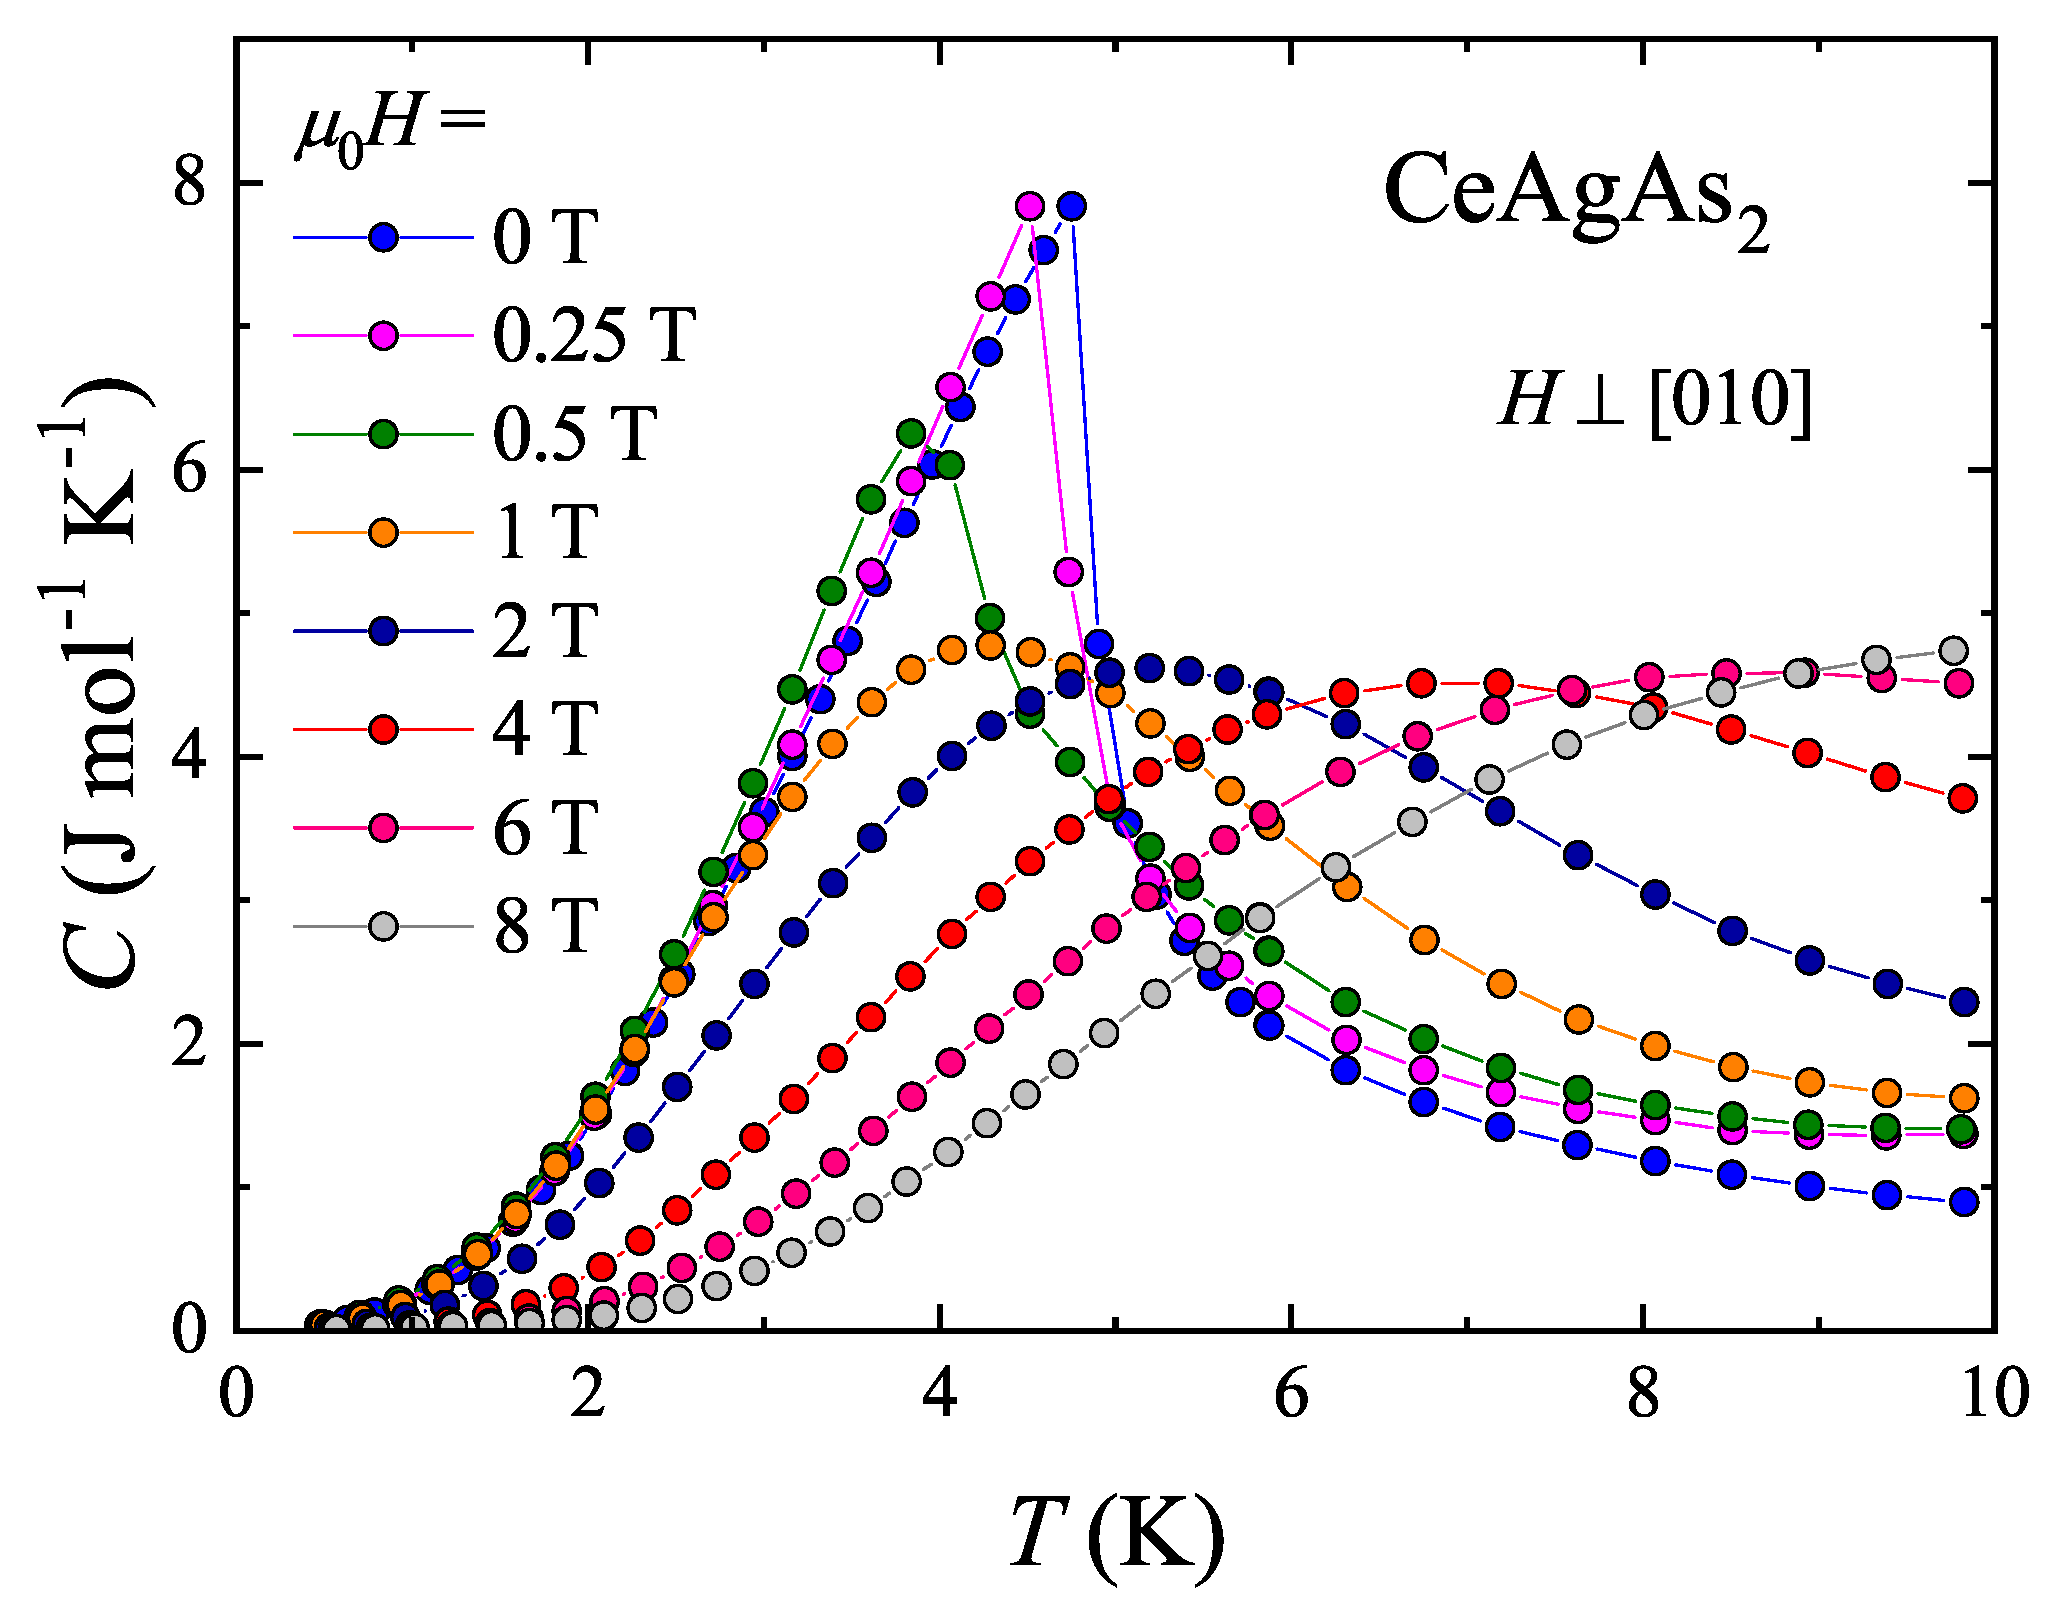
The low-temperature dependencies of the specific heat of CeAgAs2 measured in various external magnetic fields applied within the (010) plane are shown in Figure 4. In zero field C ( T ) exhibits a pronounced λ -like anomaly at the Néel temperature T N = 4.9 K, in concert with the magnetic data. Upon gradual increasing the magnetic field strength, this anomaly initially shifts towards lower temperatures, as expected for antiferromagnets, and in fields stronger than 0.5 T, the maximum in C ( T ) broadens and moves towards higher temperatures, in a ferromagnetic-like manner. The observed behavior corroborates the MM-like phase transition anticipated from the magnetization data.
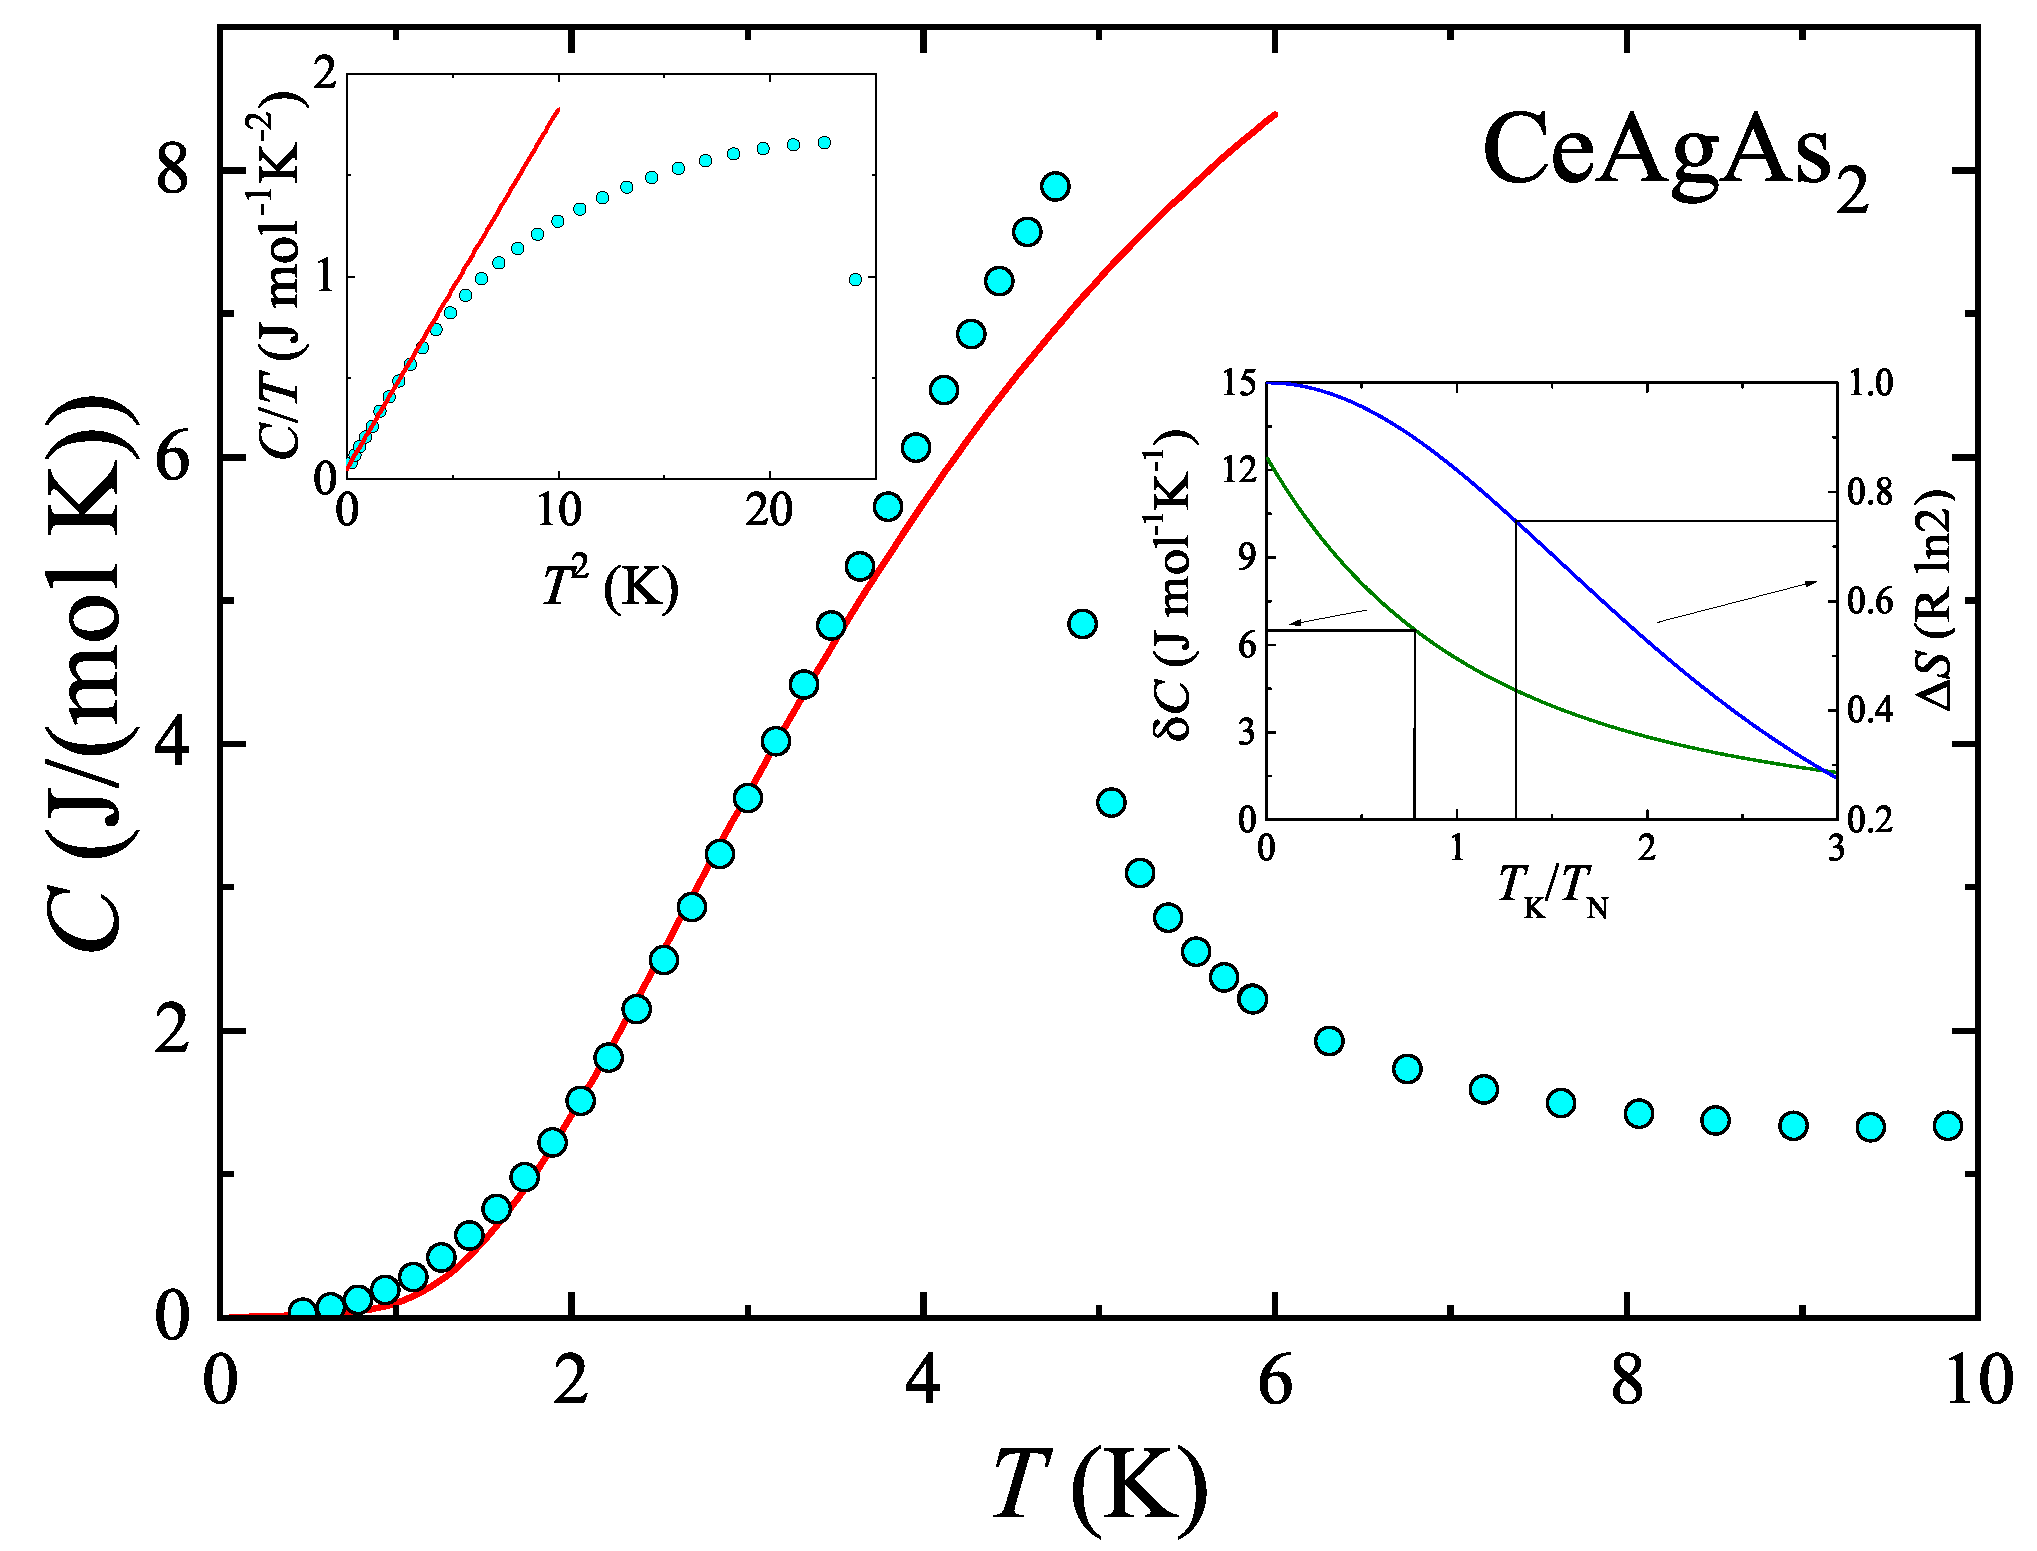
Figure 5 presents the zero-field dependence of the specific heat of CeAgAs2. As can be inferred from the figure, below T N , the C ( T ) variation can be well described by the equation [14,15]
C mag = γ 4 f T + a T 0.5 exp Δ T ,
where the first term accounts for the electronic contribution and the second one is appropriate for excitations of AFM spin waves above a gap Δ in the magnon spectrum (phonon contribution was considered to be negligible at such low temperatures). The electronic part of the specific heat was estimated by linear fit of the C / T vs T 2 variation at lowest temperatures (see the inset to Figure 5) as γ 4 f = 50 mJ mol 1 K 2 . The least-square fit of Equation (1) to the experimental data with fixed γ 4 f value yielded the parameters: a = 64.7 J mol 1 K 0.5 and Δ = 7.1 K . The moderately enhanced value of γ 4 f , being close to that given in Ref. [12], manifests the importance of strong electronic correlations in the compound studied. Remarkably, the energy gap Δ has magnitude similar to the Néel temperature of CeAgAs2.
In AFM Kondo lattices, specific heat jump due to magnetic ordering δ C is reduced compared to the value predicted within the mean-field approximation. In the framework of the S = 1 / 2 resonant model, δ C is related to the characteristic Kondo temperature T K via the formula [16,17,18]
δ C = 6 k B ψ 1 2 + ζ ψ 1 2 + ζ + ζ ψ 1 2 + ζ 2 ,
where ζ = ( T K / T N ) / 2 π , while ψ , ψ and ψ are first three derivatives of the digamma function. The inset to Figure 5 shows this universal relation that implied T K of about 3.8 K for the jump 6.5 J mol Ce 1 K 1 , observed for CeAgAs2.
Another way of determining T K in Kondo lattices is based on the analysis of magnetic entropy released by the Néel temperature T N , which can be expressed as [19]
Δ S ( T N ) = R ln 1 + exp T K T N T K T N exp ( T K T N ) 1 + exp ( T K T N ) .
For CeAgAs2 one finds Δ S ( T N ) = 0.75 R ln 2 , which would imply the Kondo temperature of about 6.4 K (see the inset to Figure 5). The so-derived values of T K are larger than that given in Ref. [12].

2.4. Magnetotransport Properties

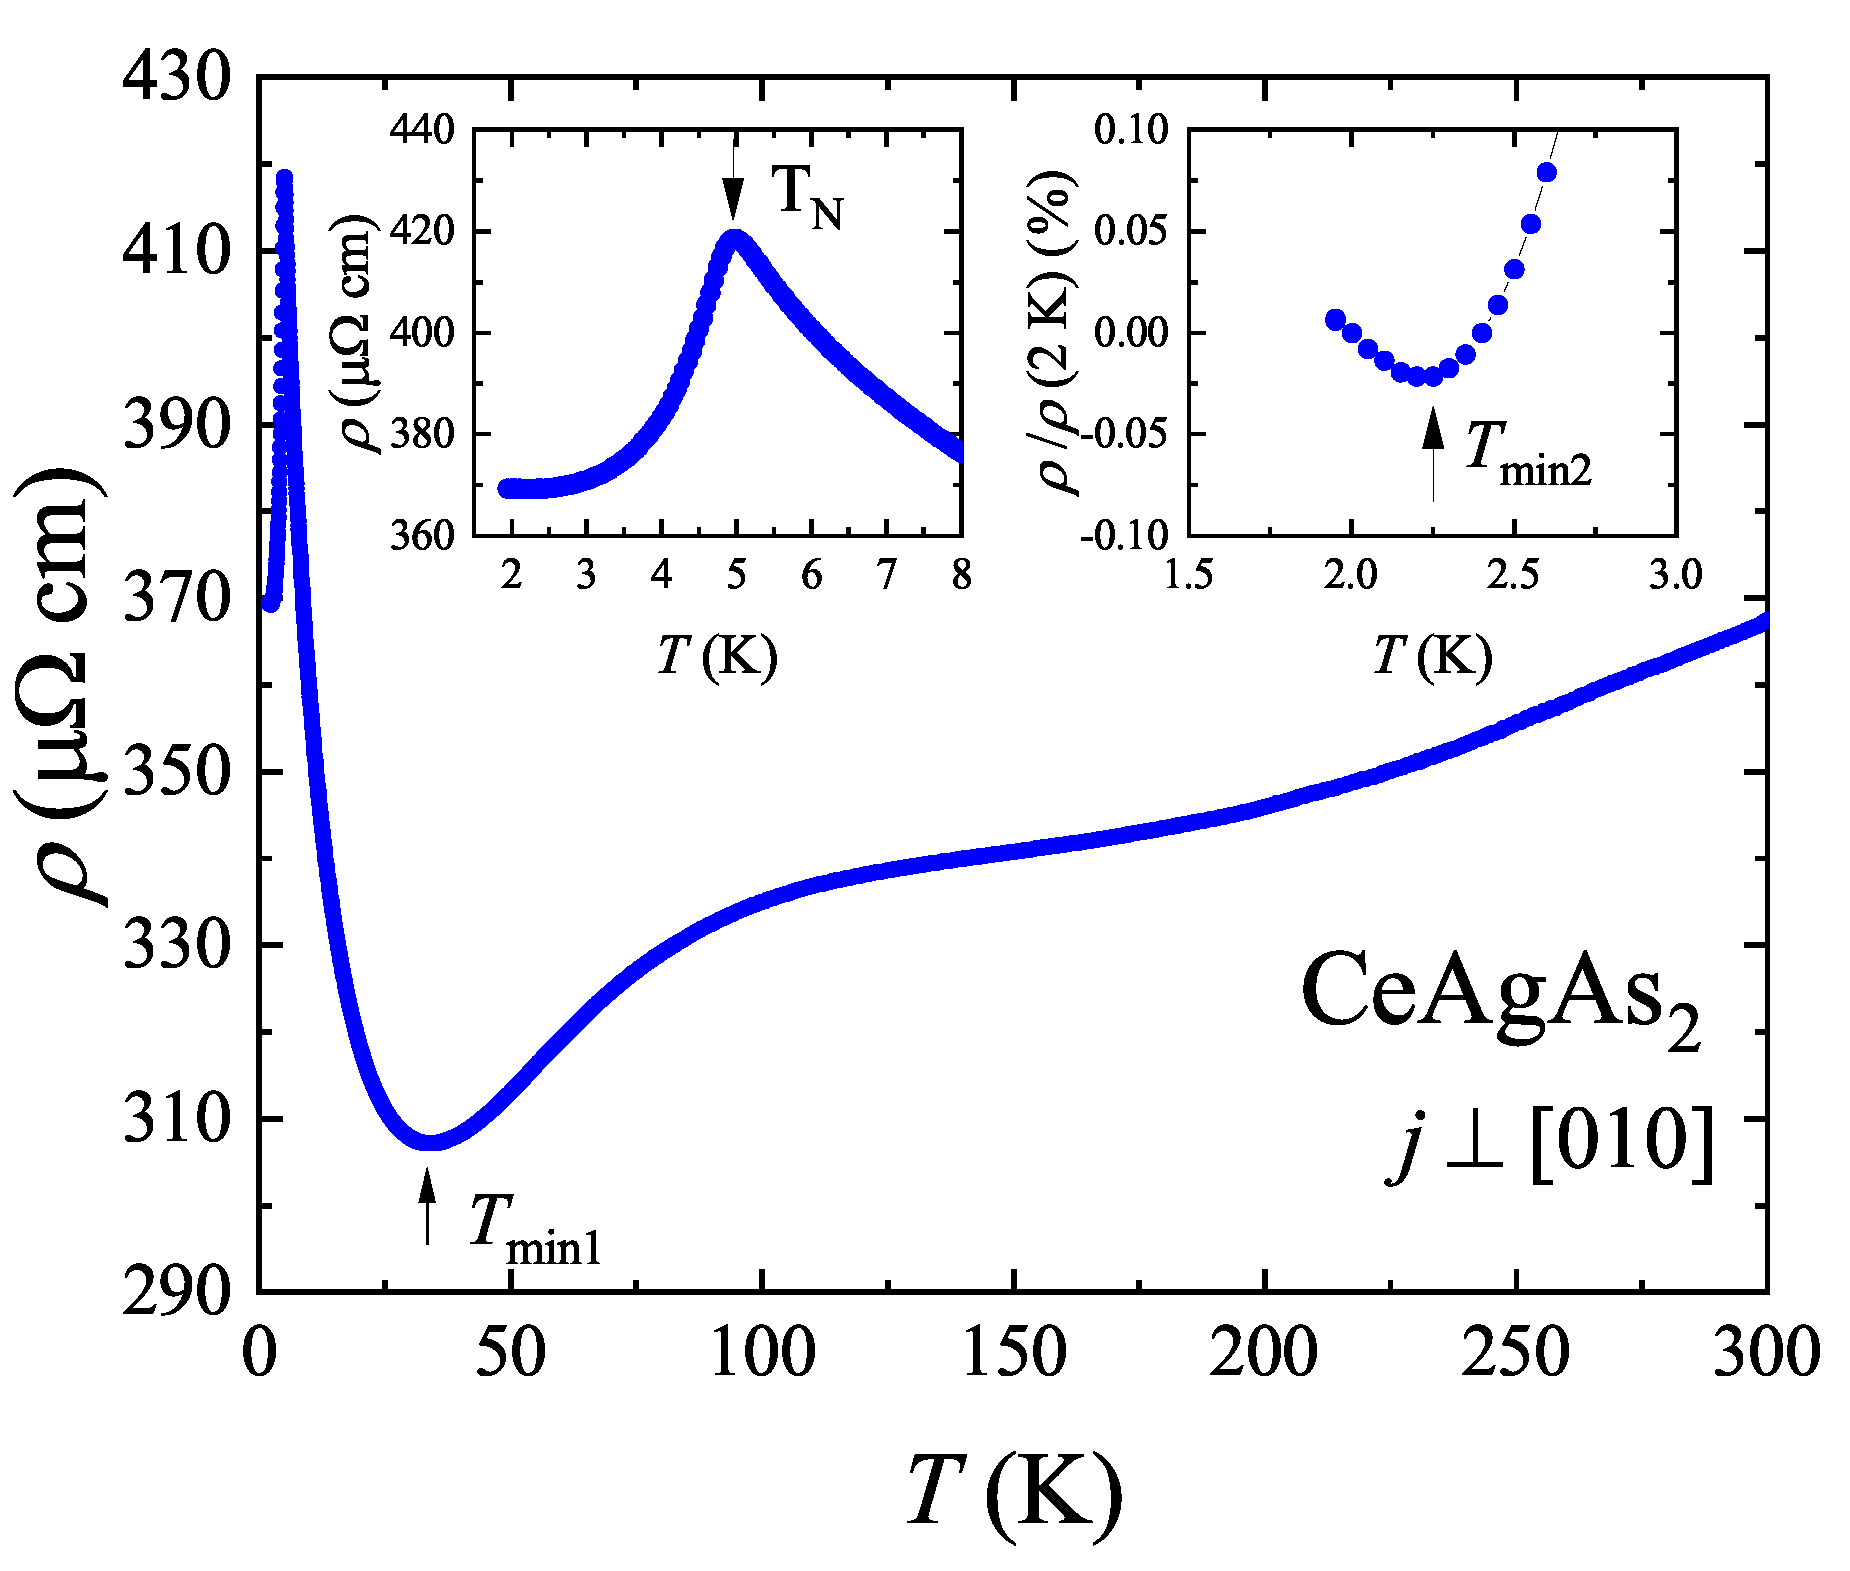
The temperature variation of the electrical resistivity ρ ( T ) of CeAgAs2 was measured with electric current flowing within the crystallographic (010) plane. The ρ ( T ) dependence presented in Figure 6 can be divided into a few ranges. Between the room temperature and the resistivity minimum located near T min 1 = 34 K, the resistivity decreases with decreasing temperature initially in a quasi-linear manner and then forms a broad hump around 200 K. While the former temperature dependence likely originates principally from scattering of conduction electrons on phonons, the broad anomaly in ρ ( T ) may be attributed to an interplay between CEF interactions and Kondo effect usually observed for Ce-based intermetallics [20]. Below T min 1 the resistivity sharply increases in a manner typical of insulators or semiconductors. Remarkably, this semiconducting-like change of the resistivity is interrupted at T max = 5 K, where ρ reaches its maximum value (see the left-hand side inset to Figure 6). The peak position matches very well with the AFM transition temperature T N derived from the magnetic susceptibility measurements. Below T N , the resistivity decreases again, which is mainly a result of scattering of charge carriers on magnons. Interestingly, the expected tendency towards saturation of the resistivity at temperatures much lower than T N is broken near T min 2 = 2.3 K, below which a small upturn occurs (see the right-hand side inset to Figure 6). However, as argued below, the origin of this increase is different from that of the resistivity behavior between T min 1 and T N .
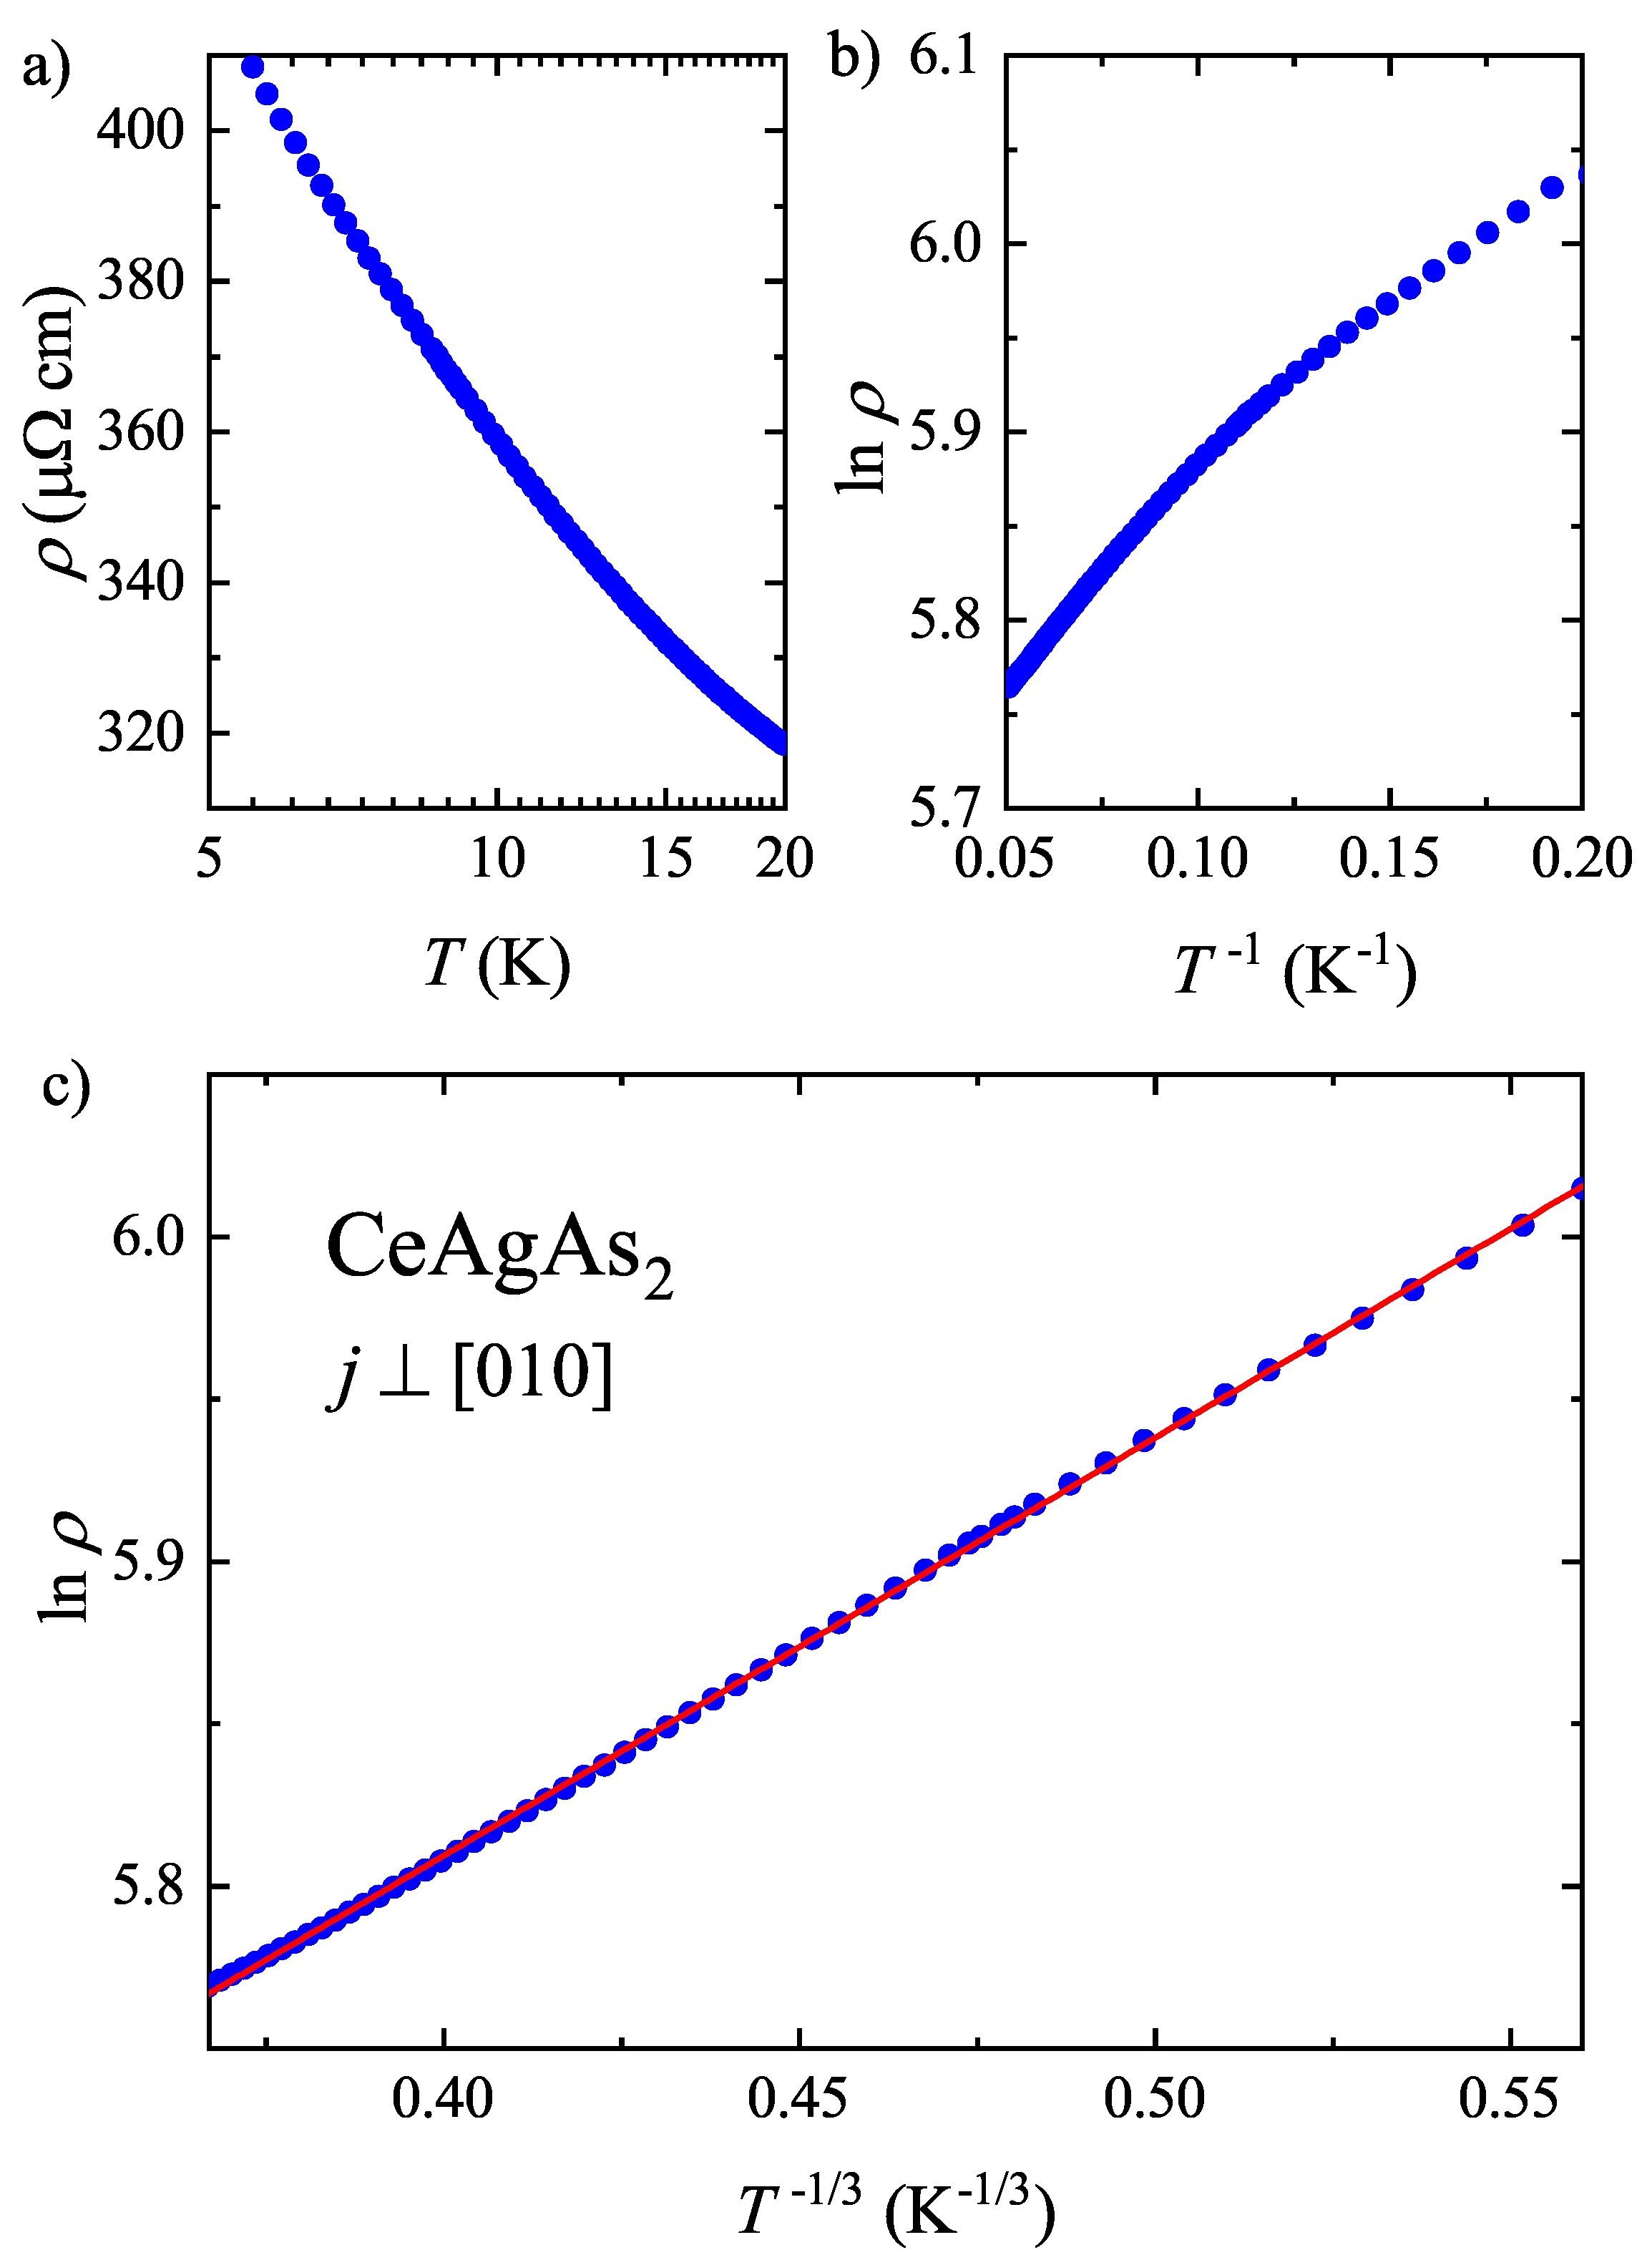
In order to find out what kind of scattering mechanism is responsible for the electrical transport in CeAgAs2 before the AFM order sets in, the ρ ( T ) data measured in the range of 5.5–20 K were analyzed in terms of three different physical scenarios. In Figure 7a, a logarithmic temperature dependence of the resistivity is examined, characteristic of incoherent Kondo scattering that was suggested in Ref. [12] to dominate the charge transport in CeAgAs2 above T N . Apparently, in the case of the crystal studied herein, a ρ ln T behavior can hardly be identified, which indicates that the simple Kondo scenario may not be adequate. In this context, it should be noted that the magnitude of the resistivity of CeAgAs2 increases within narrow temperature interval (between 34 and 5 K) by more than 100 μ Ω cm. Such a semiconducting-like character may be ascribed to the formation of a small pseudo-gap at the Fermi energy in CeAgAs2, as revealed in band structure calculations (see below). Typically, the resistivity can be approximated by the expression ρ ( T ) = ρ 0 exp ( Δ / T ) describing thermal excitation of conduction electrons over hybridization gap Δ .
As can be inferred from Figure 7b, the ln ρ ( T 1 ) dependence does not reproduce well the resistivity data of CeAgAs2. Anticipating the presence of several active channels of the electrical conduction, such as transport involving in-gap donor or acceptor states, the resistivity of CeAgAs2 in the same temperature range from 5.5 K to 20 K was analyzed in terms of the relation ρ ( T ) = ρ H exp [ ( T H / T ) x ] , where x is a parameter which defines different hopping transport regimes and ρ H represents a characteristic material constant [21,22]. This type of temperature dependence of the resistivity is basically expected in insulators and semiconductors, in which conduction of electric current is realized through hopping of charge carriers between localized states. As shown in Figure 7c, the best description of the experimental data was obtained with the parameter x equal to 1 / 3 . This finding agrees very well with the results of band structure calculations, which revealed a predominant 2D character of the Fermi surface in CeAgAs2 (see below).
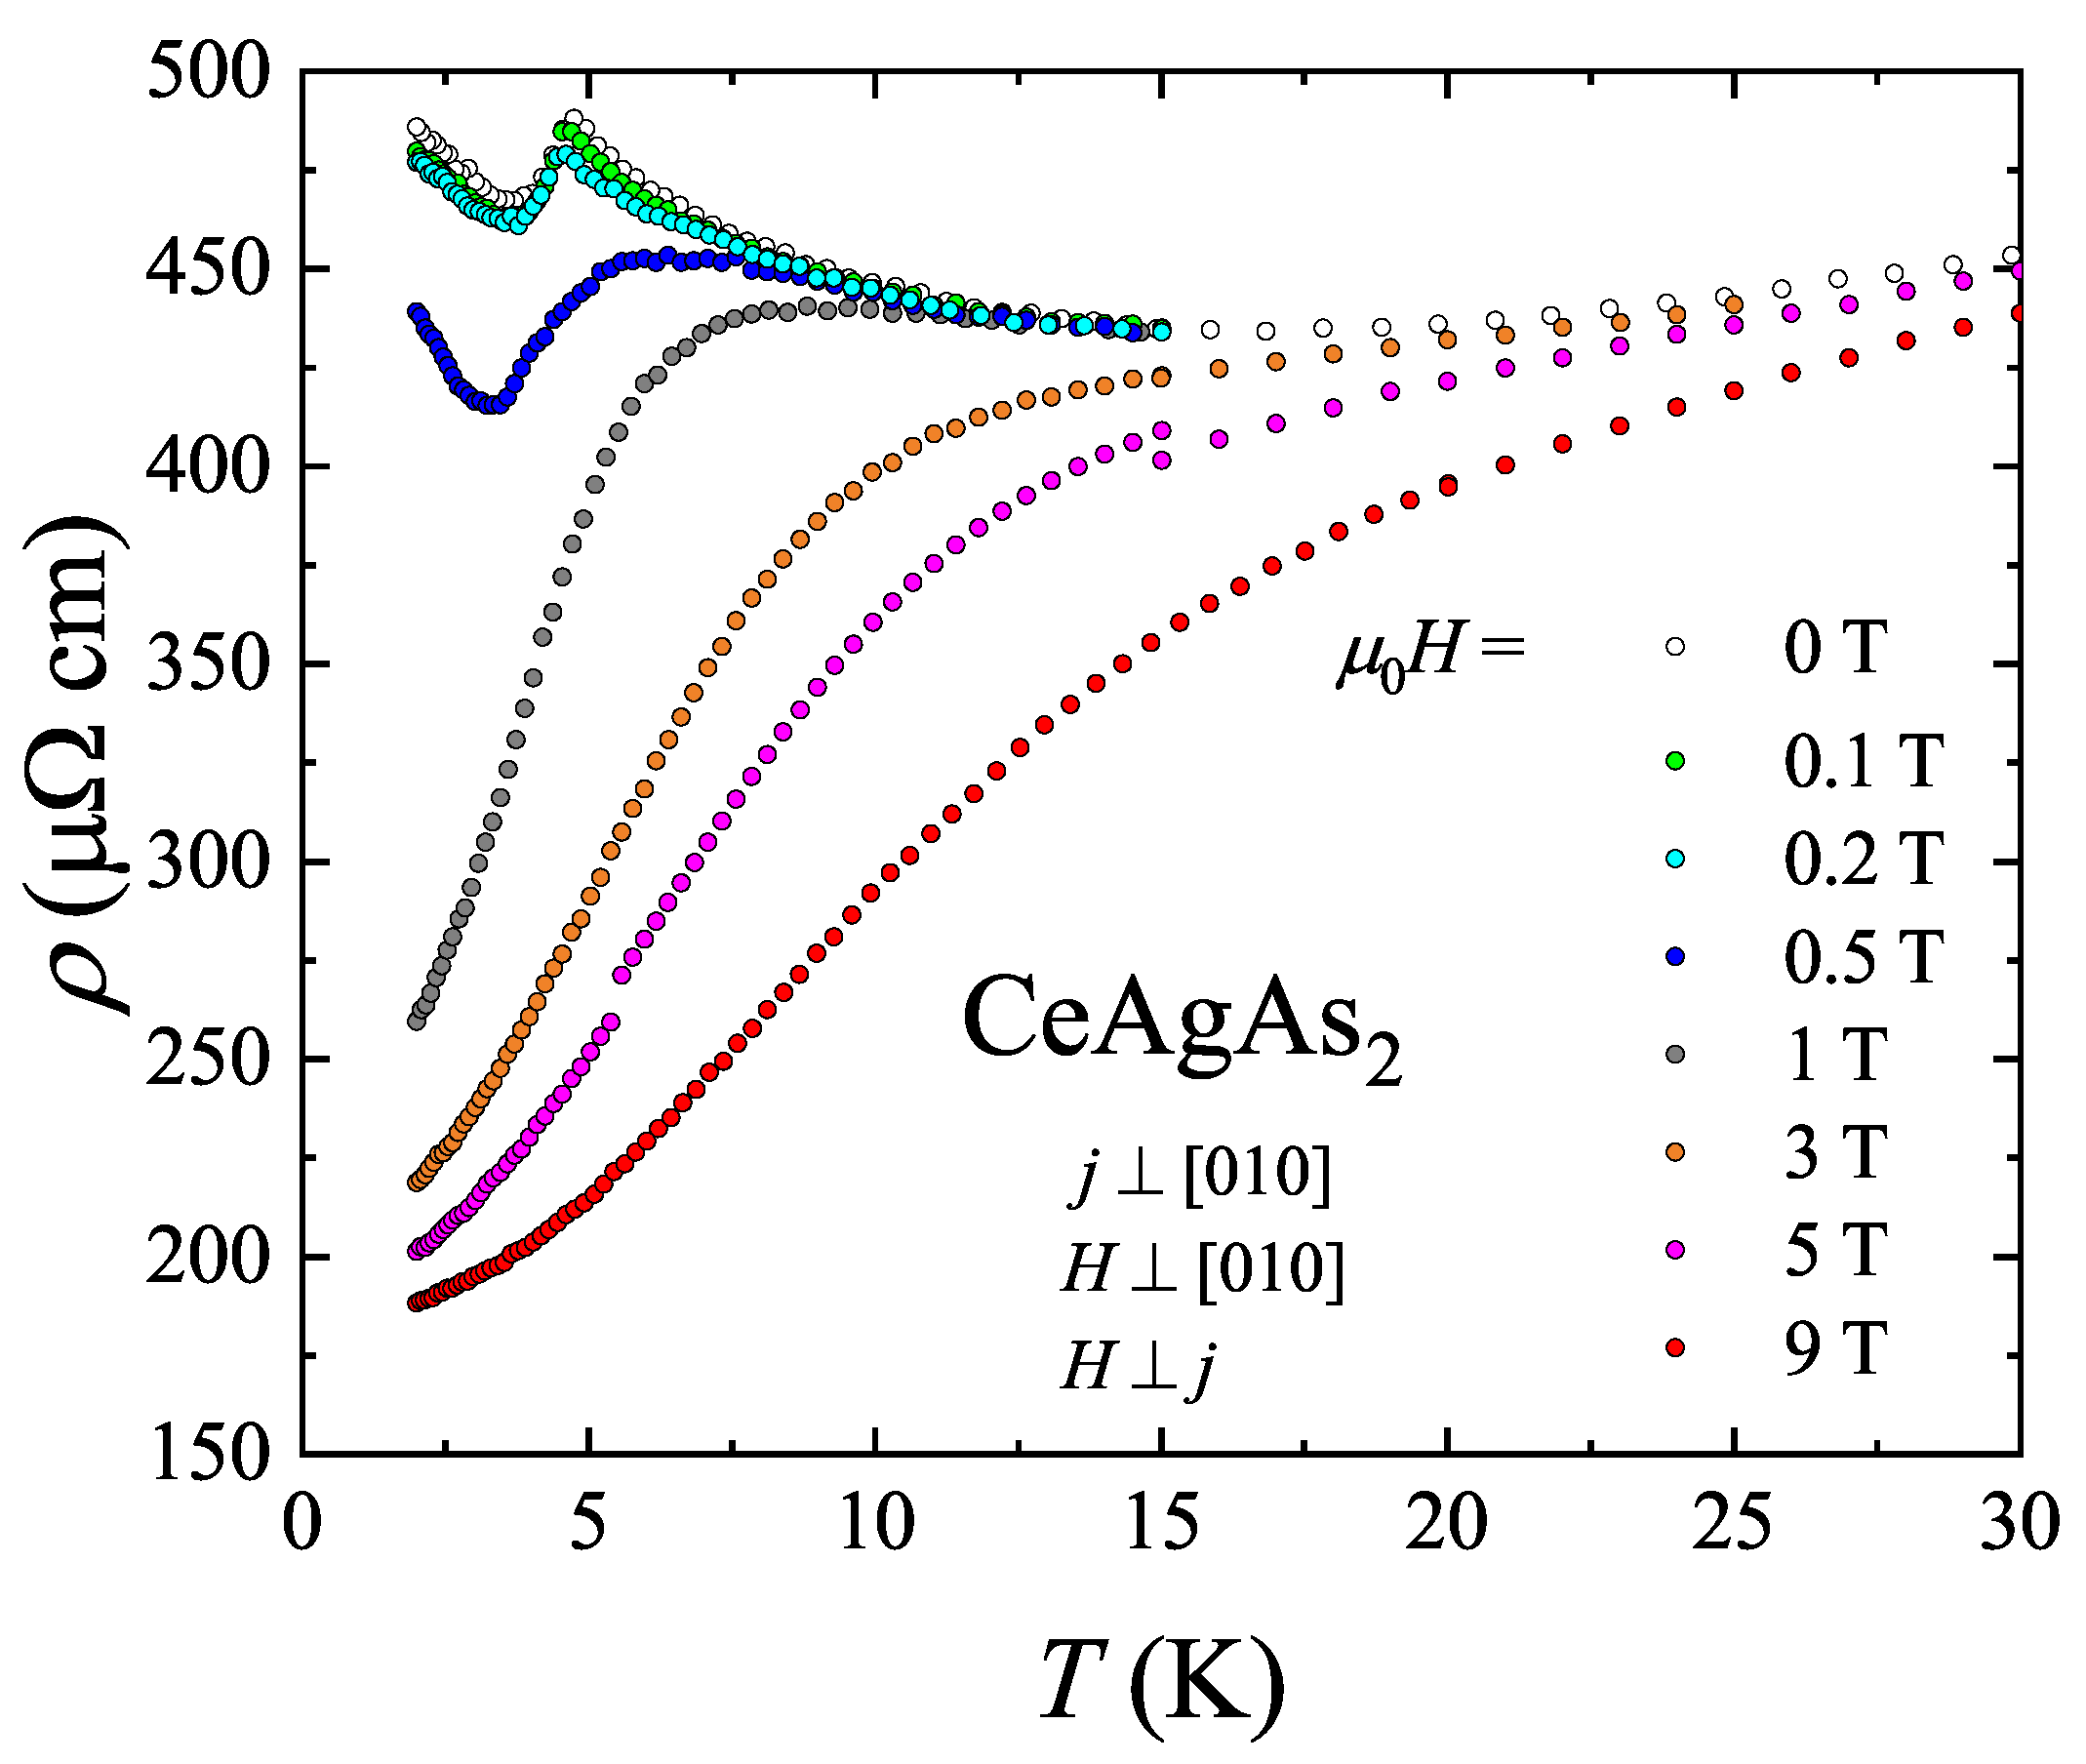
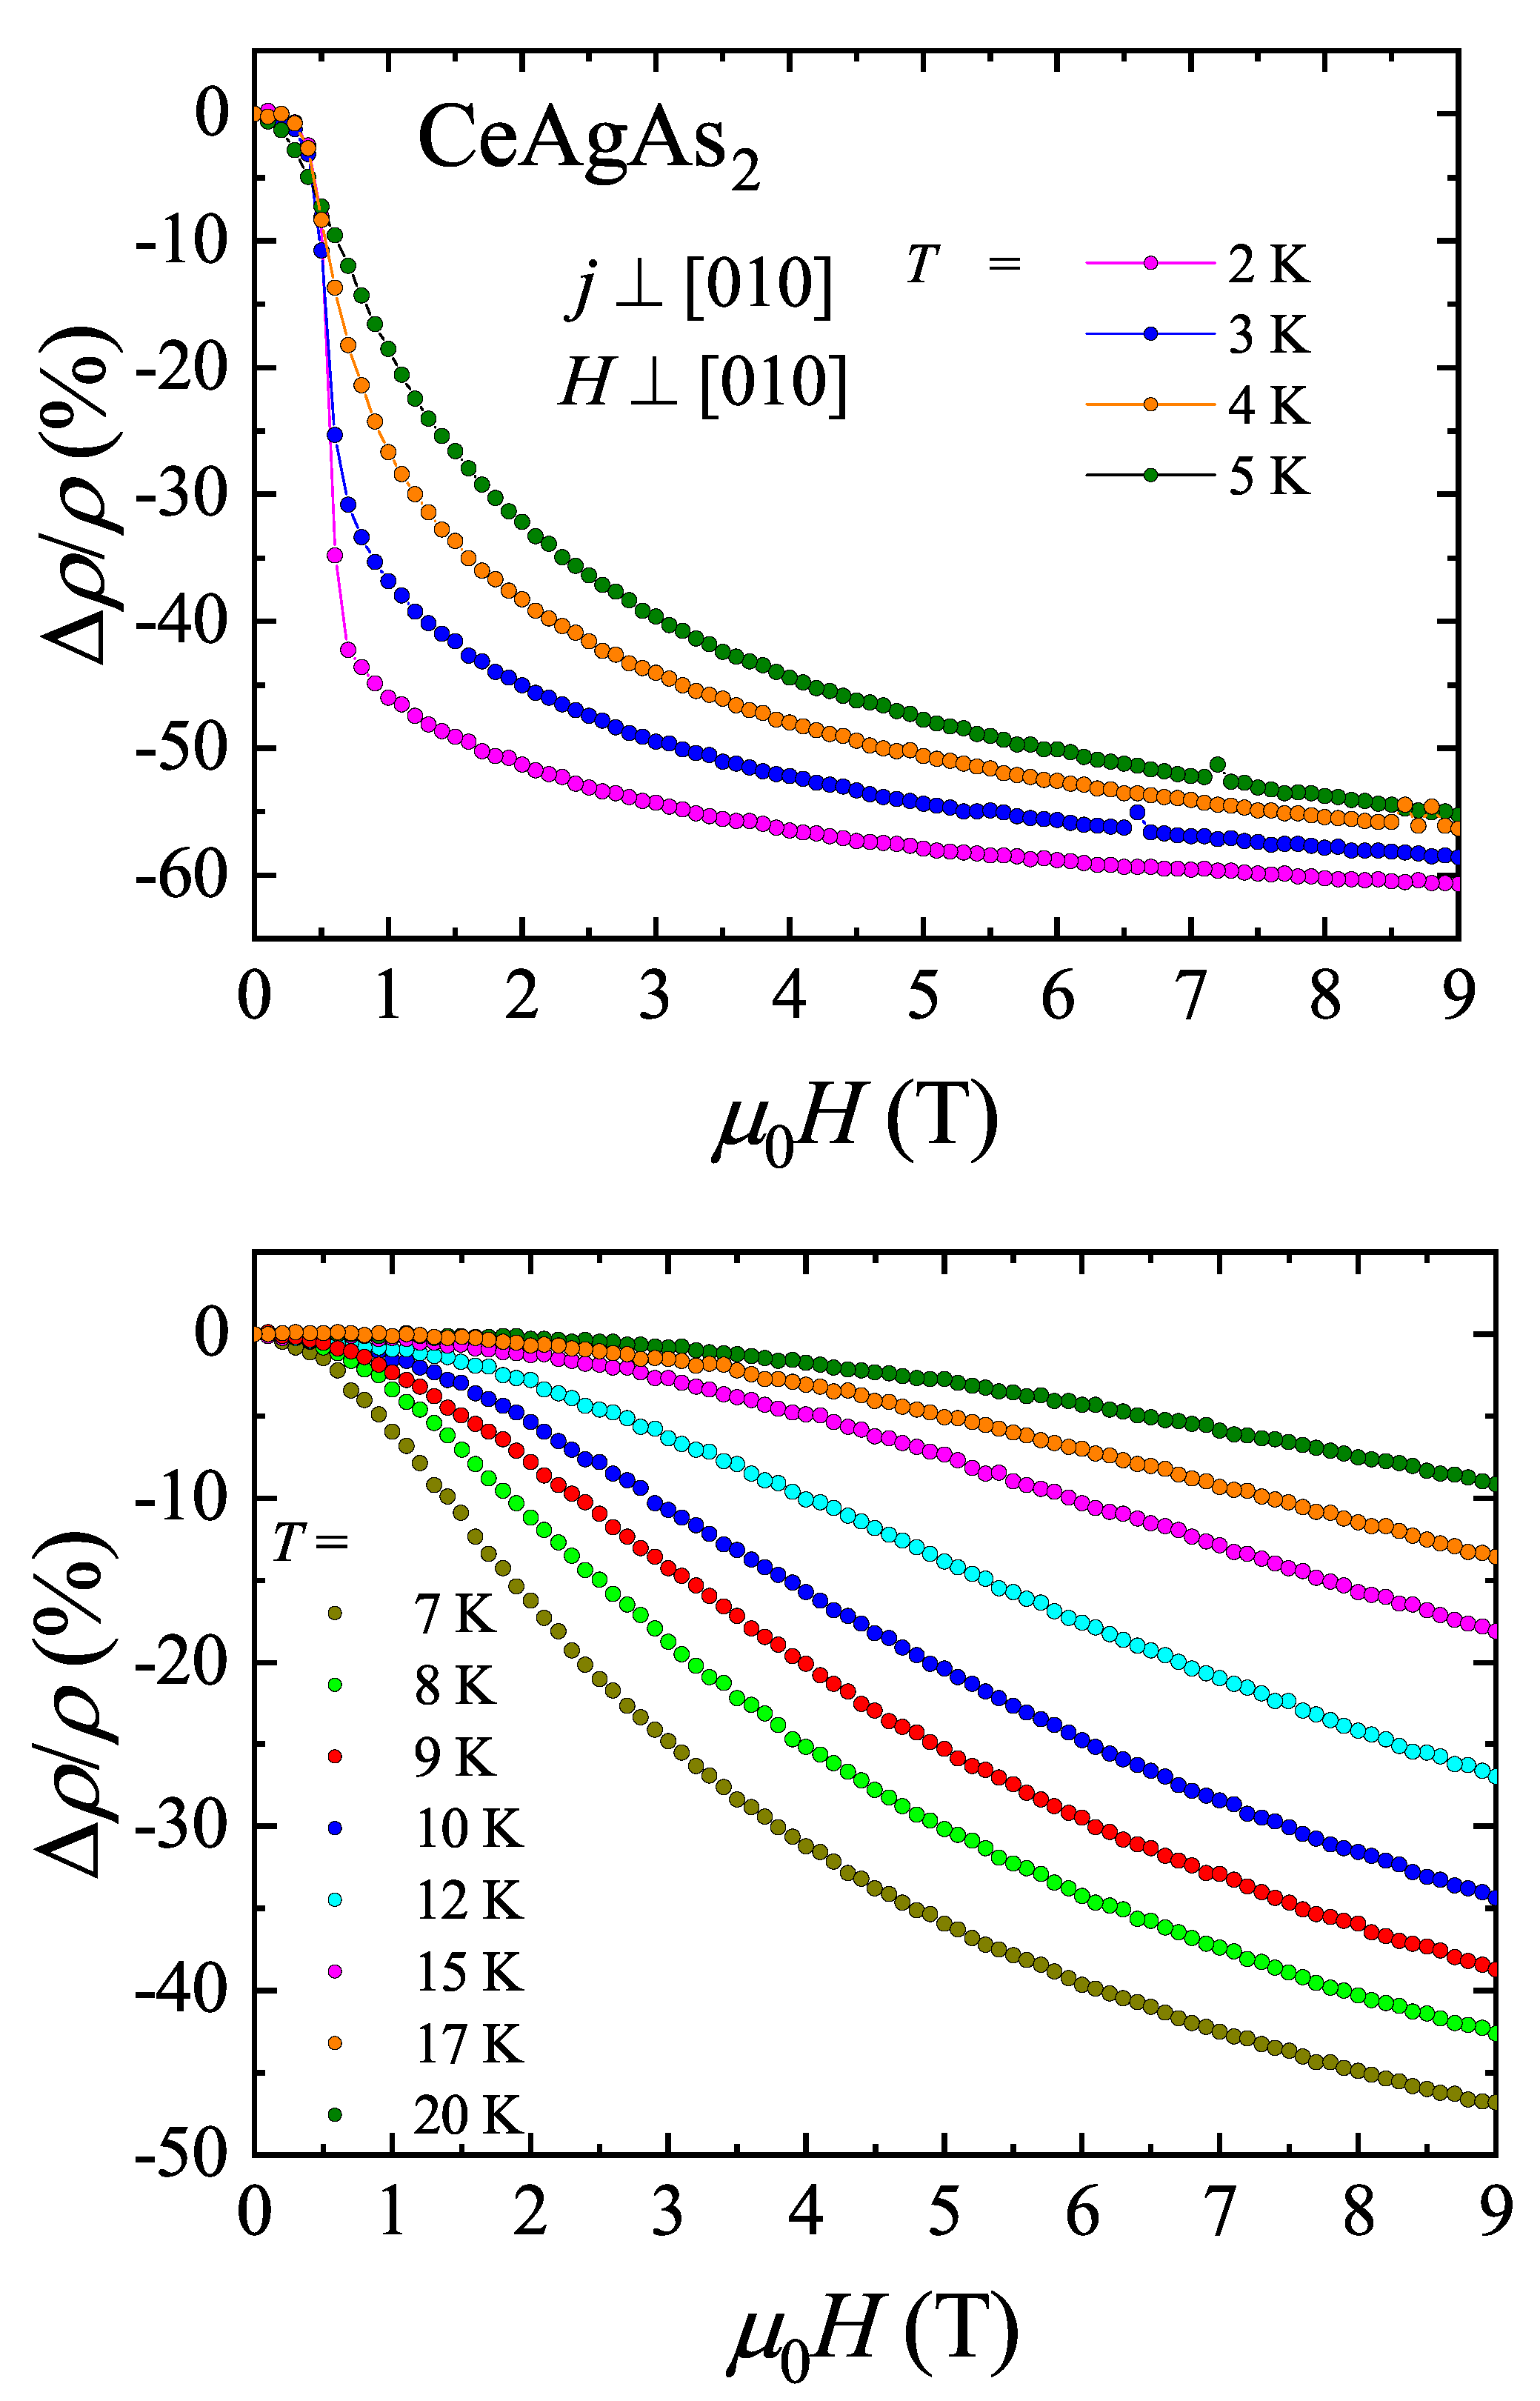
Figure 8 displays the electrical resistivity of CeAgAs2 measured within the (010) plane in external magnetic field also confined in the same plane and oriented perpendicular to the flowing current. These measurements were carried out using different single-crystal of CeAgAs2 from the same batch. It should be noted that the resistivity of this crystal is somewhat larger, the low-temperature minimum in ρ ( T ) is located at higher temperature and the lowest-temperature upturn is more significant compared to the data presented in Figure 6. As can be seen in the figure, in weak magnetic fields, the electrical resistivity is hardly changed, and the main effect is small shift of the maximum due to magnetic ordering towards lower temperatures, as expected for antiferromagnets. However, in a field 0.5 T, the decrease of the resistivity is distinct and the maximum is much broader. At stronger fields, the latter feature disappears completely and the resistivity decreases significantly. The observed behavior of ρ ( T ) results from the MM transition that occurs in H c = 0.5 T. Further support for this interpretation comes from the inspection of the isotherms of the transverse magnetoresistance (MR) of CeAgAs2 defined as Δ ρ / ρ = ρ ( H ) ρ ( 0 ) ρ ( 0 ) and measured with electrical current and magnetic field oriented as described above. The variations measured at low temperatures are gathered in the upper panel of Figure 9. Noticeably, initially the magnetic field hardly affects the resistivity, however in a field of 0.5 T, a sudden drop of Δ ρ / ρ occurs, marking the MM transition. At 2 K, the MR attains a large value of −60 % in a field of 9 T.
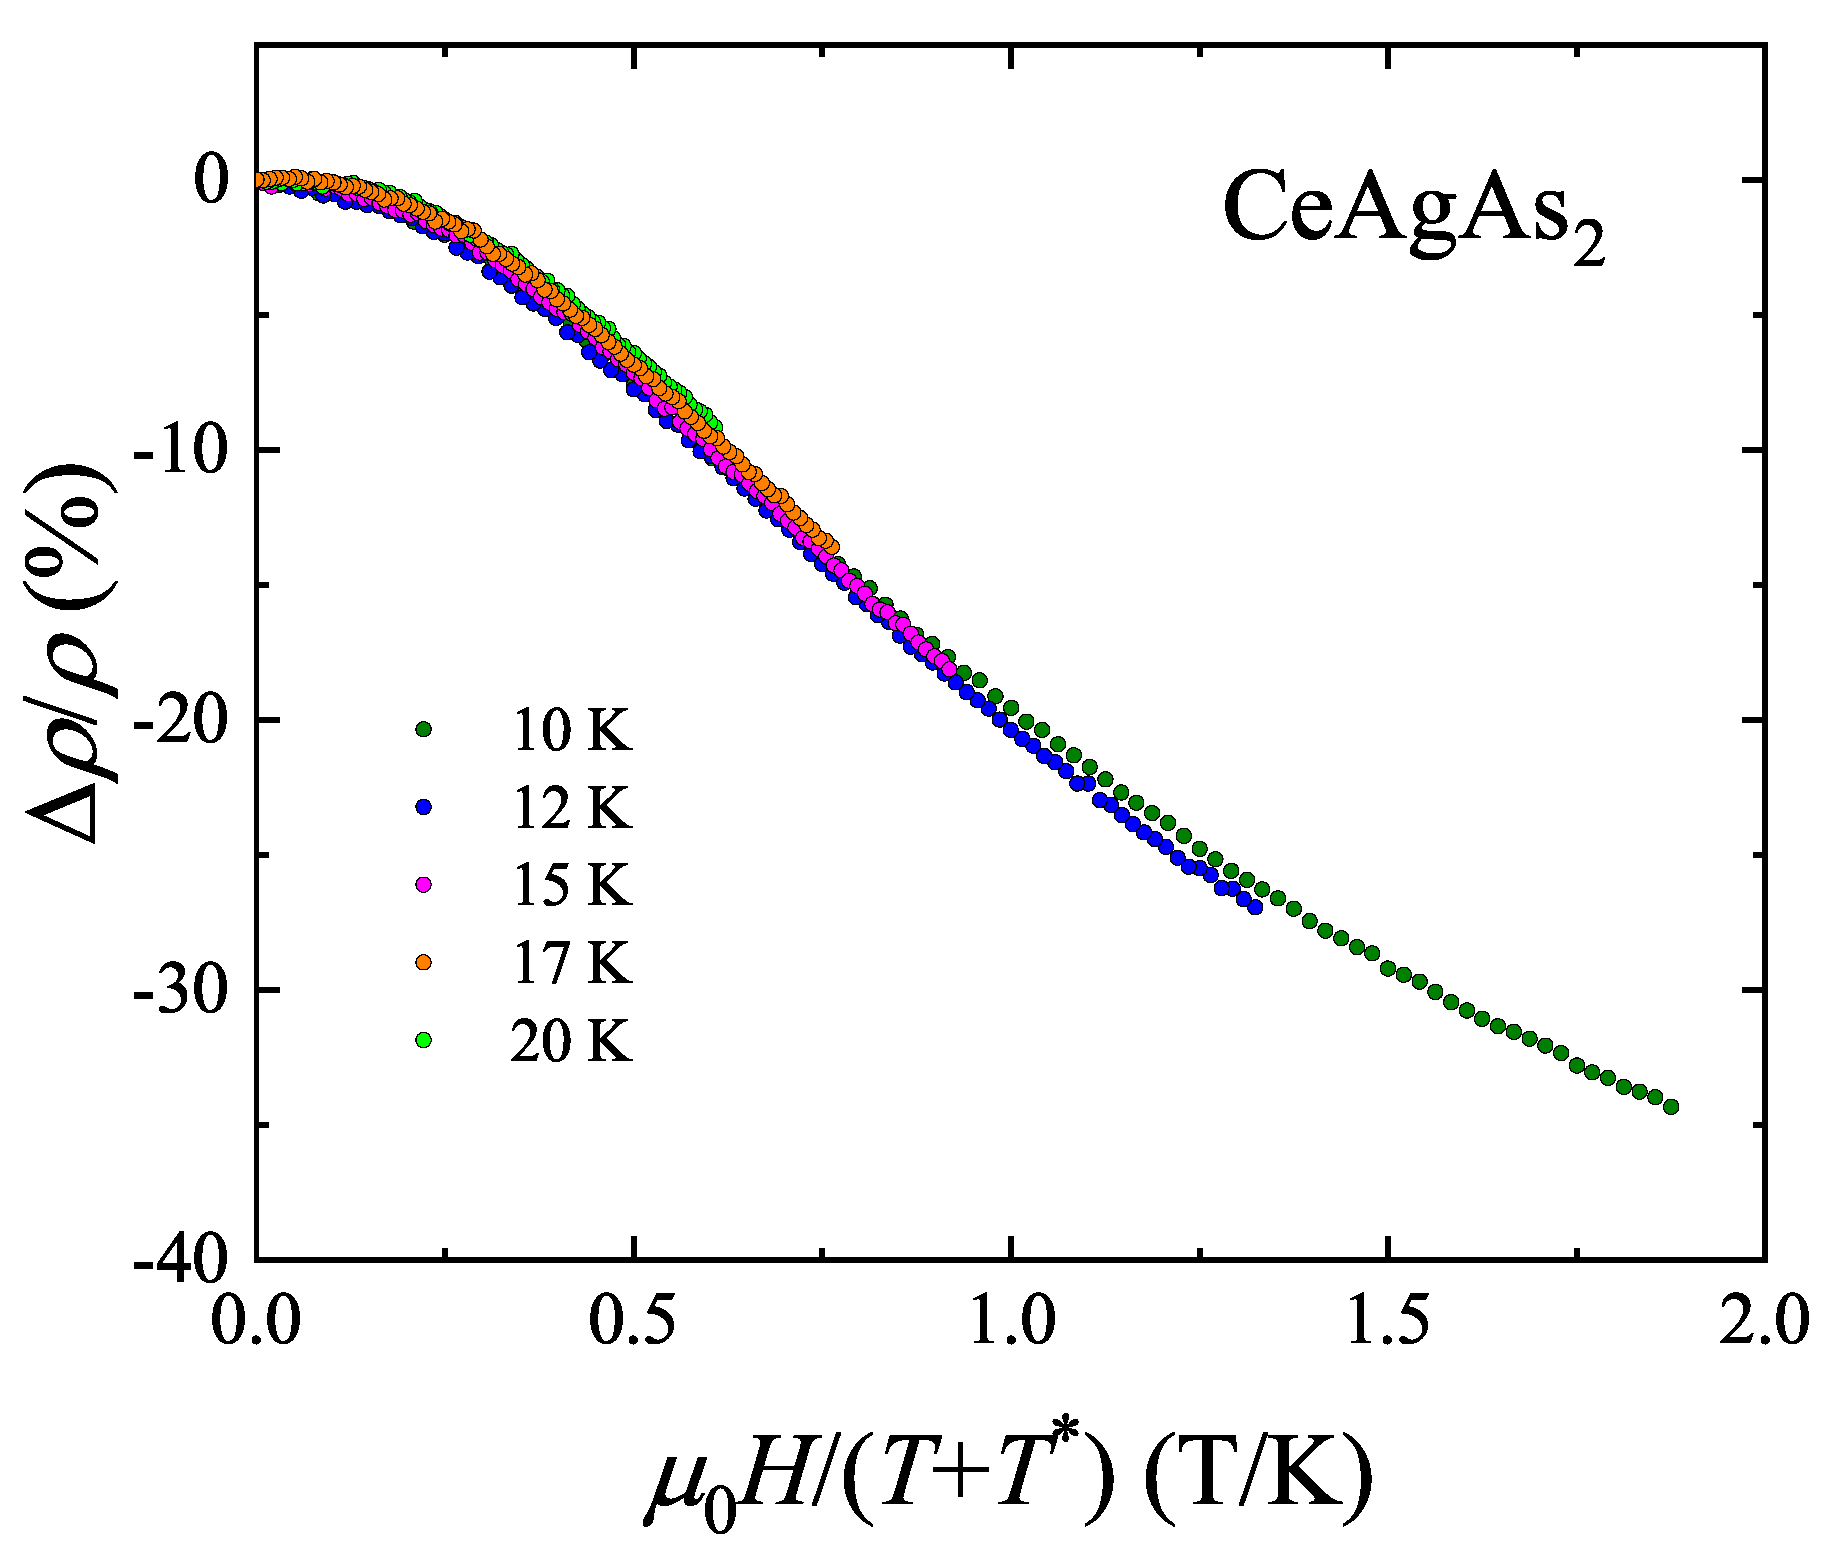
The lower panel of Figure 9 presents the Δ ρ / ρ ( H ) data collected in the paramagnetic state. At each temperature the MR is negative and large. As displayed in Figure 10, all the isotherms can be superimposed onto each other using the single-ion Kondo scaling relation Δ ρ / ρ ( H ) = f ( H T + T ) , derived within the Bethe–Ansatz approach [23]. The characteristic temperature T , which ensures the best overlap of the MR curves, amounts to 5.2 K. This value is close to that given in Ref. [12]. The negative sign of T manifests strong ferromagnetic interactions between magnetic moments within the (010) plane, as revealed by neutron diffraction measurements [11].
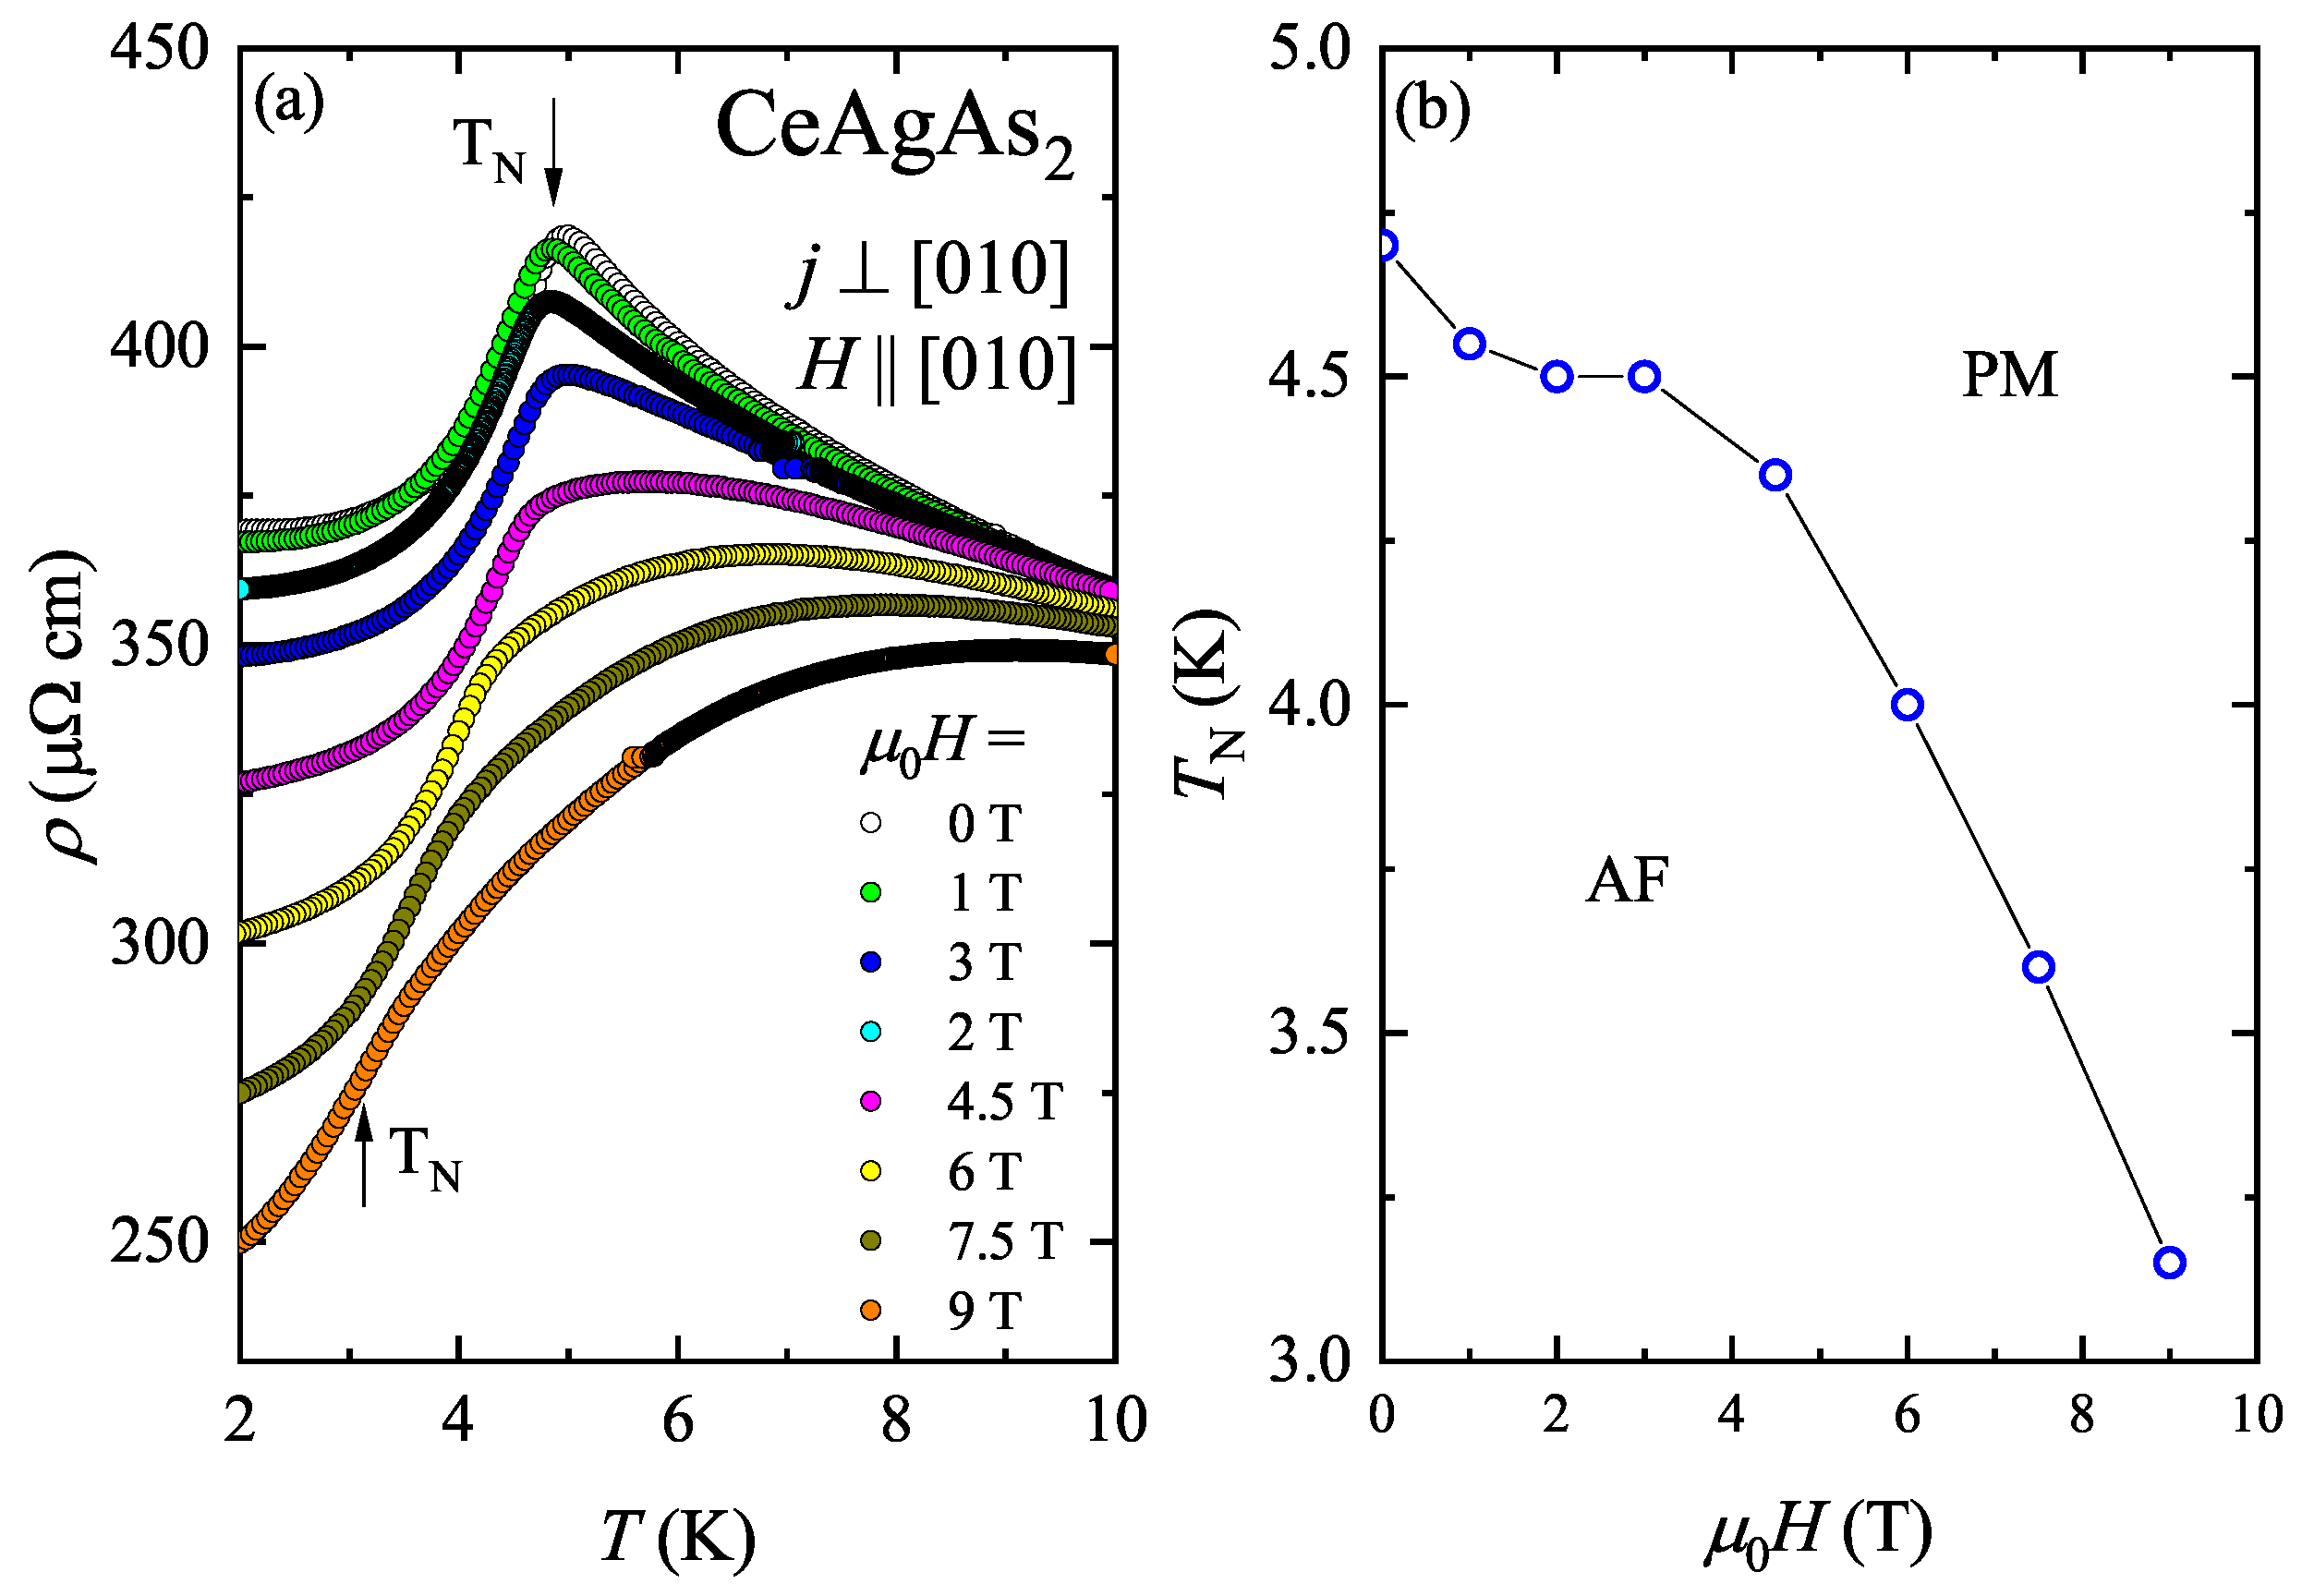
To elucidate the source of the low-temperature upturn in the electrical resistivity, the resistivity measurements were performed with magnetic field oriented along the [010] axis, being hard magnetic direction. Influence of the magnetic field on the ρ ( T ) dependencies of CeAgAs2 measured in the vicinity of T N is shown in Figure 11a. In magnetic fields up to 3 T, ρ ( T ) variation does not change significantly. With increasing the field strength, the peak in ρ ( T ) shifts slightly towards lower temperatures while the magnitude of the resistivity diminishes giving rise to negative MR. Above 3 T, this sharp peak transforms into a broad maximum which moves towards higher temperatures with increasing field. The evolution of the Néel temperature, defined as a maximum in the first derivative of the resistivity d ρ / d T with magnetic field is shown in Figure 11b.
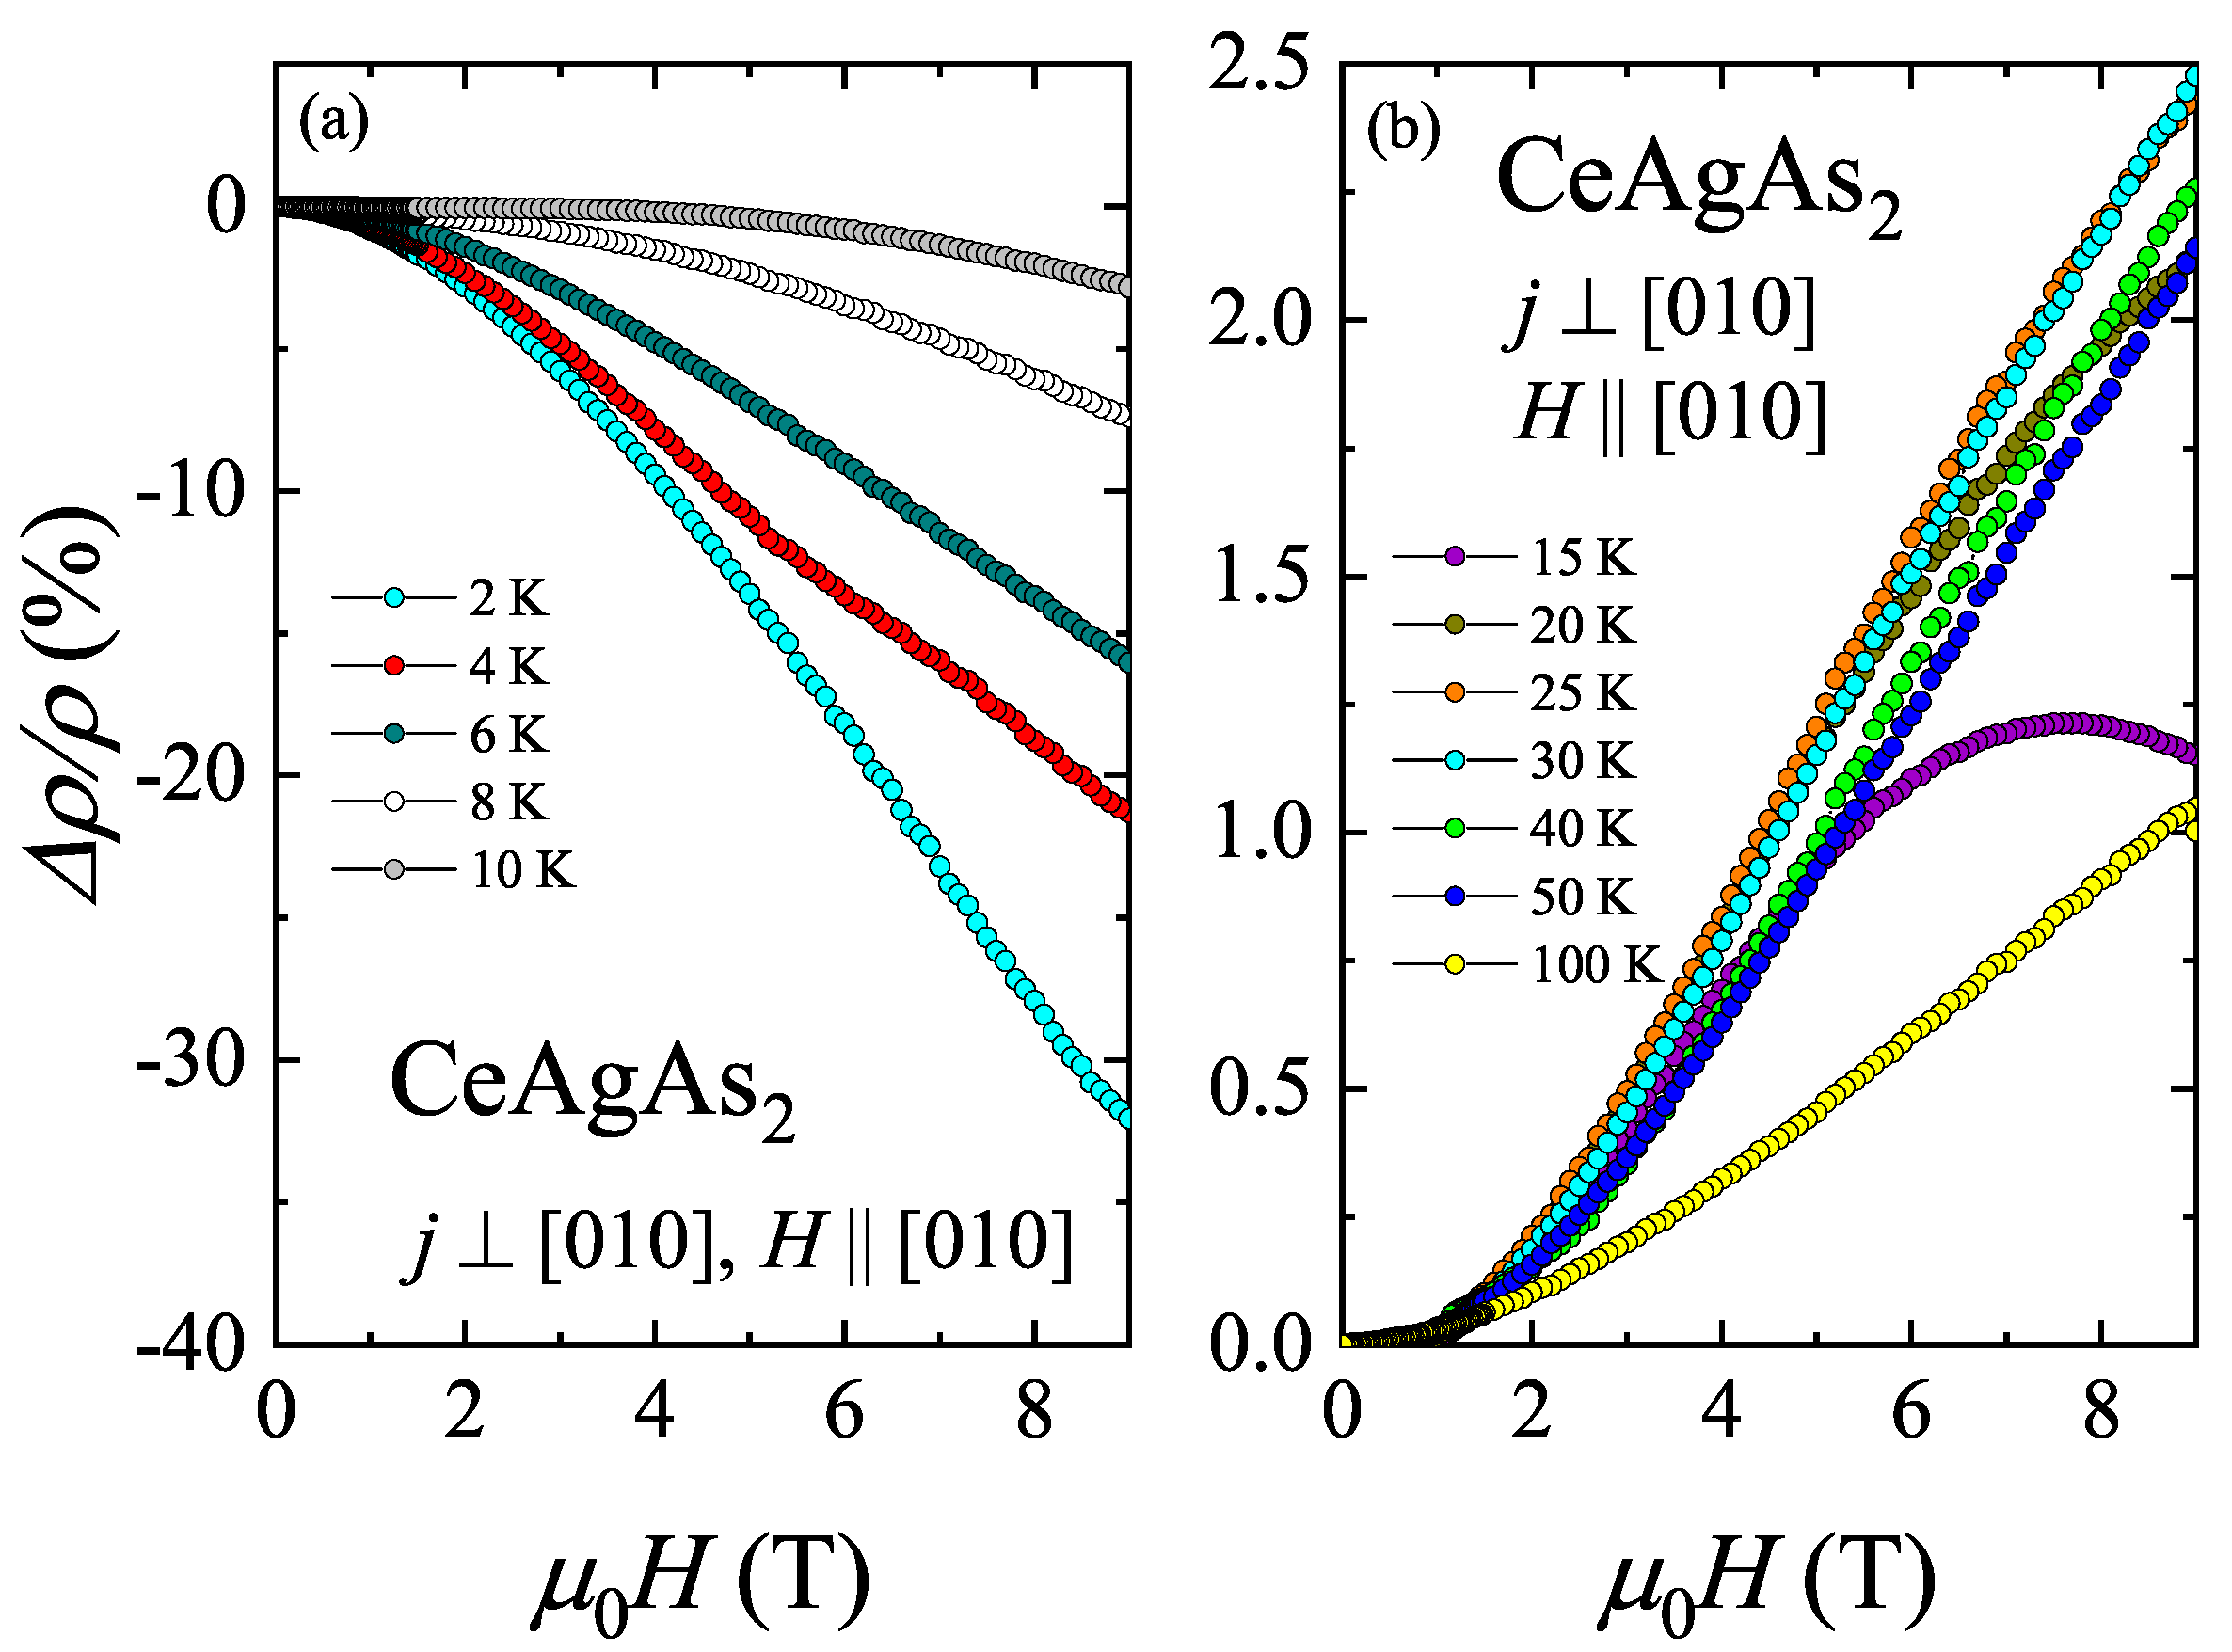
Figure 12 depicts the magnetic field dependence of the MR taken with external magnetic field oriented along the [010] axis, i.e., perpendicular to the magnetic moments which are confined within the crystallographic (010) plane [11]. Between 2 and 10 K, Δ ρ / ρ is negative in the entire field range. The absolute value of Δ ρ / ρ is quite significant at the lowest temperatures being equal to −32 % at 2 K and in a field of 9 T. Remarkably, at this temperature, no MM-like anomaly in Δ ρ / ρ ( H ) was found up to 9 T. With increasing temperature, the absolute value of the MR decreases. At T = 4 K, a small hump is seen near 6 T that can be attributed to the MM transition. This behavior is in line with the data presented in Figure 11b. For T 15 K, the MR changes sign to positive. At 15 K, the negative contribution to Δ ρ / ρ can be still observed at higher fields as a decrease of the MR above 7 T. With increasing temperature, the negative contribution to Δ ρ / ρ decreases. It is also worth noting that the magnitude of positive MR is much smaller than the negative contribution observed at low temperatures. The maximum positive value of the order of 2.5 % was found at 25 and 30 K, i.e., in the vicinity of T min 1 . Above T min 1 , the magnitude of Δ ρ / ρ decreases. The positive MR observed at high temperatures usually result from cyclotron motion of conduction electrons in the presence of external magnetic field.
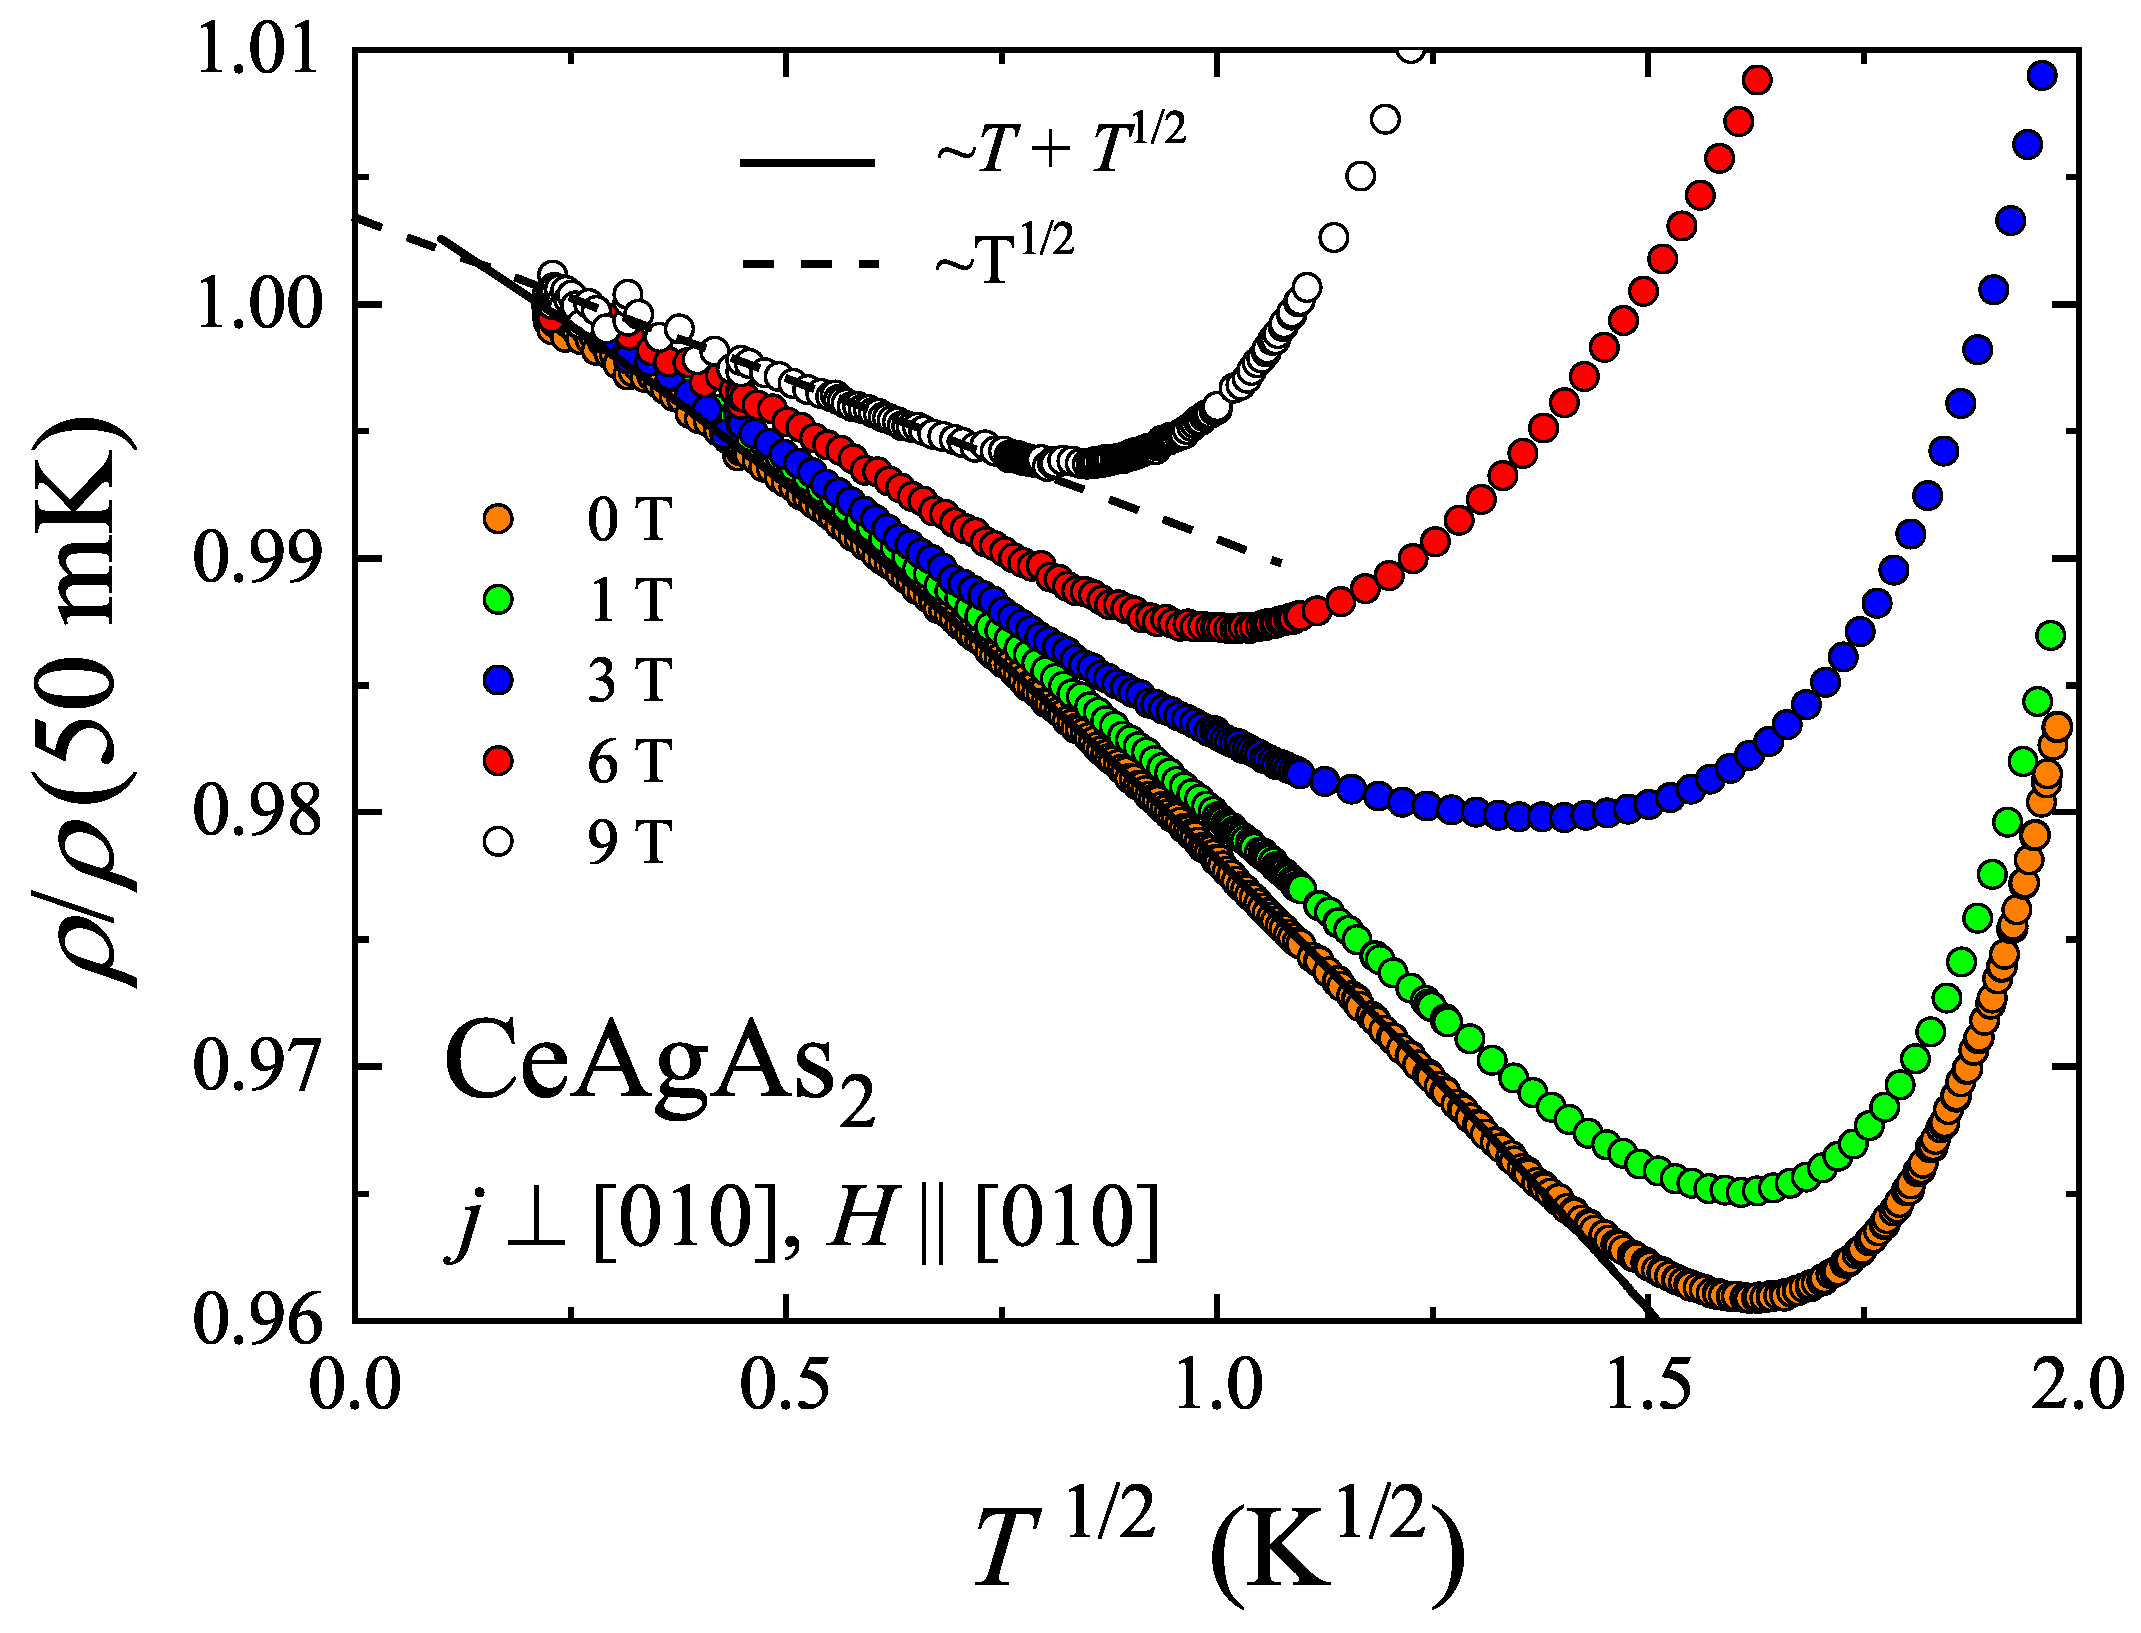
In order to further search for the origin of the low temperature upturn in the resistivity, the measurements were extended towards lower temperatures. Though performed on a different sample of CeAgAs2, the orientations of current and magnetic field with respect to the crystallographic axes were preserved, i.e., j [ 010 ] and H [ 010 ] . Figure 13 shows the temperature variation of the resistivity normalized to its value at 50 mK (note a T 1 / 2 scale). The resistivity goes through a minimum near T min 2 = 2.6 K, which is slightly higher than T min 1 found for the other sample (see above), however the magnitude and the field dependence of Δ ρ / ρ of the two specimens are very similar. Between 0.1 and 2 K, no hint at any MM transition was found in accordance with the phase diagram presented in Figure 11b. It should be noted that for both single-crystalline samples of CeAgAs2, the resistivity attains rather high magnitude, which probably implies that elastic scattering of conduction electrons on crystal structure imperfections plays an important role in the low temperature electronic transport. Remarkably, as can be inferred form Figure 13, the upturn in ρ ( T ) of the sample measured in zero field can be described by the relation: ρ = ρ 0 A C T 1 / 2 - A SW T with the residual resistivity ρ 0 = 389.4 μ Ω cm, and the prefactors A C = 8.03 μ Ω cm K 1 / 2 and A SW = 2.27 μ Ω cm K 1 . The so-derived residual resistivity is somewhat larger than that found for the sample considered above. The square-root-in-T term represents interaction quantum correction or Altshuler-Aronov correction, which is a typical contribution to low temperature resistivity of disordered conductors independent on their ground state properties [24,25,26]. In turn, linear-in-T term stands for quantum correction due to scattering of conduction electrons on spin waves [27], expected for magnetically ordered materials, being independent of the type of magnetic ordering and the system dimensionality.
As shown in Figure 13, the observed linear-in-T behavior gradually disappears with increasing the strength of external magnetic field. The resistivity measured in a field of 9 T can be well described below the minimum by relation containing only the square-root-in-T contribution: ρ = ρ 0 9 T A C 9 T T 1 / 2 , where ρ 0 9 T = 241.9 μ Ω cm and A C 9 T = 3.05 μ Ω cm K 1 / 2 . This finding is in an agreement with the behavior anticipated for magnetically ordered metallic systems, in which spin-wave mediated interaction correction to the resistivity becomes suppressed in strong magnetic fields due to damping of spin waves excitations. In turn, the Coulomb interaction correction governed mainly by singlet term and triplet term with S z = 0 inherently does not depend on the magnetic field, while triplet term with S z = ± 1 is cut off for fields large enough to make the Zeeman splitting energy much larger than thermal energy of conduction electrons. In such conditions the Coulomb interaction is not destroyed by magnetic field and the system exhibits positive MR.
Since the singlet and triplet terms contribute to the total quantum correction with opposite signs, one may expect that magnitude of the interaction correction does not decrease with increasing magnetic field. This same, the minimum should shift to higher temperatures. As shown in Figure 11, in a magnetic field of 9 T the residual resistivity of CeAgAs2 is reduced down to about 120 μ Ω cm. Since the quantum corrections are correlated with the residual resistivity value, one can deduce that with decreasing the residual resistivity the coefficient A C decreases when magnetic field is applied. The difference between values of A C and A C 9 T may reflect the presence of another contribution to the resistivity below the minimum with very similar temperature dependence as that of the interaction correction. A likely candidate is weak localization correction that appears in magnetically ordered materials when inelastic scattering rate due to electron–magnon scattering is much larger than that associated with electron–phonon interaction [27]. In such case, contrary to non-magnetic materials, the dephasing rate 1 / τ φ is a relevant cut-off for the quantum interference phenomena. In the literature, there were considered two limiting scenarios, i.e.,: ћ / τ φ Δ and ћ / τ φ Δ ( τ φ and Δ are dephasing time and energy gap in magnon spectrum, respectively). In the former case the correction to the conductivity is proportional to ( π sinh ( Δ / T ) ) 1 / 2 for T > Δ or is given by fractional power law in the crossover regime T Δ . In turn, the correction predicted for ћ / τ φ Δ is proportional to ( T ln ( c o n s t / T ) ) 1 / 2 . Remarkably, the two latter relations yield a similar square-root-in-T dependence of low temperature resistivity, experimentally observed for CeAgAs2.

2.5. Band Structure Calculations

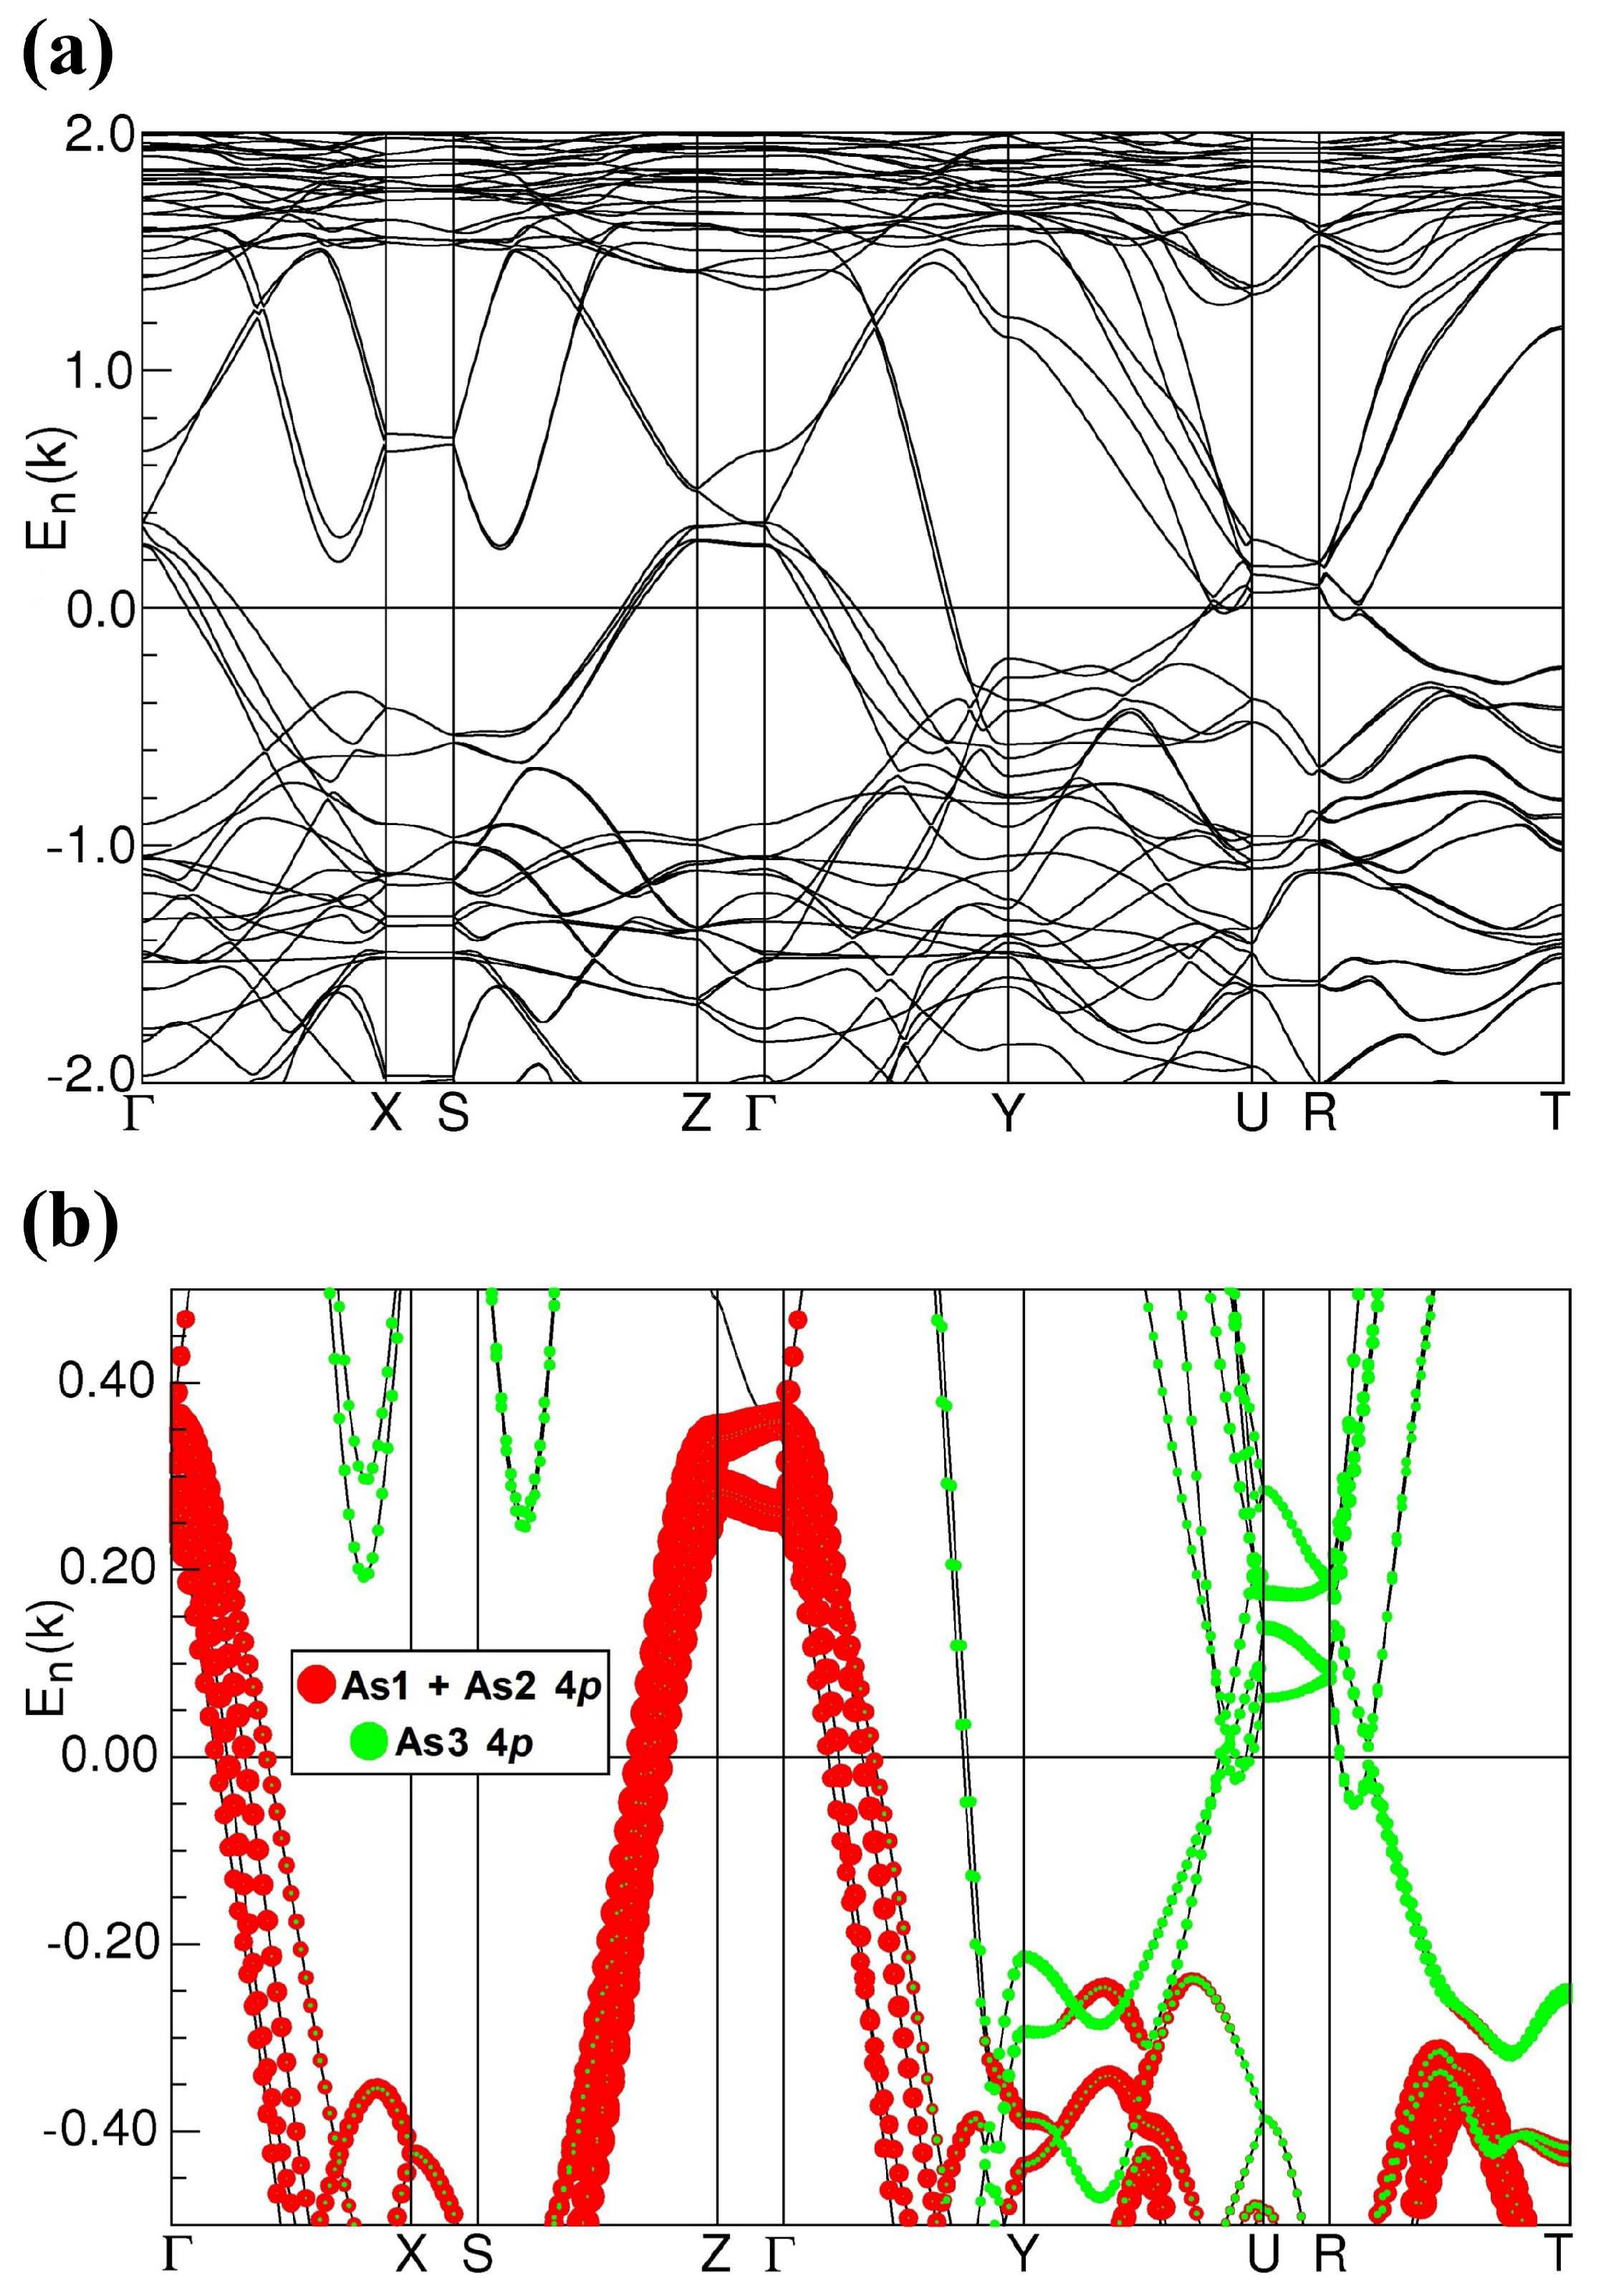
The electronic band structure calculated for antiferromagnetic CeAgAs2 (see Figure 14), exhibits a metallic character and generally it is very similar to the band structure of the nonmagnetic reference compound LaAgAs2 (Ref. [10]). It does not show any Dirac-like bands, found for a few other rare-earth (RE) pnictides RETX2 with X = Sb or Bi [28,29,30,31]. Probably it is a combination of the AFM ordering (which splits the electronic bands) with the distortion of the nets of As3 atoms from perfect squares that causes the lack of conic-like bands originating from the As 4p electrons near the Fermi level E F . One may consider that the quasi-two-dimensional (quasi-2D) band structure (along the [010] axis) reflected in a group of split and flat bands lying 0.05–0.2 eV above E F along the Γ Z and UR lines in the Brillouin Zone (BZ) mainly governs the transport properties of CeAgAs2.
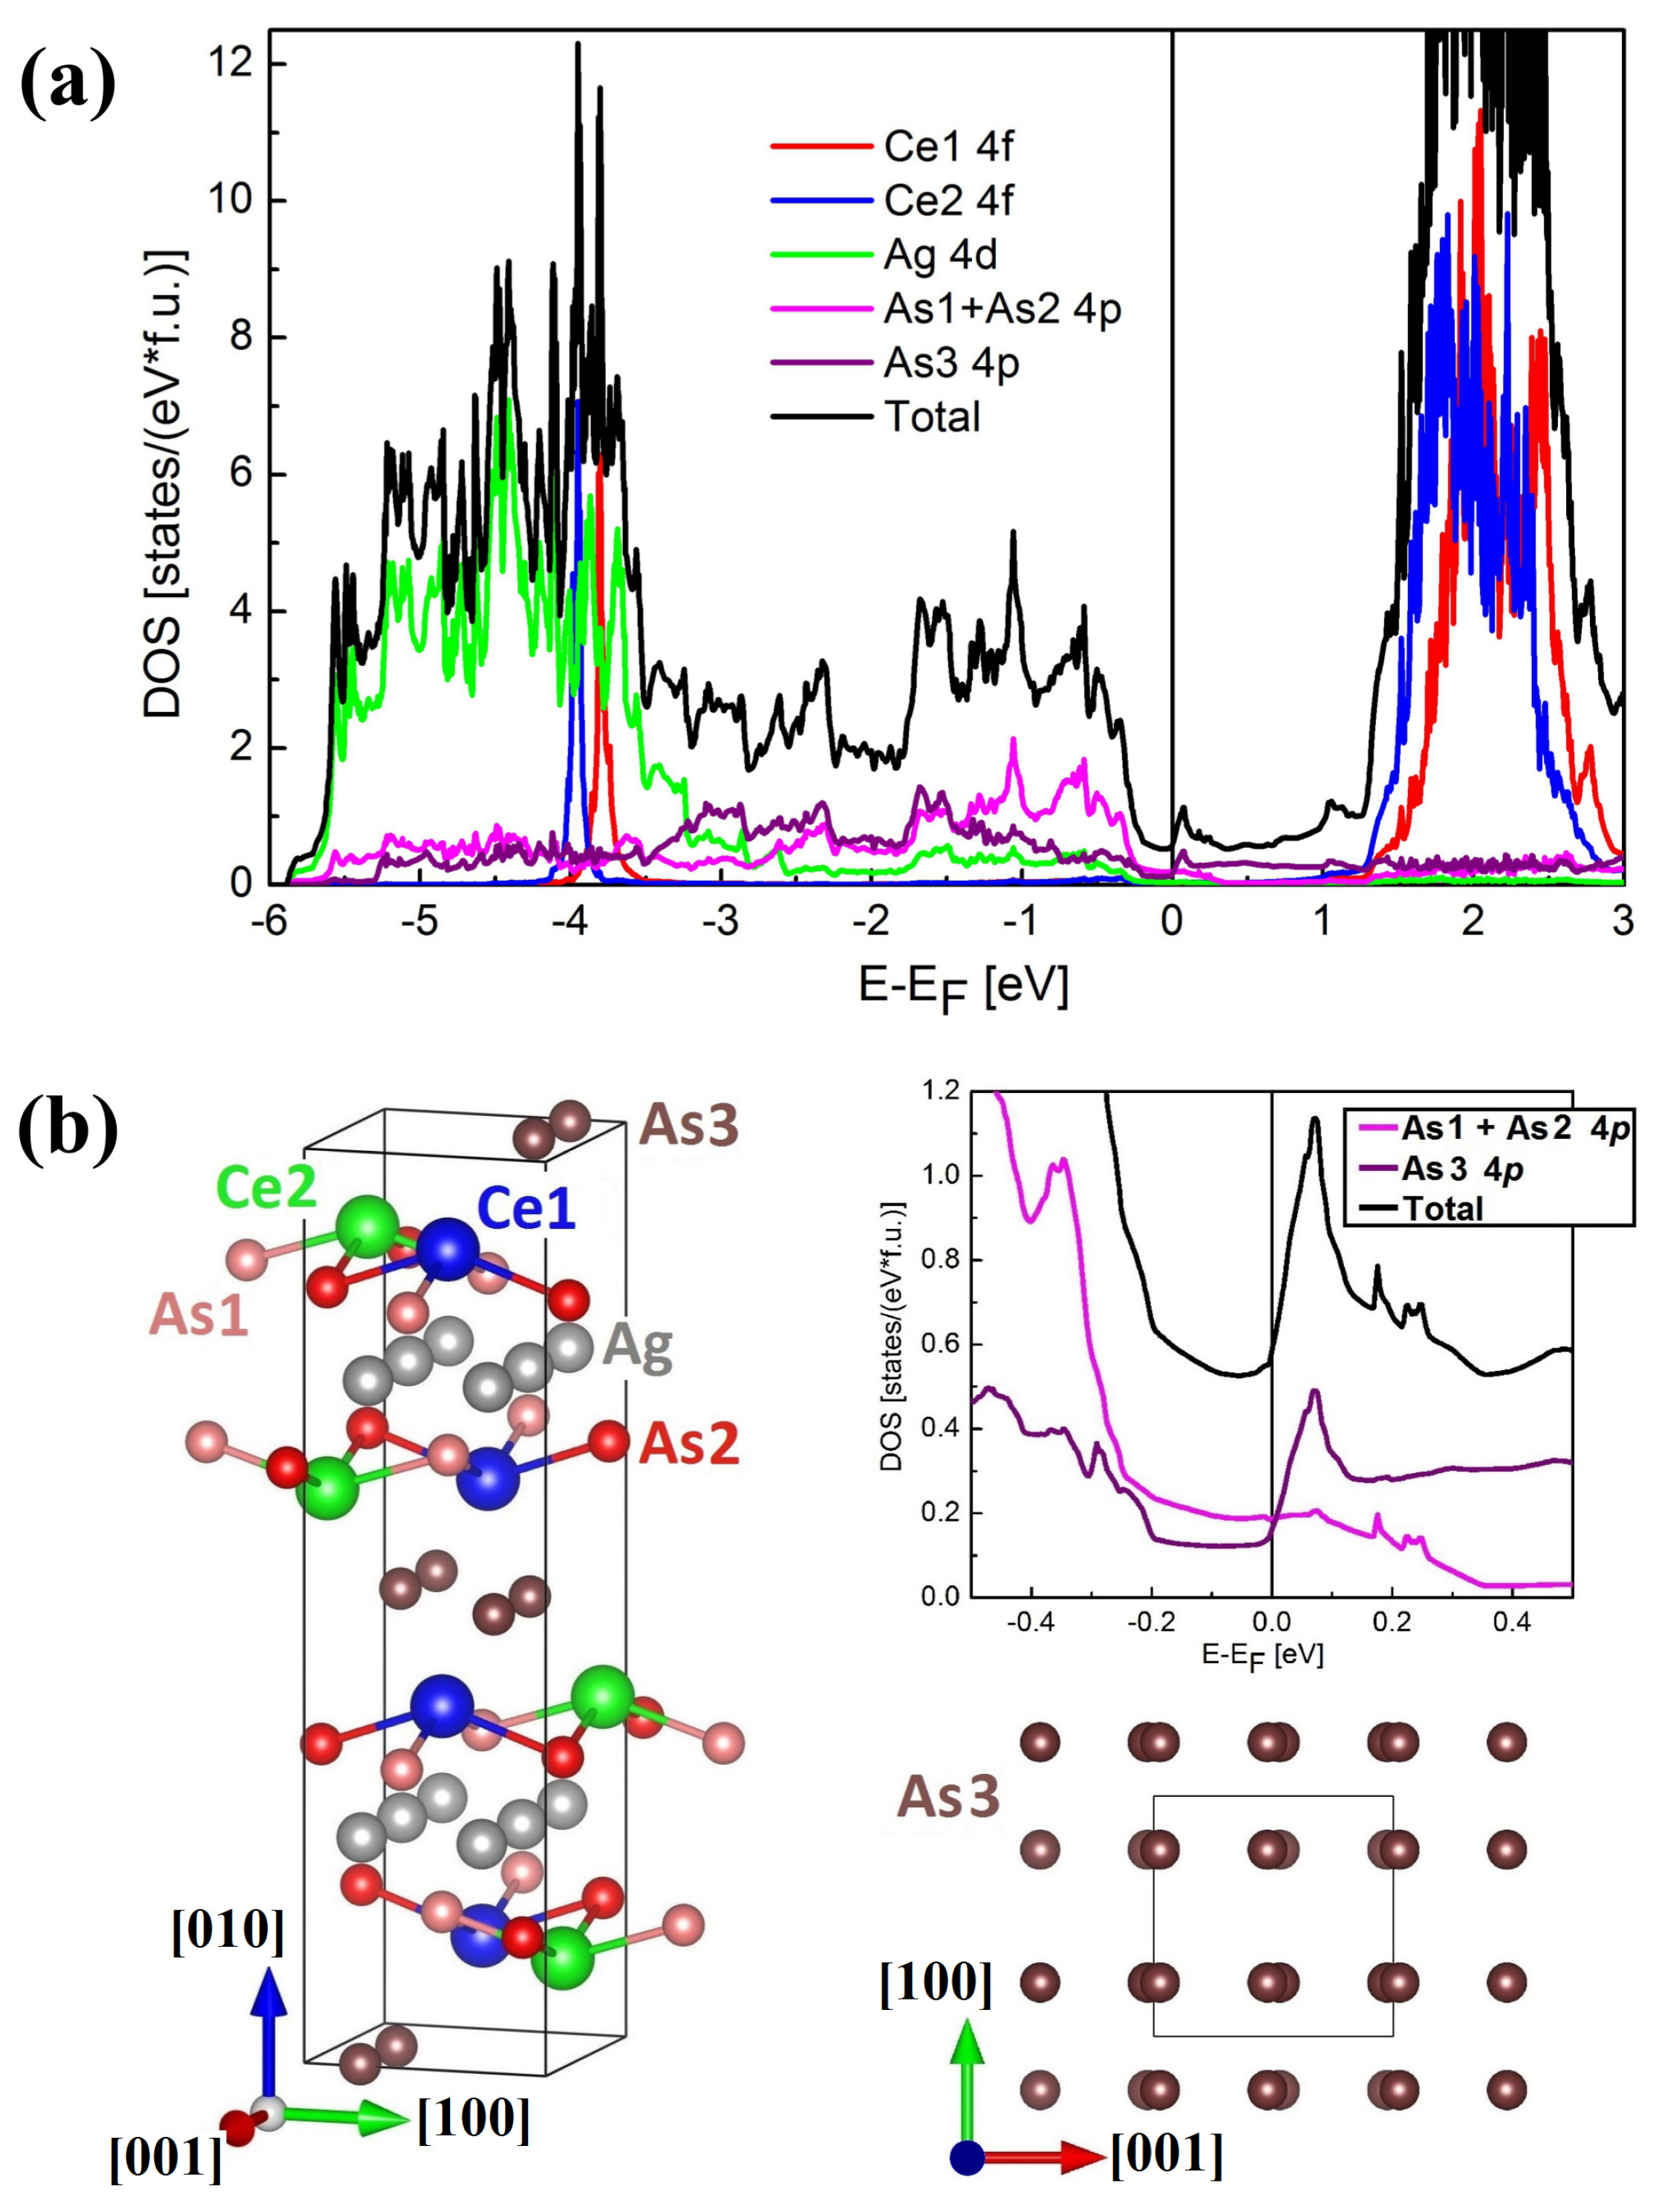
The total density of states (DOS) (see Figure 15) has rather a low value at E F ( N ( E F ) 0.6 states eV 1 f.u. 1 , where f.u. means the formula unit), which leads to the estimated value of the Sommerfeld coefficient γ calc 1.4 mJ K 2 mol 1 . This value is close to γ = 1.2 mJ K 2 mol 1 , determined experimentally for LaAgAs2 [12], while an order of magnitude smaller than the experimental value 50 mJ K 2 mol 1 determined for CeAgAs2 (see above). The latter value of γ indicates strong electron–electron correlations typical of moderate heavy-fermion behavior. The difficulty in reproducing in band calculations proper values of γ is well-known shortcoming of DFT methods applied to such systems (see, e.g., Ref. [32]). The additional Coulomb potential U is responsible for displacement of the positions of the Ce 4f states. The narrow peaks due to the 4f electrons, which are fairly well localized near 4 eV below E F are a source of the AFM order in CeAgAs2. It is worth noting that the two different sites of Ce atoms (labeled in Figure 15b as Ce1 and Ce2) show some small differences in the position of the 4f DOS peaks being about 150 meV. However, the intensities of the two peaks are almost the same. Similar location of the 4 f states below E F was observed for other magnetic Ce-based compounds [33,34]. Despite the metallic character of the electronic structure of CeAgAs2, the reduction of DOS around E F is significant, alike in other RETAs 2 phases [10,35,36]. That feature can be a reason for the semiconducting-like behavior of CeAgAs2 as well as few similar arsenides with the cis-trans distortions in As3 layers [10,35]. Principally, DOS at E F consists of the As 4p contributions like in other RETX2 compounds [28,30,37]. However, the 4p contributions originating from As1 and As2 are comparable to each other and their sum is very similar to that of the As3 atomic sites at E F . Meanwhile, in other RETX 2 compounds the contributions of the quasi-2D square nets of pnictogen atoms (without distortions) are dominating in total DOS near E F . The Ag 4d electrons contribute to total DOS in the range from −6 eV to about −3 eV below E F , wherein both Ag atoms yield very similar shape of DOS, hence it is presented here as a sum.
In the band calculation performed for CeAgAs2, an antiferromagnetic arrangement (+ - - +) of ferromagnetically ordered Ce atom layers was assumed, as determined from the neutron diffraction data [11]. The suitable magnetic supercell contained four nonequivalent Ce positions (twice more than those in the non-magnetic unit cell) with sufficiently large initial values of magnetic moments. By minimizing the total energy of such a magnetic supercell in the self-consistent field calculation the following values of the magnetic moments were obtained: +1.0142, +1.0135 and −1.0142, −1.0135 μ B per nonequivalent Ce site in two adjacent planes, respectively. The Ce moment of about 1.01 μ B is in accord with the results of the magnetization measurements (see above) and the neutron diffraction experiment [11].
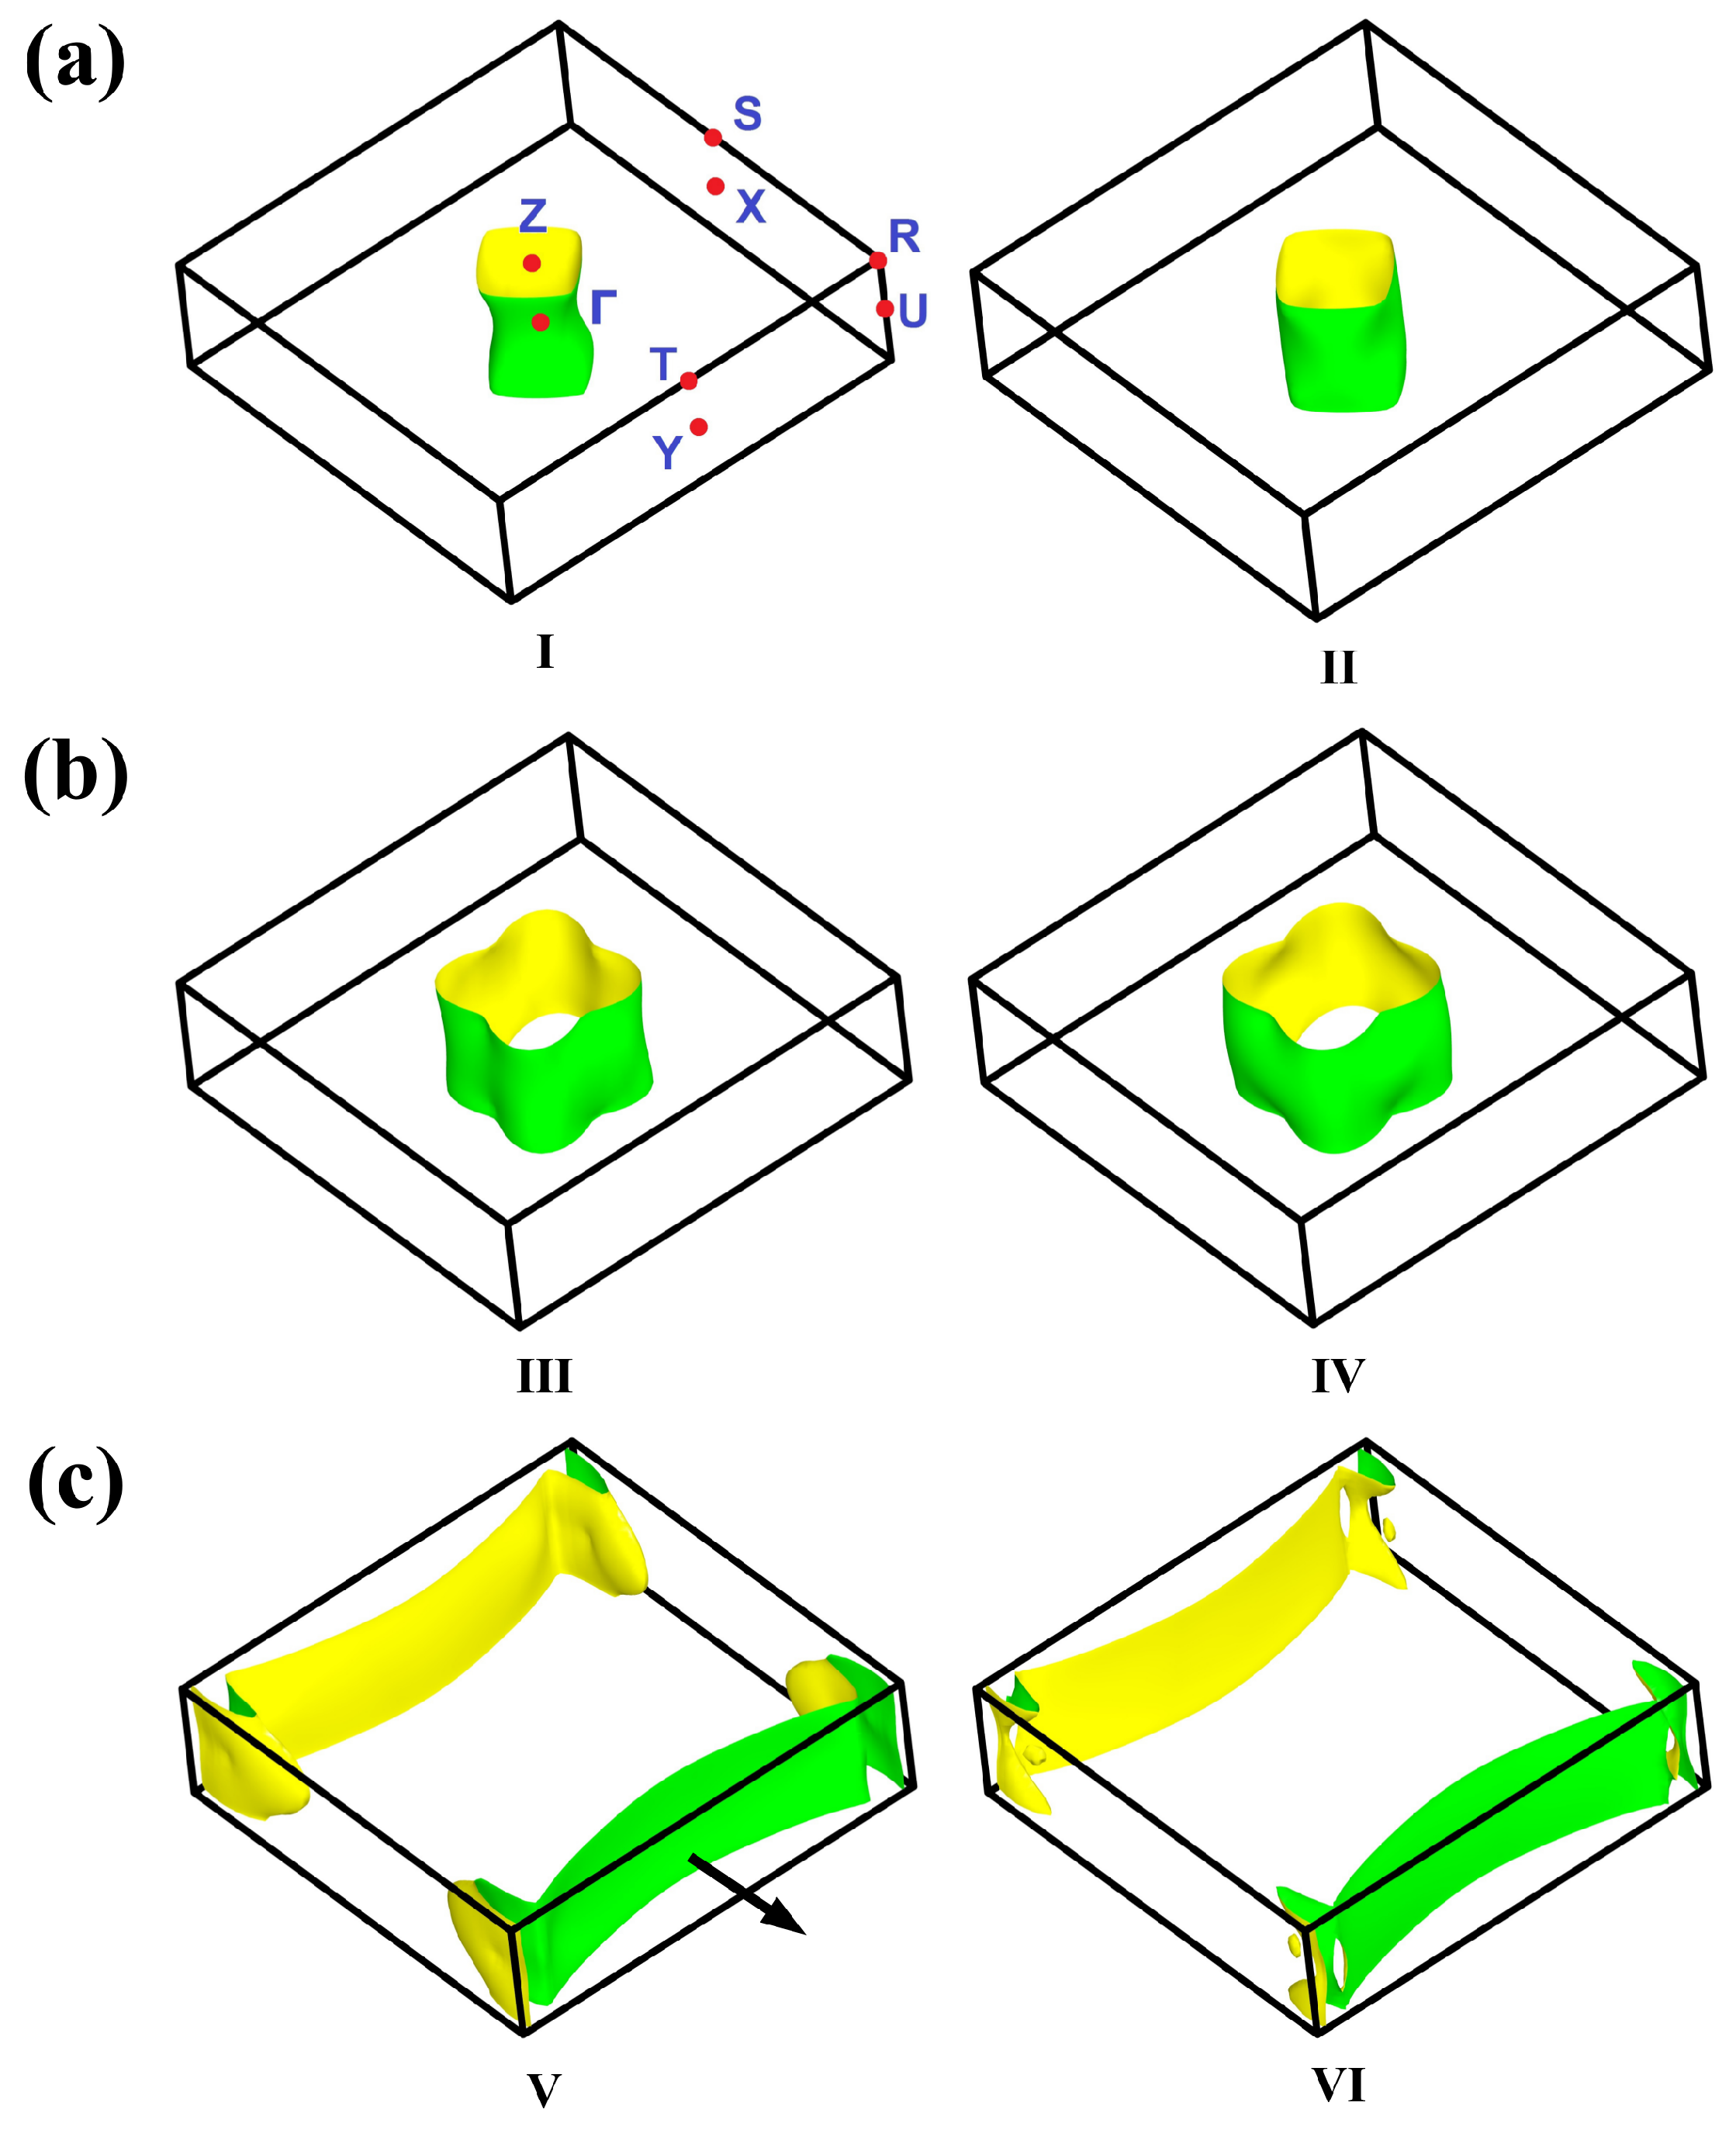
As clearly apparent from Figure 16, the three FS sheets in CeAgAs2, possess a quasi-2D character in concert with the strong anisotropy of the physical properties of the compound. The 4-fold symmetry of the cylindrical sheets, characteristic of the tetragonal RETX2 compounds [39,40] is approximately preserved (see Figure 16a,b), despite the small orthorhombic distortion present in CeAgAs2, and this finding supports the afore-made simplifications in the CEF analysis of the magnetic data of the compound (see above). Remarkably the two FS sheets displayed in Figure 16c exhibit apparent breaking of the 4-fold rotational symmetry into a two-fold one (nematic-like transition). The FS sheets labeled V and VI present discontinuity in the k z ( Γ Y) direction in BZ possessing quasi-1D character, which can be explained by an existence of the trans-cis distortion of the As3 atomic nets along the [001] axis. This type of Peierls-like transition usually leads to opening energy gap in the electronic band structure along the axis of distortion. As reflected in orbital characters of the electronic bands visualized in Figure 14b those forming FS V and FS VI sheets originate entirely from the As3 4p states (note the green band weights along the Γ X and Γ Y lines).

3. Discussion and Conclusions

Single crystals of CeAgAs2, grown using chemical vapor transport method, were found to crystallize with an orthorhombic structure, which is derivative of the tetragonal HfCuSi 2 -type structure. The obtained crystals were twinned due to small difference between the a and c lattice parameters of their pseudo-tetragonal unit cell.
The physical properties measurements corroborated that CeAgAs2 orders antiferromagnetically at low temperatures. The antiferromagnetic ordering manifests itself as a maximum in the magnetic susceptibility, a λ -like anomaly in the specific heat, and a distinct maximum in the electrical resistivity. At odds with the recent literature data [12], a single antiferromagnetic phase transition at T N = 4.9 K was found. At T = 1.72 K, the compound exhibits a metamagnetic transformation in a magnetic field of 0.5 T oriented perpendicular to [010] axis of the orthorhombic unit cell. This transition gives rise to distinct features in the low-temperature field dependencies of the magnetization and the magnetoresistance. Furthermore, in magnetic fields stronger than 0.5 T, the temperature variations of the heat capacity and the electrical resistivity distinctly change their character. The saturated magnetic moment is equal to 1 μ B , in good agreement with the neutron diffraction data [11], as well as the results of band structure calculations performed with the Coulomb parameter U = 6 eV.
The band structure calculations showed that Fermi surface sheets in CeAgAs2 have strongly quasi-2D character. The total density of states at the Fermi energy is rather low. The Sommerfeld coefficient calculated within the free-electron formula has a value similar to that of the non-magnetic reference compound LaAgAs2. Remarkably, the reduced density of states at the Fermi level brings about an activation-like behavior of the electrical resistivity at low temperatures [21,22]. In parallel, the electrical transport in CeAgAs2 is governed at the lowest temperatures by quantum corrections occurring due to crystal structure imperfections.

4. Materials and Methods

Single crystals of CeAgAs2 were synthesized using chemical vapor transport method with iodine as a transport agent, as described elsewhere [9]. The obtained crystals had a form of thin platelets with linear dimensions up to 2 mm with their large face perpendicular to the crystallographic direction [010]. The crystal structure was investigated at room temperature on an Oxford Diffraction four-circle diffractometer equipped with a CCD camera (MoK α radiation λ = 0.7107 Å). The crystal structure was solved and refined from x-ray diffraction (XRD) data employing the SHELXL program [41] (own structure type, being a HfCuSi2 derivative, space group Pbcm, lattice parameters a = 5.7797(2) Å, b = 21.0418(6) Å, c = 5.7682(2) Å).
Dc magnetic measurements were performed within the temperature interval 1.72–400 K and in magnetic fields up to 5 T using a Quantum Design MPMS-5 superconducting quantum interference device (SQUID) magnetometer. The crystal was mounted on an acrylic glass support. Due to small mass of crystals, first the magnetization of the support was measured and then this contribution was subtracted from the total SQUID response. The heat capacity was measured from 0.4 to 100 K and in magnetic fields up to 9 T employing a relaxation technique. Electrical transport measurements were made in the temperature range 50 mK–300 K and in magnetic fields up to 9 T using a standard ac four-probe method. The heat capacity and electrical resistivity experiments were carried out using a Quantum Design PPMS-9 platform.
Band structure calculations were performed with the full-potential local-orbital (FPLO-14) code within density functional theory (DFT) [42]. The Perdew–Wang parameterization (PW92) [43] of the local spin density approximation (LSDA) was used in scalar relativistic mode. The experimentally determined lattice parameters and atomic positions (see Section 2.1) and the AFM ground state obtained in the neutron diffraction measurements [11] with the magnetic moments arrangement along the [100] axis were assumed. In addition, a Coulomb repulsion potential U = 6 eV in the LSDA+U approach [44] for two different Ce sites was applied. Sets of the valence basis were automatically selected by the internal procedure of FPLO-14. Total energy values were converged with accuracy to 1 meV for the 12 × 12 × 12 k-point mesh, corresponding to 588 k-points in the irreducible part of the orthorhombic Brillouin zone (BZ). The Fermi surface (FS) sheets were calculated for a much denser grid of 27720 k-points.

Author Contributions

M.S. (Marcus Schmidt) and Y.G. prepared single crystals. M.S. (Maria Szlawska), D.G. and D.K. conceived the experiments and analyzed their results. M.J.W., P.R. and M.S.-C. carried out the electronic structure calculations and interpreted their results. All authors reviewed the manuscript. All authors have read and agreed to the published version of the manuscript.

Funding

The FPLO-14 calculations have been carried out using resources provided by Wrocław Centre for Networking and Supercomputing (http://wcss.pl), grant No. 477.

Acknowledgments

The authors are grateful to D. Kowalska for x-ray diffraction measurements and for U. Burkhardt for EDX measurements.

Conflicts of Interest

The authors declare no conflict of interest.

References

  1. Balicas, L.; Nakatsuji, S.; Lee, H.; Schlottmann, P.; Murphy, T.P.; Fisk, Z. Magnetic field-tuned quantum critical point in CeAuSb2. Phys. Rev. B 2005, 72, 64422. [Google Scholar] [CrossRef] [Green Version]
  2. Sengupta, K.; Sampathkumaran, E.V.; Nakano, T.; Hedo, M.; Abliz, M.; Fujiwara, N.; Uwatoko, Y.; Rayaprol, S.; Shigetoh, K.; Takabatake, T.; et al. Magnetic, electrical resistivity, heat-capacity, and thermopower anomalies in CeCuAs2. Phys. Rev. B 2004, 70, 64406. [Google Scholar] [CrossRef] [Green Version]
  3. André, G.; Bourée, F.; Kolenda, M.; Leśniewska, B.; Oleś, A.; Szytuła, A. Magnetic structures of RAgSb2 compounds. Physica B 2000, 292, 176. [Google Scholar] [CrossRef]
  4. Thamizhavel, A.; Takeuchi, T.; Okubo, T.; Yamada, M.; Asai, R.; Kirita, S.; Galatanu, A.; Yamamoto, E.; Ebihara, T.; Inada, Y.; et al. Anisotropic electrical and magnetic properties of CeTSb2 (T = Cu, Au, and Ni) single crystals. Phys. Rev. B 2003, 68, 54427. [Google Scholar] [CrossRef]
  5. Thamizhavel, A.; Galatanu, A.; Yamamoto, E.; Okubo, T.; Yamada, M.; Tabata, K.; Kobayashi, C.T.; Nakamura, N.; Sugiyama, K.; Kindo, K.; et al. Low Temperature Magnetic Properties of CeTBi2 (T: Ni, Cu and Ag) Single Crystals. J. Phys. Soc. Jpn. 2003, 72, 2632. [Google Scholar] [CrossRef]
  6. Szlawska, M.; Kaczorowski, D. Intriguing magnetic and electrical transport behavior in novel CeTAs2 (T=Cu, Ag, Au) compounds. J. Alloys Compd. 2008, 451, 464. [Google Scholar] [CrossRef]
  7. Demchyna, R.O.; Kuz’ma, Y.B.; Babizhetsky, V.S. New arsenides LnAgAs2 (Ln=La, Ce, Pr, Nd, Sm, Gd, Tb, Dy) and their crystal structure. J. Alloys. Compd. 2001, 315, 158. [Google Scholar] [CrossRef]
  8. Eschen, M.; Jeitschko, W. Preparation and Crystal Structures of Ternary Rare Earth Silver and Gold Arsenides LnAgAs2 and LnAuAs2 with Ln = La-Nd, Sm, Gd, and Tb. Z. Naturforsch. 2003, 58, 399–409. [Google Scholar] [CrossRef]
  9. Demchyna, R.; Jemetio, J.P.F.; Prots, Y.; Doert, T.; Akselrud, L.G.; Schnelle, W.; Kuz’ma, Y.; Grin, Y. CeAgAs2—A New Derivative of the HfCuSi2 Type of Structure: Synthesis, Crystal Structure and Magnetic Properties. Z. Anorg. Allg. Chem. 2004, 630, 635. [Google Scholar] [CrossRef]
  10. Rutzinger, D.; Bartsch, C.; Doerr, M.; Rosner, H.; Neu, V.; Doert, T.; Ruck, M. Lattice distortions in layered type arsenides LnTAs2 (Ln=La-Nd, Sm, Gd, Tb; T=Ag, Au): Crystal structures, electronic and magnetic properties. J. Solid State Chem. 2010, 183, 510. [Google Scholar] [CrossRef]
  11. Doert, T.; Schneidewind, A.; Hölzel, M.; Stockert, O.; Rutzinger, D.; Ruck, M. Neutron scattering study on CeAgAs2. J. Magn. Magn. Mater. 2012, 324, 1157. [Google Scholar] [CrossRef]
  12. Mondal, R.; Bapat, R.; Dhar, S.K.; Thamizhavel, A. Magnetocrystalline anisotropy in the Kondo-lattice compound CeAgAs2. Phys. Rev. B 2018, 98, 115160. [Google Scholar] [CrossRef] [Green Version]
  13. Fisher, M.E. Relation between the specific heat and susceptibility of an antiferromagnet. Philos. Mag. 1962, 7, 1731. [Google Scholar] [CrossRef]
  14. Akhiezer, A.I.; Bar’yakhtar, V.G.; Kaganov, M.I. Spin Waves in Ferromagnets and Antiferromagnets. Sov. Phys. Uspekhi 1961, 3, 567. [Google Scholar] [CrossRef]
  15. Gondek, Ł.; Szytuła, A.; Bałanda, M.; Warkocki, W.; Szewczyk, A.; Gutowska, M. Magnetic phase transitions in TbAuIn compound. Solid State Commun. 2005, 136, 26. [Google Scholar] [CrossRef]
  16. Schotte, K.D.; Schotte, U. Interpretation of Kondo experiments in a magnetic field. Phys. Lett. A 1975, 55, 38. [Google Scholar] [CrossRef]
  17. Bredl, C.D.; Steglich, F.; Schotte, K.D. Specific heat of concentrated kondo systems: (La, Ce)Al2 and CeAl2. Z. Phys. B 1978, 29, 327. [Google Scholar] [CrossRef]
  18. Blanco, J.A.; de Podesta, M.; Espeso, J.I.; Sal, J.C.G.; Lester, C.; McEven, K.A.; Patrikios, N.; Fernandez, J.R. Specific heat of CeNixPt1-x pseudobinary compounds and related dilute alloys. Phys. Rev. B 1994, 49, 15126. [Google Scholar] [CrossRef]
  19. Yashima, H.; Mori, H.; Sato, N.; Satoh, T.; Kohn, K. Magnetic and nonmagnetic behavior of the Ce-Si system. J. Magn. Magn. Mater. 1983, 31, 411. [Google Scholar] [CrossRef]
  20. Cornut, B.; Coqblin, B. Influence of the Crystalline Field on the Kondo Effect of Alloys and Compounds with Cerium Impurities. Phys. Rev. B 1972, 5, 4541. [Google Scholar] [CrossRef]
  21. Mott, N.F. Conduction in glasses containing transition metal ions. J. Non-Cryst. Solids 1968, 1, 1. [Google Scholar] [CrossRef]
  22. Efros, A.L.; Shklovskii, B.I. Coulomb gap and low temperature conductivity of disordered systems. J. Phys. C Solid State Phys. 1975, 8, L49. [Google Scholar] [CrossRef]
  23. Schlottmann, P. Some exact results for dilute mixed-valent and heavy-fermion systems. Phys. Rep. 1989, 181, 1. [Google Scholar] [CrossRef]
  24. Altshuler, B.L.; Aronov, A.G. Contribution to the theory of disordered metals in strongly doped semiconductors. Sov. Phys. JETP 1979, 50, 968. [Google Scholar]
  25. Altshuler, B.L.; Aronov, A.G. Electron-Electron Interactions in Disordered Systems; Elsevier: Amsterdam, The Netherland, 1985. [Google Scholar]
  26. Isawa, Y.; Fukuyama, H. Higher order interaction effects in wekly localized regime: Case of repulsive force. J. Phys. Soc. Jpn. 1984, 53, 1415. [Google Scholar] [CrossRef]
  27. Muttalib, K.A.; Wölfle, P. Quantum corrections to the conductivity of itinerant antiferromagnets. Phys. Rev. B 2015, 91, 144410. [Google Scholar] [CrossRef] [Green Version]
  28. Ruszała, P.; Winiarski, M.J.; Samsel-Czekała, M. Dirac-like band structure of LaTESb2 (TE = Ni, Cu and Pd) superconductors by DFT calculations. Comput. Mater. Sci. 2018, 154, 106. [Google Scholar] [CrossRef]
  29. Farhan, M.A.; Lee, G.; Shim, J.H. AEMnSb2 (AE = Sr, Ba): A new class of Dirac materials. J. Phys. Condens. Matter 2014, 26, 42201. [Google Scholar] [CrossRef]
  30. Wang, K.; Graf, D.; Petrovic, C. Quasi-two-dimensional Dirac fermions and quantum magnetoresistance in LaAgBi2. Phys. Rev. B 2013, 87, 235101. [Google Scholar] [CrossRef] [Green Version]
  31. Guo, Y.F.; Princep, A.J.; Zhang, X.; Manuel, P.; Khalyavin, D.; Mazin, I.I.; Shi, Y.G.; Boothroyd, A.T. Coupling of magnetic order to planar Bi electrons in the anisotropic Dirac metals AMnBi2 (A = Sr, Ca). Phys. Rev. B 2014, 90, 75120. [Google Scholar] [CrossRef] [Green Version]
  32. Kotliar, G.; Vollhardt, D. Strongly Correlated Materials: Insights From Dynamical Mean-Field Theory. Phys. Today 2004, 57, 53. [Google Scholar] [CrossRef]
  33. Majid, A.; Azmat, M.; Rana, U.A.; Khan, S.U.D.; Alzahrani, E. A computational study of magnetic exchange interactions of 3d and 4f electrons in Ti-Ce co-doped AlN. Mater. Chem. Phys. 2016, 179, 316. [Google Scholar] [CrossRef]
  34. Cheng, H.X.; Hu, Y.W.; Wang, X.X.; Zhang, G.H.; An, Z.W.; Zhang, Z.F.; Zhang, B.; Zhou, T.; Qian, P.; Liu, Y.; et al. The phase stability, magnetic and vibrational properties of A2Ni21B6 (A=Th, U) and Ce3Pd20Si6. Comput. Phys. Commun. 2015, 193, 72. [Google Scholar] [CrossRef]
  35. Stoyko, S.S.; Mar, A. Ternary rare-earth zinc arsenides REZn1-xAs2 RE = La–Nd, Sm). J. Solid State Chem. 2011, 184, 2360. [Google Scholar] [CrossRef]
  36. Ramachandran, K.K.; Genet, C.; Mar, A. Quaternary rare-earth arsenides REAg1-xZnyAs2 (RE = La–Nd, Sm, Gd–Dy) with tetragonal SrZnBi2- and HfCuSi2-type structures. J. Solid State Chem. 2015, 231, 204. [Google Scholar] [CrossRef]
  37. Wang, K.; Petrovic, C. Multiband effects and possible Dirac states in LaAgSb2. Phys. Rev. B 2012, 86, 155213. [Google Scholar] [CrossRef] [Green Version]
  38. Momma, K.; Izumi, F. VESTA 3 for three-dimensional visualization of crystal, volumetric and morphology data. J. Appl. Crystallogr. 2011, 44, 1272. [Google Scholar] [CrossRef]
  39. Hase, I.; Yanagisawa, T. Electronic band calculation of LaTSb2 (T=Cu,Ag,Au). Phys. Procedia 2014, 58, 42. [Google Scholar] [CrossRef] [Green Version]
  40. Arakane, T.; Sato, T.; Souma, S.; Takahashi, T.; Watanabe, Y.; Inada, Y. Electronic structure of LaAgSb2 and CeAgSb2 studied by high-resolution angle-resolved photoemission spectroscopy. J. Magn. Magn. Mater. 2007, 310, 396. [Google Scholar] [CrossRef]
  41. Sheldrick, G.M. A short history of SHELX. Acta Crystallogr. A 2008, 64, 112. [Google Scholar] [CrossRef] [Green Version]
  42. Koepernik, K.; Eschrig, H. Full-potential nonorthogonal local-orbital minimum-basis band-structure scheme. Phys. Rev. B 1999, 59, 1743. [Google Scholar] [CrossRef]
  43. Perdew, J.P.; Wang, Y. Accurate and simple analytic representation of the electron-gas correlation energy. Phys. Rev. B 1992, 45, 13244. [Google Scholar] [CrossRef] [PubMed]
  44. Eschrig, H.; Koepernik, K.; Chaplygin, I. Density functional application to strongly correlated electron systems. J. Solid State Chem. 2003, 176, 482. [Google Scholar] [CrossRef] [Green Version]
Figure 1. Temperature dependencies of the reciprocal magnetic susceptibility of single-crystalline CeAgAs2, measured at constant field oriented parallel and perpendicular to [010] direction. The solid lines represent the fits of the Curie–Weiss law to the experimental data, respectively.
Materials 13 03865 g001
Figure 2. Temperature dependencies of the molar magnetic susceptibility of single crystalline CeAgAs2 measured in a magnetic field of different magnitude oriented perpendicular to the crystallographic [010] axis and in a field of 0.1 T applied parallel to the [010] axis.
Materials 13 03865 g002
Figure 3. Field dependencies of the magnetization of single-crystalline CeAgAs2 measured at 1.72 K in magnetic field oriented along and perpendicular to [010].
Materials 13 03865 g003
Figure 4. Low temperature specific heat data of single-crystalline CeAgAs2 measured in zero field and in several finite magnetic fields applied within the (010) plane of the orthorhombic unit cell.
Materials 13 03865 g004
Figure 5. Zero-field low-temperature dependence of the magnetic contribution to the specific heat of CeAgAs2. Solid line represents the function described in the text. The left-hand side inset presents the C / T v s T 2 dependence. The right-hand side inset visualizes the methods used to estimate the Kondo temperature (see the text).
Materials 13 03865 g005
Figure 6. Electrical resistivity ρ ( T ) of single-crystalline CeAgAs2 measured within the crystallographic (010) plane. The insets present the low-temperature data highlighting the maximum of the resistivity at T N (left-hand side) and the minimum at T min 2 (right-hand side).
Materials 13 03865 g006
Figure 7. Different scaling relations of the resistivity data of CeAgAs2, measured in the range 5.5–20 K as described in the caption of Figure 6, appropriate for (a) incoherent Kondo scattering, (b) semiconducting activation of charge carriers across energy gap, (c) variable range hopping of electrons between localized in-gap states. Solid line represents the function ρ ( T ) = ρ H exp [ ( T H / T ) x ] with x = 1 / 3 .
Materials 13 03865 g007
Figure 8. Low-temperature dependencies of the electrical resistivity of single-crystalline CeAgAs2 measured with electric current flowing in the orthorhombic (010) plane and magnetic field of different strength applied perpendicular to it yet confined in the same plane.
Materials 13 03865 g008
Figure 9. Transverse magnetoresistance isotherms of single crystalline CeAgAs2 measured with j [ 010 ] and H [ 010 ] in the AFM state (upper panel) and the paramagnetic state (lower panel).
Materials 13 03865 g009
Figure 10. Single-ion Kondo scaling of the transverse magnetoresistance of single crystalline CeAgAs2 measured with j [ 010 ] and H [ 010 ] .
Materials 13 03865 g010
Figure 11. (a) Temperature dependence of the resistivity of CeAgAs2 measured in the vicinity of T N in different magnetic fields. (b) Néel temperature as a function of magnetic field.
Materials 13 03865 g011
Figure 12. (a) The transverse magnetoresistance of CeAgAs2 measured as a function of magnetic field in the temperature intervals 2–10 K, and (b) 15–100 K (right-hand-side panel).
Materials 13 03865 g012
Figure 13. Temperature dependence of the relative resistivity of CeAgAs2 measured in different magnetic fields in the temperature interval 0.05–4 K. The solid and dashed lines represent ρ = ρ 0 A C T 1 / 2 A SW T and ρ = ρ 0 9 T A C 9 T T 1 / 2 fitting functions, respectively.
Materials 13 03865 g013
Figure 14. (a) The LSDA+U (local spin density approximation) (U = 6 eV) electronic band structure of the AFM (antiferromagnetic) ground state of CeAgAs2 along high-symmetry lines in the orthorhombic BZ (Brillouin zone). (b) The corresponding As 4p orbital contributions to the electronic bands (band weights) originating from different As sites in the vicinity of E F (zero energy).
Materials 13 03865 g014
Figure 15. (a) Total and partial electronic densities of states calculated for CeAgAs2 in the LSDA+U (U = 6 eV) approach with the AFM ordering along the [100] axis. (b) Left panel: unit cell of CeAgAs2; right panel: enlarged DOS (density of states) in the vicinity of E F and the sketch of quasi-2D nets of the As atoms (As3 sites) with visible distortion from the ideal square-like shape. The structural figures were obtained using the VESTA program [38].
Materials 13 03865 g015
Figure 16. Fermi surface sheets in the AFM (antiferromagnetic) state of CeAgAs2 calculated within the LSDA+U (local spin density approximation) approach (U = 6 eV). The sheets of similar shapes (originated from the pairs of succeeding conduction bands numbered by increasing Roman numerals with increasing their energy) are displayed in panels (ac). High-symmetry points in the first BZ (Brillouin zone) are highlighted in panel (a). The black thick arrow in panel (c) indicates the direction of the quantization axis [100] for the AFM ordering.
Materials 13 03865 g016
Table 1. Crystallographic and structure refinement data for CeAgAs2.
CompoundCeAgAs2
Space groupPbcm
a = 5.7797(2) Å
b = 21.0418(6) Å
Unit cell dimensionsc = 5.7682(2) Å
Volume701.50(4) Å 3
Formula weight397.83 g/mol
Calculated density7.53 g/cm 3
Absorption coefficient36.835 mm 1
θ range for data collection3.511°–37.353°
9 h 9
35 k 36
Ranges in hkl 9 l 9
Reflections collected/unique31905/1528
Completeness to θ = 36.23°99.9%
Refinement methodFull-matrix least-squares on F2
Refined parameters46
Goodness of fit on F 2 1.102
Final R indices [ I 2 σ ( I ) ]R1 = 0.0293, wR2 = 0.0593
R indices (all data)R1 = 0.041, wR2 = 0.0643
Extinction coefficient0.00093(4)
Largest diff. peak and hole3.776 and −2.016 e/Å 3
Table 2. Atomic coordinates and equivalent isotropic thermal displacement parameters for CeAgAs2. U e q is defined as one third of the trace of the orthogonalized U i j tensor. All atomic sites are fully occupied.
AtomSitexyz U eq ( 10 3 Å 2 )
Ce14d0.51183(8)0.61363(2)0.258(1)
Ce24d0.01274(8)0.88214(2)0.258(1)
Ag14c0.23826(10)0.250.512(1)
Ag24c0.73584(11)0.250.512(1)
As14d0.51271(13)0.83859(3)0.259(1)
As24d0.01242(13)0.66212(3)0.259(1)
As38e0.22338(10)0.00075(4)0.52628(10)13(1)
Table 3. Anisotropic thermal displacement parameters for the atoms in CeAgAs2 (in 10 3 Å 2 ). The anisotropic displacemant factor exponent takes the form: 2 π 2 h 2 a * 2 U 11 + + 2 h k a * b * U 12 .
U 11 U 22 U 33 U 12 U 23 U 13
Ce17(1)8(1)10(1)0.2(1)00
Ce27(1)8(1)10(1)0.3(1)00
Ag112(1)11(1)14(1)00.5(2)0
Ag211(1)11(1)14(1)00.9(2)0
As17(1)10(1)10(1)000
As27(1)10(1)10(1)000
As314(1)8(1)17(1)0.4(2)2(1)0.5(2)