1. Introduction
Corrugated materials and structures have been used in mechanical engineering for many years, their application may have various characters from webs for I-beam [
1] through very unique natural lattice sandwich structures [
2] to a more conventional function of supporting structures in the corrugated board packaging industry.
In recent years, corrugated board packaging has gained popularity in transport and logistics. The main reason for the increased interest in these products is the ever-growing e-commerce market. Internet sales naturally stimulate the market for transport services, which leads to increased demand for transport boxes. The economic and ecological aspects of this constantly increasing demand for corrugated packaging cannot be ignored. For effective recycling of wastepaper, many large production and trade companies use corrugated cardboard as a safe and environmentally friendly material for packaging their products. Effective recycling is one of the tools of the currently implemented sustainable development policies. In response to growing market requirements, the paper packaging industry constantly raises the standards of its packaging, not only as it relates to recycling but also for more effective use of materials (paperboard and corrugated cardboard).
Trading companies are interested in ensuring the quality of their products, which should be well-protected in attractive, recognizable, and branded packaging. However, companies that produce corrugated packaging aim for lightweight products to reduce production costs. This is why packaging made of corrugated board must often be attractive and light, but also stabile and resistant. Additionally, production cost should be low (through the use of recycled paper and/or optimal packaging) and good printability should be ensured (through a special layer of outer paper).
Unfortunately, printing on the cardboard reduces the strength of the packaging. If a digital printing technique is used, the degree of cardboard damage is minimal. However, when flexographic or offset techniques are used, the damage to the printed material is greater. Because digital printing technology today accounts for a minority of the printing in the global market, the majority of printed packaging is to a greater or lesser extent weakened by printing technology. This phenomenon occurs mainly due to pressure during printing, which causes damage to the corrugated layers, and in turn leads to a reduction in the bending stiffness and torsion stiffness of the corrugated board. As a consequence, the degraded rigidity directly reduces the strength of the packaging for both static and dynamic loads.
Therefore, manufacturers of corrugated board packaging should be able to determine to what extent the printing decreases the load capacity of the designed box. One way to do this is to estimate the load capacity of the packaging using analytical formulas, e.g., the popular McKee formula [
3]. Unfortunately, the analytical formulas do not include all the parameters that degrade during printing, namely the thickness, the transverse shear stiffness in the machine direction (MD), and the transverse shear stiffness in the cross direction (CD). Another possibility is to check the decrease in load capacity of the printed packaging by using the box compression test (BCT). Unfortunately, if the load capacity is checked after box production has started (a posteriori), and the decrease is found to be too large, it is often too late to correct the construction or change the cardboard quality. In this case, either production must stop and resume with a new design and production setup, or the risk of returns and costly complaints must be accepted.
In the literature, one can find some modifications of the McKee formula. Review of different formulas for box compression analysis and an improved approach were presented by Urbanik and Frank [
4]. Recently, Coffin examined the McKee formula modified by Urbanik and Frank for BCT using the box data coming from the original McKee’s work and the data of Batelka and Smith [
5]. Schaffrath et al. examined the influence of asymmetric properties of boxes on robustness of the McKee formula for prediction of box strength [
6]. However, torsional test and transverse stiffness of boxes are considered very rarely in the literature.
An alternative method that has recently become more popular is load capacity prediction based on numerical methods, which requires the definition of cardboard properties. These properties can be obtained through adequate laboratory testing [
7,
8], and include transverse shear stiffness in the MD (
modulus) and the CD (
modulus). Determining these parameters, although not complicated, is unfortunately rarely done. Knowing these parameters, especially for material that is converted (after printing, etc.), allows for an assessment of the extent to which the material (corrugated cardboard) has been damaged [
9] and, consequently, the extent to which the strength of the final packaging has been reduced.
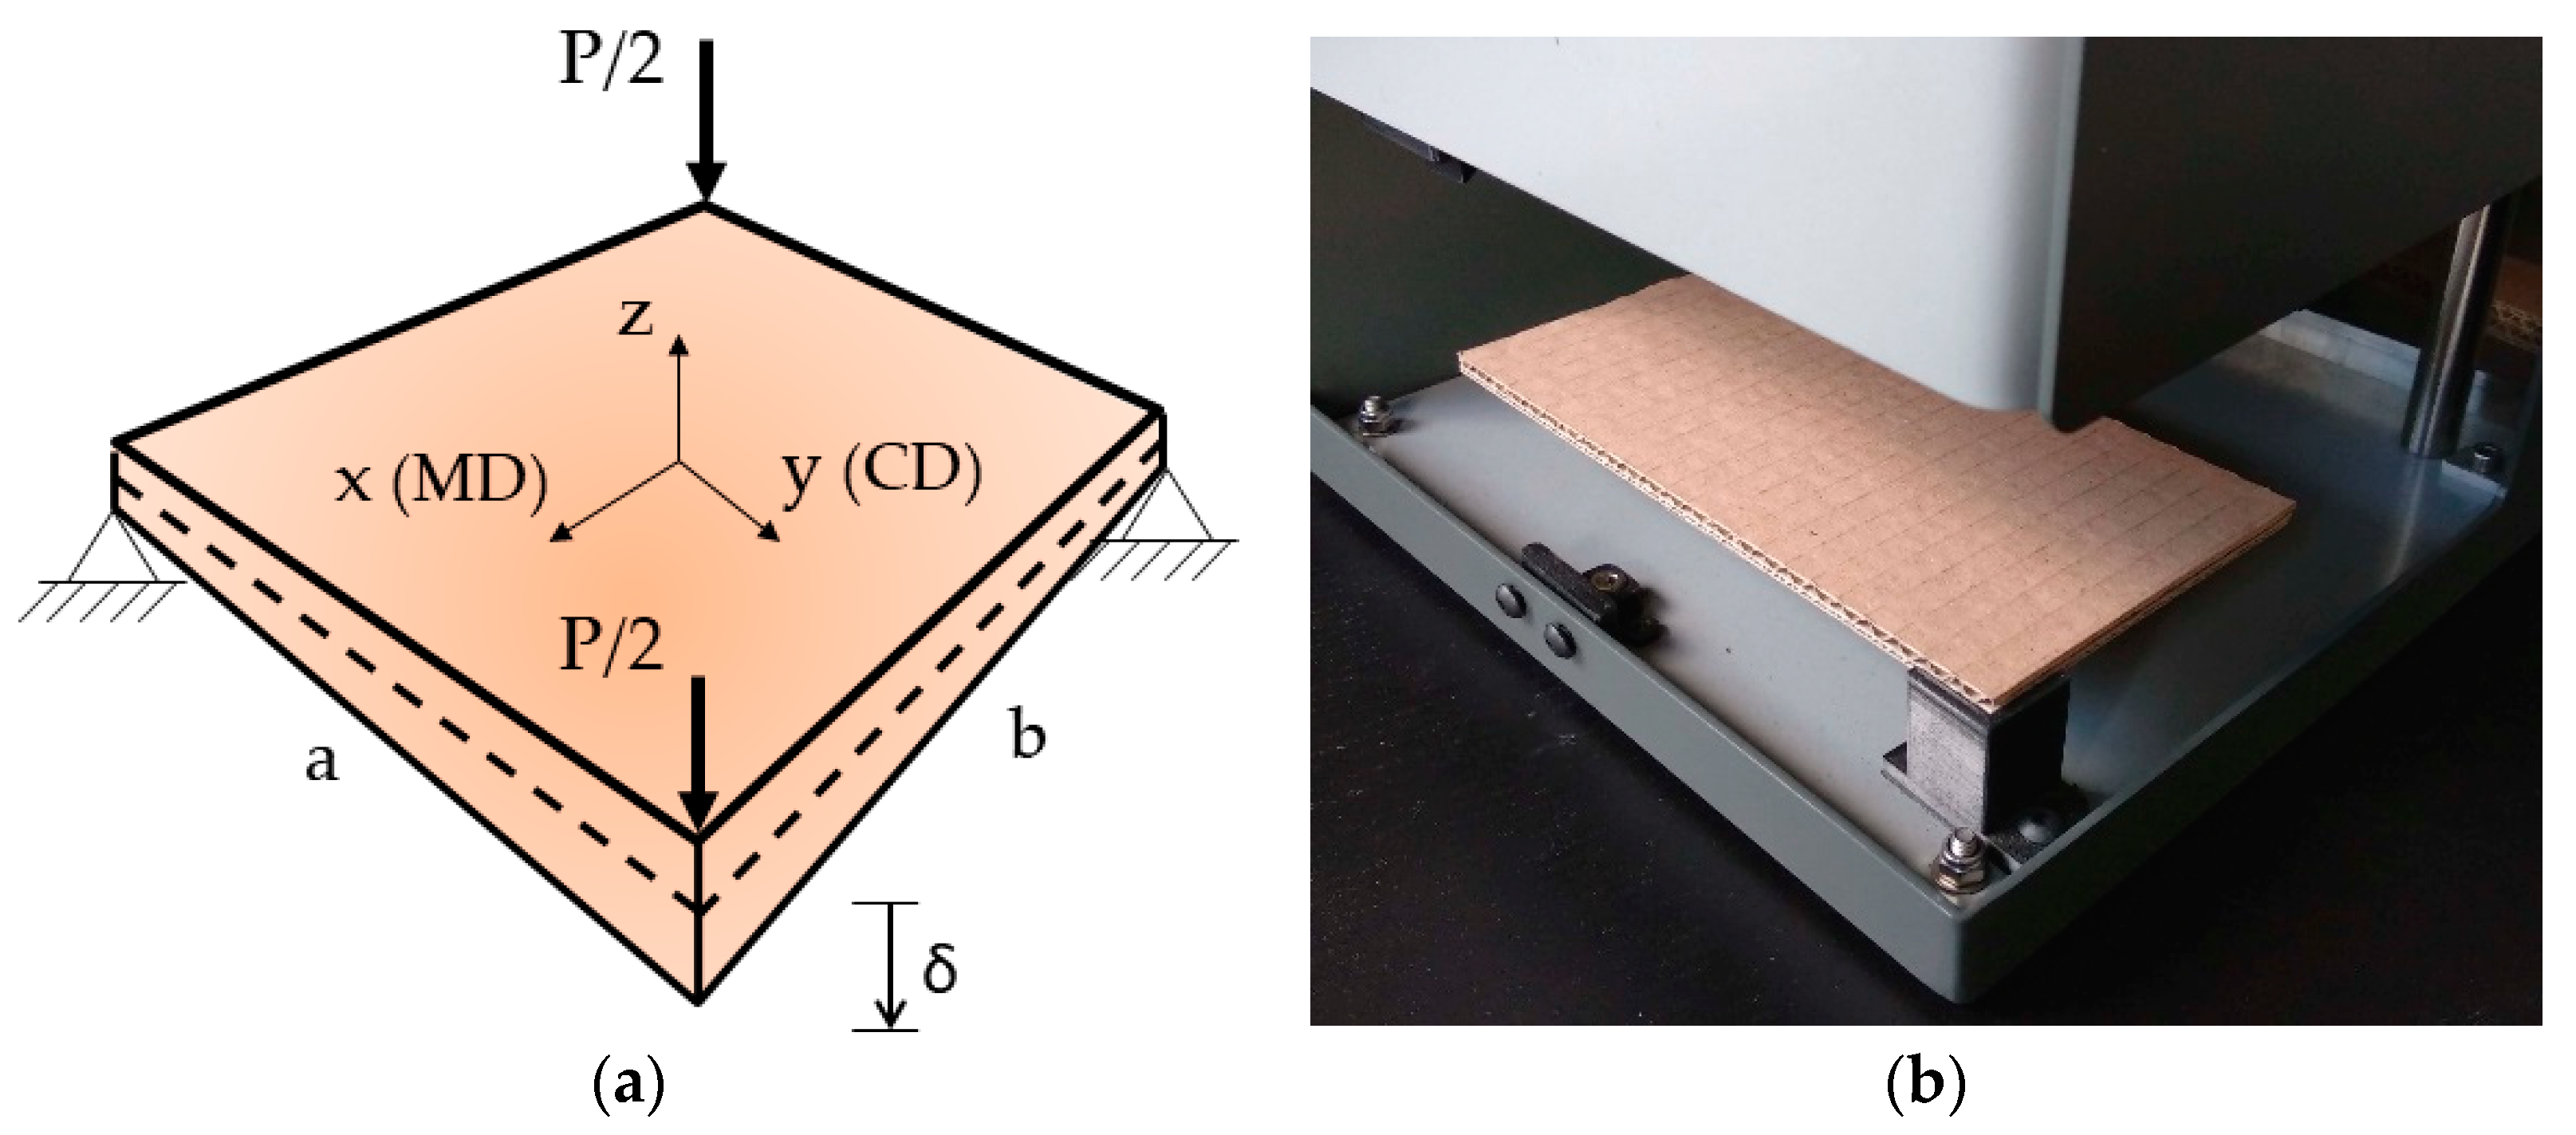
In this work, a method for calculating the transverse stiffness of corrugated cardboard based on modified plate torsion tests (
Figure 1) and analytical formulas is presented. There have been many attempts in the literature to determine and/or describe these properties [
10,
11,
12,
13,
14,
15,
16]. One of the classical studies on the subject is the work of Reissner [
17]. The approach presented in 1980 in his work regarding the prediction of torsional stiffness of beams and plates has become fundamental. Whitney, in his work from 1987 [
18], gathered knowledge about the shear deformation in laminated anisotropic plates. He concluded that the classical laminate plate theory (CLPT) was not sufficient to model the behavior of laminated plates. More recent work by Popil et al. [
19] deals with transverse shear measurement. The authors considered corrugated boards, and twisting stiffness in two directions; MD and CD, was introduced with the variables
and
, respectively. For
, the transverse shear modulus was considered in the sample dominant direction only. We prove that both transverse shear moduli are “active”, but the one in the non-dominant direction plays a minor role, however they should be included.
Recently, the Carlsson group made an important contribution to this research area, namely in studies by Avilés et al. [
20,
21,
22] and Hernandez-Perez et al. [
23,
24]. In their work from 2009, Avilés et al. [
20] compare the results from CLPT with the finite element method (FEM) for sandwich (soft-core) plates. The conclusion was that the classical theory was not sufficient for modeling a twist in such structures. In the work from 2011, Avilés et al. [
21] focused on experiments on the torsion and shear properties of sandwich panels and laminated composites. They made the first reference to a preliminary shear-corrected model, which was explicitly stated in the paper by Avilés et al. from 2012 [
22]. In addition, in 2012, Hernandez-Perez et al. [
23] studied the twist test in sandwich plates, comparing results based on first-order shear deformation (FOSD) theory and finite element computations. The applicability of the theory was evaluated as acceptable, but with some limitations. However, mainly soft-core structures were analyzed. In their 2014 study [
24], Hernandez-Perez et al. redirected their interest to the corrugated boards of single- and double-walled structures. It should be highlighted that for all numerical simulations of corrugated boards, including FEM calculations, the transverse shear moduli should be determined in an appropriate way [
25,
26]. In this study, experimental, structural FEM, homogenized FEM, CLPT, and FOSD results were compared. The FOSD and FEM predictions showed good performance compared with the experimental results. The CLPT results were highly overestimated.
In our study, the modification by Avilés et al. from 2012 [
22] is developed. It may be classified as one of the FOSD method and serve as an alternative to the FOSD approach presented by Hernandez-Perez et al. in their 2014 study [
24]. Another example of FOSD was presented by Nguyen et al. in 2019 [
27] for advanced composite plates such as functionally graded plates, where no shear correction factor was used. In the literature, also the alternatives to FOSD may be found, for instance in the work of Anish et al. [
28], the so-called improved shear deformation theory was presented, in which a cubic variation of the thickness coordinate in the displacement field is employed.
3. Results
Depending on the particular sample of corrugated cardboard, a transverse shear contribution may have an important effect on material performance. In this paper, using the formulas presented in
Section 2.1 and the model described in
Section 2.2, the contribution of the transverse shear to total compliance
was verified (here
). In other words, the ratio
to
was computed.
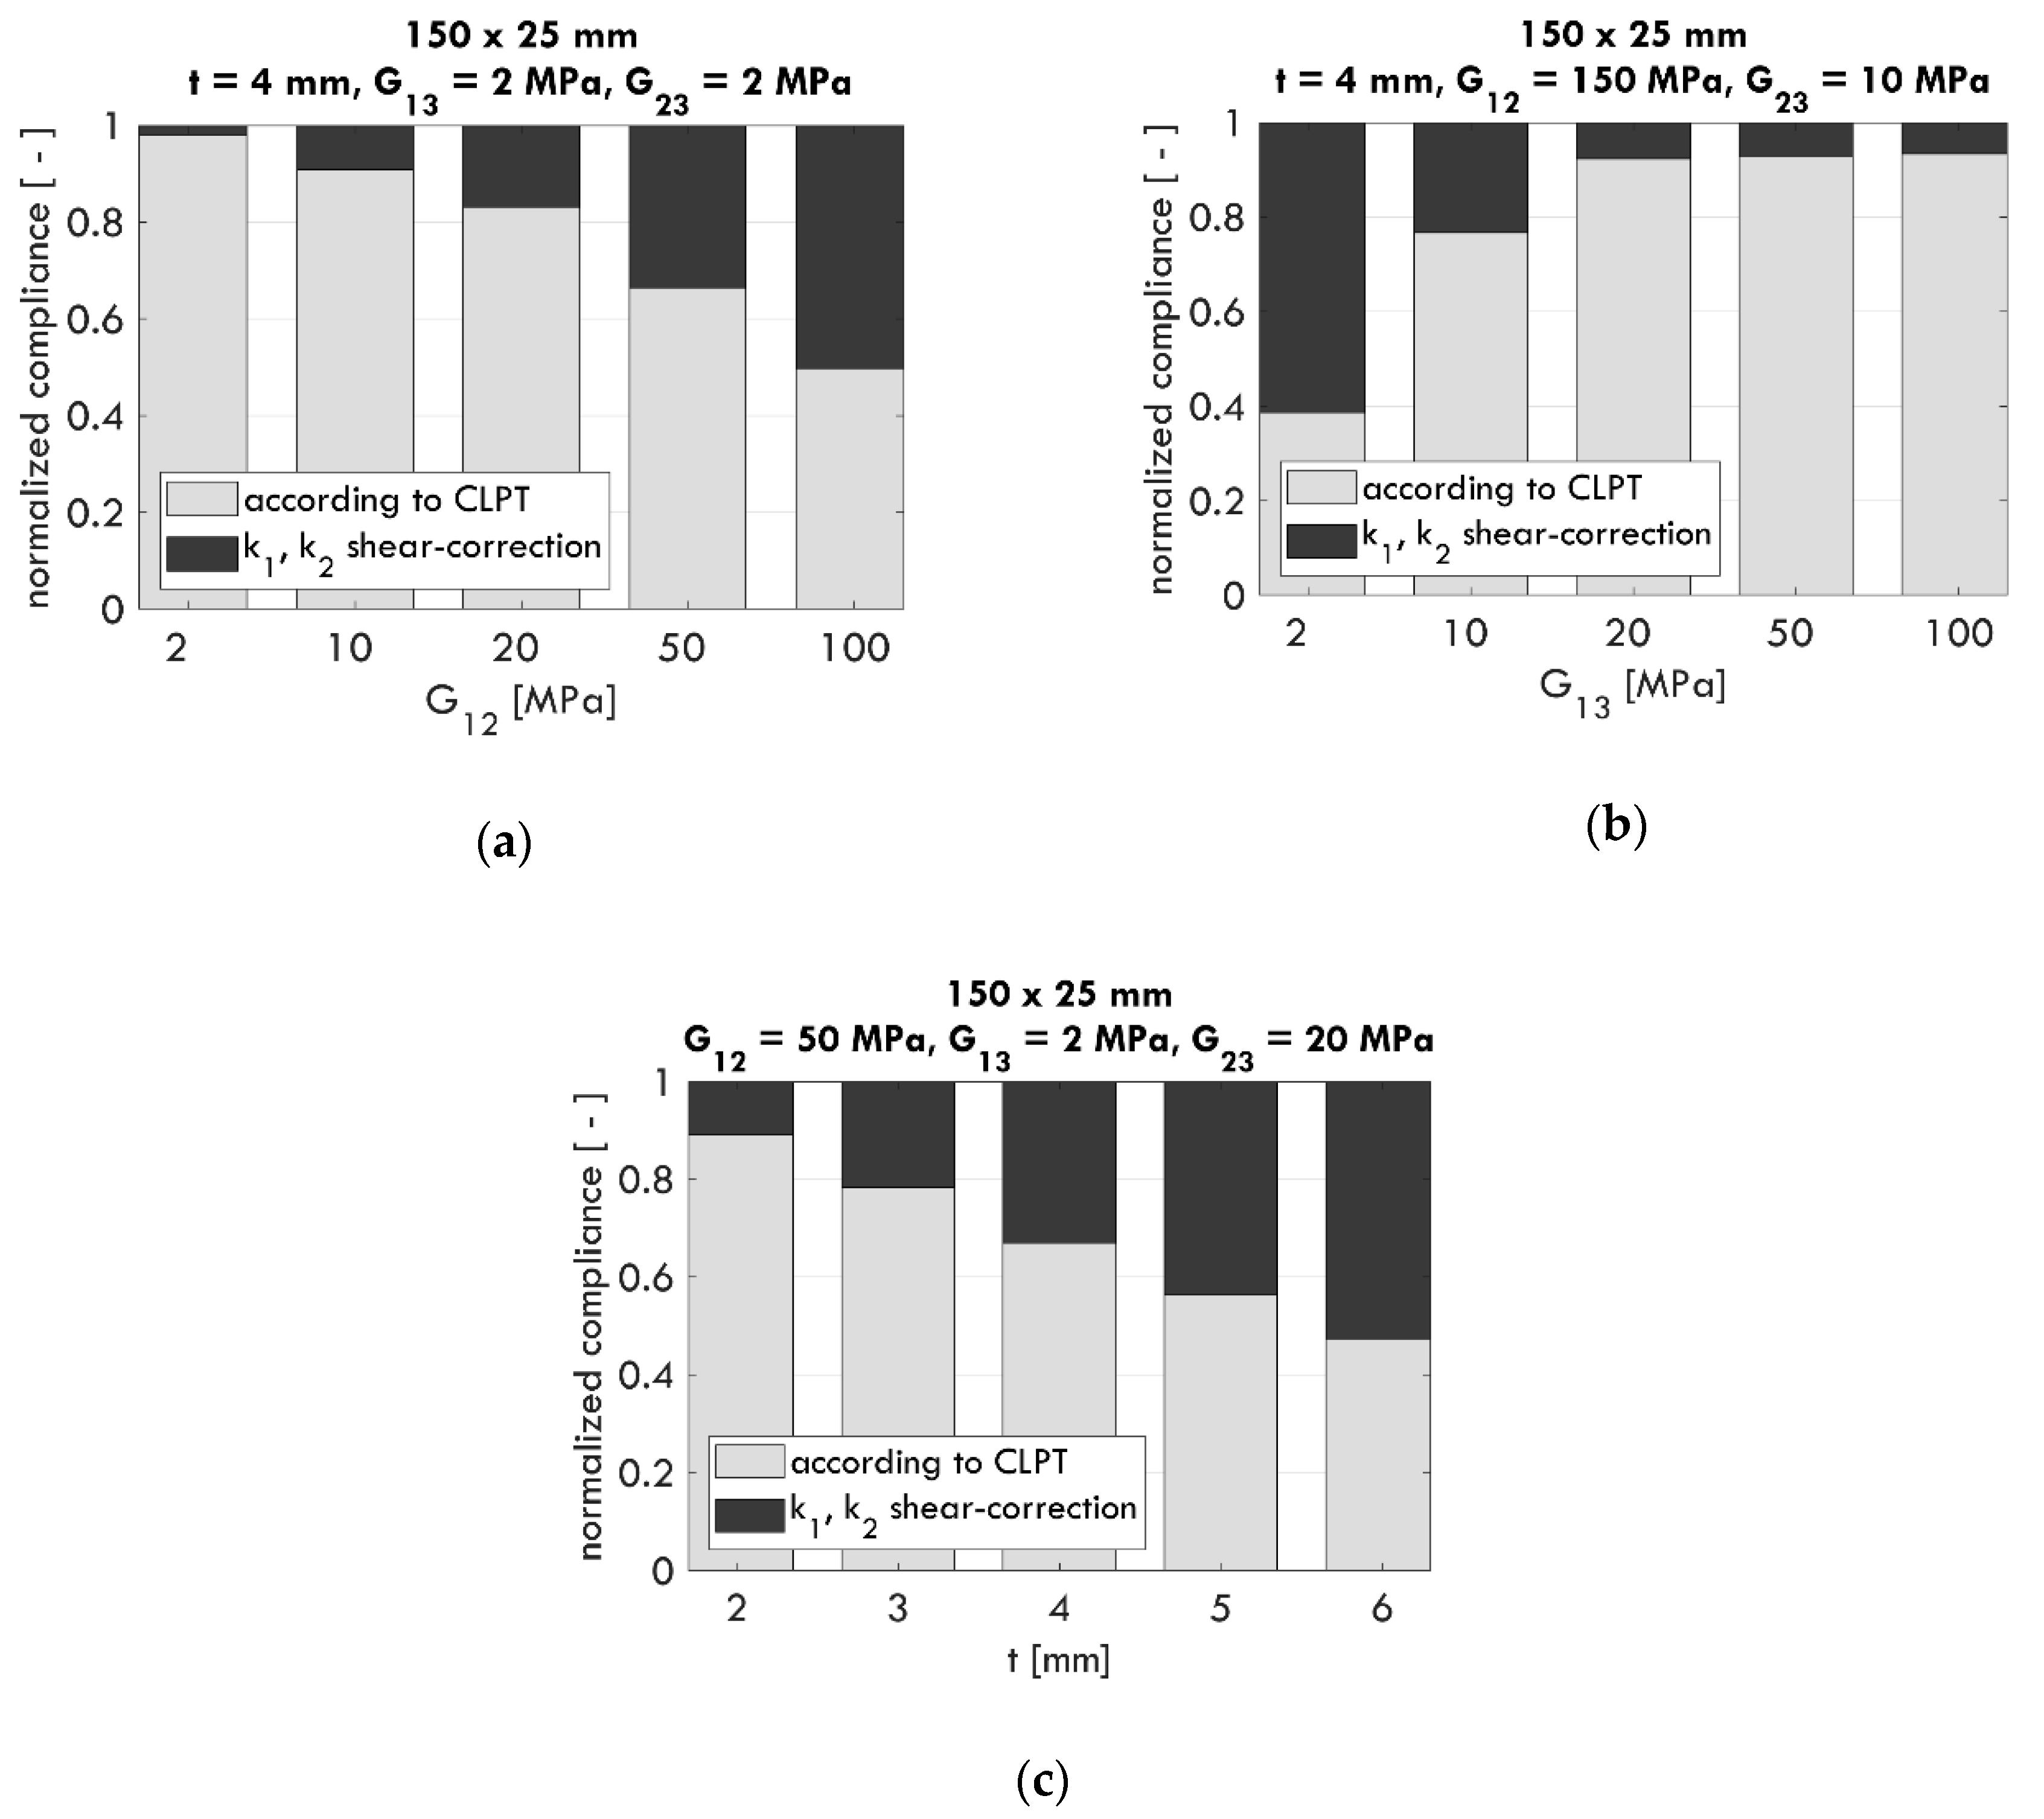
In
Figure 2, the bar charts for compliance
normalized to 1 are shown, where for the example combinations of
and
, the ratios
(gray bars) and
(black bars) were calculated. The assumed dimensions of the sample were
mm. The high ratio of
shows how significant the impact of the transverse shear was on the compliance for a given cardboard sample. Depending on the adopted material parameters and sample thickness, this value may even reach several dozen percent, e.g., 37% for
= 100 MPa (
Figure 2a), 61% for
= 2 MPa (
Figure 2b), and 53% for
= 6 mm (
Figure 2c). Therefore, it can be concluded that there are cases in which it is necessary to account for the transverse shear correction
in relation to the use of (pure) classical theory, i.e., Equation (8).
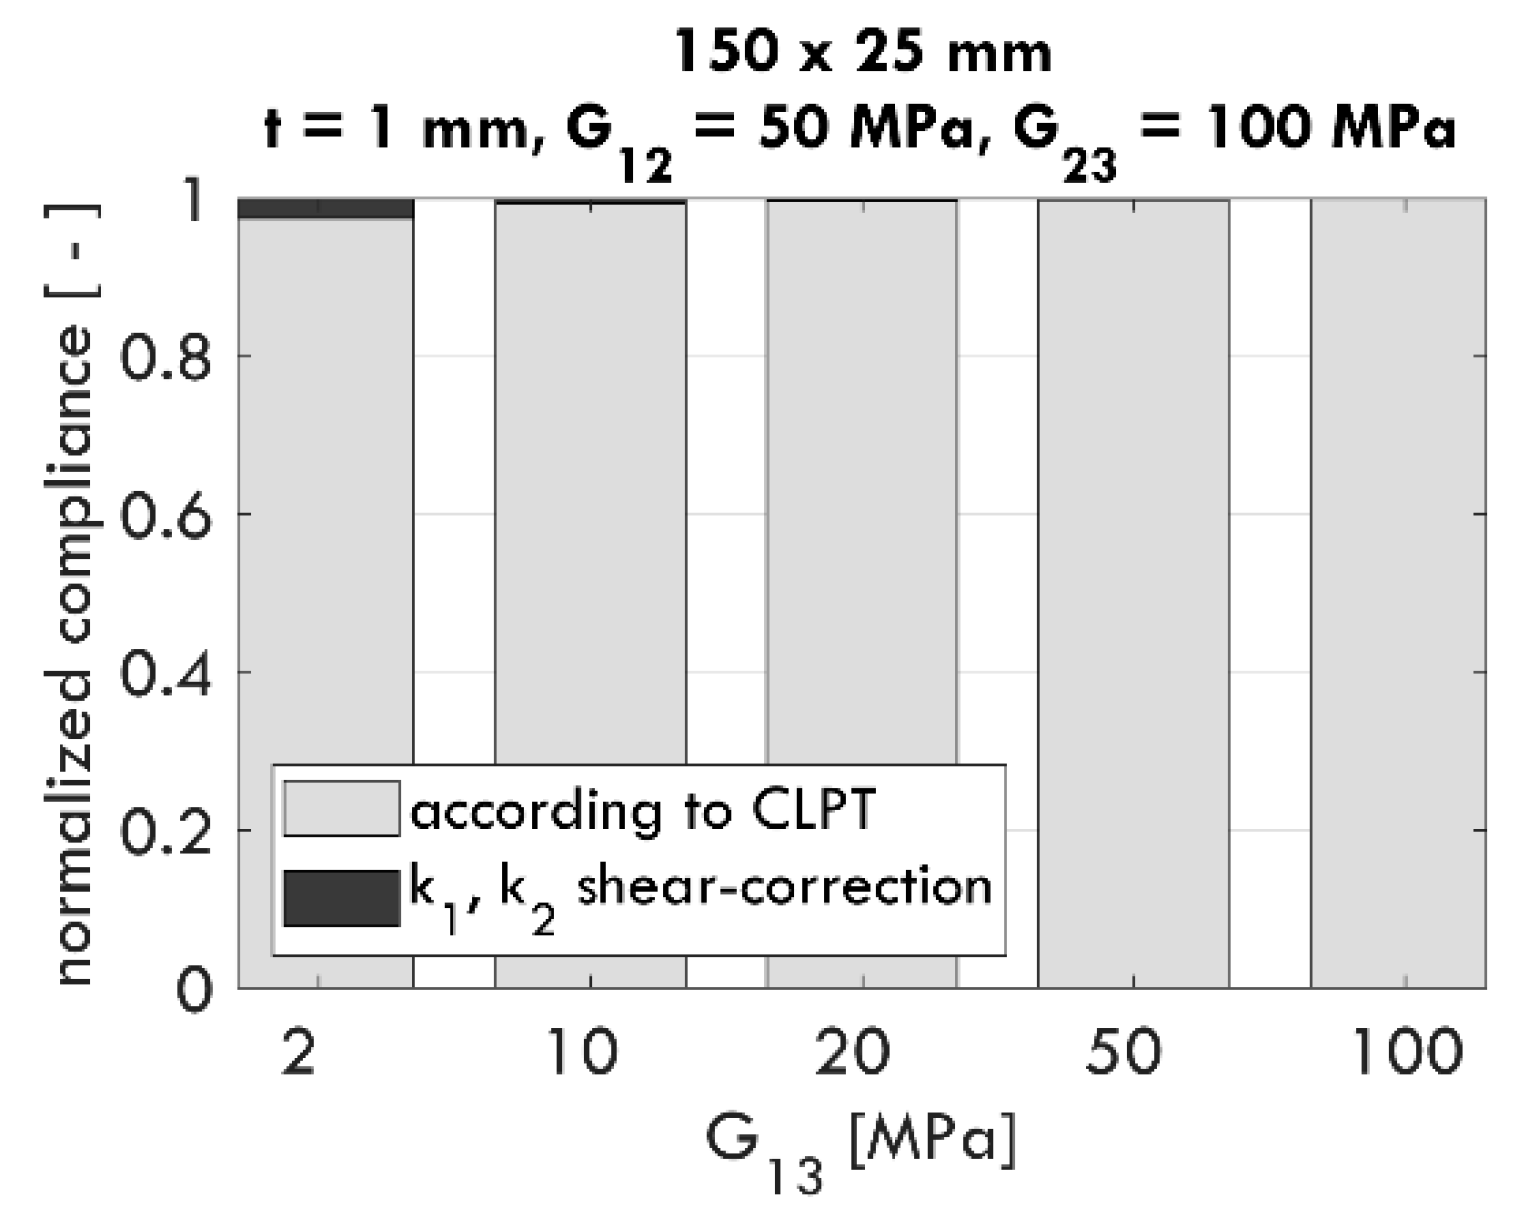
In some cases, particularly for thin cardboard, the effect of transverse shear is negligible. This phenomenon is illustrated in
Figure 3, where for
= 1 mm and changing values of
, the influence of
on
is usually less than 2.5%. In such cases, applying only classical theory (
), excluding
, is accurate enough.
The shear correction proposed in [
22] and shown as Equation (9) introduces the questions: (i) what should be the value of the dimensionless coefficient
to obtain the correct compliance value, and (ii) what is the influence on
if the material parameters, sample dimensions, or thickness change? In order to answer these questions, the sensitivity of
was systematically tested, and selected computational results are presented later in this work.
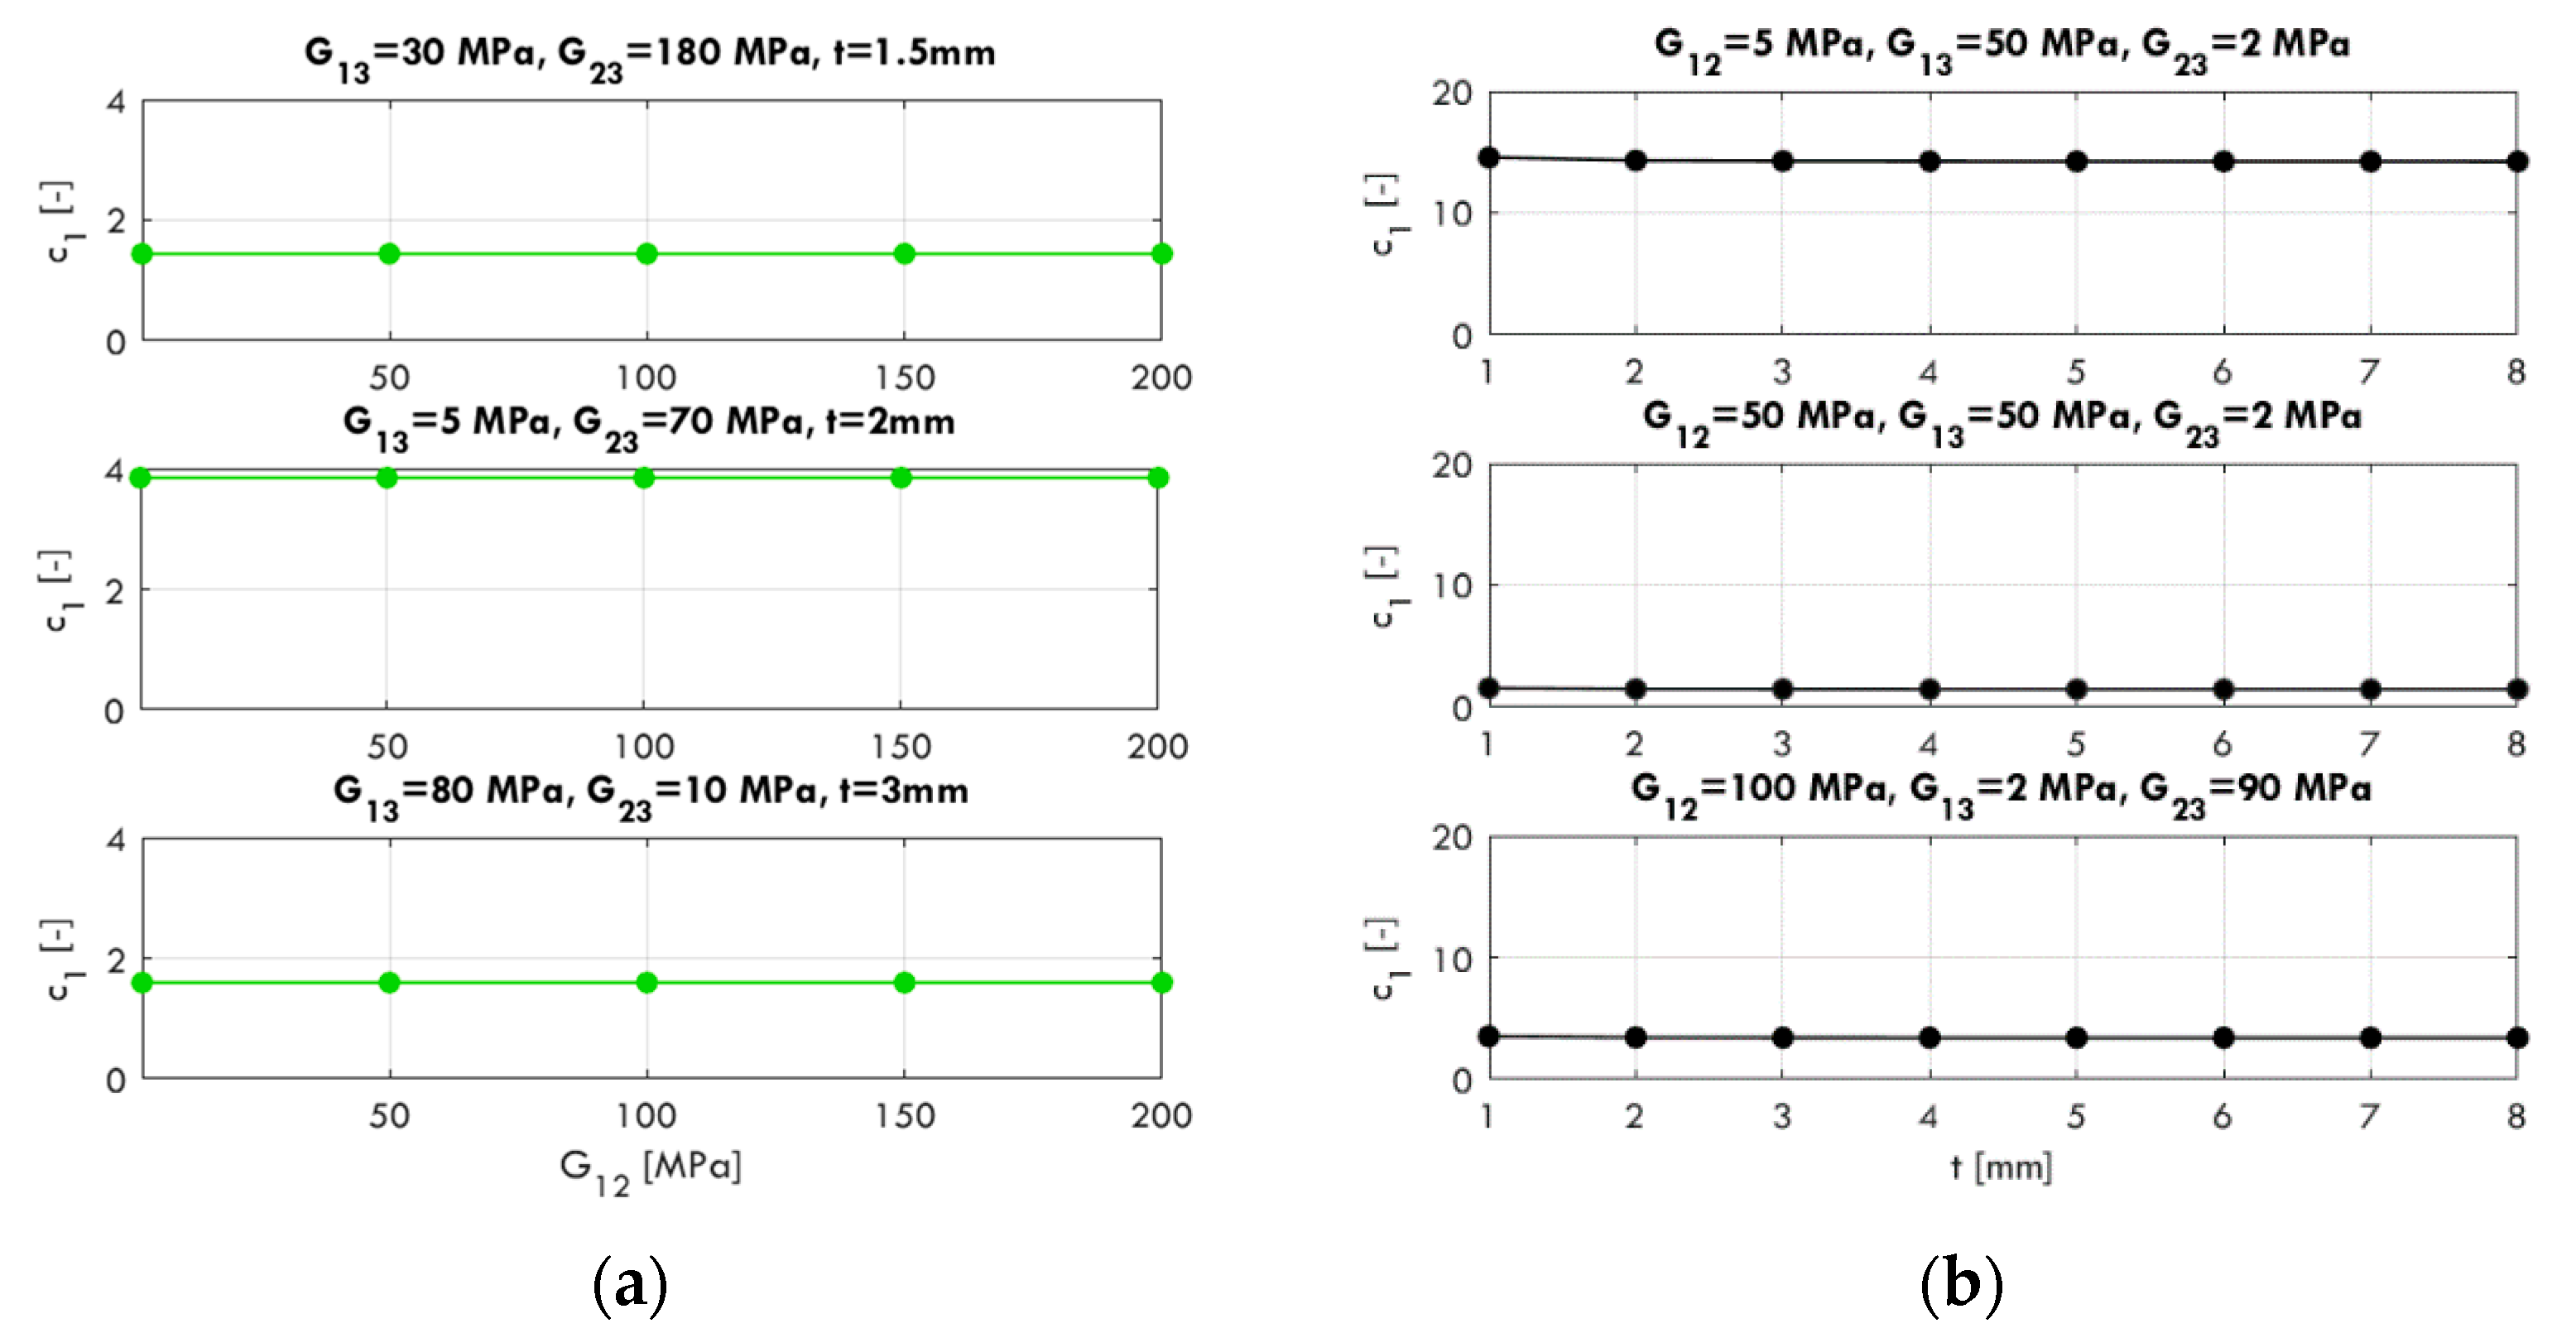
In
Figure 4, the calculated values of
according to Equation (11) for certain combinations of material parameters (
and
), thickness
, and sample dimensions are shown. The following sample dimensions are adopted:
mm,
mm, and
mm. Regardless of the
value (
Figure 4a) and sample thickness
(
Figure 4b), the values of the computed coefficient
are constant. Based on the results, it can be concluded that
does not depend on
and
.
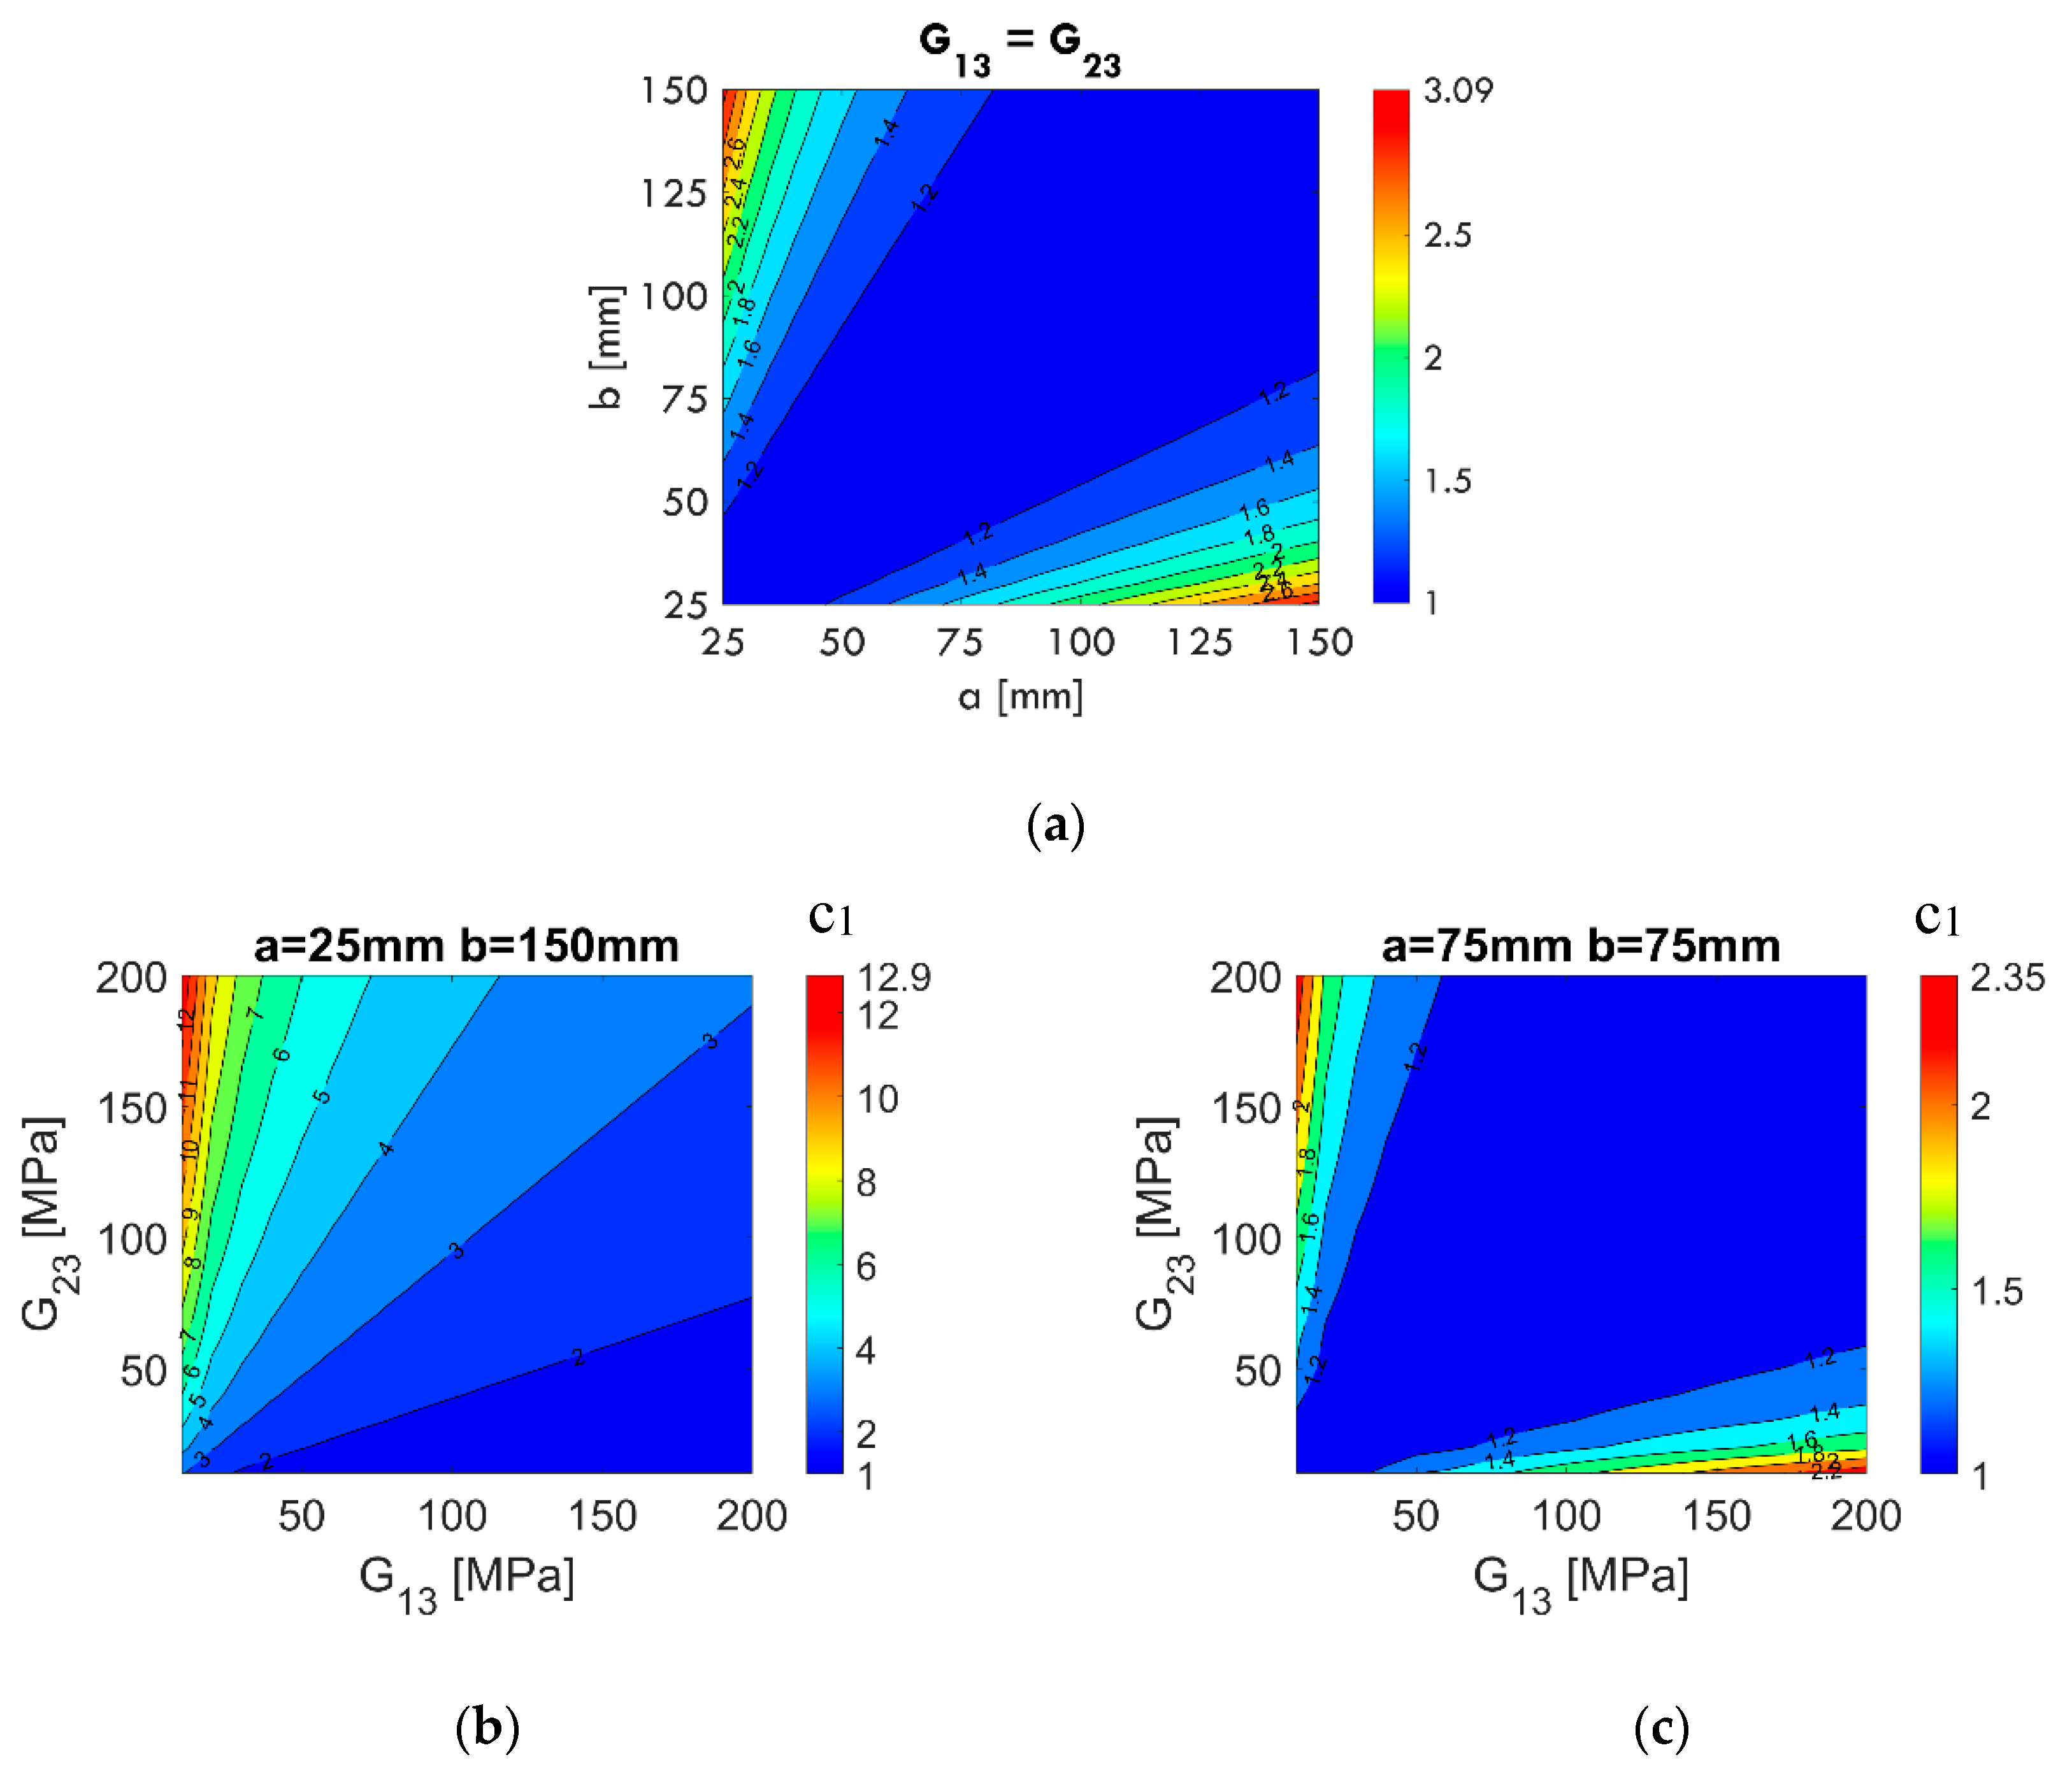
In the next step, two aspects of
are analyzed, i.e., the impact of sample aspect ratio for constant and equal transverse shear moduli (
) and the relation between transverse shear moduli
(the selected sample sizes
were
mm and
mm). In
Figure 5a, the influence of dimensions
and
is shown. The values of
reach a maximum of about 3.09 for a longitudinal sample with a dimension aspect ratio of 1:6 (
mm), i.e., the transverse shear correction due to the sample geometry should be significant. For square samples, e.g.,
mm,
mm, the factor
should be 1 (no correction). The contour plot of
values is symmetrical in relation to the main diagonal, i.e., the transverse shear correction for the
mm and
mm samples is the same, assuming
. On the contrary, in
Figure 5b, the effect of cross shear modulus relationships for a rectangular sample (a = 25 mm, b = 150 mm) is shown. The variable
reaches a value of around 12.9, a very significant effect of transverse shear correction due to the relationship of
(
= 10 MPa and
= 200 MPa). In
Figure 5c, the same relationship for a square sample (
75 mm,
75 mm) is shown. The maximum value of
in this case is approximately 2.35. On this contour plot, one can see a symmetry with respect to the main diagonal, similar to the case shown in
Figure 5a.
Based on the systematic calculations of
, a modification of Equation (9) was proposed. Two physically justified coefficients,
and
, were introduced instead of coefficient
. Thus, the correction due to shear takes the following form:
where
is a factor that accounts for the proportion of sample dimensions, and
is a factor that accounts for the ratio
. Both dimensionless coefficients were proposed based on an approximation of the systematic computations made.
In the next step, a numerical verification of Equations (13)–(15) that takes into account the transverse shear effect was carried out. Intervals for transverse shear moduli
from 2 to 300 MPa (6 discrete values for
and
, namely, 2, 20, 50, 100, 200, and 300 MPa) and sample dimensions from 25 to 150 mm (6 discrete values for
and
, namely, 25, 50, 75, 100, 125, and 150 mm) were assumed. Using all possible combinations for the values of
,
and
values, 1296 computational cases (6
4) were obtained. Based on Equation (6) (assuming that
= 1) and using Equations (7), (8), and (13)–(15), the values of
were calculated. For the same input data, the reference values of forces
were obtained using the FEM (see
Section 2.2, in which the computational model used was described).
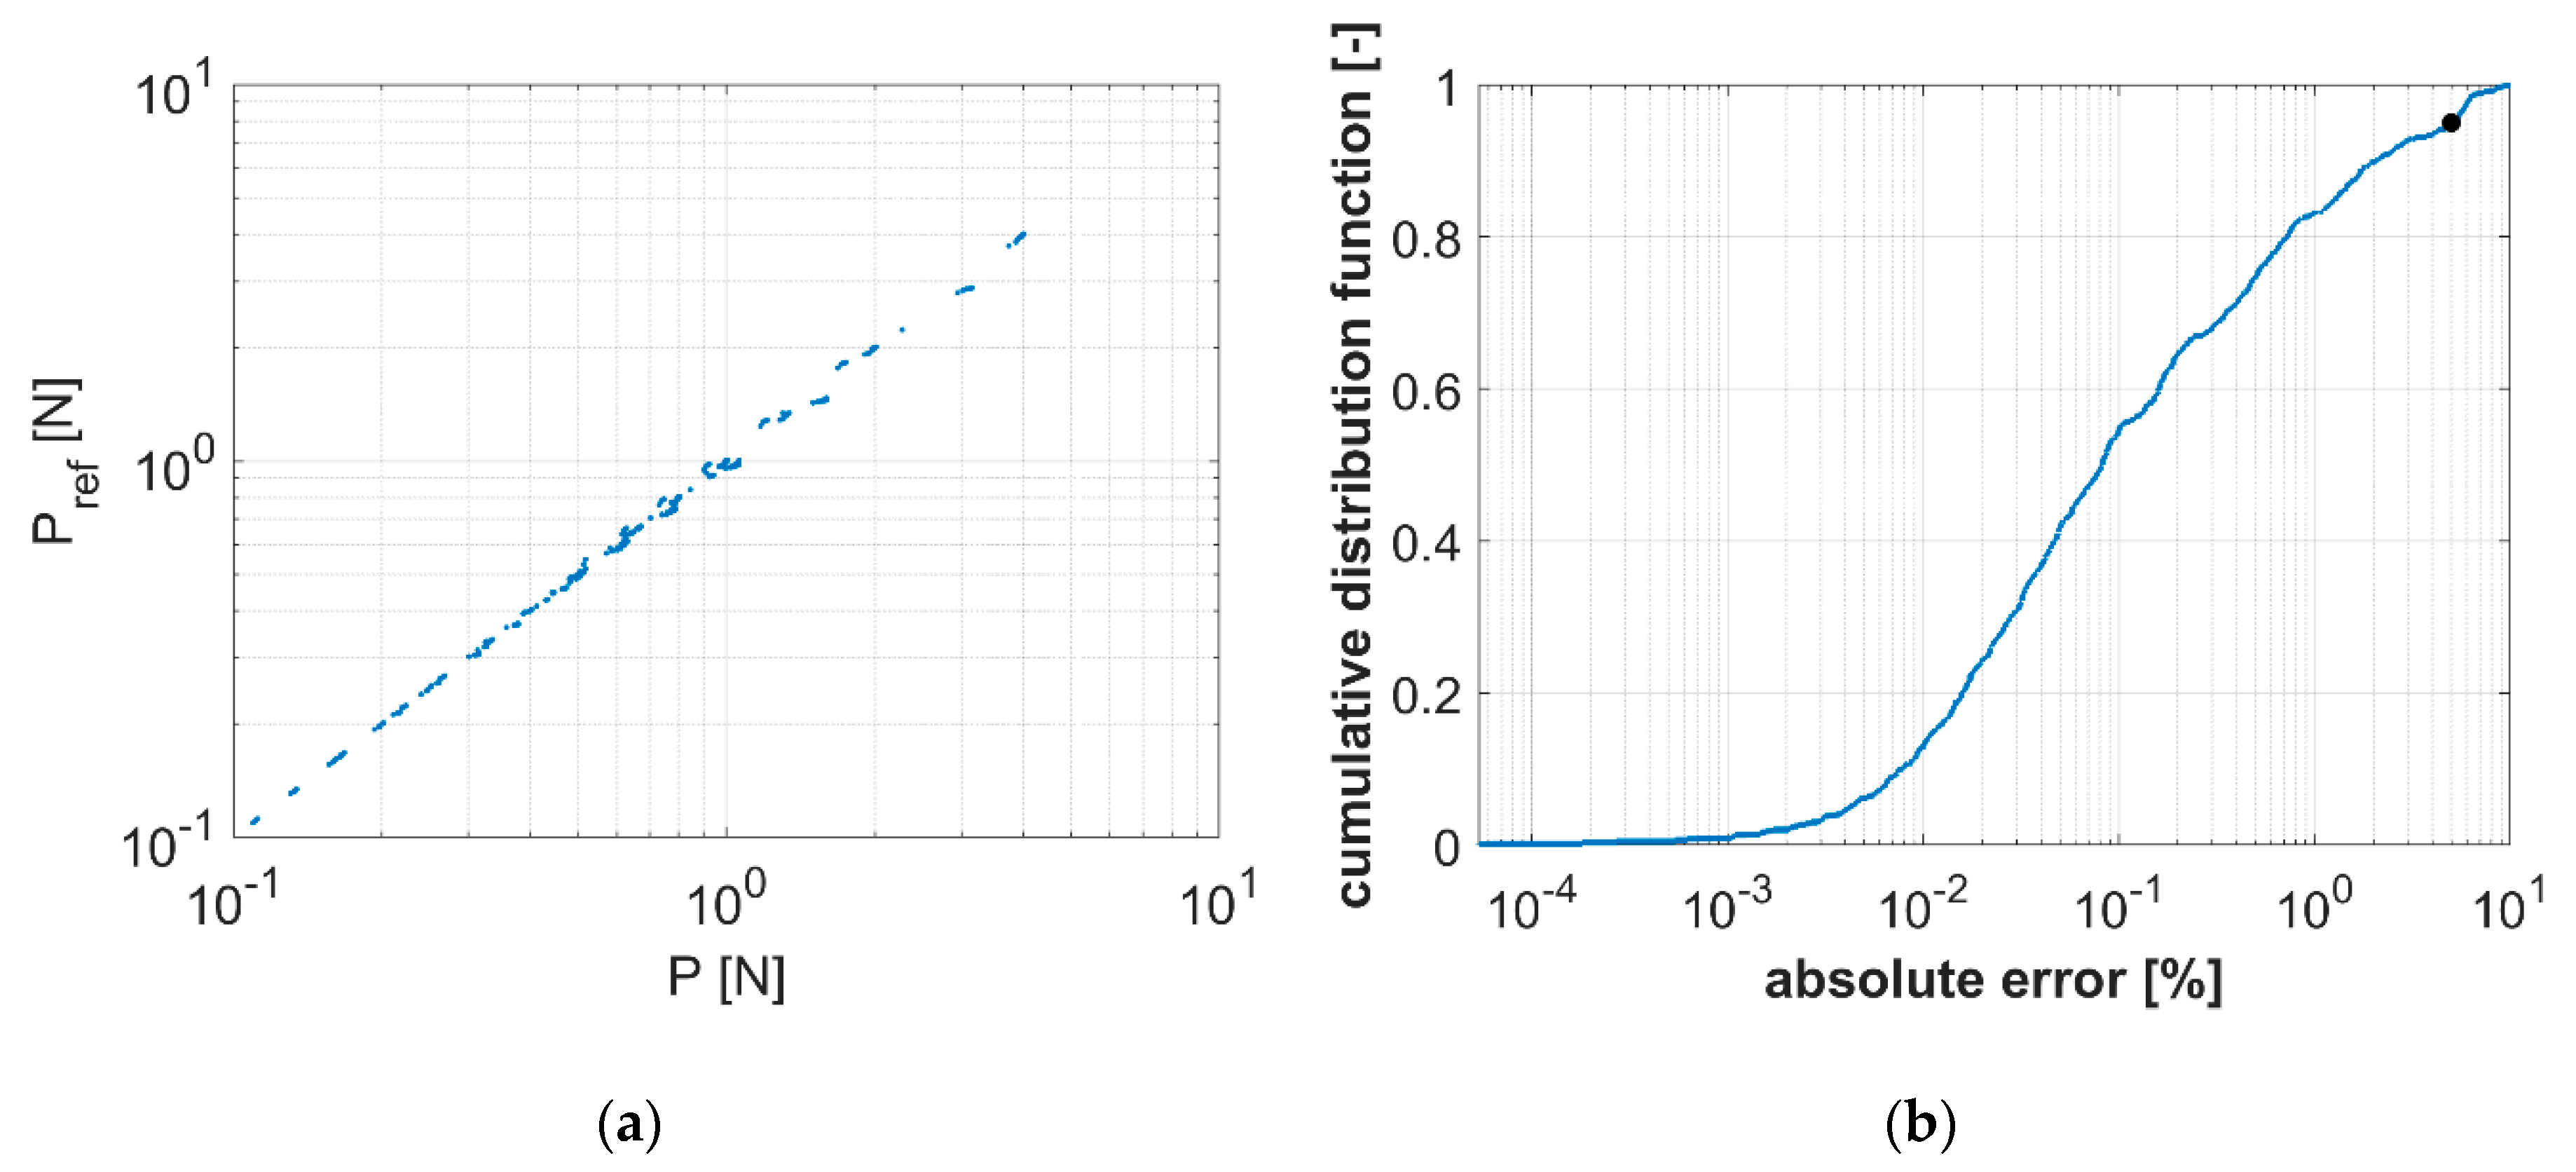
The differences between
and
are graphically presented in
Figure 6.
Figure 6a shows raw data, where on the vertical axis the reference values of the force
Pref are presented, while on the horizontal axis, its counterparts computed by our proposed approach are demonstrated. In
Figure 6a, almost perfect alignment of the magnitudes can be observed.
Figure 6b presents a histogram of the data. In may be observed that the error is less than 5% for about 95% of all cases (see black dot). The average overall error for the solutions of the 1296 cases is 0.11%. The error is 10.1% in only one case; in all other cases, it is less than 10%. The largest errors (greater than 5%) were obtained in cases where G13 and G23 reached the limit values, e.g., G13 = 2 MPa and at the same time G23 = 300 MPa. Such values of these parameters are usually non-physical, which would mean that the material has very high shear stiffness in one direction and virtually no shear stiffness in other, perpendicular direction. All raw data used to generate
Figure 6 can be found in
Supplementary materials.
For the classical solution (using
as an a priori constant), the largest error in estimating
according to [
22] for
is equal to 35% (average error 2.5%), and for
, the largest error is equal to 32% (average error 1.2%).


