Profile and Areal Surface Parameters for Fatigue Fracture Characterisation

 ,
,  ,
,  ,
, 
 ,
, 
Abstract
1. Introduction
2. Materials and Methods of Measurement
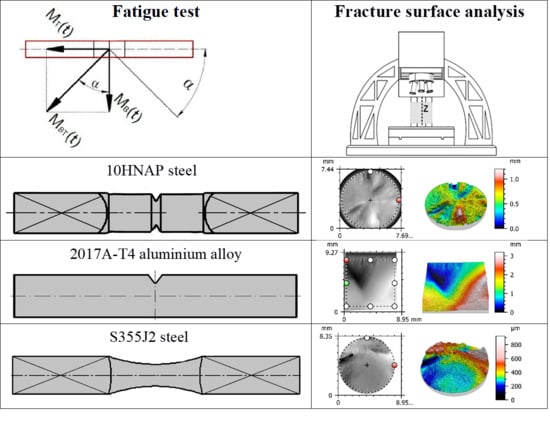
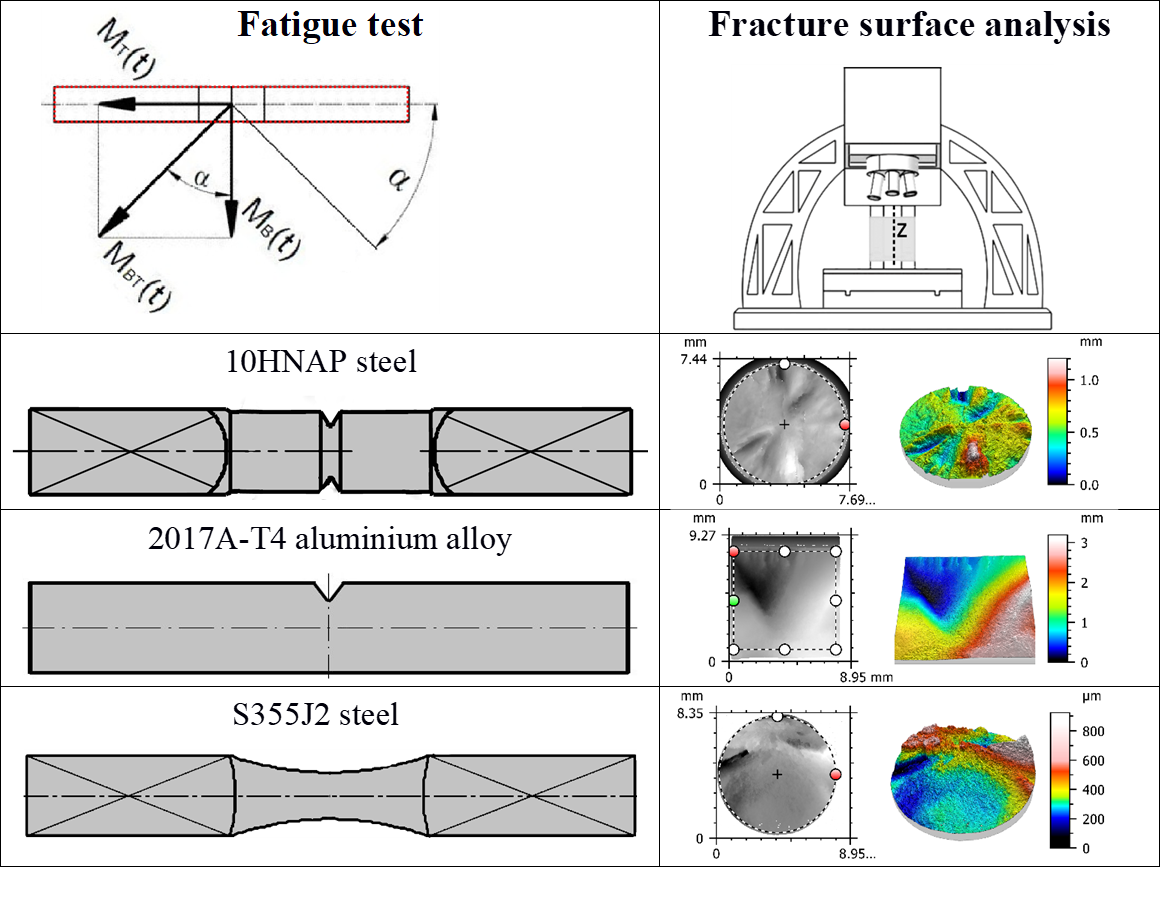
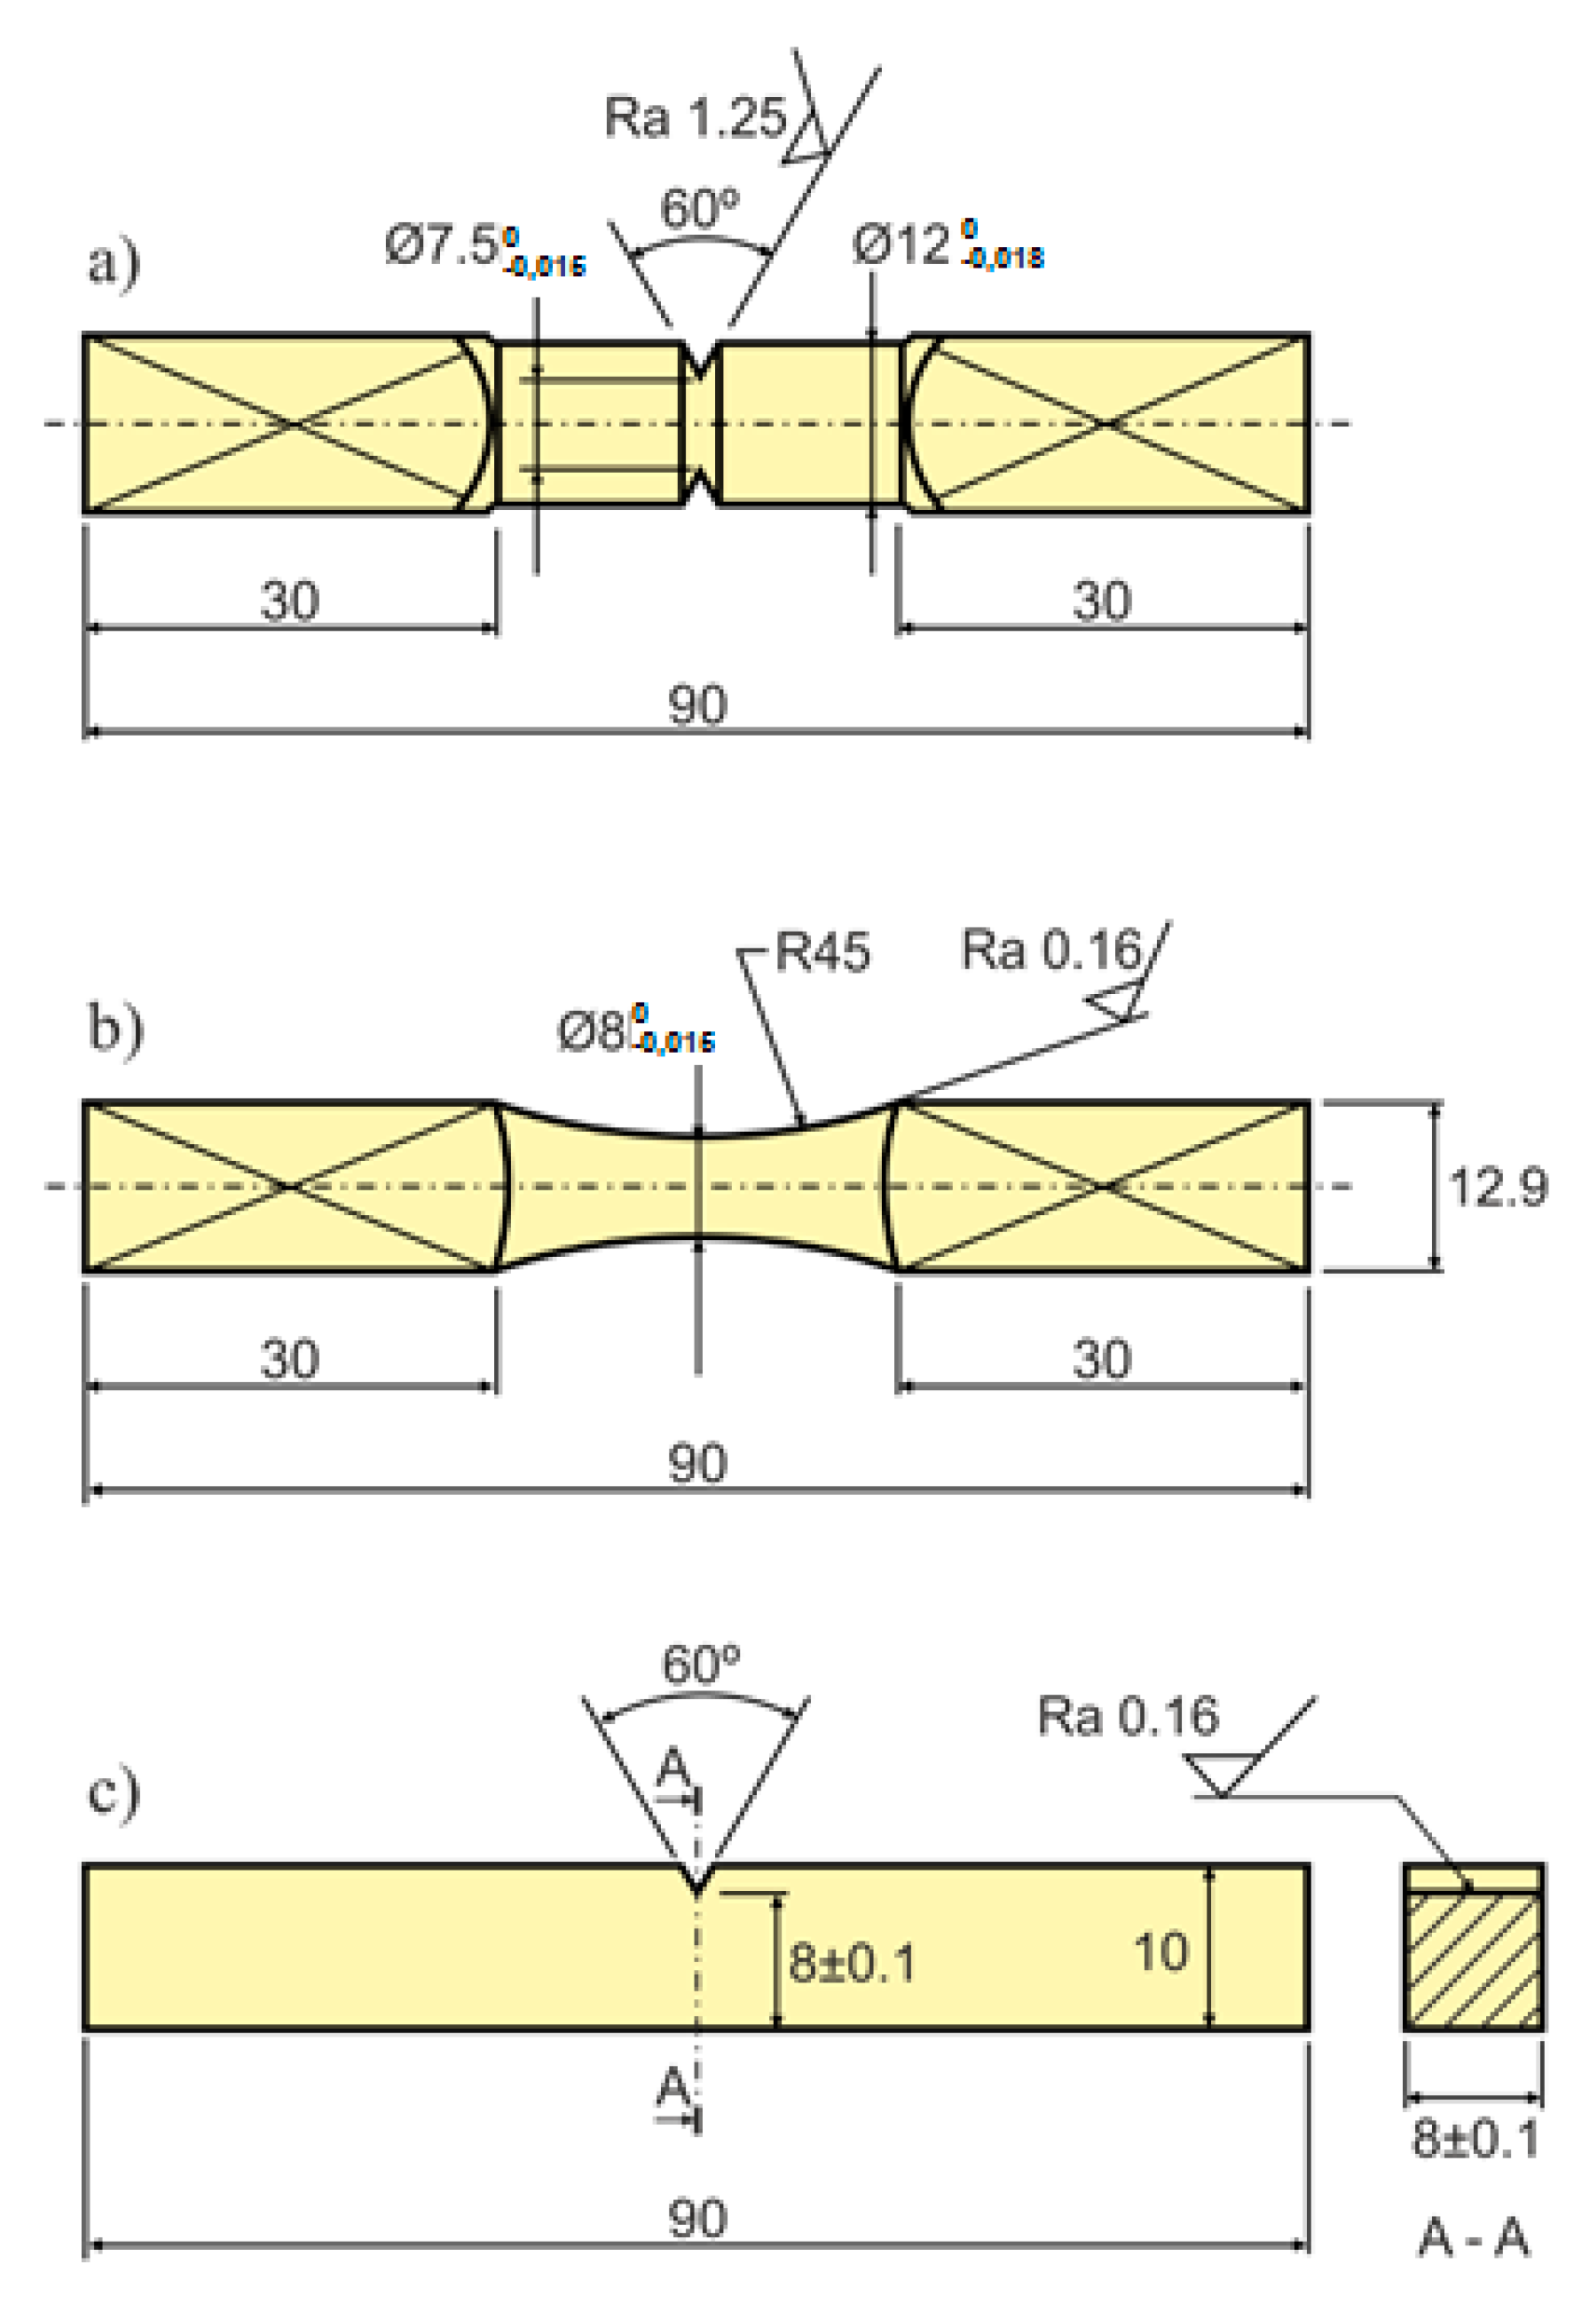
2.1. Materials and Specimens
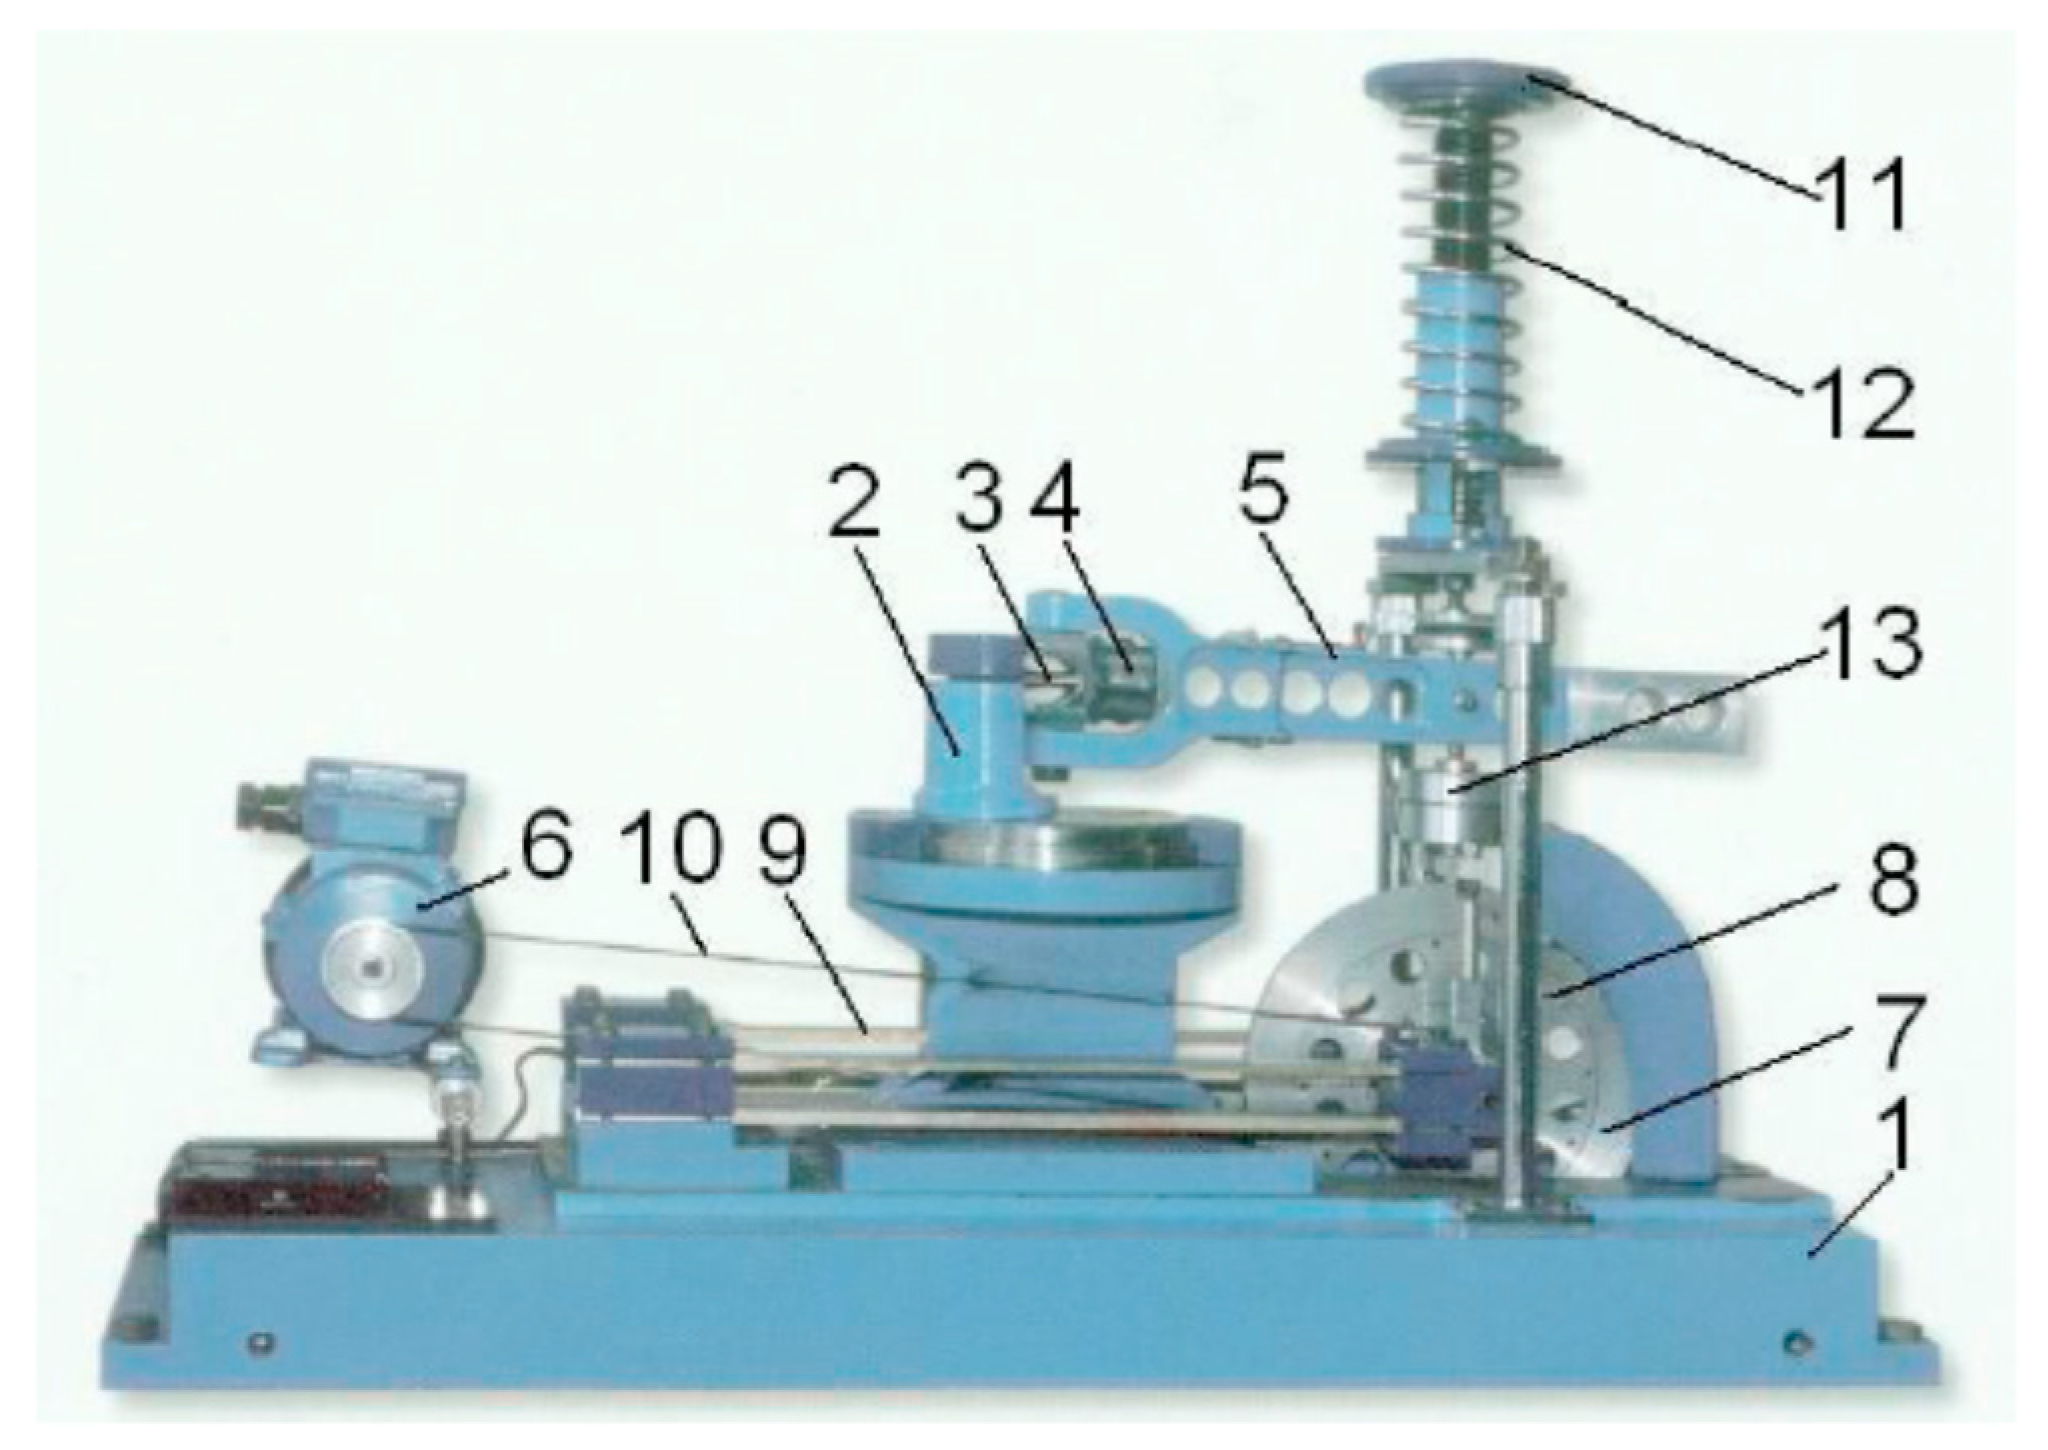
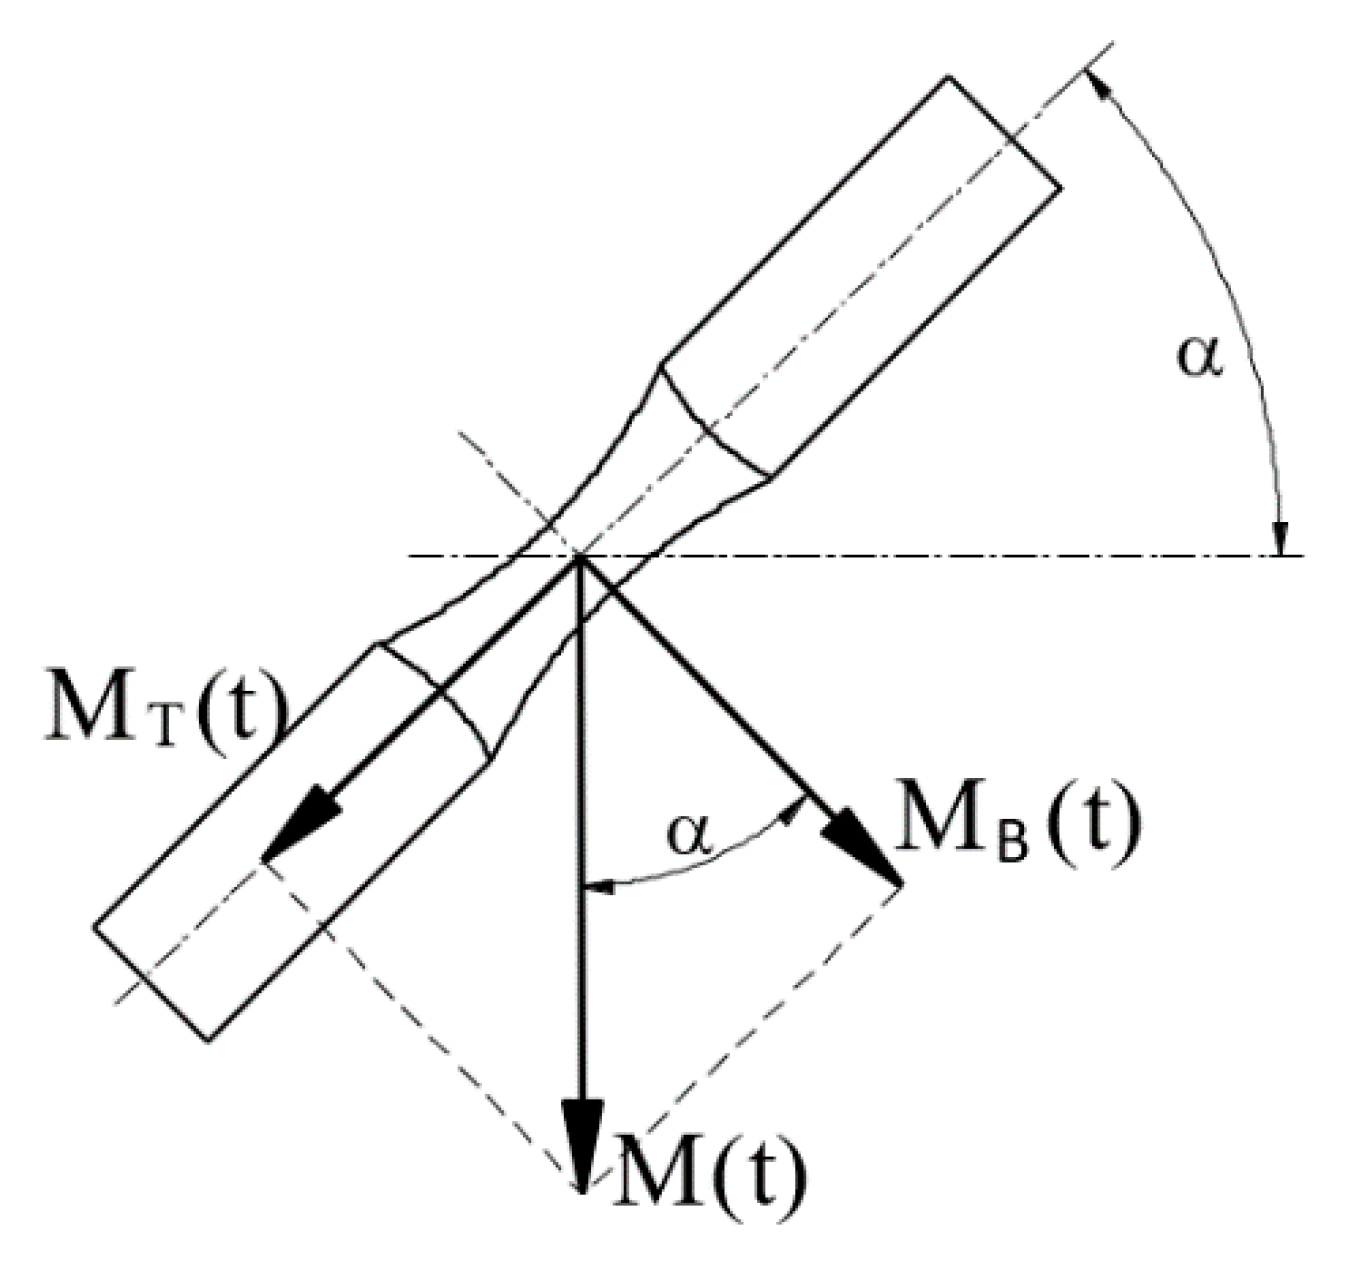
2.2. Loading Histories
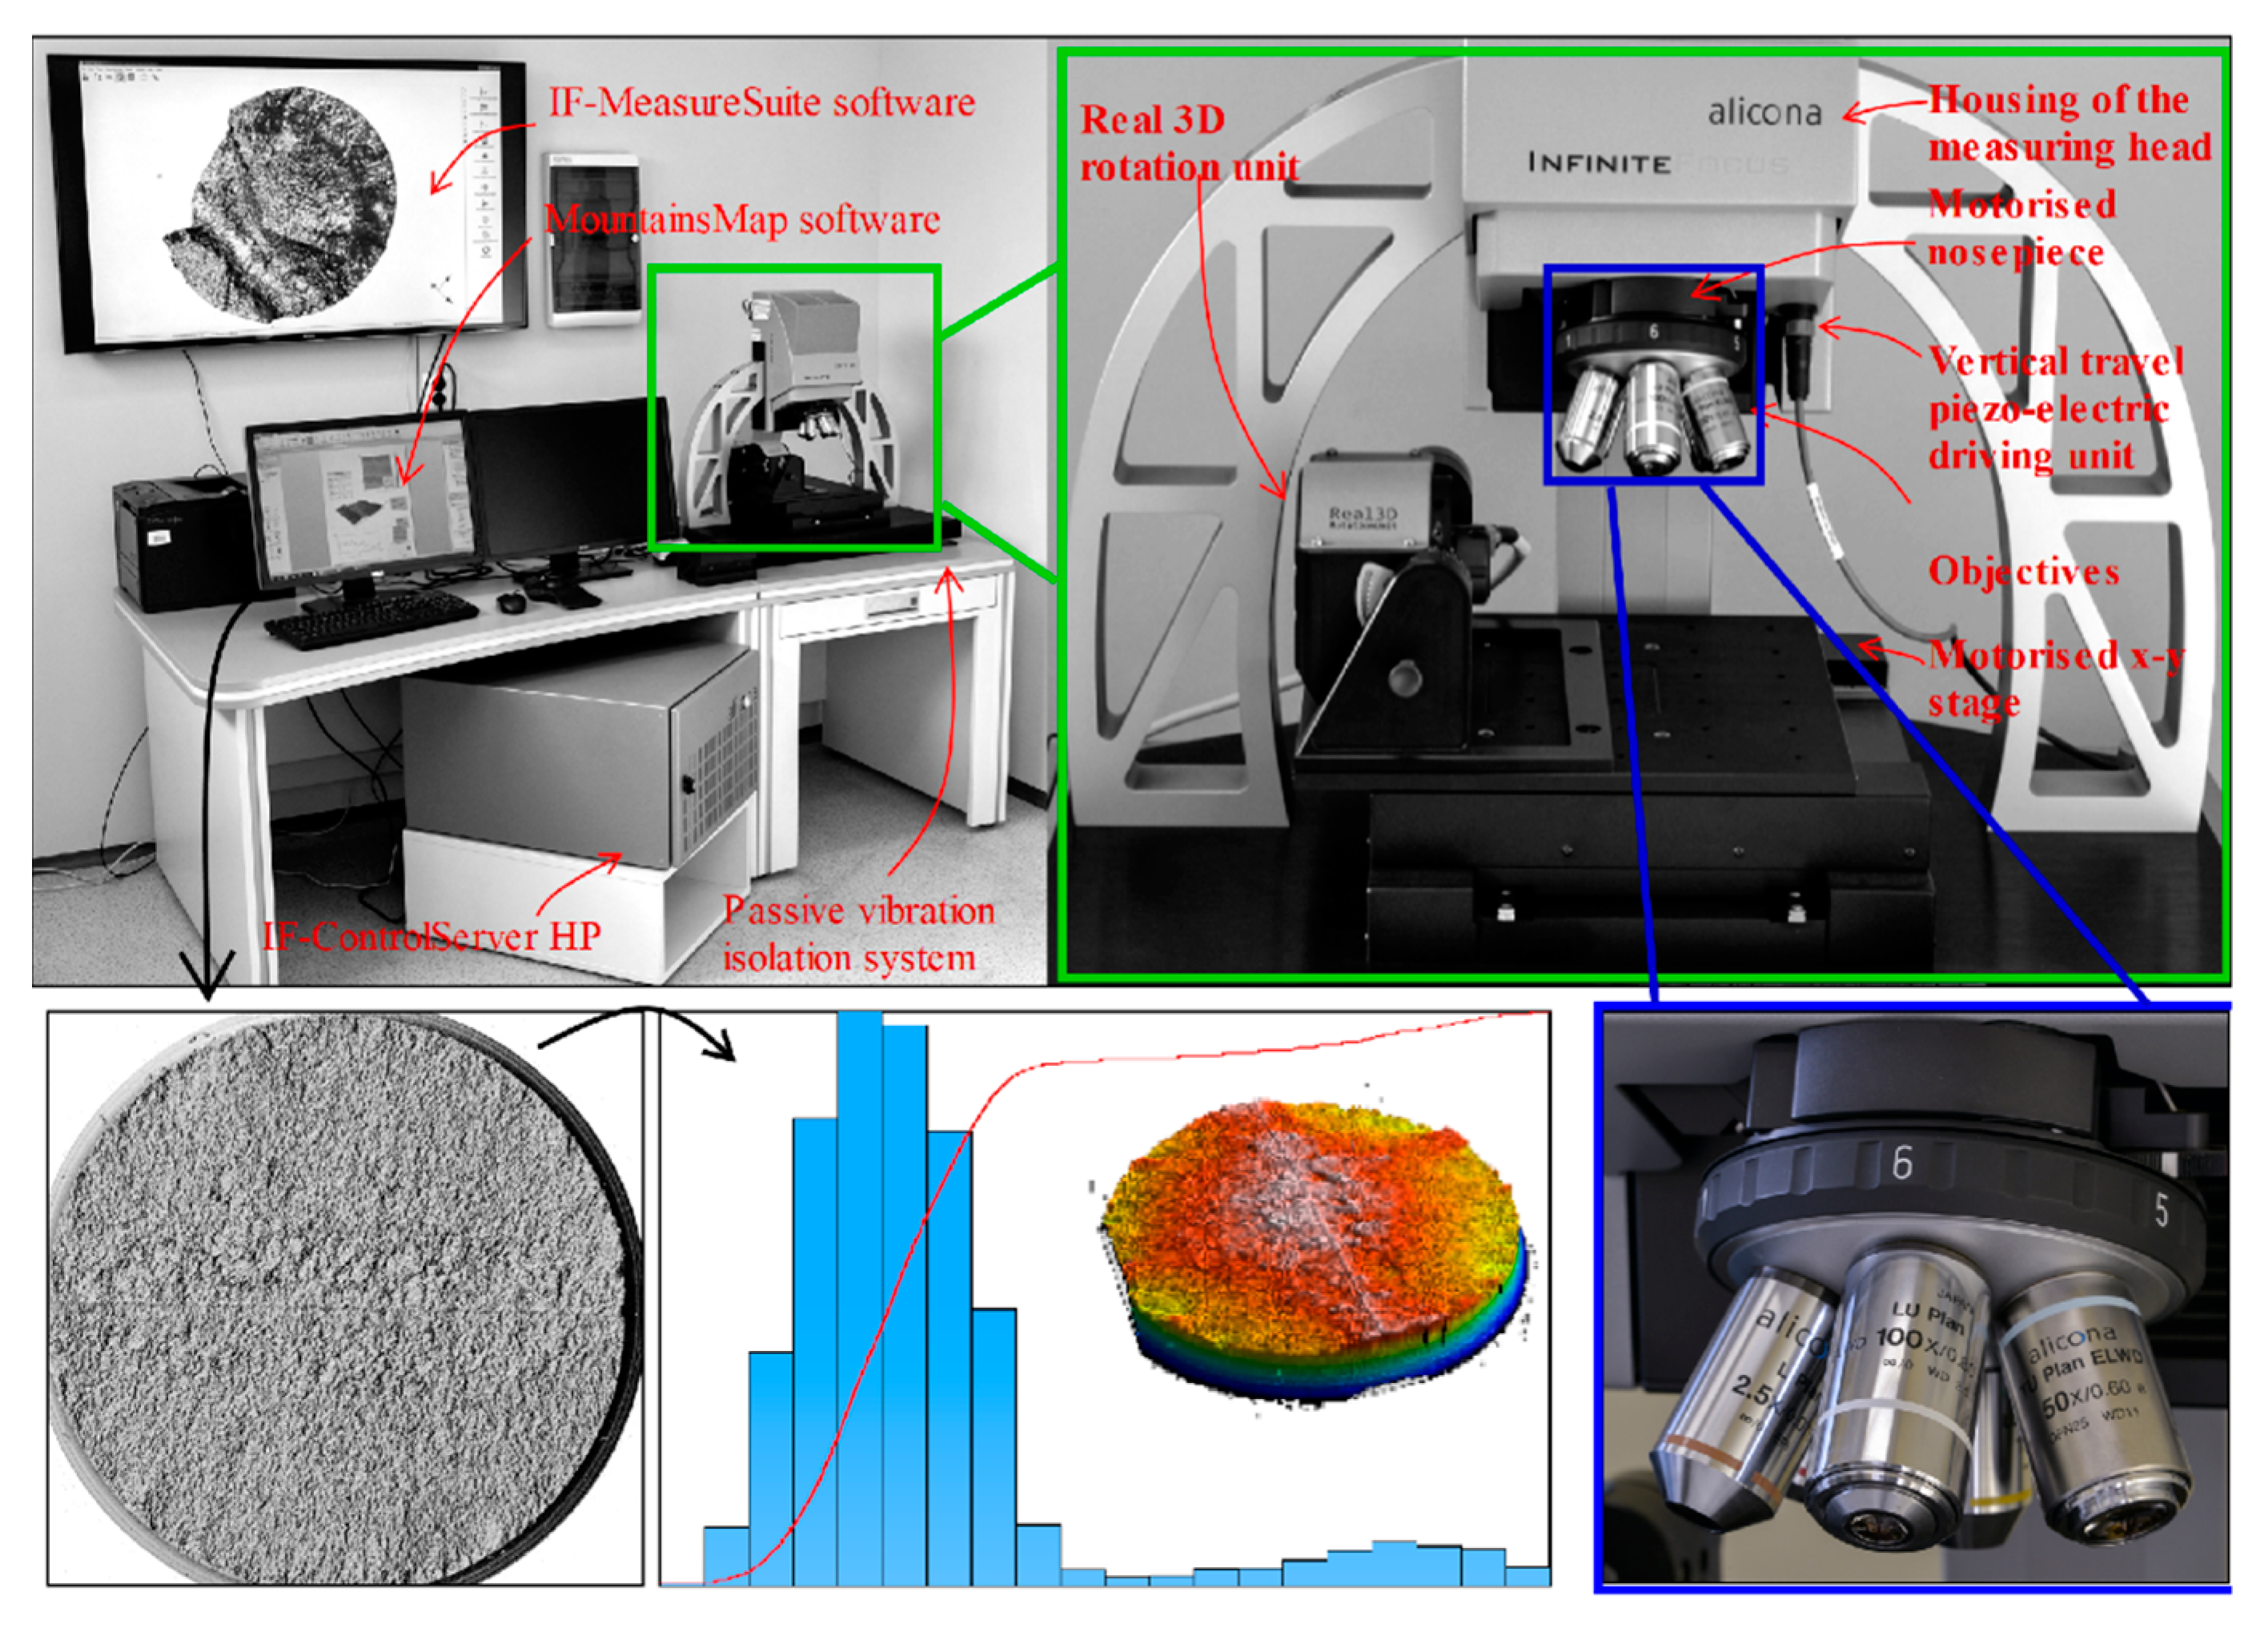
2.3. Surface Parameter Measurement and Calculation
3. Results and Discussion
4. Conclusions
- The entire total area method is more universal and burdened with less error than the subjective method of measurement in individual fracture zones for various shape-types of fatigue-tested samples.
- This method is suitable for assessment, and supplements the testing of materials damaged as a result of fatigue loads, for various shapes of the tested detail.
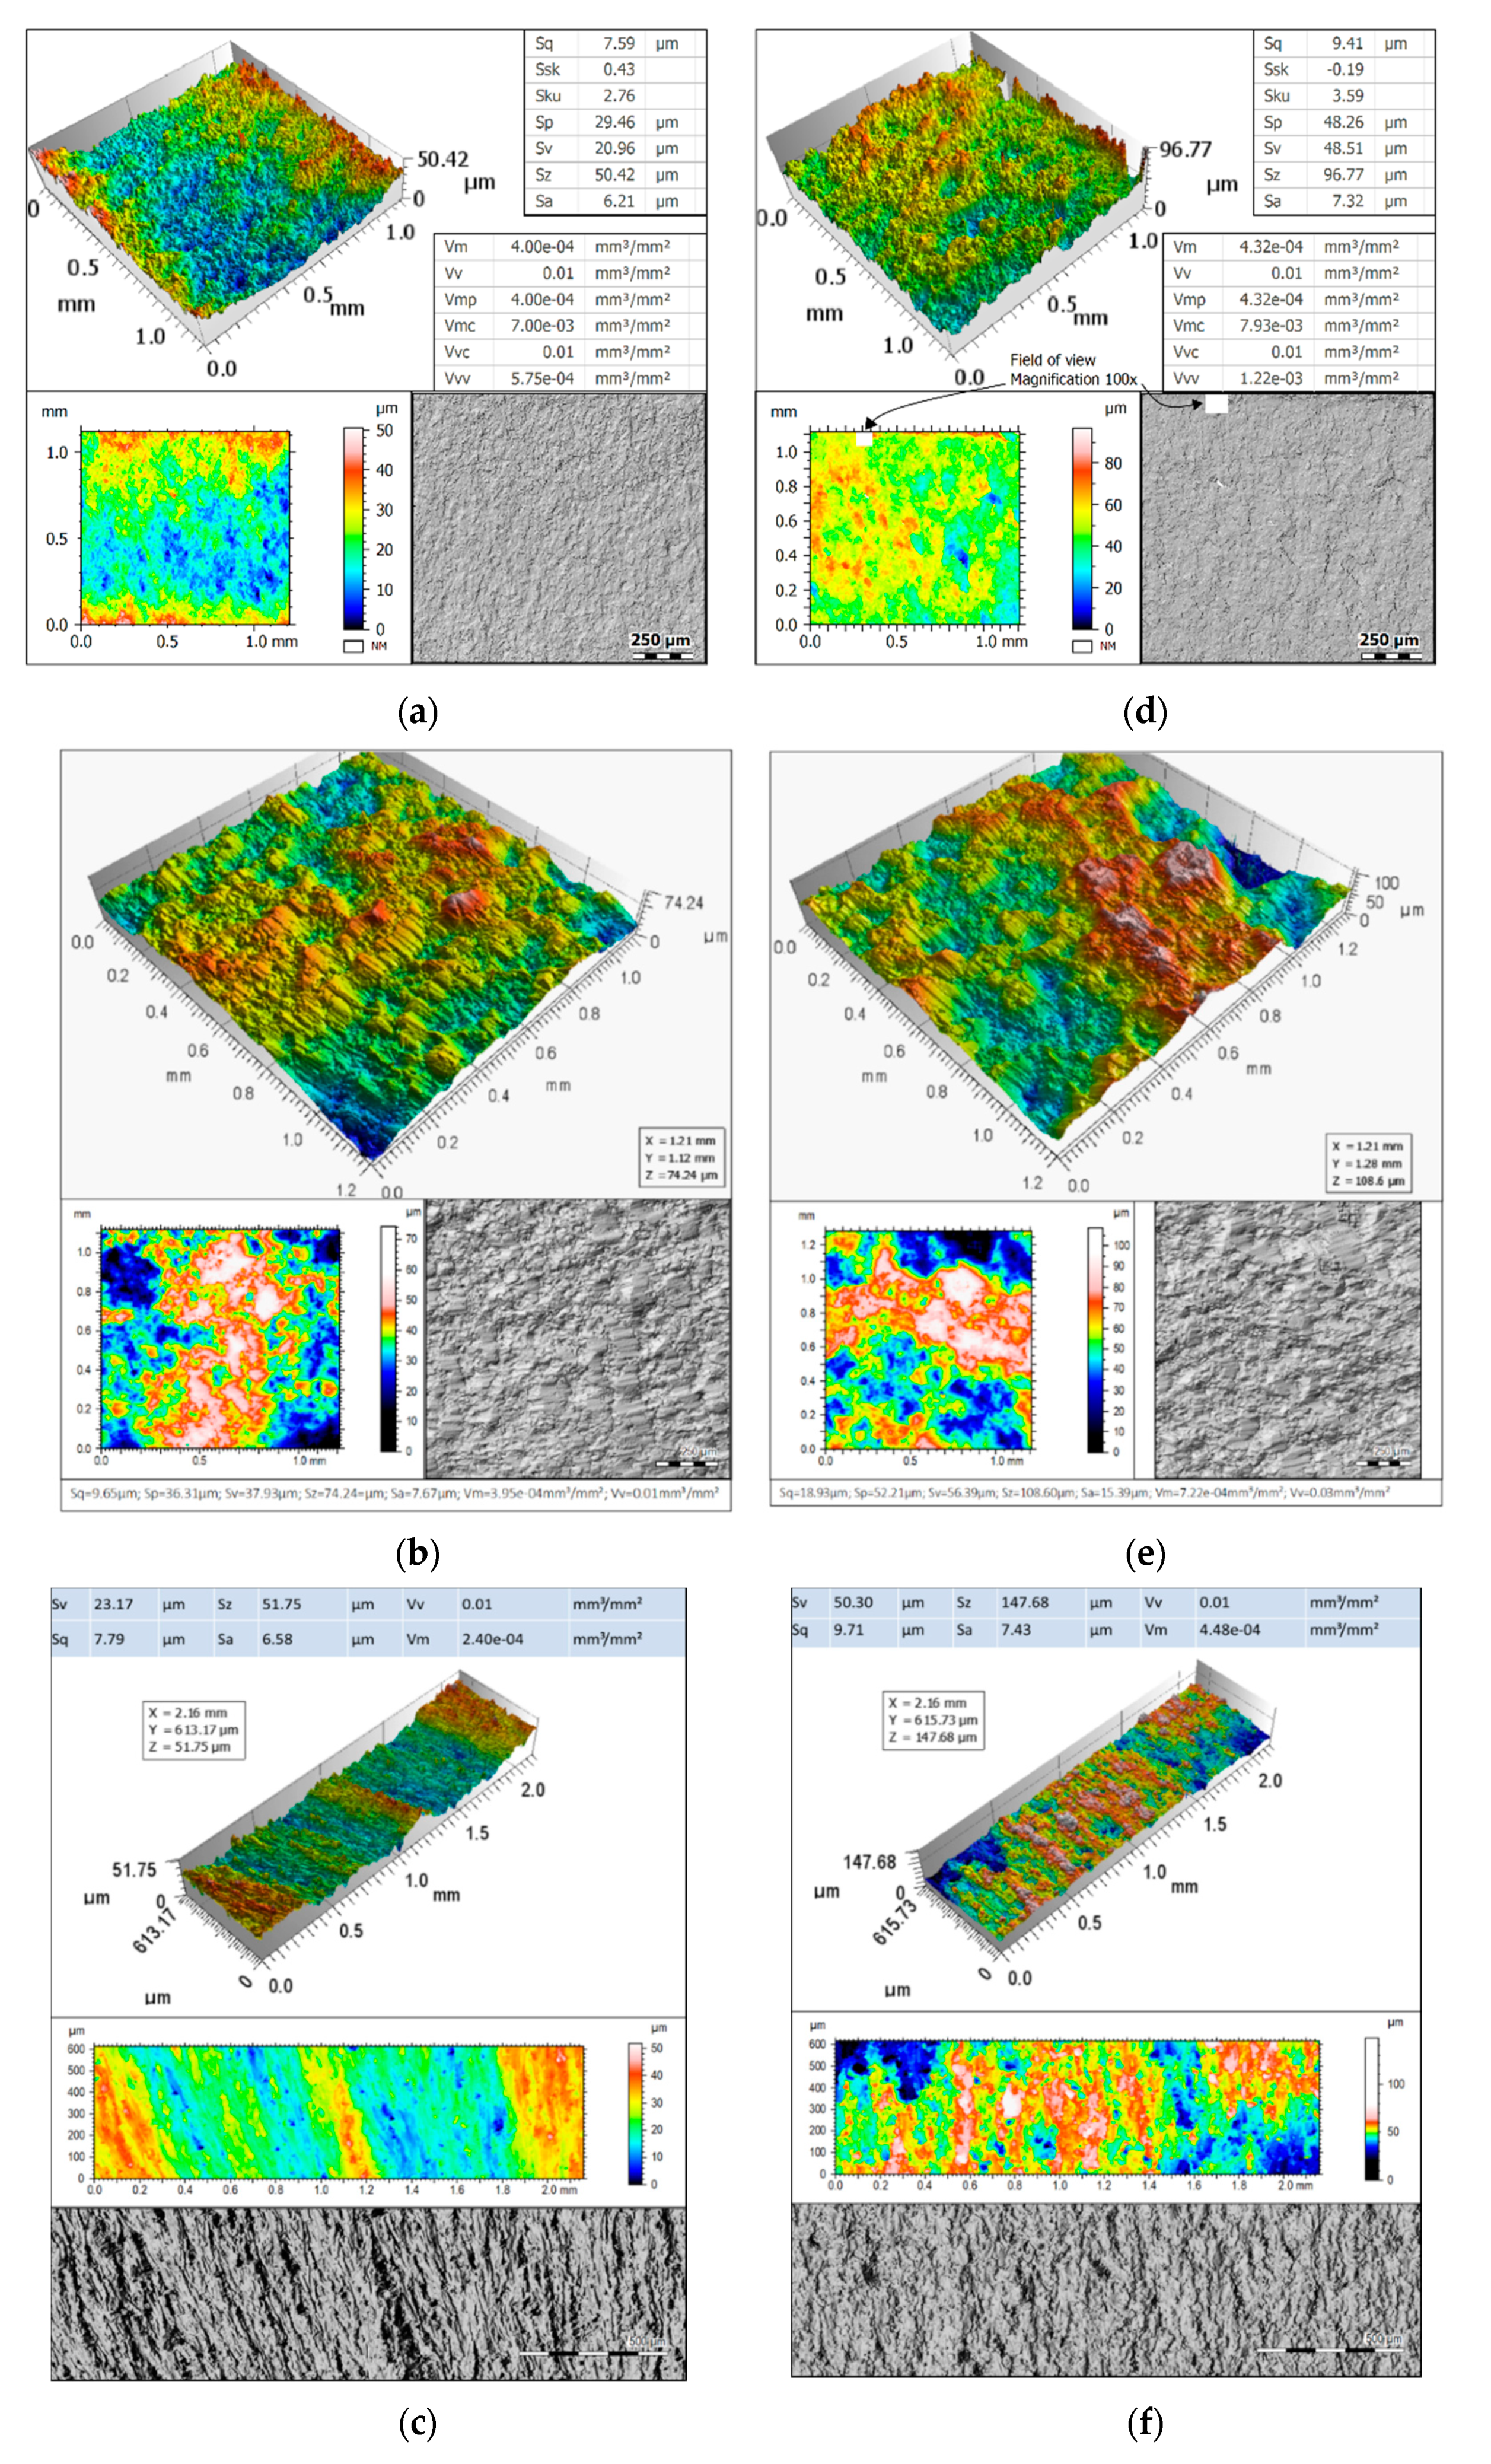
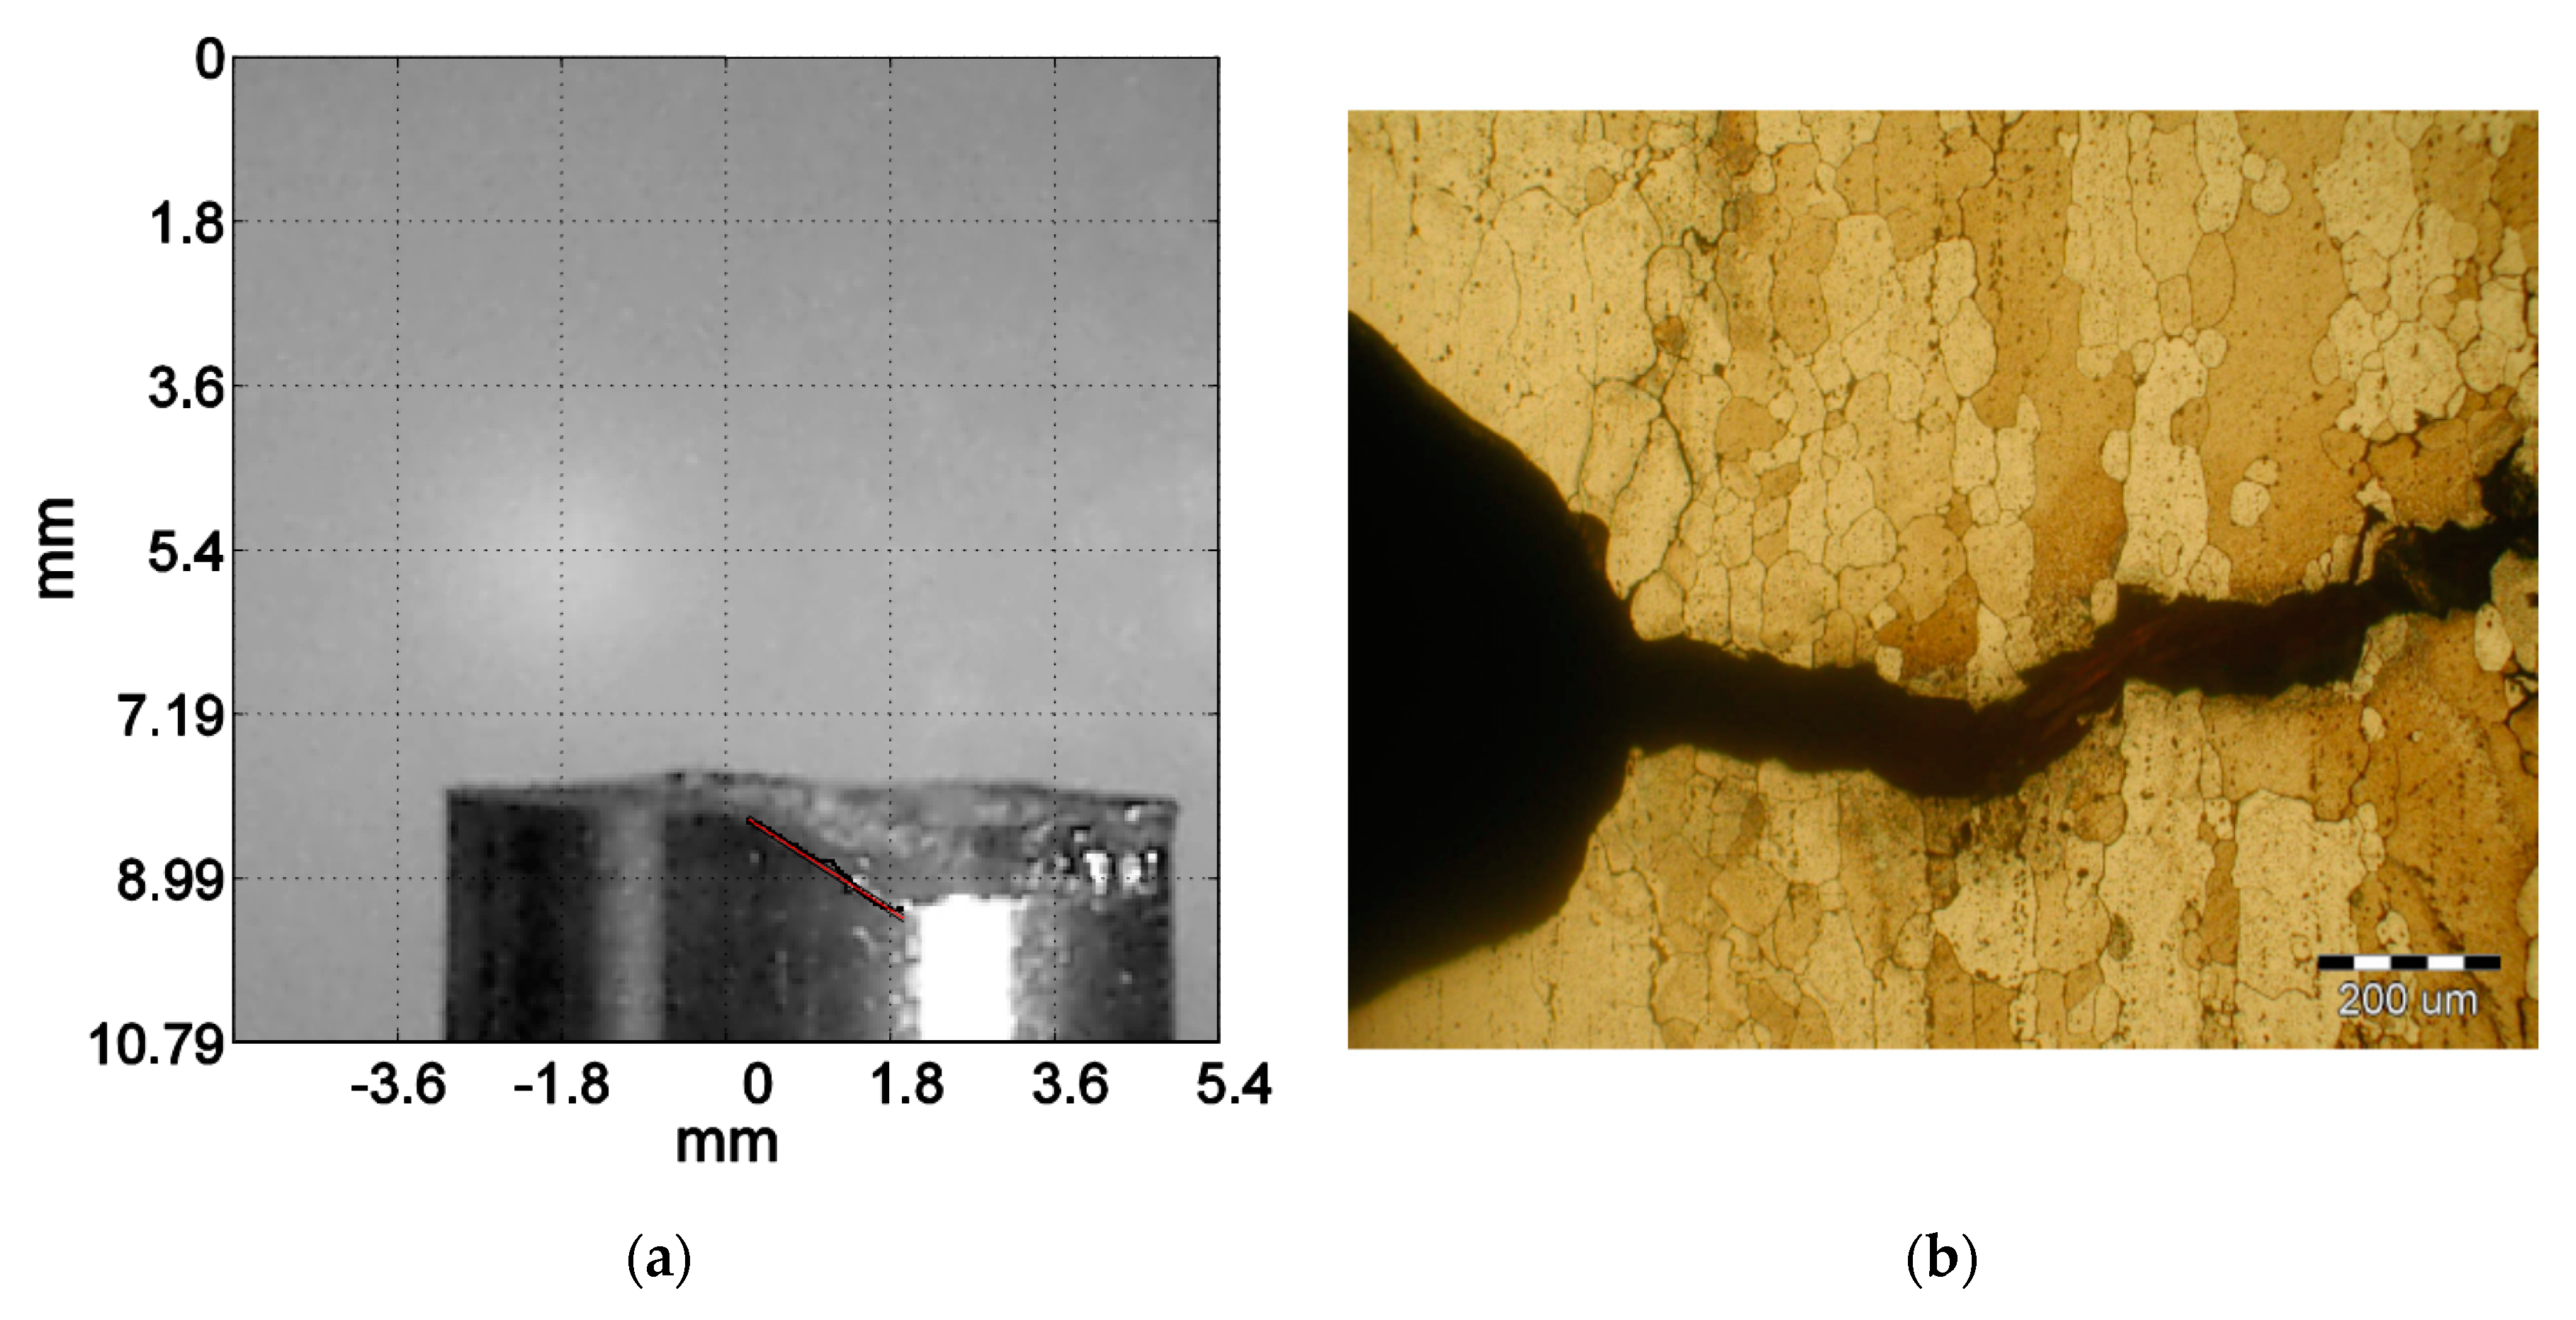
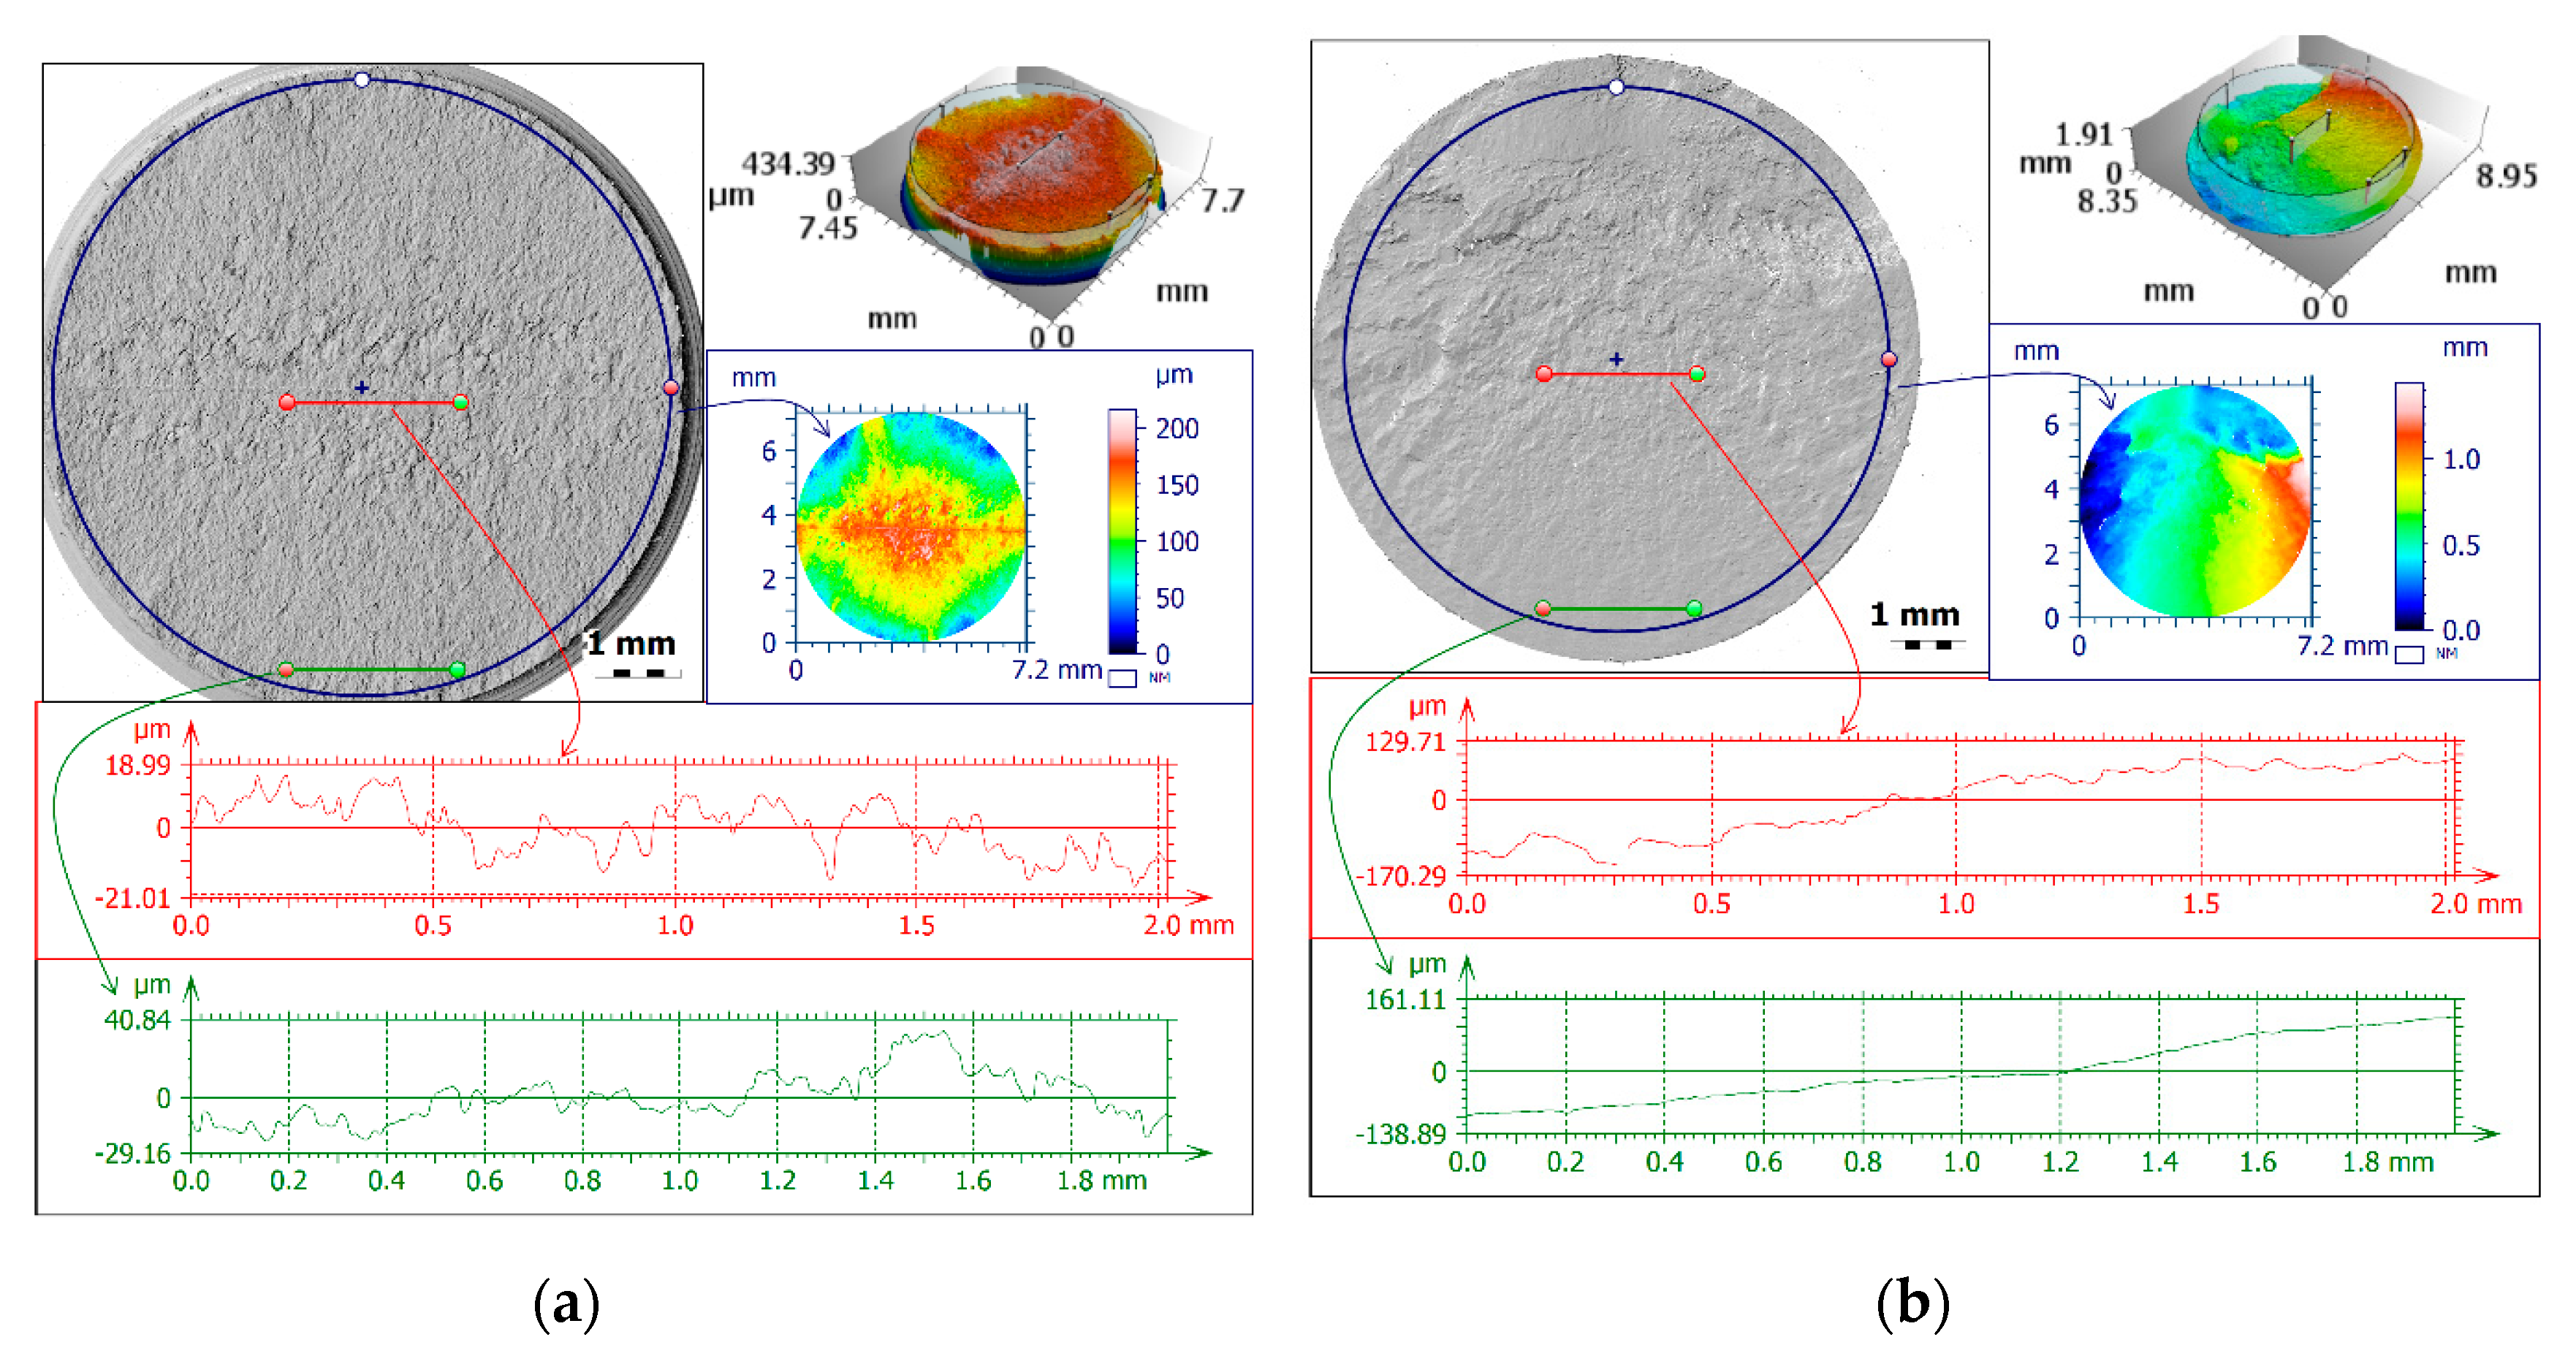
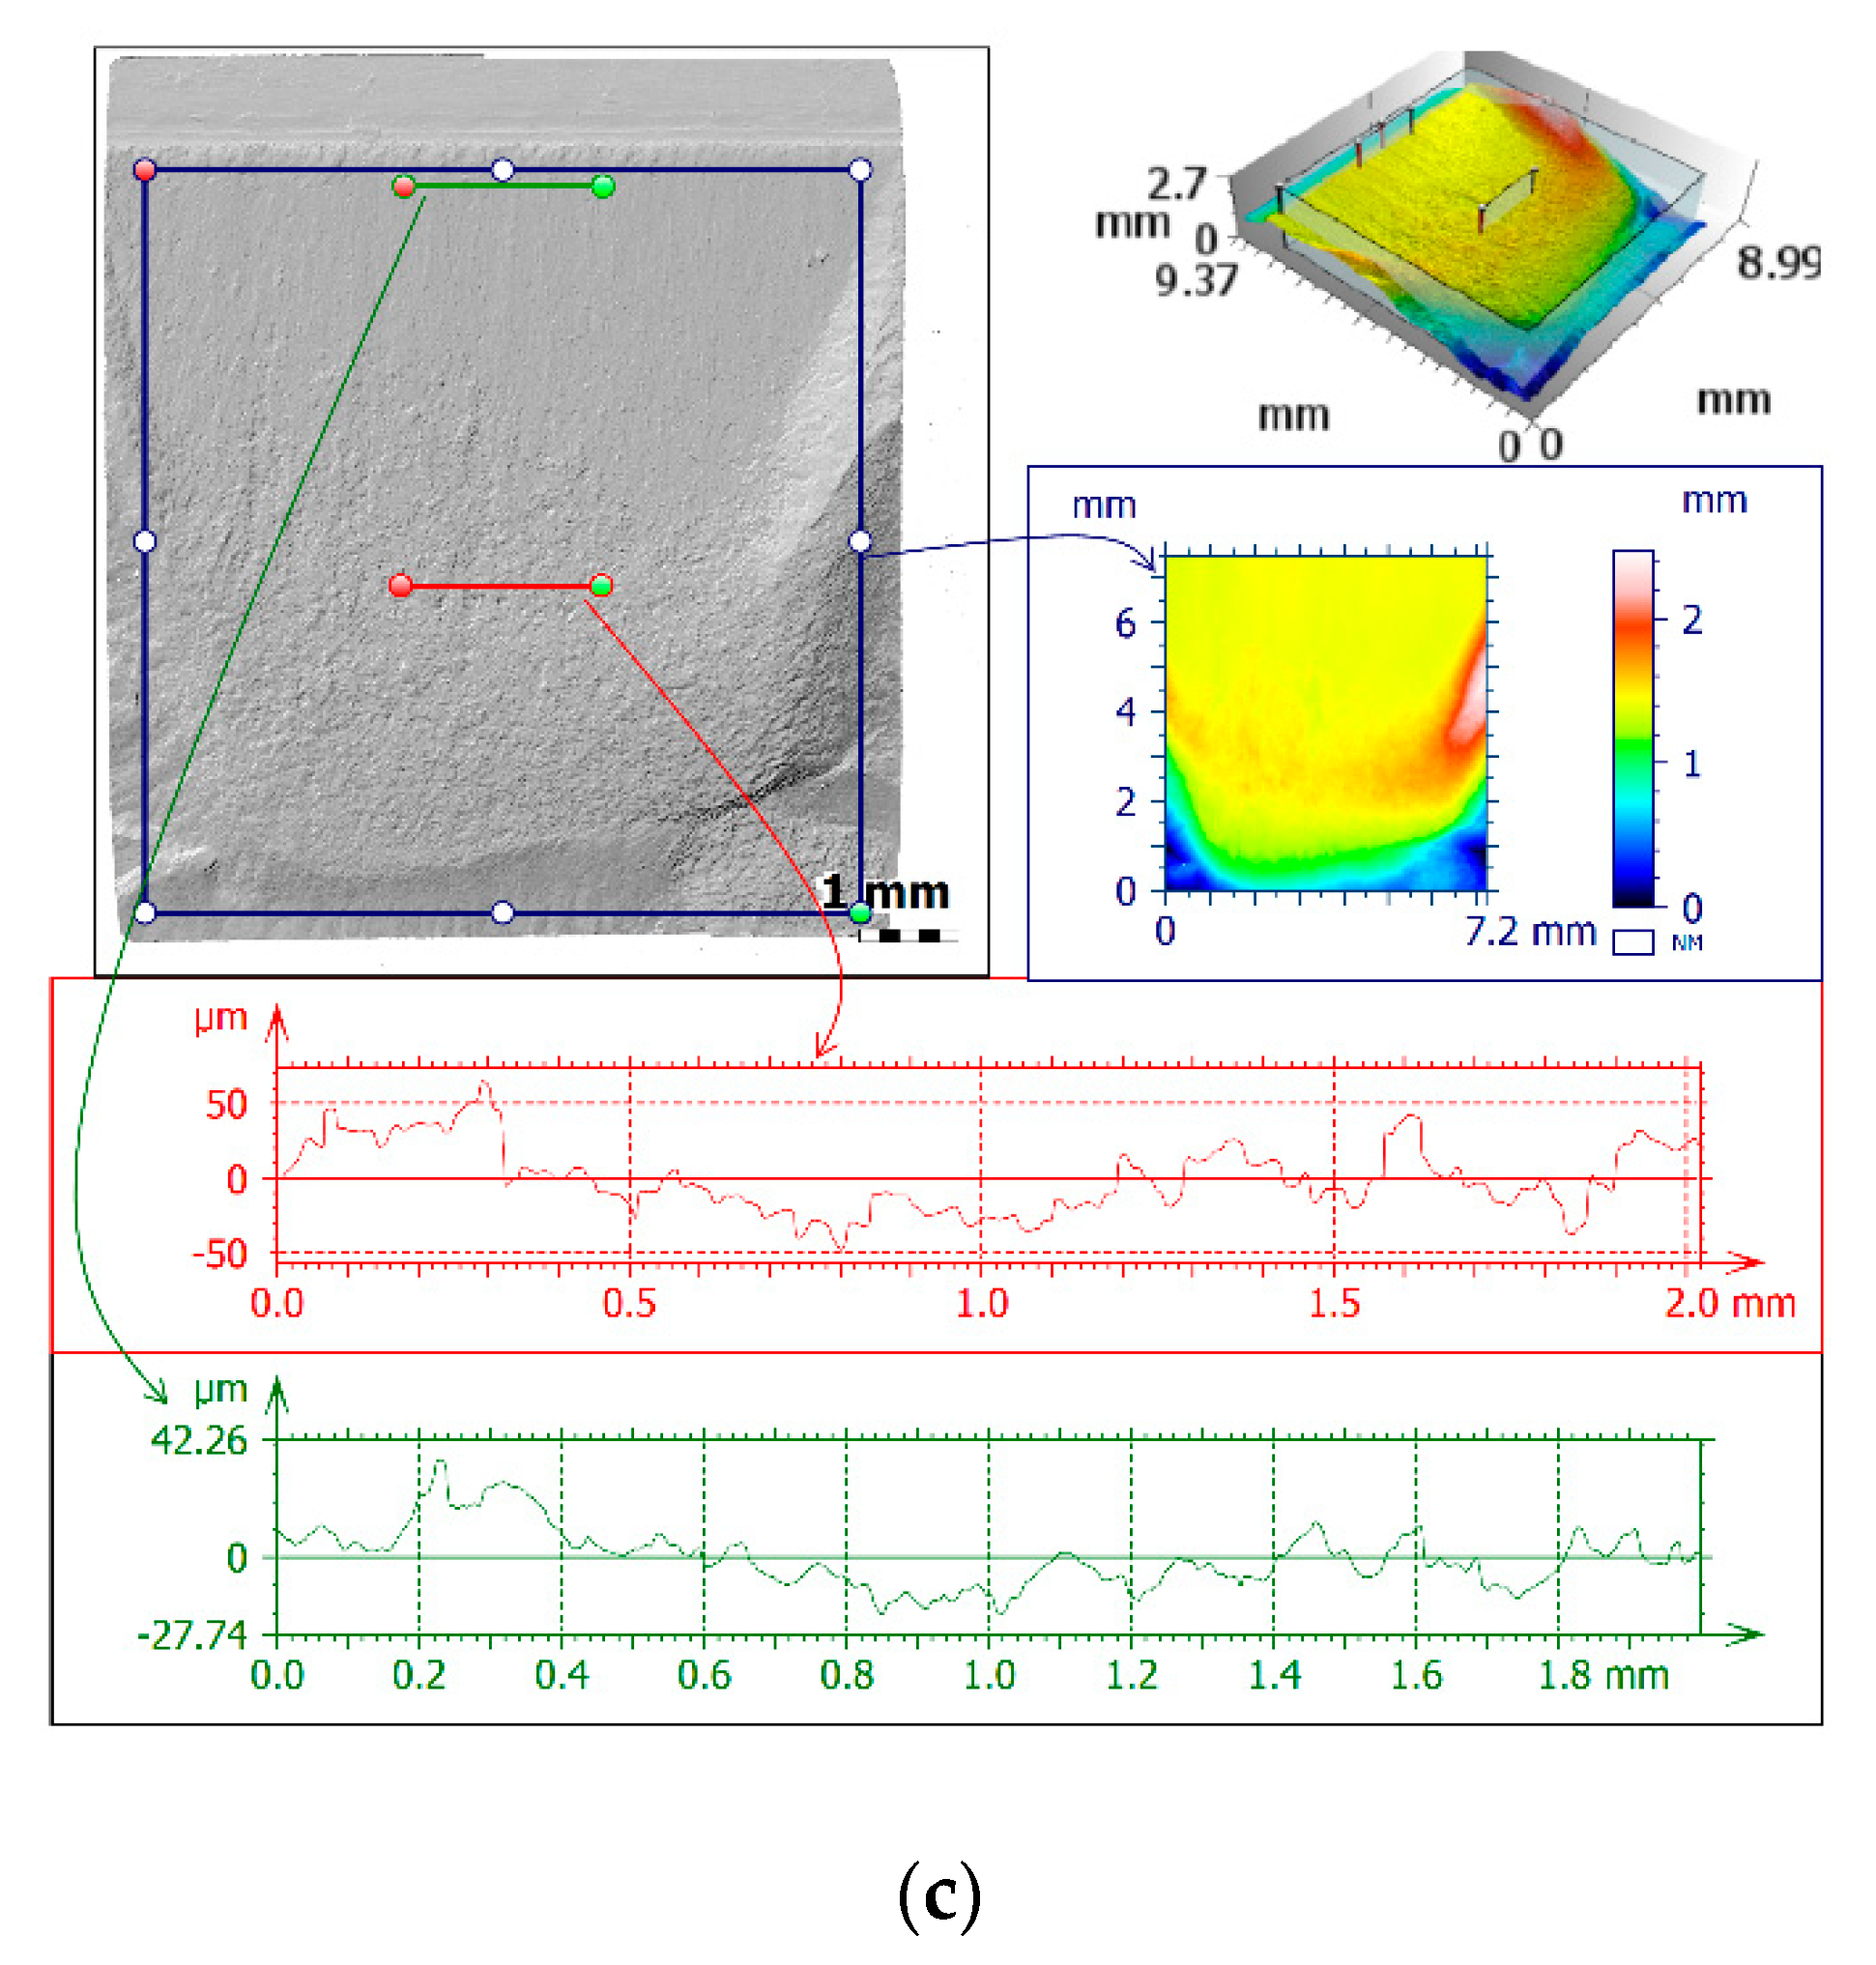
- Both profile and areal surface parameters are essential for fatigue fracture mechanism characterisation. However, if we compare profiles of R-roughness and areal S-roughness parameters, the latter give complete information, because a single line cannot identify pits or valleys, and shows the relationship between surface functions. 3D measurements give far more comprehensive information than 2D profiles or sections.
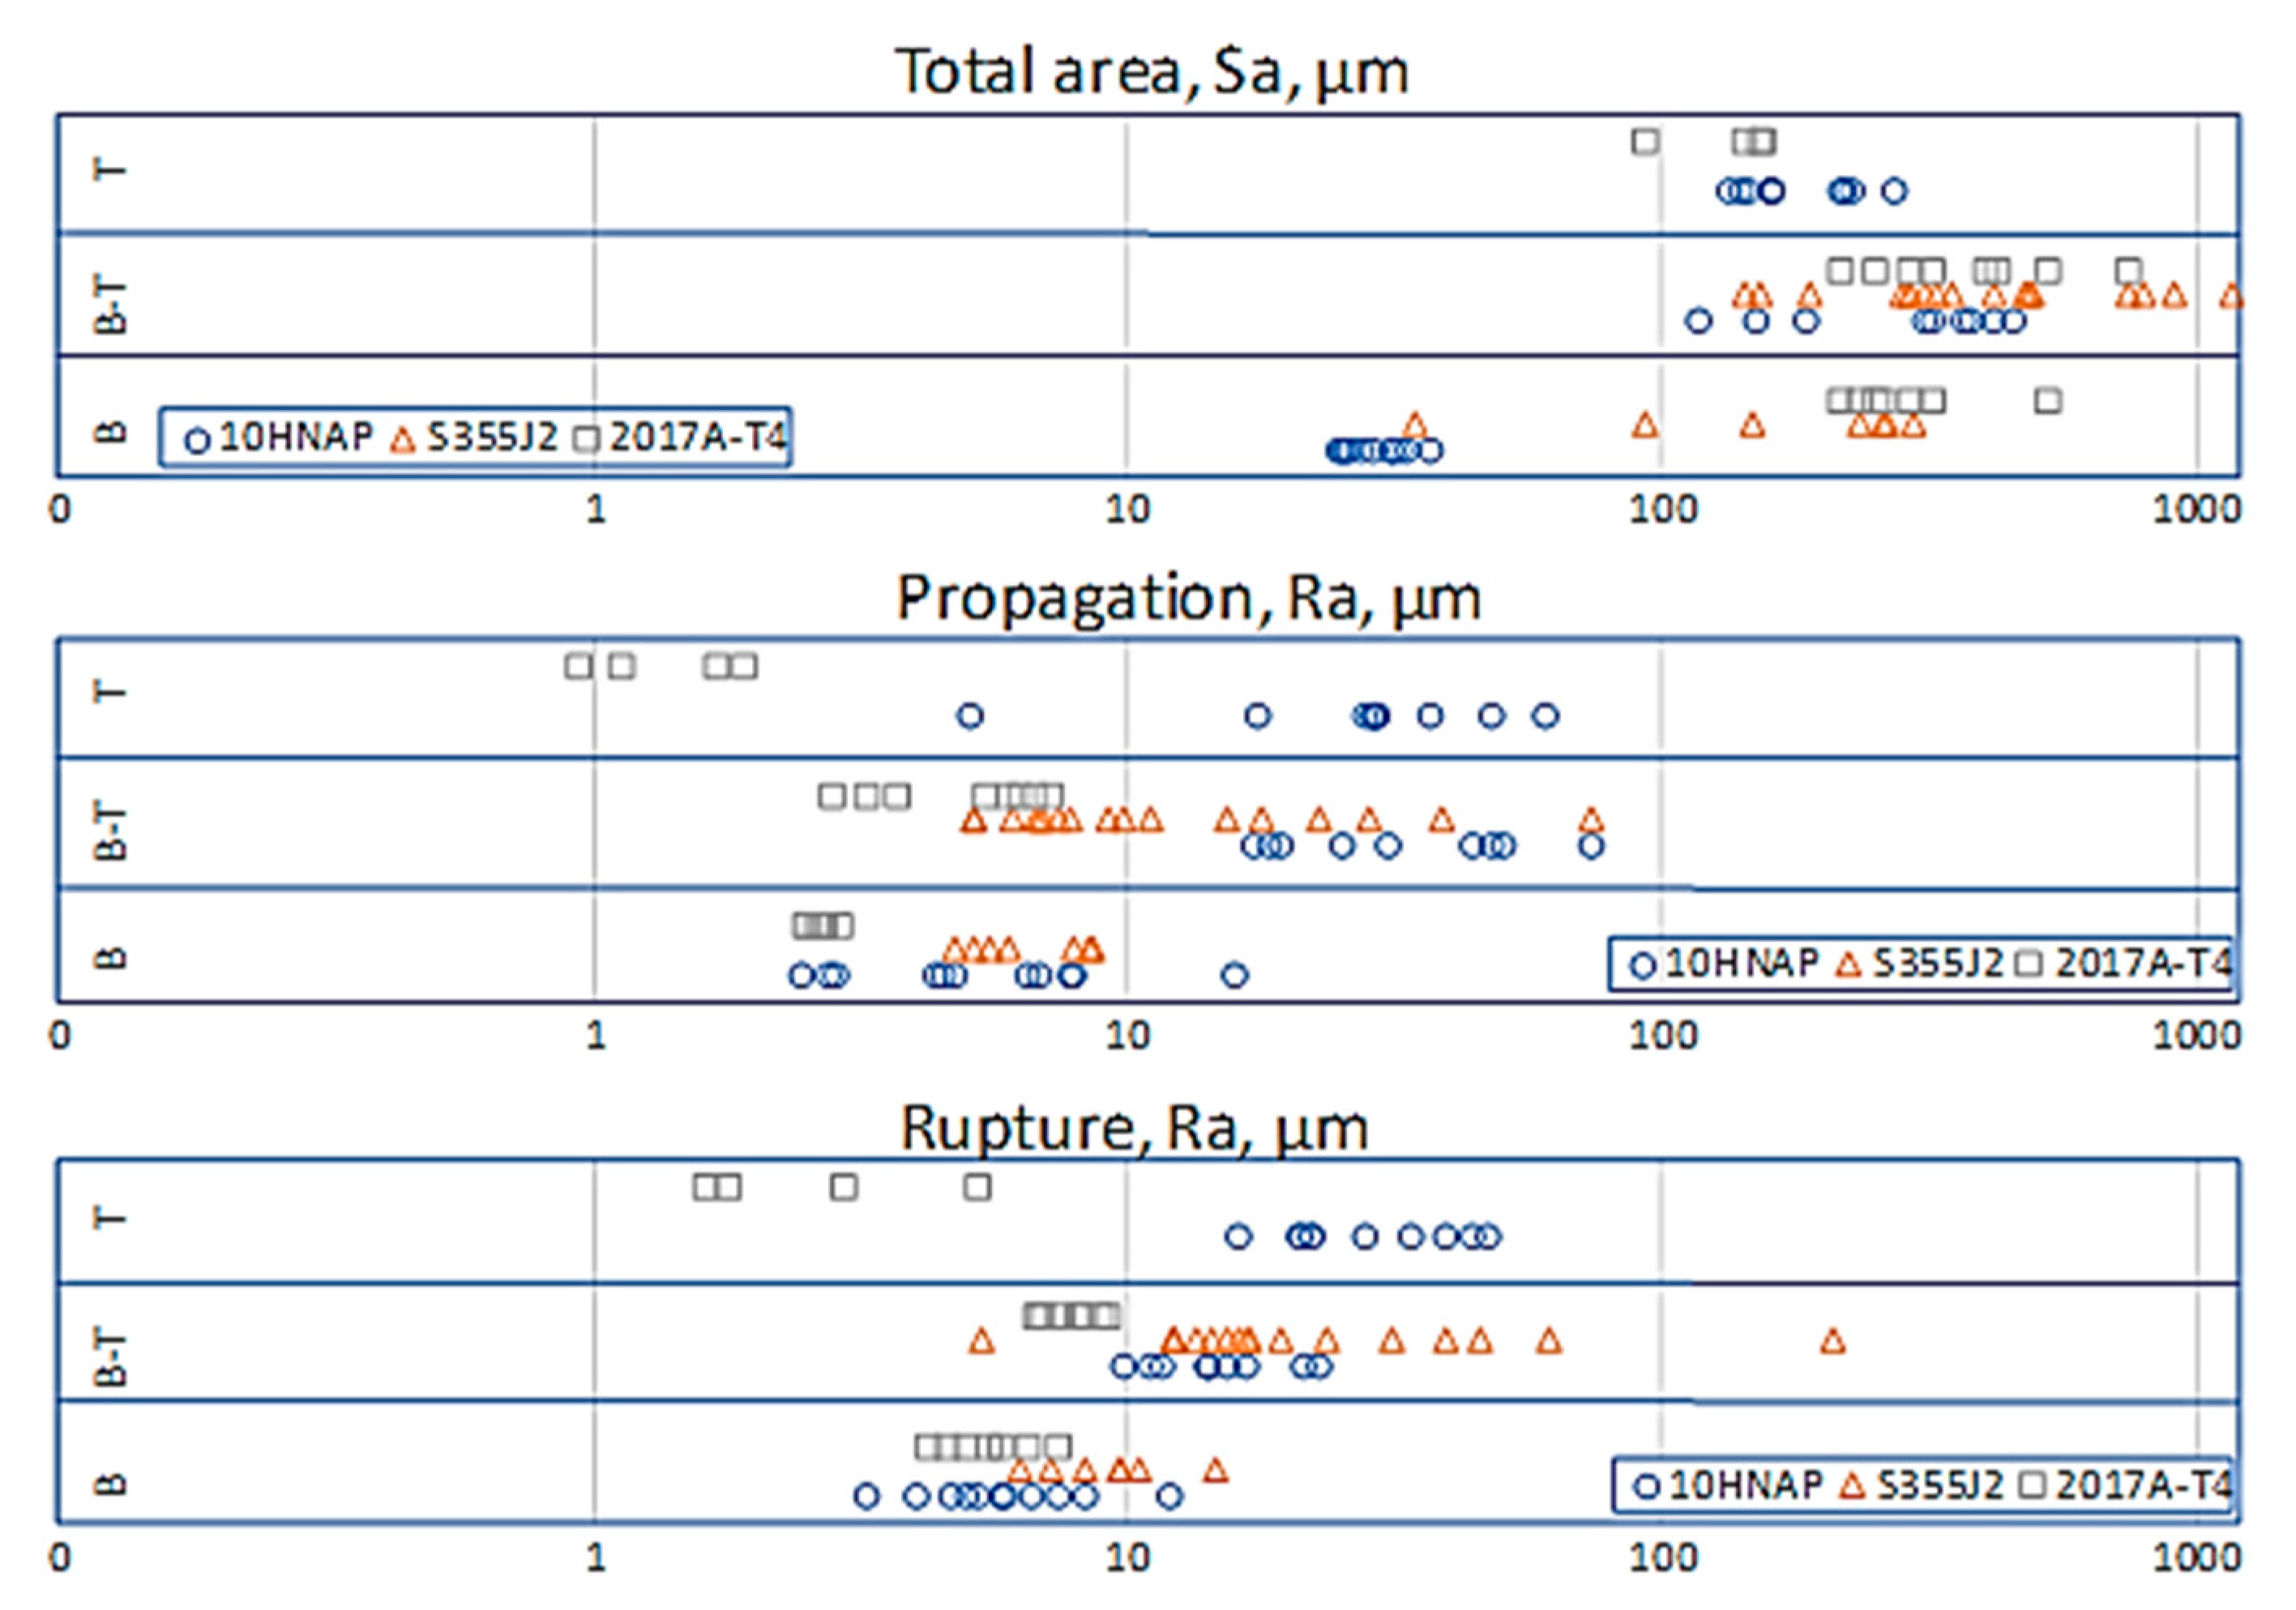
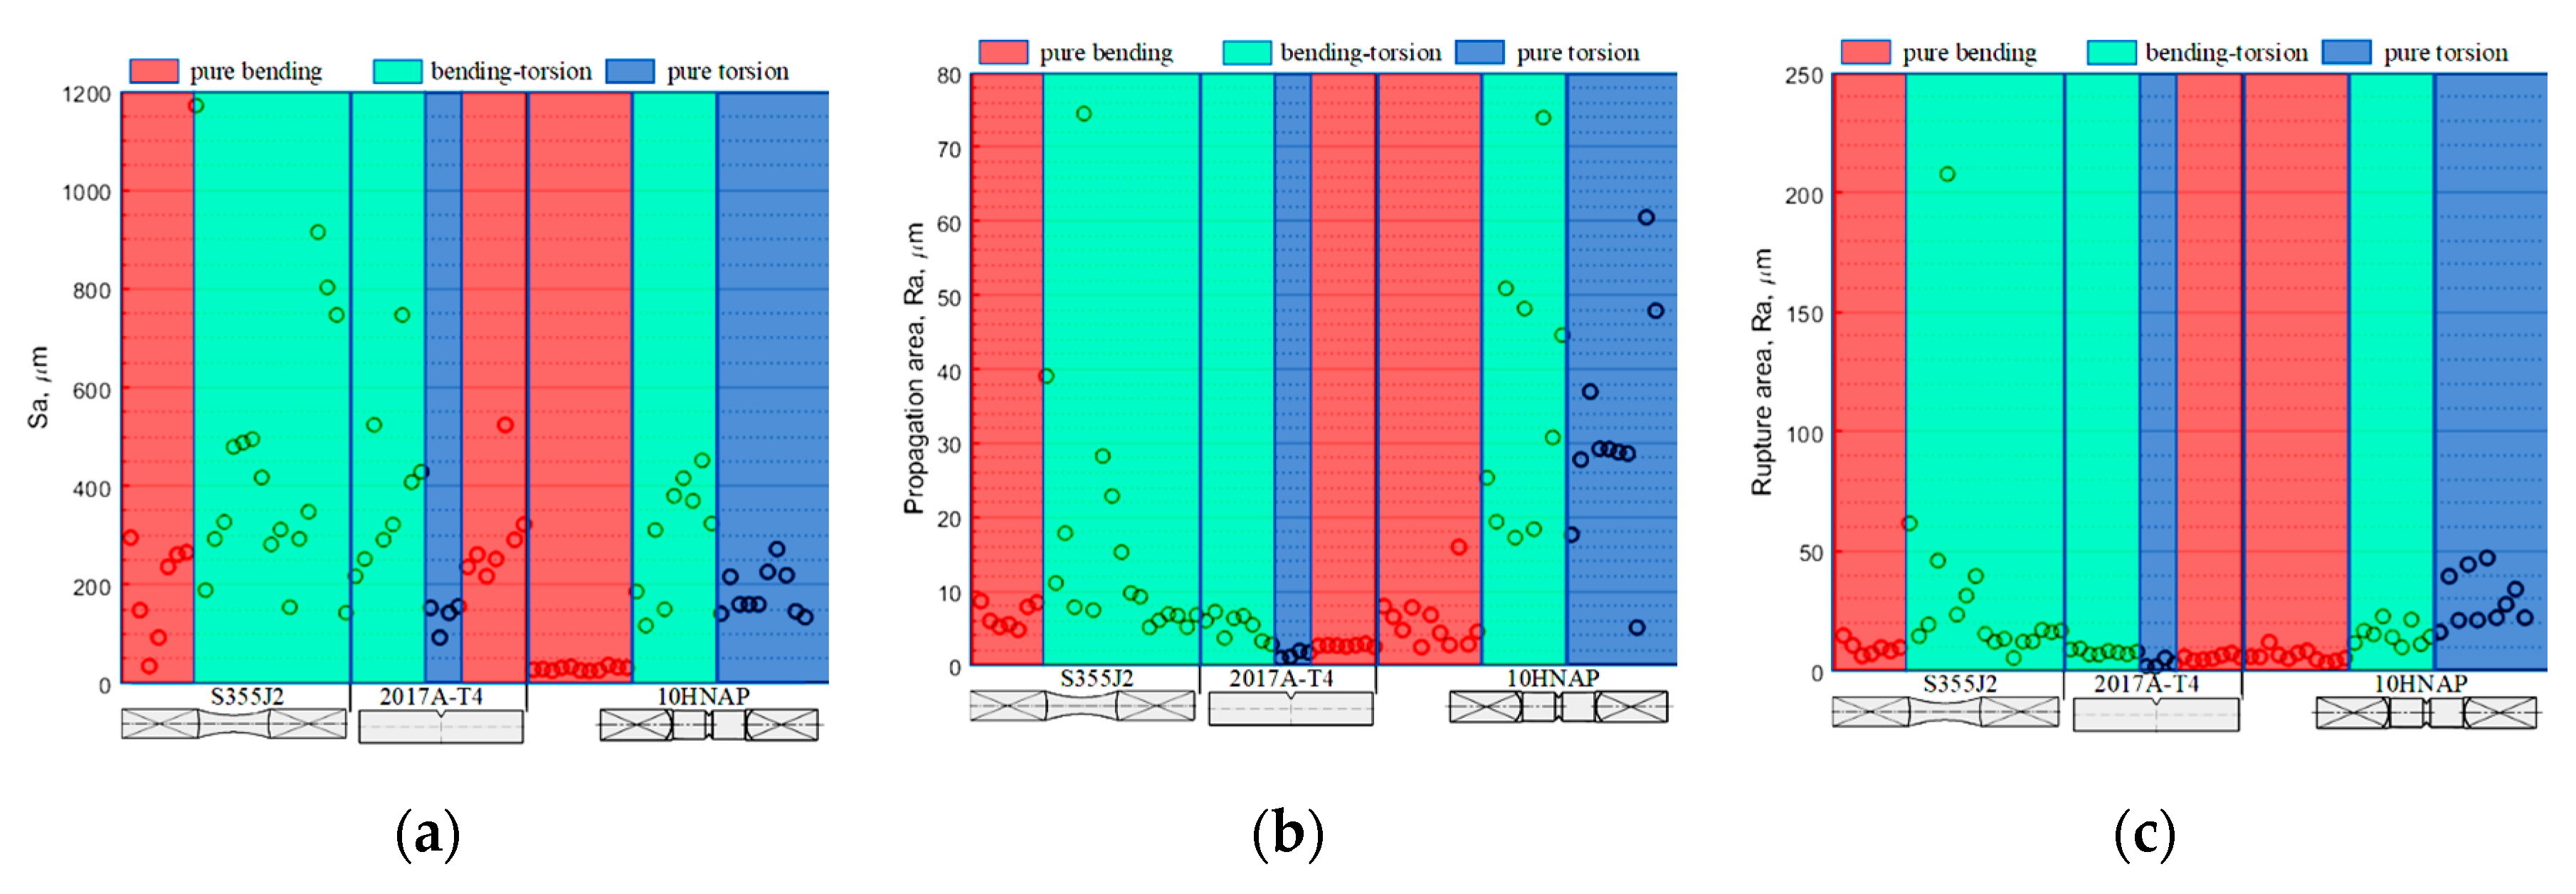
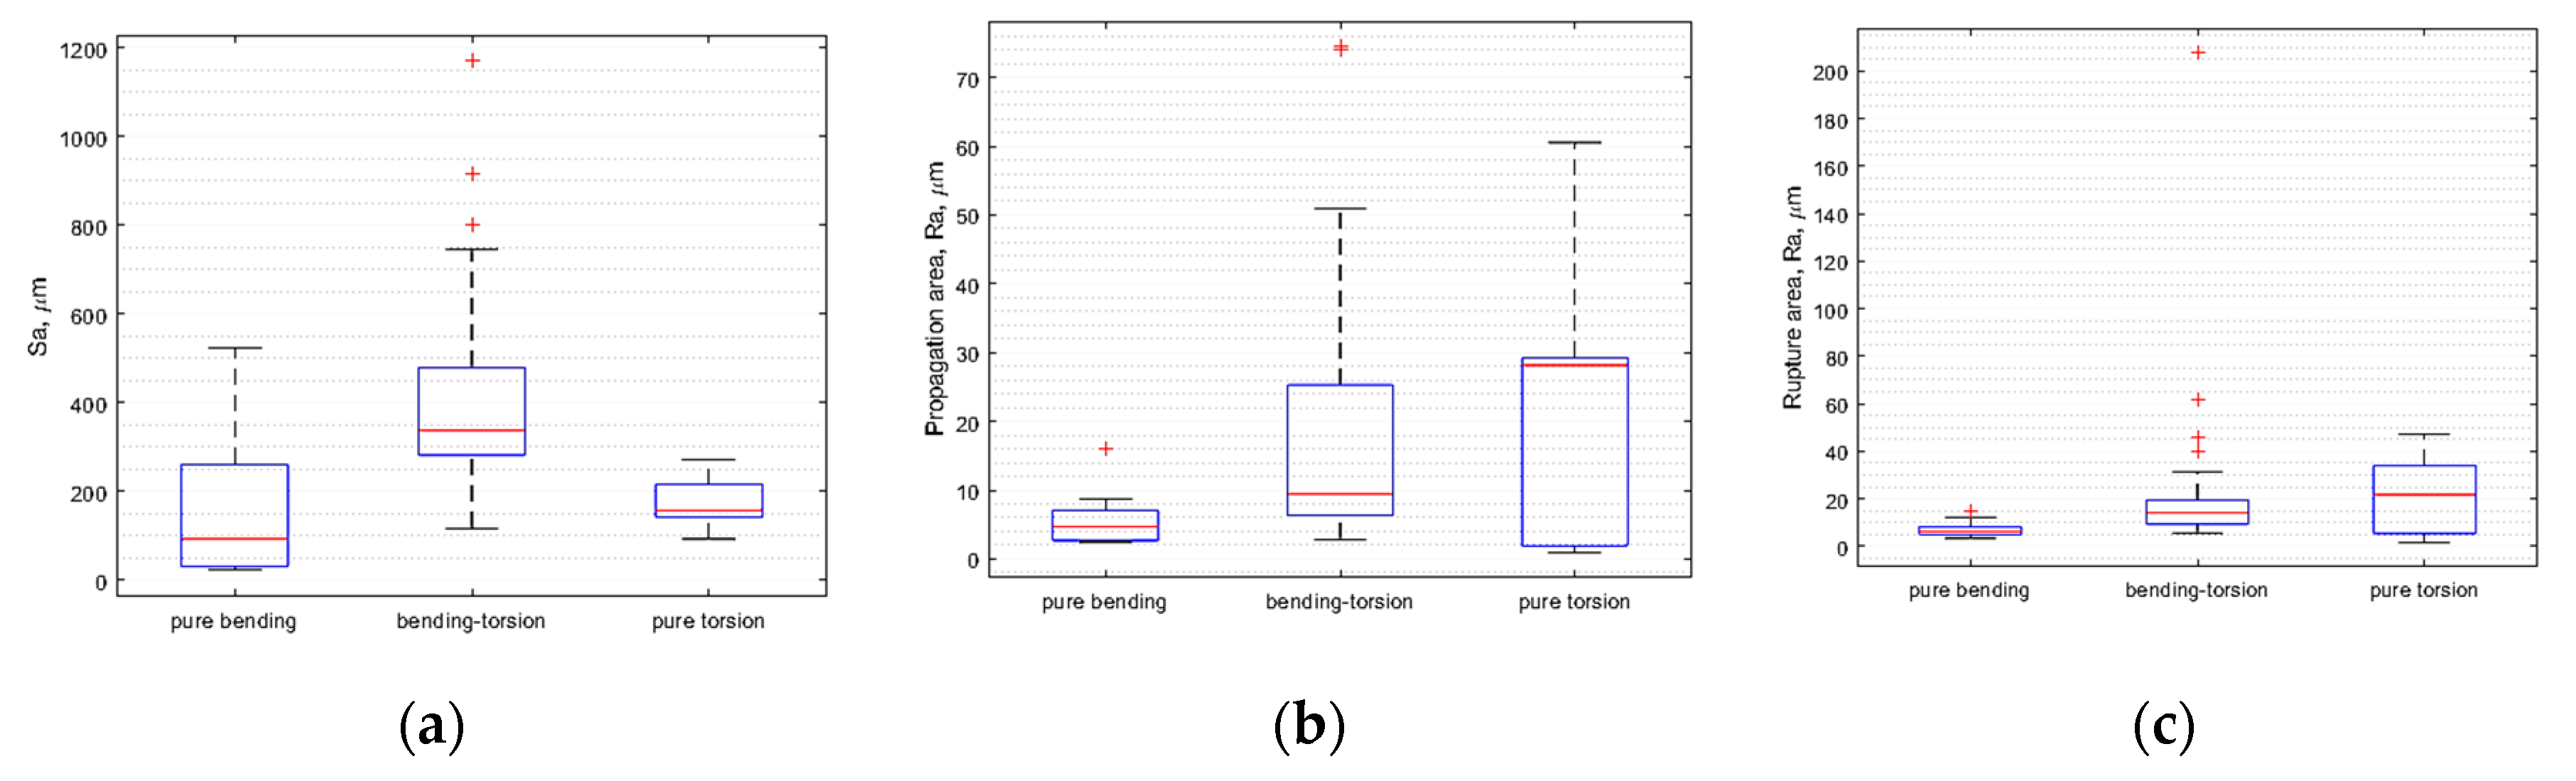
- For both zones (propagation and rupture), the median Ra increases along with the increase in the proportion of torsional loadings. Otherwise, for total area, the mixed mode causes the highest average Sa value, and this conclusion can be considered appropriate given the greater accuracy of this method. This is also confirmed by the results for the individual types of specimens.
- The Sa parameter is more universal, independent of measurement orientation.
Author Contributions
Funding
Conflicts of Interest
References
- Ulewicz, R.; Nový, F.; Novák, P.; Palček, P. The investigation of the fatigue failure of passenger carriage draw-hook. Eng. Fail. Anal. 2019, 104, 609–616. [Google Scholar] [CrossRef]
- Branco, R.; Antunes, F.V.; Costa, J.D.; Yang, F.P.; Kuang, Z.B. Determination of the Paris law constants in round bars from beach marks on fracture surfaces. Eng. Fract. Mech. 2012, 96, 96–106. [Google Scholar] [CrossRef]
- Su, Y.; Yu, F.-H.; Han, Q.-N.; Shang, Y.-B.; Rui, S.-S.; Li, J.; Shi, H.-J.; Niu, L.-S. Failure analysis of runway centerline light and effect of microstructure on mechanical properties. Eng. Fail. Anal. 2019, 105, 1069–1078. [Google Scholar] [CrossRef]
- Branco, R.; Costa, J.D.; Berto, F.; Antunes, F.V. Effect of loading orientation on fatigue behaviour in severely notched round bars under non-zero mean stress bending-torsion. Theor. Appl. Fract. Mech. 2017, 92, 185–197. [Google Scholar] [CrossRef]
- Lesiuk, G.; Rymsza, B.; Rabiega, J.; Correia, J.A.F.O.; De Jesus, A.M.P.; Calcada, R. Influence of loading direction on the static and fatigue fracture properties of the long term operated metallic materials. Eng. Fail. Anal. 2019, 96, 409–425. [Google Scholar] [CrossRef]
- Azevedo, C.R.F.; Marques, E.R. Three-dimensional analysis of fracture, corrosion and wear surfaces. Eng. Fail. Anal. 2010, 17, 286–300. [Google Scholar] [CrossRef]
- Szala, M.; Walczak, M.; Pasierbiewicz, K.; Kamiński, M. Cavitation erosion and sliding wear mechanisms of AlTiN and TiAlN films deposited on stainless steel substrate. Coatings 2019, 9, 340. [Google Scholar] [CrossRef]
- Macek, W.; Owsiński, R.; Trembacz, J.; Branco, R. Three-dimensional fractographic analysis of total fracture areas in 6082 aluminium alloy specimens under fatigue bending with controlled damage degree. Mech. Mater. 2020, 147, 103410. [Google Scholar] [CrossRef]
- Becker, W.T.; Lampman, S. Fracture appearance and mechanisms of deformation and fracture. In Failure Analysis and Prevention; Becker, W.T., Shipley, R.J., Eds.; ASM International: Materials Park, OH, USA, 2002; pp. 559–586. ISBN 978-1-62708-180-1. [Google Scholar]
- Lynch, S.P.; Moutsos, S. A brief history of fractography. J. Fail. Anal. Prev. 2006, 6, 54–69. [Google Scholar] [CrossRef]
- Miletić, I.; Ilić, A.; Nikolić, R.R.; Ulewicz, R.; Ivanović, L.; Sczygiol, N. Analysis of selected properties of Welded joints of the HSLA steels. Mater. Basel Switz. 2020, 13, 1301. [Google Scholar] [CrossRef]
- Taira, S.; Tanaka, K.; Ryu, J.G. X-ray diffraction approach to the mechanics of fatigue and fracture in metals. Mech. Res. Commun. 1974, 1, 161–166. [Google Scholar] [CrossRef]
- Leer, B.V.; Genc, A.; Passey, R. Ga+ and Xe+ FIB milling and measurement of FIB damage in aluminum. Microsc. Microanal. 2017, 23, 296–297. [Google Scholar] [CrossRef][Green Version]
- Karbalaei Akbari, M.; Baharvandi, H.R.; Shirvanimoghaddam, K. Tensile and fracture behavior of nano/micro TiB2 particle reinforced casting A356 aluminum alloy composites. Mater. Des. 2015, 66, 150–161. [Google Scholar] [CrossRef]
- Lemaitre, J. How to use damage mechanics. Nucl. Eng. Des. 1984, 80, 233–245. [Google Scholar] [CrossRef]
- Kelly, J.; Mohammadi, M. Uniaxial tensile behavior of sheet molded composite car hoods with different fibre contents under quasi-static strain rates. Mech. Res. Commun. 2018, 87, 42–52. [Google Scholar] [CrossRef]
- Szala, M.; Łukasik, D. Pitting corrosion of the resistance welding joints of stainless steel ventilation grille operated in swimming pool environment. Int. J. Corros. 2018, 2018, 9408670. [Google Scholar] [CrossRef]
- Hutiu, G.; Duma, V.-F.; Demian, D.; Bradu, A.; Podoleanu, A.G. Assessment of ductile, brittle, and fatigue fractures of metals using optical coherence tomography. Metals 2018, 8, 117. [Google Scholar] [CrossRef]
- Kubit, A.; Trzepiecinski, T.; Faes, K.; Drabczyk, M.; Bochnowski, W.; Korzeniowski, M. Analysis of the effect of structural defects on the fatigue strength of RFSSW joints using C-scan scanning acoustic microscopy and SEM. Fatigue Fract. Eng. Mater. Struct. 2019, 42, 1308–1321. [Google Scholar] [CrossRef]
- Lesiuk, G.; Szata, M.; Rozumek, D.; Marciniak, Z.; Correia, J.; De Jesus, A. Energy response of S355 and 41Cr4 steel during fatigue crack growth process. J. Strain Anal. Eng. Des. 2018, 53, 663–675. [Google Scholar] [CrossRef]
- Kasprzyczak, L.; Macha, E.; Marciniak, Z. Energy Parameter Control System of Strength Machine for Material Tests under Cyclic Bending and Torsion. Available online: https://doi.org/10.4028/www.scientific.net/SSP.198.489 (accessed on 5 May 2020).
- Kowal, M.; Szala, M. Diagnosis of the microstructural and mechanical properties of over century-old steel railway bridge components. Eng. Fail. Anal. 2020, 110, 104447. [Google Scholar] [CrossRef]
- Krawczyk, J.; Pacyna, J.; Bała, P. Fracture toughness of steels with nickel content in respect of carbide morphology. Mater. Sci. Technol. 2015, 31, 795–802. [Google Scholar] [CrossRef]
- Derpeński, Ł. Ductile fracture behavior of notched aluminum alloy specimens under complex non-proportional load. Materials 2019, 12, 1598. [Google Scholar] [CrossRef] [PubMed]
- Żebrowski, R.; Walczak, M.; Korga, A.; Iwan, M.; Szala, M. Effect of shot peening on the mechanical properties and cytotoxicity behaviour of titanium implants produced by 3D printing technology. J. Healthc. Eng. 2019, 2019, 8169538. [Google Scholar] [CrossRef] [PubMed]
- Nový, F.; Bokůvka, O.; Trško, L.; Jambor, M. Safe choice of structural steels in a region of ultra-high number of load cycles. Prod. Eng. Arch. 2019, 24, 25–28. [Google Scholar] [CrossRef]
- Walczak, M.; Pasierbiewicz, K.; Szala, M. Adhesion and mechanical properties of TiAlN and AlTiN magnetron sputtered coatings deposited on the DMSL titanium alloy substrate. Acta Phys. Pol. A 2019, 136, 294–298. [Google Scholar] [CrossRef]
- Maslarevic, A.; Bakic, G.M.; Djukic, M.B.; Rajicic, B.; Maksimovic, V.; Pavkov, V. Microstructure and wear behavior of MMC coatings deposited by plasma transferred Arc welding and thermal flame spraying processes. Trans. Indian Inst. Met. 2020, 73, 259–271. [Google Scholar] [CrossRef]
- Szala, M.; Dudek, A.; Maruszczyk, A.; Walczak, M.; Chmiel, J.; Kowal, M. Effect of atmospheric plasma sprayed TiO2-10% NiAl cermet coating thickness on cavitation erosion, sliding and abrasive wear resistance. Acta Phys. Pol. A 2019, 136, 335–341. [Google Scholar] [CrossRef]
- Slámečka, K.; Pokluda, J.; Ponížil, P.; Major, Š.; Šandera, P. On the topography of fracture surfaces in bending–torsion fatigue. Eng. Fract. Mech. 2008, 75, 760–767. [Google Scholar] [CrossRef]
- de Freitas, M.; Reis, L.; Meggiolaro, M.A.; de Castro, J.T.P. Stress scale factor and critical plane models under multiaxial proportional loading histories. Eng. Fract. Mech. 2017, 174, 104–116. [Google Scholar] [CrossRef]
- Karolczuk, A. Plastic strains and the macroscopic critical plane orientations under combined bending and torsion with constant and variable amplitudes. Eng. Fract. Mech. 2006, 73, 1629–1652. [Google Scholar] [CrossRef]
- Santus, C.; Taylor, D.; Benedetti, M. Experimental determination and sensitivity analysis of the fatigue critical distance obtained with rounded V-notched specimens. Int. J. Fatigue 2018, 113, 113–125. [Google Scholar] [CrossRef]
- Macek, W.; Wołczański, T. Analysis of fracture roughness parameters of S355J2 steel and EN AW-2017A-T4 aluminium alloy. ITM Web Conf. 2017, 15, 06002. [Google Scholar] [CrossRef][Green Version]
- Macek, W.; Faszynka, S.; Deptuła, A. Fracture surface analysis of the EN AW-2017A-T4 specimens with rectangular section. In Proceedings of the Mechatronics 2017—Ideas for Industrial Applications, Wisła, Poland, 2017; Świder, J., Kciuk, S., Trojnacki, M., Eds.; Springer International Publishing: Cham, Switzerland, 2019; pp. 290–297. [Google Scholar]
- Singh, A.K.; Datta, S.; Chattopadhyay, A.; Riddick, J.C.; Hall, A.J. Fatigue crack initiation and propagation behavior in Al-7075 alloy under in-phase bending-torsion loading. Int. J. Fatigue 2019, 126, 346–356. [Google Scholar] [CrossRef]
- Valoroso, N.; Debruyne, G.; Laverne, J. A cohesive zone model with rate-sensitivity for fast crack propagation. Mech. Res. Commun. 2014, 58, 82–87. [Google Scholar] [CrossRef]
- Martins, R.F.; Ferreira, L.; Reis, L.; Chambel, P. Fatigue crack growth under cyclic torsional loading. Theor. Appl. Fract. Mech. 2016, 85, 56–66. [Google Scholar] [CrossRef]
- Macek, W. Post-failure fracture surface analysis of notched steel specimens after bending-torsion fatigue. Eng. Fail. Anal. 2019, 105, 1154–1171. [Google Scholar] [CrossRef]
- Macek, W. Fractal analysis of the bending-torsion fatigue fracture of aluminium alloy. Eng. Fail. Anal. 2019, 99, 97–107. [Google Scholar] [CrossRef]
- Marciniak, Z.; Rozumek, D.; Macha, E. Fatigue lives of 18G2A and 10HNAP steels under variable amplitude and random non-proportional bending with torsion loading. Int. J. Fatigue 2008, 30, 800–813. [Google Scholar] [CrossRef]
- Rozumek, D.; Faszynka, S. Fatigue crack growth in 2017A-T4 alloy subjected to proportional bending with torsion. Frat. Ed Integrità Strutt. 2017, 11, 23–29. [Google Scholar] [CrossRef]
- Rozumek, D.; Marciniak, Z. Control system of the fatigue stand for material tests under combined bending with torsion loading and experimental results. Mech. Syst. Signal Process. 2008, 22, 1289–1296. [Google Scholar] [CrossRef]
- Achtelik, H.; Lachowicz, C.; Lagoda, T.; Macha, E. Fatigue characteristics of the notched specimens of 10HNAP steel under cyclic and random synchronous bending with torsion. In Proceedings of the 2nd Annual Fatigue Meeting of Copernicus Contract CIPA CT940194, Metz, France, 30–31 August 1996; pp. 176–191. [Google Scholar]
- Kapłonek, W.; Nadolny, K.; Królczyk, G.M. The use of focus-variation microscopy for the assessment of active surfaces of a new generation of coated abrasive tools. Meas. Sci. Rev. 2016, 16, 42–53. [Google Scholar] [CrossRef]
- Newton, L.; Senin, N.; Gomez, C.; Danzl, R.; Helmli, F.; Blunt, L.; Leach, R. Areal topography measurement of metal additive surfaces using focus variation microscopy. Addit. Manuf. 2019, 25, 365–389. [Google Scholar] [CrossRef]
- Macek, W.; Rozumek, D.; Królczyk, G.M. Surface topography analysis based on fatigue fractures obtained with bending of the 2017A-T4 alloy. Measurement 2020, 152, 107347. [Google Scholar] [CrossRef]
- Neimitz, A.; Galkiewicz, J.; Lipiec, S.; Dzioba, I. Estimation of the onset of crack growth in ductile materials. Materials 2018, 11, 2026. [Google Scholar] [CrossRef] [PubMed]
- Kim, J.; Kang, J.W.; Lee, D.-E.; Kim, D.Y. Methodology for evaluation of residual stress effect on small corner-crack initiation and growth. Materials 2019, 12, 2904. [Google Scholar] [CrossRef]
- Djoković, J.M.; Nikolić, R.R.; Ulewicz, R.; Hadzima, B. Interface crack approaching a three-material joint. Appl. Sci. 2020, 10, 416. [Google Scholar] [CrossRef]
- Nikolić, R.R.; Djoković, J.M.; Hadzima, B.; Ulewicz, R. Spot-weld service life estimate based on application of the interfacial crack concept. Materials 2020, 13, 2976. [Google Scholar] [CrossRef]
- Stachowiak, G.W.; Batchelor, A.W. Engineering Tribology; Elsevier Butterworth-Heinemann: Amsterdam, The Netherlands; Boston, MA, USA, 2005; ISBN 978-0-7506-7836-0. [Google Scholar]
- Deptuła, A.; Macek, W.; Partyka, M.A. Analysis of loading history influence on fatigue and fracture surface parameters using the method of induction trees. In Proceedings of the MATEC Web of Conferences, Lublin, Poland, 17–19 June 2019; Volume 252, p. 08003. [Google Scholar]
- Macek, W.; Branco, R.; Trembacz, J.; Costa, J.D.; Ferreira, J.A.M.; Capela, C. Effect of multiaxial bending-torsion loading on fracture surface parameters in high-strength steels processed by conventional and additive manufacturing. Eng. Fail. Anal. 2020, 104784. [Google Scholar] [CrossRef]


| Element | 10HNAP | S355J2 | AW-2017A-T4 |
|---|---|---|---|
| C | 0.115 | 0.21 | - |
| Si | 0.41 | 0.42 | 0.45 |
| Mn | 0.71 | 1.46 | 0.65 |
| P | 0.082 | 0.019 | - |
| S | 0.028 | 0.046 | - |
| Cr | 0.81 | 0.09 | 0.10 |
| Ni | 0.50 | 0.04 | - |
| Cu | 0.30 | 0.17 | 4.15 |
| Zn | - | - | 0.50 |
| Mg | - | - | 0.69 |
| Ti | - | - | 0.20 |
| Al | - | - | Balance |
| Fe | Balance | Balance | 0.70 |
| Material Properties | 10HNAP [44] | S355J2 [41] | AW-2017A-T4 [42] |
|---|---|---|---|
| Ultimate tensile stress, σu (MPa) | 566 | 533 | 480 |
| Yield stress, σy (MPa) | 418 | 358 | 382 |
| Elongation A10 (%) | A10 = 30.1 | A5 = 21 | A5 = 15 |
| Reduction of area RA (%) | 36.5 | 50 | 50 |
| Young’s modulus E (GPa) | 215 | 210 | 72 |
| Poisson’s ratio ν | 0.29 | 0.30 | 0.32 |
| Material | Specimen | ||
|---|---|---|---|
| λ | R | Ref. | |
| 10HNAP | 0; 0.5; ∞ | −1 | [44] |
| S355J2 | 0; 0.16−0.6 | −1 | [41] |
| AW-2017A | 0; 0.18−0.44; ∞ | −1; −0.5; 0; 1 | [35,42] |
| Height Parameters | |||
|---|---|---|---|
| Sq | µm | Root-mean-square height | |
| Ssk | - | Skewness | |
| Sku | - | Kurtosis | |
| Sp | µm | Maximum peak height | Sp = Sz − Sv |
| Sv | µm | Maximum pit height | Absolute value of the height of the largest pit within the defined area |
| Sz | µm | Maximum height | Height between the highest peak and the deepest valley |
| Sa | µm | Arithmetical mean height | Mean surface roughness |
| Functional Parameters (Volume) | |||
| Vm | mm3/mm2 | Material volume | Parameters describing the characteristics of the volume of the appropriate size to the surface area of the surface being examined |
| Vv | mm3/mm2 | Void volume | |
| Vmp | mm3/mm2 | Peak material volume | |
| Vmc | mm3/mm2 | Core material volume | |
| Vvc | mm3/mm2 | Core void volume | |
| Vvv | mm3/mm2 | Pit void volume | |
| Method | Specimen | ||
|---|---|---|---|
| 10HNAP | S355J2 | AW-2017A | |
| Total area max. | BT | BT | BT |
| Propagation profile max. | BT | BT | BT |
| Rupture profile max. | T | BT | BT |
| Total area min. | B | B | T |
| Propagation profile min. | B | B | T |
| Rupture profile min. | B | B | T |
| Reference Area/Median Extremum | Bending | Bending–Torsion | Torsion |
|---|---|---|---|
| Total area | MIN. | MAX. | - |
| Propagation profile | MIN. | - | MAX. |
| Rupture profile | MIN. | - | MAX. |
© 2020 by the authors. Licensee MDPI, Basel, Switzerland. This article is an open access article distributed under the terms and conditions of the Creative Commons Attribution (CC BY) license (http://creativecommons.org/licenses/by/4.0/).
Share and Cite
Macek, W.; Branco, R.; Szala, M.; Marciniak, Z.; Ulewicz, R.; Sczygiol, N.; Kardasz, P. Profile and Areal Surface Parameters for Fatigue Fracture Characterisation. Materials 2020, 13, 3691. https://doi.org/10.3390/ma13173691
Macek W, Branco R, Szala M, Marciniak Z, Ulewicz R, Sczygiol N, Kardasz P. Profile and Areal Surface Parameters for Fatigue Fracture Characterisation. Materials. 2020; 13(17):3691. https://doi.org/10.3390/ma13173691
Chicago/Turabian StyleMacek, Wojciech, Ricardo Branco, Mirosław Szala, Zbigniew Marciniak, Robert Ulewicz, Norbert Sczygiol, and Piotr Kardasz. 2020. "Profile and Areal Surface Parameters for Fatigue Fracture Characterisation" Materials 13, no. 17: 3691. https://doi.org/10.3390/ma13173691
APA StyleMacek, W., Branco, R., Szala, M., Marciniak, Z., Ulewicz, R., Sczygiol, N., & Kardasz, P. (2020). Profile and Areal Surface Parameters for Fatigue Fracture Characterisation. Materials, 13(17), 3691. https://doi.org/10.3390/ma13173691