Article

Process-Induced Distortions Characterization of MBWK Fabric Reinforced Composite Helmet Shell

1
School of Textile Science and Engineering, Tiangong University, Tianjin 300387, China
2
Key Laboratory of Advanced Textile Composite of Ministry of Education, Tiangong University, Tianjin 300387, China
*
Author to whom correspondence should be addressed.
Materials 2020, 13(13), 2983; https://doi.org/10.3390/ma13132983
Submission received: 15 June 2020 / Revised: 1 July 2020 / Accepted: 1 July 2020 / Published: 4 July 2020
(This article belongs to the Special Issue Non-destructive Testing Methods for Composite Materials)

Abstract

:
In order to characterize the process-induced distortions of 3D thin shell composites with complex shape, the multilayered biaxial weft knitted (MBWK) fabric reinforced high-performance composite helmet was selected as the research object, and the 3D laser scanning machine was used to scan the helmet surface, then the 3D scanning data was compared with the CAD model to evaluate the deformation. The results and discussion indicated that the conventional method was workable, but the speed of convergence was slow and the calculation results were easy to drop into local optimization. According to detailed analysis, a measurement method focusing on the principle of “Feature Distance” was developed. The measurement results shown that this method can not only give accurate results, but also reduce working procedure and greatly save the computing resources, which is proved to be a feasible approach for the deformation measurement foundation of 3D thin shell textile composites.

1. Introduction

Since the fiber reinforced composites have excellent fatigue resistance, high strength-to-weight and stiffness-to-weight ratios, they have been widely employed in various fields [1,2,3]. As one of the structures in composite engineering, thin shell structure is commonly used in advanced equipment, such as helmet, oxygen mask and unmanned aerial vehicle, etc. [4,5]. However, the residual stress is an inevitable problem during the manufacturing process of composites, which are caused by the mismatch of the coefficients of thermal expansion (CTE) between reinforced fiber and matrix, the shrinkage in the resin polymerization reaction during the curing process, and fiber reorientation during the 3D shape forming process [6,7,8,9,10,11] Additionally, a number of literatures implied that residual stresses may cause composite delamination and matrix fracture, reduce the failure strength, and influence the performance and service life of composite materials. Additionally, the process-induced distortions (PIDs) may affect the structural integrity even lead composites to fail [12,13]. Just due to these problems, the application of thin shell composites is seriously restricted. Therefore, it is meaningful to measure and evaluate the distortion of composite materials with efficient technology.
In recent years, with the development of three-dimensional laser scanning technology, it has developed rapidly in the field of composites quality detection, such as deformation monitoring, dimensional evaluation, and surface defects characterization, etc. [14,15,16]. The analysis results can be employed to die compensation, and process adaptation [17]. Moreover, three-dimensional digital detection is one of the most important key factors of controlling the composite product quality, especially in terms of accurate size control.
Measuring and characterizing the deformations of 3D structural composites have been studied by many researchers [18,19,20,21]. Filippatos et al. [22] used an optical marker recognition system to determine the thickness variation of the composite rotors, for verifying the simulation analysis of the gradual damage behaviour of composite rotors. Xu et al. [23] investigated the deformation of large-scale composite tunnel structure with terrestrial laser scanning (TLS) technology, which could be applied in health monitoring. According to Yang et al. [24], a series of statistical experiments on composite structures under monotonic loads based on TLS measurement were conducted to investigate the deformation behavior of the arch structure. The measurement results also had been applied to build finite element modeling for composite arched structures deformation simulation [25]. Although the existing works made a tremendous contribution to the composite deformation measurement, the tested samples were composed of several planes like L beam, or continuous same curved cross-section such as tunnel, arch, Z shape, U shape, etc. The matter of whether the methods applied to the complex structure with different curved cross-section was not mentioned, such as helmet, oxygen mask, and propeller, etc. which are difficult to find the geometrical center point, centerline, or datum plane when the local surface deformed [26]. According to the literatures mentioned above, the calculation speed is slow, and the accuracy is slow. On the other hand, it is hard to integrate the scanned model and design model into the common coordinating system with the different original points [27].
This paper investigates the process-induced distortions of the MBWK fabric reinforced composite helmet. By comparing the point cloud data with CAD model, the result indicates that it is sometimes difficult to avoid local optima when using traditional iterative closest point (ICP) algorithm to register the point cloud data with the designed CAD model. And a novel measuring strategy based on the “feature distance” is developed, it can characterize the distortion of the composites by the size of the critical parts, which calculate the deformation by scalar rather than vector. This method takes up less computing resources and can achieve good results, in addition, there is no registration convergence problem in this method. Combining with the previous method, it can be used to detect the deformation of complex curved composite structure.

2. Composite Materials and Manufacturing Process

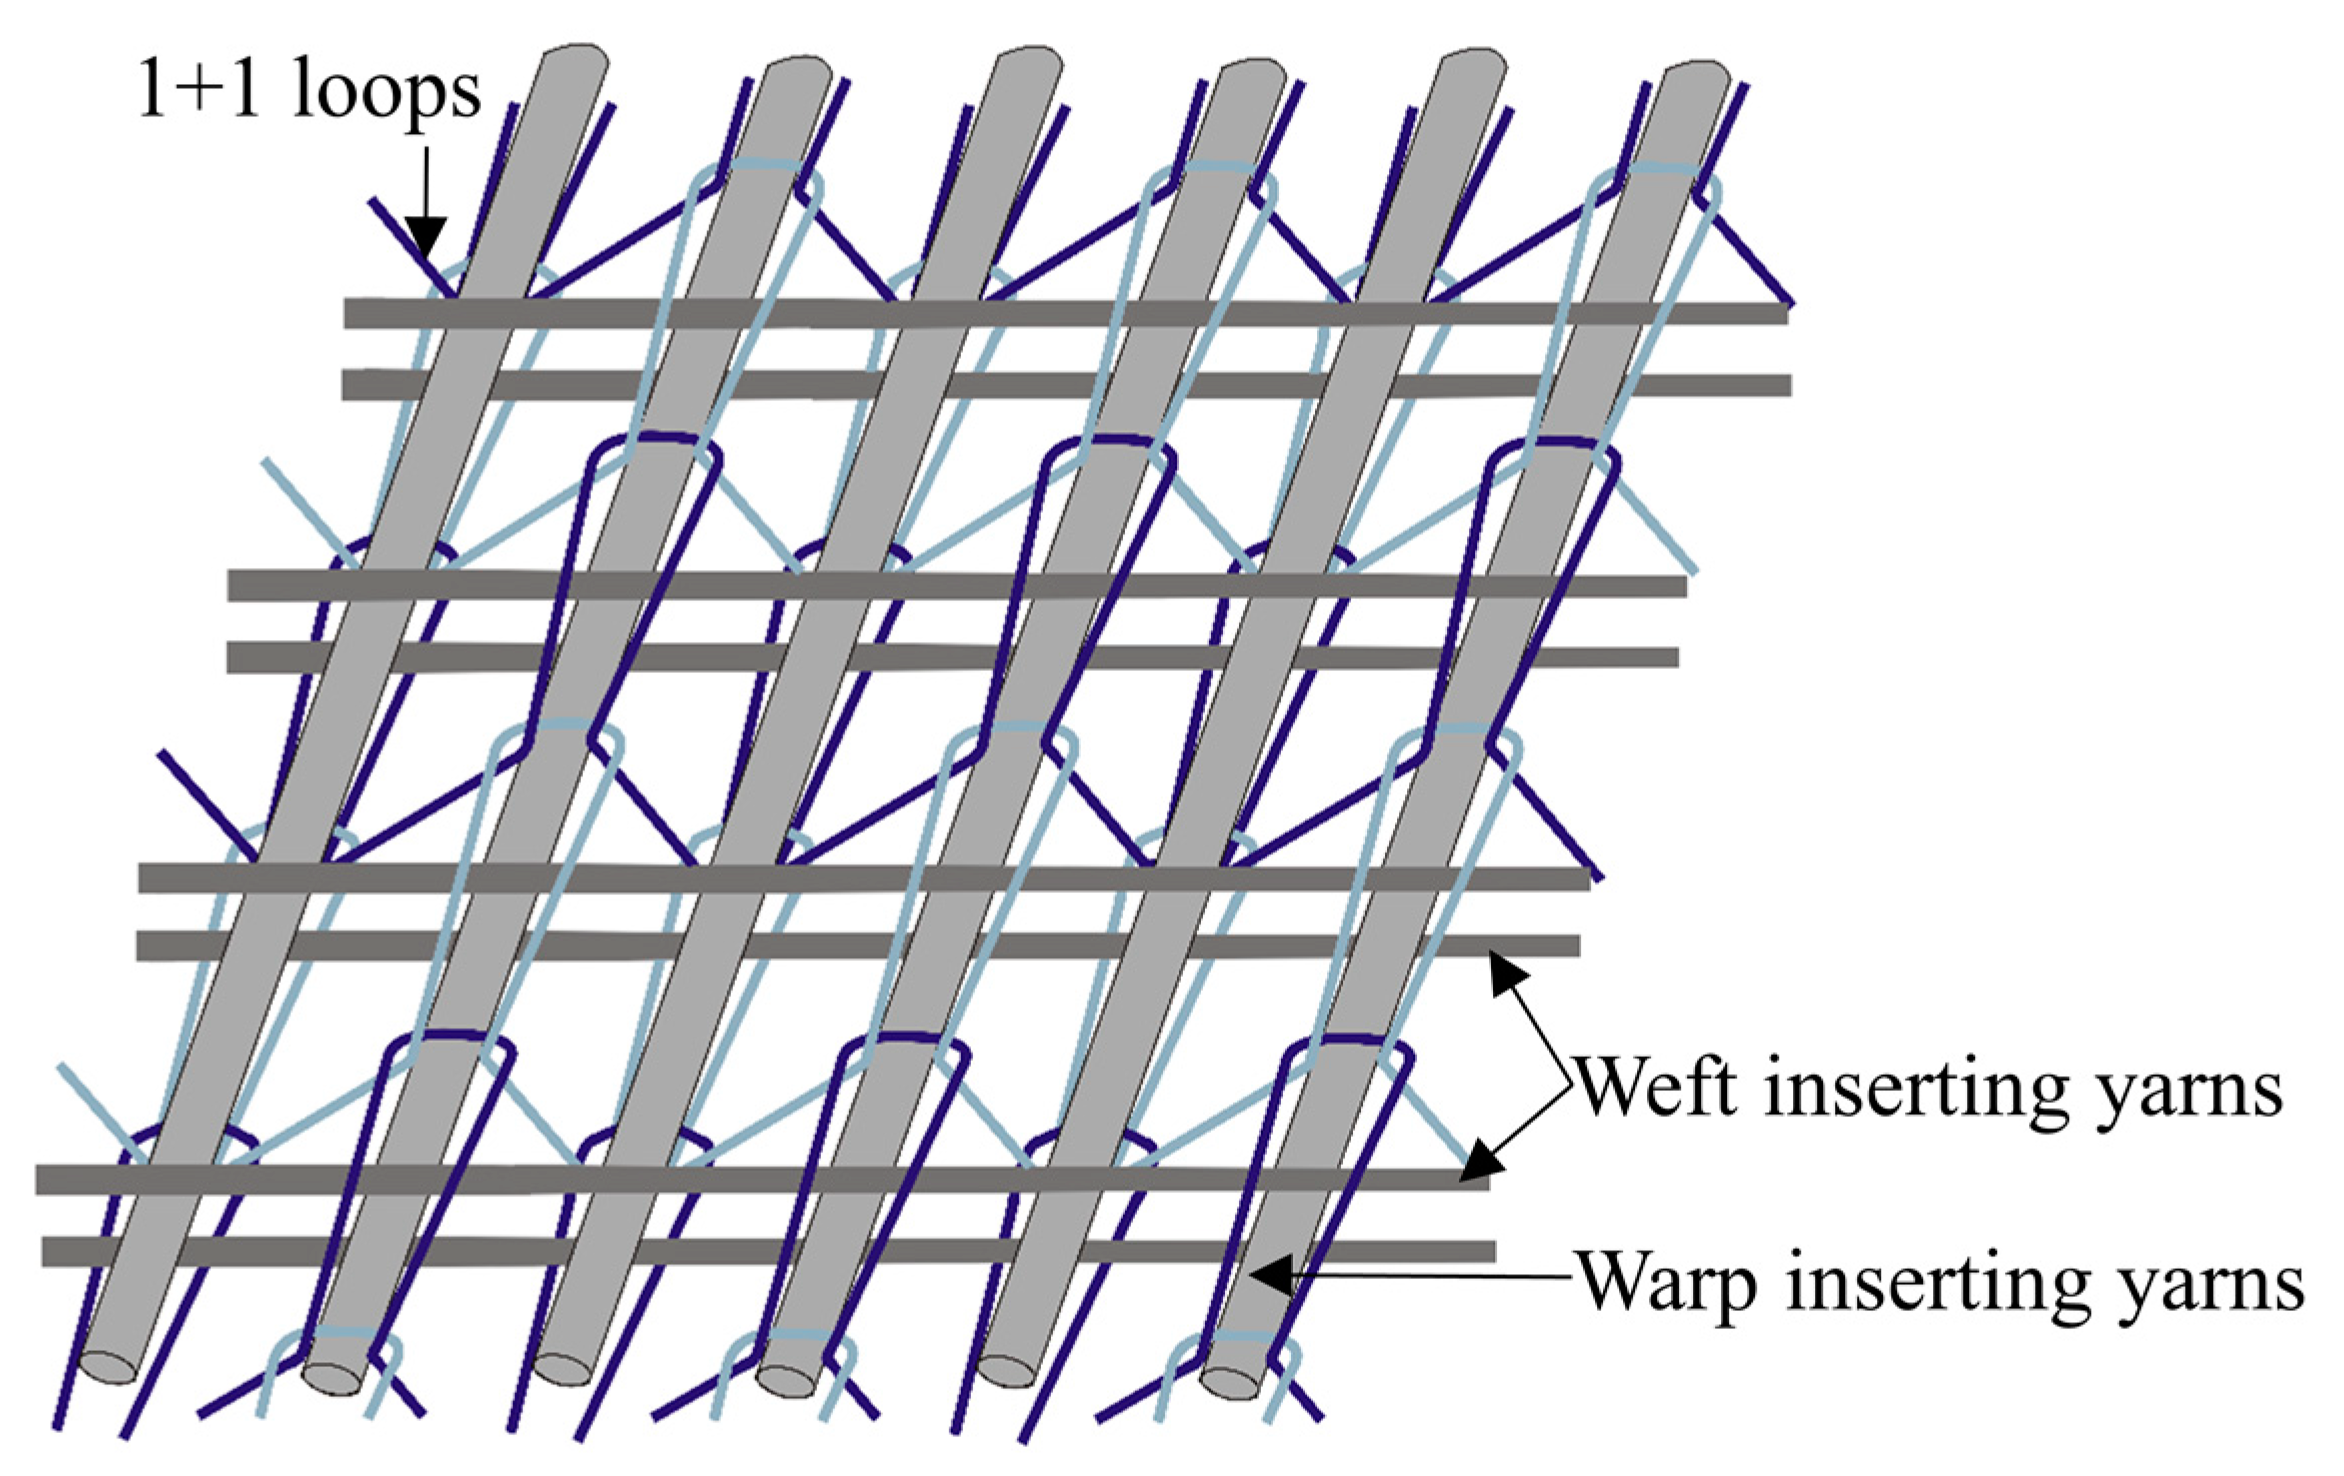
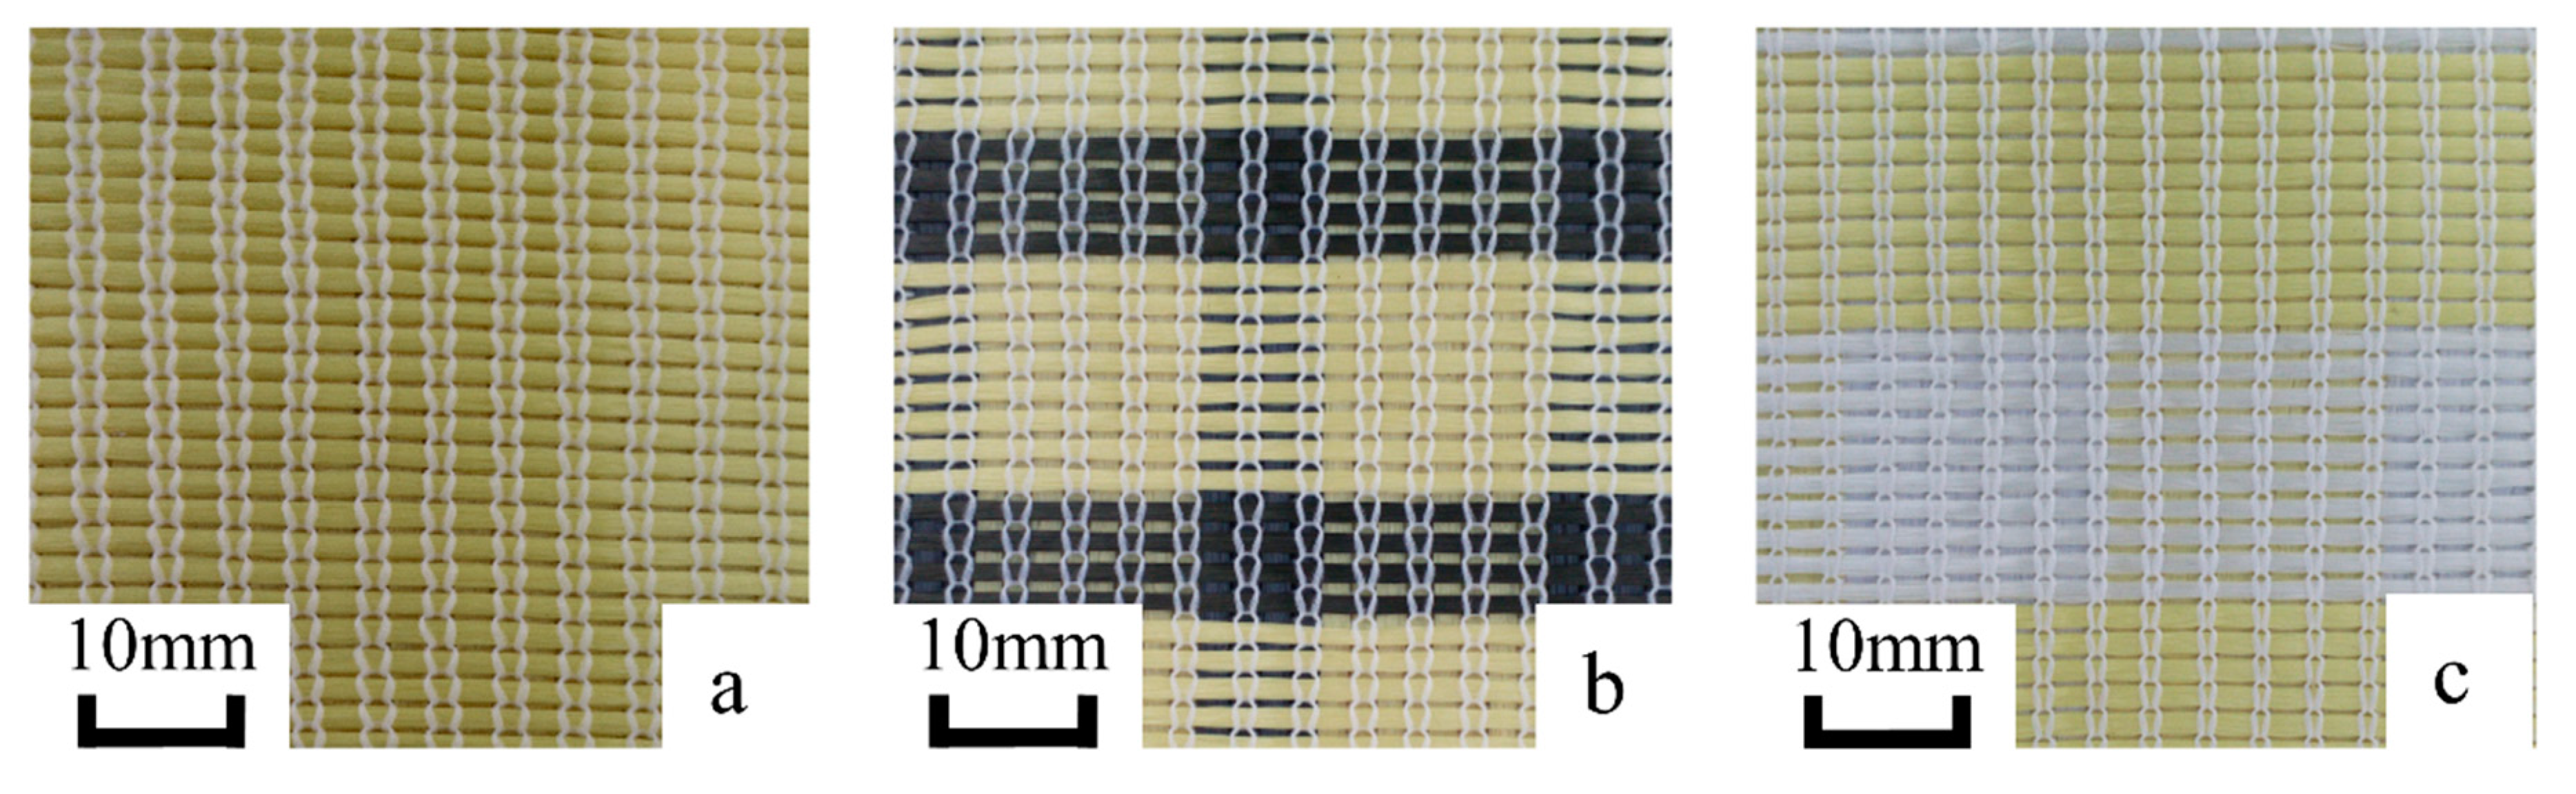
2.1. Preparation of Raw Materials

In this study, the multilayered biaxial weft knitted (MBWK) fabric is selected as reinforcement. The MBWK fabrics, a member in the non-crimp fabrics (NCFs) family, of good formability on curved molding surfaces and of high property-to-cost ratio, can behave as reinforcements for the composite plate and shell structures [28]. The three-layer-connected biaxial weft knitted fabric is chosen for this experiment, as the structure shown in Figure 1, where the stitching system structure is 1 + 1 rib, which has good stretch property and can provide adequate space for inserting yarns shearing [29,30,31], and the inserting yarns are parallel and straight, hence the utilization rate of high performance fiber is over 90% [32]. In addition, the various type of inserting yarns hybrid ratio lend the MBWK fabric flexible designability [33]. Literatures show that the MBWK fabrics are widely applied in the fields of personal protective equipment, wind power, and automobile industry [33,34].
In order to build a helmet shell for high-speed impact resistance, three kinds of high performance fibers are selected as inserting yarns, which are aramid fiber (Kevlar 49), carbon fiber (T-300), and ultra-high molecular weight polyethylene (UHWPE). Raw materials’ specification is shown in Table 1. And all the stitch yarns are polyester (PET DTY).
The parameters of three types MBWK fabrics with different hybrid ratio were listed in Table 2. The samples are presented in Figure 2.
The resins are vinyl ester (VE), unsaturated polyester (UP) and epoxy (EP), respectively, as shown in Table 3.

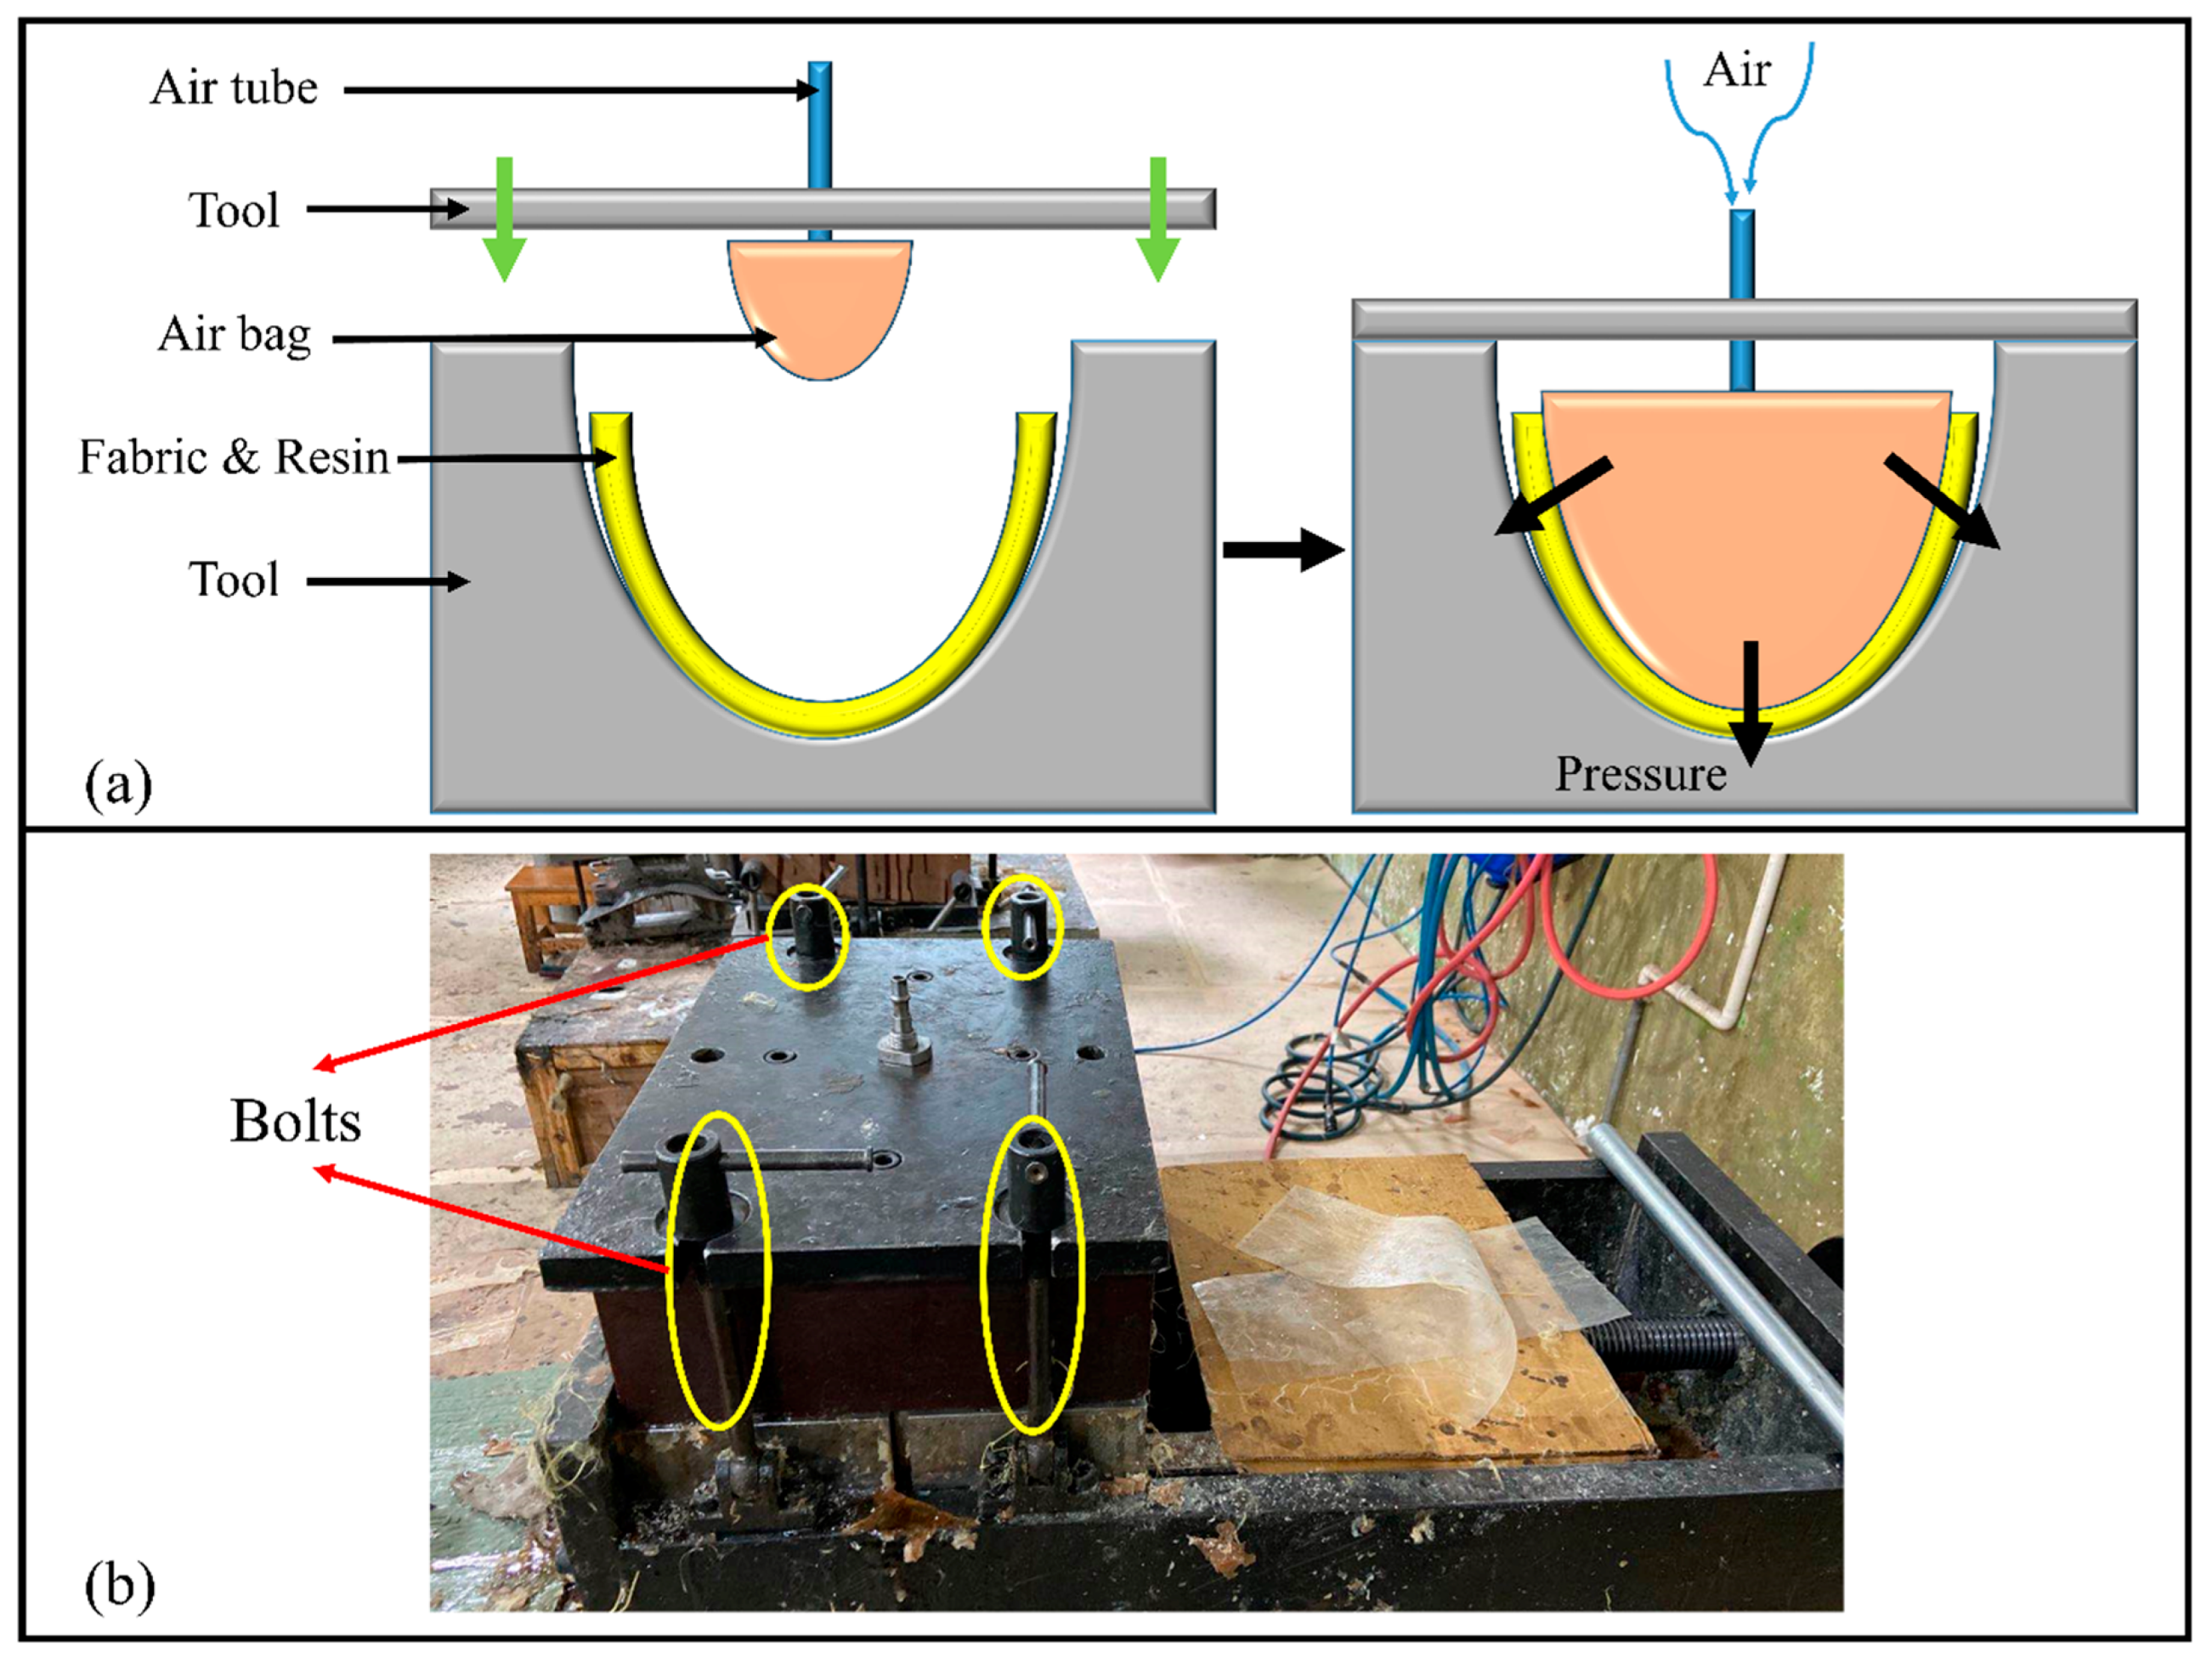
2.2. Sample Preparation

The composite samples are prepared by the air bag compression molding process, which is suitable for the small or medium-sized products with complex structure and smooth surface, as shown in Figure 3a.
In the preparing process includes firstly the MBWK fabric is put into the tool, the size of the fabric sample is 50 × 50 cm, then the resin is applied evenly in the fabrics by manual lay-up method, the weight of mixed resin for each sample is 110 g. After closing the tool and screwing down bolts (the calibration of the tools’ position also depends on the bolts), as shown in Figure 3b, the air bag is inflated with 0.3 MPa pressure for four hours under room temperature. Afterwards, the sample is demolded after releasing the air and opening the tool, if there are no dry spots on the surface, this composite shell is considered to be a qualified one. Finally, the trimming process is applied to cutting the sample’s extra parts. In this experiment the trimming machine is Prima Rapido-5® 3D laser cutting machine, all the trimming path is predesigned and automatically executed by the machine, the laser power for cutting sample is 3.5 kW. The symbolizations of sample composite shells are listed in Table 4.

3. Data Extraction and Analysis

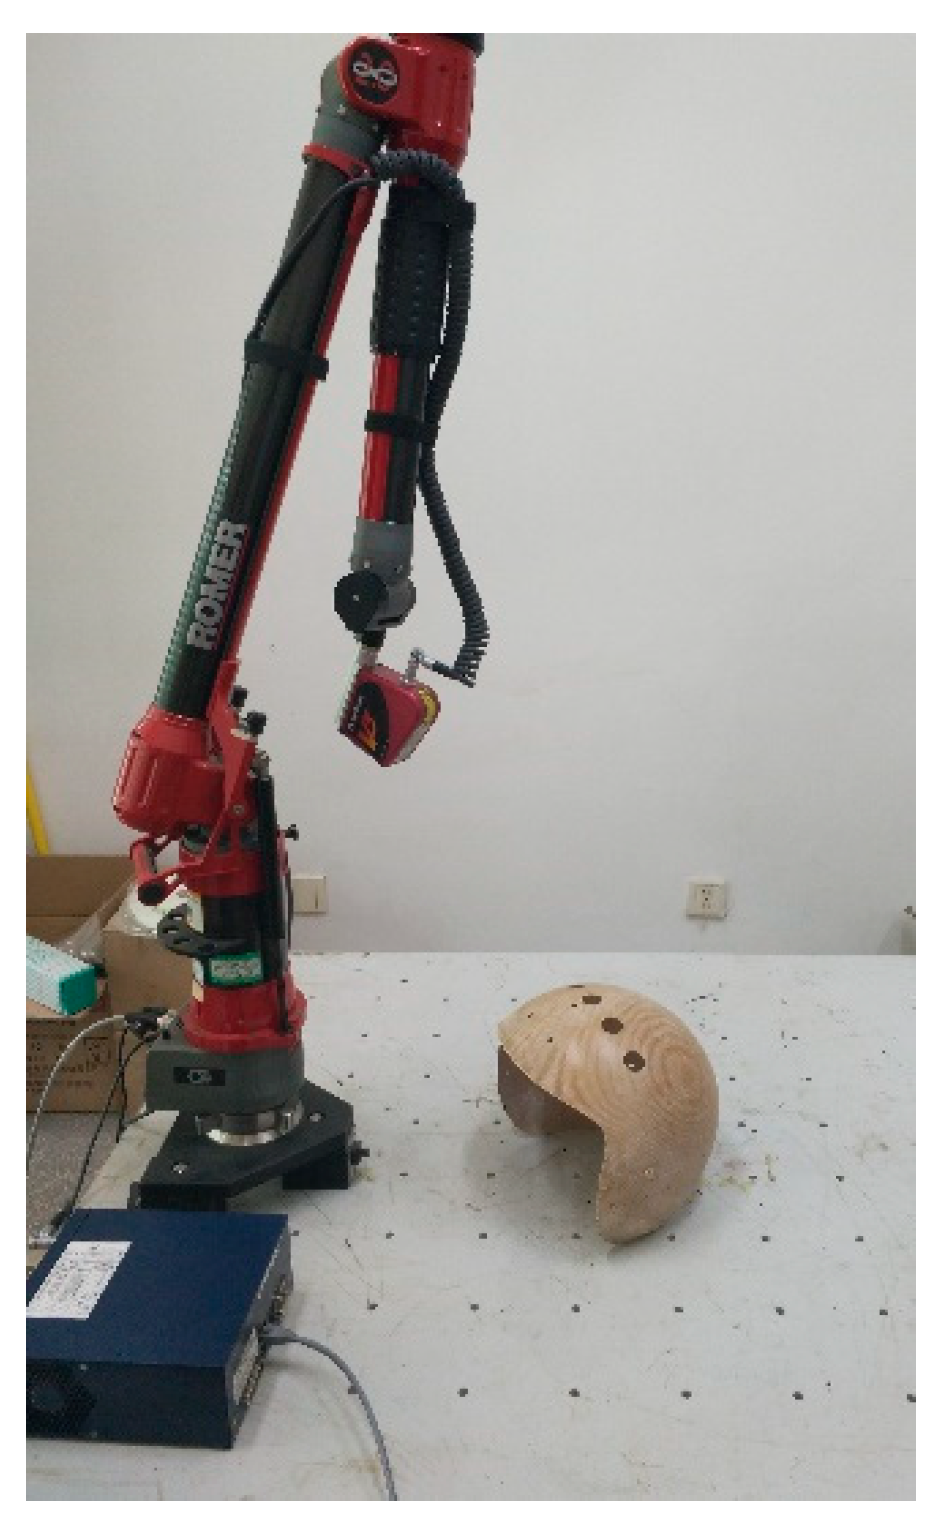
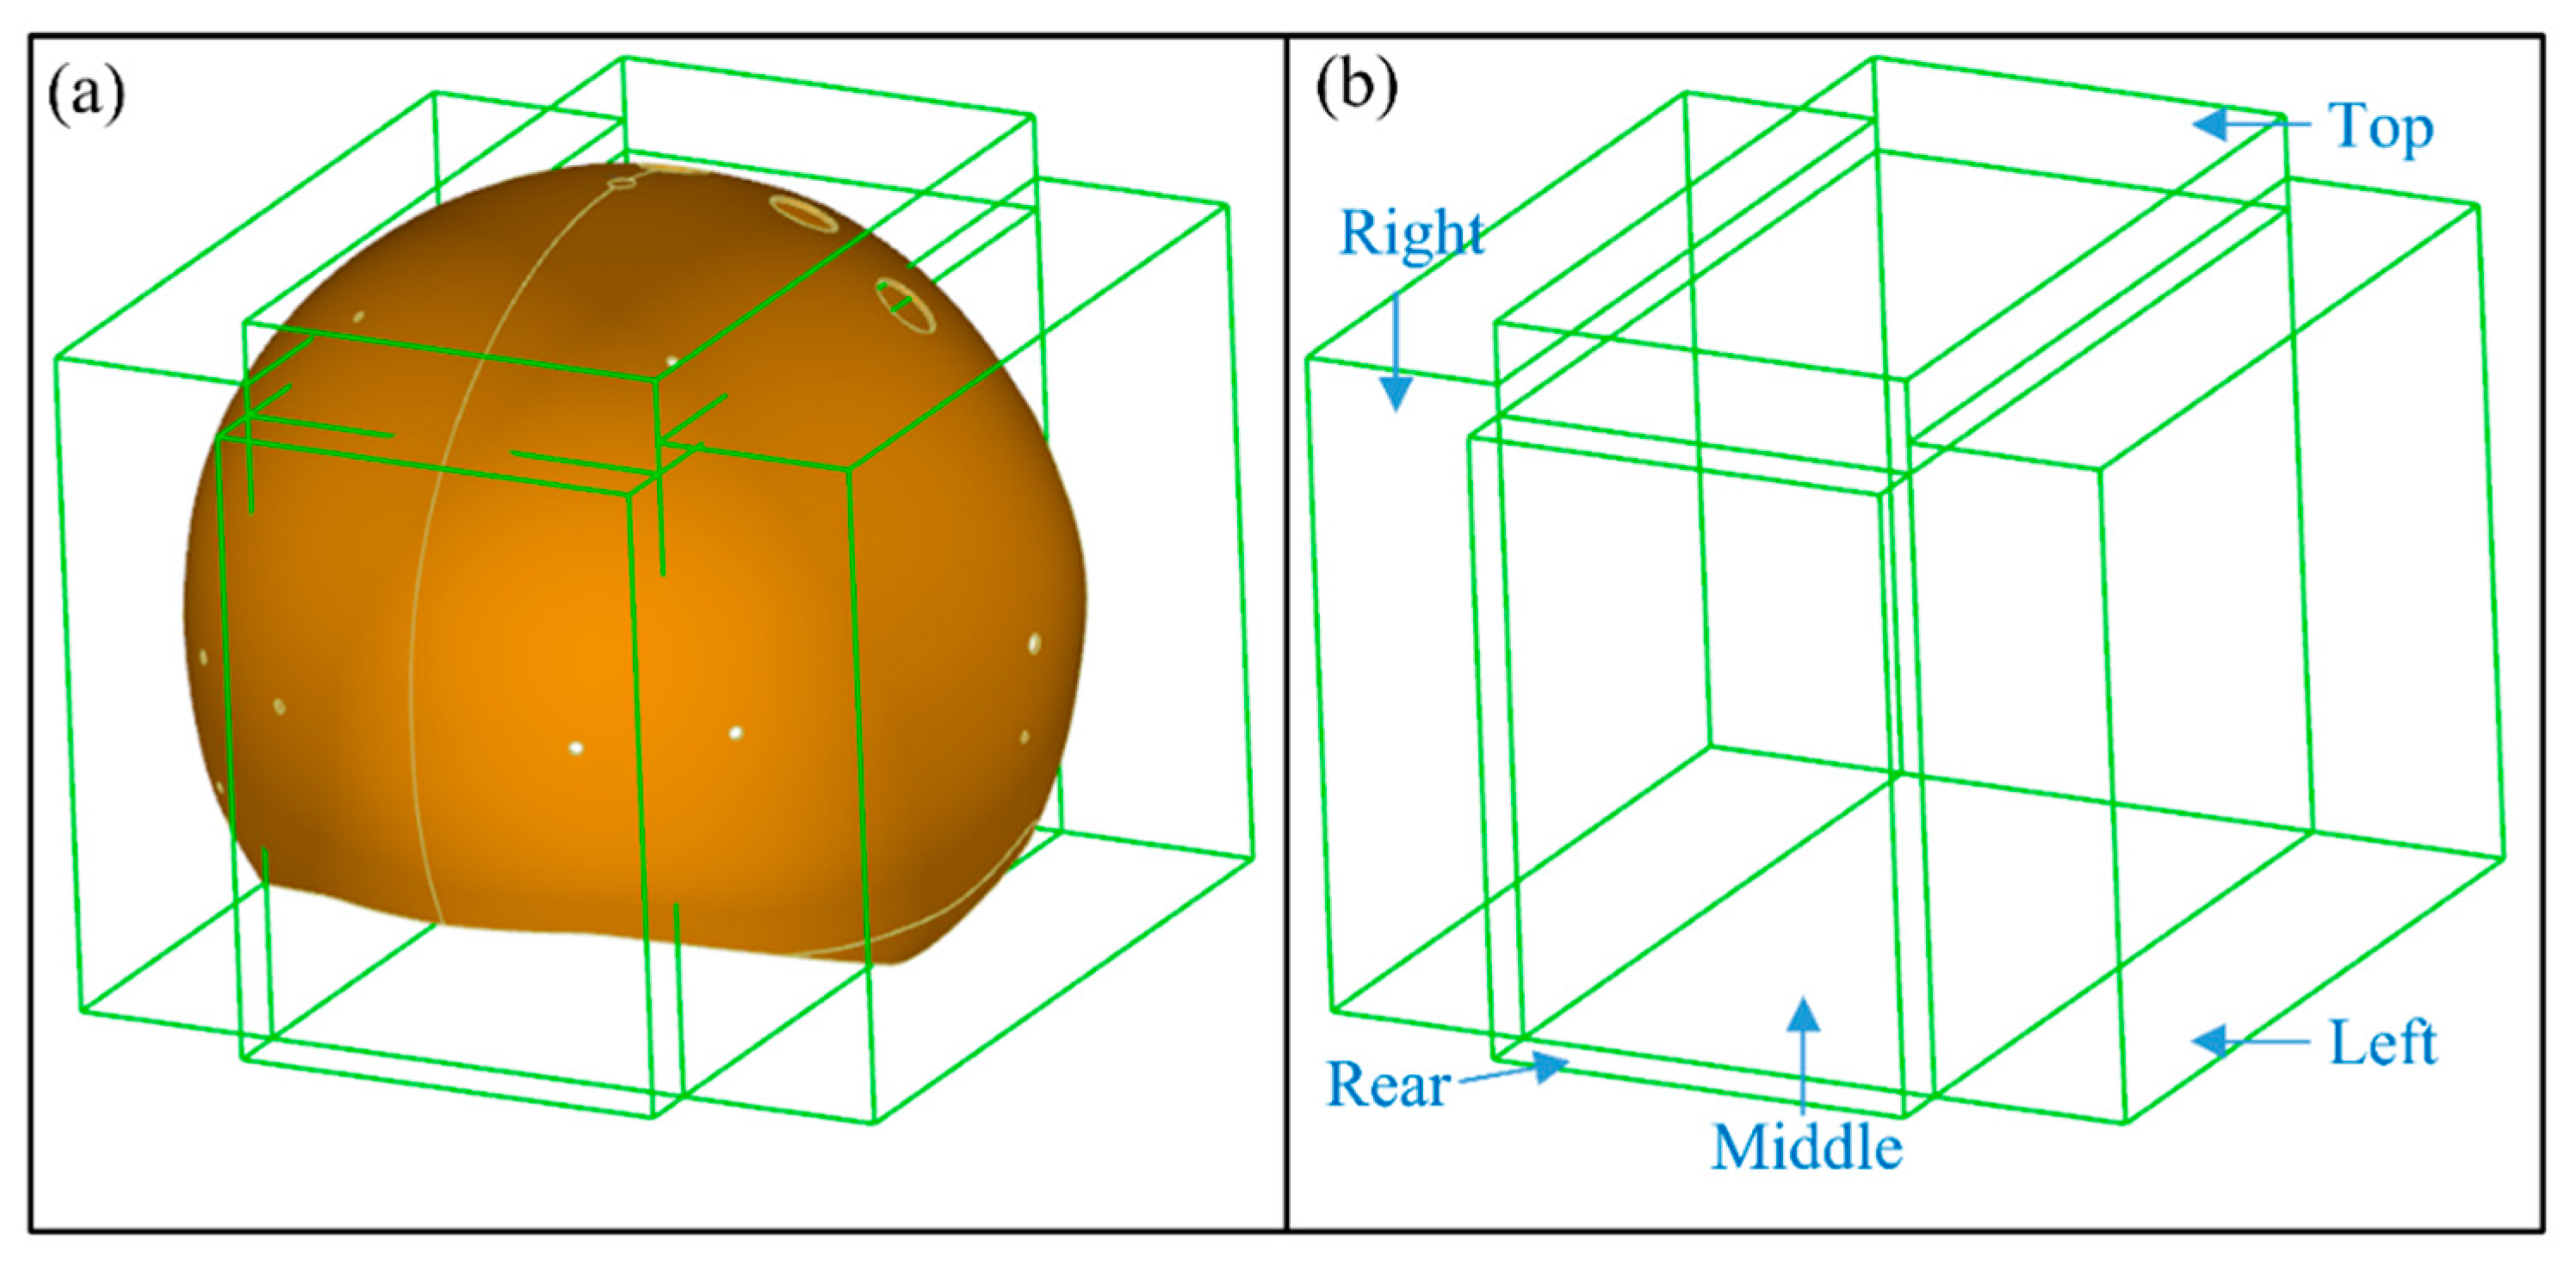
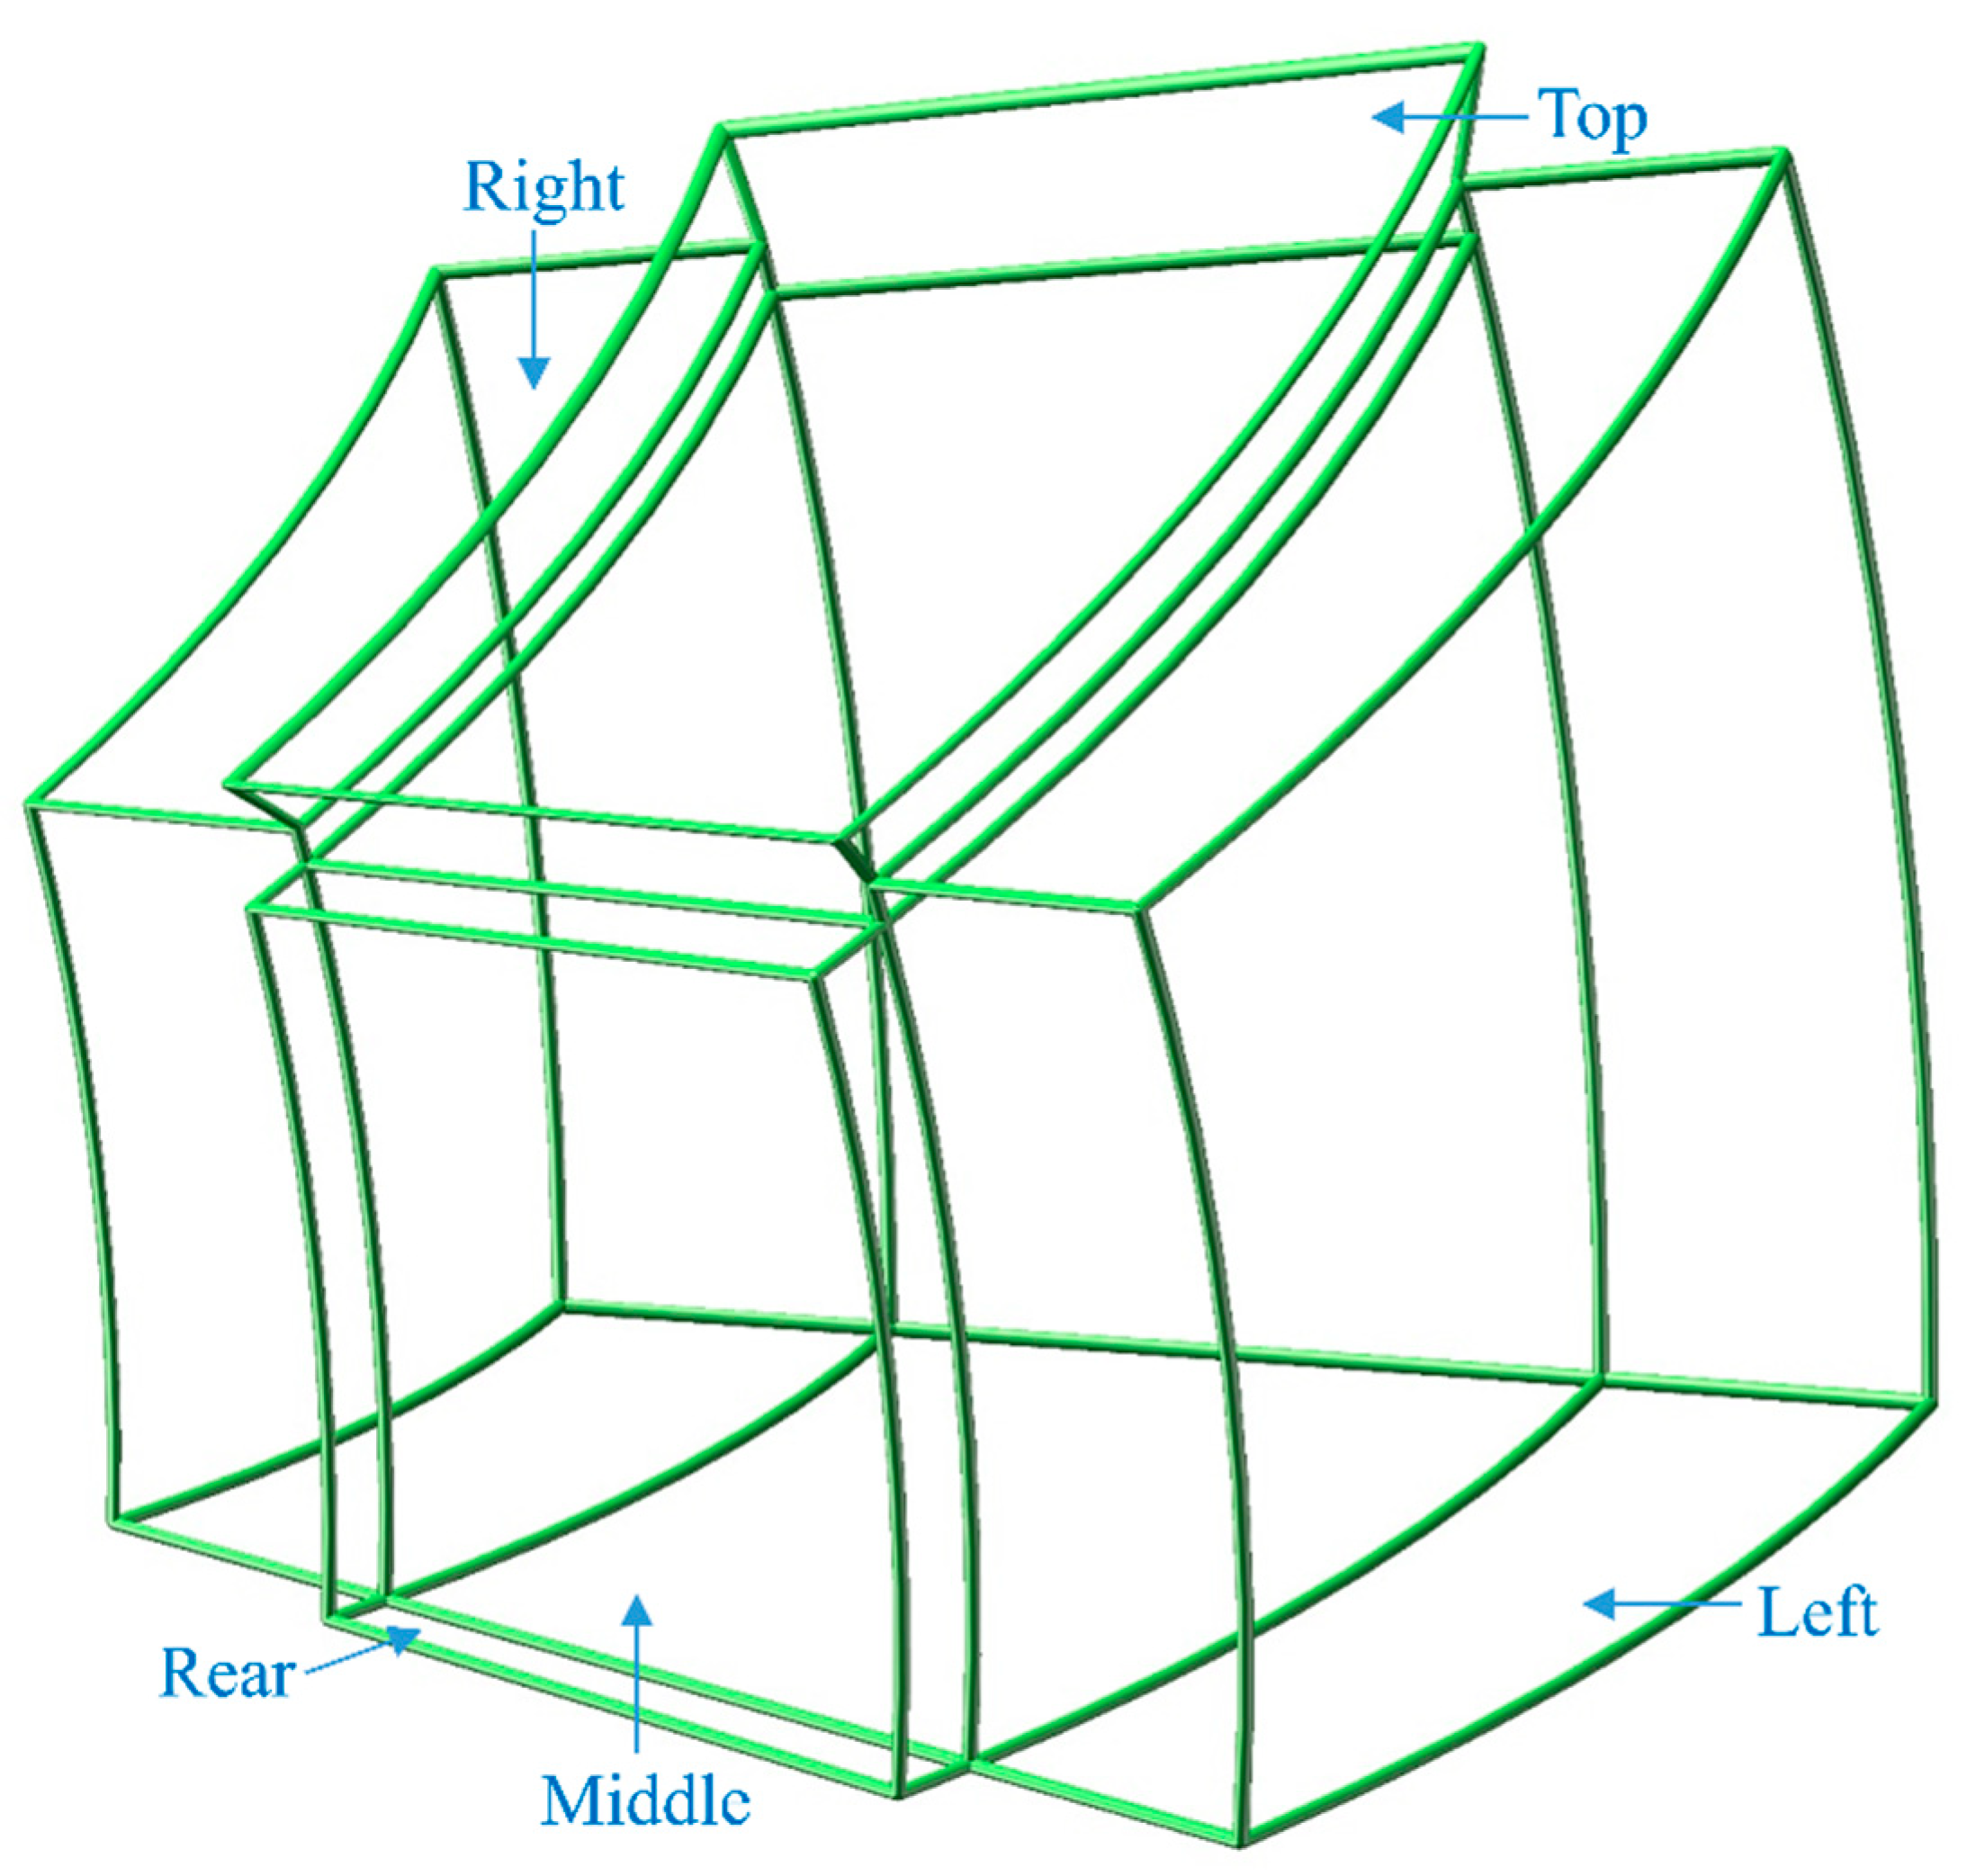
3.1. Helmet Molding and Surface Scanning

In order to release the residual stresses and spring-back as fully as possible, the helmets are relaxed for about one week or so, then the surfaces are scanned by 3D measuring arm Romer® with laser scanner Scanworks® V3, the measuring arm is fixed on optical table, as illustrated in Figure 4. The laser system technical data is presented in Table 5. During the scanning process, the calibration of the sensor and the collection of the point cloud data are accomplished by PC-DIMIS software. Then, the scanned point cloud data are imported into Geomagic® software (3D Systems®) in bin format to optimization and building.

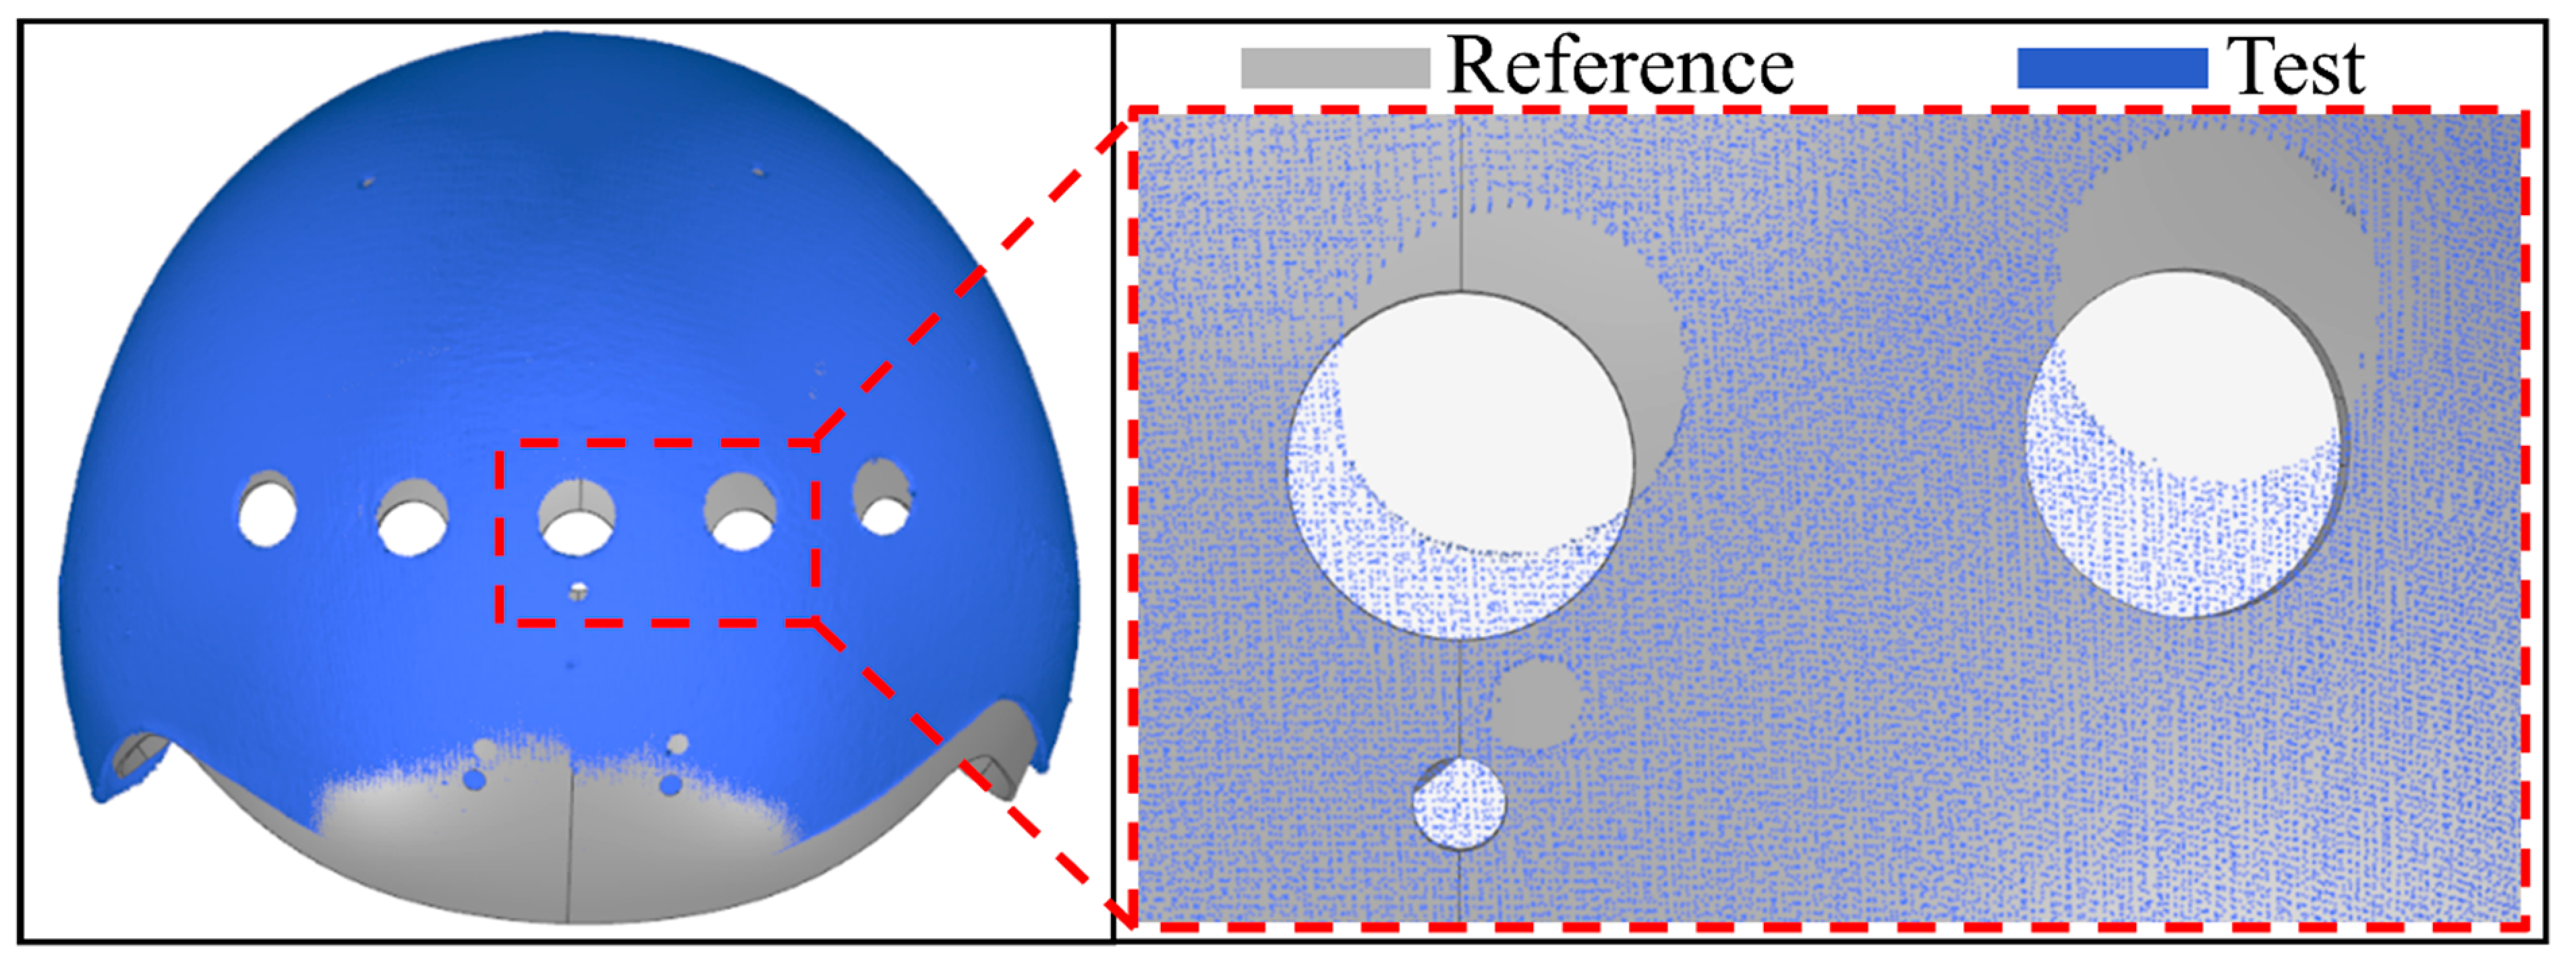
3.2. Conventional Analysis Method based on ICP Algorithm

The point cloud and the CAD model should be aligned in the same coordinate system firstly, which is known as registration. The most commonly used method of registration is the Iterative Closest Point (ICP) algorithm, the ICP algorithm aims to minimize the difference between a point cloud and some reference surface, by minimizing the square errors between the corresponding entities, to find the transformation between them [35,36,37]. More specifically, there are two corresponding point sets:
X = { x 1 , , x n }
Y = { y 1 , , y n }
the goal of the ICP algorithm is to find the translation t and rotation R that minimizes the sum of the squared error:
E ( R , t ) = 1 n i = 1 n x i R y i t 2
where xi and yi are corresponding points.
Generally, the procedure for the initial scanning model preprocess is as follows: combine point clouds to one object, filter the disconnected components, and then clean noise. The coordinate systems of the design model and the scanned model are not consistent when they are created [36]. Therefore, the initial positions of the two models are often scattered after importing the scanned model and CAD model into Geomagic®. The ICP algorithm requires that the initial positions between the test and reference models are close enough, since the point cloud and the CAD model has been in the different coordinate system when they are built, it is necessary to narrow the primary direction deflection and location deviation of the measured data and CAD model, otherwise it may not be able to obtain good convergence results. Hence, it is necessary to have a coarse registration before fine registration with ICP algorithm. Thus, it is essential to manually move the two models as close as possible in the same coordinate system for coarse registration, then align the two models with the Best Fit Alignment tool automatically, which is a fine registration step based on ICP algorithm [38].
However, in this study the scanned model and CAD model still have different degrees of malposition after alignment. As shown in Figure 5, the assembly holes’ locations obviously illustrate the deviation between the reference model and test model, which can lead to theoretical errors in the deformation evaluation results. The reason is that the warpage occurs to helmet samples to some degrees after being cured completely, which makes it impossible to obtain a point cloud with the same shape as the CAD model, and the geometric center has changed, which increases the difficulty of alignment [36]. On the other hand, the alignment method based on ICP algorithm is easy to drop into local optimum [26,36,39], the local optimums typically do not correspond to the correct result, because there is not enough geometry shape to restrict the sliding between two partial shapes. Because the ICP assumes that one point set is a subset of the other. When this assumption is not valid, false matches are created which negatively influences the convergence of the ICP to the correct solution [40]. Accordingly, the alignment results can not be used to obtain or evaluate the samples’ deformation.

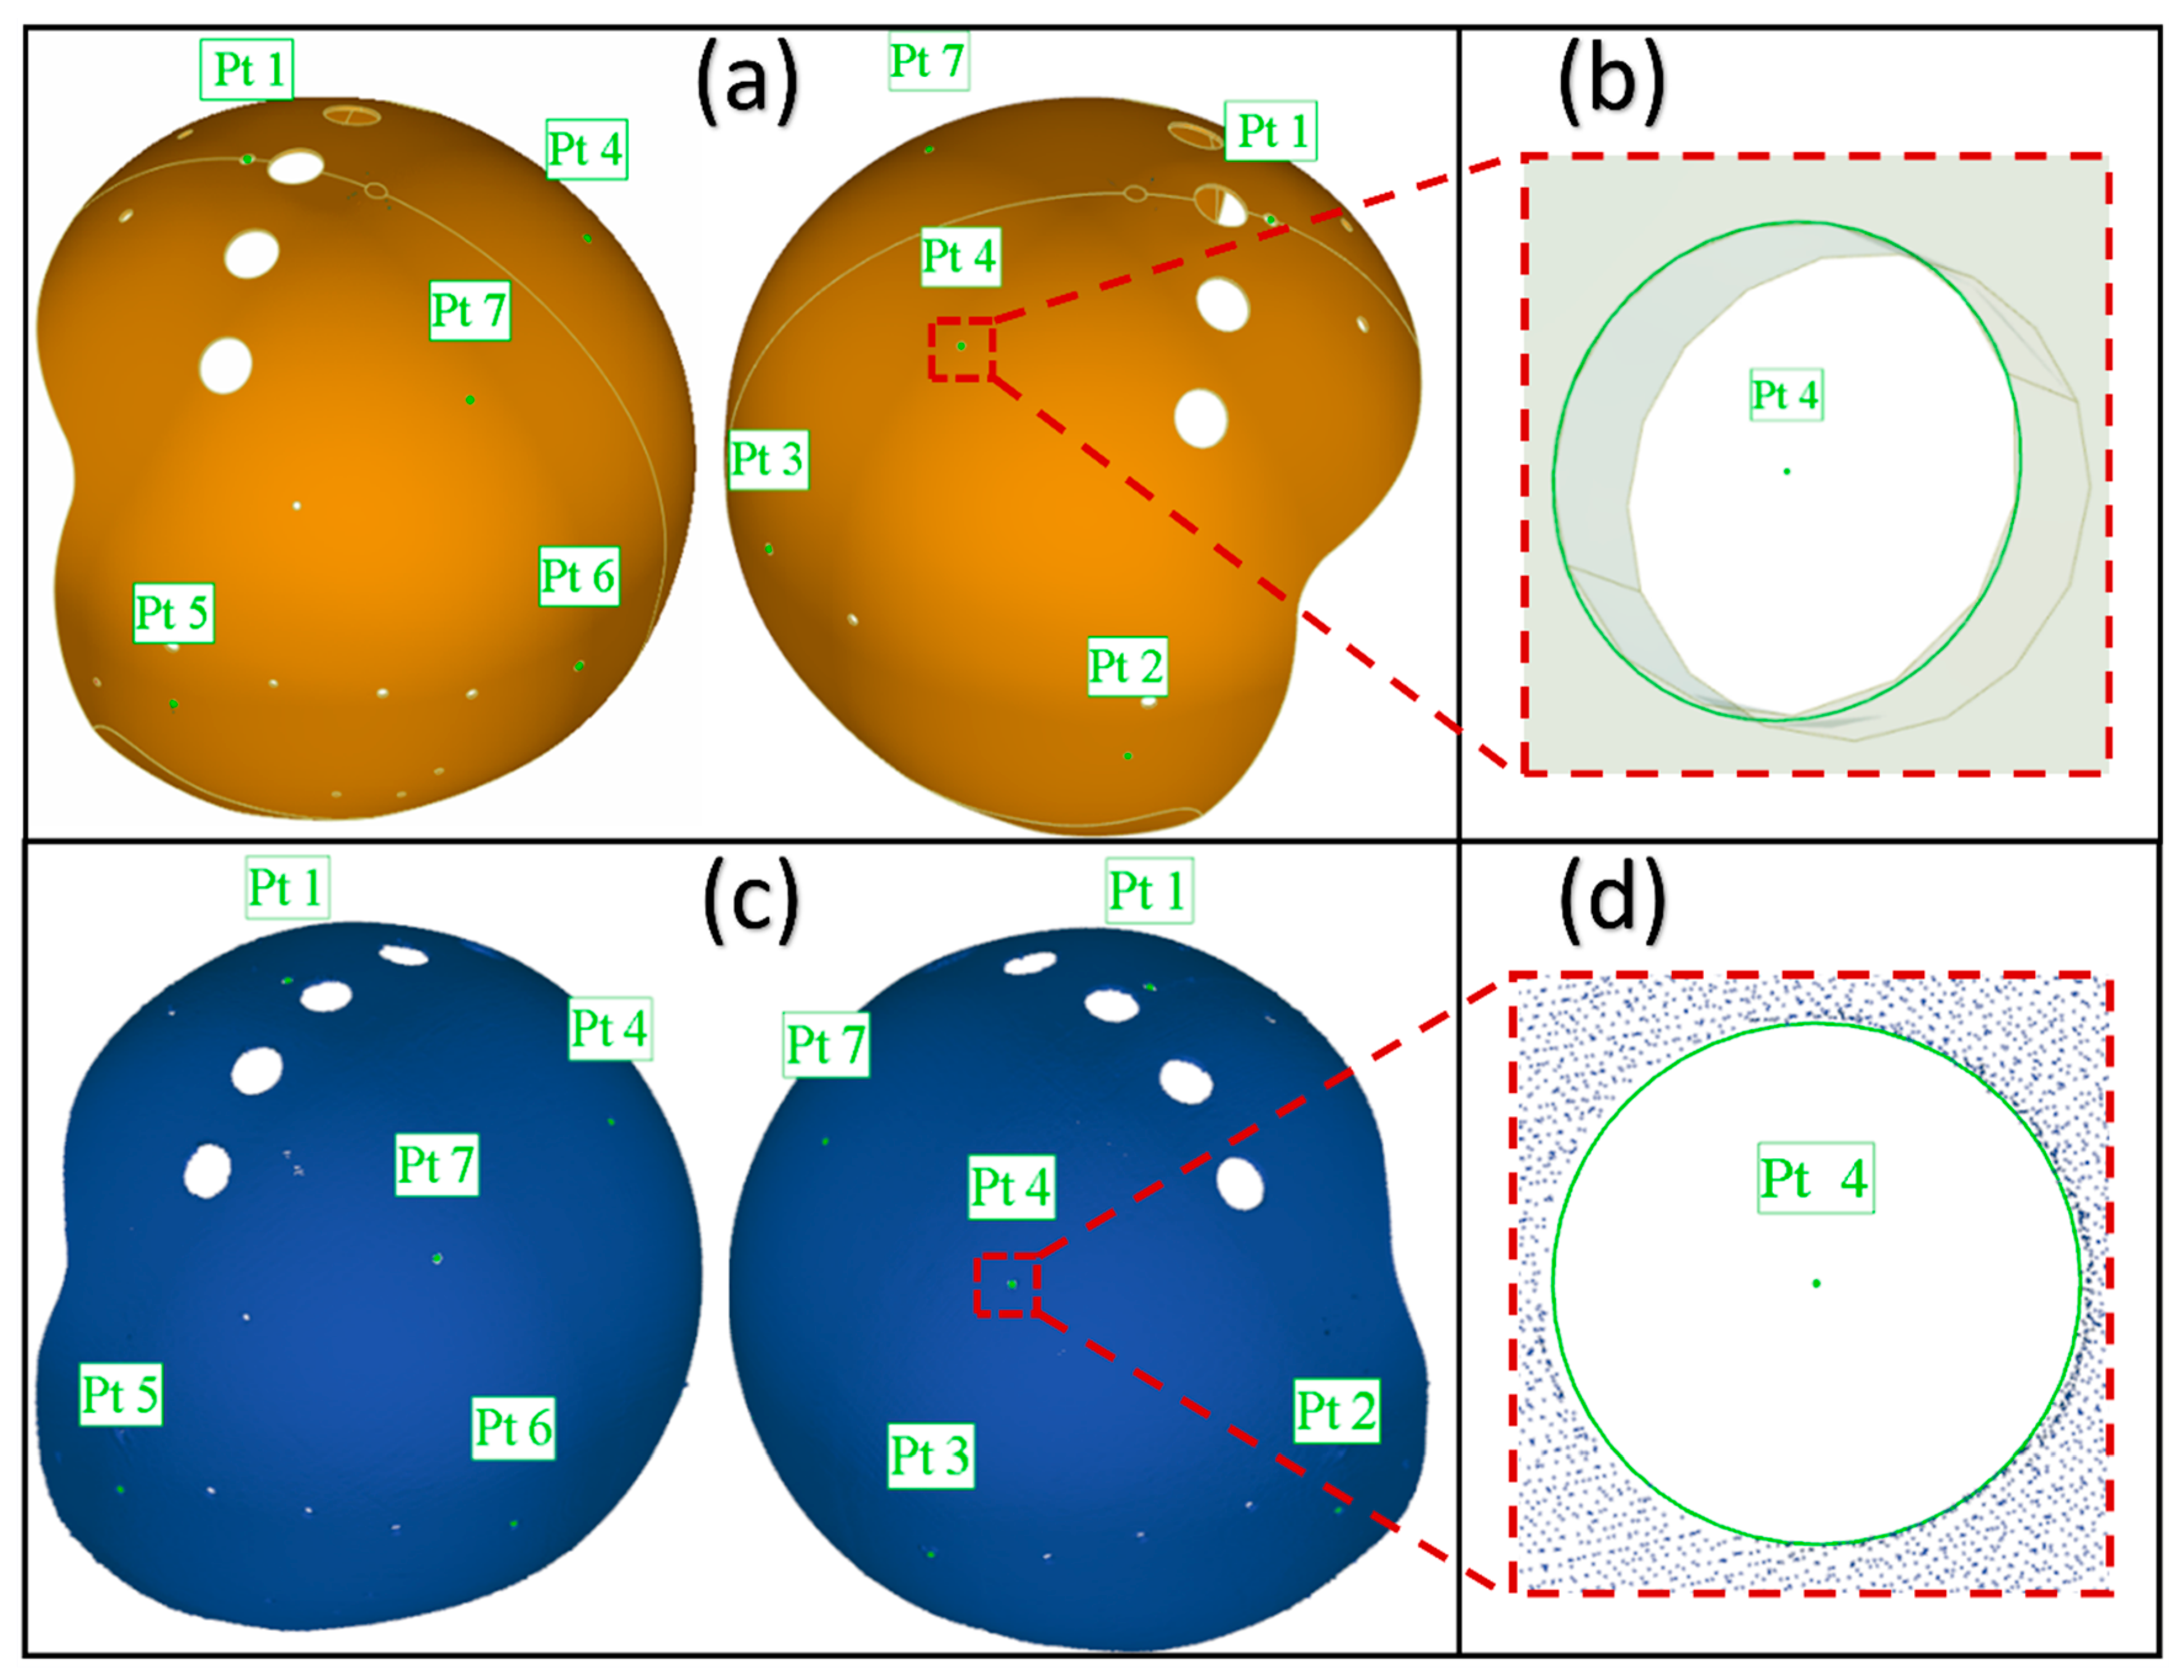
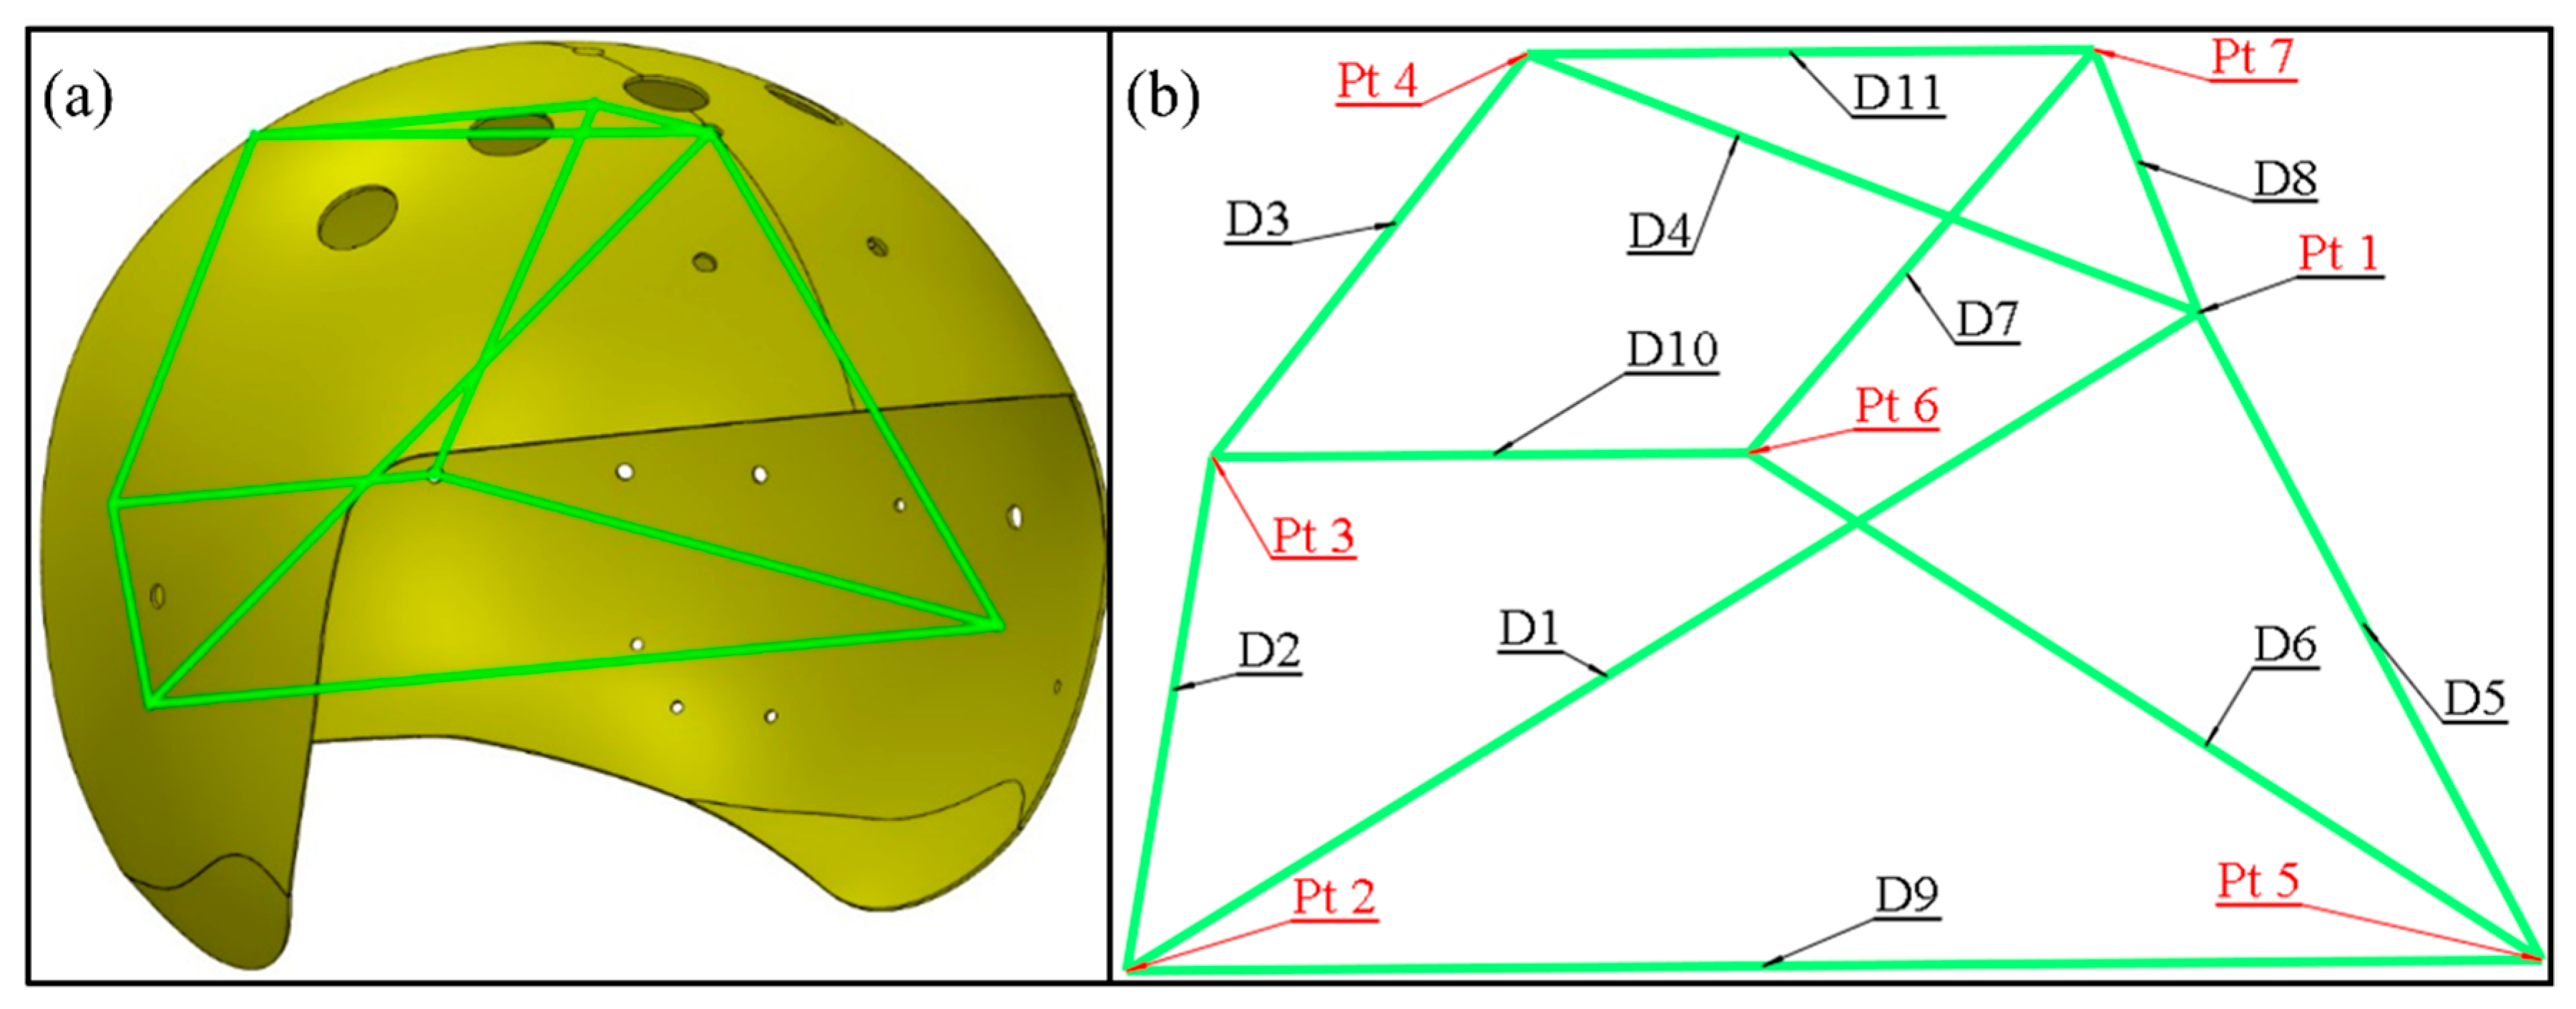
3.3. Analysis Based on Feature Distance

Modern advanced helmets can both provide protection also other intelligent functions through assembling different sensors [41,42]. Therefore, the dimension of the helmet and the deviation of the assembly holes’ location will directly affect the accuracy of the helmet system. In order to characterize the overall deformation tendencies of the helmets, seven circular holes in the CAD model are selected as research objects according to the critical assembly criteria, and center points are obtained by feature extracting. Then, seven corresponding circular holes are found in the point cloud model, and their center coordinates are extracted. The Euclidean distance between the center of the circle is used to investigate the deformation of the helmets:
d = ( x 1 x 2 ) 2 + ( y 1 y 2 ) 2 + ( z 1 z 2 ) 2
where the d refers to the distance between any two points in three dimensional coordinate like point 1 (x1, y1, z1) and point 2 (x2, y2, z2).
This paper puts forward an evaluation strategy called “feature distance”, the progress is presented in Figure 6. Firstly, the seven assembly holes locate on the top, rear and both sides of the helmet in the CAD model (as shown in Figure 7a) have been selected. The “feature” function of Geomagic® is used to build circular feature on the model surface as presented in Figure 7b. After that the “point location” function of “analysis” tool is used to export the coordinate of the circle center, and number the distance between center points as shown in Figure 8 and Table 6. Then the distances between these central points are calculated accord to the Euclidean distance formula.
During the filtration process: the type of noise reduction is “free-form shapes”, the Smoothness Level is 2 and the Iterations value is 5. After filtering the noise of the cloud data, the “features” function is used to build circle features in the assembly holes of the scanned model on the common location with the CAD model, as shown in Figure 7d, and obtain the coordinates of the circle central points. Afterwards, number the seven central points with the same sequence and calculate the Euclidean distance according to the Table 6.
Finally, use the 11 “feature distance” in each 3D point clouds to compare with the “feature distance” in the CAD model in common code. The absolute values sum of the deviation in each scanned model are used to evaluate the deformation of each helmet totally.

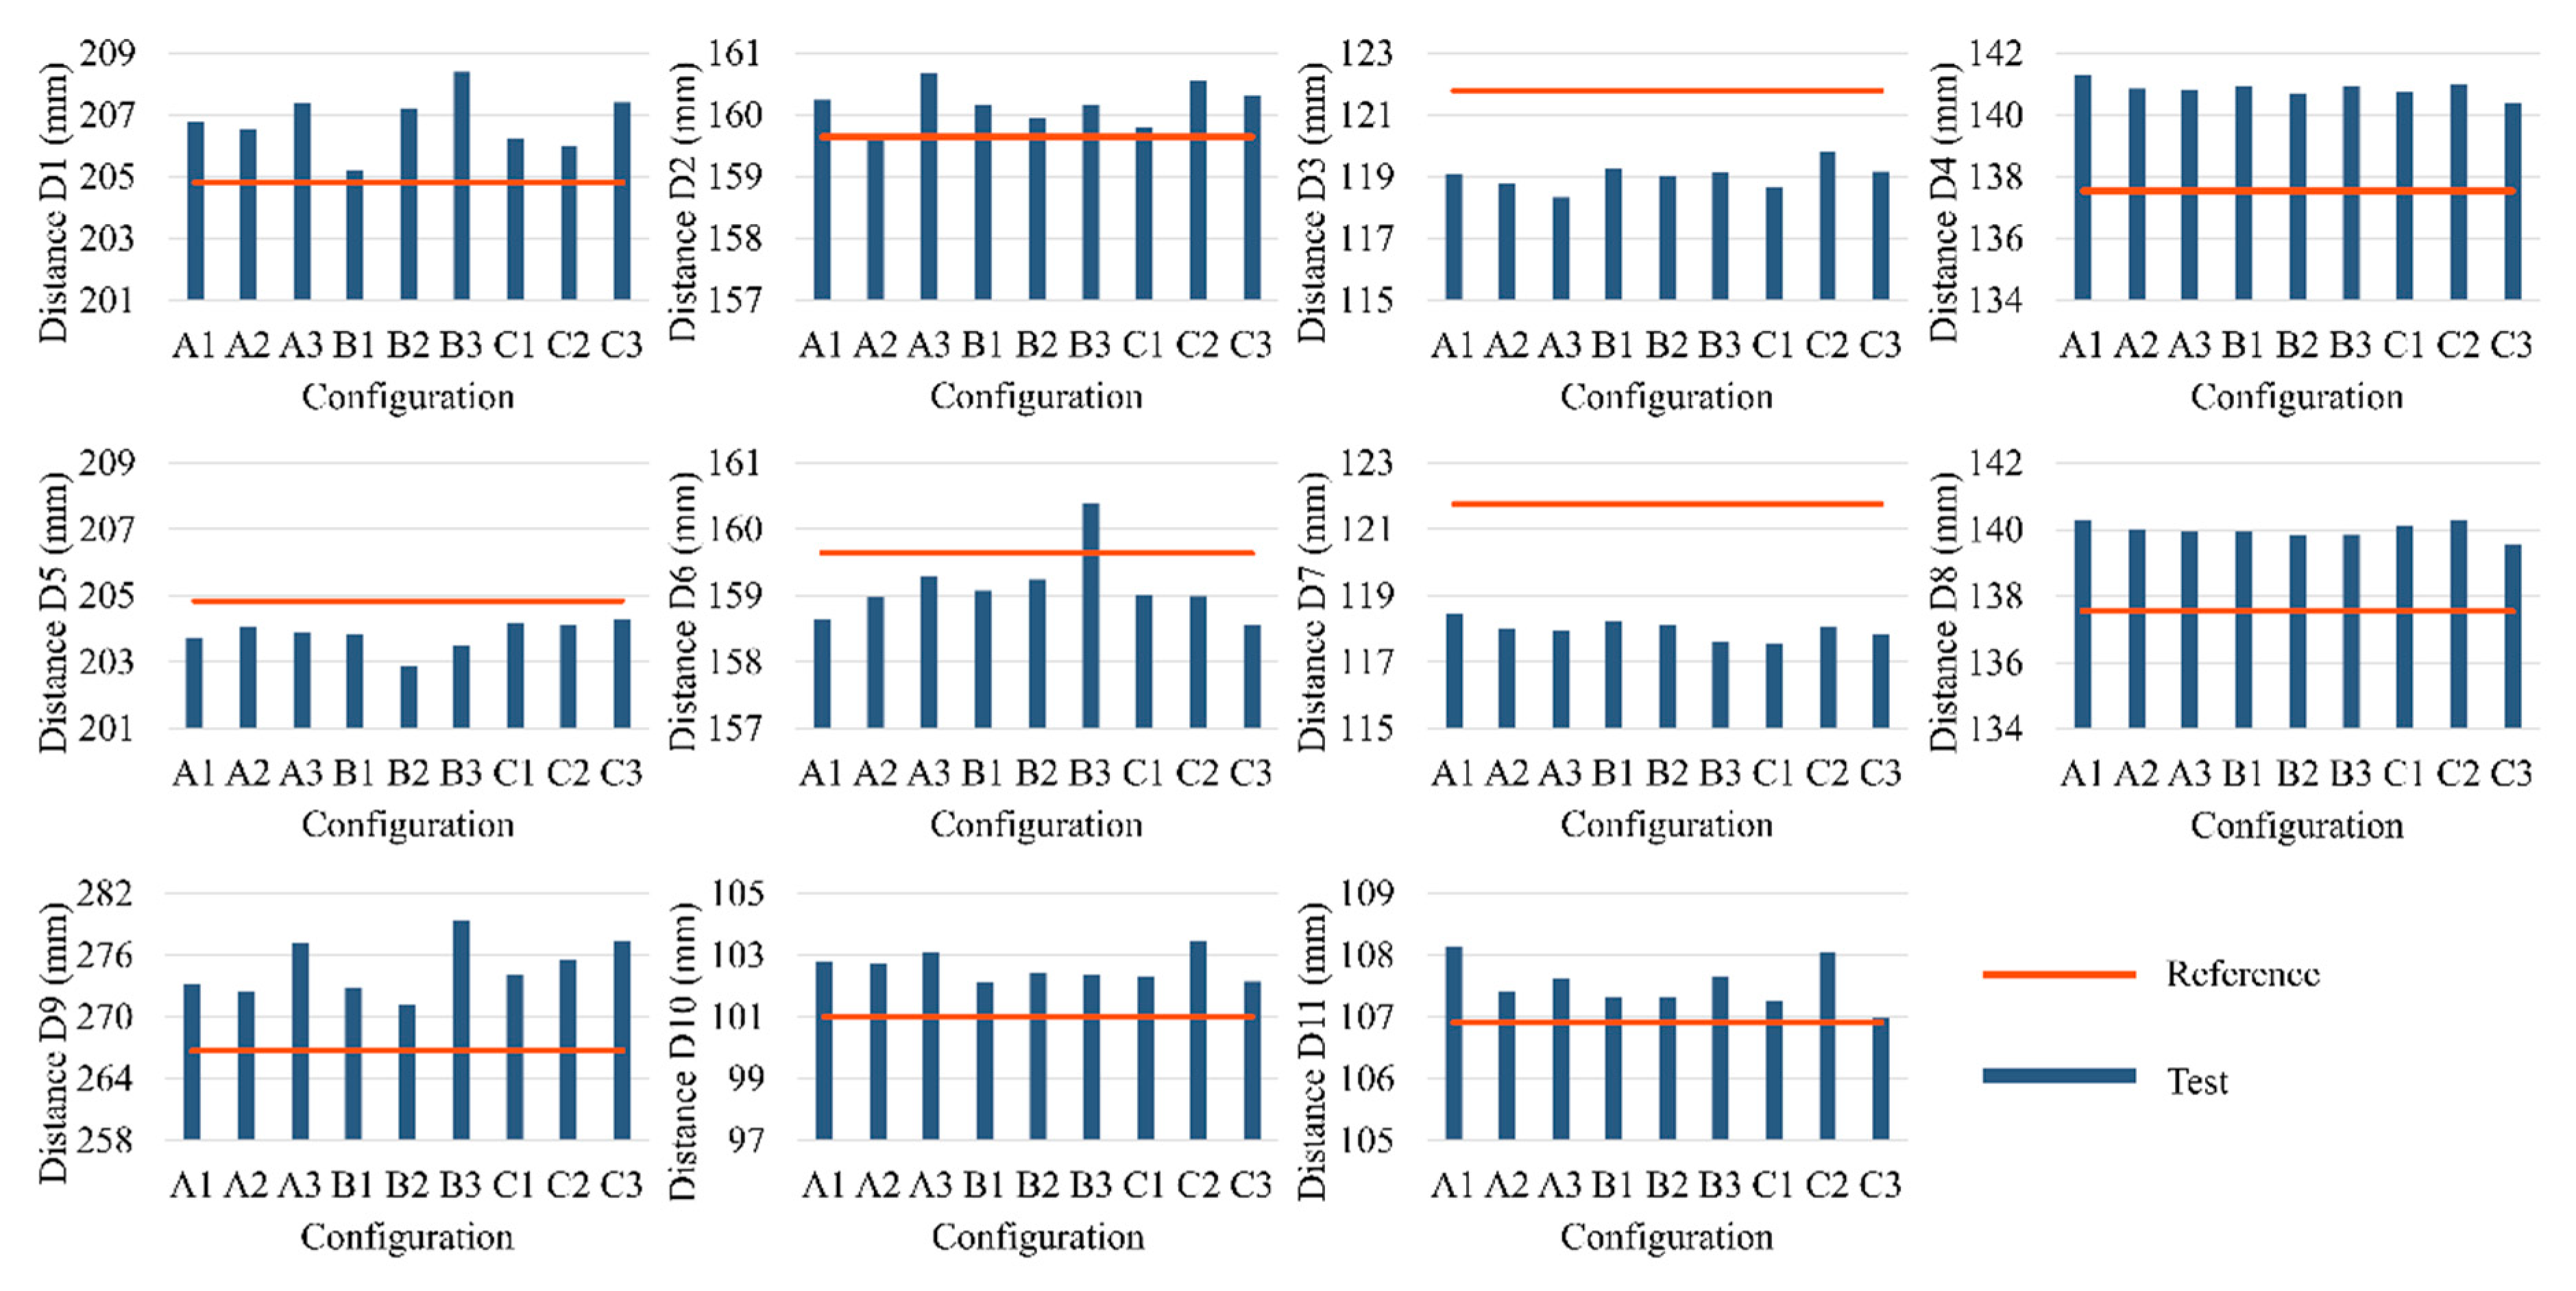
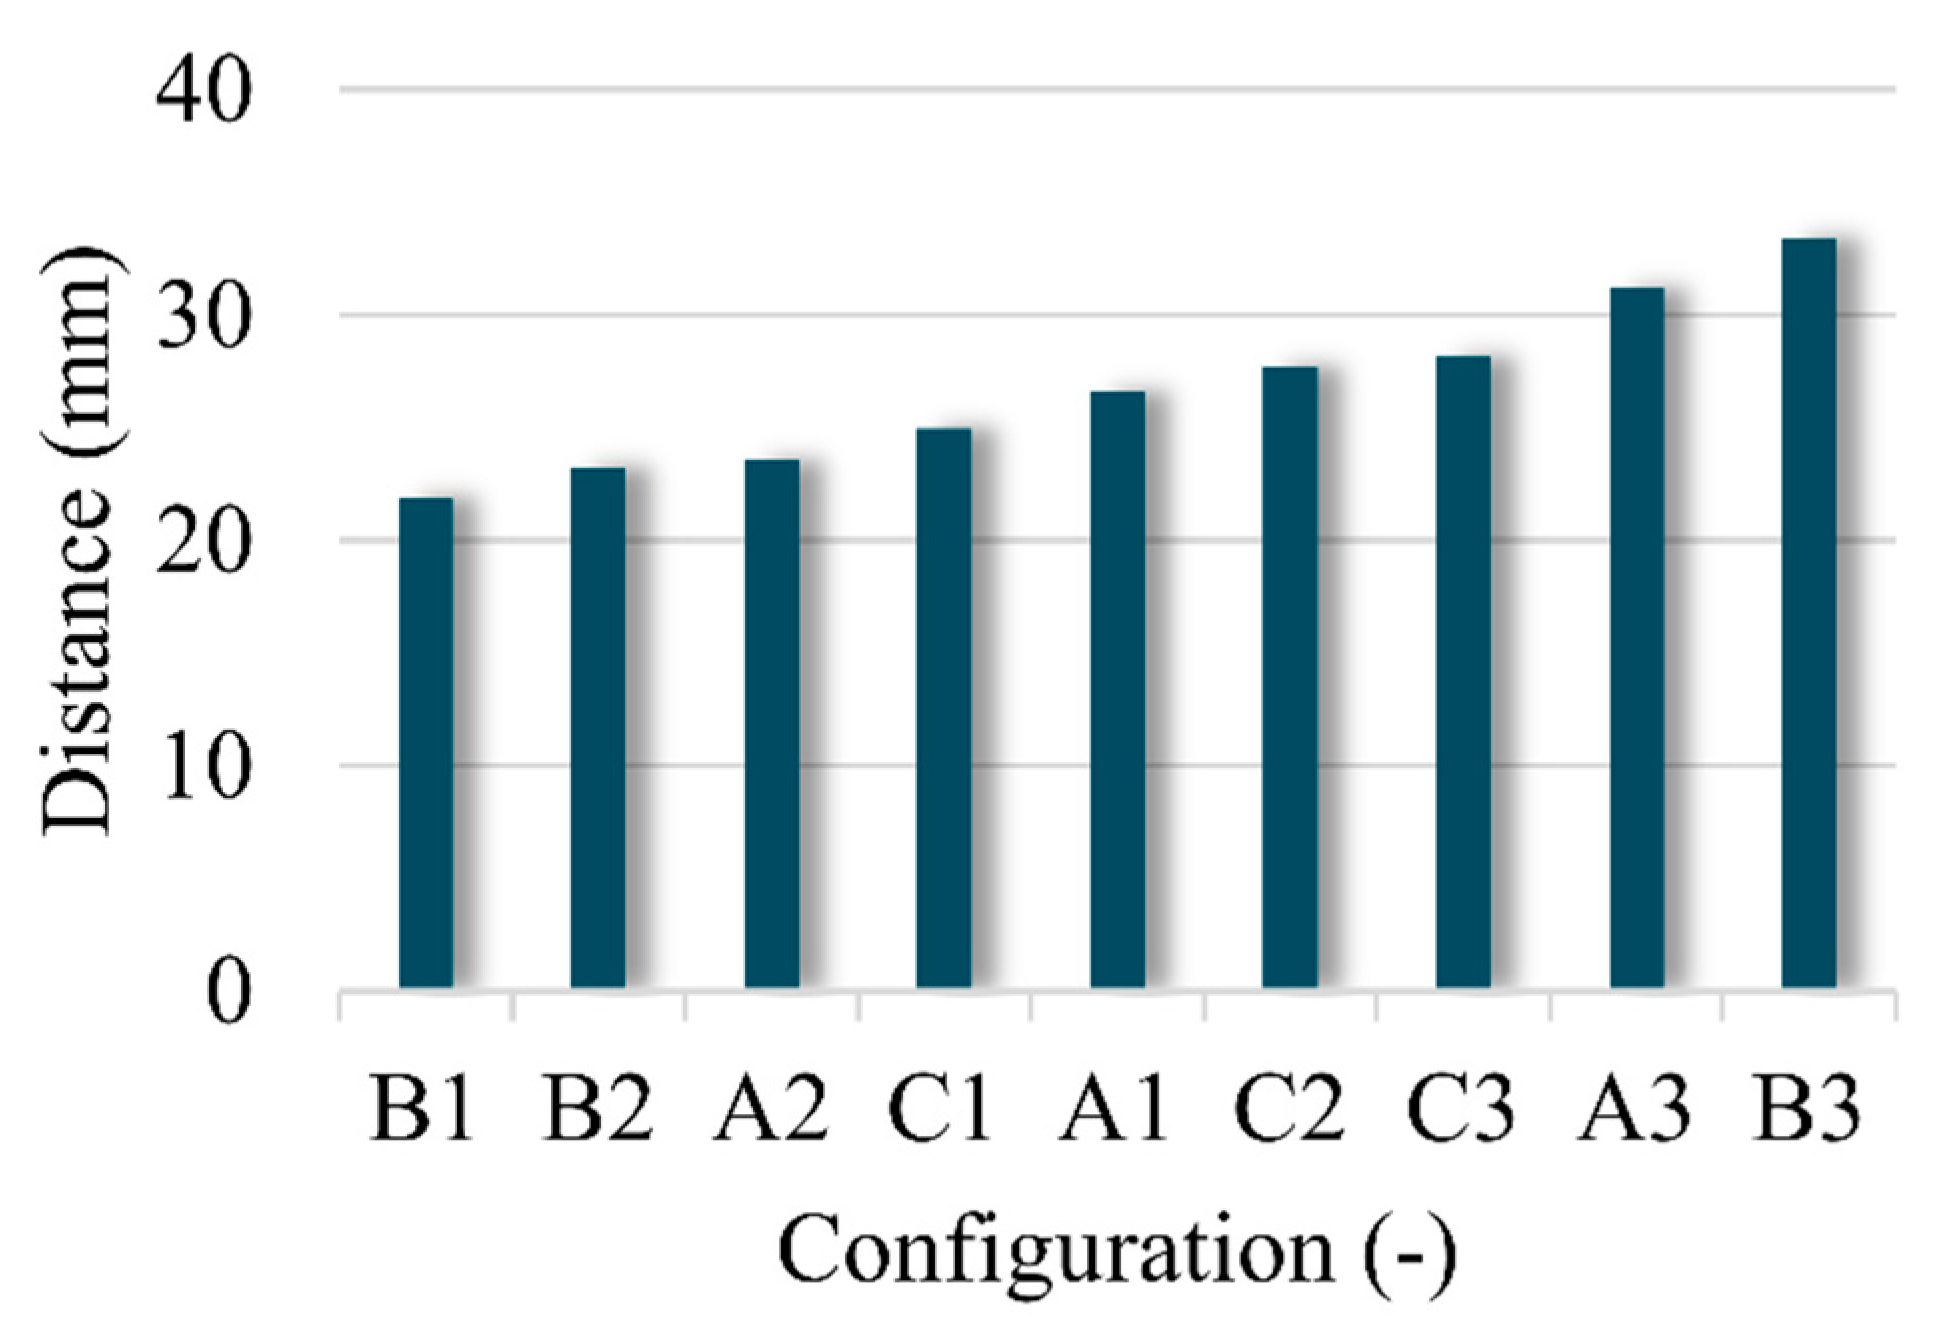
4. Results and Discussion

As mentioned previously, the measurement results based on the “feature distance” method of the nine helmets are shown in Figure 9, the detailed data is presented in Appendix A. The eleven feature distances of CAD model are used as reference line, each reference line is used to compare with the nine testing results for evaluating the deviations. The results demonstrate that all the helmets made by different fibers and resins deformed obviously but at different levels.
In order to facilitate the explanation of PIDs, the helmet is divided into five parts, i.e., left, right, top, middle and rear, as shown in Figure 10. It can be seen that the size of left area is represented by the feature distance D1 and D2, combining the Figure 8b with Figure 9, the measuring results show that D1 and D2 of the nine helmets become larger on an average of 1.961 mm and 0.525 mm respectively, which indicate that the size of the nine helmets’ left areas has an increasing trend. Likewise, the results of D4 and D8 show an average length increase of 3.309 mm and 2.429 mm, suggesting that the helmets’ top areas become larger. The measurements of D5 and D6, however, indicate that the majority of helmets’ right areas become narrower, the length of D5 and D6 show an average narrowing of 1.004 mm and 0.665 mm, and the D3 and D7 values follow the same law, which also show a decrease by an average 2.740 mm and 3.789 mm length decrease, which demonstrate the reduction trend of the sizes of helmets’ rear area. But D6 value of sample B3 is an exception, which becomes wider. As seen from the results of D9, D10 and D11, the top, middle and rear areas have the phenomenon of lateral expansion and the length grow by an average of 8.077 mm, 1.602 mm and 0.630 mm respectively. All the deformations are expressed by the five parts as shown in Figure 11. It can be seen from the results that the sizes of the helmets’ top area are basically consistent with the requirements of the design, and the rear parts have some deviations but small, which are caused by spring-back after demoulding. In addition, the locations of helmets’ maximum spring-back appear in the lateral bottom areas, due to their free boundary with low restriction.
Furthermore, the total deformation result of each helmet can be achieved by summing up the absolute values of the deviations between the measured and standard feature distance of each helmet, as shown in Figure 12. According to the final evaluation results, the helmet made of aramid and UP has the smallest deformation while the helmet made of aramid/UHMWPE and UP has the largest deformation after using the same processing parameters. From the results of A3, B3 and C3, the helmet made of UHMWPE as reinforcement is easier to deform, because of its low modulus and weak resin bound ability.

5. Conclusions

In this paper, 3D laser scan technology was adopted to investigate the process-induced distortion of complex surface thin shell composites. The method based on “feature distance” was proposed to characterize the deviation of the local feature, which could reflect the integral deformation of the helmets.
It was shown that the ICP algorithm is difficult to register the design model with actual model when the amount of point data is huge or initial position is unreasonable, easily appear some problems in the registration process such as non-convergence and local optimum. However, with the development of laser scanning technology, there are increasing amounts of point cloud data, and that makes it harder to register the reference model with measured model with complex curved structure by traditional ICP algorithm. However, the “feature distance” method can avoid the theoretical mistakes resulted from the ICP algorithm, furthermore, it can omit the registration process. Meanwhile, one model at a time of procedure can save much computation resource.
The results of the nine helmets deformation based on the “feature distance” evaluation strategy shown that the distance between left and right sides become larger are the main deformation characteristic of all the helmets, the total distortion of the aramid/carbon hybrid UP helmet is smallest, the aramid/UHMWPE hybrid EP helmet has the maximum integral curing deformation. Thereby, the helmet made by aramid/carbon hybrid UP has better dimensional accuracy with the same processing parameter. This method is feasible and effective for deformation measurement and dimension evaluation of complex thin shell composites.
Herein, the evaluation method based on the distance among the critical positions to characterize the deformation of 3D thin shell textile composites and combined with laser scan technology was put forward. The method is convenient, rapid, accurate, with suitable for the complex shelled composites intelligent deformation monitor. In addition, it provides a reference for improving the efficiency of resin matrix composite quality control and deformation inspection.

Author Contributions

Experiments; H.X. and Y.Q. performed the experiments; H.X. and J.L. analyzed the data; Y.J. contributed reagents/materials/analysis tools; H.X. wrote the paper. All authors have read and agreed to the published version of the manuscript.

Funding

This research was funded by Aeronautical Science Foundation of China (Grants No: 201829Q2002), Natural Science Foundation of Tianjin City (Grants No: 18JCZDJC10020) and (Grants No: 18JCQNJC73300)

Conflicts of Interest

The authors declare no conflict of interest.

Appendix A. Experimentally Determined Feature Distance of Reference model and Nine Helmets

cadA1A2A3B1B2B3C1C2C3
D1204.842 206.803 206.525 207.418 205.238 207.202 208.397 206.226 205.985 207.428
D2159.644 160.238 159.662 160.684 160.167 159.959 160.161 159.796 160.552 160.304
D3121.785 119.088 118.804 118.335 119.293 119.041 119.173 118.689 119.800 119.181
D4137.548 141.287 140.853 140.836 140.938 140.706 140.921 140.771 140.991 140.409
D5204.843 203.732 204.061 203.892 203.856 202.865 203.513 204.203 204.142 204.285
D6159.643 158.654 158.974 159.298 159.081 159.249 160.391 159.023 158.996 158.549
D7121.778 118.478 118.022 117.972 118.233 118.098 117.628 117.545 118.059 117.864
D8137.549 140.269 139.994 139.954 139.959 139.829 139.865 140.097 140.292 139.545
D9266.751 273.218 272.438 277.264 272.792 271.219 279.388 274.154 275.594 277.388
D10101.010 102.787 102.723 103.083 102.146 102.433 102.402 102.320 103.451 102.164
D11106.908 108.148 107.411 107.629 107.338 107.336 107.670 107.263 108.049 106.998
Unit: mm

References

  1. Hu, Q.; Memon, H.; Qiu, Y.; Wei, Y. The Failure Mechanism of Composite Stiffener Components Reinforced with 3D Woven Fabrics. Materials 2019, 12, 2221. [Google Scholar] [CrossRef] [PubMed] [Green Version]
  2. Sun, Z.; Xiao, J.; Tao, L.; Wei, Y.; Wang, S.; Zhang, H.; Zhu, S.; Yu, M. Preparation of High-Performance Carbon Fiber-Reinforced Epoxy Composites by Compression Resin Transfer Molding. Materials 2018, 12, 13. [Google Scholar] [CrossRef] [PubMed] [Green Version]
  3. Zhu, M.; Chen, D.; Hu, Q. Failure Mechanisms and Reinforcing Modes of Ply Splice Fiber-Reinforced Composite Laminates under Tensile Load. Materials 2019, 12, 2912. [Google Scholar] [CrossRef] [PubMed] [Green Version]
  4. Antin, K.-N.; Laukkanen, A.; Andersson, T.; Smyl, D.; Vilaça, P. A Multiscale Modelling Approach for Estimating the Effect of Defects in Unidirectional Carbon Fiber Reinforced Polymer Composites. Materials 2019, 12, 1885. [Google Scholar] [CrossRef] [PubMed] [Green Version]
  5. Wang, Z.P.; Zhang, G.L.; Zhu, Y.X.; Zhang, L.Q.; Shi, X.P.; Wang, W.W. Theoretical analysis of braiding strand trajectories and simulation of three-dimensional parametric geometrical models for multilayer interlock three-dimensional tubular braided preforms. Text. Res. J. 2019, 89, 4306–4322. [Google Scholar] [CrossRef]
  6. Zhang, G.; Wang, J.; Ni, A. Process-Induced Stress and Deformation of Variable-Stiffness Composite Cylinders during Curing. Materials 2019, 12, 259. [Google Scholar] [CrossRef] [Green Version]
  7. Ding, A.X.; Wang, J.H.; Ni, A.Q.; Li, S.X. A new analytical solution for cure-induced spring-in of L-shaped composite parts. Compos. Sci. Technol. 2019, 171, 1–12. [Google Scholar] [CrossRef]
  8. Liu, K.; Zhang, B.; Xu, X.; Ye, J.; Liu, C. Simulation and Analysis of Process-Induced Distortions in Hemispherical Thermostamping for Unidirectional Thermoplastic Composites. Polym. Compos. 2018, 40, 1786–1800. [Google Scholar] [CrossRef]
  9. Kappel, E. Distortions of composite aerospace frames due to processing, thermal loads and trimming operations and an assessment from an assembly perspective. Compos. Struct. 2019, 220, 338–346. [Google Scholar] [CrossRef]
  10. Yuan, Z.; Wang, Y.; Peng, X.; Wang, J.; Wei, S. An analytical model on through-thickness stresses and warpage of composite laminates due to tool–part interaction. Compos. Sci. Part B Eng. 2016, 91, 408–413. [Google Scholar] [CrossRef]
  11. Ding, A.X.; Li, S.X.; Wang, J.H.; Ni, A.Q.; Zu, L. A new path-dependent constitutive model predicting cure-induced distortions in composite structures. Compos. Part A Appl Sci. 2017, 95, 183–196. [Google Scholar] [CrossRef]
  12. Kappel, E. Forced-interaction and spring-in - Relevant initiators of process-induced distortions in composite manufacturing. Compos. Struct. 2016, 140, 217–229. [Google Scholar] [CrossRef]
  13. Ding, A.X.; Li, S.X.; Wang, J.H.; Ni, A.Q. A new analytical solution for spring-in of curved composite parts. Compos. Sci. Technol. 2017, 142, 30–40. [Google Scholar] [CrossRef]
  14. Muller, M.T.; Potzsch, H.F.; Gohs, U.; Heinrich, G. Online Structural-Health Monitoring of Glass Fiber-Reinforced Thermoplastics Using Different Carbon Allotropes in the Interphase. Materials 2018, 11, 75. [Google Scholar] [CrossRef] [PubMed] [Green Version]
  15. Jovančević, I.; Pham, H.-H.; Orteu, J.-J.; Gilblas, R.; Harvent, J.; Maurice, X.; Brèthes, L. 3D Point Cloud Analysis for Detection and Characterization of Defects on Airplane Exterior Surface. J. Nondestruct. Eval 2017, 36, s10921¨Cs017. [Google Scholar]
  16. Xu, X.Y.; Kargoll, B.; Bureick, J.; Yang, H.; Alkhatib, H.; Neumann, I. TLS-based profile model analysis of major composite structures with robust B-spline method. Compos. Struct. 2018, 184, 814–820. [Google Scholar] [CrossRef]
  17. Wu, D.W.; Ding, X.F.; Tong, G. Surface Design of Molding Tool for Composite Component Based on Reverse Engineering. Adv. Mater. Res. 2012, 503–504, 215–218. [Google Scholar] [CrossRef]
  18. Kwiatkowski, J.; Anigacz, W.; Beben, D. Comparison of Non-Destructive Techniques for Technological Bridge Deflection Testing. Materials 2020, 13, 1908. [Google Scholar] [CrossRef]
  19. Bellini, C.; Sorrentino, L. Analysis of cure induced deformation of CFRP U-shaped laminates. Compos. Struct. 2018, 197, 1–9. [Google Scholar] [CrossRef]
  20. Che, L.; Zhou, Z.; Fang, G.; Ma, Y.; Dong, W.; Zhang, J. Cured shape prediction of fiber metal laminates considering interfacial interaction. Compos. Struct. 2018, 194, 564–574. [Google Scholar] [CrossRef]
  21. Baran, I.; Hattel, J.H.; Akkerman, R. Investigation of process induced warpage for pultrusion of a rectangular hollow profile. Compos. Part B Eng. 2015, 68, 365–374. [Google Scholar] [CrossRef]
  22. Filippatos, A.; Langkamp, A.; Gude, M. Influence of Gradual Damage on the Structural Dynamic Behaviour of Composite Rotors: Simulation Assessment. Materials 2018, 11, 2453. [Google Scholar] [CrossRef] [Green Version]
  23. Xu, X.Y.; Yang, H.; Zhang, Y.; Neumann, I. Intelligent 3D data extraction method for deformation analysis of composite structures. Compos. Struct. 2018, 203, 254–258. [Google Scholar] [CrossRef]
  24. Yang, H.; Xu, X.Y.; Neumann, I. Deformation behavior analysis of composite structures under monotonic loads based on terrestrial laser scanning technology. Compos. Struct. 2018, 183, 594–599. [Google Scholar] [CrossRef]
  25. Yang, H.; Xu, X.Y.; Neumann, I. An automatic finite element modelling for deformation analysis of composite structures. Compos. Struct. 2019, 212, 434–438. [Google Scholar] [CrossRef]
  26. Cheng, X.; Li, Z.; Zhong, K.; Shi, Y. An automatic and robust point cloud registration framework based on view-invariant local feature descriptors and transformation consistency verification. Opt. Las. Eng. 2017, 98, 37–45. [Google Scholar] [CrossRef]
  27. Tan, L.B.; Tse, K.M.; Lee, H.P.; Tan, V.B.C.; Lim, S.P. Performance of an advanced combat helmet with different interior cushioning systems in ballistic impact: Experiments and finite element simulations. Int. J. Impact Eng. 2012, 50, 99–112. [Google Scholar] [CrossRef]
  28. Pei, X.Y.; Shang, B.; Chen, L.; Li, J.L.; Tang, Y.H. Compression properties of multilayer-connected biaxial weft knitted carbon fiber fabric reinforced composites. Compos. Part. B-Eng. 2016, 91, 296–305. [Google Scholar] [CrossRef]
  29. Qi, Y.X.; Li, J.L.; Liu, L.S. Stiffness prediction of multilayer-connected biaxial weft-knitted fabric-reinforced composites. J. Reinf. Plast. Compos. 2015, 34, 1113–1125. [Google Scholar] [CrossRef]
  30. Jiang, G.; Gao, Z.; Ma, P.; Miao, X.; Zhu, Y. Comparative study on the mechanical behavior of carbon weft-knitted biaxial fabrics stitched by polyester fibers and preoxidized polyacrylonitrile fibers. J. Ind. Text. 2013, 44, 5–21. [Google Scholar] [CrossRef]
  31. Li, X.K.; Bai, S.L. Sheet forming of the multi-layered biaxial weft knitted fabric reinforcement. Part I: On hemispherical surfaces. Compos. Part. A-Appl. S 2009, 40, 766–777. [Google Scholar] [CrossRef]
  32. Qi, Y.; Li, J.; Liu, L. Tensile properties of multilayer-connected biaxial weft knitted fabric reinforced composites for carbon fibers. Mater. Des. (1980–2015) 2014, 54, 678–685. [Google Scholar] [CrossRef]
  33. Hasani, H.; Hassanzadeh, S.; Abghary, M.J.; Omrani, E. Biaxial weft-knitted fabrics as composite reinforcements: A review. J. Ind. Text. 2016, 46, 1439–1473. [Google Scholar] [CrossRef]
  34. Demircan, Ö.; Ashibe, S.; Kosui, T.; Nakai, A. Mechanical properties of biaxial weft-knitted and cross-ply thermoplastic composites. J. Thermoplast. Compos. Mater. 2014, 28, 1058–1074. [Google Scholar] [CrossRef]
  35. Bi, Z.M.; Wang, L. Advances in 3D data acquisition and processing for industrial applications. Robot. Comput. Integr. Manuf. 2010, 26, 403–413. [Google Scholar] [CrossRef]
  36. Li, T.; Gao, L.; Li, P.; Pan, Q. An ensemble fruit fly optimization algorithm for solving range image registration to improve quality inspection of free-form surface parts. Inf. Sci. 2016, 367–368, 953–974. [Google Scholar] [CrossRef]
  37. Besl, P.J.; McKay, N.D. A method for registration of 3-D shapes. IEEE Trans. Pattern Anal. Mach. Intell. 1992, 14, 239–256. [Google Scholar] [CrossRef]
  38. O’Toole, S.; Osnes, C.; Bartlett, D.; Keeling, A. Investigation into the accuracy and measurement methods of sequential 3D dental scan alignment. Dent. Mater. Off. Publ. Acad. Dent. Mater. 2019, 35, 495–500. [Google Scholar] [CrossRef]
  39. Li, Y.; Gu, P. Free-form surface inspection techniques state of the art review. Comput. Aided Des. 2004, 36, 1395–1417. [Google Scholar] [CrossRef]
  40. Gruen, A.; Akca, D. Least squares 3D surface and curve matching. ISPRS J. Photogramm. Remote Sens. 2005, 59, 151–174. [Google Scholar] [CrossRef] [Green Version]
  41. Nikmatin, S.; Hermawan, B.; Irmansyah, I.; Indro, M.N.; Kueh, A.B.H.; Syafiuddin, A. Evaluation of the Performance of Helmet Prototypes Fabricated from Acrylonitrile Butadiene Styrene Composites Filled with Natural Resource. Materials 2018, 12, 34. [Google Scholar] [CrossRef] [PubMed] [Green Version]
  42. Kaczynski, P.; Ptak, M.; Fernandes, A.O.F.; Chybowski, L.; Wilhelm, J.; Alves de Sousa, R.J. Development and Testing of Advanced Cork Composite Sandwiches for Energy-Absorbing Structures. Materials 2019, 12, 697. [Google Scholar] [CrossRef] [PubMed] [Green Version]
Figure 1. MBWK structure with three layers of inserting yarns.
Materials 13 02983 g001
Figure 2. Three types MBWK fabrics: (a) Aramid; (b) Aramid/carbon; (c) Aramid/UHMWPE.
Materials 13 02983 g002
Figure 3. Sample preparing process: (a) A schematic diagram of air bag compression molding process; (b) Actual molding set-up.
Materials 13 02983 g003
Figure 4. Measurement step of the helmets using a 3D laser scanning machine.
Materials 13 02983 g004
Figure 5. Alignment result based on ICP algorithm.
Materials 13 02983 g005
Figure 6. Work-flow of “feature distance” strategy.
Materials 13 02983 g006
Figure 7. The central points of design model and point cloud model: (a) The location of central points in CAD model; (b) Central point obtaining in CAD model; (c) The location of central points in point cloud model; (d) Central point obtaining in point cloud model.
Materials 13 02983 g007
Figure 8. Feature points and feature distance: (a) The feature of CAD model; (b) Feature note.
Materials 13 02983 g008
Figure 9. Feature distance results.
Materials 13 02983 g009
Figure 10. Division of the helmet: (a) Dividing the helmet into five areas; (b) Names of five areas.
Materials 13 02983 g010
Figure 11. The distortion tendencies of five areas.
Materials 13 02983 g011
Figure 12. Total deformation results of nine helmets.
Materials 13 02983 g012
Table 1. Specification of inserting yarns.
TypeDensityTensile StrengthTensile ModulusCTE
/(g·cm−3)/GPa/GPa/10−6
Carbon1.763.53230−0.54
Aramid1.443.00112−2.7
UHMWPE0.973.2099−12
Table 2. Parameters of three types MBWK fabrics.
TypeFineness of Stitch Yarns (Polyester)Weft Yarns’ CompositionWarp Yarns’ CompositionThickness
Aramid75D × 2Aramid
100%
Aramid
100%
1.0 mm
Aramid/Carbon75D × 2Aramid: Carbon
8: 4
Aramid: Carbon
8: 4
0.9 mm
Aramid/UHMWPE75D × 2Aramid: UHMWPE
10: 10
Aramid: UHMWPE
10: 10
0.9 mm
Table 3. Specification of resins.
ResinTensile ModulusBending ModulusCTE
/GPa/GPa/10−6·℃
VE (R806)2.93.224
UP (191S)3.83.4135
EP (6349)2.32.668
Table 4. Sample code symbols.
VE (R806)UP (191S)EP(6349)
AramidA1B1C1
Aramid/CarbonA2B2C2
Aramid/UHMWPEA3B3C3
Table 5. Laser system.
Laser SystemParameter
Accuracy0.034 mm
Point acquisition rate23,040 points/s
Points per line768
Line rate30 Hz
Table 6. Configuration of feature points and feature distance.
Pt1Pt2Pt3Pt4Pt5Pt6Pt7
Pt1
Pt2D1
Pt3 D2 Symmetric
Pt4D4 D3
Pt5D5D9
Pt6 D10 D6
Pt7D8 D11 D7

