Burial Depth Effect of Crack on the Lcr Wave Acoustoelastic Coefficient for Stress Measurement of Laser Cladding Coating


Abstract
1. Introduction
2. Experimental Material and Methods
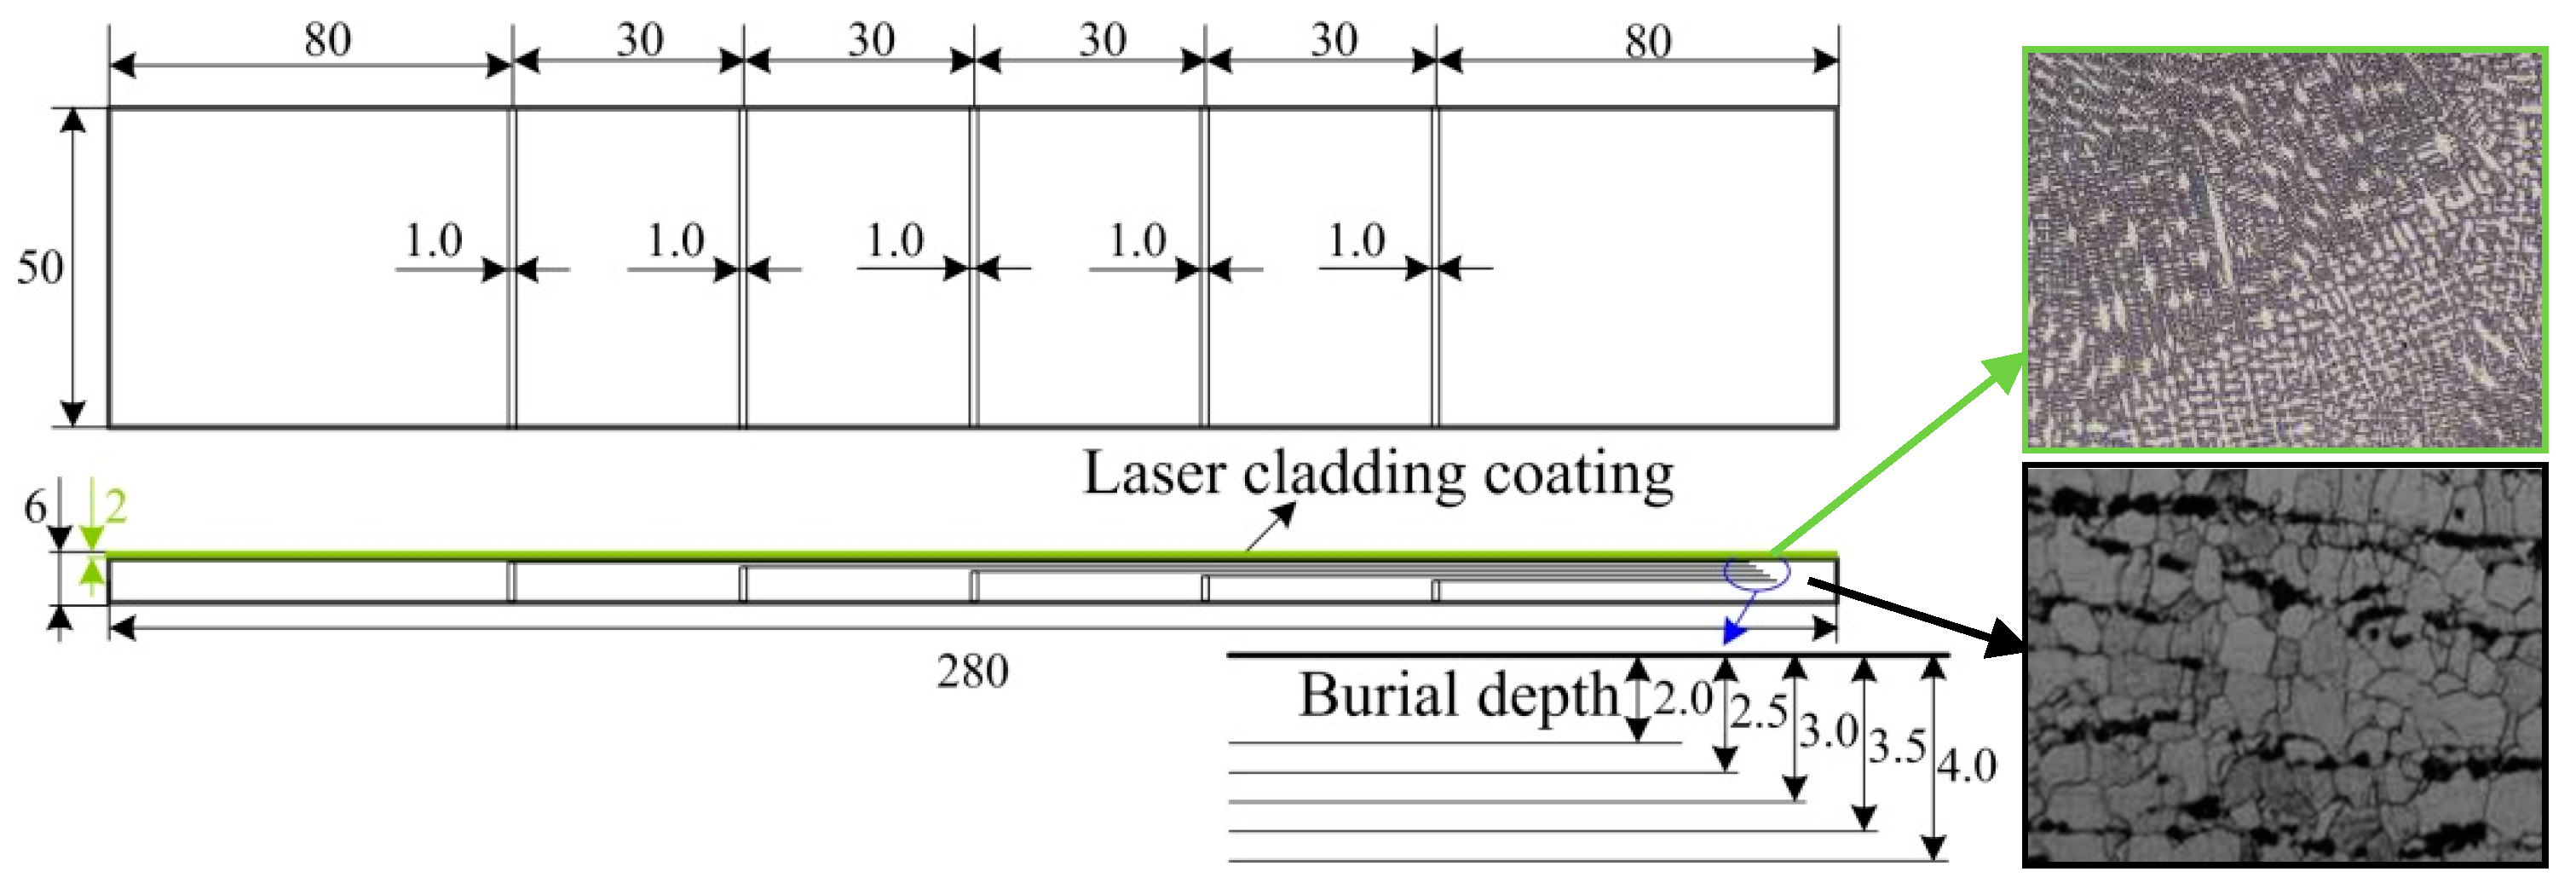
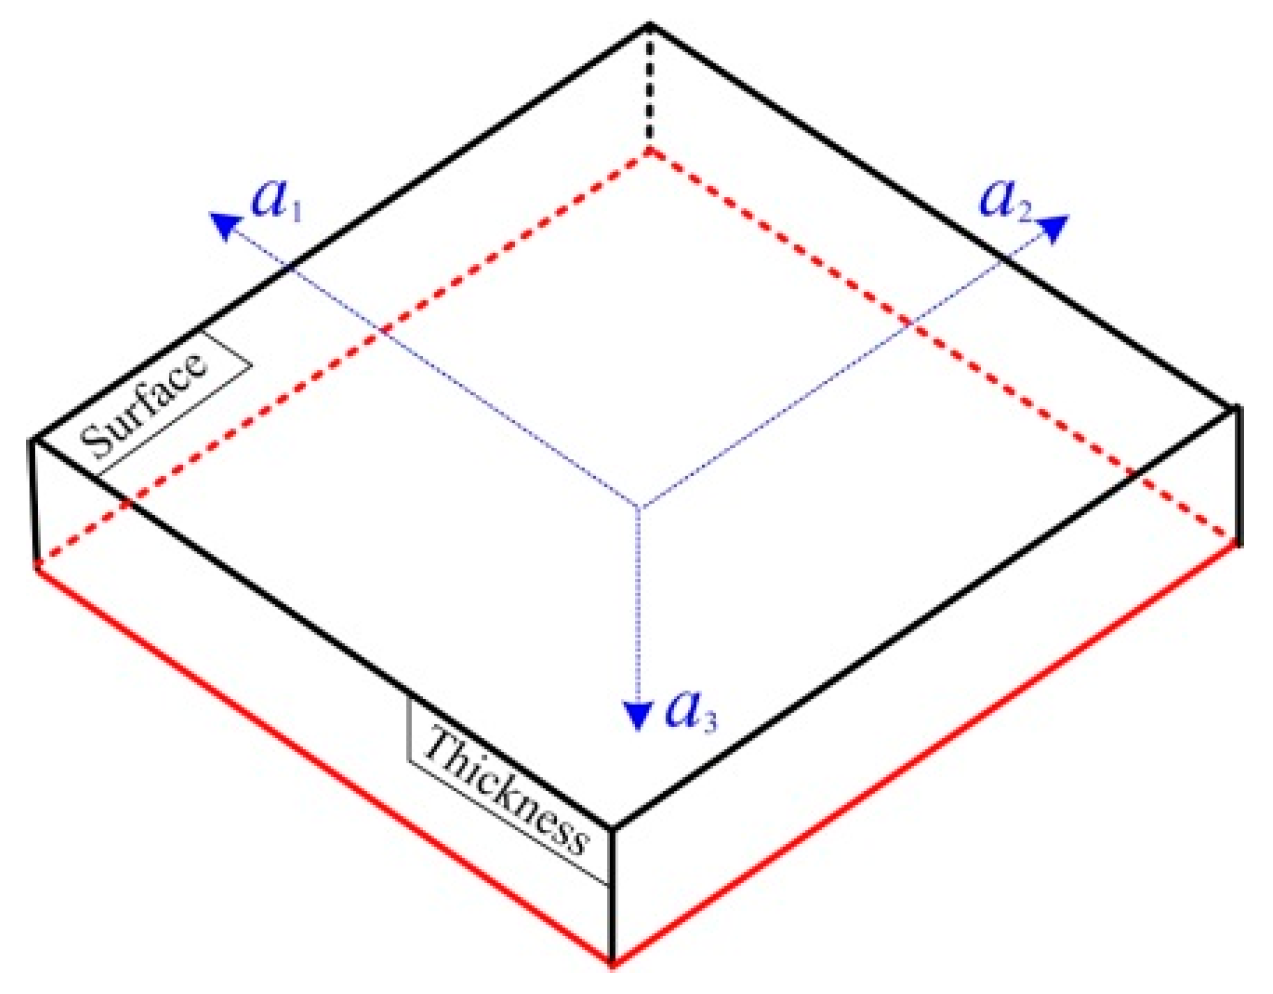
2.1. Experimental Material
2.2. Lcr Wave Acoustoelastic Theory
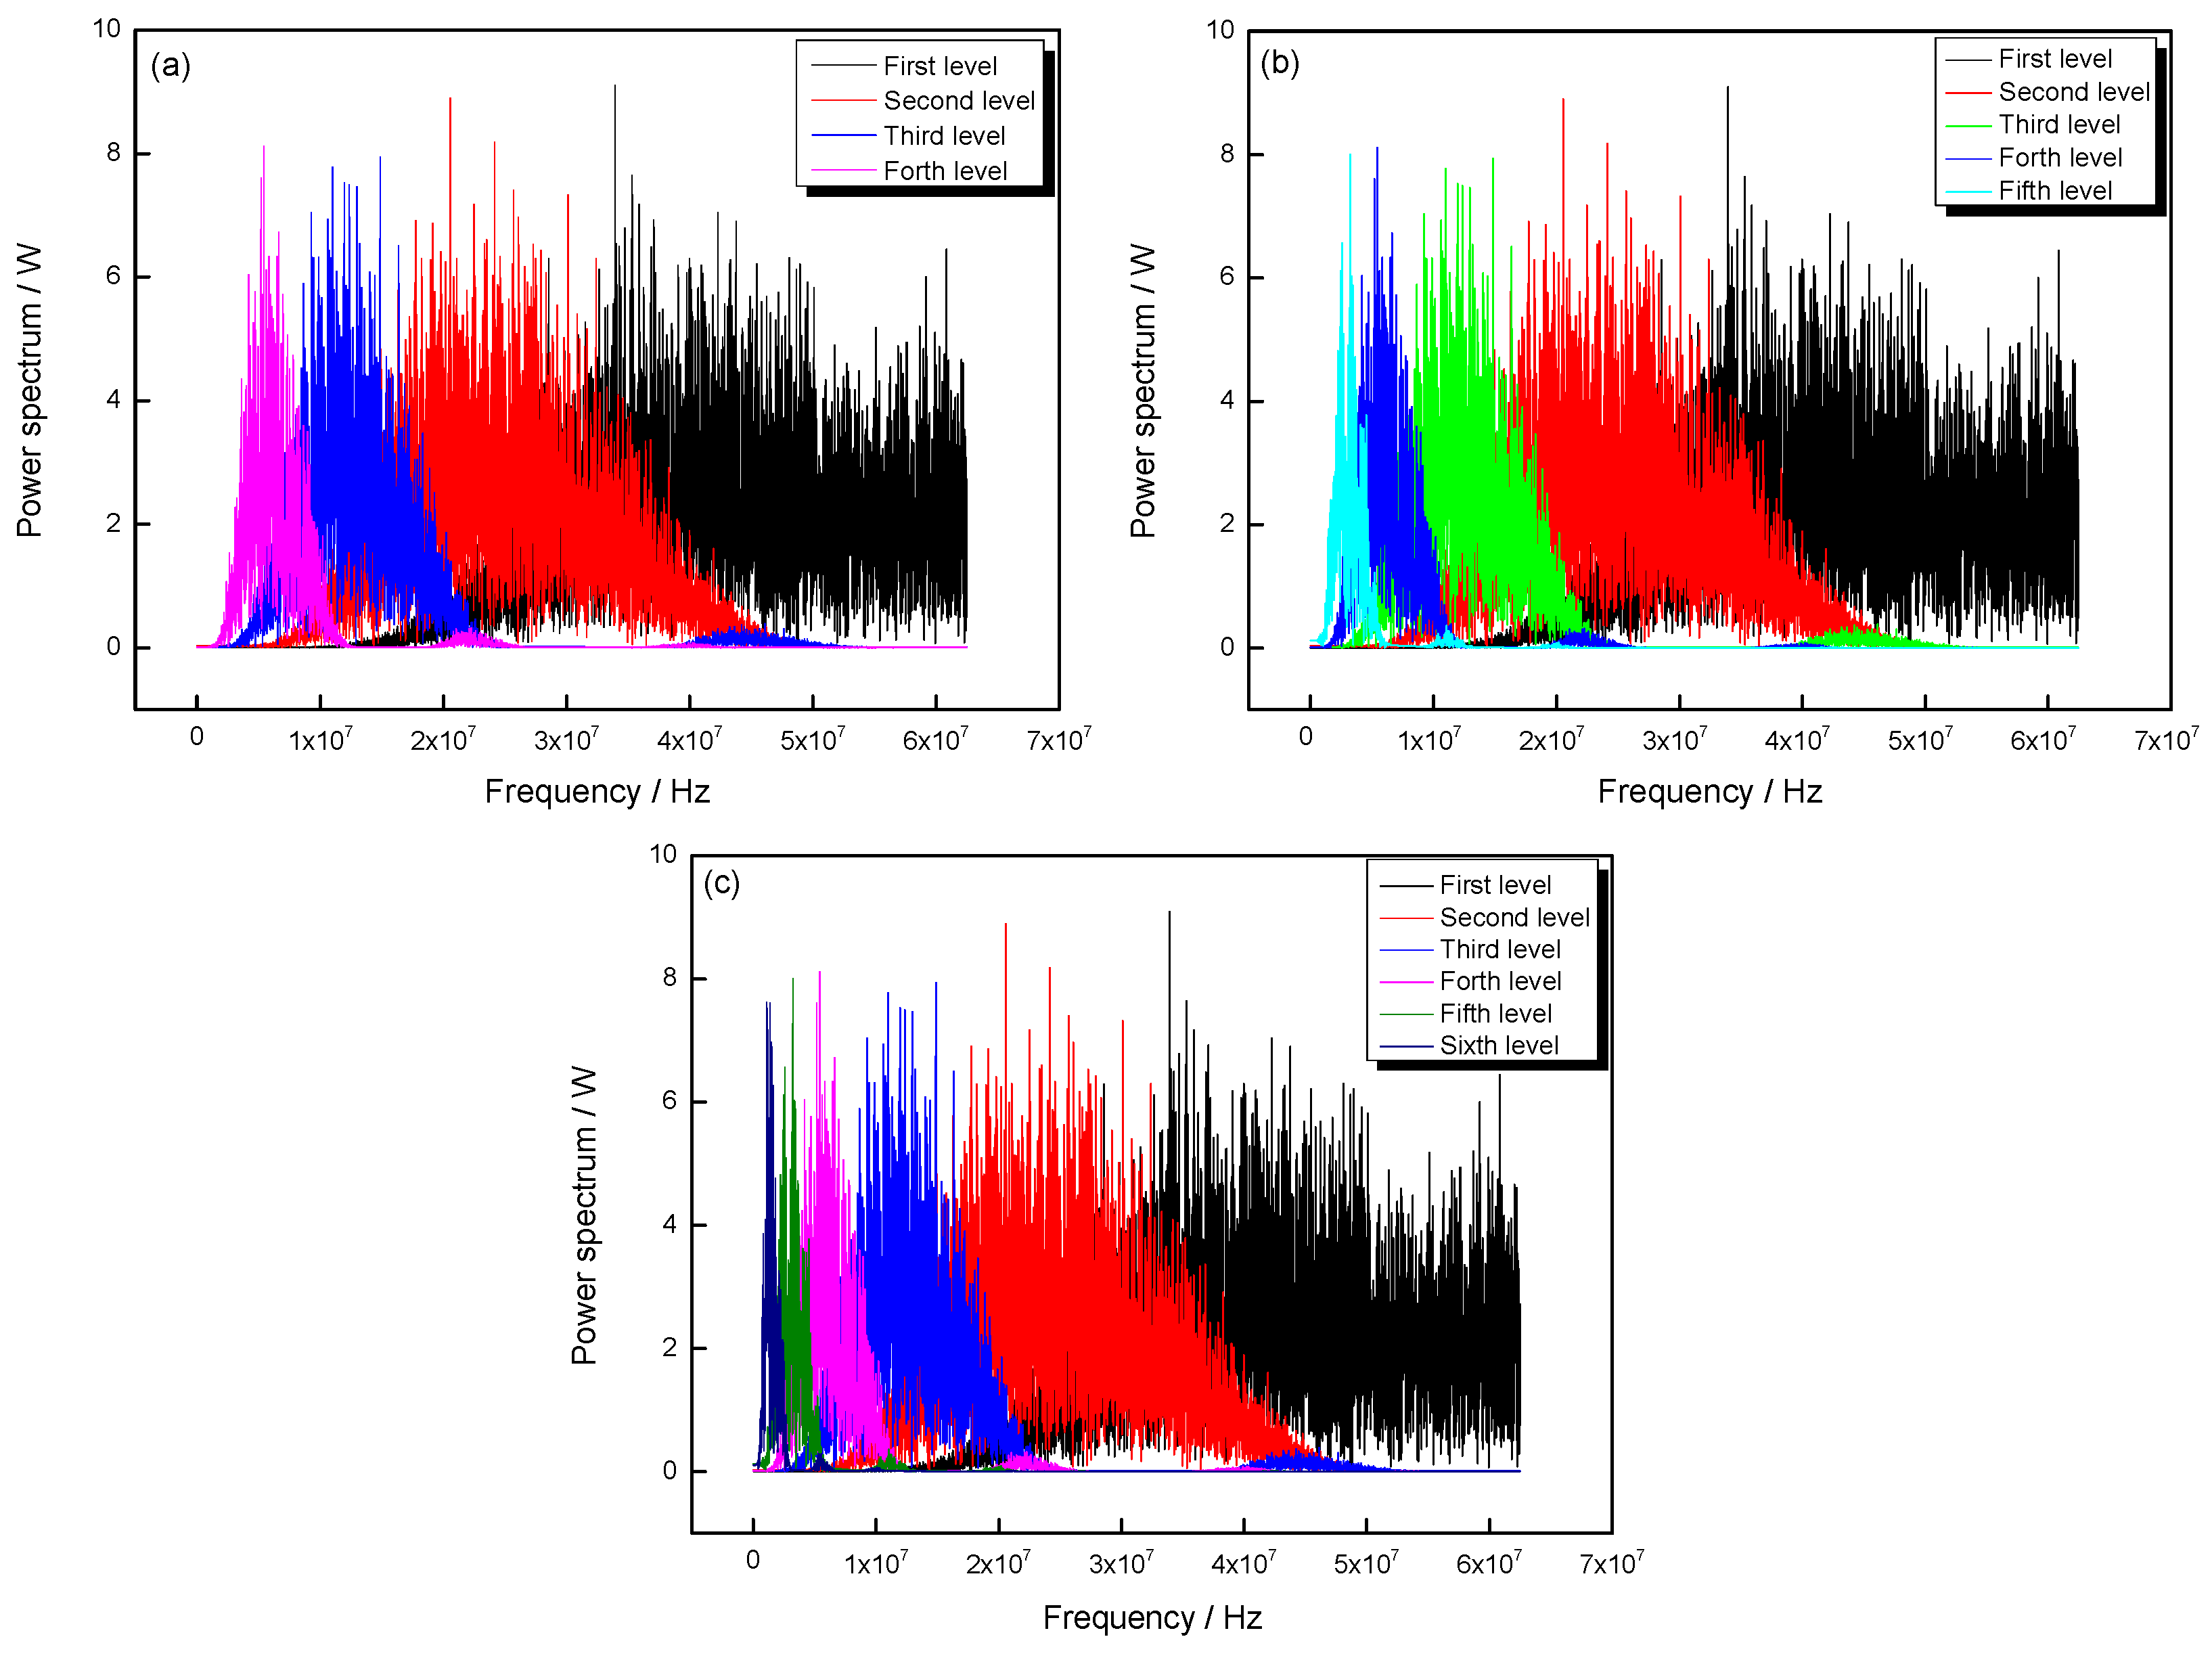
2.3. The Cross-Correlation Theory
2.4. Experimental System for Stress Evaluation
3. Results and Discussion
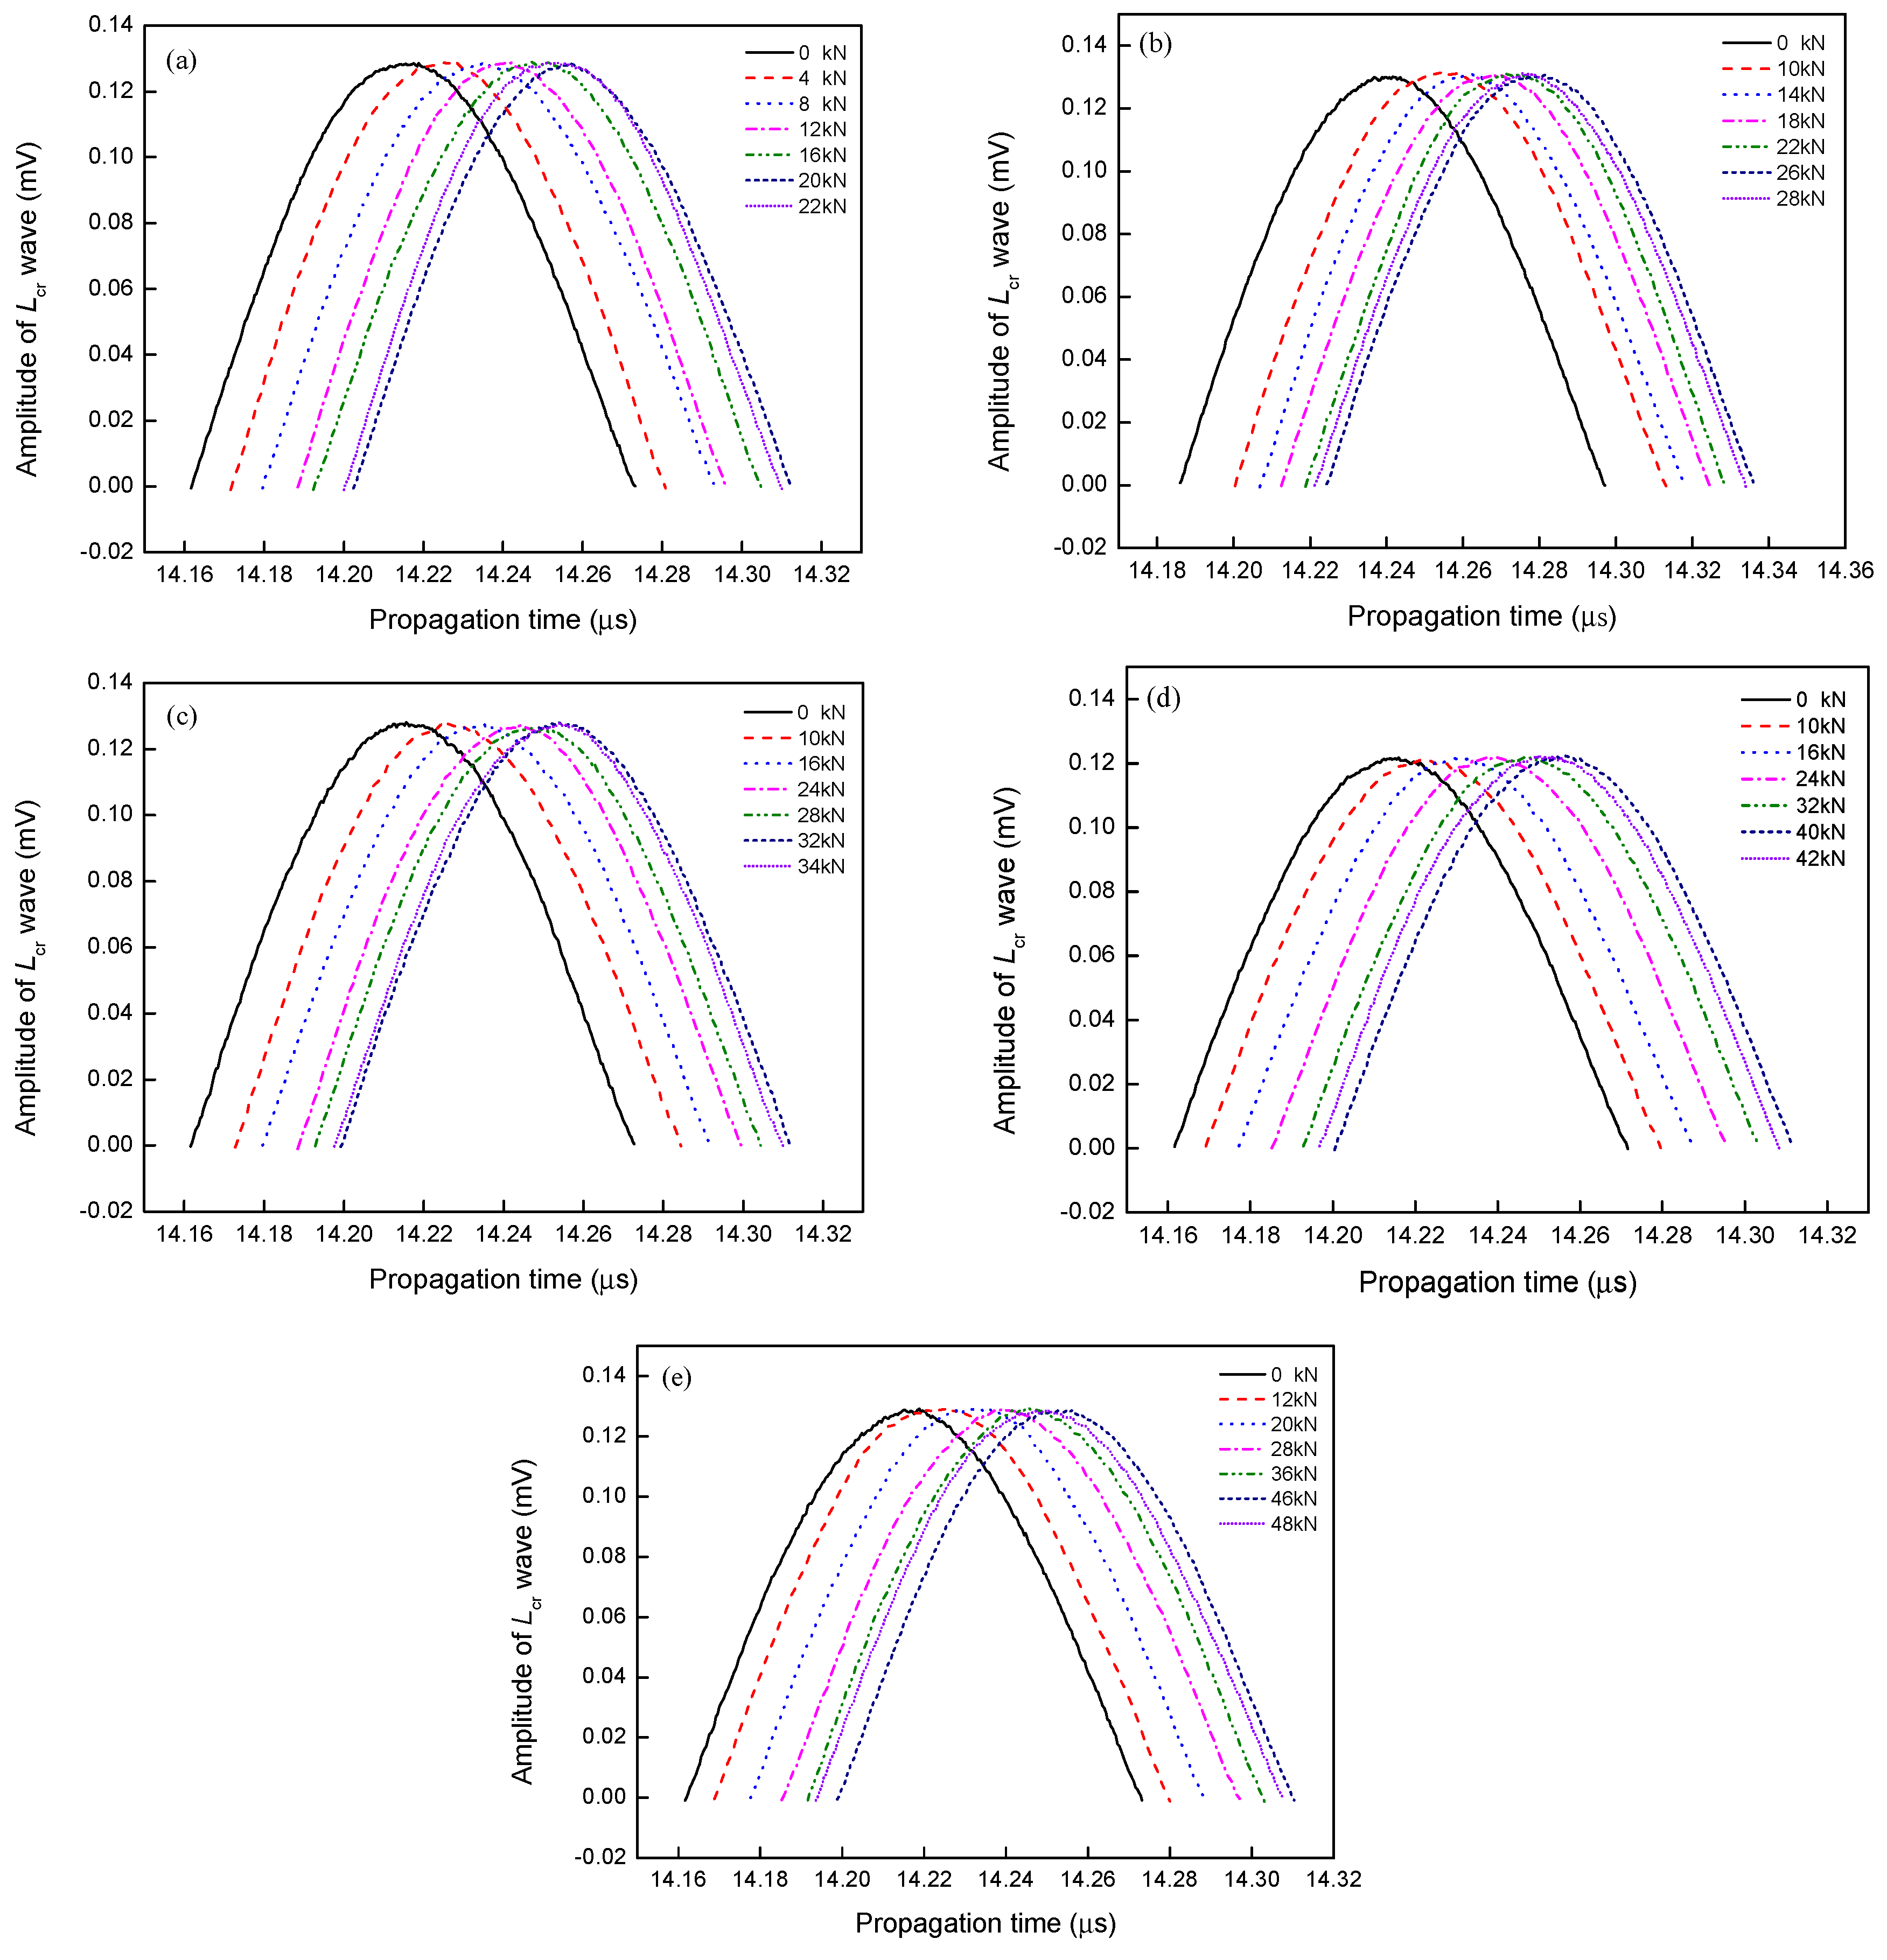
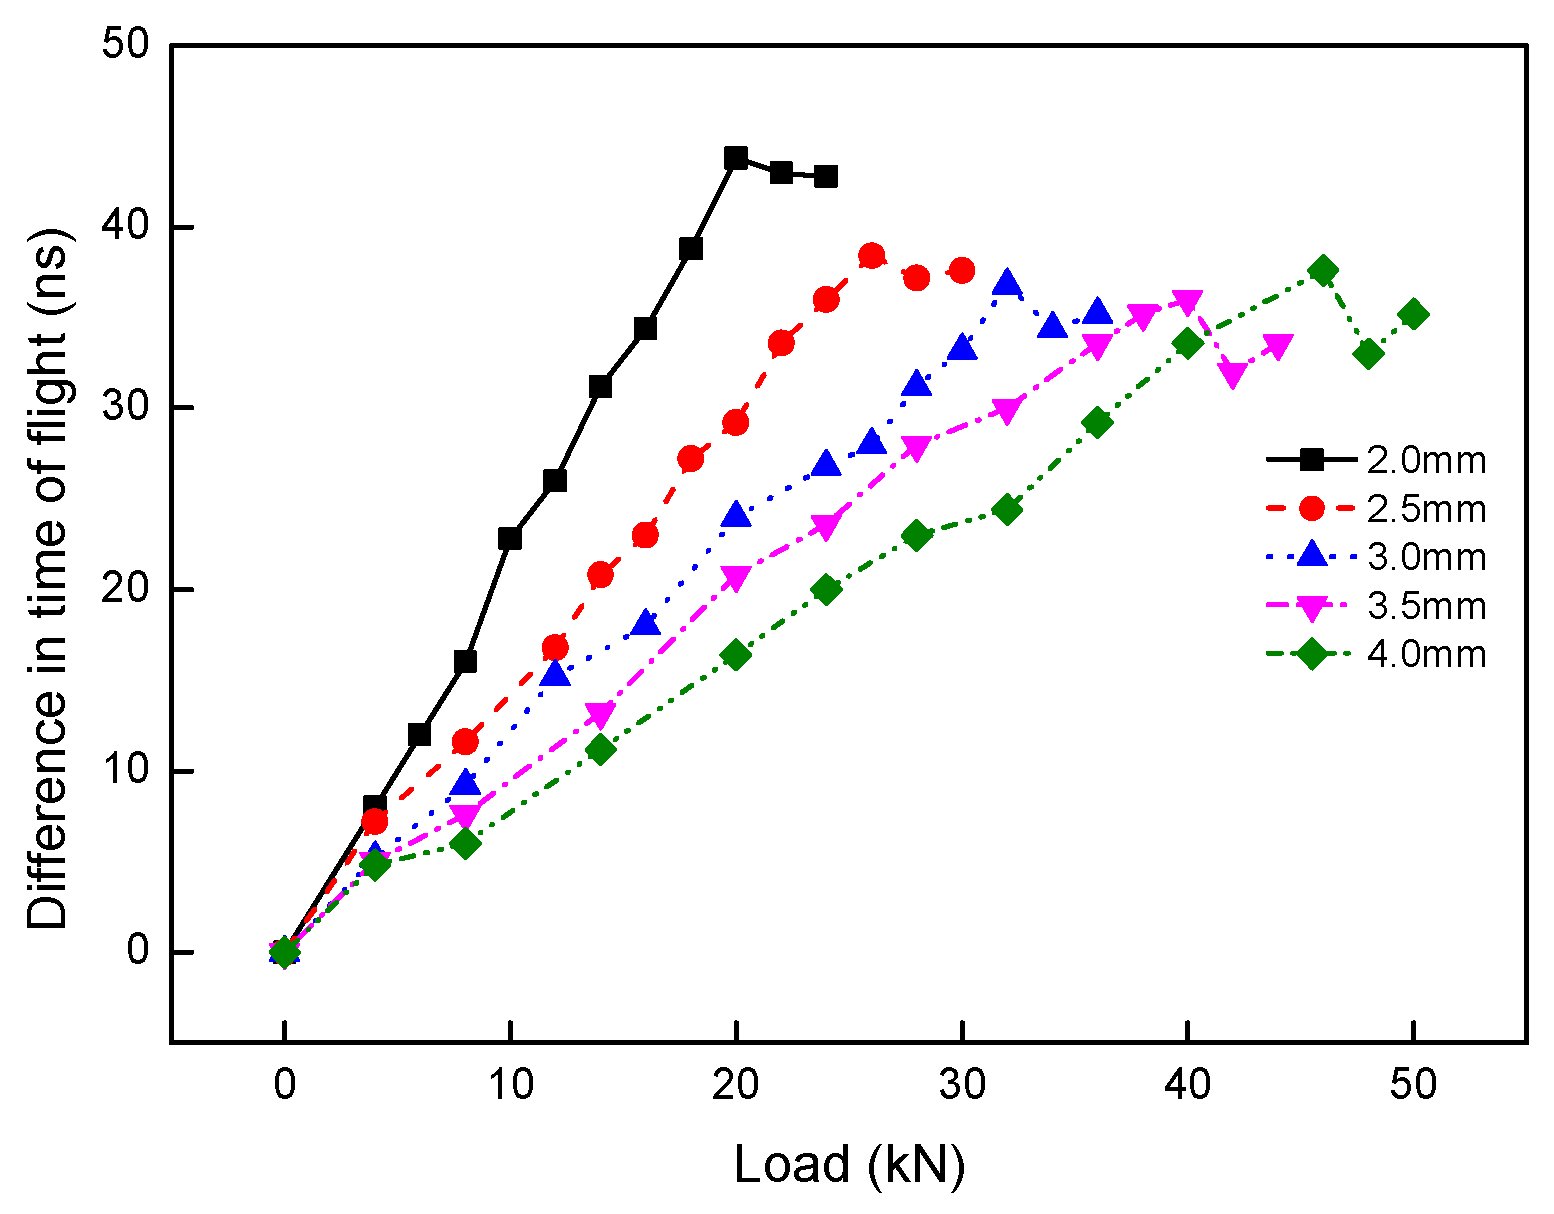
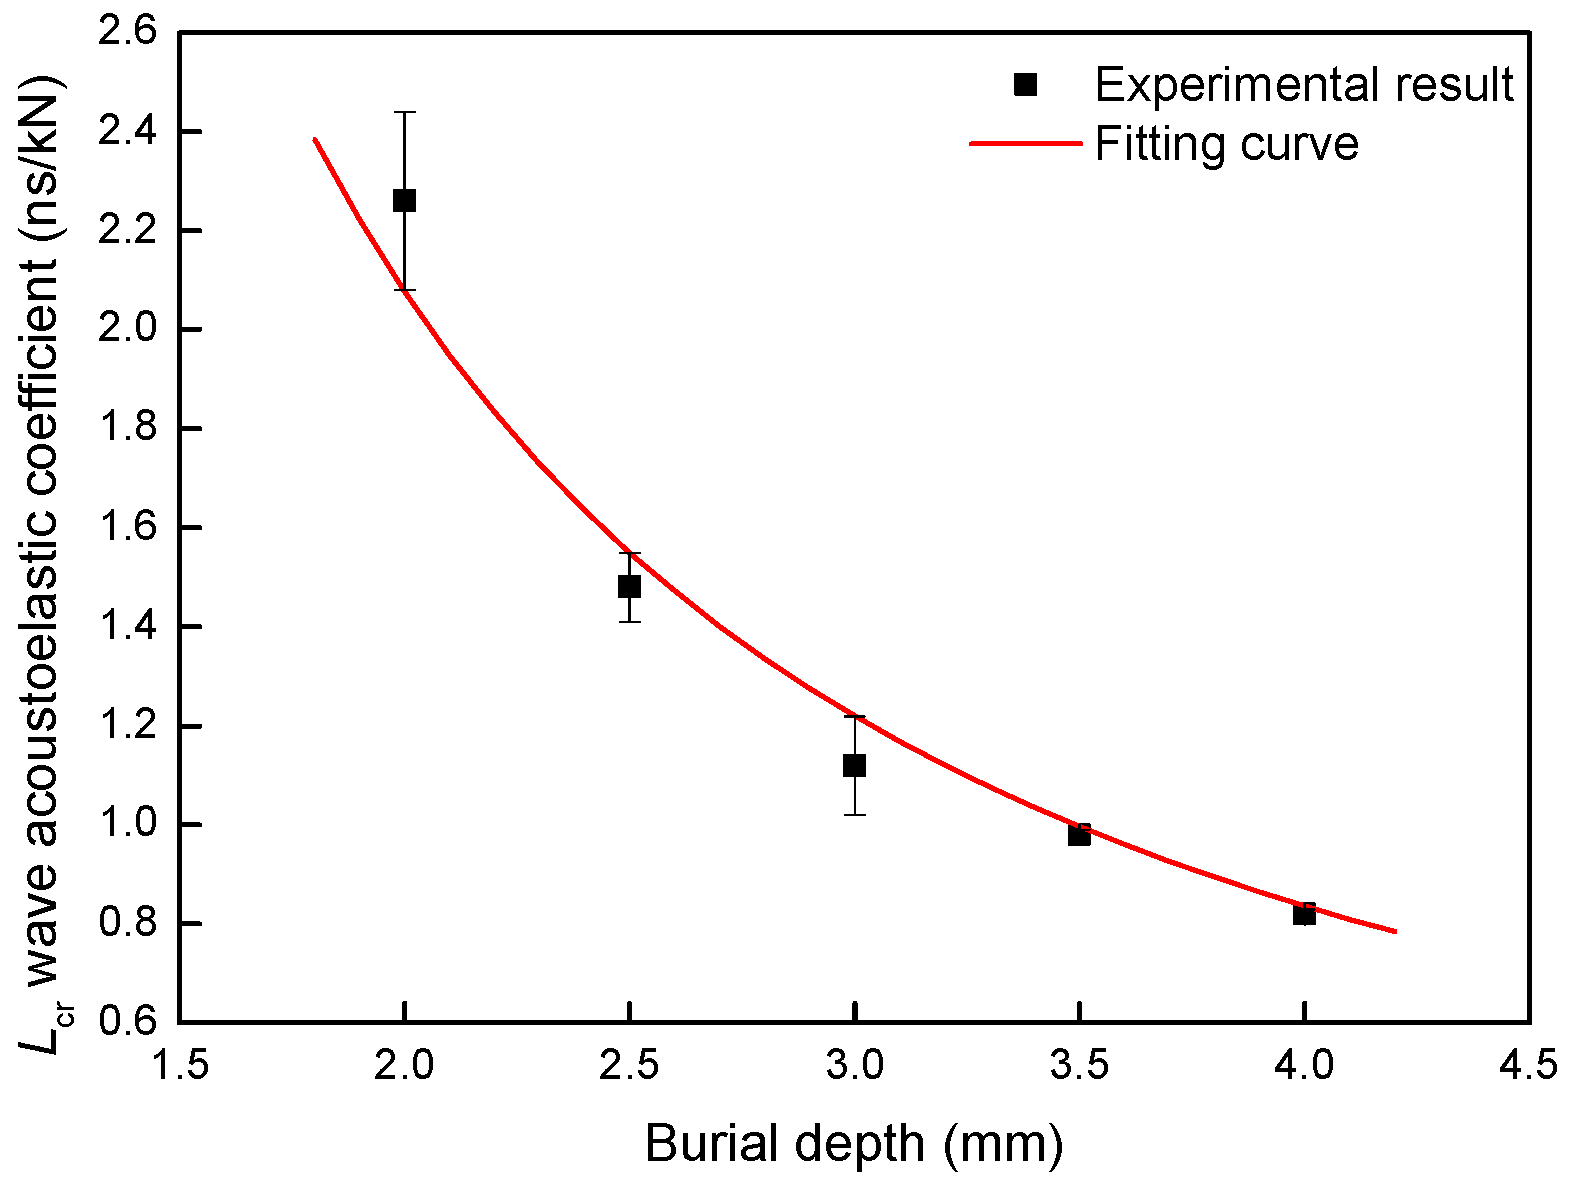
3.1. Relation of the Lcr Wave Acoustoelastic Coefficient and Burial Depth of Crack
3.2. Discussion and Analysis
4. Conclusions
Author Contributions
Funding
Conflicts of Interest
References
- Wei, L.; Zhang, X.F. An optical method for measuring mixed-mode stress intensity factors for an arbitrarily oriented crack in cylindrical shells. Theor. Appl. Fract. Mech. 2020, 107, 102567–102580. [Google Scholar]
- Weisz-Patrault, D.; Maurin, L.; Legrand, N.; Salem, A.N.; Bengrir, A.A. Experimental evaluation of contact stress during cold rolling process with optical fiber Bragg gratings sensors measurements and fast inverse method. J. Mater. Process. Technol. 2015, 223, 105–123. [Google Scholar] [CrossRef]
- Liu, C.; Yan, Y.; Cheng, X.H.; Wang, C.J.; Zhao, Y. Residual stress in a restrained specimen processed by post- weld ultrasonic impact treatment. Sci. Technol. Weld. Join. 2019, 24, 193–199. [Google Scholar] [CrossRef]
- Liu, B.; Fu, P.; Li, R.F.; He, P.; Dong, S.Y. Influence of crack size on stress evaluation of ferromagnetic low alloy steel with metal magnetic memory technology. Materials 2019, 12, 4028. [Google Scholar] [CrossRef]
- Liu, B.; Xue, X.M.; Li, R.F.; Chen, S.J.; Dong, S.Y.; Shu, F.Y. Effect of precut flaw depth on stress evaluation of carbon steel with metal magnetic memory method. Mater. Eval. 2019, 77, 1347–1354. [Google Scholar]
- Yang, F.; Jiang, J.Q.; Fang, F.; Wang, Y.; Ma, C. Rapid determination of residual stress profiles in ferrite phase of cold-drawn wire by XRD and layer removal technique. Mater. Sci. Eng. A 2008, 486, 455–460. [Google Scholar] [CrossRef]
- Mao, H.L.; Zhang, Y.H.; Mao, H.Y.; Li, X.X.; Huang, Z.F. Stress evaluation of metallic material under steady state based on nonlinear critically refracted longitudinal wave. Results Phys. 2018, 9, 665–672. [Google Scholar] [CrossRef]
- Liu, B.; Gong, K.; Qiao, Y.X.; Dong, S.Y. Evaluation of influence of preset crack burial depth on stress of laser cladding coating with metal magnetic memory. Acta Metall. Sin. 2016, 52, 241–248. [Google Scholar]
- Javadi, Y.; Ashoori, M. Sub-surface stress measurement of cross welds in a dissimilar welded pressure vessel. Mater. Des. 2015, 85, 82–90. [Google Scholar] [CrossRef]
- Javadi, Y.; Pirzaman, H.S.; Raeisi, M.H.; Najafabadi, M.A. Ultrasonic stress evaluation through thickness of a stainless steel pressure vessel. Int. J. Pres. Ves. Pip. 2014, 123–124, 111–120. [Google Scholar] [CrossRef]
- Hu, E.Y.; He, Y.M.; Chen, Y.M. Experimental study on the surface stress measurement with Rayleigh wave. Appl. Acoust. 2009, 70, 356–360. [Google Scholar] [CrossRef]
- Ditri, J. Determination of nonuniform stresses in an isotropic elastic half space from measurements of the dispersion of surface waves. J. Mech. Phys. Solids 1997, 45, 51–66. [Google Scholar] [CrossRef]
- Husson, D. A perturbation theory for the acoustoelastic effect of surface waves. J. Appl. Phys. 1985, 57, 1562–1568. [Google Scholar] [CrossRef]
- Liu, B.; Miao, W.B.; Dong, S.Y.; He, P. Grain size effect on Lcr elastic wave for surface stress measurement of carbon steel. Nondestruct. Test. Eval. 2018, 33, 139–153. [Google Scholar] [CrossRef]
- Kurashkina, K.; Mishakina, V.; Rudenkob, A. Ultrasonic evaluation of residual stresses in welded joints of hydroelectric unit rotor frame. Mater. Today Proceed. 2019, 11, 163–168. [Google Scholar] [CrossRef]
- Zhan, Y.; Li, Y.M.; Zhang, E.D.; Ge, Y.M.; Liu, C.S. Laser ultrasonic technology for residual stress measurement of 7075 aluminum alloy friction stir welding. Appl. Acoust. 2019, 145, 52–59. [Google Scholar] [CrossRef]
- Liu, B.; Miao, W.B.; Dong, S.Y.; He, P. Grain size correction of welding residual stress measurement in a carbon steel plate using the critical refraction of longitudinal wave. Res. Nondestruct. Eval. 2019, 30, 112–126. [Google Scholar] [CrossRef]
- Karen, F.B.; Vladimir, G.H. Ultrasonic tests in the evaluation of the stress level in concrete prisms based on the acoustoelasticity. Constr. Bulid. Mater. 2018, 162, 740–750. [Google Scholar]
- Wang, W.; Xu, C.H.; Zhang, Y.M.; Zhou, Y.F.; Meng, S.H.; Deng, Y. An improved ultrasonic method for plane stress measurement using critically refracted longitudinal waves. NDT E Int. 2018, 99, 117–122. [Google Scholar] [CrossRef]
- Lhémery, A.; Calmon, P.; Chatillon, S.; Gengembre, N. Modeling of ultrasonic fields radiated by contact transducer in a component of irregular surface. Ultrasonics 2002, 40, 231–236. [Google Scholar] [CrossRef]
- Liu, H.B.; Li, Y.P.; Li, T.; Zhang, X.; Liu, Y.K.; Liu, K.; Wang, Y.Q. Influence factors analysis and accuracy improvement for stress measurement using ultrasonic longitudinal critically refracted (LCR) wave. Appl. Acoust. 2018, 141, 178–187. [Google Scholar] [CrossRef]
- Zou, D.; Liu, T.; Liang, C.; Huang, Y.; Zhang, F.; Du, C. An experimental investigation on the health monitoring of concrete structures using piezoelectric transducers at various environmental temperatures. J. Intell. Mater. Syst. Struct. 2015, 26, 1028–1034. [Google Scholar] [CrossRef]
- Javadi, Y.; Najafabadi, M.A. Comparison between contact and immersion ultrasonic method to evaluate welding residual stresses of dissimilar joints. Mater. Des. 2013, 47, 473–482. [Google Scholar] [CrossRef]
- Kube, C.M.; Arguelles, A.P.; Turner, J.A. Ultrasonic backscatter from elongated grains using line focused ultrasound. Ultrasonics 2018, 82, 79–83. [Google Scholar] [CrossRef]
- Zhan, Y.; Liu, C.; Zhang, J.J.; Mo, G.Z.; Liu, C.S. Measurement of residual stress in laser additive manufacturing TC4 titanium alloy with the laser ultrasonic technique. Mater. Sci. Eng. A 2019, 762, 138093–138102. [Google Scholar] [CrossRef]
- Liu, B.; Dong, S.Y. Stress evaluation of laser cladding coating with critically refracted longitudinal wave based on cross correlation function. Appl. Acoust. 2016, 101, 98–103. [Google Scholar] [CrossRef]
- Belahcene, F.; Lu, J. Determination of residual stress using critically refracted longitudinal waves and immersion mode. J. Strain. Anal. Eng. 2002, 37, 13–20. [Google Scholar] [CrossRef]
- Hugues, D.S.; Kelly, J.L. Second-order elastic deformation of solid. Phys. Rev. 1951, 92, 1145–1149. [Google Scholar] [CrossRef]
- Gao, Y.; Brennan, M.J.; Liu, Y.Y.; Fabrício, C.L.A.; Joseph, P.F. Improving the shape of the cross-correlation function for leak detection in a plastic water distribution pipe using acoustic signals. Appl. Acoust. 2017, 127, 24–33. [Google Scholar] [CrossRef]
- Liu, B.; Dong, S.Y. Anisotropic structure affects thickness measurement of laser cladding coating with surface ultrasonic wave based on cross-correlation function. Mater. Res. Innov. 2015, 19, 1–5. [Google Scholar] [CrossRef]


| Heating Rate/(°C·s−1) | Maximal Temperature/°C | Holding Time/Min | Cooling Mode |
|---|---|---|---|
| 10 | 550 | 30 | Furnace cooling |
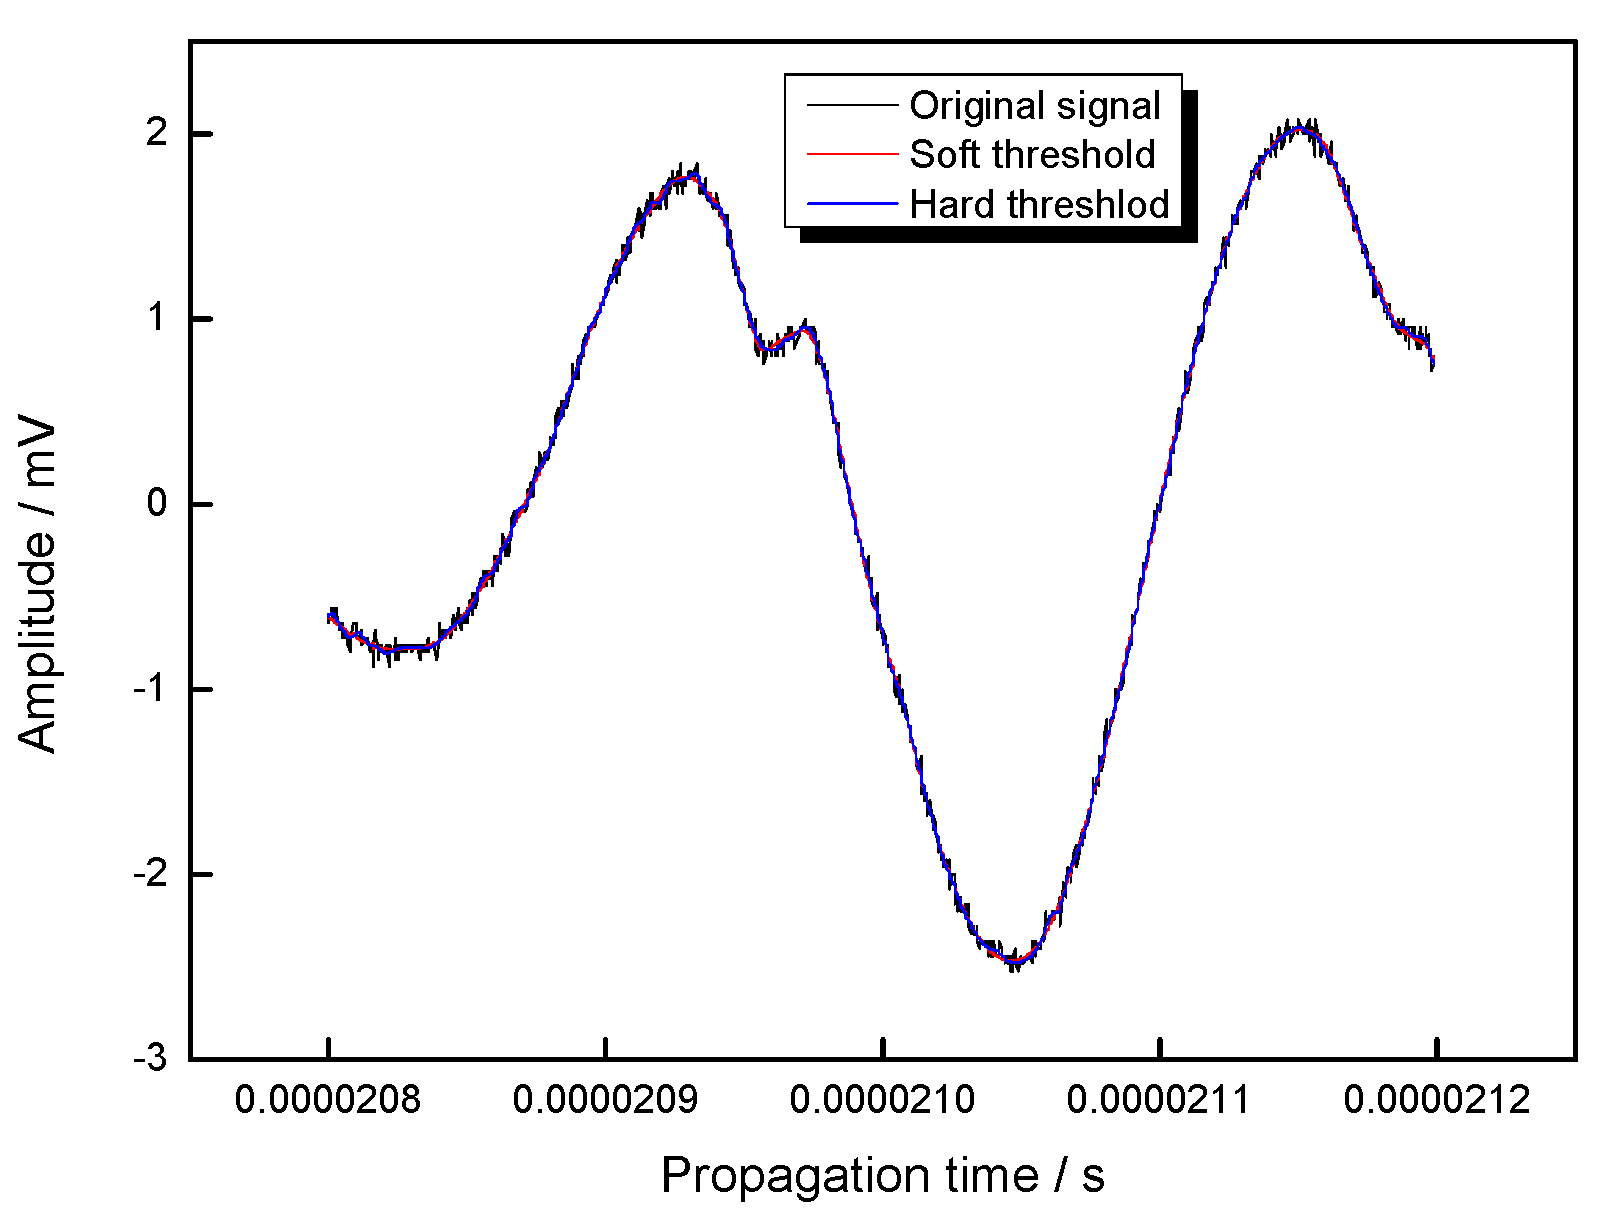
| Threshold Method | Signal-to-Noise Ratio | Mean Square Deviation |
|---|---|---|
| soft threshold | 18.721 | 0.031927 |
| hard threshold | 19.202 | 0.030205 |
© 2020 by the authors. Licensee MDPI, Basel, Switzerland. This article is an open access article distributed under the terms and conditions of the Creative Commons Attribution (CC BY) license (http://creativecommons.org/licenses/by/4.0/).
Share and Cite
Liu, B.; Zeng, Z.; Gu, J.; Chen, S.; He, P.; Fang, J. Burial Depth Effect of Crack on the Lcr Wave Acoustoelastic Coefficient for Stress Measurement of Laser Cladding Coating. Materials 2020, 13, 2823. https://doi.org/10.3390/ma13122823
Liu B, Zeng Z, Gu J, Chen S, He P, Fang J. Burial Depth Effect of Crack on the Lcr Wave Acoustoelastic Coefficient for Stress Measurement of Laser Cladding Coating. Materials. 2020; 13(12):2823. https://doi.org/10.3390/ma13122823
Chicago/Turabian StyleLiu, Bin, Zhihao Zeng, Jiayang Gu, Shujin Chen, Peng He, and Jinxiang Fang. 2020. "Burial Depth Effect of Crack on the Lcr Wave Acoustoelastic Coefficient for Stress Measurement of Laser Cladding Coating" Materials 13, no. 12: 2823. https://doi.org/10.3390/ma13122823
APA StyleLiu, B., Zeng, Z., Gu, J., Chen, S., He, P., & Fang, J. (2020). Burial Depth Effect of Crack on the Lcr Wave Acoustoelastic Coefficient for Stress Measurement of Laser Cladding Coating. Materials, 13(12), 2823. https://doi.org/10.3390/ma13122823