Article

Energy Transfer Study on Tb3+/Eu3+ Co-Activated Sol-Gel Glass-Ceramic Materials Containing MF3 (M = Y, La) Nanocrystals for NUV Optoelectronic Devices

by
Natalia Pawlik
*,
Barbara Szpikowska-Sroka
and
Wojciech A. Pisarski
*
Institute of Chemistry, University of Silesia, 40-007 Katowice, Poland
*
Authors to whom correspondence should be addressed.
Materials 2020, 13(11), 2522; https://doi.org/10.3390/ma13112522
Submission received: 22 April 2020 / Revised: 18 May 2020 / Accepted: 28 May 2020 / Published: 1 June 2020
(This article belongs to the Special Issue Advances in Materials for Organic Optoelectronics and Photonics)

Abstract

:
In the present work, the Tb3+/Eu3+ co-activated sol-gel glass-ceramic materials (GCs) containing MF3 (M = Y, La) nanocrystals were fabricated during controlled heat-treatment of silicate xerogels at 350 °C. The studies of Tb3+ → Eu3+ energy transfer process (ET) were performed by excitation and emission spectra along with luminescence decay analysis. The co-activated xerogels and GCs exhibit multicolor emission originated from 4fn–4fn optical transitions of Tb3+ (5D47FJ, J = 6–3) as well as Eu3+ ions (5D07FJ, J = 0–4). Based on recorded decay curves, it was found that there is a significant prolongation in luminescence lifetimes of the 5D4 (Tb3+) and the 5D0 (Eu3+) levels after the controlled heat-treatment of xerogels. Moreover, for both types of prepared GCs, an increase in ET efficiency was also observed (from ηET ≈ 16% for xerogels up to ηET = 37.3% for SiO2-YF3 GCs and ηET = 60.8% for SiO2-LaF3 GCs). The changes in photoluminescence behavior of rare-earth (RE3+) dopants clearly evidenced their partial segregation inside low-phonon energy fluoride environment. The obtained results suggest that prepared SiO2-MF3:Tb3+, Eu3+ GC materials could be considered for use as optical elements in RGB-lighting optoelectronic devices operating under near-ultraviolet (NUV) excitation.

1. Introduction

The development of materials dedicated to photonic applications is a frontier area of current materials engineering research [1,2]. Thus, considerable efforts are still being made to improve the optical parameters of such materials, e.g., the tuning of emissions in the desired spectrum range. In this case, the willingly studied pathway for generation a white light is related to the mixing of three primary colors—red, green and blue (RGB)—in optical materials. Such red-green-blue multicolor visible light can be achieved via up-conversion of near-infrared radiation (NIR) [3,4,5,6,7] or via the conversion of near-ultraviolet (NUV) photons [8,9,10]. Since rare-earth ions (RE3+) exhibit a broad range of emission in the visible (VIS) spectral scope via interactions with NIR and NUV irradiation, they are considered as essential parts in the development of white-light-emitting RGB materials [11,12]. The first of abovementioned ways of generating RGB emission can be realized via NIR up-conversion excitation in doubly (e.g., Yb3+/Er3+ [3,4], Yb3+/Tm3+ [4]) and triply doped (e.g., Yb3+/Er3+/Tm3+ [5,6], Tb3+/Tm3+/Yb3+ [7]) optical systems. For example, for Yb3+/Er3+/Tm3+ triply doped β-NaYF4 microrods, Er3+ ions are responsible for the generation of red (the 4F9/24I15/2 transition) as well as green (the 2H11/24I15/2 and the 4S3/24I15/2 transitions) emissions through a two-photon absorption process involved in Yb3+ → Er3+ energy transfer. Simultaneously, due to the three-photon assisted process of Yb3+ → Tm3+ energy transfer, Tm3+ ions are able to emit blue light (the 1D23F4 and the 1G43H6 transitions) [5]. The second of the abovementioned routes can be realized via the successful conversion of NUV irradiation into VIS light. In this matter, Eu3+ ions are treated as a red or reddish-orange light source (the 5D07FJ transitions, J = 0–4) and Tb3+ ions are considered as one of the most important sources of green emission (the 5D47F5 transition). Therefore, co-doping with Tb3+/Eu3+ ions seems to be a promising strategy for the generation of multicolor luminescence, which plays a key role in RGB optical materials [13,14,15,16].
Another particularly important point in the field of substantial enhancement, the luminescence of RE3+ ions is related to the selection of a suitable host lattice with low phonon energy. Since the phonon energies of fluorides—usually in a range from 400 up to 500 cm−1 [17]—are significantly lower compared to phosphates (~1250 cm−1) [18] or borates (~1350 cm−1) [19], they are considered as great candidates for generating an efficient and long-lived luminescence of RE3+. Among fluorides, special attention should be paid to YF3 and LaF3 crystal phases characterized by wide band gap (>10 eV) and exceptionally low-phonon energies equal to ~358 as well as ~350 cm−1, respectively, in which M3+ (M = Y, La) cations from crystal lattices can be easily substituted by RE3+ ions without any charge compensation [20,21,22,23]. Due to the above reasons, the oxyfluoride glass-ceramic materials (GCs) containing fluoride nanocrystals are considered as an interesting class of advanced optical materials, which are frequently reported in the literature [24,25,26,27,28]. Indeed, they successfully combine the advantages of the individual fluoride crystal phase with good mechanical strength and thermal durability of oxide hosts [29,30]. It should also be noted that due to the compliance with the principles of green chemistry, the systematic elimination of PbF2 (characterized by exceptionally low-phonon energy equals to ~250 cm−1 [31]) during preparation is currently a very important aspect. Thus, taking the above considerations into account, Tb3+/Eu3+ co-doped oxyfluoride GCs containing selected fluoride phases (e.g., YF3 and LaF3) seems to be a good choice for the generation of efficient visible emissions.
The conventional melt-quenching method followed by controlled heat-treatment at specified time and temperature conditions is currently the most widely used technique for fabricating the class of oxyfluoride GCs [32,33,34,35,36]. On the other hand, the high melting temperatures of glass-forming components (e.g., 1450 °C, 1500 °C [37,38,39]) increase the risk of volatilization of the fluoride compounds, which may adversely affect the crystallization process of the fluoride fraction. Therefore, an alternative route to obtain oxyfluoride GCs is the sol-gel technique, characterized by low-temperature processing [40,41,42]. This method is based on hydrolysis, condensation and polycondensation reactions of organometallic precursors, usually alkoxysilanes Si(OR)4 (R = –CH3, –C2H5, etc.) in a liquid phase at room temperature [43]. The in-situ crystallization of fluoride phases is possible due to introduction of a fluorinating reagent into reaction system at initial stages, whose role is commonly played by trifluoroacetic acid (TFA) [44]. Since the sintering of sol-gel materials is carried out at significantly lower temperatures (usually <500 °C) than the conventional melt-quenching of glasses, a risk of volatilization of fluorides is adequately lower, meaning that sol-gel processing is preferred. Lower energy consumption also makes the sol-gel technique particularly advantageous and attractive from an environmental friendliness point of view. Simultaneously, to the best of our knowledge, the investigation of Tb3+/Eu3+ energy transfer process in oxyfluoride GCs is extremely rarely described in the available literature. In the literature, there is only one excellent description concentrated on YF3:Tb3+, Eu3+ nanocrystalline-based GCs fabricated from 44SiO2-28Al2O3-17NaF-(10 − x)YF3-TbF3−xEuF3 (x = 0, 0.1, 0.25, 1) glasses during their heat-treatment at 670 °C per 2 h, as far as we know [45]. Due to the above reasons, it seems to be justified to study the Tb3+ → Eu3+ energy transfer in sol-gel GCs containing MF3 (M = La or Y) nanocrystals.
In the present work, the sol-gel oxyfluoride GCs materials containing MF3:Tb3+, Eu3+ (M = Y, La) nanocrystals were successfully fabricated during controlled heat-treatment at low temperature (350 °C per 10 h) and characterized by detailed luminescence measurements. The studies were performed by means of excitation and emission spectra along with lifetime measurements. Based on photoluminescence results, the interactions between Tb3+ and Eu3+ dopant ions were systematically investigated and the incorporation of dopant ions into the fluoride environment was also analyzed.

2. Materials and Methods

The xerogels co-doped with Tb3+ and Eu3+ ions were synthesized using the low-temperature sol-gel method. All reagents used during the described procedure were taken from Aldrich Chemical Co. The sol-gel synthesis was started with the introduction of tetraethoxysilane (TEOS, 98%), ethyl alcohol (98%), deionized water (from Elix 3 system, Millipore, Molsheim, France) and acetic acid (99.5–99.9%) into round-bottom flasks. The molar ratio of components was equal to TEOS:C2H5OH:H2O:CH3COOH = 1:4:10:0.5 (90 wt.%). To perform hydrolysis and to initialize a condensation reaction, the components were stirred for 30 min. During the next step, the appropriate amounts of acetates, i.e., M(CH3COO)3 (M = Y, La; 99.9%) as well as Tb(CH3COO)3 (99.999%) and Eu(CH3COO)3 (99.999%) were weighed and dissolved in trifluoroacetic acid (TFA, 99%) and obtained mixtures were added into TEOS-based solutions. The molar ratio was equal to CF3COOH:M(CH3COO)3:Tb(CH3COO)3:Eu(CH3COO)3 = 5:1:0.05:0.05 (10 wt.%) (M = Y, La). The resultant solutions were mixed for another 60 min. After sol-gel synthesis, the obtained liquid sols were dried at 35 °C for 7 weeks to form colorless and transparent solid xerogels (denoted in the text as XGs). Their further transformation into glass-ceramic materials containing YF3 and LaF3 nanocrystals was realized by controlled heat-treatment in a muffle furnace (FCF 5 5SHP produced by Czylok, Jastrzębie-Zdrój, Poland) at 350 °C per 10 h (the temperature was raised by 10 °C/min from room temperature). After this procedure, the samples were slowly cooled down to room temperature (denoted in the text as SiO2-MF3, M = Y, La). The successful formation of fluoride nanocrystals (LaF3 NCs: P63/mmc, ICDD PDF-2 No. 08-0461; YF3 NCs: Pnma, ICDD PDF-2 No. 32-1431) was verified using X-ray diffraction (XRD, X’Pert Pro diffractometer, Panalytical, Almelo, The Netherlands) and the nanocrystals imaging was done via high-resolution transmission electron microscope (HR-TEM, JEOL JEM 3010, Tokyo, Japan). The results are shown in Figure 1. The average diameters of fabricated nanocrystals were estimated to 8.1 nm for LaF3 and 15.4 nm for YF3. The in-situ formation of LaF3 and YF3 nanocrystals during the thermal decomposition of La(CF3COO)3 as well as Y(CF3COO)3 in applied heat-treatment conditions (350 °C, 10 h) was confirmed and reported in details in our previous works [46,47].
The excitation and emission spectra as well as decay curves were recorded on Horiba Jobin Yvon FluoroMax-4 spectrofluorimeter (Horiba Jobin Yvon, Longjumeau, France) supplied with 150 W Xe lamp. The spectra were recorded with ± 0.1 nm resolution and the decay curves were recorded with ± 2 μs accuracy. All structural and luminescence measurements were carried out at room temperature.

3. Results and Discussion

3.1. Excitation Spectra of Fabricated Tb3+,Eu3+ Co-Doped Sol-Gel Materials

Figure 2 and Figure 3 present the photoluminescence excitation (PLE) spectra of fabricated Tb3+/Eu3+ co-doped xerogels. The PLE spectra were recorded in the spectral range from 340 to 520 nm and monitored at λem = 543 nm and λem = 612 nm emissions (the 5D47F5 green line of Tb3+ ions and the 5D07F2 red line of Eu3+, respectively). The recorded bands were attributed to the 4f8–4f8 and 4f6–4f6 intra-configurational transitions from both of optically active ions. The bands originating from Eu3+ were assigned to the following transitions: 7F05D4 (363 nm), 7F05GJ, 5L7 (from 372 nm to 389 nm), 7F05L6 (394 nm) and 7F05D2 (464 nm). Among the group of excitation bands originated from Tb3+ ions, the transitions were ascribed to the electronic transitions from the 7F6 ground level into the subsequent upper-lying states: 5L9 (352 nm), 5L10 (370 nm), 5D3 (378 nm) and 5D4 (488 nm).
The selection of excitation parameters for further emission measurements and to study the Tb3+ → Eu3+ energy transfer process was done from the near-UV (NUV) irradiation area (<400 nm) due to the greater intensity of recorded excitation lines than in visible light (VIS) scope (>400 nm). Indeed, the optical elements considered to be used in RGB-lighting devices should operate under NUV excitation. Since the 7F05L6 excitation band of Eu3+ is the most intense, we decided to perform the luminescence measurements for Eu3+ ions using λexc = 394 nm wavelength.
As the band associated to the 7F65L9 transition of Tb3+ ions does not coincide with any excitation peak of Eu3+, the choice of λexc = 352 nm wavelength as the excitation source for the generation of the Tb3+ → Eu3+ energy transfer seems to be reasonable. Additionally, in order to compare the luminescence behavior of sol-gel samples co-doped with Tb3+/Eu3+ ions with samples singly doped with Tb3+ ions, all photoluminescence measurements for Tb3+ ions were performed using the λexc = 352 nm excitation line.
It should be also noted that for prepared GC samples, the 7F05L6 excitation line was split into two separated components, the maxima of which were located at 394 and 397 nm (shown in inset of Figure 2 and Figure 3). Similar results were reported by A.C. Yanes et al. [48] for sol-gel glass-ceramics with 89.9SiO2-10LaF3:0.1EuF3 (mol %) composition. Based on numerous photoluminescence measurements (excitation and emission spectra recorded at different temperatures: room temperature (RT), 100 and 13 K; analysis of emission spectra under excitation at 393 and 396 nm), it was clearly proven that the two PLE components are strictly related to the distribution of Eu3+ between the SiO2 sol-gel host (393 nm component) and LaF3 nanocrystals (396 nm component). Thus, in the case of our studied sol-gel samples, we also assumed that the origin of such a split after the controlled heat-treatment of xerogels (XG-Y/Tb3+,Eu3+ and XG-La/Tb3+,Eu3+) is related to the partial migration of rare-earths from silicate sol-gel host into MF3 (M = Y, La) nanocrystals. It is quite interesting that deeper splitting of the 7F05L6 band was observed for SiO2-LaF3:Tb3+,Eu3+ GC and, in consequence, two strong components with maxima at 394 and 397 nm are visible. For the SiO2-YF3:Tb3+,Eu3+ GC sample, the 397 nm component is visible as a weak shoulder. This effect may suggest more efficient segregation of dopant ions in LaF3 than YF3 nanocrystals. Analogous results were reported earlier by us for singly doped SiO2-YF3:Eu3+ [46] and SiO2-LaF3:Eu3+ [47] GC sol-gel systems.

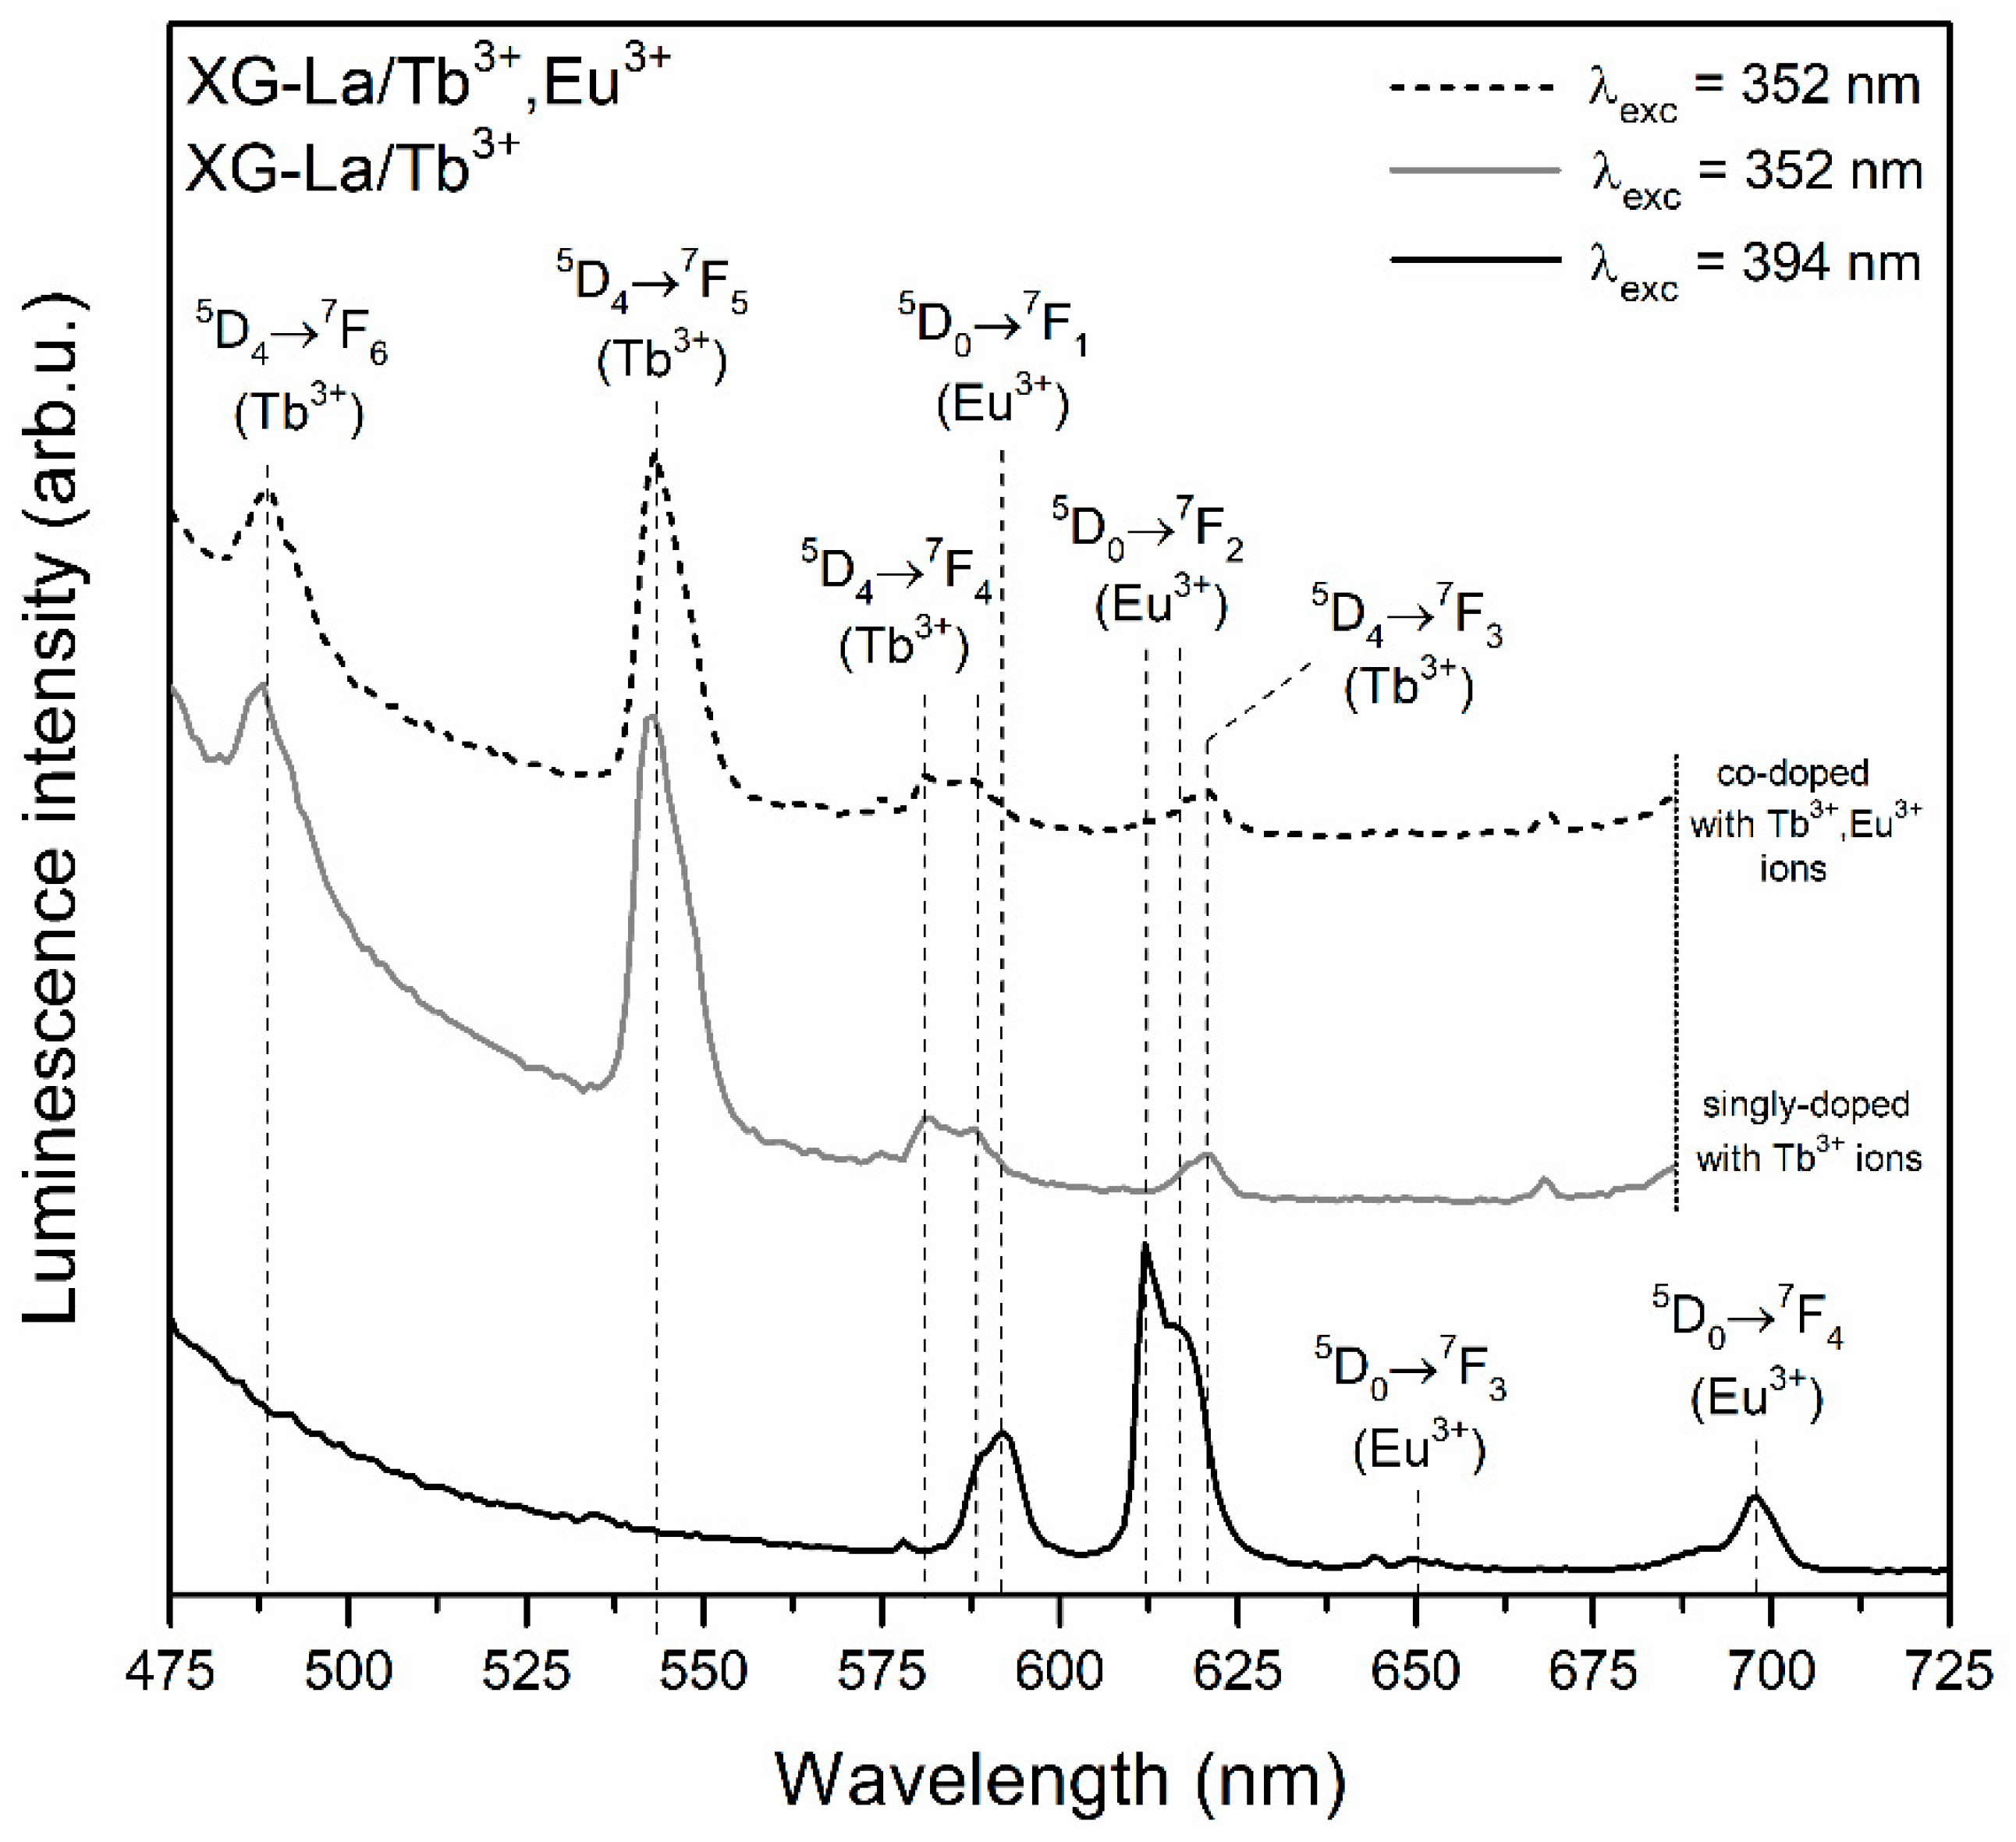
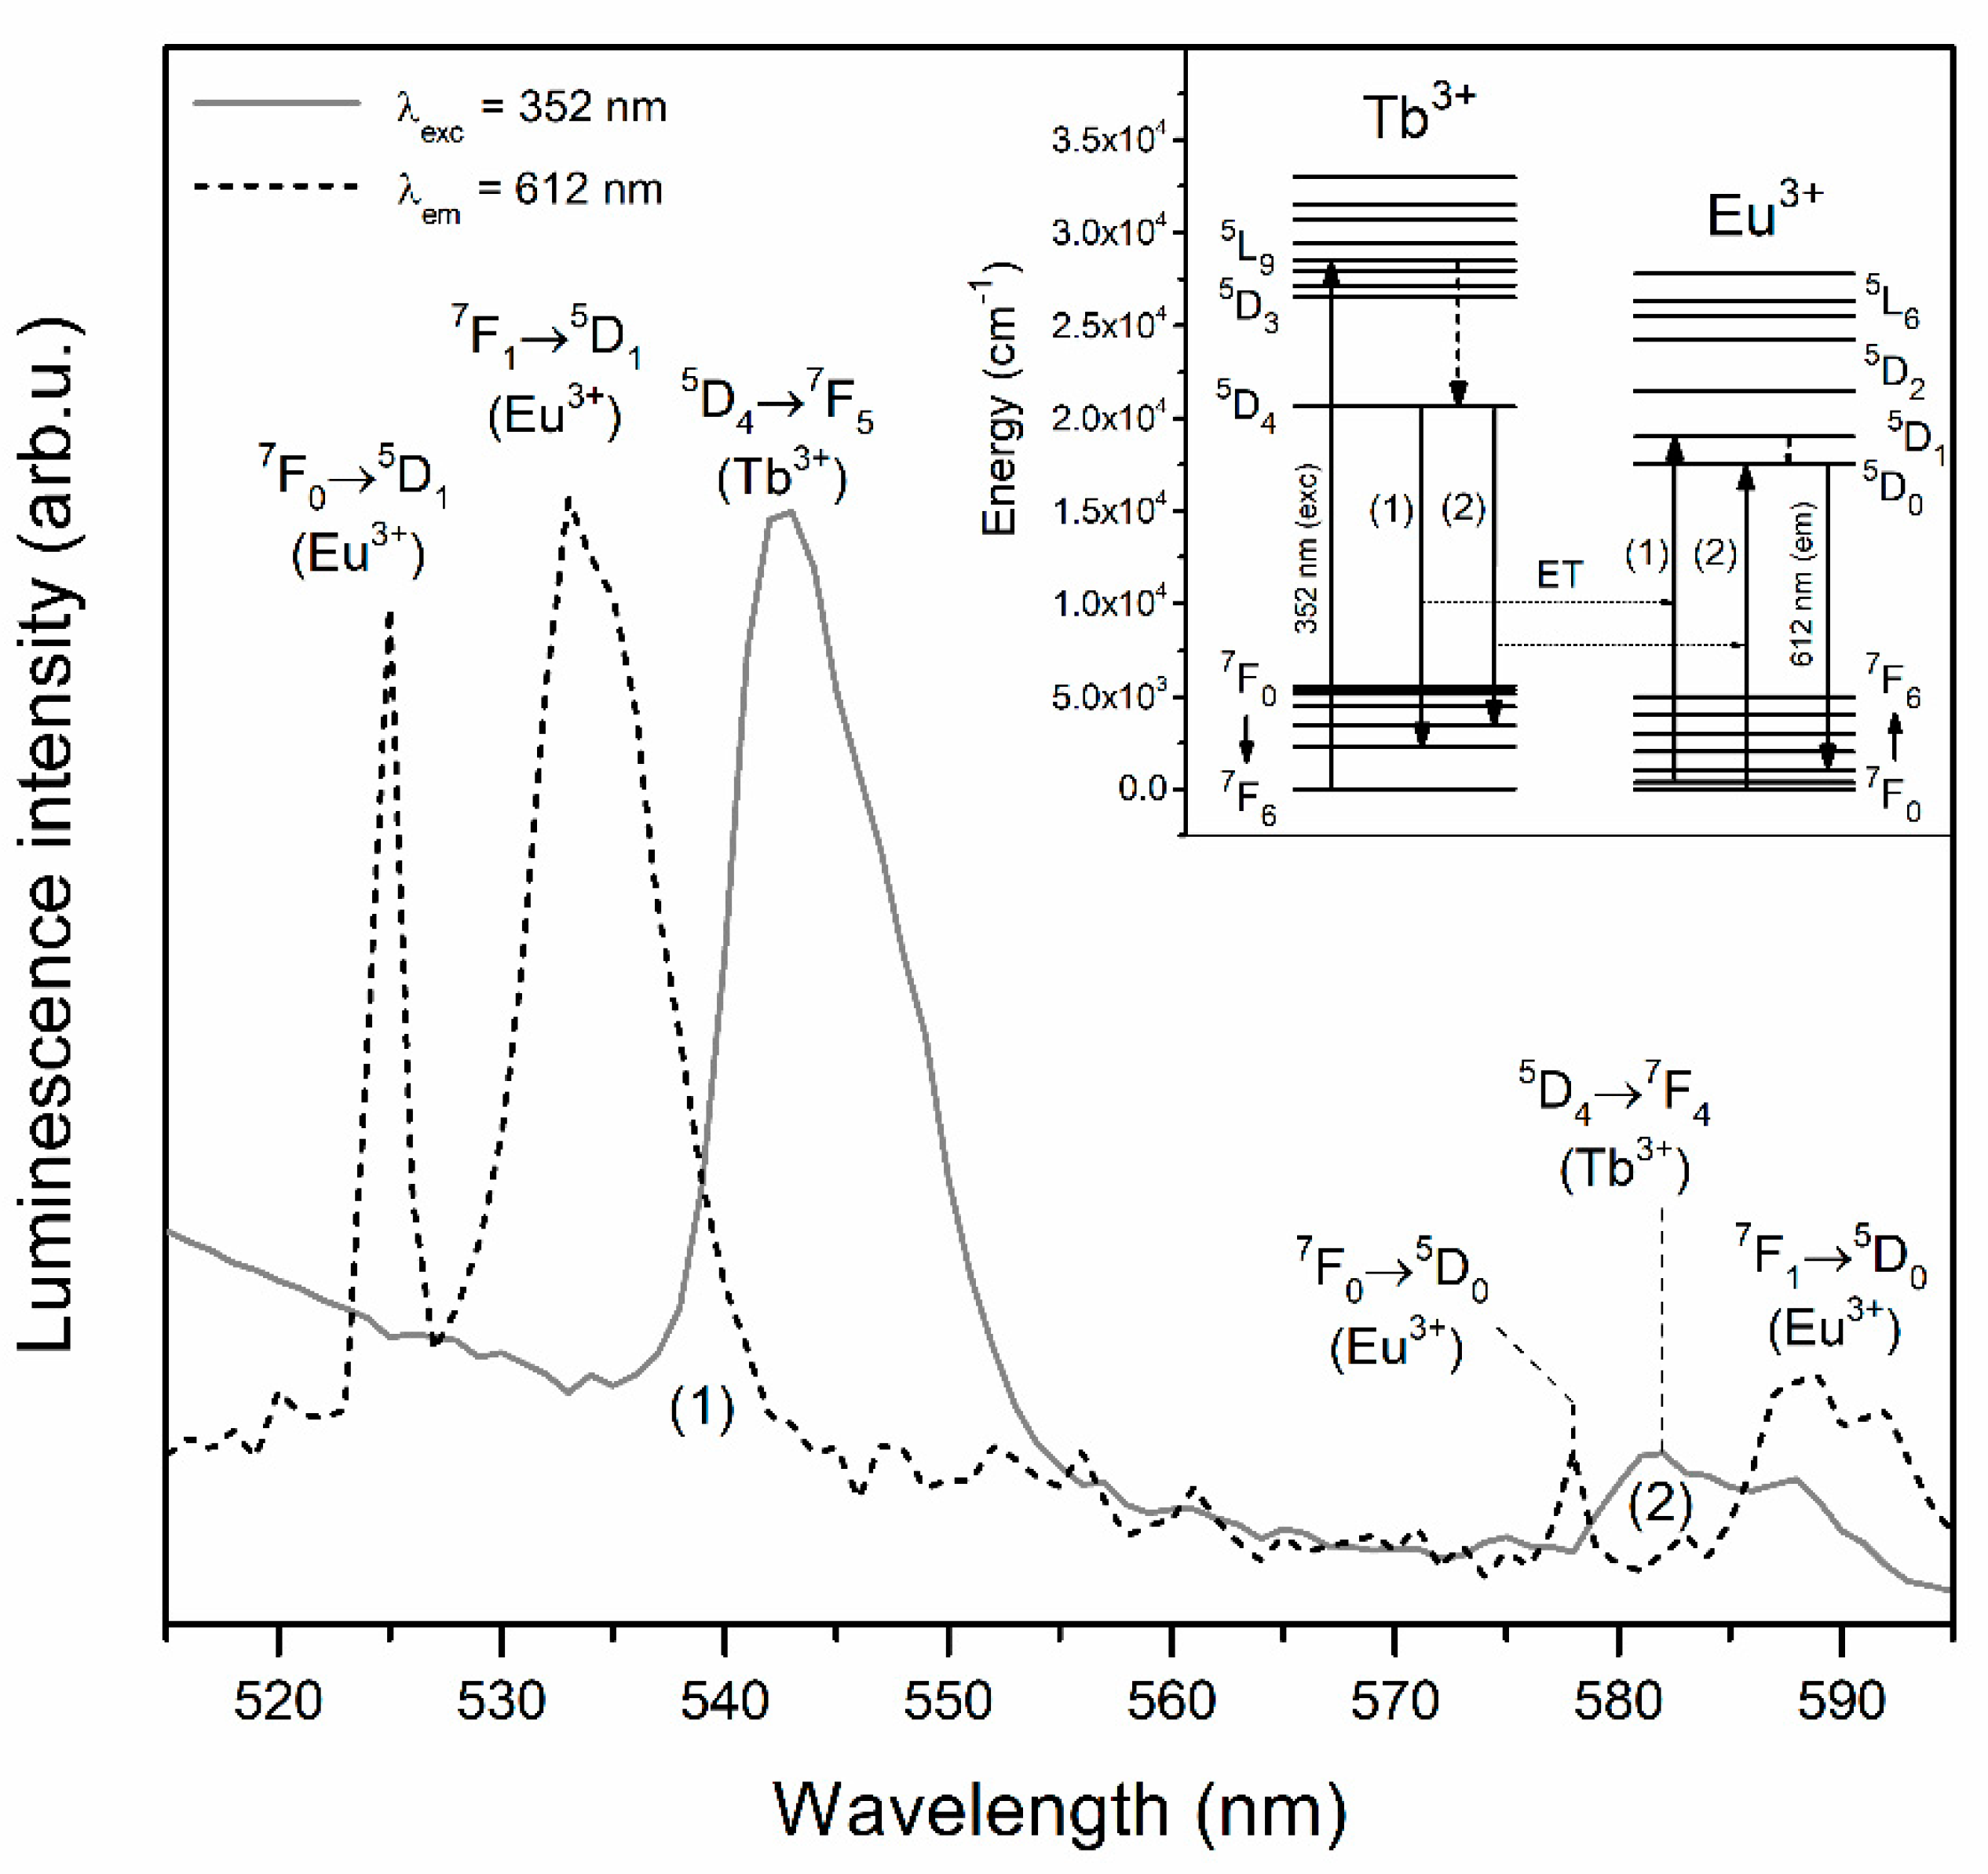
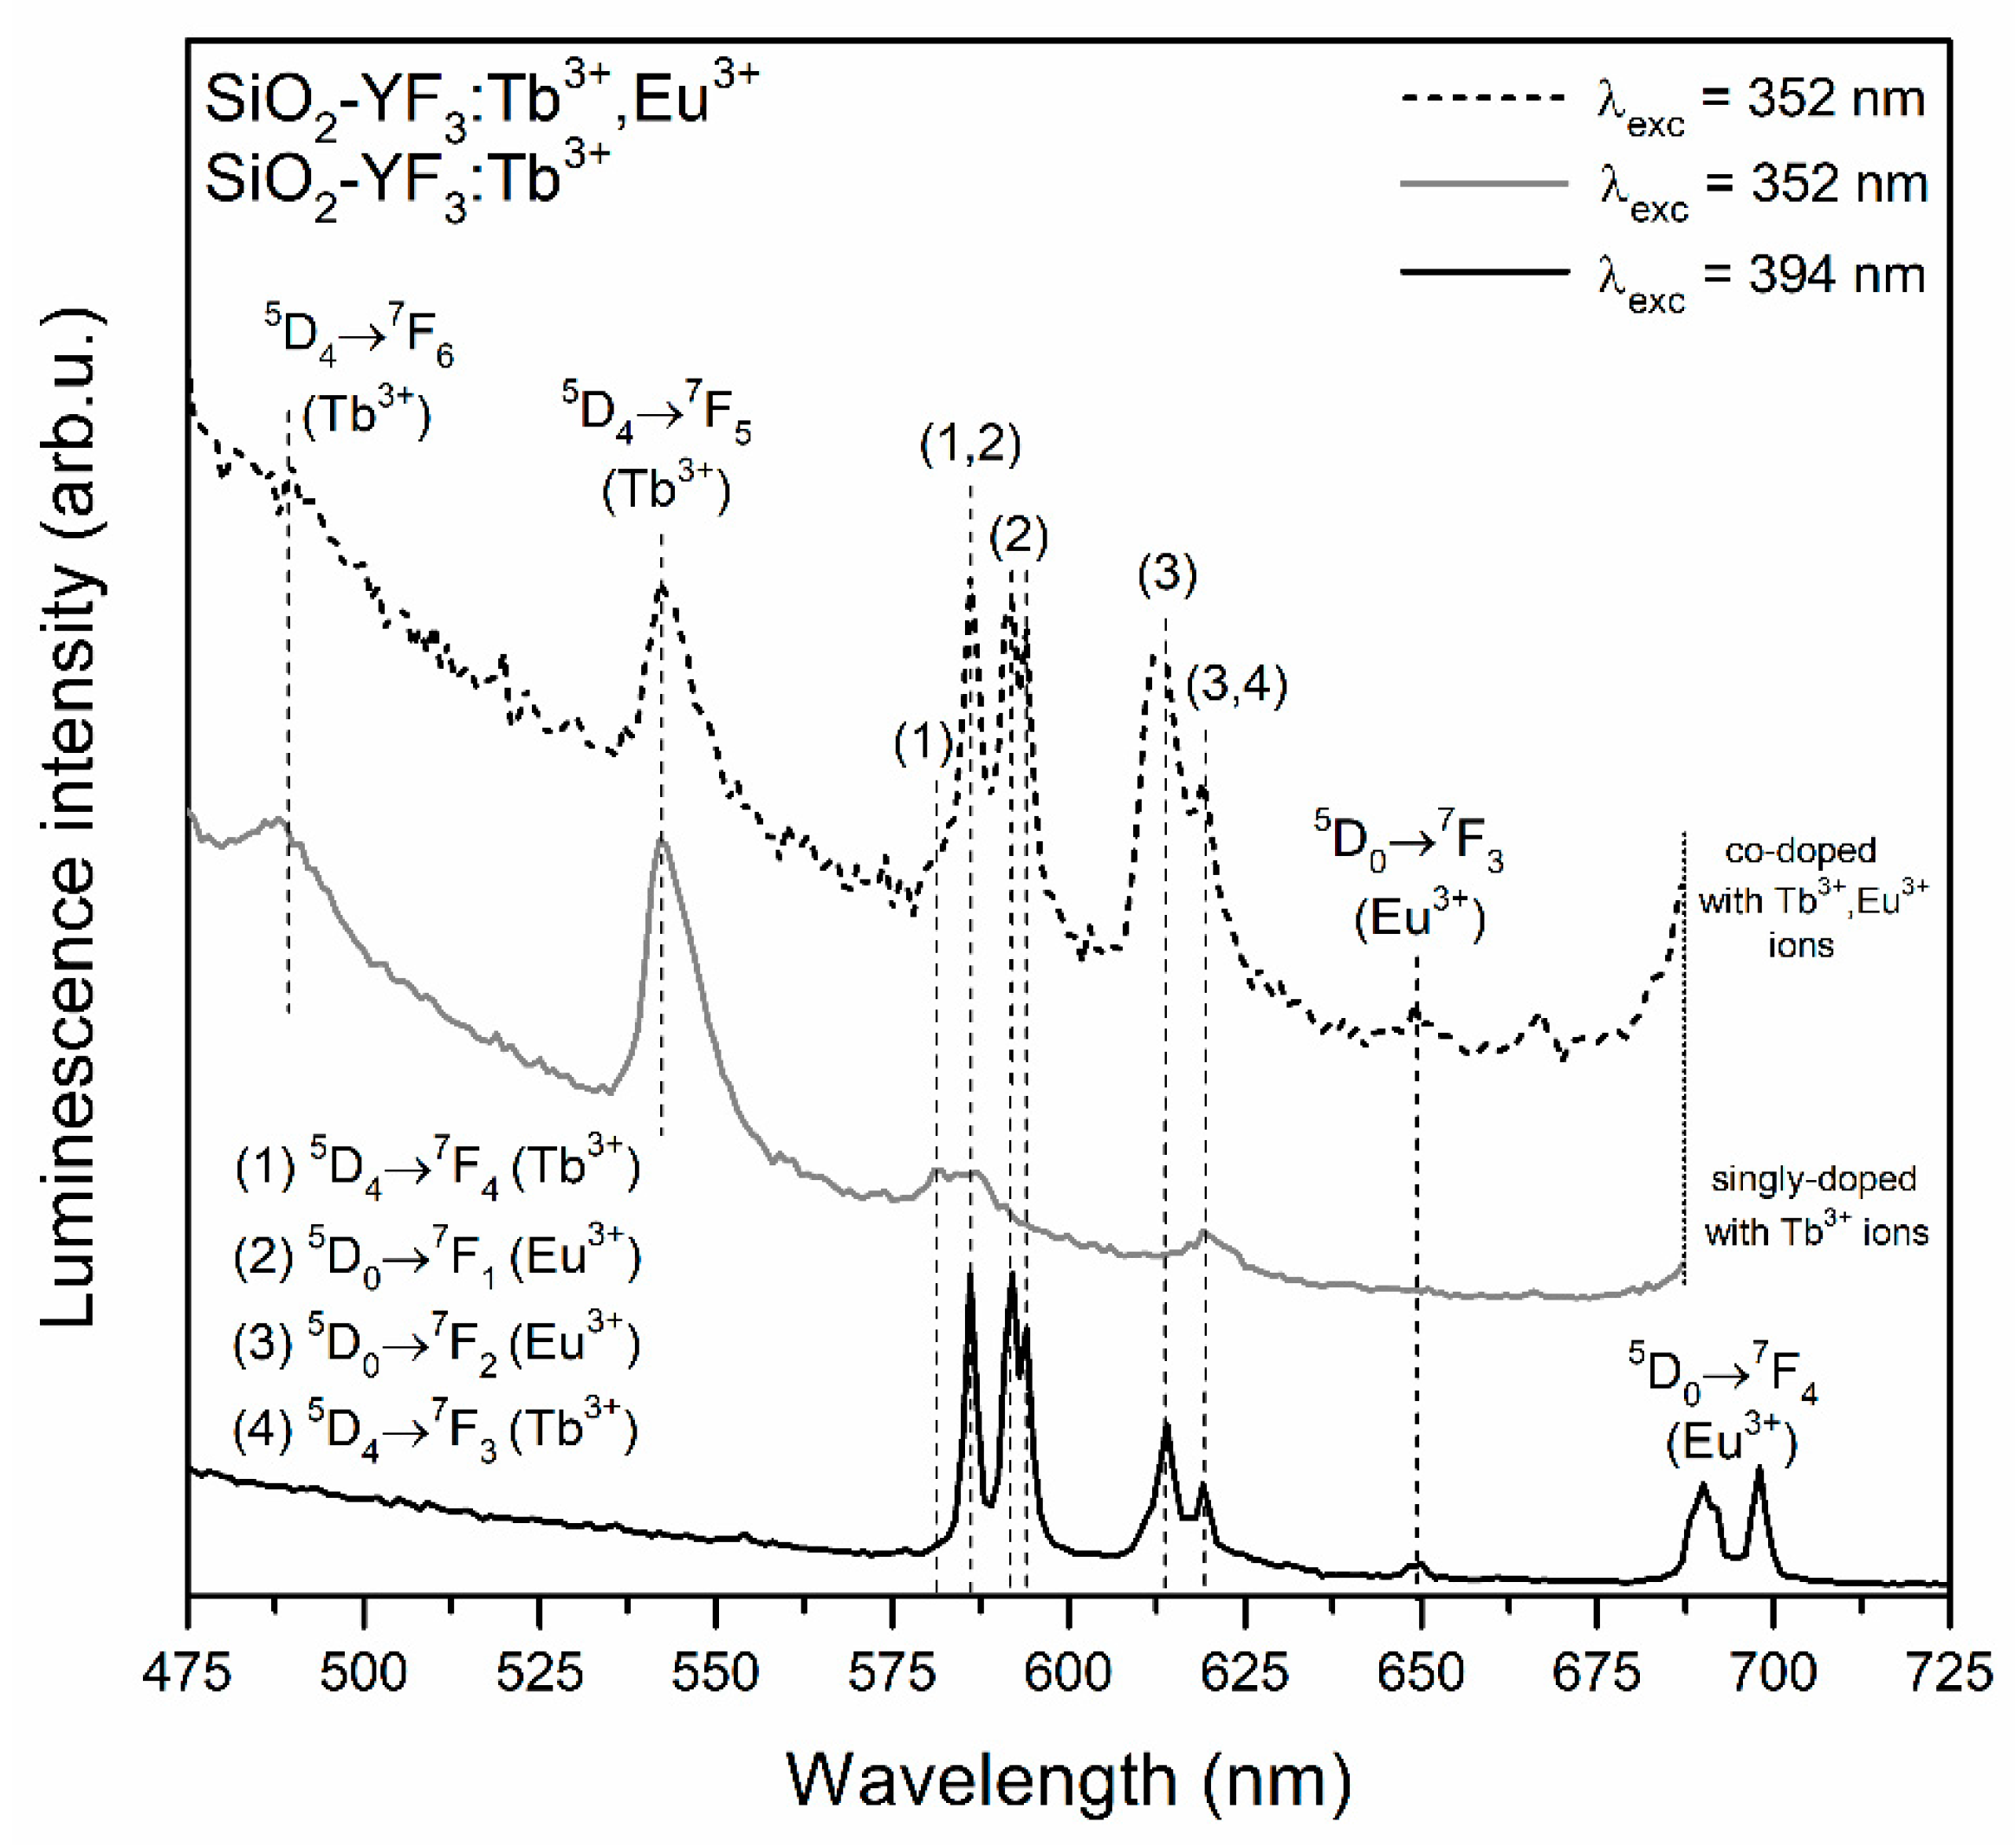
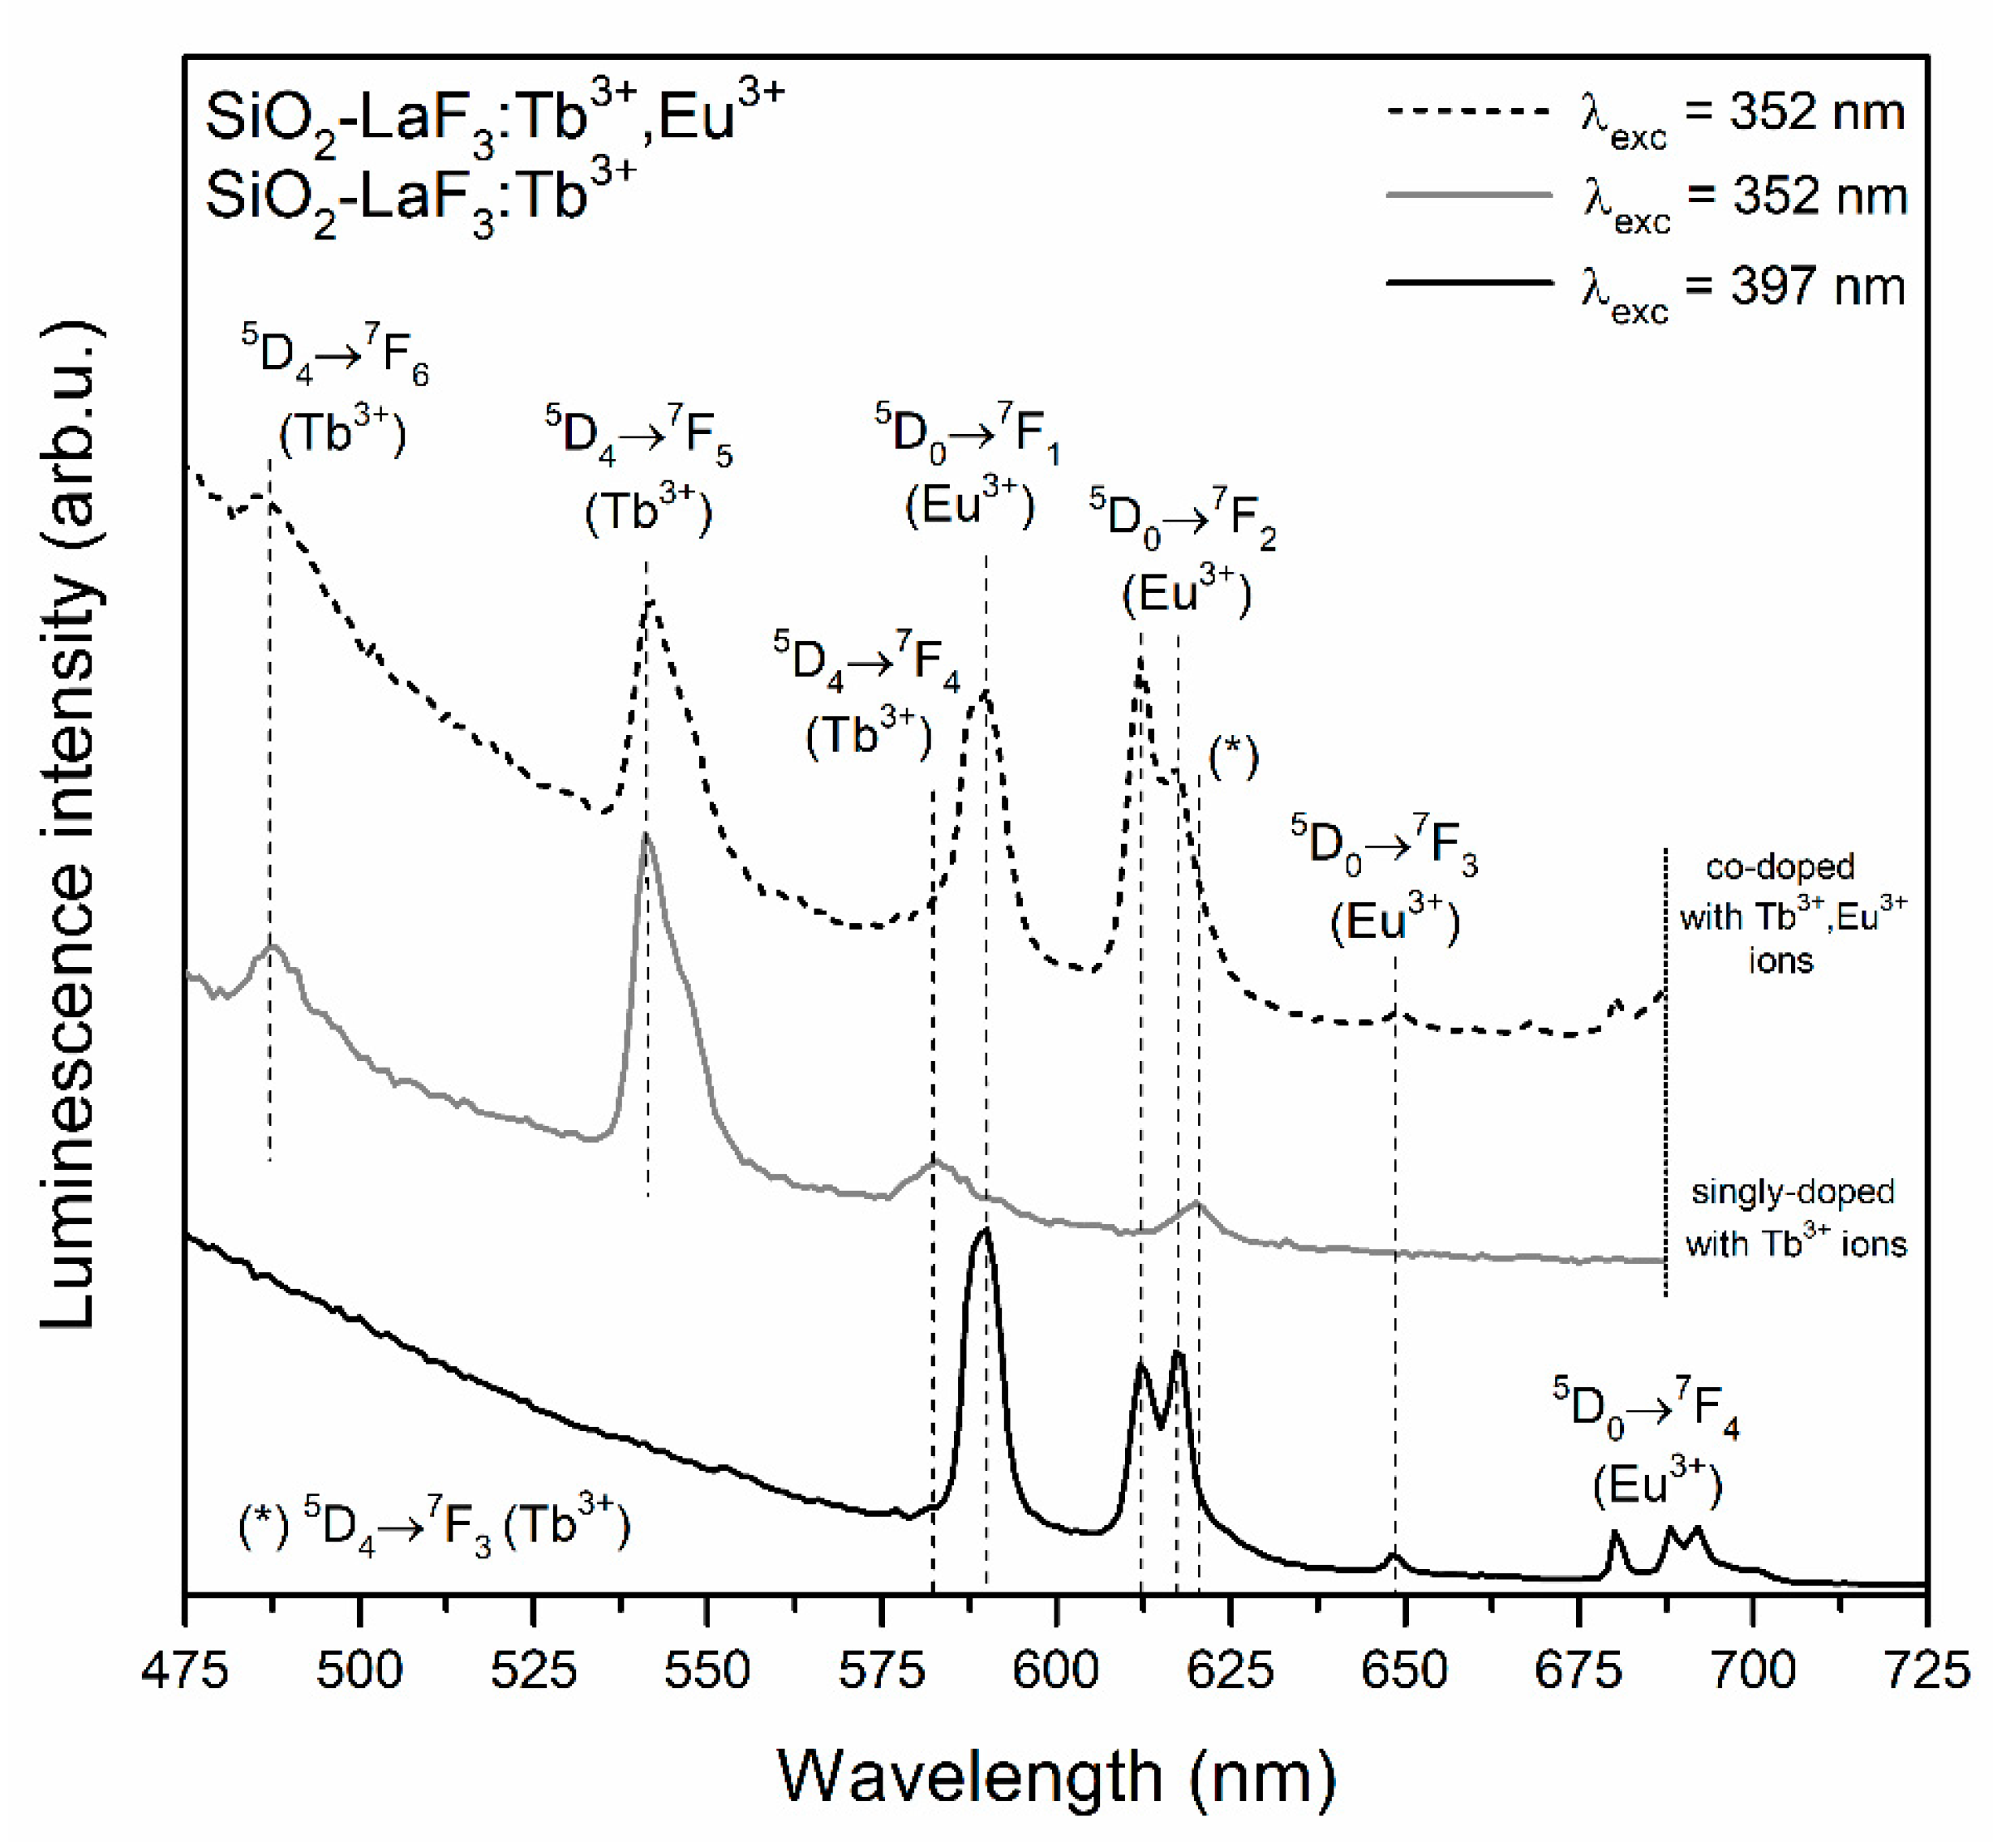
3.2. Influence of Controlled Heat-Treatment at 350 °C on Tb3+ → Eu3+ Energy Transfer

The photoluminescence (PL) spectra recorded for prepared silicate xerogels are illustrated in Figure 4 (XG-Y/Tb3+ and XG-Y/Tb3+,Eu3+) as well as in Figure 5 (XG-La/Tb3+ and XG-La/Tb3+,Eu3+). The excitation of Eu3+ ions using the λexc = 394 nm wavelength resulted in the appearance of luminescence bands located within the reddish-orange light area: 5D07F0 (578 nm), 5D07F1 (592 nm), 5D07F2 (611 nm), 5D07F3 (645 nm), and 5D07F4 (698 nm). Since the local framework around Eu3+ ions in sol-gel host is non-symmetric, the most intense emission line corresponds to the 5D07F2 electric-dipole transition and red-to-orange ratio (R/O) values for fabricated xerogels are relatively high (R/O = 3.01 for XG-Y/Tb3+,Eu3+; R/O = 2.78 for XG-La/Tb3+,Eu3+).
The PL spectra recorded upon excitation at λexc = 352 nm for xerogels singly doped with Tb3+ ions revealed two emission bands in the bluish-green spectral scope, i.e., 5D47F6 (488 nm) and the most prominent 5D47F5 (543 nm) line. Two another emission bands of Tb3+ ions were detected in the yellowish-red range: 5D47F4 (584 nm) and 5D47F3 (619 nm). The excitation of Tb3+/Eu3+ co-doped xerogels using λexc = 352 nm wavelength led to generating the characteristic emission lines of Tb3+ ions; however, it should be noted that some spectral broadening of the 5D47F4 as well as the 5D47F3 bands was observed. Such broadening is a consequence of the energy transfer process from Tb3+ to Eu3+, which resulted in the appearance of additional luminescence coming from Eu3+ dopant (5D07F1 and 5D07F2 transitions) [49,50,51,52]. In general, the spectral matching of donor’s emission (Tb3+) and acceptor’s excitation (Eu3+) regions is a fundamental condition for energy transfer occurrence. In this way, upon irradiation using λexc = 352 nm line from NUV spectral region, Tb3+ ions could be successfully pumped into the 5L9 level and then the non-radiative de-activation to the 5D4 state takes place. Since there is spectral overlapping between the 5D47F5,7F4 emissions of Tb3+and the 7F15D1 and the 7F0, 7F15D0 excitation bands of Eu3+, the energy could be successfully transferred from Tb3+ into Eu3+ ions as follows [53,54]:
5D4 (Tb3+) + 7F1 (Eu3+) → 7F5 (Tb3+) + 5D1 (Eu3+) (1),
5D4 (Tb3+) + (7F0, 7F1) (Eu3+) → 7F4 (Tb3+) + 5D0 (Eu3+) (2).
Hence, among the characteristic emission lines from Tb3+ ions, additional bands originated from Eu3+ can also be recorded. The matching of Tb3+ emission and Eu3+ excitation as well as illustration of energy levels involved in Tb3+ → Eu3+ energy transfer process are depicted in Figure 6.
The PL spectra recorded for glass-ceramic materials are shown in Figure 7 (SiO2-YF3:Tb3+ and SiO2-YF3:Tb3+,Eu3+) and Figure 8 (SiO2-LaF3:Tb3+ and SiO2-LaF3:Tb3+,Eu3+). For both types of prepared co-doped GC, a well-resolved Stark structure of recorded luminescence bands of Eu3+ ions was observed, which points to crystalline-like environment around them. For SiO2-YF3:Tb3+, Eu3+ GCs the following maxima are located at: 586/592/594 nm (5D07F1), 614 nm/619 nm (5D07F2), 650 nm (5D07F3) and 690/692/698 nm (5D07F4), while for SiO2-YF3:Tb3+, Eu3+ GCs, the maxima of individual emission bands were detected at the following wavelengths: 590 nm (5D07F1), 612 nm/618 nm (5D07F2), 649 nm (5D07F3) and 680/688/692 nm (5D07F4). Such clear splitting is a consequence of the partial segregation of Eu3+ ions inside fluoride crystal lattices. Indeed, when Eu3+ ions are inserted into the crystal lattice, the subsequent energy levels get split by the crystal-field effect and the number of sub-levels depends on the local site symmetry. It is reported in the literature that in YF3 and LaF3 crystal lattices, Eu3+ ions occupy Cs and C2v point symmetry sites, respectively [55,56]. If Eu3+ ions occupy Cs and C2v site symmetry, the J term of the 7FJ levels should split into three (J = 1), five (J = 2), seven (J = 3) and nine (J = 4) sub-levels [57]. However, observation of such strong splitting for glass-ceramic systems is quite difficult due to the partial distribution of Eu3+ ions within the amorphous sol-gel host. Moreover, compared to xerogels, a significant increase in intensity of the 5D07F1 magnetic-dipole transition band was observed, while the intensity of the 5D07F2 electric-dipole transition is strongly inhibited. Generally, the 5D07F1 magnetic-dipole transition is orbitally allowed and practically insensitive to symmetry in the local environment around Eu3+ ions. Conversely, the 5D07F0,2–4 electric-dipole transitions are forbidden in centrosymmetric sites due to the same parity of energy levels. However, if Eu3+ ions are located in non-centrosymmetric sites, the transitions became allowed as forced electric-dipole transitions due to the mixing of wavefunctions of 4f6 sublevels with different J values. Therefore, the ratio of integrated luminescence intensity of the 5D07F2 electric-dipole transition to the 5D07F1 magnetic-dipole transition can inform us about local symmetry around Eu3+ ions and is called the R/O ratio. A decrease in R/O-ratio value clearly suggests that local symmetry around Eu3+ ions is closer to an inversion center. The calculated R/O ratio values after controlled heat-treatment are relatively low (R/O = 0.42 for SiO2-YF3:Tb3+,Eu3+; R/O = 0.89 for SiO2-LaF3:Tb3+,Eu3+), which clearly points to the partial migration of Eu3+ ions from sol-gel host into more symmetric fluoride crystal phases.
For the prepared SiO2-MF3:Tb3+ GC samples, the characteristic emission bands corresponding to the transitions from the 5D4 excited level into the 7F6, 7F5, 7F4 and 7F3 lower-lying states were detected. In the case of SiO2-MF3:Tb3+,Eu3+ co-doped GCs, the mutual coincidence of the luminescence lines originating from both of the rare-earths was clearly observed after excitation at the λexc = 352 nm line. Therefore, an appearance of characteristic emission bands coming from Eu3+ ions upon excitation of Tb3+ confirms the occurrence of Tb3+ → Eu3+ energy transfer.
It should be particularly pointed out that the intensity of Tb3+ emission bands decreased, which was accompanied by the simultaneous enhancement of Eu3+ luminescence. Such an effect is much more observable for GC samples than for precursor xerogels. Hence, it could suggest that both of the optically active dopants were incorporated into the crystal lattices of the YF3 as well as LaF3 phases, causing there to be a shorter distance between neighboring Tb3+-Eu3+ pairs in comparison with the sol-gel host. Thus, the Tb3+ → Eu3+ seems to be more efficient in glass-ceramic materials, which results in a much more intense emission of Eu3+ ions.

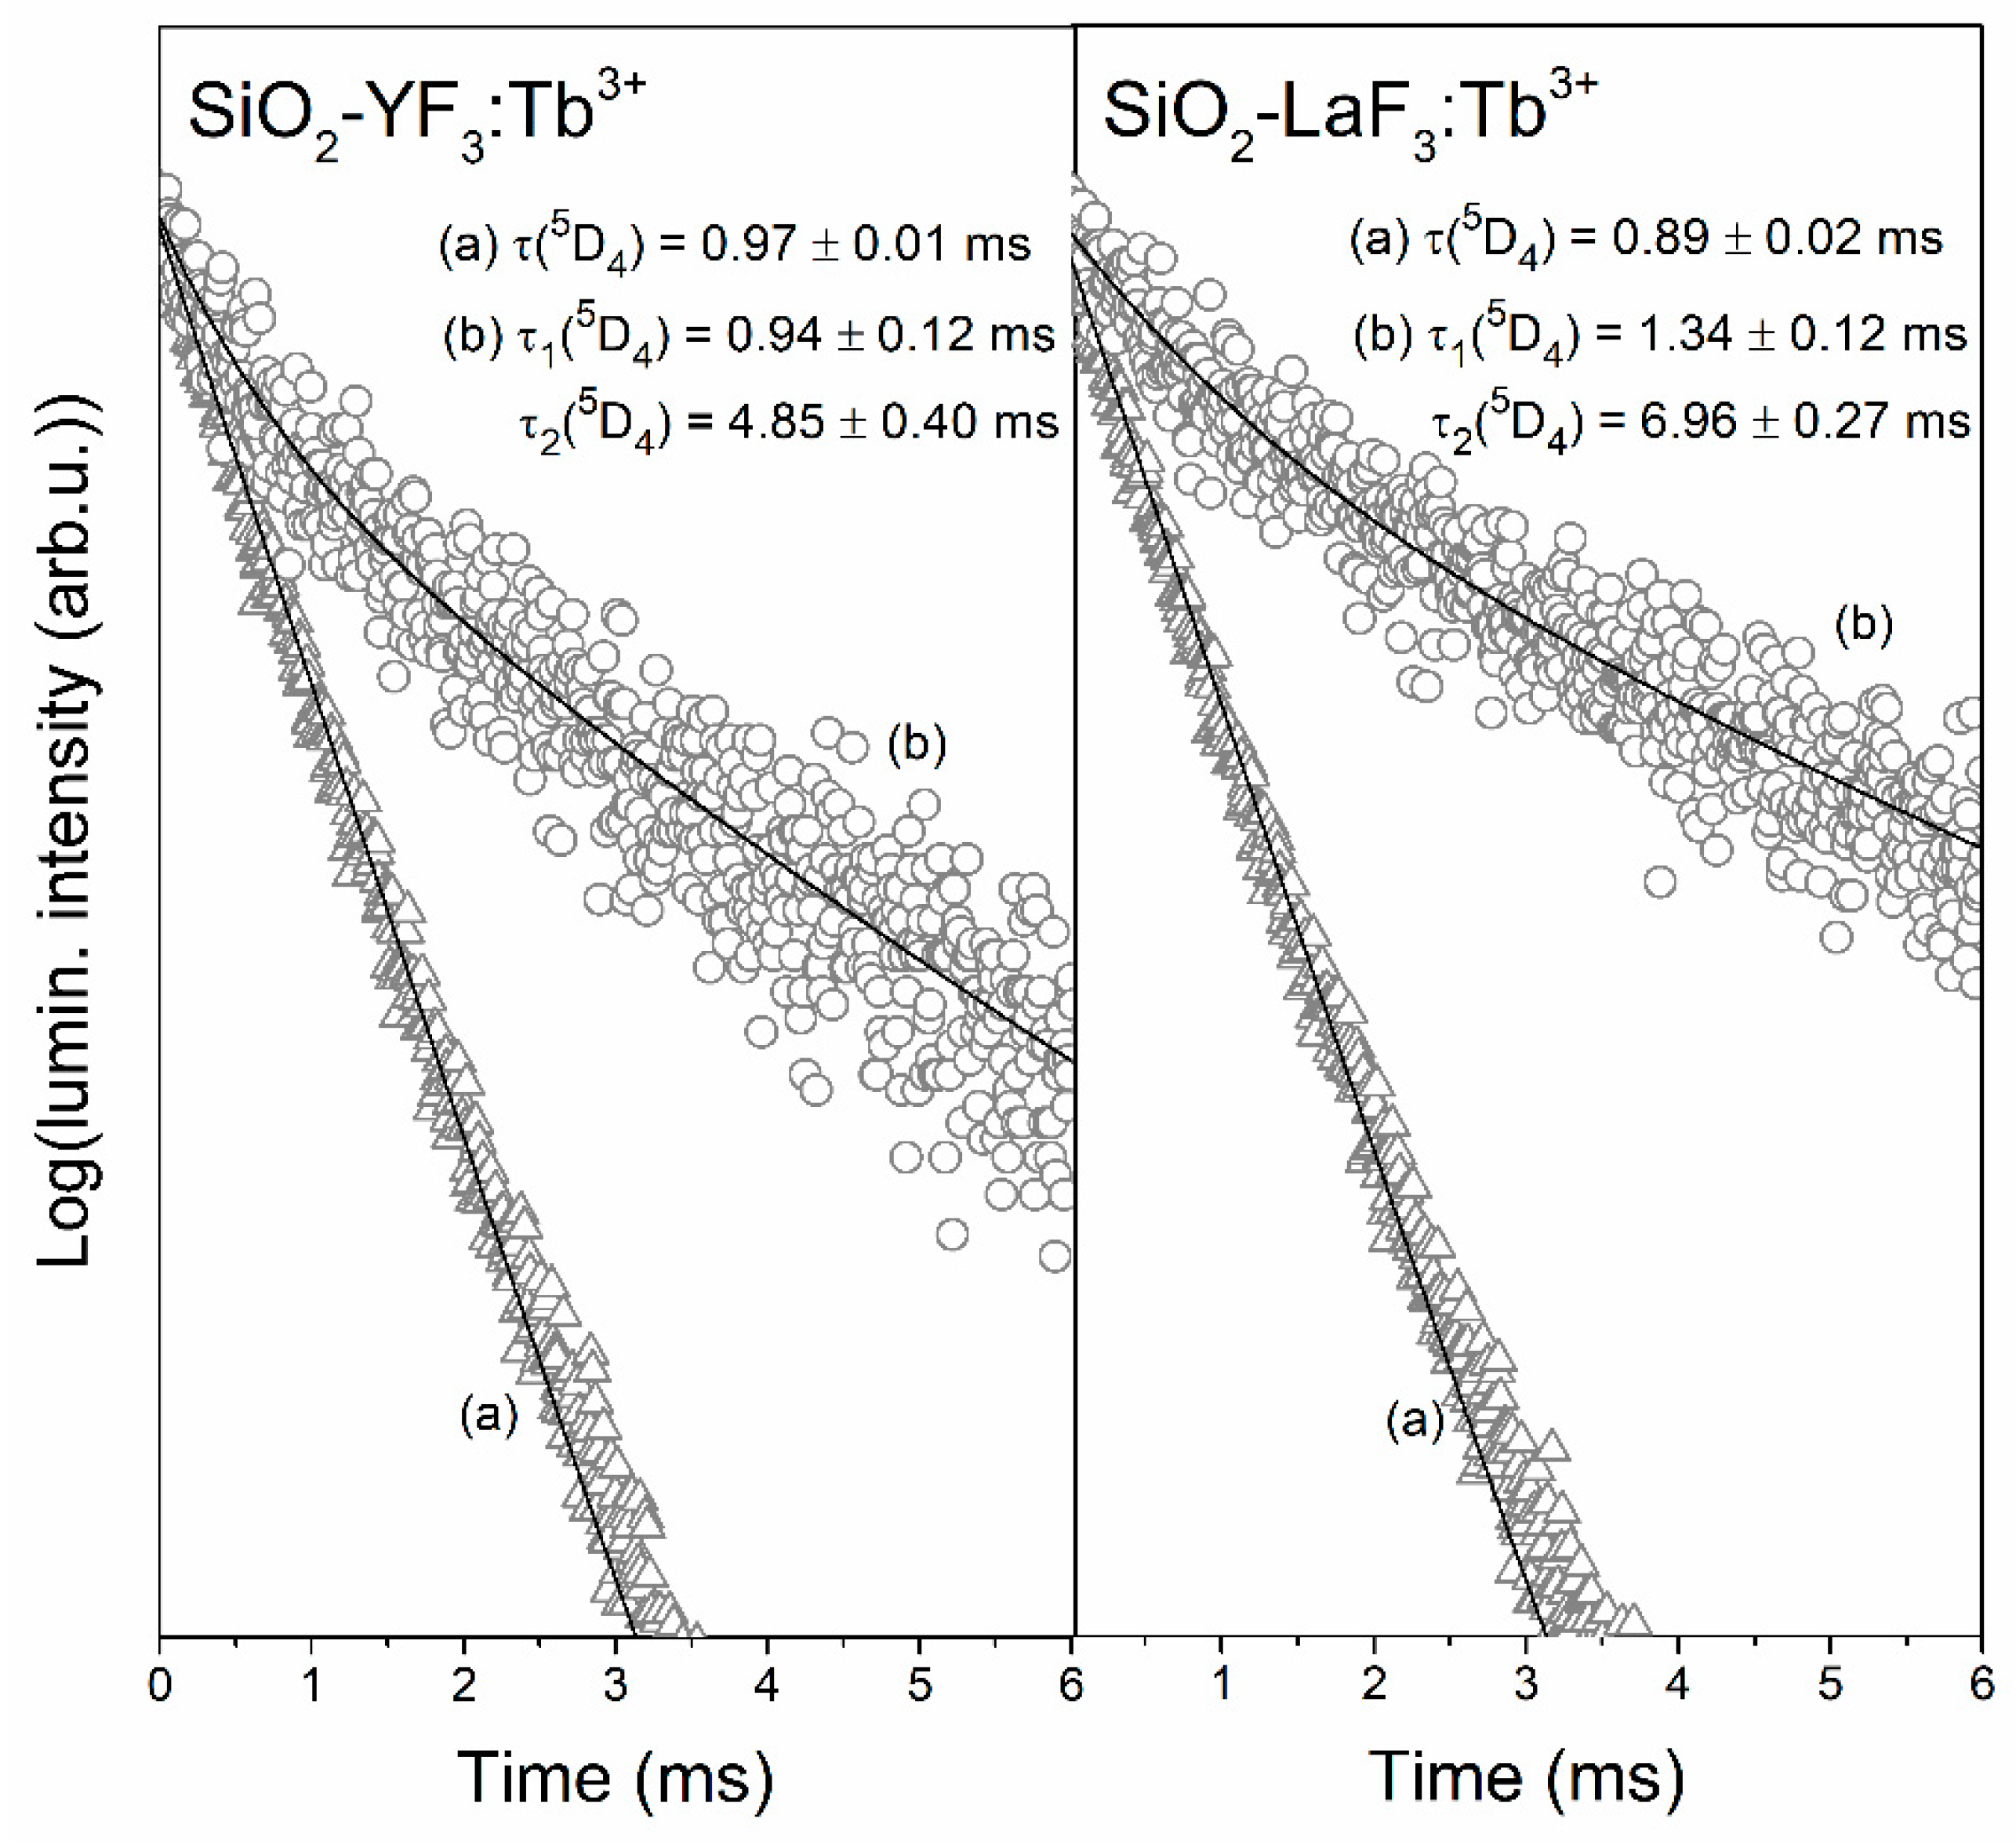
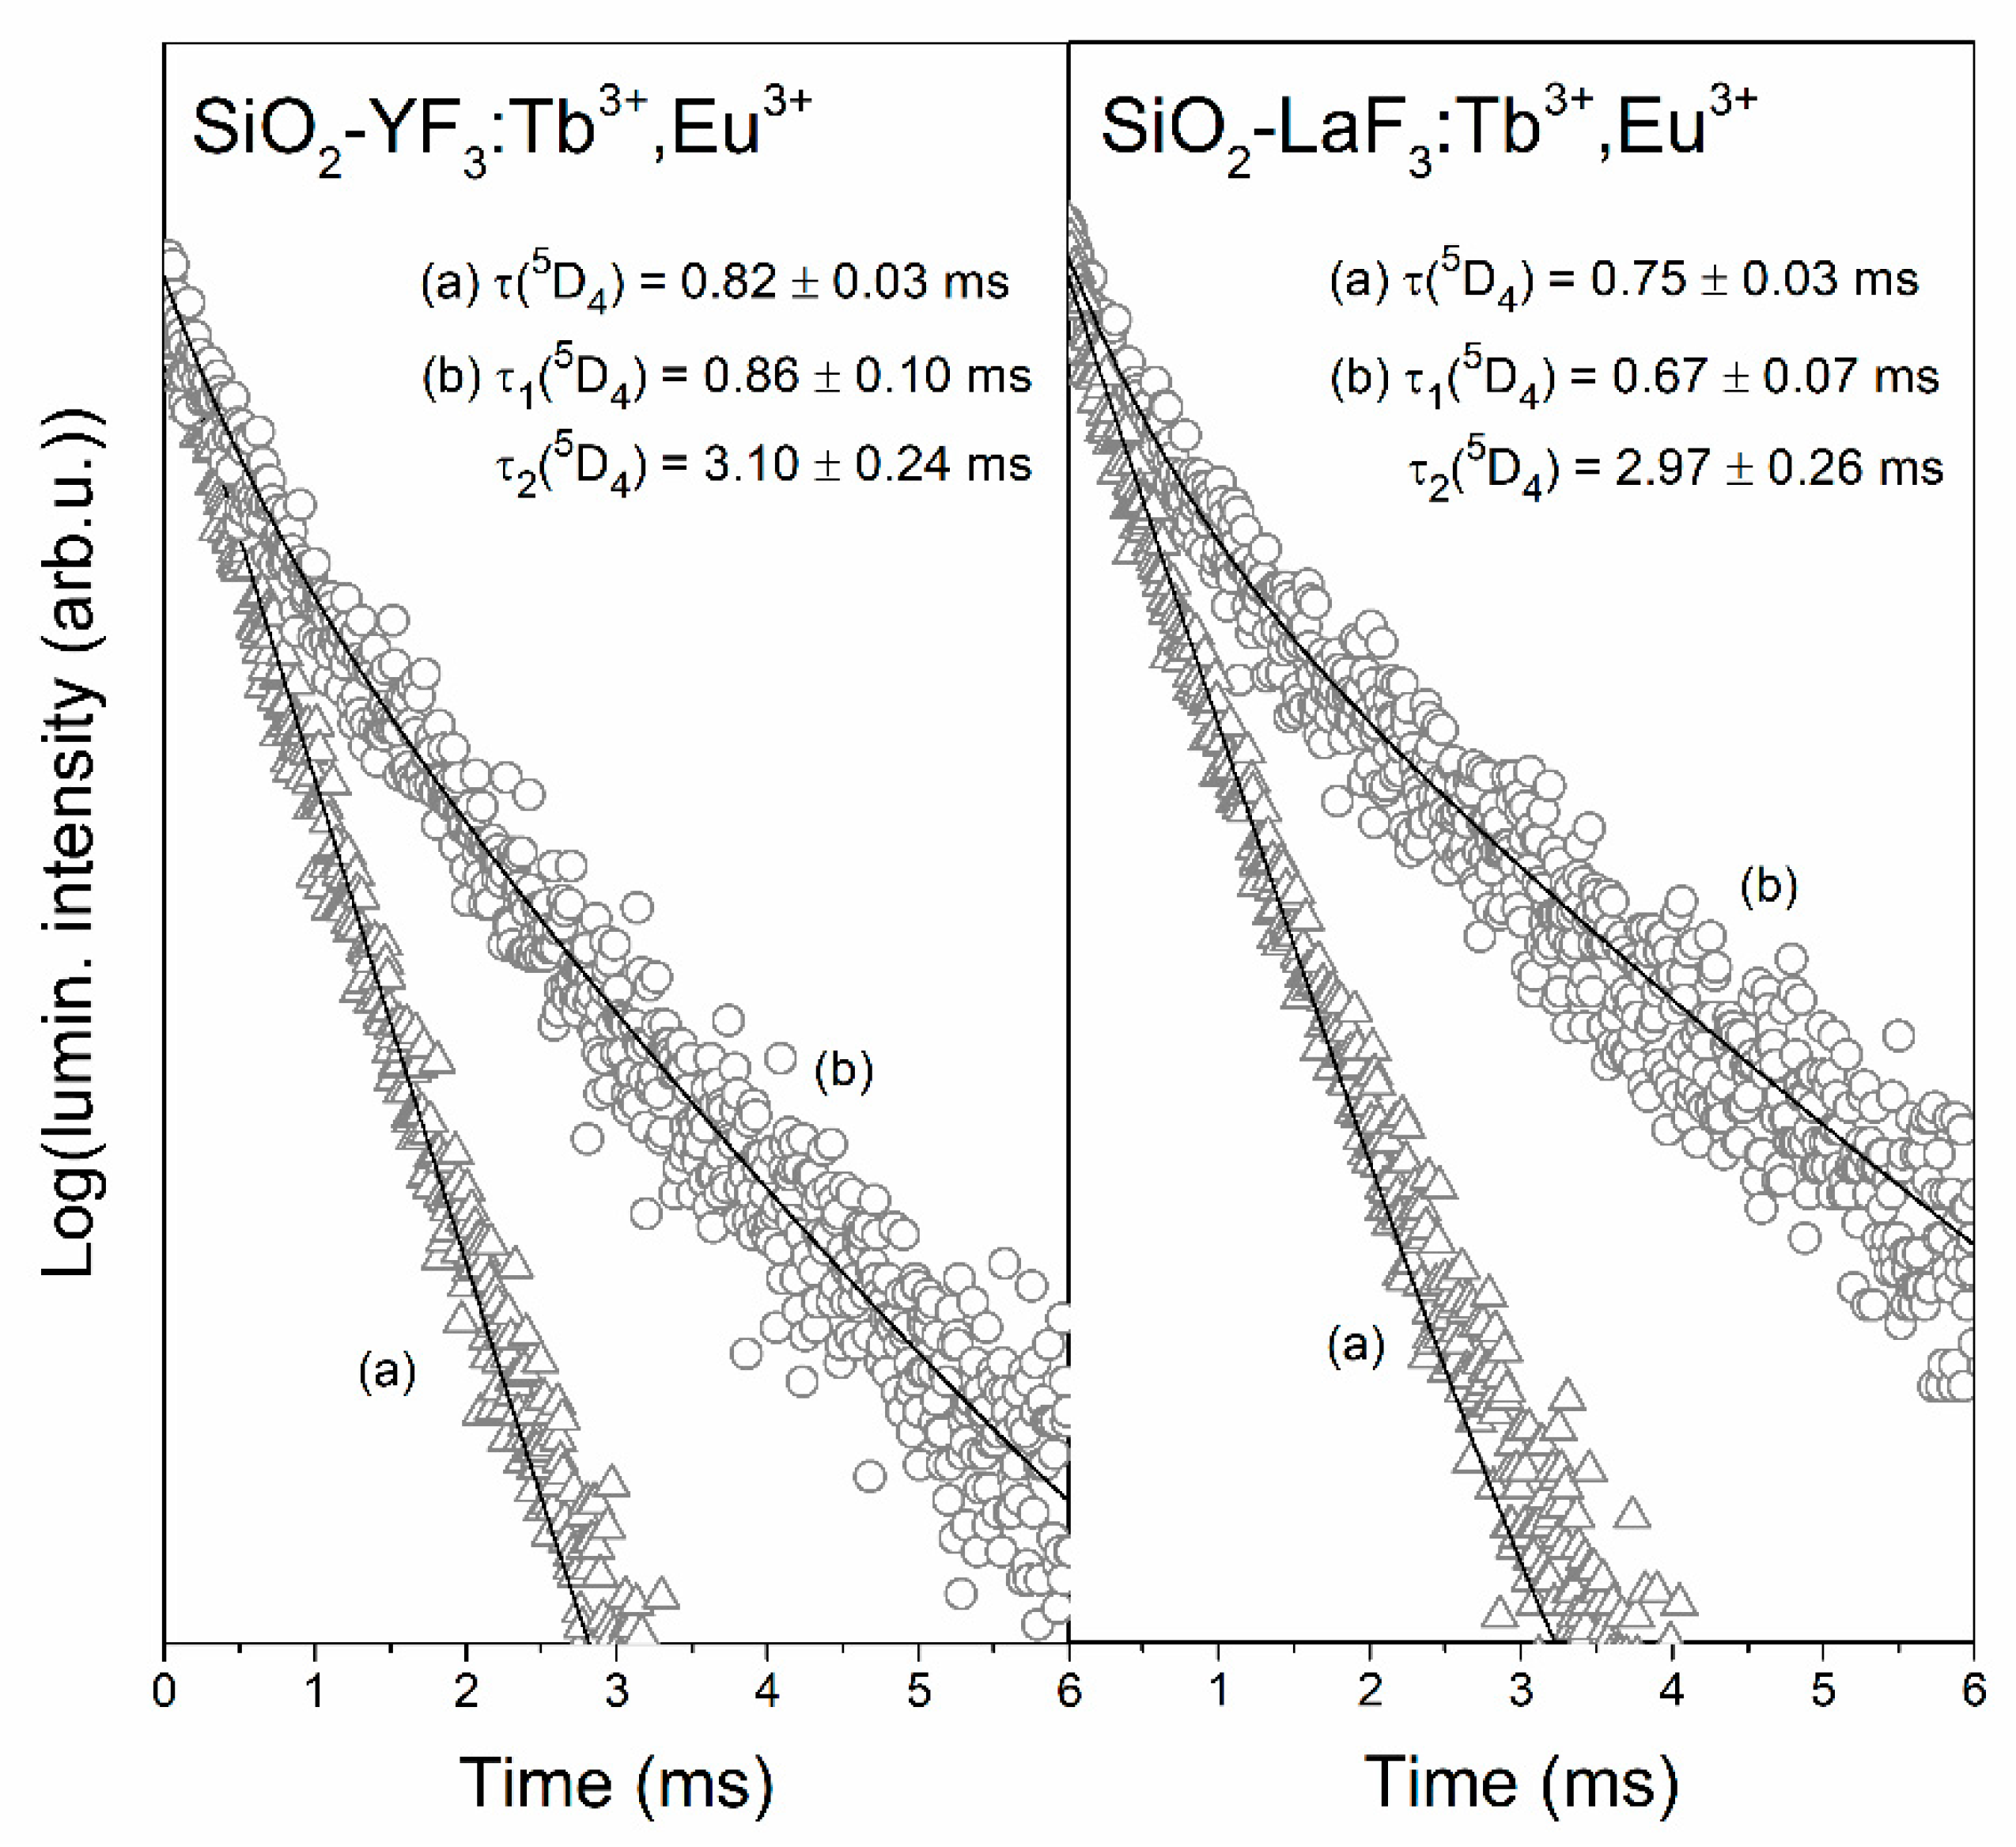
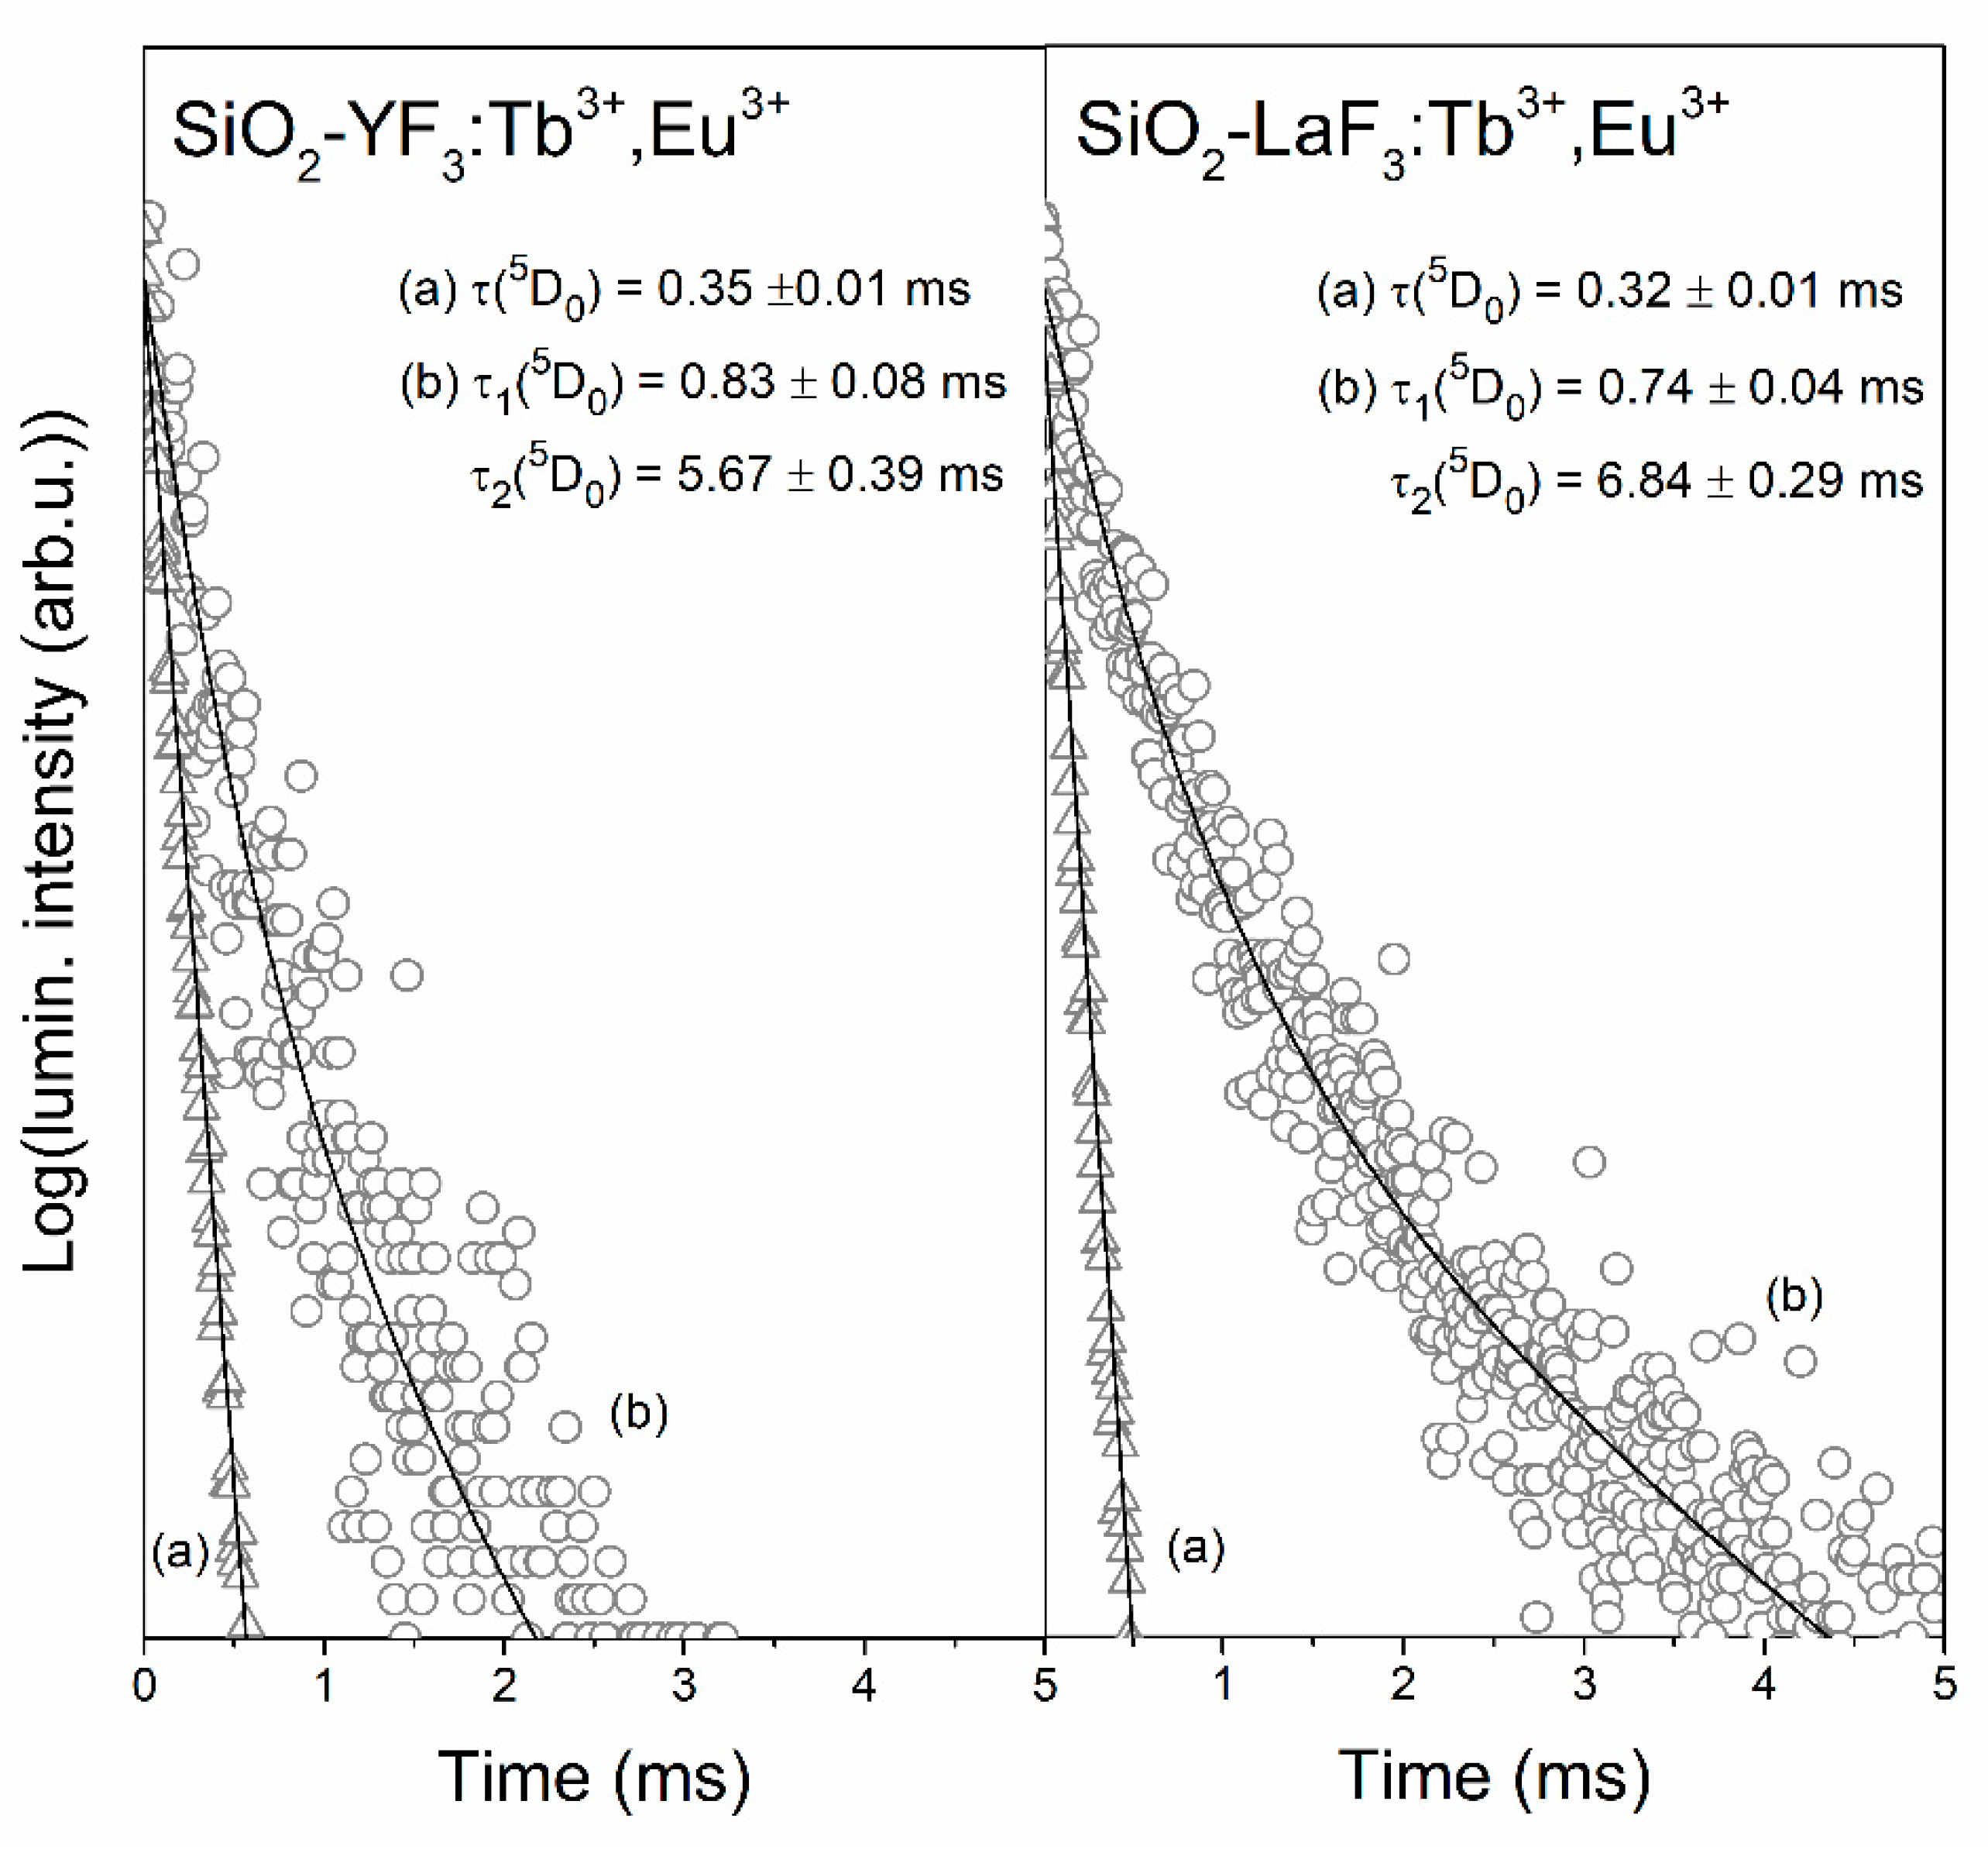
3.3. Luminescence Decay Analysis of the 5D4 (Tb3+) and the 5D0 (Eu3+) Levels in Sol-Gel Materials

To further optical examination of prepared xerogels and GC materials, the luminescence decay analysis of the 5D4 (Tb3+) and the 5D0 (Eu3+) excited states was performed. The analysis of decay profiles allows for the deeper characterization of the Tb3+ → Eu3+ energy transfer process and for establishing the relation between luminescence lifetimes and distribution of rare-earths within sol-gel materials.
Firstly, we compared the luminescence lifetimes of the 5D4 level of Tb3+ ions in singly doped sol-gel materials (Figure 9) and materials co-doped with Tb3+/Eu3+ ions (Figure 10). The decay curves were recorded upon NUV excitation (λexc = 352 nm) and monitoring a green emission related to the 5D47F5 transition of Tb3+em = 543 nm). For xerogels, the curves are well-fitted to mono-exponential functions given by:
I ( t ) / I 0 = A × exp ( t / τ ) ,
where τ corresponds to the luminescence decay time. It was observed that the τ (5D4) estimated for XG-Y/Tb3+ and XG-La/Tb3+ is quite comparable and equals 0.97 ± 0.01 and 0.89 ± 0.02 ms, respectively. Such negligible differences in luminescence lifetime values are caused by considerable similarity of chemical environment around Tb3+ in fabricated silicate xerogels. Indeed, the non-radiative relaxation between subsequent J states might occur due to the interaction of electronic levels of RE3+ ions with suitable vibrational modes in their nearest surrounding. As was proven earlier by infrared measurements, some liquids (residual solvents used during sol-gel process and products of homo- and heterocondensation reactions) are retained in xerogel pores [46]. In this way, Tb3+ and Eu3+ ions are coordinated by CF3COO anions (C=O groups: ~1650 cm−1, C–F bond: ~1200 cm−1) and OH groups (>3000 cm−1). According to energy gap law, an increase in the non-radiative decay rate is assisted by the decreasing number of phonons needed to cover the energy gap, ∆E. Since OH groups are characterized by higher vibrational energy than CF3COO anions, we assumed that OH groups with higher phonon energies play a major role in non-radiative relaxation from the 5D4 state. In this way, a maximum of five OH phonons are needed to cover the 5D47F0 energy gap of Tb3+ ions (∆E = 15,000 cm−1); therefore, the probability of non-radiative depopulation from the 5D4 state in xerogels is relatively high.
A comparison of luminescence lifetimes of the 5D4 state for xerogels singly doped with Tb3+ ions and co-doped with Tb3+/Eu3+ ions reveals a slight shortening when Tb3+ ions coexist with Eu3+ ions in the same host. Indeed, it was reported that there was a decrease from 0.97 ± 0.01 to 0.82 ± 0.03 ms for XG-Y/Tb3+,Eu3+ and from 0.89 ± 0.02 to 0.75 ± 0.03 ms for XG-La/Tb3+,Eu3. Therefore, such an effect is a clear evidence of Tb3+ → Eu3+ energy transfer occurrence. The energy transfer efficiency (ηET) between Tb3+ and Eu3+ ions could be expressed by the following Equation [54,58]:
η ET = ( 1 τ τ 0 ) × 100 %
where τ and τ0 correspond to intrinsic the decay lifetime of the 5D4 excited level of Tb3+ in the presence and absence of acceptor ions (Eu3+) in the host lattice, respectively. Indeed, the shortening of the donor’s lifetime when the acceptor coexists is a measure of its ability for energy transfer. The energy transfer efficiencies for prepared xerogels are depicted in Table 1. The calculated efficiencies of Tb3+ → Eu3+ energy transfer for both of co-doped xerogels are comparable and they are close to ηET ≈ 16%. The comparability in ηET values is a consequence of the chemical similarity of the nearest framework around rare-earths (Tb3+, Eu3+) in xerogels. Such relatively low efficiencies are correlated with the long interionic distances between Tb3+ and Eu3+ ions dispersed within silicate sol-gel host.
For glass-ceramic samples the recorded decay curves are well-fitted to double-exponential functions, which can be expressed by following Equation:
I ( t ) / I 0 = A 1 × exp ( t / τ 1 ) + A 2 × exp ( t / τ 2 ) ,
where τ1 is the decay time of a short lifetime component, τ2 is the decay time of a long component, while the A1 and A2 parameters are amplitudes at t = 0. The double-exponential character of the decay curves clearly means that Tb3+ ions are distributed between two different surroundings in which decay processes take place with variable rates. The first of them is a silicate sol-gel network in which the luminescence lifetimes of the 5D4 state of Tb3+ ions are shorter (τ1 decay component) due to presence of high-vibrational energy modes in their local framework (numerous Q3 units of SiO4 tetrahedrons (~1050 cm−1) and residual Si–OH groups (>3000 cm−1)). The second surrounding is according to fluorides, i.e., YF3 and LaF3 nanocrystals. Due to their low-phonon energies close to ~358 (YF3 phase) and ~350 cm−1 (LaF3 phase), the radiative relaxation from the 5D4 excited state is strongly promoted, and thus, the luminescence lifetimes are considerably prolonged (τ2 decay component). In other words, the change in decay profiles from mono-exponential functions (for xerogels) into double-exponential functions (for GCs) is evident proof, which allowed us to conclude that dopant ions are located either in a silicate sol-gel host or fluoride nanocrystals.
It is quite interesting that the τ2(5D4) component for SiO2-LaF3:Tb3+ GC is longer (6.96 ± 0.27 ms) compared with the τ2(5D4) component for SiO2-YF3:Tb3+ GC (4.85 ± 0.40 ms). Since the phonon energies of YF3 and LaF3 fluoride phases are almost the same, we assumed that such difference in τ2 lifetime values may suggest that the migration of Tb3+ ions from silicate sol-gel host into LaF3 phase could be more efficient than into YF3 nanocrystals. It should be also pointed out that co-doping with Eu3+ ions lead to the considerable shortening of τ2(5D4) components due to occurrence of Tb3+ → Eu3+ ET process (3.10 ± 0.24 ms for SiO2-YF3:Tb3+,Eu3+ GC and 2.97 ± 0.26 ms for SiO2-LaF3:Tb3+,Eu3+ GC). To estimate the energy transfer efficiencies, we used the average luminescence lifetimes of the 5D4 state for glass-ceramic materials singly doped with Tb3+ and co-doped with Tb3+/Eu3+ ions calculated from the following Equation [59]:
τ avg = A 1 τ 1 2 + A 2 τ 2 2 A 1 τ 1 + A 2 τ 2  
where A1 and A2 are fitting constants, and τ1 and τ2 are short and long decay components, respectively.
To determine the percentage contribution of short- (τ1) and long-lived (τ2) components involved in the total decay process, the following equations were used:
% , τ 1 = A 1 A 1 + A 2 × 100 % ,  
% , τ 2 = A 2 A 1 + A 2 × 100 % .
For both SiO2-YF3:Tb3+ as well as SiO2-YF3:Tb3+,Eu3+ GCs, the percentage contributions of τ1 and τ2 are quite comparable and equal nearly 50%. A slightly different observation was attained for GCs containing LaF3 nanocrystals. The difference in contribution of τ1 and τ2 decay components is slightly more visible for GCs containing LaF3 nanocrystals. For the sample singly doped with Tb3+ ions, the contribution of the τ2 component is slightly larger (56.42%) than that of the τ1 component (43.58%); meanwhile, co-doping with Eu3+ ions results in an increase in the τ1 component’s contribution (57.16%) and slight decrease in τ2 contribution (42.84%). The luminescence lifetimes of the 5D4 state of Tb3+ ions, their percentage contribution (%, τn(5D4)), average lifetimes (τavg) and the Tb3+ → Eu3+ ET efficiencies (ηET) for fabricated GCs are depicted in Table 2.
It was observed that the average luminescence lifetime for SiO2-LaF3:Tb3+,Eu3+ GC (τavg(5D4) = 2.44 ms) is 2.6-fold shorter than for SiO2-LaF3:Tb3+ GC (τavg(5D4) = 6.23 ms), while for SiO2-YF3:Tb3+,Eu3+ GC (τavg(5D4) = 2.62 ms), it is 1.6-fold shorter than for SiO2-YF3:Tb3+ GC (τavg(5D4) = 4.18 ms). The greater shortening of τavg(5D4) luminescence lifetime for SiO2-LaF3:Tb3+,Eu3+ GC than for SiO2-YF3:Tb3+,Eu3+ GC indicates a more efficient Tb3+ → Eu3+ energy transfer. Indeed, the calculated ET efficiency value for SiO2-LaF3:Tb3+,Eu3+ET = 60.8%) is about 1.6-fold higher than for SiO2-YF3:Tb3+,Eu3+ET = 37.3%). It should also be noted that the transformation from xerogels into glass-ceramic materials during controlled heat-treatment strongly determines the Tb3+ → Eu3+ energy transfer efficiency, ηET, which increased from ~16% (xerogels) up to 37.3% (SiO2-YF3:Tb3+,Eu3+ GCs) and 60.8% (SiO2-LaF3:Tb3+,Eu3+ GCs).
The luminescence decay curves of the 5D0 state of Eu3+ ions in xerogels and SiO2-YF3:Tb3+,Eu3+ as well as SiO2-LaF3: Tb3+,Eu3+ glass-ceramics were recorded for λem = 611 nm (Figure 11). Similarly, as in the case of decay curves recorded for the 5D4 state of Tb3+ ions, the curves of the 5D0 level are well-fitted to mono-exponential functions for xerogels and to double-exponential functions for GCs. Relatively short luminescence lifetimes for xerogels are caused by the coordination of Eu3+ ions by high-vibrational OH groups, which are involved in the non-radiative depopulation of the 5D0 level (only four phonons are needed to cover energy gap, ∆E = 12,500 cm−1). Since controlled heat-treatment of xerogels resulted in the partial migration of Eu3+ ions inside fluoride nanocrystals, we distinguished two significantly different luminescence lifetimes (τ1, τ2). From the decays, it could be concluded that there is a clear correlation between the designated luminescence lifetimes and energy transfer efficiencies (ηET) related to the relative distribution of rare-earths between silicate sol-gel host and fluoride environment. The higher energy transfer efficiency for SiO2-LaF3:Tb3+,Eu3+ET = 60.8%) results in longer decay components (τ1(5D0) = 0.74 ± 0.04 ms, τ2(5D0) = 6.84 ± 0.29 ms) than for SiO2-YF3:Tb3+,Eu3+1(5D0) = 0.83 ± 0.08 ms, τ2(5D0) = 5.67 ± 0.39 ms) with lower Tb3+ → Eu3+ energy transfer efficiency (ηET = 37.3%). Indeed, it was observed that the average luminescence lifetime for SiO2-LaF3:Tb3+,Eu3+avg(5D0) = 5.87 ms) is longer than the average lifetime for SiO2-YF3:Tb3+,Eu3+avg(5D0) = 4.59 ms). Such an effect could also indicate that the interionic distance between neighboring Tb3+ and Eu3+ ions in LaF3 nanocrystals seems to be shorter than in the YF3 crystal lattice. In other words, this could suggest that the segregation of rare-earths inside the LaF3 crystal phase is greater, which promotes the Tb3+ → Eu3+ ET. The luminescence decay times, their percentage distribution as well as average lifetimes for both types of fabricated GC sample are depicted in Table 3.
The optical characterization of fabricated co-doped sol-gel samples was supplemented with calculations of quantum yields, ФEu. The quantum efficiencies were calculated from Ф = kR/k formula in which k is the total decay rate constant (k = 1/τ) and kR is the radiative rate constant estimated from the following Equation [60]:
k R = A MD , 0 n 3 ( I tot I MD ) .
In above equation, AMD,0 is according to the Einstein spontaneous emission coefficient for the 5D07F1 transition (14.65 s−1 [61]); Itot is the sum of integrated intensities of the 5D07FJ (J = 0–4) luminescence bands of Eu3+; IMD is the integrated intensity of the 5D07F1 magnetic-dipole transition and n is the refractive index. The refractive index of YF3 and LaF3 nanocrystals is almost the same and equals n = 1.55–1.56. Such values are comparable with previously published results [62,63]. It is quite interesting that the refractive index of LaF3 nanocrystals is slightly lower than that of the corresponding LaF3 single crystal, as was proven by Z. Wang et al. [64]. Finally, the calculated quantum yields are depicted in Table 4.
The quantum efficiencies for xerogels are comparable and equal to 9.2% for XG-Y/Tb3+,Eu3+ and 8.1% for XG-La/Tb3+,Eu3+. Much greater differences in quantum efficiencies were denoted for fabricated glass-ceramics. In fact, the ФEu calculated for SiO2-YF3:Tb3+,Eu3+ GC equal to 49.5%, meanwhile for SiO2-LaF3:Tb3+,Eu3+ GC sample, the ФEu value achieve even 73.0%. The observed significant difference is clearly related to Tb3+ → Eu3+ energy transfer, the efficiency of which is much greater for SiO2-LaF3:Tb3+,Eu3+ET = 60.8%) compared with SiO2-YF3:Tb3+,Eu3+ glass-ceramics (ηET = 37.3%). Based on the current literature, the luminescence quantum yields for Tb3+,Eu3+ co-doped nanocrystals are usually in a range from 32% to 61% [65]. It is very interesting that the ФEu value for SiO2-YF3:Tb3+,Eu3+ is in good accordance with the presented data, but the SiO2-LaF3:Tb3+,Eu3+ GC sample is characterized by a greater quantum efficiency value. Furthermore, as was proven by N. Shrivastava et al. [66], the quantum yields for LaF3:Eu3+ nanocrystals could vary from 67% up to 85% depending on the Eu3+ concentration. Therefore, the obtained results suggest that fabricated sol-gel glass-ceramics could be considered as quite good candidates for visible light-emitting devices.

4. Conclusions

In this work, SiO2-MF3:Tb3+,Eu3+ (M = Y, La) glass-ceramic materials were prepared via sol-gel method during the controlled heat-treatment of silicate xerogels at 350 °C. The performed systematic photoluminescence measurements confirmed that fabricated sol-gel materials exhibit multicolor emission due to the coexistence of the characteristic emission bands originating from both dopant ions, i.e., Tb3+ (5D47FJ, J = 6–3) and Eu3+ (5D07FJ, J = 0–4) due to Tb3+ → Eu3+ energy transfer occurrence. Based on performed luminescence decay analysis from the 5D4 (Tb3+) and the 5D0 (Eu3+) excited levels, the correlation between luminescence lifetimes and the distribution of rare-earth ions between the silicate sol-gel host and fluoride nanocrystals was clearly proven. Hence, it was suggested that more preferable segregation of rare-earth ions inside LaF3 nanocrystals occurred. Moreover, the transformation from xerogels into glass-ceramic materials during controlled heat-treatment determines the strong influence on Tb3+ → Eu3+ energy transfer efficiency, ηET, which increased from ~16% (xerogels) up to 37.3% and 60.8% (SiO2-YF3:Tb3+,Eu3+ and SiO2-LaF3:Tb3+,Eu3+ glass-ceramics, respectively). The obtained luminescent results clearly suggest that the prepared sol-gel glass-ceramic materials could be considered as promising candidates for use as optical elements in RGB-lighting optoelectronic devices operating under NUV excitation.

Author Contributions

Conceptualization, N.P., B.S.-S. and W.A.P.; methodology, N.P., B.S.-S. and W.A.P.; software, N.P.; validation, N.P. and W.A.P.; formal analysis, W.A.P.; investigation, N.P.; resources, N.P. and W.A.P.; data curation, N.P.; writing—original draft preparation, N.P.; writing—review and editing, W.A.P.; visualization, N.P.; supervision, N.P. and W.A.P.; project administration, W.A.P.; funding acquisition, W.A.P. All authors have read and agreed to the published version of the manuscript.

Funding

This research was funded by National Science Centre (Poland), grant number 2016/23/B/ST8/01965.

Conflicts of Interest

The authors declare no conflict of interest.

References

  1. Jamalaiah, B.C.; Venkatramaiah, N.; Rao, T.R.; Rasool, S.N.; Rao, B.N.; Ram, D.V.R.; Reddy, A.S.N. UV excited SrAl2O4: Tb3+ nanophosphors for photonic applications. Mat. Sci. Semicon. Proc. 2020, 105, 104722. [Google Scholar] [CrossRef]
  2. Dalmis, R.; Keskin, O.Y.; Azem, N.F.A.; Birlik, I. A new one-dimensional photonic crystal combination of TiO2/CuO for structural color applications. Ceram. Int. 2019, 45, 21333–21340. [Google Scholar] [CrossRef]
  3. Bian, W.; Lin, Y.; Wang, T.; Yu, X.; Qiu, J.; Zhou, M.; Luo, H.; Yu, S.F.; Xu, X. Direct Identification of surface defects and their influence on the optical characteristics of upconversion nanoparticles. ACS Nano. 2018, 12, 3623–3628. [Google Scholar] [CrossRef] [PubMed]
  4. Gong, G.; Song, Y.; Tan, H.; Xie, S.; Zhang, C.; Xu, L.; Xu, J.; Zheng, J. Design of core/active-shell NaYF4:Ln3+@NaYF4:Yb3+ nanophosphors with enhanced red-green-blue upconversion luminescence for anti-counterfeiting printing. Compos. Part B—Eng. 2019, 179, 107504. [Google Scholar] [CrossRef]
  5. Wang, T.; Yu, H.; Siu, C.K.; Qiu, J.; Xu, X.; Yu, S.F. White-light whispering-gallery-mode lasing from lanthanide-doped upconversion NaYF4 hexagonal microrods. ACS Photonics 2017, 4, 1539–1543. [Google Scholar] [CrossRef]
  6. Chen, J.; Peng, Y.; Li, X.; Chen, W.; Huang, H.; Lin, L.; Chen, D. Near-infrared-laser-driven robust glass-ceramic-based upconverted solid-state lighting. J. Mater. Chem. C 2019, 7, 4109–4117. [Google Scholar] [CrossRef]
  7. Li, Z.; Zhou, D.; Yang, Y.; Ren, P.; Qiu, J. Adjustable multicolor up-energy conversion in light-luminescence in Tb3+/Tm3+/Yb3+ co-doped oxyfluoride glass-ceramics containing Ba2LaF7 nanocrystals. Sci. Rep. 2017, 7, 6518. [Google Scholar] [CrossRef] [Green Version]
  8. do Carmo, F.F.; do Nascimento, J.P.C.; Façanha, M.X.; Sales, T.O.; Santos, W.Q.; Gouveia-Neto, A.S.; Jacinto, C.; Sombra, A.B.S. White light upconversion emission and color tunability in Er3+/Tm3+/Yb3+ tri-doped YNbO4 phosphor. J. Lumin. 2018, 204, 676–684. [Google Scholar] [CrossRef]
  9. Li, M.; Wang, L.; Ran, W.; Deng, Z.; Ren, C.; Shi, J. Tunable emission of single-phased NaY(WO4)2: Sm3+ phosphor based on energy transfer. Ceram. Int. 2017, 43, 6751–6757. [Google Scholar] [CrossRef]
  10. Li, Z.; Zhong, B.; Cao, Y.; Zhang, S.; Lv, Y.; Mu, Z.; Hu, Z.; Hu, Y. Energy transfer and tunable luminescence properties in Y3Al2Ga3O12:Tb3+,Eu3+ phosphors. J. Alloy. Compd. 2019, 787, 672–682. [Google Scholar] [CrossRef]
  11. Liu, Y.; Liu, G.; Wang, J.; Dong, X.; Yu, W. Single-component and warm-white-emitting phosphor nagd(wo4)2:Tm3+,Dy3+,Eu3+: Synthesis, luminescence, energy transfer, and tunable color. Inorg. Chem. 2014, 53, 11457–11466. [Google Scholar] [CrossRef] [PubMed]
  12. Lü, Y.; Tang, X.; Yan, L.; Li, K.; Liu, X.; Shang, M.; Li, C.; Lin, J. Synthesis and luminescent properties of GdNdO4:RE3+ (RE = Tm, Dy) nanocrystalline phosphors via the sol-gel process. J. Phys. Chem. C 2013, 117, 21972–21980. [Google Scholar] [CrossRef]
  13. Baur, F.; Glocker, F.; Jüstel, T. Photoluminescence and energy transfer rates and efficiencies in Eu3+ activated Tb2Mo3O12. J. Mater. Chem. C 2015, 3, 2054–2064. [Google Scholar] [CrossRef] [Green Version]
  14. Xu, M.; Ding, Y.; Luo, W.; Wang, L.; Li, S.; Liu, Y. Synthesis, luminescence properties and energy transfer behavior of color-tunable KAlP2O7:Tb3+,Eu3+ phosphors. Opt. Laser Technol. 2020, 121, 105829. [Google Scholar] [CrossRef]
  15. Chen, Z.; Chen, X.; Huang, S.; Pan, Y. A novel tunable green-to-red emitting phosphor Ca4LaO(BO3)3:Tb,Eu via energy transfer with high quantum yield. Ceram. Int. 2016, 42, 13476–13484. [Google Scholar] [CrossRef]
  16. Kukku, T.; Dinu, A.; Sisira, S.; Gopi, S.; Biju, P.R.; Unnikrishnan, N.V.; Cryriac, J. Energy transfer driven tunable emission of Tb/Eu co-doped lanthanum molybdates nanophosphors. Opt. Mater. 2018, 80, 37–46. [Google Scholar]
  17. dos, S.; Bezerra, C.; Valerio, M.E.G. Structural and optical study of CaF2 nanoparticles produced by a microwave-assisted hydrothermal method. Phys. B Condens. Matter 2016, 501, 106–112. [Google Scholar]
  18. Rivera-López, F.; Babu, P.; Basavapoornima, C.; Jayasankar, C.K.; Lavín, V. Efficient Nd3+ → Yb3+ energy transfer processes in high phonon energy phosphate glasses for 1.0 μm Yb3+ ions. J. Appl. Phys. 2011, 109, 123514. [Google Scholar] [CrossRef]
  19. Cao, R.; Lu, Y.; Tian, Y.; Huang, F.; Xu, S.; Zhang, J. Spectroscopy of thulium and holmium co-doped silicate glasses. Opt. Mater. Express 2016, 6, 2252–2263. [Google Scholar] [CrossRef]
  20. Suo, H.; Guo, C.; Zheng, J.; Zhou, B.; Ma, C.; Zhao, X.; Li, T.; Guo, P.; Goldys, E.M. Sensitivity modulation of upconverting thermometry through engineering phonon energy of a matrix. ACS Appl. Mater. Interfaces 2016, 8, 32312–32319. [Google Scholar] [CrossRef]
  21. Biswas, A.; Maciel, G.S.; Friend, C.S.; Prasad, P.N. Upconversion properties of a transparent Er3+-Yb3+ co-doped LaF3-SiO2 glass-ceramics prepared by sol-gel method. J. Non-Cryst. Solids 2003, 316, 393–397. [Google Scholar] [CrossRef]
  22. Jacobsohn, L.G.; McPherson, C.L.; Oliveira, L.C.; Kucera, C.J.; Ballato, J.; Yukihara, E.G. Radioluminescence and thermoluminescence of rare earth doped and co-doped YF3. Radiat. Meas. 2017, 106, 79–83. [Google Scholar] [CrossRef]
  23. Milovanov, Y.S.; Skryshevsky, V.A.; Tolstoy, V.P.; Gulina, L.B.; Gavrilchenko, I.V.; Kuznetsov, G.V. Photoluminescence of porous silicon coated by SILD method with LaF3 nanolayers. Curr. Appl. Phys. 2013, 13, 1625–1629. [Google Scholar] [CrossRef]
  24. Du, Y.; Han, S.; Zou, Y.; Yuan, J.; Shao, C.; Jiang, X.; Chen, D. Luminescence properties of Ce3+-doped oxyfluoride aluminosilicate glass and glass ceramics. Opt. Mater. 2019, 89, 243–249. [Google Scholar] [CrossRef]
  25. Montoya-Quesada, E.; Villaquirán-Caicedo, M.A.; Mejía de Gutiérrez, R.; Muñoz-Saldaña, J. Effect of ZnO content on the physical, mechanical and chemical properties of glass-ceramics in the CaO-SiO2-Al2O3 system. Ceram. Int. 2020, 46, 4322–4328. [Google Scholar] [CrossRef]
  26. Wang, T.; Wang, S.; Wei, Y.; Zhou, X.; Zhang, H.; Wang, L.; Guo, Z.; Lv, H. Preparation and luminescence properties of Eu2O3 doped glass-ceramics containing NaY(MoO4)2. J. Eur. Ceram. Soc. 2020, 40, 1671–1676. [Google Scholar] [CrossRef]
  27. Marcondes, L.M.; Evangelista, R.O.; Gonçalves, R.R.; de Camargo, A.S.S.; Manzani, D.; Nalin, M.; Cassanjes, F.C.; Poirier, G.Y. Er3+-doped niobium alkali germanate glasses and glass-ceramics: NIR and visible luminescence properties. J. Non-Cryst. Solids 2019, 521, 119492. [Google Scholar] [CrossRef]
  28. Cheng, C.; Zeng, N.; Jiao, Q.; Zhang, X.; Liu, X. Tunable upconversion white photoemission in Yb3+/Mn2+/Tm3+ tri-doped transparent glass ceramics. Opt. Mater. 2020, 100, 109718. [Google Scholar] [CrossRef]
  29. Fedorov, P.P.; Luginina, A.A.; Popov, A.I. Transparent oxyfluoride glass ceramics. J. Fluor. Chem. 2015, 172, 22–50. [Google Scholar] [CrossRef]
  30. Yu, H.; Guo, H.; Zhang, M.; Liu, Y.; Liu, M.; Zhao, L. Distribution of Nd3+ ions in oxyfluoride glass ceramics. Nanoscale Res. Lett. 2012, 7, 275. [Google Scholar] [CrossRef] [Green Version]
  31. del-Castillo, J.; Yanes, A.C.; Méndez-Ramos, J.; Tikhomirov, V.K.; Moshchalkov, V.V.; Rodríguez, V.D. Sol-gel preparation and white up-conversion luminescence in rare-earth doped PbF2 nanocrystals dissolved in silica glass. J. Solgel Sci. Technol. 2010, 53, 509–514. [Google Scholar] [CrossRef] [Green Version]
  32. Leśniak, M.; Żmojda, J.; Kochanowicz, M.; Miluski, P.; Baranowska, A.; Mach, G.; Kuwik, M.; Pisarska, J.; Pisarski, W.A.; Dorosz, D. Spectroscopic properties of erbium-doped oxyfluoride phospho-tellurite glass and transparent glass-ceramic containing BaF2 nanocrystals. Materials 2019, 12, 3429. [Google Scholar] [CrossRef] [Green Version]
  33. Lisiecki, R.; Ryba-Romanowski, W. Silica-based oxyfluoride glass and glass-ceramic doped with Tm3+ and Yb3+-VUV-VIS-NIR spectroscopy and optical thermometry. J. Alloys Compd. 2020, 814, 152304. [Google Scholar] [CrossRef]
  34. Hu, Z.; Wang, Y.; Bao, F.; Luo, W. Crystallization behavior and microstructure investigations on LaF3 containing oxyfluoride glass ceramics. J. Non-Cryst. Solids 2005, 351, 722–728. [Google Scholar] [CrossRef]
  35. Zhang, Z.; Li, K.; Liu, C.; Yin, Q.; Han, J.; Heo, J. Intense up-conversion emission from Er3+/Yb3+ ion co-doped transparent oxyfluoride glass-ceramics containing Y5O4F7 nanorods for optical thermometry. J. Mater. Chem. C 2019, 7, 6134–6143. [Google Scholar]
  36. Zhang, X.; Hu, L.; Ren, J. Transparent aluminosilicate oxyfluoride glass ceramics containing upconversion luminescent caf2 nanocrystals: Glass-to-crystal structural evolution studied by the advanced solid-state nmr spectroscopy. J. Mater. Chem. C 2020, 124, 1594–1608. [Google Scholar] [CrossRef]
  37. Antuzevics, A.; Kemere, M.; Krieke, G.; Ignatans, R. Electron paramagnetic resonance and photoluminescence investigation of europium local structure in oxyfluoride glass ceramics containing SrF2 nanocrystals. Opt. Mater. 2017, 72, 749–755. [Google Scholar] [CrossRef]
  38. Zhou, B.; E, C.Q.; Bu, Y.Y.; Meng, L.; Yan, X.H.; Wang, X.F. Temperature-controlled down-conversion luminescence behavior of Eu3+-doped transparent MF2 (M = Ba, Ca, Sr) glass ceramics. Luminescence 2017, 32, 195–200. [Google Scholar] [CrossRef]
  39. Biswas, K.; Sontakke, A.D.; Sen, R.; Annapurna, K. Luminescence properties of dual valence Eu doped nano-crystalline BaF2 embedded glass-ceramics and observation of Eu2+ → Eu3+ energy transfer. J. Fluoresc. 2012, 22, 745–752. [Google Scholar] [CrossRef]
  40. Gorni, G.; Velázquez, J.J.; Mosa, J.; Balda, R.; Fernández, J.; Durán, A.; Castro, Y. Transparent glass-ceramics produced by sol-gel: A suitable alternative for photonic materials. Materials 2018, 11, 212. [Google Scholar] [CrossRef] [Green Version]
  41. Velázquez, J.J.; Mosa, J.; Gorni, G.; Balda, R.; Fernández, J.; Durán, A.; Castro, Y. Novel sol-gel SiO2-NaGdF4 transparent nano-glass-ceramics. J. Non-Cryst. Solids 2019, 520, 119447. [Google Scholar] [CrossRef]
  42. Gorni, G.; Velázquez, J.J.; Mosa, J.; Mather, G.C.; Serrano, A.; Vila, M.; Castro, G.R.; Bravo, D.; Balda, R.; Fernández, J.; et al. Transparent sol-gel oxyfluoride glass-ceramics with high crystalline fraction and study of re incorporation. Nanomaterials 2019, 9, 530. [Google Scholar] [CrossRef] [Green Version]
  43. Vinogradov, A.V.; Vinogradov, V.V. Low-temperature sol-gel synthesis of crystalline materials. RSC Adv. 2014, 4, 45903–45919. [Google Scholar] [CrossRef]
  44. Pawlik, N.; Szpikowska-Sroka, B.; Goryczka, T.; Pisarski, W.A. Photoluminescence investigation of sol-gel glass-ceramic materials containing SrF2:Eu3+ nanocrystals. J. Alloys Compd. 2019, 810, 151935. [Google Scholar] [CrossRef]
  45. Chen, D.; Wang, Z.; Zhou, Y.; Huang, P.; Ji, Z. Tb3+/Eu3+:YF3 nanophase embedded glass ceramics: Structural characterization, tunable luminescence and temperature sensing behavior. J. Alloys Compd. 2015, 646, 339–344. [Google Scholar] [CrossRef]
  46. Pawlik, N.; Szpikowska-Sroka, B.; Goryczka, T.; Zubko, M.; Lelątko, J.; Pisarski, W.A. Structure and luminescent properties of oxyfluoride glass-ceramics with YF3:Eu3+ nanocrystals derived by sol-gel method. J. Eur. Ceram. Soc. 2019, 39, 5010–5017. [Google Scholar] [CrossRef]
  47. Pawlik, N.; Szpikowska-Sroka, B.; Pietrasik, E.; Goryczka, T.; Pisarski, W.A. Structural and luminescence properties of silica powders and transparent glass-ceramics containing LaF3:Eu3+ nanocrystals. J. Am. Ceram. Soc. 2018, 101, 4654–4668. [Google Scholar] [CrossRef]
  48. Yanes, A.C.; del-Castillo, J.; Méndez-Ramos, J.; Rodríguez, V.D.; Torres, M.E.; Arbiol, J. Luminescence and structural characterization of transparent nanostructures Eu3+-doped LaF3-SiO2 glass-ceramics prepared by sol-gel method. Opt. Mater. 2007, 29, 999–1003. [Google Scholar] [CrossRef]
  49. Wu, X.; Zheng, J.; Ren, Q.; Zhu, J.; Ren, Y.; Hai, O. Luminescent properties and energy transfer in novel single-phase multicolor tunable Sr3Y(BO3)3:Tb3+,Eu3+ phosphors. J. Alloys Compd. 2019, 805, 12–18. [Google Scholar] [CrossRef]
  50. Yanes, A.C.; del-Castillo, J.; Ortiz, E. Energy transfer and tunable emission in BaGdF5:RE3+ (RE = Ce, Tb, Eu) nano-glass-ceramics. J. Alloys Compd. 2019, 773, 1099–1107. [Google Scholar] [CrossRef]
  51. Wang, B.; Ren, Q.; Hai, O.; Wu, X. Luminescence properties and energy transfer in Tb3+ and Eu3+ co-doped Ba2P2O7 phosphors. RSC Adv. 2017, 7, 15222–15227. [Google Scholar] [CrossRef] [Green Version]
  52. Xie, F.; Li, J.; Dong, Z.; Wen, D.; Shi, J.; Yan, J.; Wu, M. Energy transfer and luminescent properties of Ca8MgLu(PO4)7:Tb3+/Eu3+ as a green-to-red color tunable phosphor under NUV excitation. RSC Adv. 2015, 5, 59830–59836. [Google Scholar] [CrossRef]
  53. Caldiño, U.; Speghini, A.; Berneschi, S.; Bettinelli, M.; Brenci, M.; Pasquini, E.; Pelli, S.; Righini, G.C. Optical spectroscopy and optical waveguide fabrication in Eu3+ and Eu3+/Tb3+ doped zinc-sodium-aluminosilicate glasses. J. Lumin. 2014, 147, 336–340. [Google Scholar] [CrossRef]
  54. Gopi, S.; Jose, S.K.; Sreeja, E.; Manasa, P.; Unnikrishnan, N.V.; Cyriac, J.; Biju, P.R. Tunable green to red emission via Tb sensitized energy transfer in Tb/Eu co-doped alkali fluoroborate glass. J. Lumin. 2017, 192, 1288–1294. [Google Scholar] [CrossRef]
  55. Liu, H.-G.; Zheng, W.-C. Theoretical investigations of the optical and EPR spectra for trivalent cerium and ytterbium ions in orthorhombic YF3 crystal. Phys. B 2016, 496, 15–19. [Google Scholar] [CrossRef]
  56. Rast, H.E.; Caspers, H.H.; Miller, S.A. Infrared Dispersion and Lattice Vibrations of LaF3. Phys. Rev. 1968, 171, 1051–1057. [Google Scholar] [CrossRef]
  57. Binnemans, K. Interpretation of europium(III) spectra. Coord. Chem. Rev. 2015, 295, 1–45. [Google Scholar] [CrossRef] [Green Version]
  58. Li, B.; Huang, X.; Guo, H.; Zeng, Y. Energy transfer and tunable photoluminescence of LaBWO6:Tb3+,Eu3+ phosphors for near-UV white LEDs. Dye. Pigment. 2018, 150, 67–72. [Google Scholar] [CrossRef]
  59. Xia, Z.; Zhuang, J.; Liao, L. Novel red-emitting Ba2Tb(BO3)2Cl:Eu phosphor with efficient energy transfer for potential application in white light-emitting diodes. Inorg. Chem. 2012, 51, 7202–7209. [Google Scholar] [CrossRef]
  60. Chen, J.; Meng, Q.; May, P.S.; Berry, M.T.; Lin, C. Sensitization of Eu3+ luminescence in Eu:YPO4 nanocrystals. J. Phys. Chem. C 2013, 117, 5953–5962. [Google Scholar] [CrossRef]
  61. Werts, M.H.V.; Jukes, R.T.F.; Verhoeven, J.W. The emission spectrum and the radiative lifetime of Eu3+ in luminescent lanthanide complexes. Phys. Chem. Chem. Phys. 2002, 4, 1542–1548. [Google Scholar] [CrossRef]
  62. Zhang, S.-T.; Modreanu, M.; Roussel, H.; Jiménez, C.; Deschanvres, J.-L. Exploring the optical properties of Vernier phase yttrium oxyfluoride thin films grown by pulsed liquid injection MOCVD. Dalton Trans. 2018, 47, 2655–2661. [Google Scholar] [CrossRef] [PubMed]
  63. Gorni, G.; Balda, R.; Fernández, J.; Velázquez, J.J.; Pascual, L.; Mosa, J.; Durán, A.; Castro, Y. 80SiO2-20LaF3 oxyfluoride glass ceramic coatings doped with Nd3+ for optical applications. Int. J. Appl. Glass Sci. 2018, 9, 208–217. [Google Scholar] [CrossRef] [Green Version]
  64. Wang, Z.; Wang, N.; Wang, D.; Tang, Z.; Yu, K.; Wei, W. Method for refractive index measurement of nanoparticles. Opt. Lett. 2014, 39, 4251–4254. [Google Scholar] [CrossRef]
  65. Lu, P.; Wang, Y.; Huang, L.; Lian, S.; Wang, Y.; Tang, J.; Belfiore, L.A.; Kipper, M.J. Tb3+/Eu3+ complex-doped rigid nanoparticles in transparent nanofibrous membranes exhibit high quantum yield fluorescence. Nanomaterial 2020, 10, 694. [Google Scholar] [CrossRef] [Green Version]
  66. Shrivastava, N.; Khan, L.U.; Vergas, J.M.; Ospina, C.; Coaquira, J.A.Q.; Zoppellaro, G.; Brito, H.F.; Javed, Y.; Shukla, D.K.; Felinto, M.C.F.C.; et al. Efficient multicolor tunability of ultrasmall ternary-doped LaF3 nanoparticles: Energy conversion and magnetic behavior. Phys. Chem. Chem. Phys. 2017, 19, 18660–18670. [Google Scholar] [CrossRef]
Figure 1. Transmission electron microscope (TEM) images and X-ray diffraction (XRD) patterns of fabricated xerogels and glass-ceramic samples.
Materials 13 02522 g001
Figure 2. Photoluminescence excitation (PLE) spectra of XG-Y/Tb3+,Eu3+ co-doped sample, monitored at λem = 543 nm and λem = 612 nm.
Materials 13 02522 g002
Figure 3. PLE spectra of XG-La/Tb3+,Eu3+ co-doped sample, monitored at λem = 543 nm and λem = 612 nm.
Materials 13 02522 g003
Figure 4. Photoluminescence (PL) spectra of XG-Y/Tb3+ and XG-Y/Tb3+,Eu3+ samples recorded upon near-ultraviolet (NUV) illumination at λexc = 352 nm and λexc = 394 nm.
Materials 13 02522 g004
Figure 5. PL spectra of XG-La/Tb3+ and XG-La/Tb3+,Eu3+ samples recorded upon NUV illumination at λexc = 352 nm and λexc = 394 nm.
Materials 13 02522 g005
Figure 6. An overlap of Tb3+ emission (λexc = 352 nm) and Eu3+ excitation (λem = 612 nm) regions and illustration of energy levels involved in Tb3+ → Eu3+ energy transfer process.
Materials 13 02522 g006
Figure 7. PL spectra of SiO2-YF3:Tb3+ and SiO2-YF3:Tb3+,Eu3+ samples recorded under NUV excitation at λexc = 352 nm and λexc = 394 nm.
Materials 13 02522 g007
Figure 8. PL spectra of SiO2-LaF3:Tb3+ and SiO2-LaF3:Tb3+, Eu3+ samples recorded under NUV excitation at λexc = 352 nm and λexc = 397 nm.
Materials 13 02522 g008
Figure 9. Luminescence decay curves of the 5D4 state of Tb3+ recorded for xerogels (a) and glass-ceramics (b) singly doped with Tb3+ ions.
Materials 13 02522 g009
Figure 10. Luminescence decay curves of the 5D4 state of Tb3+ recorded for xerogels (a) and glass-ceramics (b) co-doped with Tb3+/Eu3+ ions.
Materials 13 02522 g010
Figure 11. Luminescence decay curves of the 5D0 state of Eu3+ recorded for xerogels (a) and glass-ceramics (b) co-doped with Tb3+/Eu3+ ions.
Materials 13 02522 g011
Table 1. Luminescence lifetimes of the 5D4 state of Tb3+ (τ) and ET efficiencies (ηET) for fabricated silicate xerogels.
Sampleτ(5D4) (ms)ηET (%)
XG-Y/Tb3+,Eu3+0.82 ± 0.0315.5
XG-Y/Tb3+0.97 ± 0.01-
XG-La/Tb3+,Eu3+0.75 ± 0.0315.7
XG-La/Tb3+0.89 ± 0.02-
Table 2. Luminescence lifetimes of the 5D4 state of Tb3+, their contribution and energy transfer (ET) efficiencies (ηET) for fabricated glass-ceramics.
Sampleτ(5D4) (ms)%,τn(5D4) τavg(5D4) (ms)ηET (%)
SiO2-YF3:Tb3+,Eu3+0.86 ± 0.10 (τ1)
3.10 ± 0.24 (τ2)
49.79% (τ1)
50.21% (τ2)
2.6237.3
SiO2-YF3:Tb3+0.94 ± 0.12 (τ1)
4.85 ± 0.40 (τ2)
51.50% (τ1)
48.50% (τ2)
4.18-
SiO2-LaF3:Tb3+,Eu3+0.67 ± 0.07 (τ1)
2.97 ± 0.26 (τ2)
57.16% (τ1)
42.84% (τ2)
2.4460.8
SiO2-LaF3:Tb3+1.34 ± 0.12 (τ1)
6.96 ± 0.27 (τ2)
43.58% (τ1)
56.42% (τ2)
6.23-
Table 3. Luminescence lifetimes of the 5D0 state of Eu3+ and their contributions for fabricated glass-ceramics.
Sampleτ(5D0) (ms)%, τn(5D0)τavg(5D0) (ms)
SiO2-YF3:Tb3+,Eu3+0.83 ± 0.08 (τ1)
5.67 ± 0.39 (τ2)
66.30% (τ1)
33.70% (τ2)
4.59
SiO2-LaF3:Tb3+,Eu3+0.74 ± 0.04 (τ1)
6.84 ± 0.29 (τ2)
63.58% (τ1)
36.42% (τ2)
5.87
Table 4. Quantum yields (ФEu) calculated for fabricated xerogels and glass-ceramic materials.
SampleФEu (%)
XG-Y/Tb3+,Eu3+9.2
XG-La/Tb3+,Eu3+8.1
SiO2-YF3:Tb3+,Eu3+73.0
SiO2-LaF3:Tb3+,Eu3+49.5

